
the Creative Commons Attribution 4.0 License.
the Creative Commons Attribution 4.0 License.
 | 14 Sep 2026
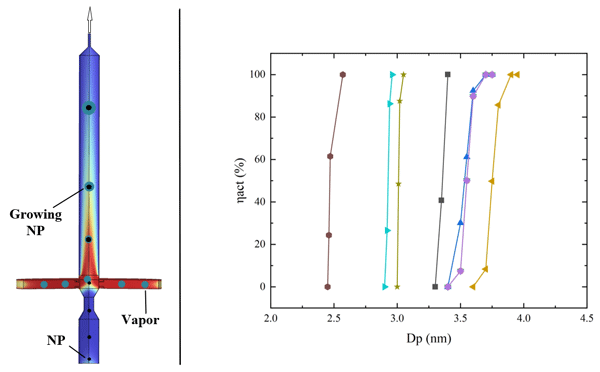
Performance modeling of a small mixing-type condensation particle counter
Jitong Zhou
Gehang Huang
Fajun Yu
Xiaoqi Lei
Xiujuan Wang
Huaqiao Gui
Huanqin Wang

The performance of a small mixing-type condensation particle counter (sMCPC) was numerically evaluated. The modeling calculated the fields of turbulent flow and temperature, and species transport in the particle channel of sMCPC, and the growth of particles included the effects of Kelvin, non-continuum and latent heat. Upon the validated, the model was applied to investigate the effects of temperature difference (, where Tc and Ts are the temperature setting for working fluid saturation and sampled aerosol cooling, respectively), total flow rate (Qg), and vapor fraction (f) on the working-fluid-governed supersaturation and particle activation in the sMCPC. It is found that the supersaturation ratio is increased, and the critical activation diameter (Dp,50) is lowered by increasing ΔT; the excessive increase of Qg reduces the supersaturation ratio and shifts the ratio peak towards the downstream of carrier flow; both the supersaturation ratio and the Dp,50-slope are increased by increasing f. Under specific thermal and flow conditions, minimum activation diameters obtained in the cases with working fluids of ethylene glycol (EG), diethylene glycol (DEG), and dimethyl phthalate (DMP) is less than that in the case with n-butanol (B). Because of the particle growth after the activation, final sizes of particles exiting the particle growth tube are in micrometers in the case with n-butanol (B), and ∼ 700 nm in case with EG; in contrast, final particle sizes in cases with DEG and DMP generally remain below the detection limit of typical optical particle counters (OPCs), i.e., ∼ 0.3 µm.
- Article
(3650 KB) - Full-text XML
- BibTeX
- EndNote


Condensation Particle Counters (CPCs) are widely used for measuring the number/concentration of aerosol particles, particularly for ultrafine particles defined as those with sizes less than 100 nm (below the lower detection limit of a typical optical particle counter, OPC). It is because of the “size amplification (via condensation) and optical counting” in CPCs, which significantly reduces the lower size detection limit of CPCs although at the expense of losing the original particle size (Heathman and Ensor, 2019). CPCs have been extensively applied in atmospheric pollution monitoring, environmental exposure assessment, roadside vehicle emission monitoring and many other applications in addition to scientific aerosol research (Takegawa et al., 2022; Pradhan et al., 2022; Li et al., 2024a).
Two types of CPCs capable of continuous counting (i.e., laminar flow and mixing types) are available. For laminar-flow CPCs with n-butanol as working fluid, aerosol particles first pass through a vapor-saturated chamber containing hot vapor and then transport to the condensation (or particle growth) channel at a temperature setting less than that of the vapor-saturated chamber (Wlasits et al., 2020). A stable temperature gradient established in the particle growth channel develops a supersaturated vapor environment, allowing particles to grow larger in sizes (ideally to optically detectable sizes) (Li et al., 2024b). Commercial CPCs, e.g., TSI CPC model 3025/3076, are capable of detecting particles in sizes as small as 3 nm (or even smaller with a particle amplifier, Iida et al., 2009). Water-based CPCs, which exhibit performance comparable to butanol-based CPCs, have also been developed. Note that the temperature setting for establishing supersaturation conditions and growing the particle size in water-based CPCs is different from those of butanol-based CPCs (Hering et al., 2005; Mei et al., 2021; Hao et al., 2023). Recent studies have also demonstrated that the choice of working fluid can significantly influence the CPC performance, particularly in reducing the composition-dependent counting efficiency (Wlasits et al., 2024).
MCPCs (Mixing-type CPCs or particle amplifier) amplify the particle size by rapidly mixing saturated vapor of the working fluid at high temperature with aerosol stream at cold temperature in a chamber (Fuchs, 1964). The mixing chamber can be small, e.g., a Swagelok cross used in the work of Wang et al. (2002). The above mixing creates a steep temperature gradient driving the working fluid vapor to the particle surface that activates the growth of particles in the sizes down to sub-5 nm and increases their sizes to optically detectable particle size limit (Mavliev, 2002; Kousaka et al., 1982). Vanhanen et al. (2011) introduced a mixing-type particle size magnifier that generates high supersaturation in a short channel by combining heated saturated vapor with a cold aerosol flow, achieving sub-3 nm detection. Wang et al. (2002) introduced a rapid-mixing condensation particle counting technique. Building on the above principle, Brechtel 9403a MCPC has been demonstrated to be UAV-deployable for in-situ aerosol monitoring (Bates et al., 2013). Overall, the MCPC development trajectory has been toward miniaturization while preserving its activation and reliable performance. Compared with laminar flow CPCs, MCPCs enhance convective mixing between the aerosol and vapor streams, which promotes heat and mass transfer and facilitates fast establishment of supersaturation conditions required for particle activation. In addition, the reduced particle residence time prior to growth would minimize the particle loss due to Brownian diffusion and reduce counting errors associated with wall condensation (Sgro and De La Mora, 2003). The above features make MCPCs good candidates for applications requiring mobile particle monitoring.
Studies have employed COMSOL to calculate the flow and temperature fields, and species transport in laminar-flow CPCs. Kangasluoma et al. (2015) used COMSOL to quantify how the saturator–condenser temperature difference shapes the supersaturation field in CPCs, affecting the overall CPC performance. Building on the above modeling framework, Barmpounis et al. (2017) showed that reducing the operating temperature window can enhance the detection efficiency for sub-3 nm particles. Thomas et al. (2018) further employed COMSOL to examine how carrier-gas composition influences the particle activation in CPCs. Hao et al. (2021) modeled a laminar-flow CPC and identified an operational condition optimizing the activation efficiency of sub-3 nm ultrafine particles. However, most previous modeling studies have focused on laminar-flow CPCs, while studies specifically addressing the performance of mixing-type CPCs remain limited. A related work is on mixed-flow particle magnifiers (Fisenko et al., 2007). In the work, vapor condensation and heterogeneous droplet growth were analyzed, highlighting the roles of mixing, supersaturation formation, and transport processes in the determination of instrument performance
In this modeling of a small MCPC (sMCPC), COMSOL was applied to calculate both flow and temperature fields, and working fluid vapor concentration distribution in the aerosol flow channel of sMCPC (Wang et al., 2025). The effect of operational parameters, including the temperature setting, flow velocity, flowrate ratio, and working fluid type, on the supersaturation establishment and particle activation efficiency were quantitatively evaluated. Under consideration of the effects of the Kelvin, non-continuum heat-transfer corrections, and latent heat, the condensational growth of particles in sMCPC with different working fluids was computed in MATLAB. The result obtained in this modeling provides a solid foundation for the design and optimization of sMCPC.
COMSOL was applied to calculate both the flow and temperature fields, and vapor transport in sMCPC designed in the axisymmetric configuration. Shown in Fig. 1 is the schematic diagram of the model sMCPC. The governing equations used to calculate the flow and temperature fields, vapor distribution and particle growth in the sMCPC are described in this section.
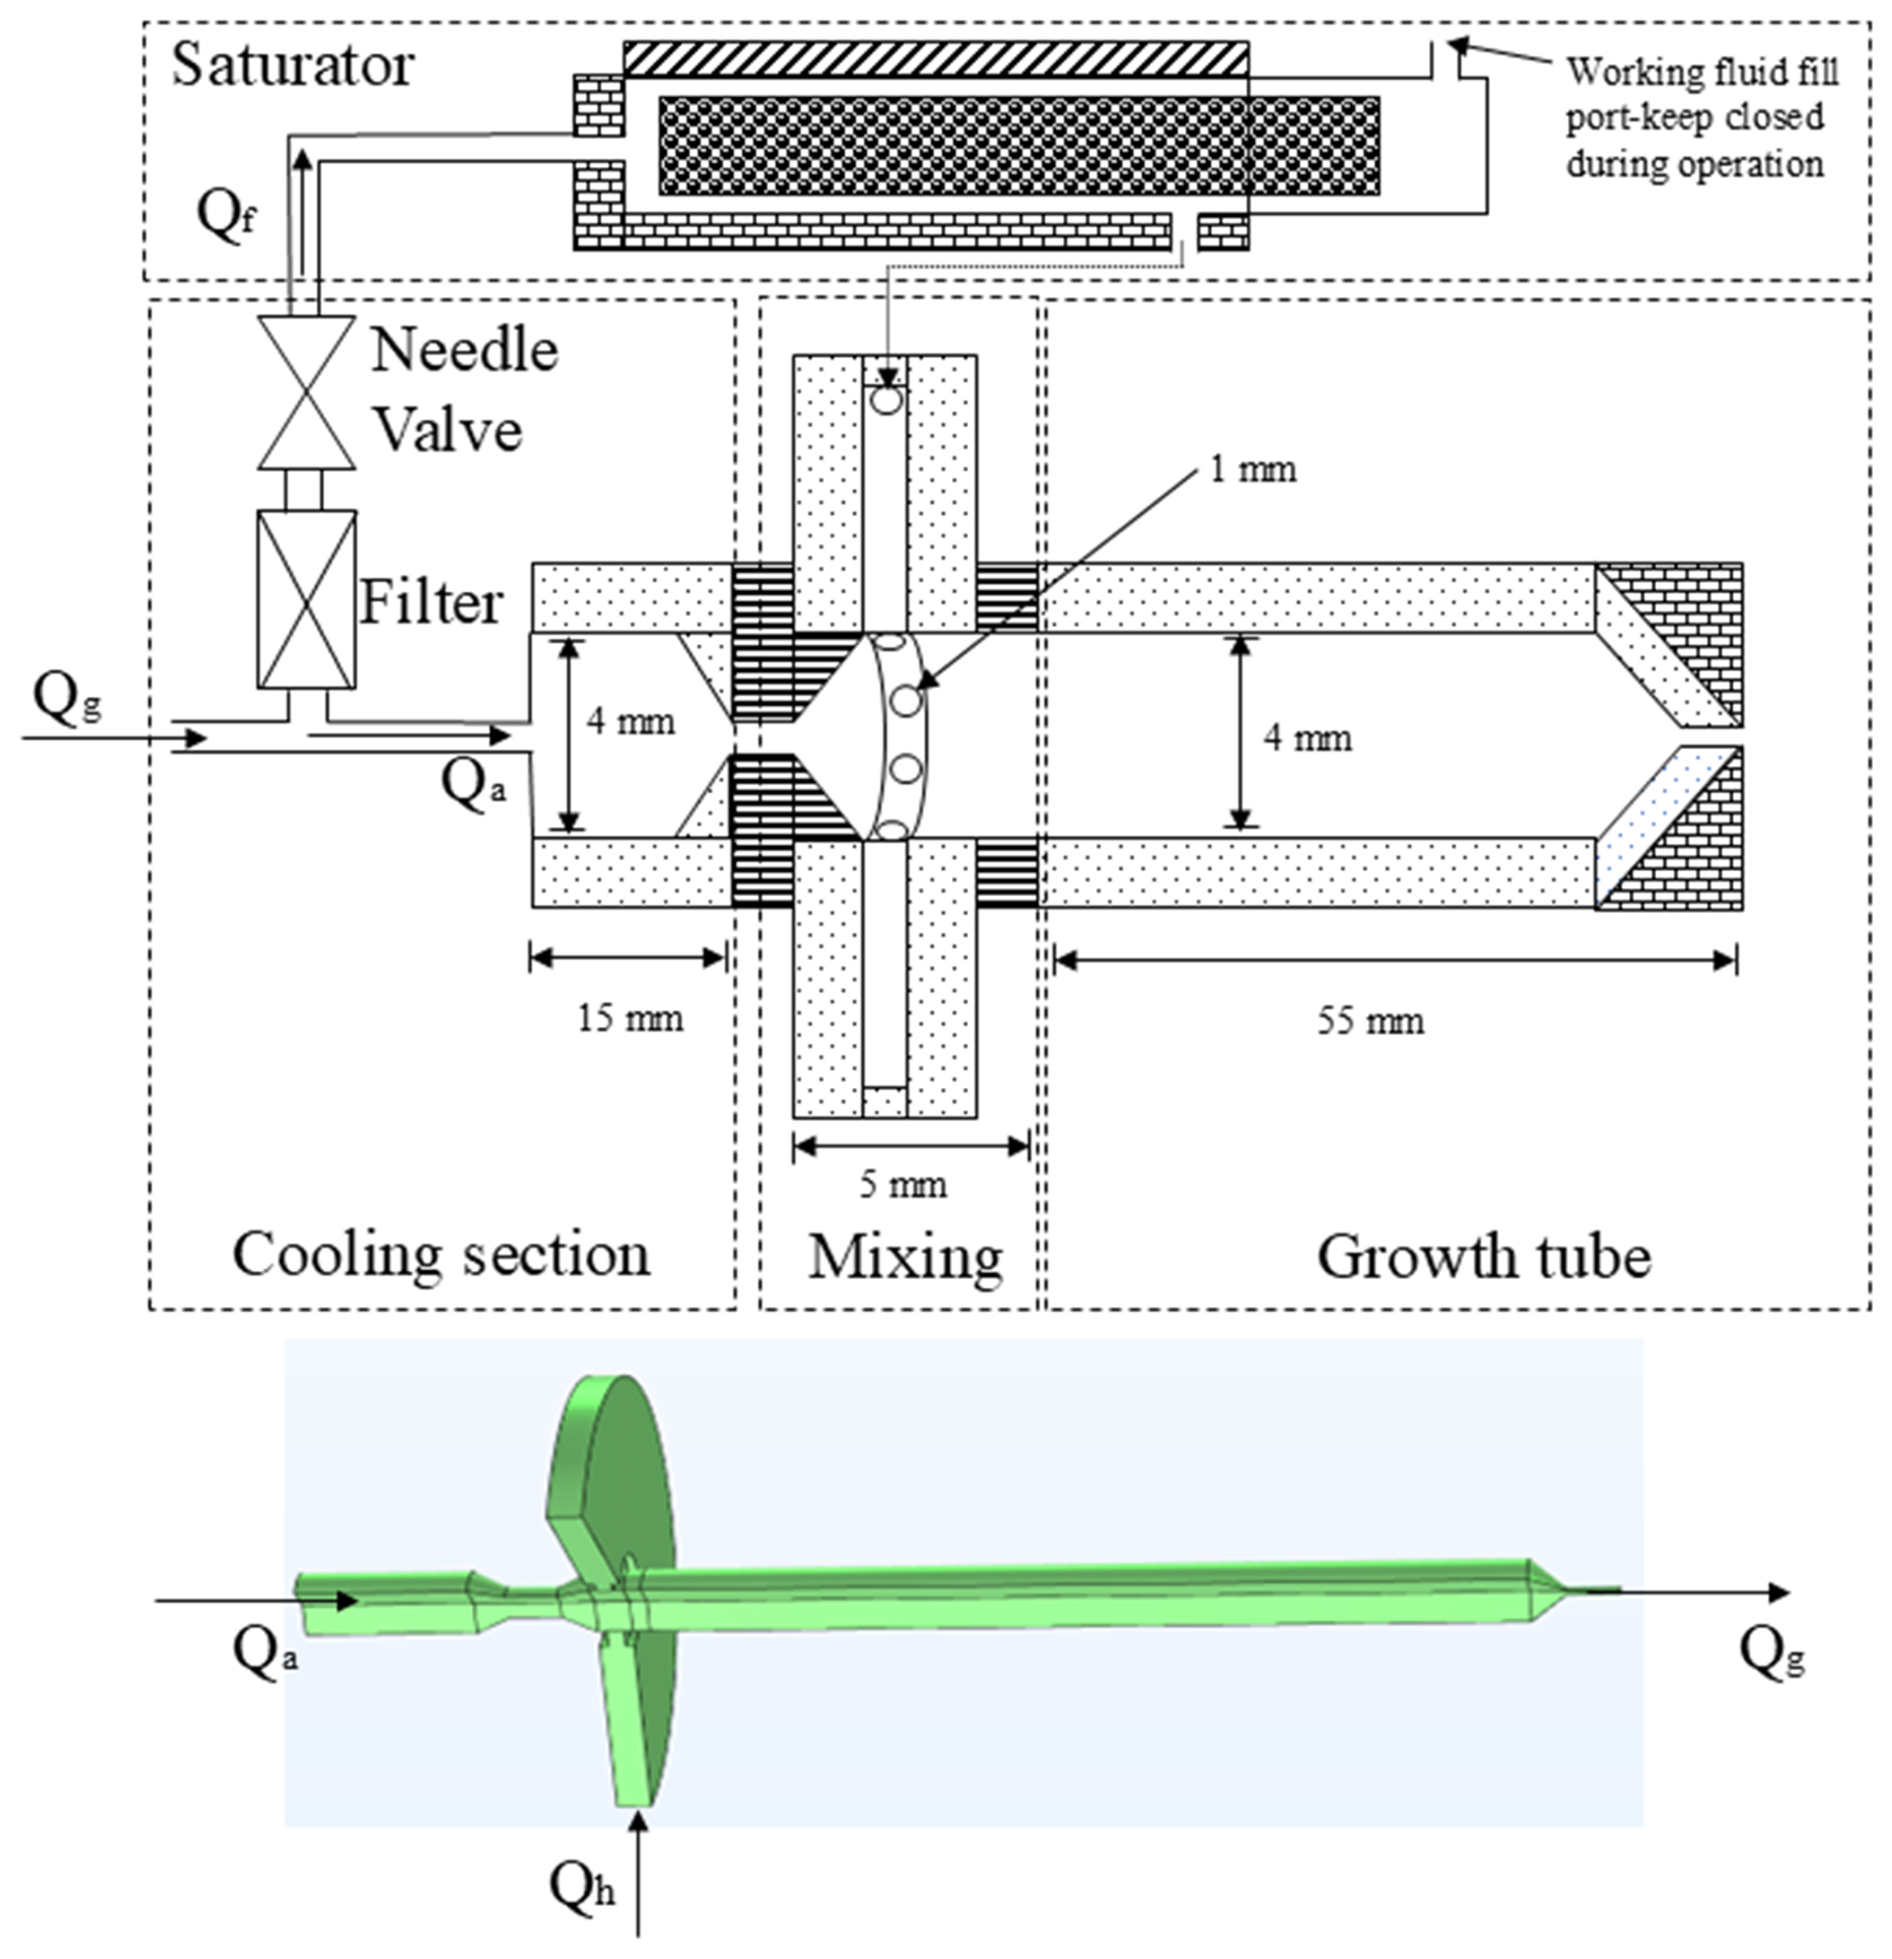
In this study, the total inlet flow rate to the sMCPC is denoted as Qg, which is separated into two streams: a portion of total inlet flow is used as vapor carrier flow, Qh (vapor carrier flow ) which carries hot vapor to the mixing chamber after passing through a HEPA filter and a working fluid reservoir; the other portion of total flow, , which carries aerosol particles to the mixing chamber.
2.1 Problem Formulation
2.1.1 Governing Equations for Particle Growth
Both the supersaturation ratio and Kelvin diameter play crucial roles in the nucleation and size enlargement of particles. In a supersaturated vapor environment, vapor molecules condense onto the surface of particles, resulting in their size enlargement. Supersaturation ratio is the key factor governing the saturation rate (Sr), defined as the ratio of the partial pressure of the condensing vapor (p) to the saturated vapor pressure (ps) at the flow temperature (T):
For the condensation growth of particles, the Kelvin diameter Dk defines as the smallest particle size that can be activated to start the growth of particles under a specific supersaturation ratio, Sr. Equation (2) is derived from the Kelvin equation, which relates the equilibrium vapor pressure over a curved droplet surface to that over a flat surface,
where σ is the liquid's surface tension, vm its molecular volume, kb the Boltzmann constant, T the absolute temperature.
To quantify the particle activation of a CPC, the activation efficiency (ηact) was introduced as a key performance metric, defined as the ratio of particles which are successfully activated, and their sizes are grown to an optically detectable size, to the total number of particles entering the CPC. The activation efficiency can thus be calculated as:
where r is the radial coordinate, w(r) is the axial velocity profile, and N(r) is the local number concentration of activated particles with the radius r. Qa denotes the sampled aerosol flowrate; N0 is the number concentration of sampled particles; and Ract represents the maximal radius of the activation zone in the growth tube.
The counting efficiency was derived from the COMSOL-resolved fields ny the flux-based method. In the method, the local supersaturation distribution was first obtained from the calculated temperature and vapor concentration fields. The corresponding minimum activation diameter Dp,kel was then calculated using Eq. (2). The activation region for the particle growth was identified as the region, defined by the outermost radius, Ract, in which the growth of particles in a given size can be activated. Assuming that particles entering this region undergo condensational growth, the activation efficiency was calculated by integrating the particle number flux over the activated region by Eq. (3). Note that local particle flux, which is the product of the axial velocity profile w(r) and the local particle concentration N(r), is used in Eq. (3).
While the supersaturation ratio is the key driver for condensation growth of particles in a CPC, excessively high supersaturation levels may increase the chance of new particle generation via the homogeneous nucleation of working fluid vapor. The formation of new particles can result in false counts in the CPC reading. It is therefore necessary to quantitatively assess whether the operational supersaturation leads to homogeneous nucleation or not through the evaluation of homogeneous nucleation rate (based on classical nucleation theory). By limiting the contribution of homogeneously nucleated particles to less than one particle per second, the maximal supersaturation avoiding the homogeneous nucleation can be determined. This provides a basis for determining the optimal CPC temperature in the modeling (Iida et al., 2009). The nucleation rate I can be calculated by (Friedlander, 2000)
where m is the molecular mass of working fluid and n is the molecular concentration of the condensing vapor. I is the local homogeneous nucleation rate to evaluate the risk of homogeneous nucleation under different temperature settings. Note that the homogeneous nucleation analysis in this modeling is used as the reference for the selection of the temperature setting for sMCPC operation, not to accurately predict the nucleation rate.
Once particles are activated in a vapor-supersaturated environment, their subsequent condensational growth can be described by the diffusion-driven mass transport of vapor molecules to the particle surface. With the assumption of a spherical particle, and neglecting both the particle coalescence and curvature-dependent effects beyond the Kelvin correction, the temporal growth of particle diameter Dp can be estimated by:
where Dv is the diffusion coefficient of the condensing vapor in air, vm is the molecular volume of the condensable vapor, χ is the Fuchs–Sutugin correction factor accounting for non-continuum effects, p is the condensing vapor pressure away from the droplet surface, and pd is the equilibrium vapor pressure at the droplet surface. The value of pd is computed as a function of the droplet surface temperature Td:
as proposed by Butt et al. (2003), incorporating the Kelvin effect for curved interfaces. The correction factor χ depends on the Knudsen number () and is given by (Hegg and Larson, 1990):
To account for heat transfer during condensational growth, the droplet surface temperature (Td) is introduced herein and calculated together with the particle growth (Eq. 5). Because the latent heat is released during vapor condensation and exchanged between the droplet surface and the surrounding gas (T), the droplet surface temperature, Td, would not be equal to the local gas temperature (away from the droplet surface). The evolution of Td is therefore described by an energy conservation equation that considers both the latent heat of condensation and conductive heat transfer between the droplet and the surrounding gas:
where cp is the specific heat capacity of the droplet, ρv is the droplet density, Hvap is the latent heat of vaporization, and kg is the thermal conductivity of the surrounding gas. χh corrects for the non-continuum effects in heat-transfer, calculated as
where mg, ρg, and cp,g are the molecular weight, density, and heat capacity of air, respectively. αT is the thermal accommodation coefficient and assumed to be unity for simplicity (Seinfeld and Pandis, 2016). Equation (8) captures the dynamic interplay between heat and mass transfer during the particle growth for accurately predicting the droplet evolution under transient supersaturation conditions.
The above equations require the temperature and vapor fields of working fluids in the flow channel of sMCPC for the calculation of particle activation and condensational growth. An axisymmetric COMSOL model was therefore used to obtain the steady-state velocity, temperature, and vapor fields in the mixing chamber and growth tube of the sMCPC. Once calculated by COMSOL Multiphysics, the filed data was transferred to MATLAB for calculating the particle activation and growth. Local temperature and vapor partial pressure were obtained from these fields at each time step for the particle trajectory and growth calculation.
The vapor diffusion coefficient and the non-continuum mass- and heat-transfer corrections were then evaluated, and Eqs. (5)–(9) were solved simultaneously to update the particle diameter and droplet temperature. Instead of releasing and tracking an ensemble of individual particles, the particle population at the inlet was represented by a continuous radial distribution. The calculated activation boundary was subsequently combined with the local particle number flux, w(r)N(r), and the counting efficiency was obtained through the flux-weighted integration given in Eq. (3).
Note that the particle Brownian diffusion in the convective direction was neglected when calculating the advective transport paths. The above assumption was assessed by comparing the characteristic diffusion velocity, , with the axial advective velocity U. Over the investigated particle-size range (≤ 100 nm) and operating conditions, , indicating that particle transport is dominated by advection. Moreover, the particle-laden flow entering the mixing chamber (along the centerline) is immediately exposed to the vapor-rich flow (introduced through a series of small holes arranged annularly), thereby keeping particles away from the near-wall region. The effect of particle Brownian diffusion along the transport paths was considered to be limited.
The present modeling is partially coupled: only the flow, temperature and vapor fields were solved by COMSOL in a coupled manner, whereas the COMSOL-resolved fields were not updated due to the vapor consumption and latent heat release during the calculation of particle transport and growth. This is because low concentration of particles are considered in our study. Under the above assumption, the particle momentum loading and condensation-induced source terms are expected to have minor effect on the macroscopic flow, temperature, and vapor fields.
Note that the use of MATLAB for the particle-growth calculation is because it effectively enables the coupling of particle equations and size-dependent correction factors (i.e., particle diameter, droplet temperature, Kelvin correction, vapor diffusion properties, and non-continuum correction factors) as well as field data interpolation during the repetitive calculation of activation-efficiency (compared to performing the same calculation in COMSOL).
2.1.2 Governing Equations for Transport Phenomena in Mixing Chamber
This section describes the formulation used in the modeling of transport phenomena in the sMCPC. It includes the SST k–ω model for turbulent flow, energy equation for heat transfer, and dilute species transport equations for vapor distribution. These equations were solved by COMSOL in a coupled manner to obtain the velocity, temperature, and vapor concentration fields.
The SST (Shear Stress Transport) turbulent flow model combines the advantages of both the k–ω model (providing improved accuracy near walls and in boundary layers) and the k–ε model (offering robustness in free-shear flows, i.e., better performance in fully developed turbulence regions) (Menter, 1993; Menter et al., 2003). By using a blending function to transition between two models based on distance from the wall, the SST model effectively captures the flow characteristics in both near-wall and core flow regions. This feature makes the flow model well-suited for calculating turbulent flows with strong shear stress and separation, such as that in the mixing chamber of sMCPC. Accurate prediction of velocity variation, shear layer, and recirculation zone is essential for the calculation of vapor transport and supersaturation distribution. The governing equations for mass and momentum conservation under the Reynolds-Averaged Navier–Stokes (RANS) framework are expressed as:
where μt is the turbulent viscosity derived from the SST model, and ρg represents the buoyancy force, which could be important due to the thermal gradients in the mixing chamber.
The transport of turbulence quantities in the SST model is governed by the following two additional partial differential equations: one for the turbulent kinetic energy k, and one for the specific dissipation rate ω:
where Pk=μtS2 is the turbulence production term, S is the mean strain-rate magnitude, and is the eddy viscosity. F1 is the blending function of the SST model. The parameters σk, σω, γ, and β0 are calculated as
while β∗ is a constant. The default COMSOL values used in this study are σk1=0.85, σk2=1.00, σω1=0.50, σω2=0.856, , γ2=0.44, β01=0.075, β02=0.0828, and .
The temperature distribution in the mixing chamber significantly influences the local saturation vapor pressure, thereby affecting the supersaturation field. The heat transfer in the flow is modeled using the steady-state energy conservation equation:
where ρ is the fluid density, cp is the specific heat capacity at constant pressure, T is the absolute temperature, is the effective thermal conductivity, incorporating both molecular and turbulent heat conduction, accounts for viscous and turbulent dissipation. The inclusion of turbulent thermal diffusivity via the turbulent viscosity μt is crucial for capturing enhanced convective heat transport in the mixing chamber.
The transport of the working fluid vapor is modeled using the dilute species transport equation, which governs the convection and diffusion of vapor molecules:
where c is the vapor molar concentration, is the effective diffusivity, Sct is the turbulent Schmidt number.
2.1.3 Boundary Conditions
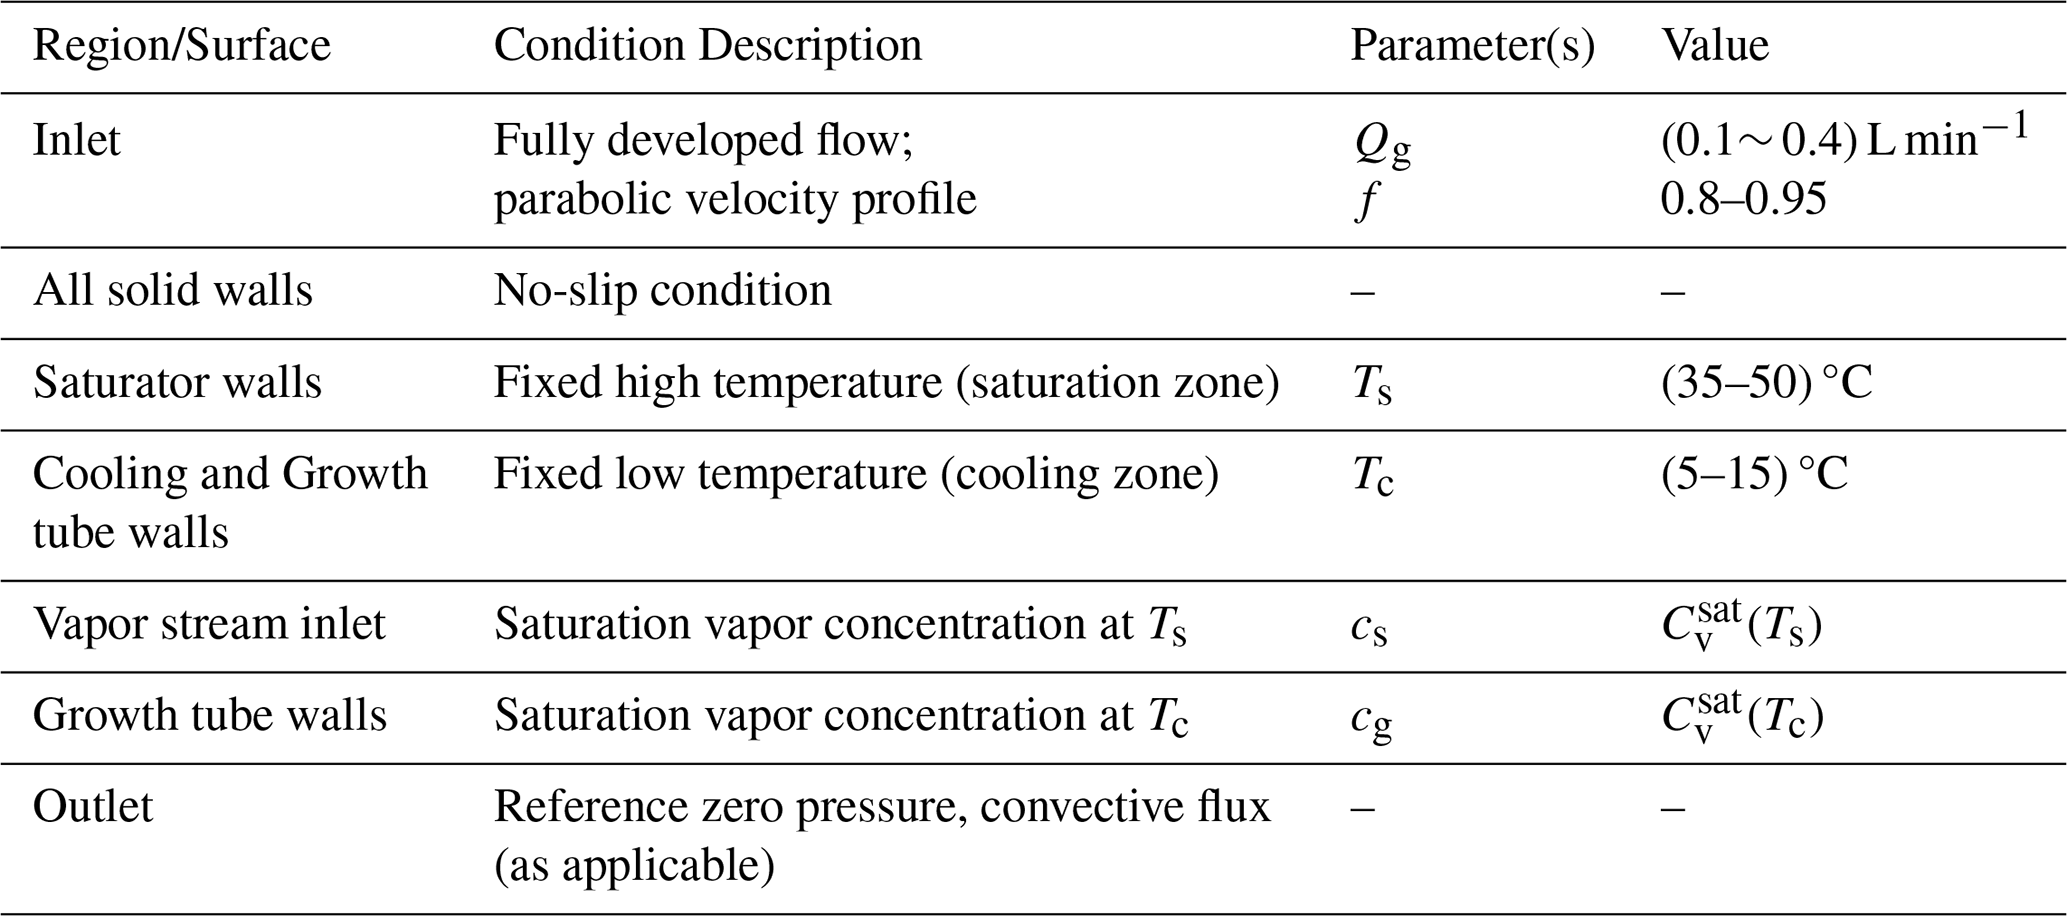
Appropriate boundary conditions are required to solve the above governing equations for modeling the flow mixing, temperature distribution, and vapor concentration in the sMCPC. The computational domain for modeling the sMCPC is shown in Fig. 2. The no-slip and specific temperature conditions (i.e., either saturator temperature Ts, or cooling temperature Tc) were set for all the solid walls for the flow and temperature fields, respectively. The vapor concentration of working fluid was set to the saturated concentration cs at the inlet and to cg on the walls of the growth tube. From the operation viewpoint, the temperature setting for the working fluid vapor and the growth tube determines the achievable supersaturation ratio in the growth tube, which is one of the key driving parameters. The sMCPC performance with different working fluids were further compared to investigate their effects on hygroscopic particle growth. Detailed boundary conditions are summarized in Table 1 for reference.
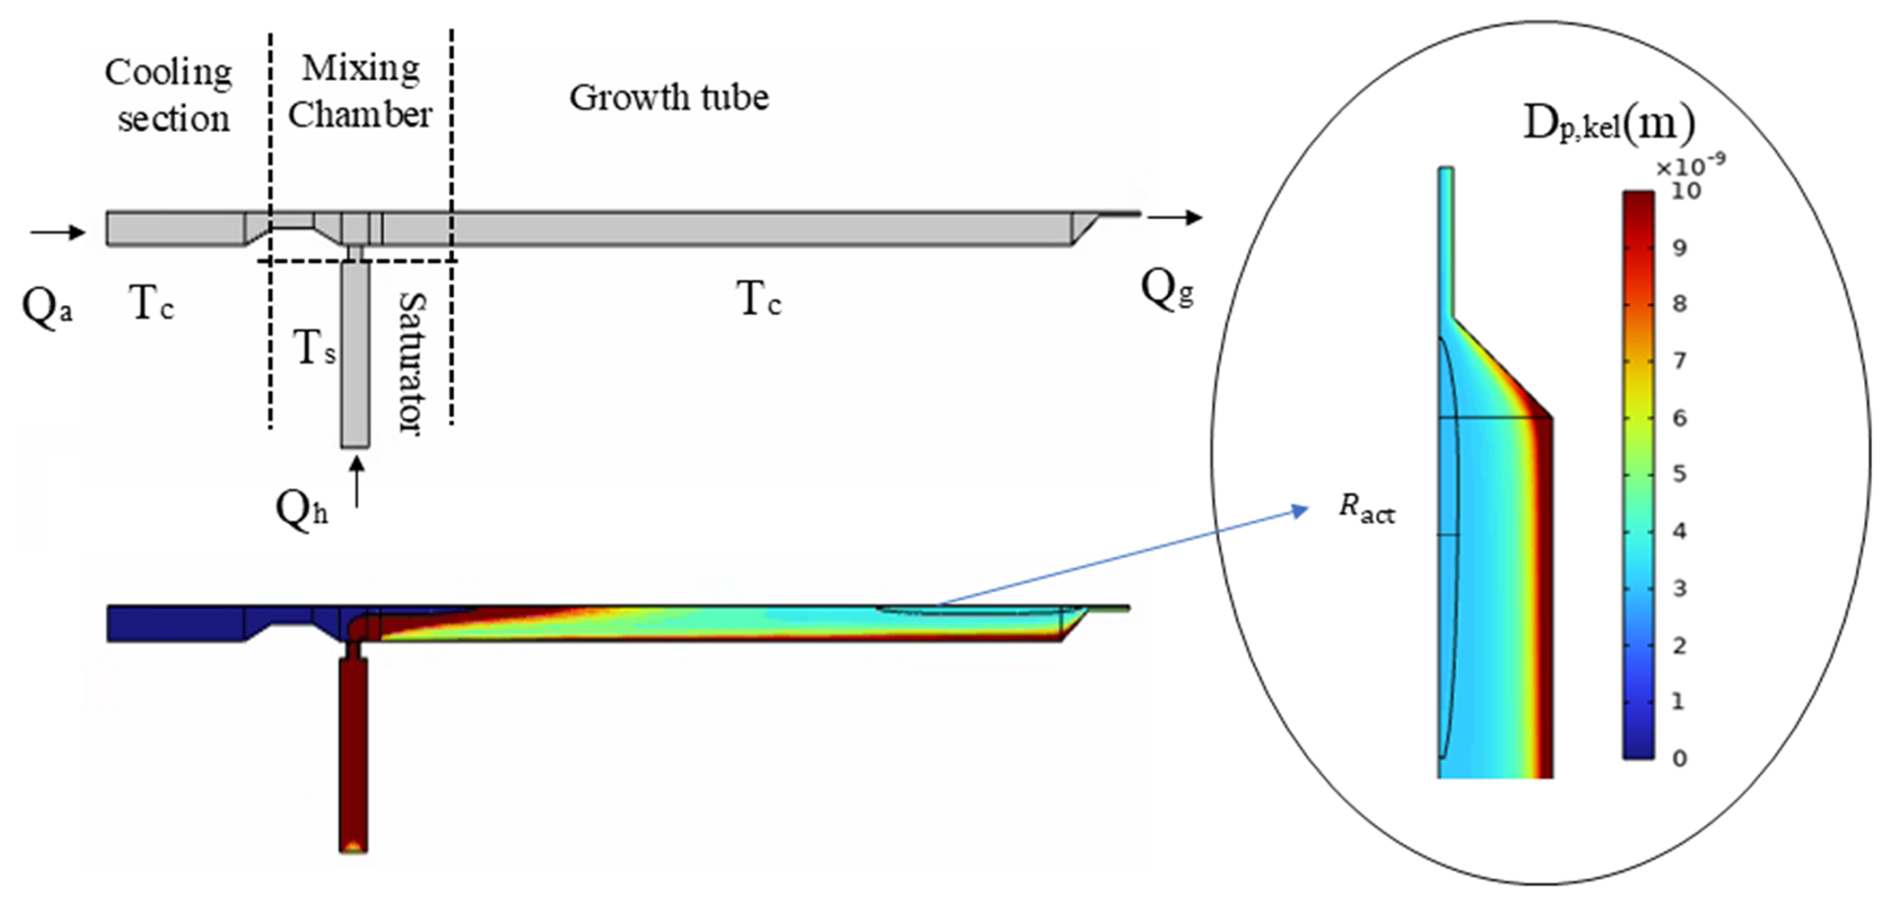
Figure 2Computational domain for modeling the sMCPC performance and a typical distribution of the equilibrium Kelvin-diameter.
2.2 Computational Domain and Its Meshing
Figure 2 shows the used computational domain including the aerosol inlet, saturated vapor inlet, turbulent mixing zone, particle growth tube, and outlet. The overall length of the domain is approximately 75 mm and an inner diameter of 4 mm. The mixing and growth tubes are 4 and 55 mm in length, respectively.
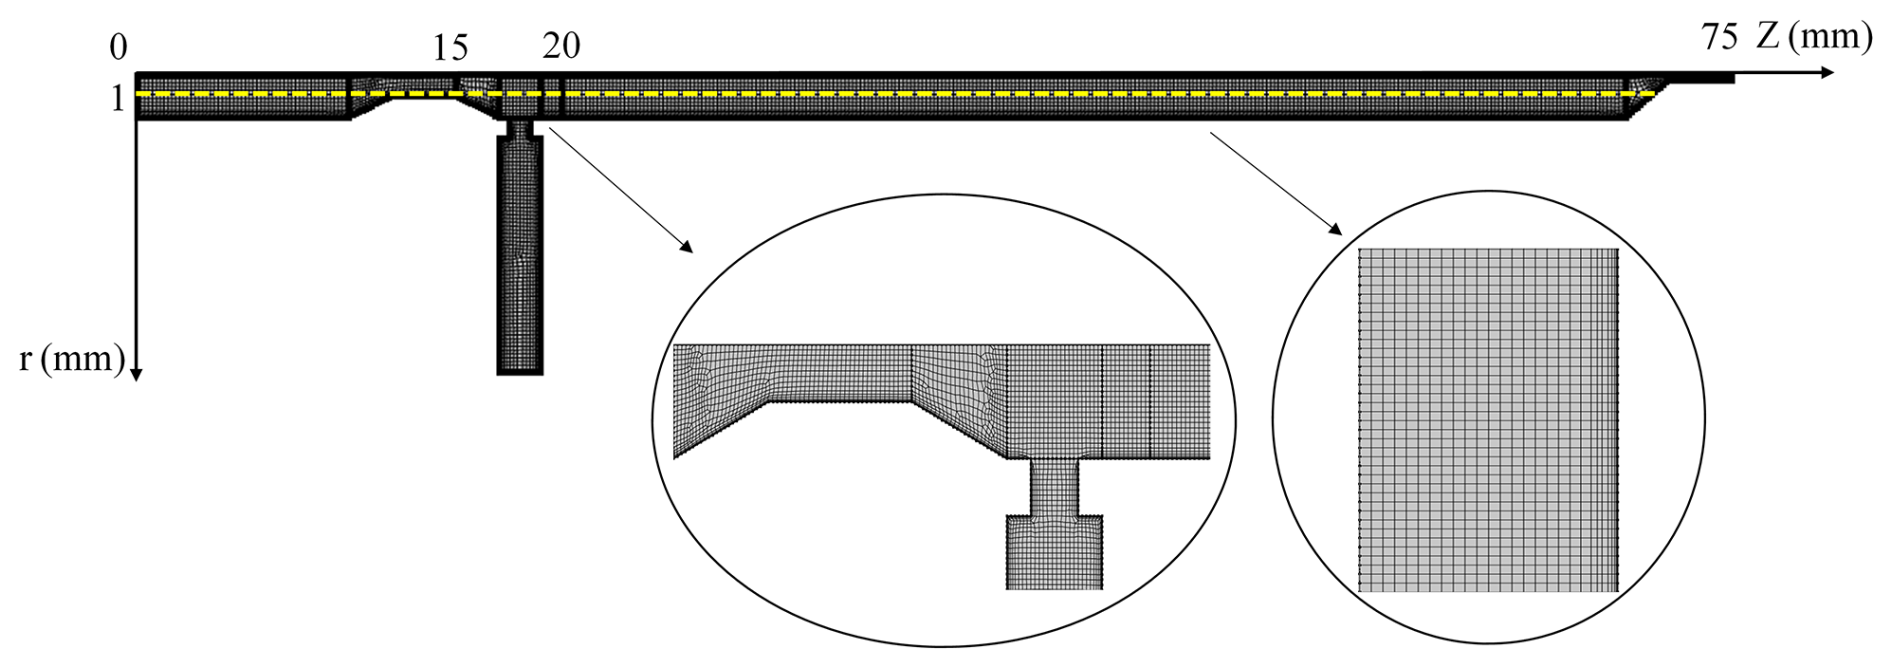
Figure 3Computational domain for modeling the sMCPC performance and a typical mesh layout near walls and in the mixing/growth zones.
Structured meshes with local refinement in the regions near the walls, in the mixing zone, and in the particle growth region were used. The thickness of the first layer meshes near solid walls was set to 0.002 mm to ensure the dimensionless wall distance , (where , y is the distance from the wall, uτ is friction velocity, ρ is density and μ is dynamic viscosity) in accordance with the requirement for using the SST k–ω turbulence flow model. In regions where saturated vapor and aerosol flows intersect, and within the mixing zone, the mesh size was refined to 0.03 mm. A total of approximately 24 366 elements were used in the computational domain, with average element quality greater than 0.98 and a maximum mesh aspect ratio less than 10 (shown in Fig. 3).
To ensure the mesh independence of calculation results, a mesh sensitivity analysis was conducted by comparing the axial temperature profiles obtained using medium and fine meshes. As shown in Fig. 4, the temperature distributions along the centerline (r = 0) and near the wall (r = 1 mm) show excellent agreement between the two meshing schemes. The fine-meshed results closely overlap the medium-meshed results, with negligible deviation throughout the domain, including regions with steep thermal gradients in the region where two streams are first encountered. The above comparison confirms that the medium meshing offers sufficient resolution to capture the key features of temperature. Medium meshing was therefore adopted for all subsequent modeling to save computational time.
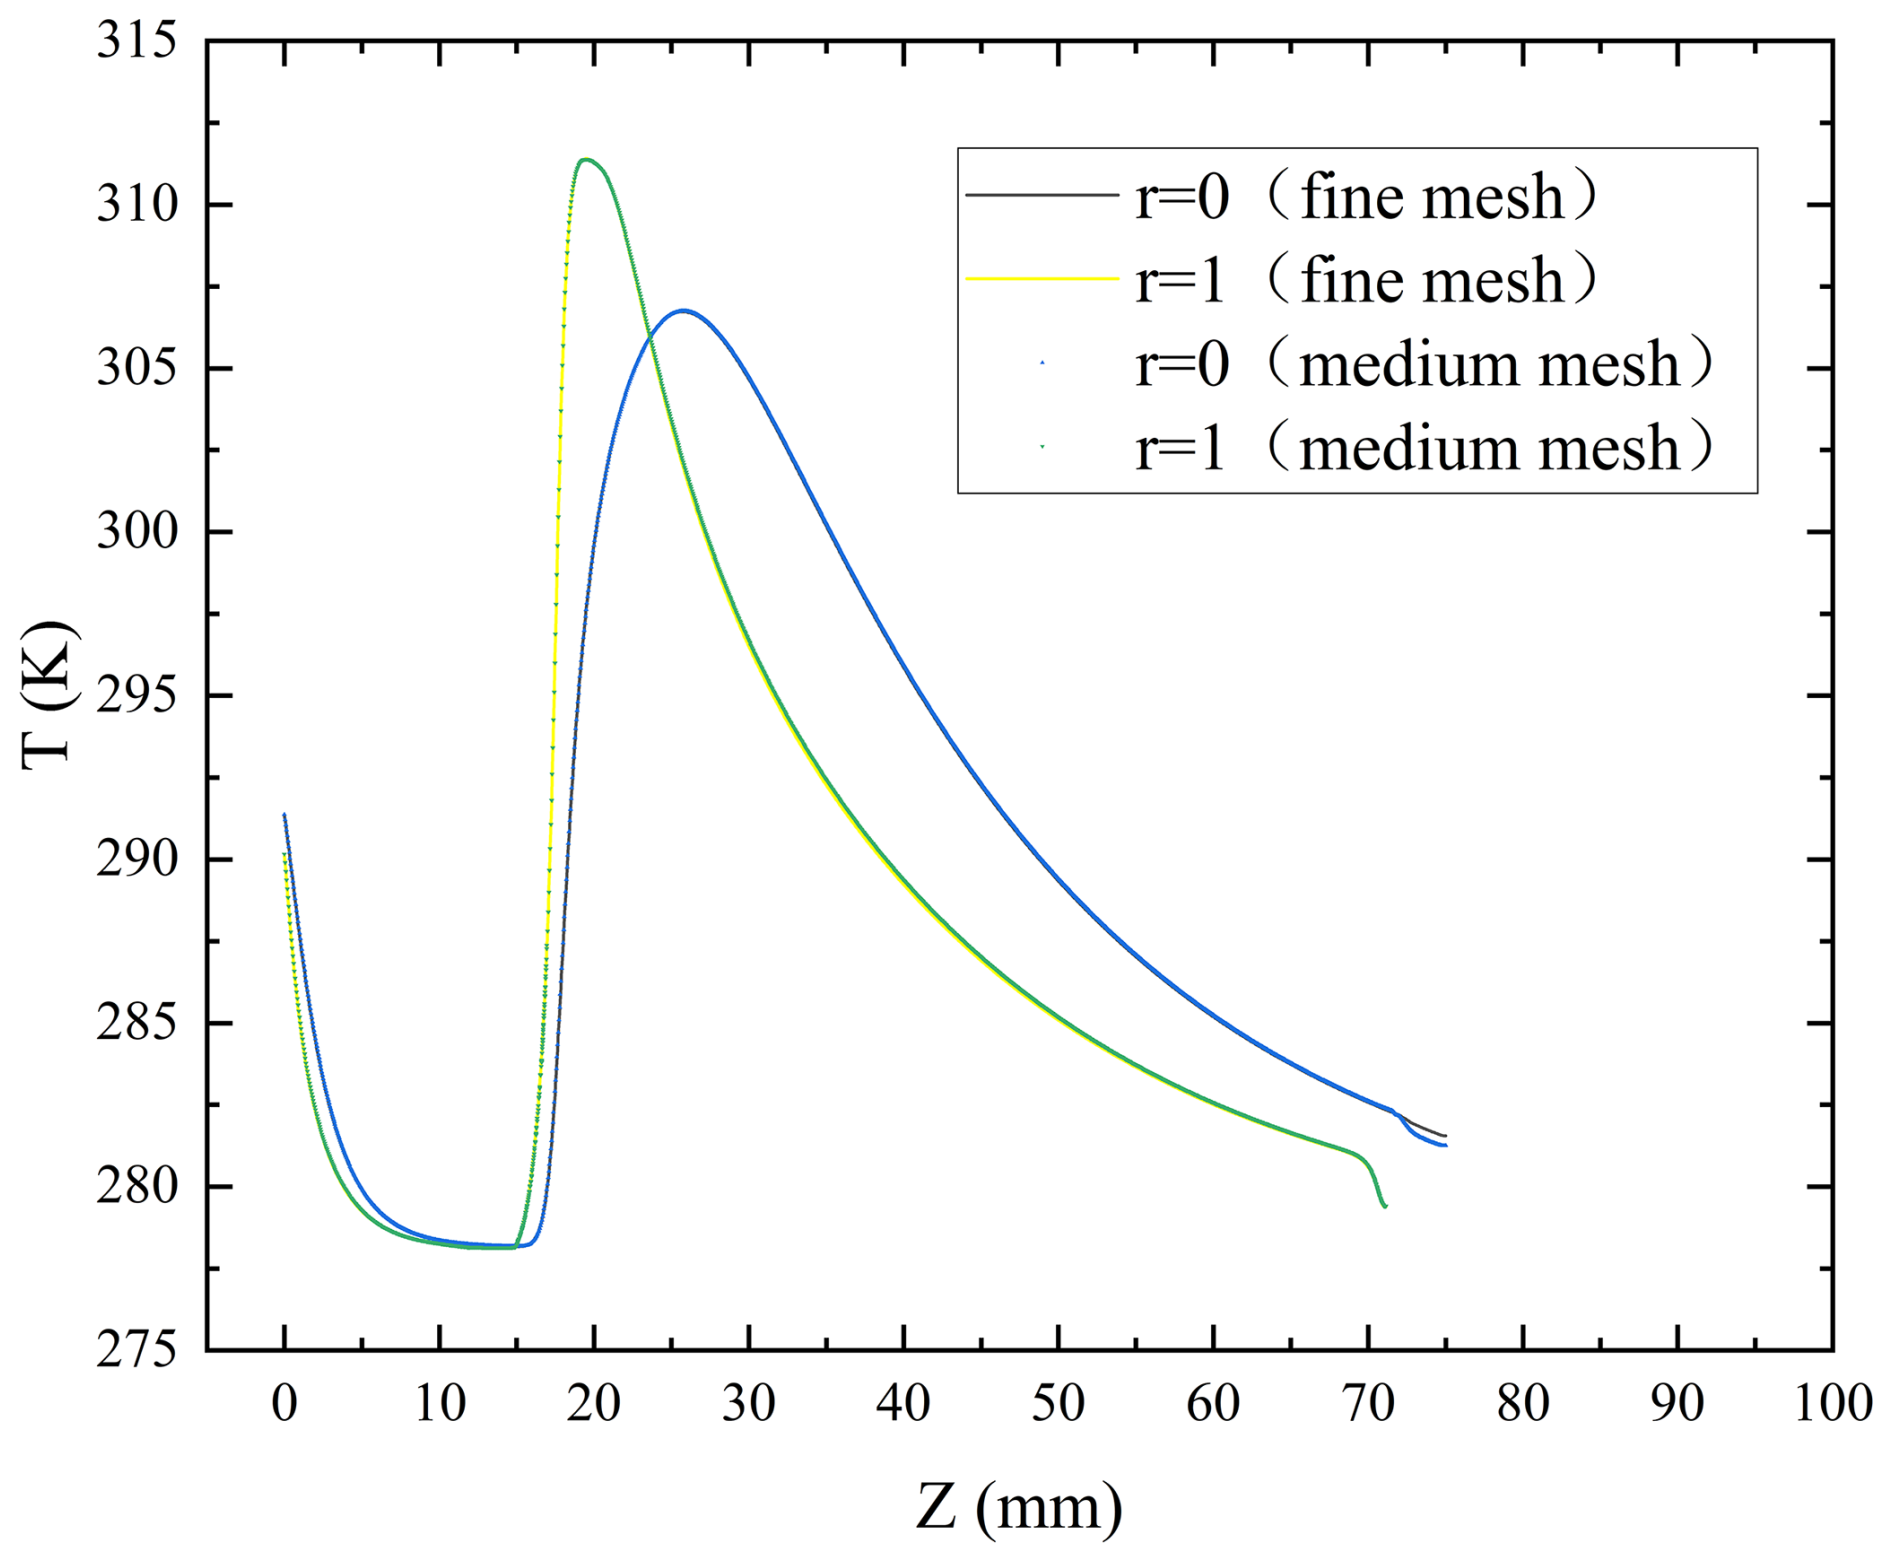
Figure 4Comparison of axial temperature profiles along the centerline of the sMCPC (calculated using medium and fine meshes).
2.3 Model Validation
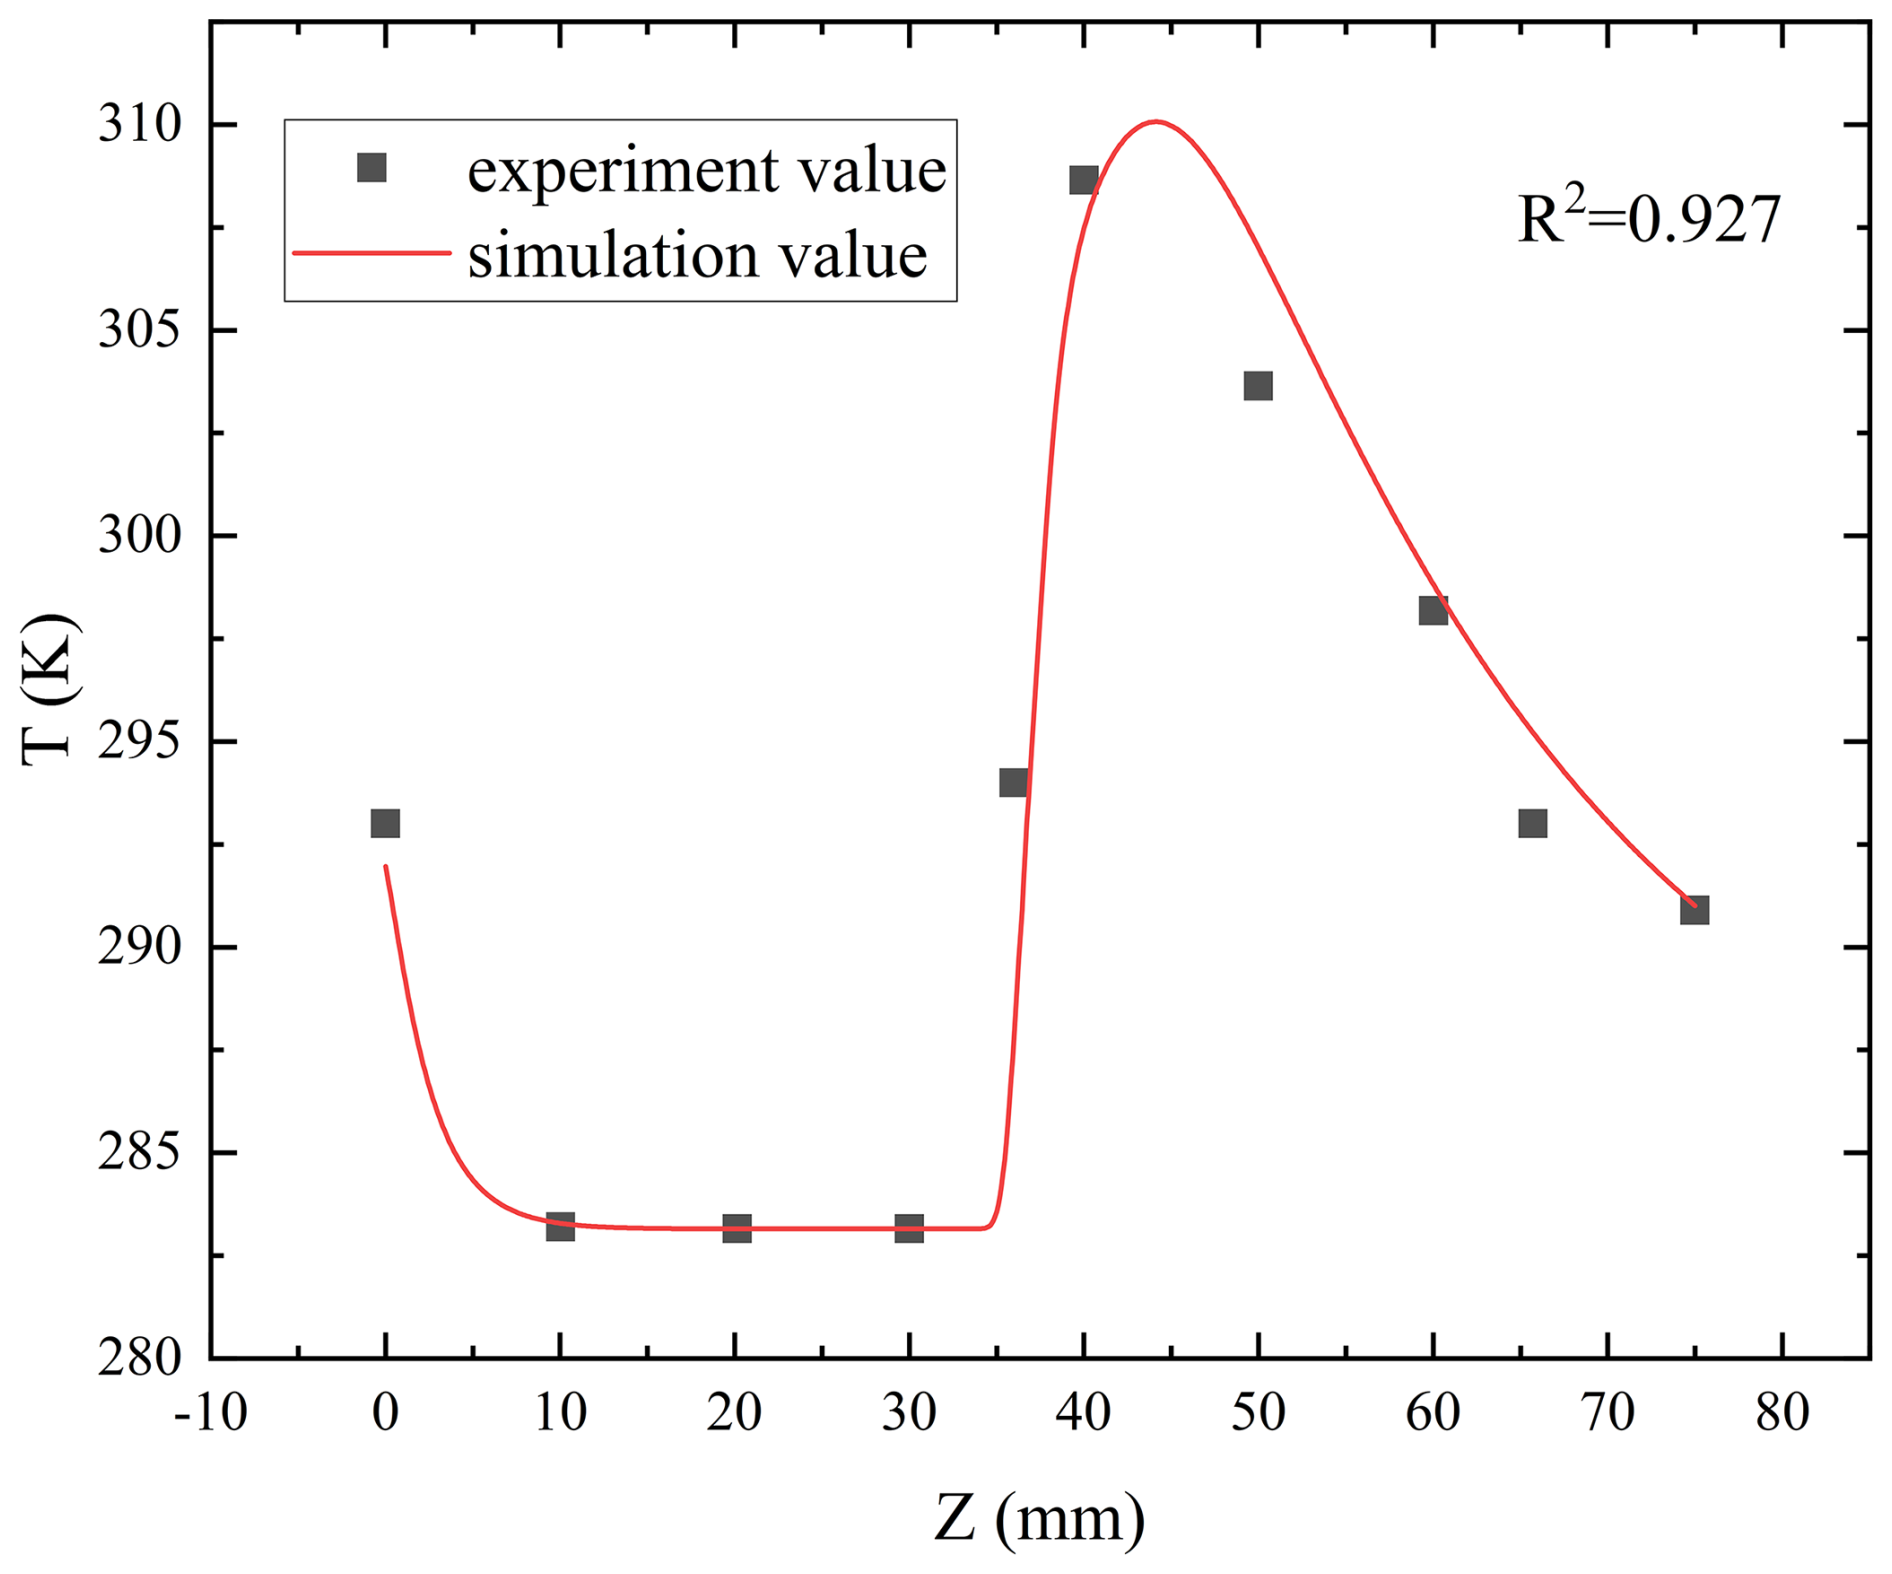
To validate the modeling of the sMCPC, supplementary experiment measuring the temperature profile along the axis of the sMCPC was conducted by inserting a thermocouple probe into the growth tube from its outlet. The probe was moved step by step along the axial direction to measure the temperature at different locations along the tube axis. Under the operational conditions (Tc = 10 °C, Ts = 40 °C, Qg = 0.3 L min−1, f = 0.9), the axial temperature distribution along the centerline of the particle growth region was measured and compared with the calculated result. As shown in Fig. 5, reasonable agreement between the experimental and calculated temperature profiles along the MCPC centerline was observed (R2 = 0.927). Overall, the modeling reproduces the temperature gradient and its spatial distribution. Minor discrepancies between two results could be attributed to the slight misalignment of measurement locations with the centerline when probing the thermocouples into the sMCPC.
3.1 Effect of temperature setting
The differential temperature between Tc (for cooling section and growth tube) and Ts (vapor saturation chamber) is one of key factors influencing the performance of the sMCPC. The maximal supersaturation threshold to prevent working fluid vapor from homogeneous nucleation in the sMCPC is calculated using Eq. (4). Accordingly, the temperature setting for satuation vapor, Ts, is 35, 40, 45, and 50 °C; and the setting for both cooling section and growth tube, Tc, is 5, 10, and 15 °C, when using n-butanol as the working fluid. Figure 6 shows the temperature profile and supersatuartion ratio along the axis of the sMCPC.
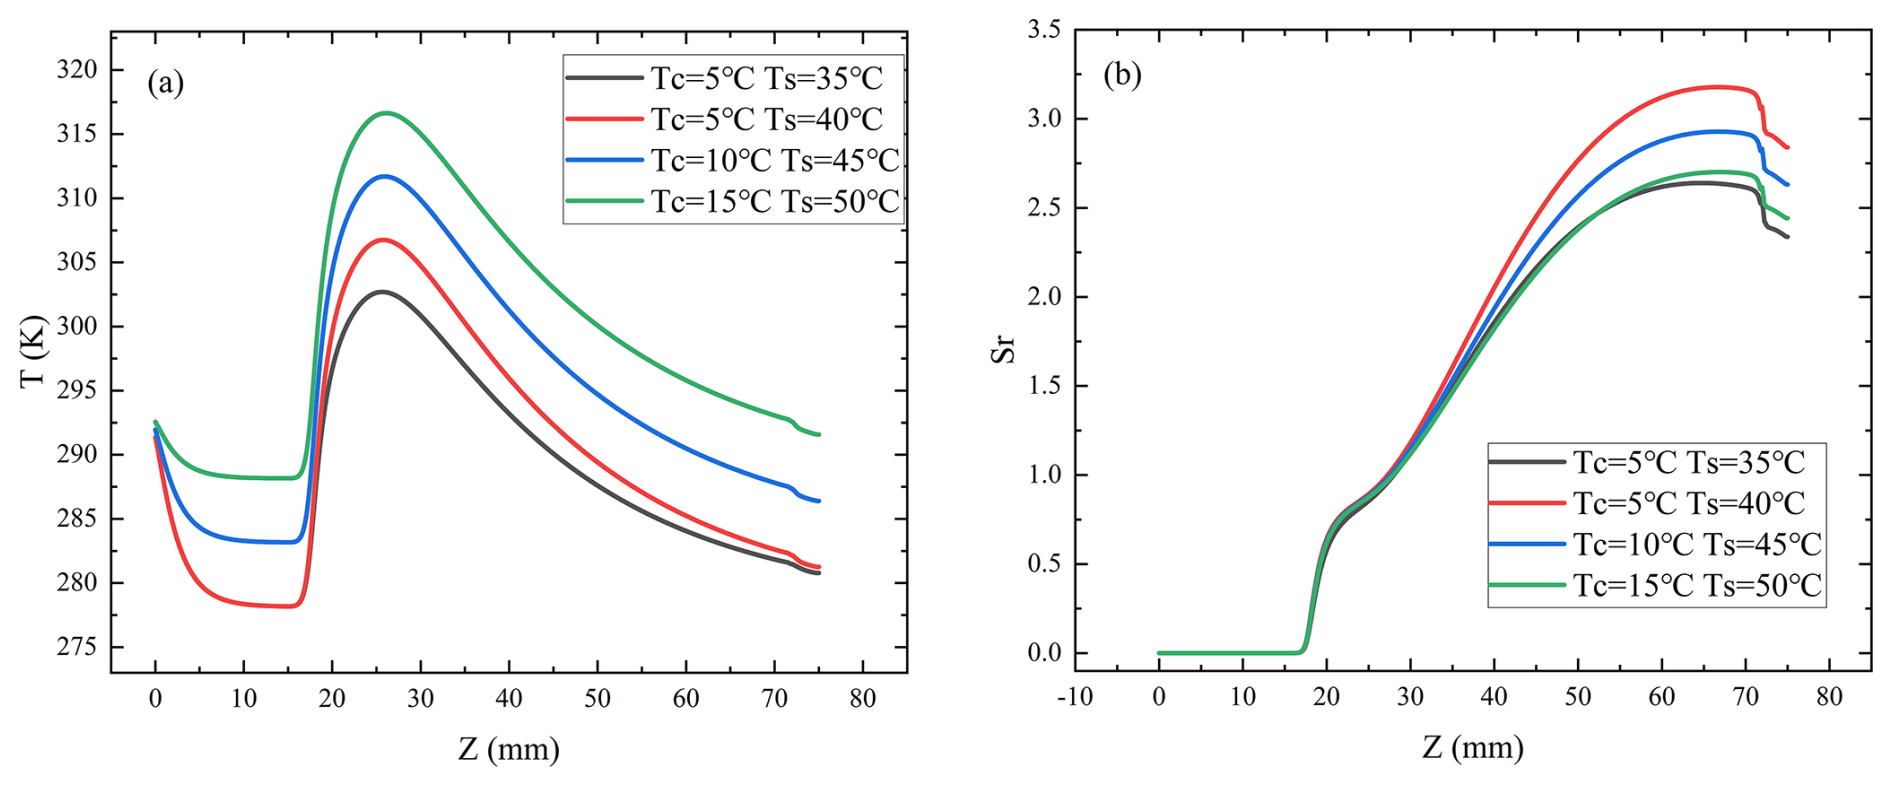
Figure 6Temperature distribution (a) and Supersaturation ratio distribution (b) along the axis of the sMCPC under different temperature settings for Tc and Ts.
As evidenced in Fig. 6, significant variation was observed in both temperature (Fig. 6a) and supersaturation profile, Sr, (Fig. 6b) along the sMCPC axis. The increase of Sr was pronounced between z = 20 mm and z = 60 mm, peaked at z = ∼ 65 mm for all the studied temperature settings. Note that, although the setting with the largest temperature difference (i.e., Tc = 15 °C, Ts = 50 °C) resulted in the highest thermal peak, its maximal supersaturation was actually lower than that observed in the setting of Tc = 5 °C, Ts = 40 °C. For the cases with the same temperature difference (ΔT=35 °C), increasing both Ts and Tc leads to a reduction in the maximum supersaturation. This is because, although the local vapor pressure p was increased by increasing the temperature setting, it significantly increased the saturation vapor ps(T) at the same time. The increase in ps(T) outweighs the increase in p, resulting in the decrease of supersaturation ratio. The calculated result indicates that Sr,max reaches approximately 3.2 for the setting of Tc = 5 °C and Ts = 40 °C, compared to ∼ 2.8 for the setting of Tc = 15 °C and Ts = 50 °C, suggesting that simultaneous increase in both Ts and Tc actually limits the achievable max. supersaturation in the sMCPC. Moreover, under minimal temperature differentials (e.g., Tc = 5 °C, Ts = 35 °C), the rate of increase in the supersaturation ratio was significantly low, and peaked at a relatively low value (compared with other settings), indicating weak driving force for the activation of ultrafine particles in sMCPC. The observed trend is qualitatively consistent with that reported in previous studies on laminar flow CPCs (Barmpounis et al., 2017; Wlasits et al., 2020) although the studied sMCPC involves convective mixing processes, which is different from that in laminar CPCs.
Figure 7 shows the calculated activation efficiency for ultrafine particles in the sMCPC under different temperature settings. Under the condition of Ts = 40 °C and Tc = 5 °C, the particle diameter corresponding to 50 % activation efficiency (Dp,50) is ∼ 3.55 nm. In contrast, under the setting of Ts = 35 °C and Tc = 5 °C, this value increased to ∼ 4.25 nm, indicating a notable difference in the activation performance between two temperature settings.
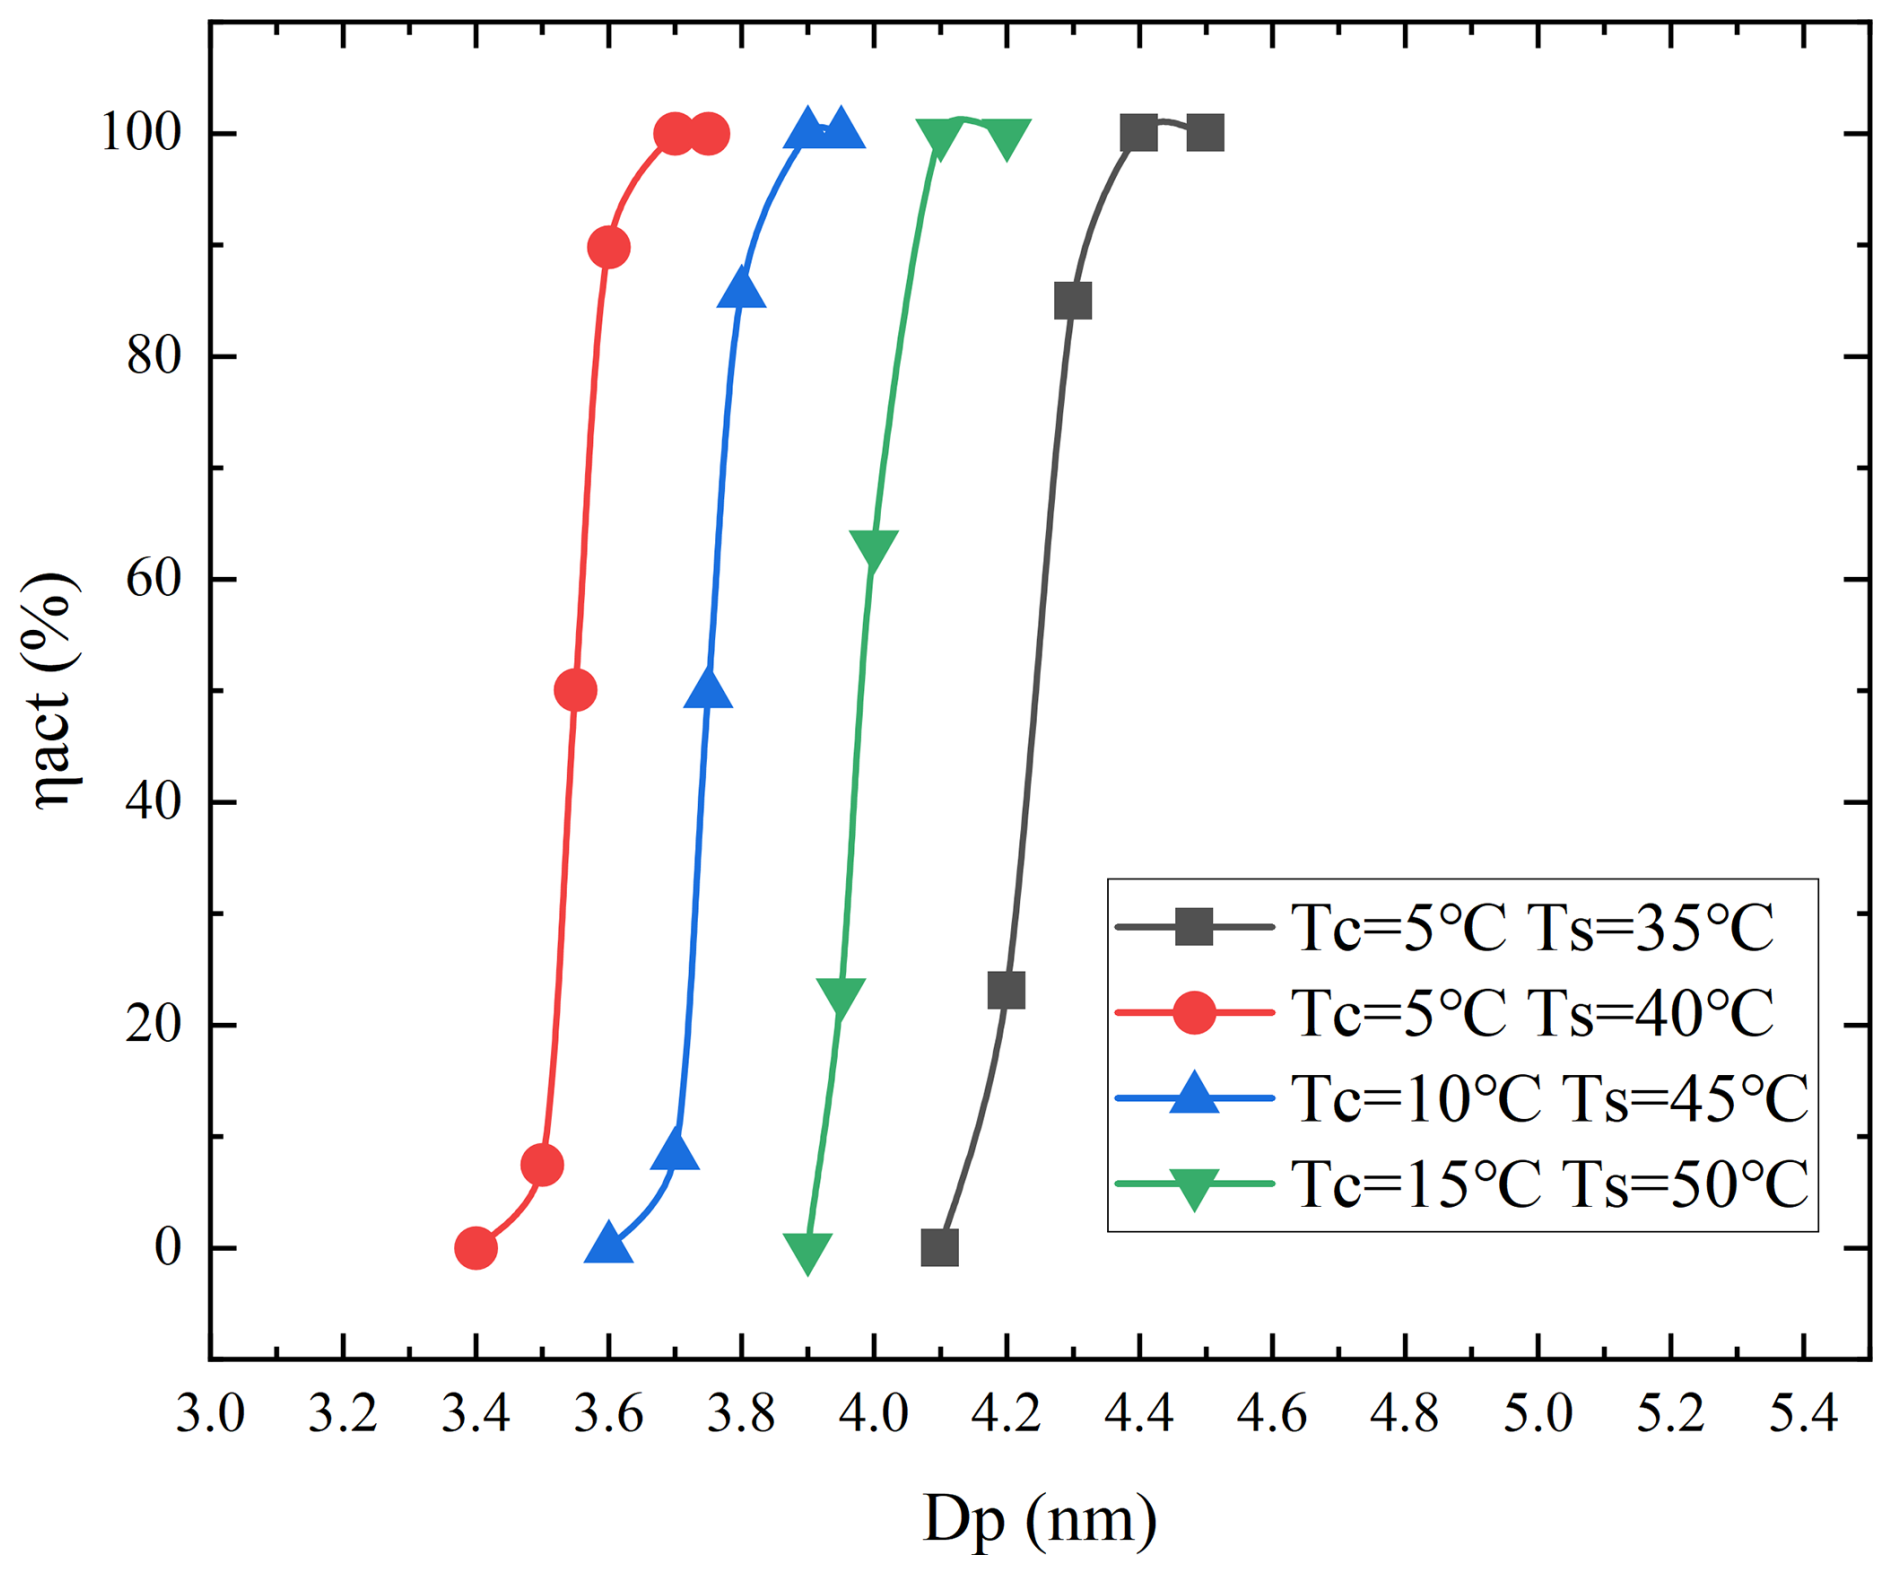
Figure 7Effect of temperature settings (Tc and Ts) on the calculated activation efficiency and critical activation diameter of particles in sMCPC.
The above result further confirms that the temperature difference between Ts and Tc is a key parameter governing both the intensity and spatial distribution of supersaturation in the sMCPC, strongly affecting the particle activation behavior. As shown in Fig. 8, by increasing the temperature difference from Ts = 35 °C and Tc = 5 °C to Ts = 40 °C and Tc = 5 °C, the activation region for particles in the same size was enlarged. The above indicates that not only does a large temperature difference promote the formation of a high supersaturation field in the growth tube, but also enlarge the size of effective activation zone, thereby improving the activated probability of sub-4 nm particles (Kuang et al., 2012; Barmpounis et al., 2017). Based on this finding, the condition of Ts = 40 °C and Tc = 5 °C was selected for the subsequent simulations.
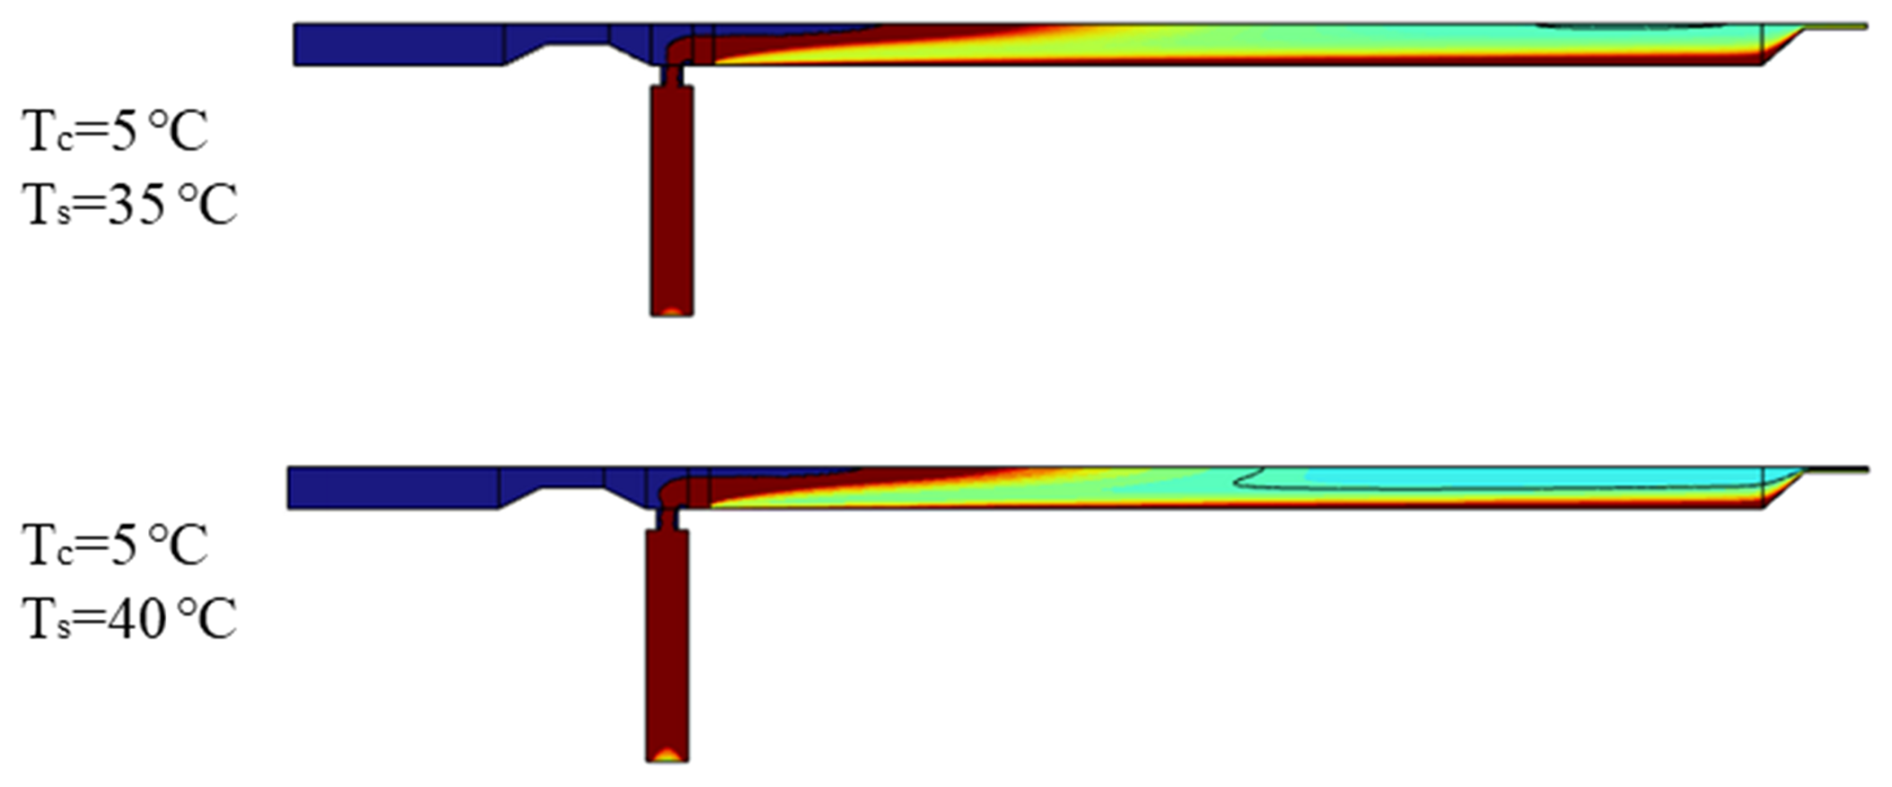
Figure 8Comparison of activation regions for particles with the same diameter in the sMCPC under different temperature settings.
3.2 Effect of total flowrate
Figure 9 shows the effect of total flowrate, Qg, on the temperature, saturation ratio, and activation efficiency of the sMCPC under a fixed vapor flow fraction of f = 0.9. As shown in the temperature profiles (Fig. 9a), the increase Qg from 0.1 to 0.4 L min−1 results in a noticeable decrease in the peak temperature and the peak location is moved downstream. This observation indicates that at a high flowrate, the residence time for mixing saturated vapor and cool air in the sMCPC is reduced, thereby diminishing heat-transfer efficiency.
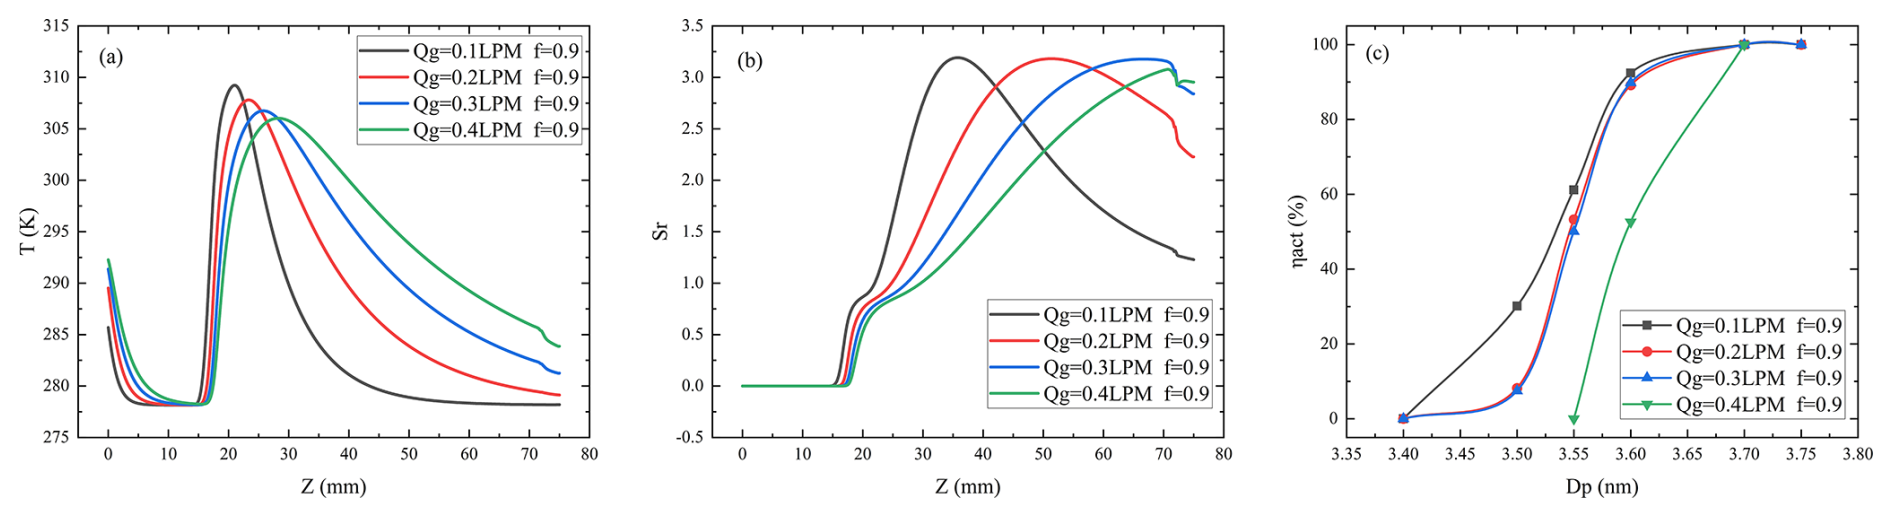
Figure 9Effect of Qg (at fixed f = 0.9) on (a) temperature, T; (b) supersaturation ratio, Sr; and (c) activation efficiency, ηact, in the sMCPC.
The saturation distribution (Fig. 9b) exhibits similar trend as observed in the temperature distribution. At either a low total flowrate or high vapor fractions, sMCPC can rapidly establish a high supersaturation environment over a short axial distance. However, when Qg increases from 0.1 to 0.3 L min−1, the value of the maximal supersaturation ratio does not vary significantly. The notable change was observed for the donwstream location shift of peaked supersatuartion ratio in the growth tube. It is also noteworthy that, when the aerosol flow rate Qa is very low, the diffusional loss of particles in the cooling sectioin is significant (Balendra et al., 2023). In the consideration of both activation performance and diffusion losse, 0.3 L min−1 is thus selected as the operational total flow rate for the sMCPC.
Furthermore, the activation efficiency curves (Fig. 9c) reveal that the Dp,50 remains approximately 3.55 nm for Qg between 0.1 and 0.3 L min−1. When Qg increases to 0.4 L min−1, Dp,50 increased to above 3.60 nm, indicating that excessively high total flow rates hinder the effective activation of sub-4 nm particles.
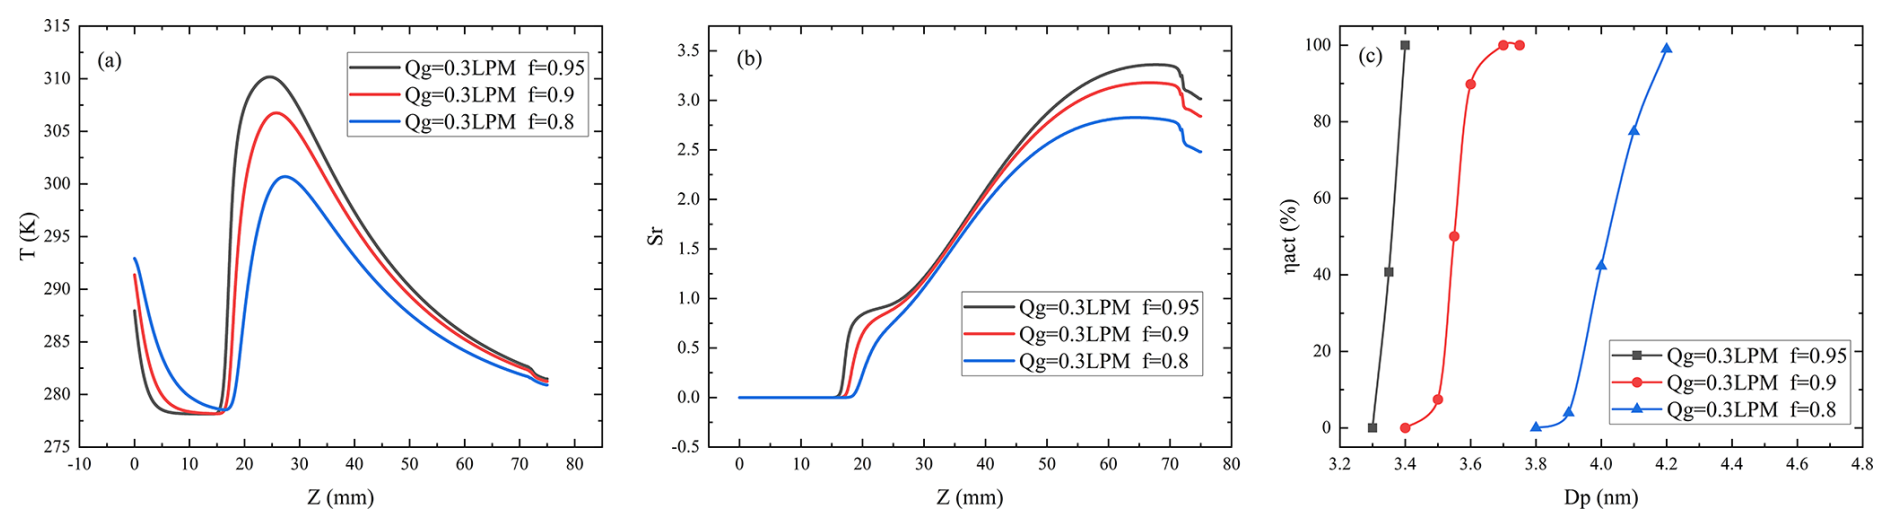
Figure 10Effect of f (Qg = 0.3 L min−1) on (a) temperature, T; (b) supersaturation ratio, Sr; and (c) activation efficiency, ηact in the sMCPC.
Figure 10 shows the effect of f (the fraction of total flowrate used as the vapor carrier flowrate) on the temperature, supersaturation ratio, and activation efficiency of the sMCPC, at a fixed total flowrate of Qg = 0.3 L min−1. From Fig. 10a, it is evident that the increase of f resulted in a significant elevation of the temperature peak in the mixing zone. It indicates that a high f value facilitates the formation of strong temperature difference over a short axial distance, which is conductive to enhance the supersaturation.
The corresponding supersaturation distribution (Fig. 10b) shows that at f = 0.95, a higher supersaturation region was established closer to the inlet, and the maximal Sr is greater than that under low f value condition. It indicates that not only does a high vapor fraction increase the vapor concentration but also enhance the mixing efficiency between hot vapor and cooled aerosol-laden air.
As shown in Fig. 10c, the effect of f on activation efficiency is dramatically pronounced. When the vapor carrier flowrate ratio, f, increases from 0.80 to 0.95 under a fixed total flow rate (Qg = 0.3 L min−1), the Dp,50 significantly decreased from ∼ 4.2 to ∼ 3.4 nm. This observation clearly demonstrates that a high vapor carrier flow fraction substantially enhances the sMCPC's sensitivity for ultrafine particles. Moreover, the steepness of the corresponding activation curves increased as f increased. The observed steep slope implies the establishment of a stable and well-defined supersaturated environment, enabling particles with the sizes above the critical size to be effectively activated without going through gradual transition. Not only does the increase of the vapor carrier flowrate boost the working fluid vapor concentration and enhance heat and mass transfer in the mixing zone but also leads to more consistent and sharply defined condensation growth behavior in the growth tube.
3.3 Effect of working fluid
We selected ethylene glycol (EG), diethylene glycol (DEG), dimethyl phthalate (DMP), and n-butanol (B) to investigate the combinational effect of vapor pressure and surface tension on the Dp,50 and droplet growth relative to the detection limit of optical particle counters (OPCs) (Hao et al. 2021). The calculated result of activation efficiency as a function of particle sizes is shown on Fig. 11.
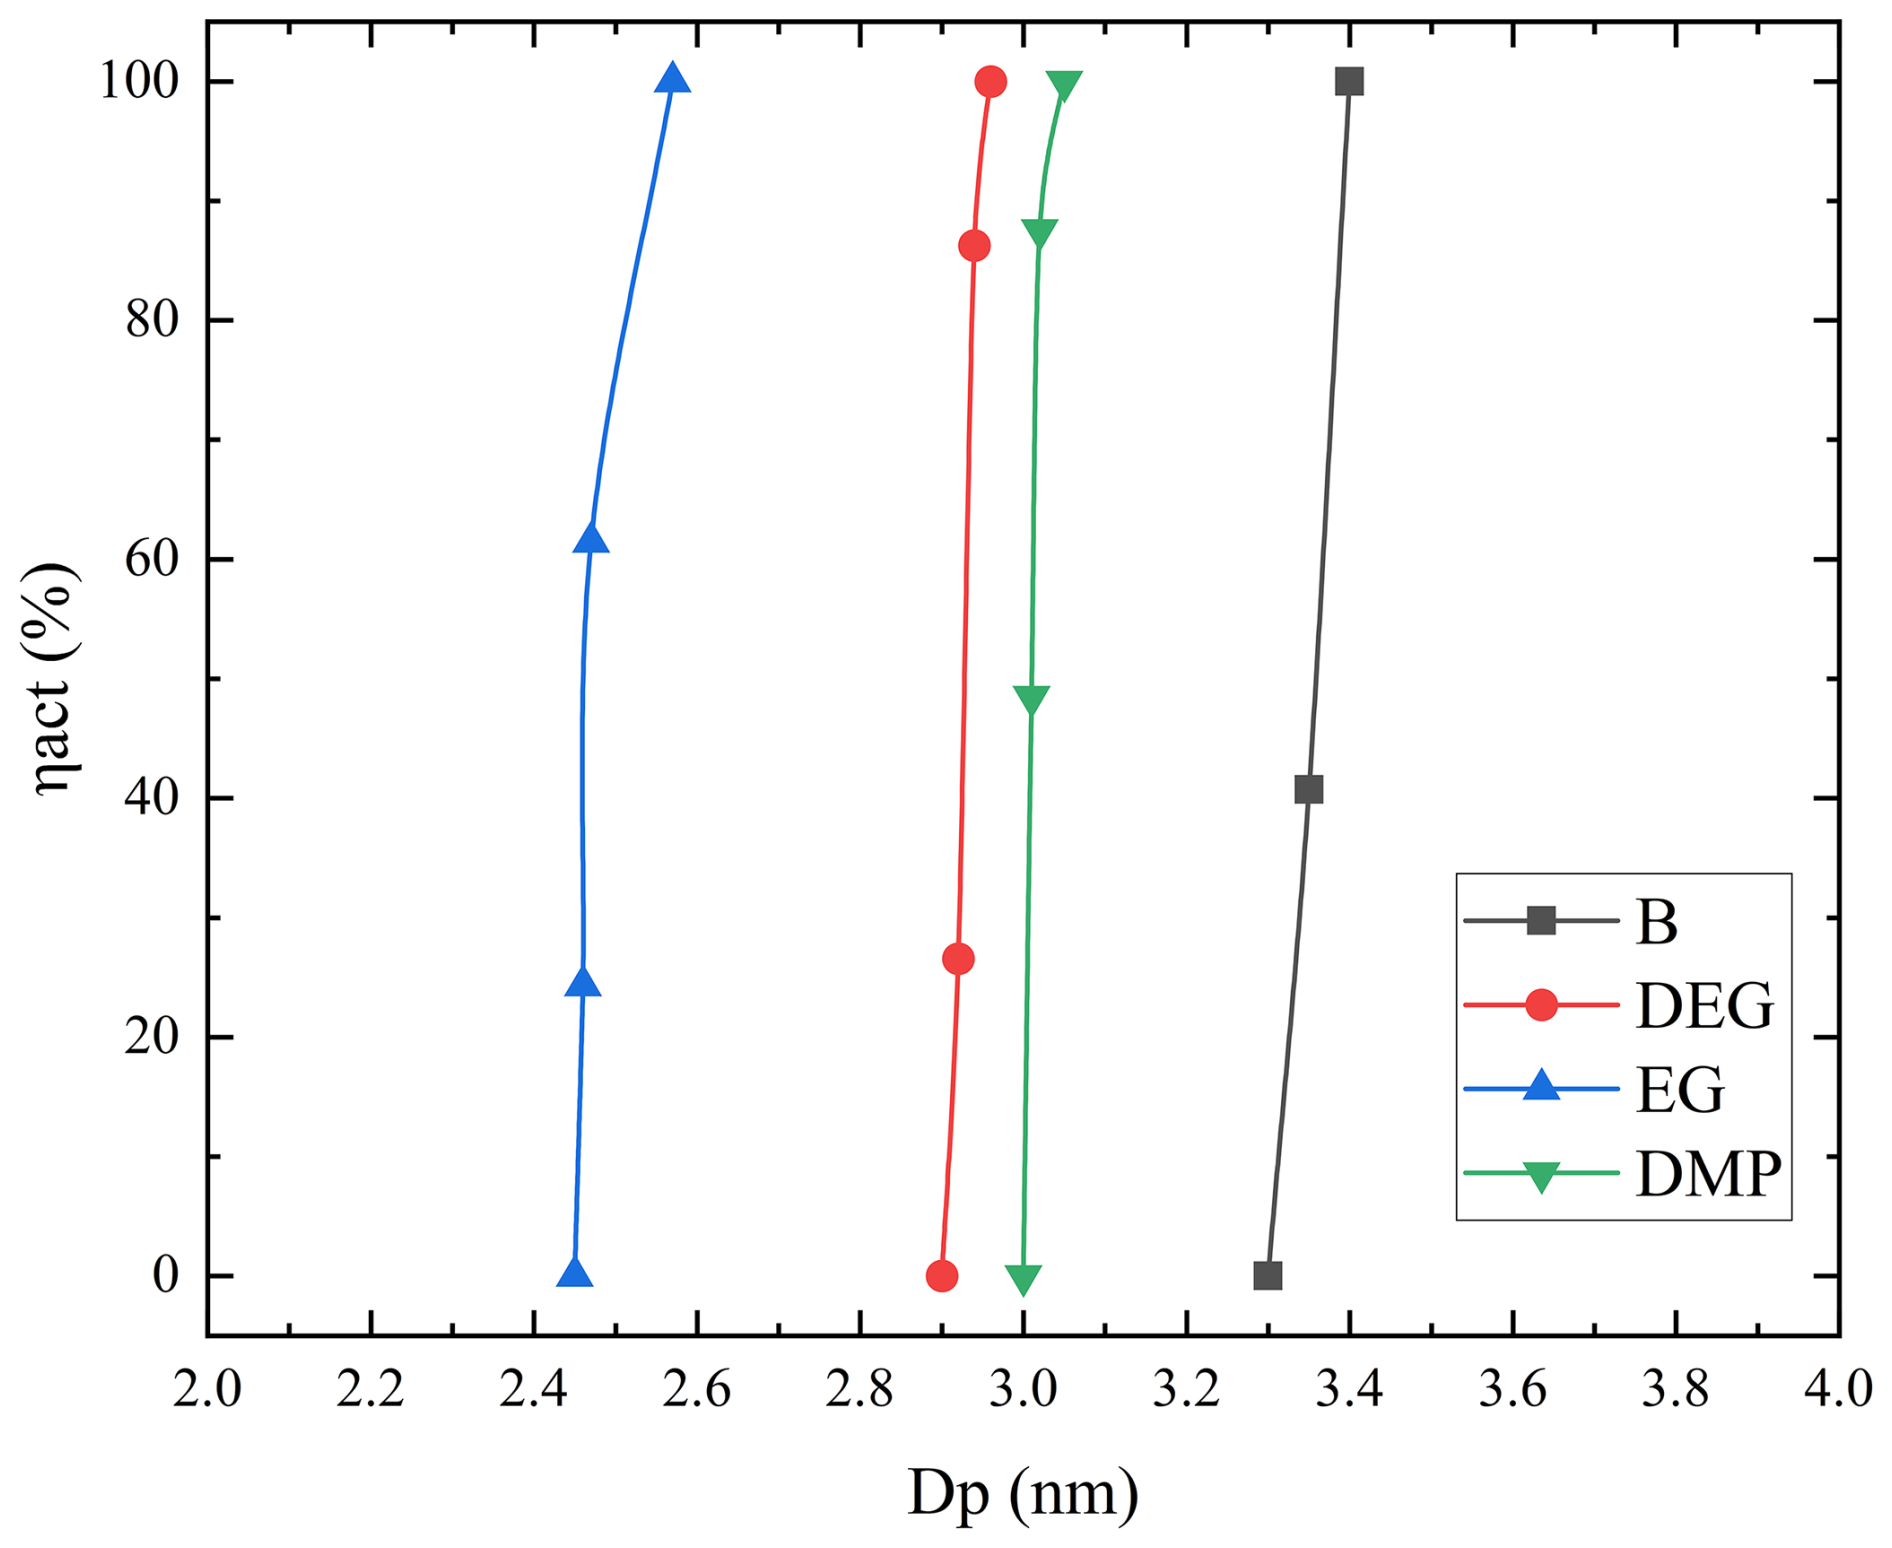
Under the selected flow and temperature settings (Qg = 0.3 L min−1, f = 0.95, Tc = 5 °C and Ts= 40 °C), activation efficiency–diameter curves for four working fluids exhibit pronounced difference in their critical activation diameters (Fig. 11). EG exhibited the smallest critical diameter (–2.6 nm), followed by DEG and DMP (–3.0 nm), while B showed the largest diameter (–3.4 nm). The steep transition near Dp,50 in the cases with EG/DEG/DMP indicates sharp discrimination between non-activated and fully activated particles. Mechanistically, the minimal activation diameter is jointly determined by the curvature of the working fluid, governed by its surface tension and molecular volume, and the maximal supersaturation ratio sustained in the sMCPC. Working fluids capable of producing high and stable supersaturation level can effectively reduce the Kelvin diameter. Compared with B, both EG and DEG exhibited lower saturated vapor pressures and greater temperature sensitivity, making it easier to establish a stable and high supersaturation in the growth tube, thereby resulting in smaller critical activation diameters. However, the “activation” of particle growth does not always lead to the growth of particle size to an optically detectable size.
As shown on Fig. 12, the particle growth through the growth tube (exposure to high supersaturation environment) differed dramatically among four selected working fluids. The final particle sizes exiting the growth tube was in micrometers in the case with n-butanol (B); ∼ 700 nm in the case with EG; 200–300 nm in the case with DEG. The final size was the smallest in the case of DMP. Therefore, in the sMCPC with limited growth tube length, both DMP and DEG would not be good candidates for working fluids due to insufficient droplet size growth. In contrast, the final particle sizes in cases with both EG and B are more likely to exceed the OPC detection limit although the activation diameter in the case with B is higher (compared with those in the other cases).
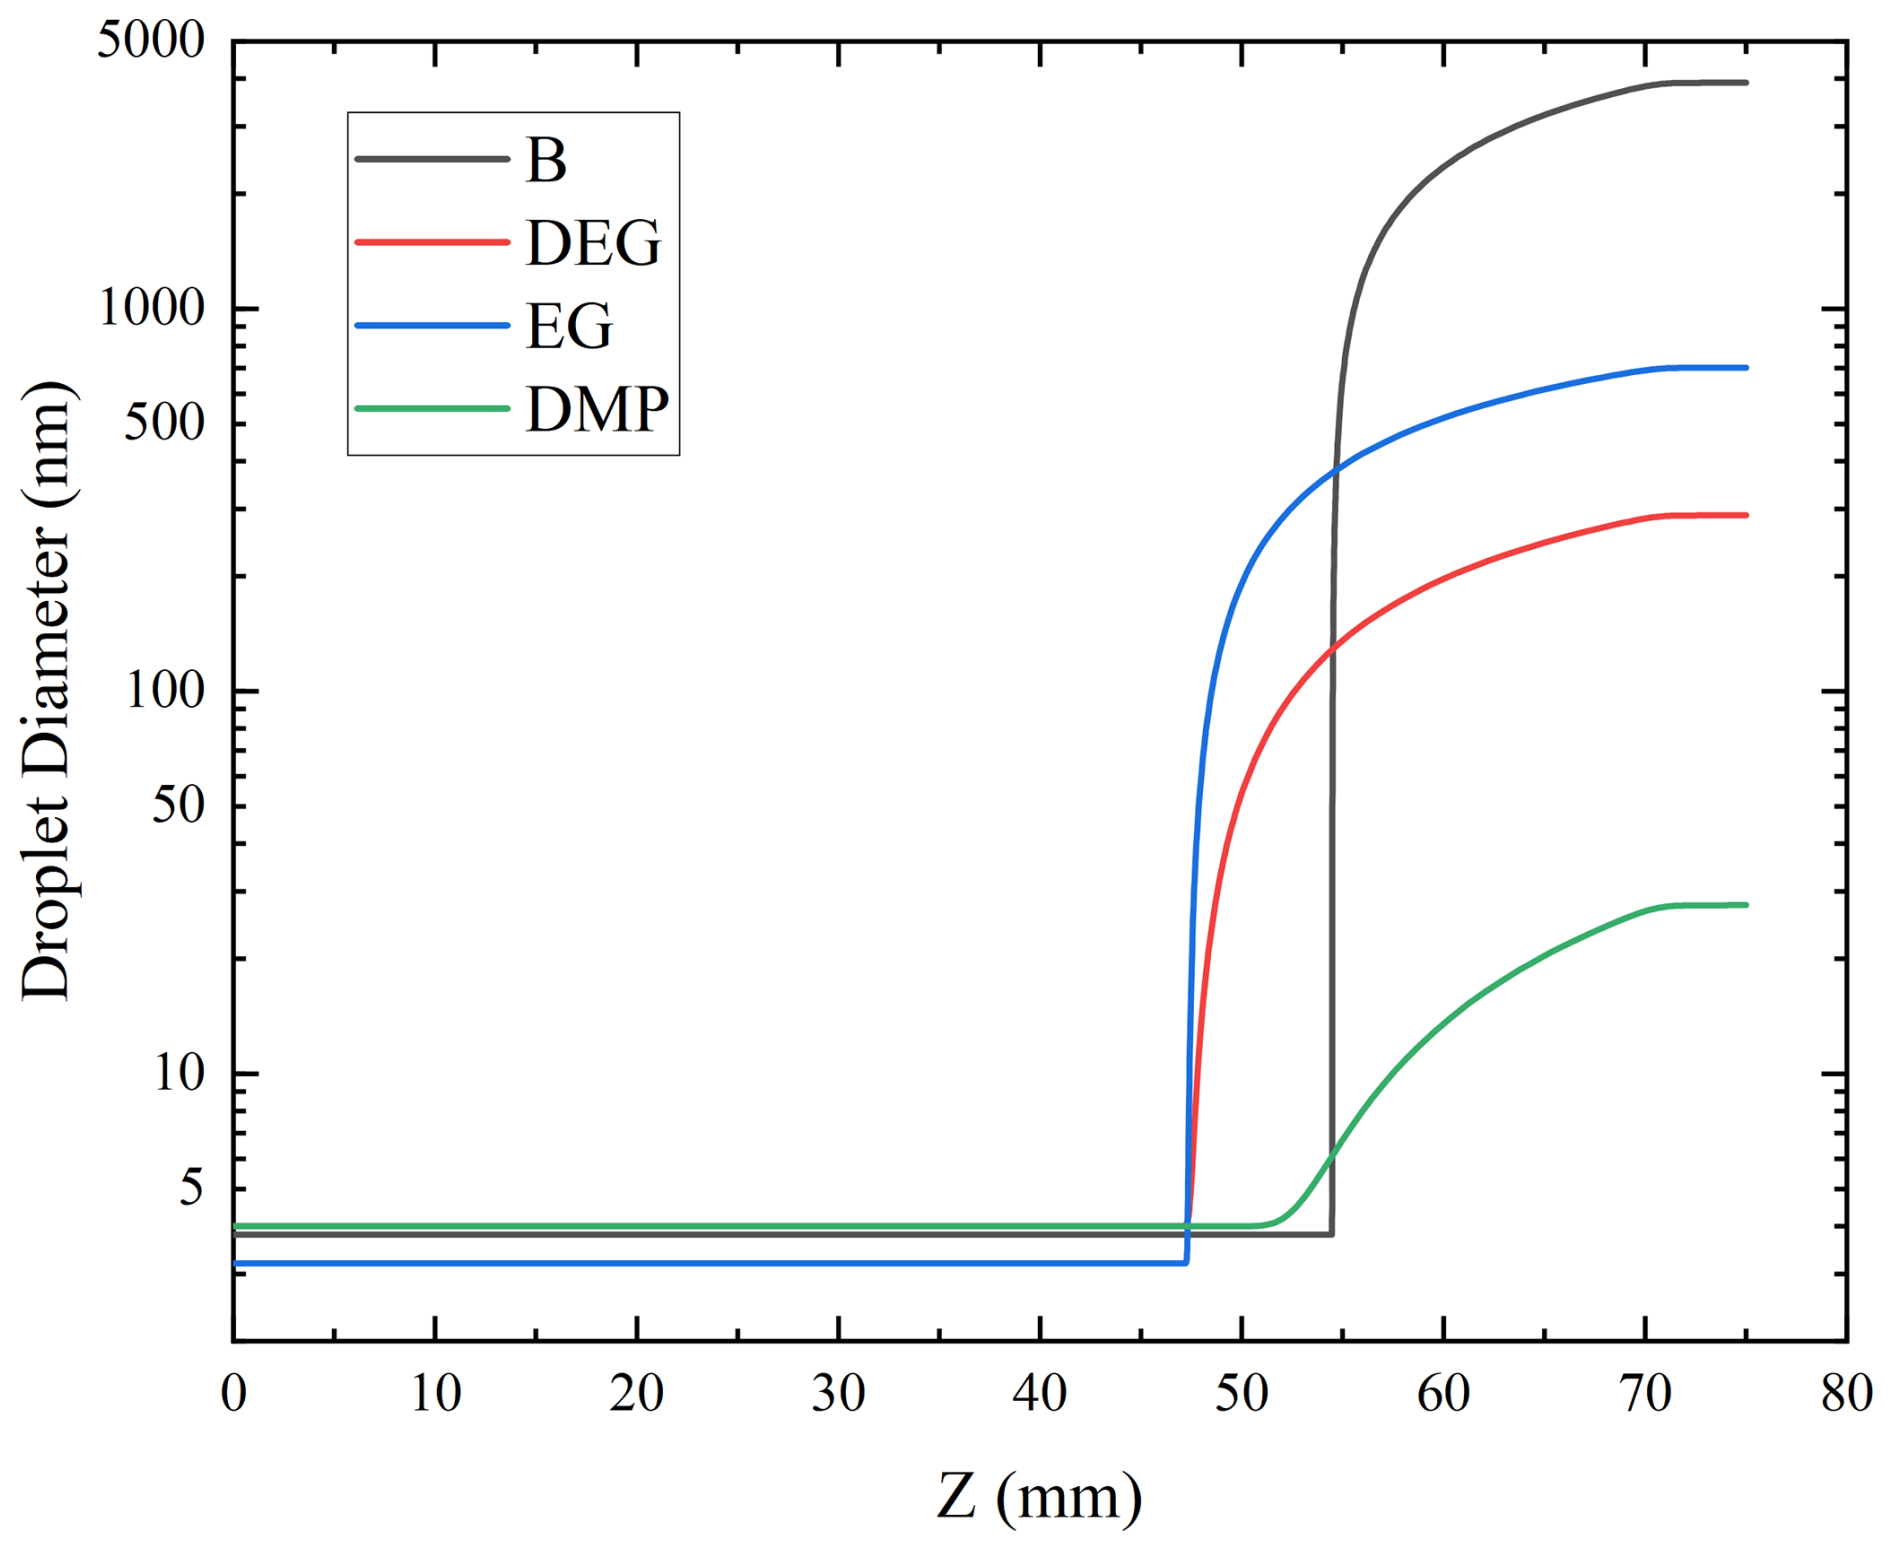
Figure 12Growth of the particle size as a function of distance along the axis of sMCPC when using the four selected working fluids (B, DEG, EG and DMP).
3.4 Comparison of ηact between the sMCPC and laminar flow CPC
As shown in Fig. 13, the activation efficiency curves of the sMCPC were compared with the laminar flow CPC data, reported by Hao et al. (2021) (as a function of ). The sMCPC activation curves exhibited steeper change in the vicinity of than the laminar-flow CPC curves, indicating that the activation of particle growth in laminar flow CPCs occurred over a wider size range compared to that of sMCPC and demonstrating the difference in the transition characteristics from non-activated particles to fully activated particles between the two types of CPCs. By comparison with laminar flow CPCs, the sMCPC showed a narrower activation transition region and a sharper activation cutoff. This modeling result indicates that the sMCPC can provide a more efficient activation environment near the critical activation diameter than a laminar flow CPC, which offers a higher size resolution.
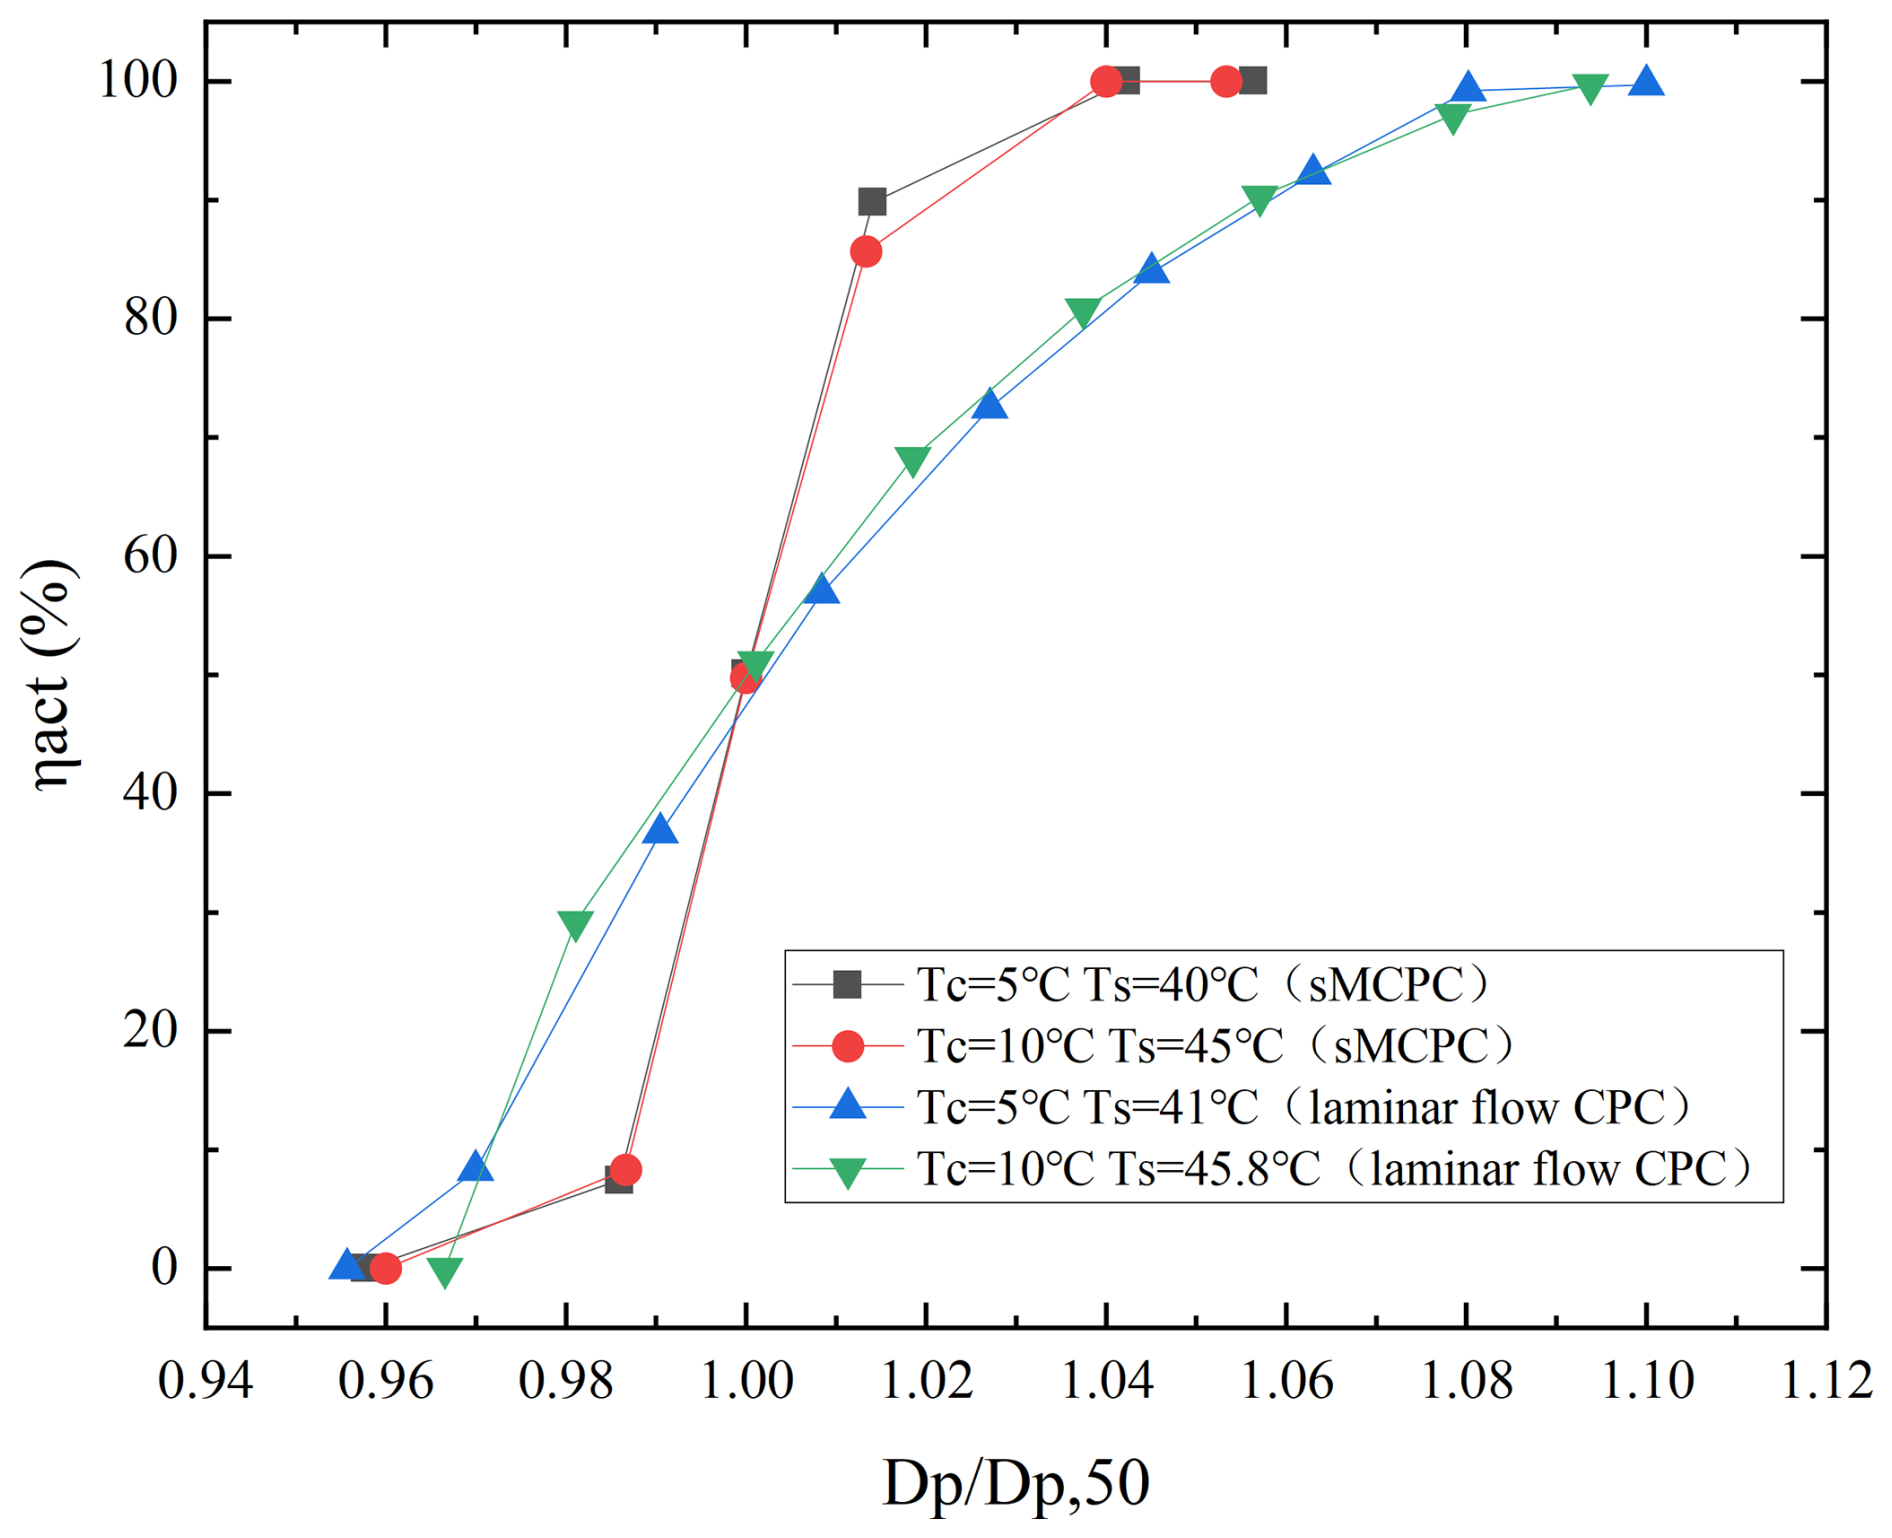
Figure 13Comparison of the caluclated activation efficiency curves of the sMCPC and laminar flow CPC.
An axisymmetric model was developed on the COMSOL platform to investigate the performance of a MCPC (mixing -type CPC) through the calculation of flow, temperature, and working fluid vapor concentration fields in the device. With the calculated fields, MATLAB was applied to obtain the activation efficiency and condensational growth of individual particles in the MCPC, in which the effects of Kelvin, non-continuum heat-transfer and mass-transfer, and latent-heat release were considered in the calculation of particle trajectories. Once validated by experimental data, the developed model enables us to numerically study the performance of a MCPC in general. In this study, we applied the developed model to study the performance of a specific sMCPC.
Two core performance metrics, i.e., Dp,50 (the activation size of particles for condensational growth) and the final size after the condensational growth as the functions of the temperature difference between the temperatures of cooling/growth tube and saturation vapor temperature, ΔT, total flowrate (Qg), and the vapor carrier flow fraction (f), and working fluids were systematically evaluated. The result is summarized in the following:
- i.
Temperature setting. Moderate increase of ΔT with a low Tc enhances the supersaturation ratio in the sMCPC, resulting in the reduction of Dp,50. Under the condition of Tc = 5 °C and Ts = 40 °C, both the peak supersaturation along the sMCPC axis and activation efficiency of the sMCPC are superior to those at the condition of Tc = 5 °C and Ts = 35 °C, resulting in the decrease of Dp,50 from 4.25 to 3.55 nm.
- ii.
Total Flowrate setting. Dp,50 remains unchanged as Qg varied from 0.1 to 0.3 L min−1 but obviously increases when Qg increased to 0.4 L min−1 (> 3.60 nm). Moreover, the location of the maximal supersaturation shifts downstream (toward the outlet), indicating that excessively high flowrate weakens the activation and reduces the effective particle growth path.
- iii.
Vapor-carrier flow fraction setting. The increase of f strengthens supersaturation and steepens the activation curve of the sMCPC. When f increased from 0.80 to 0.95 at Qg = 0.3 L min−1, Dp,50 decreased from 4.2 to 3.4 nm, resulting in the reduction of lower detection limit.
- iv.
Working-fluid selection. sMCPC with working fluids of EG, DEG, and DMP exhibited lower activation thresholds than that with B (with the smallest Dp,50 = 2.5–2.6 nm for EG). However, the small activation particle size of the sMCPC did not always guarantee the final particle size for optical detection. It is found that sMCPC with B as working fluid has the fastest droplet growth rate (with the final size in micrometers). sMCPC with EG grew the size of particles to ∼ 700 nm. The final size in the cases with DEG/DMP failed to reach the OPC detection threshold (∼ 0.3 µm), leading to the loss of particle detection efficiency because of the activated-but-undetected” events.
The above findings provide general guidance to specify the temperature settings and selection of, , and working fluids in the sMCPC design to achieve satisfactory performance for the detection of particle numbers in ambient aerosol monitoring.
| c | Molecular concentration of the water vapor [mol m−3] |
| cp | Heat capacity of the vapor [J K−1 kg−1] |
| cp,g | Heat capacity of air [J K−1 kg−1] |
| cs | Vapor concentration equal to saturation [J K−1 kg−1] |
| cg | Fixed vapor concentration on surface [J K−1 kg−1] |
| D | Molecular diffusion coefficient [m2 s−1] |
| DB | Brownian diffusion coefficient of the particle[m2 s−1] |
| Dk | The Kelvin diameter [m] |
| Dp,50 | Size of particle that has a 50 % activation efficiency [m] |
| Dp,kel | Size of particle that can be activated according to the Kelvin equation [m] |
| Dv | Diffusivity of the vapor [m2 s−1] |
| Dp | Particle size [m] |
| Deff | Effective diffusivity [m2 s−1] |
| f | Vapor fraction [1] |
| F | Generic body-force density [N m−3] |
| F1 | The blending function between k–ω and k–ε models near the wall |
| g | Gravitational acceleration [m s−2] |
| Hvap | Heat of vaporization of vapor [J kg−1] |
| I | Nucleation rate [m3 s−1] |
| Kn | Knudsen number [1] |
| k | Turbulent kinetic energy [m2 s−2] |
| kg | Thermal conductivity of air [W m−1 K−1] |
| kb | Boltzmann constant, 1.38 × 10⁻²³ [J K−1] |
| keff | Effective thermal conductivity including molecular and turbulent parts [W m−1 K−1] |
| kt | Molecular thermal conductivity [W m−1 K−1] |
| N | Concentration of the particles [particles m−3] |
| N0 | Concentration of particles at the inlet of the conditioner [particles m−3] |
| L | Characteristic particle transport length [m] |
| m | Molecular mass of working fluid [kg] |
| mg | Molecular weight of air [kg mol−1] |
| n | Molecular concentration of the vapor [molec. m−3] |
| p | the partial pressure of the condensing vapor [Pa] |
| pd | the equilibrium vapor pressure at the droplet surface [Pa] |
| ps | Saturation vapor pressure of the vapor [Pa] |
| Pk | Production of Turbulent kinetic energy [Pa s−1] |
| pd | Equilibrium condensing vapor pressure at the surface of the droplet [Pa] |
| Qg | The total flow rate through the sMCPC [L min−1] |
| Qa | The aerosol flow rate [L min−1] |
| Qh | The vapor flow rate [L min−1] |
| Qvd | Volumetric heat source/sink [W m−3] |
| qturb | Turbulent dissipation term [W m−3] |
| r | Radial coordinate in the sMCPC [m] |
| Ract | Maximum radius of the contour corresponding to Dp,kel = Dp [m] |
| Sr | Saturation ratio [1] |
| S | Mean strain-rate magnitude [s−1] |
| Tc | The temperature setting for sampled aerosol cooling [K] |
| Ts | The temperature setting for working fluid saturation [K] |
| Td | Droplet surface temperature [K] |
| T | Flow temperature in the sMCPC [K] |
| ΔT | Temperature difference between working fluid saturation and sampled aerosol cooling [K] |
| u | Mean velocity vector [m s−1] |
| Udiff | Characteristic diffusion velocity of the particle [m s−1] |
| U | Characteristic axial advective velocity of the carrier gas [m s−1] |
| vm | Molecular volume of the condensable vapor [m3] |
| w | Velocity along the axial direction in the CPC [m s−1] |
| σ | Surface tension of the vapor [N m−1] |
| σk | Diffusion-related model constant in the k equation [1] |
| σω | Diffusion-related model constant in the ω equation [1] |
| ηact | Activation efficiency [1] |
| χ | Correction factor for non-continuum effects in particle condensational growth [1] |
| χh | Correction factor for non-continuum effects in particle heat transfer [1] |
| αT | Thermal accommodation coefficient of air [1] |
| ρv | Density of vapor [kg m−3] |
| ρg | Density of air [kg m−3] |
| λ | Mean free path [m] |
| ρ | The fluid density [kg m−3] |
| μ | Molecular dynamic viscosity [Pa s] |
| μt | Turbulent viscosity from the SST model [Pa s] |
| ω | Specific dissipation rate [s−1] |
| σk, σω, β∗, γ, and β0 | Empirical model constants |
| Prt | Turbulent Prandtl number [1] |
| Sct | Turbulent Schmidt number [1] |
| τ | Viscous stress tensor [Pa] |
| β∗ | Dissipation-related model constant in the k equation [1] |
| β0 | Dissipation-related model constant in the ω equation [1] |
| γ | Production-related model constant in the ω equation [1] |
The sMCPC data in the study are available upon request to Huanqin Wang (hqwang@iim.ac.cn).
JZ, GH, and DC designed the research. JZ led the simulation and data analyses. JZ led the writing, with significant input from DC, XL and FY as well as further input from all other authors. HW, XW, and HG provided suggestions on the revision.
The contact author has declared that none of the authors has any competing interests.
Publisher's note: Copernicus Publications remains neutral with regard to jurisdictional claims made in the text, published maps, institutional affiliations, or any other geographical representation in this paper. The authors bear the ultimate responsibility for providing appropriate place names. Views expressed in the text are those of the authors and do not necessarily reflect the views of the publisher.
This research has been supported by the Prevention and Control of Emerging and Major Infectious Diseases – National Science and Technology Major Project (grant no. 2025ZD01902301), the National Key Research and Development Program of China (grant nos. 2025ZD1201200 and 2023YFC3705400), Anhui Provincial Ecological Environment Science and Technology Project (grant no. 2025hb004).
This paper was edited by Joachim Curtius and reviewed by Michel Attoui and two anonymous referees.
Balendra, S., Kale, A., Pongetti, J., Kazemimanesh, M., Haugen, M., Weller, L., and Boies, A.: Condensation particle counters: Exploring the limits of miniaturisation, J. Aerosol Sci., 175, 106266, https://doi.org/10.1016/j.jaerosci.2023.106266, 2023.
Barmpounis, K., Ranjithkumar, A., Schmidt-Ott, A., Attoui, M., and Biskos, G.: Enhancing the detection efficiency of condensation particle counters for sub-2 nm particles, J. Aerosol Sci., 117, 44–53, https://doi.org/10.1016/j.jaerosci.2017.12.005, 2017.
Bates, T. S., Quinn, P. K., Johnson, J. E., Corless, A., Brechtel, F. J., Stalin, S. E., Meinig, C., and Burkhart, J. F.: Measurements of atmospheric aerosol vertical distributions above Svalbard, Norway, using unmanned aerial systems (UAS), Atmos. Meas. Tech., 6, 2115–2120, https://doi.org/10.5194/amt-6-2115-2013, 2013.
Butt, H.-J., Graf, K., and Kappl, M. Physics and chemistry of interfaces, John Wiley & Sons, https://doi.org/10.1002/3527602313, 2003.
Fisenko, S. P., Wang, W., Lenggoro, I. W., and Okuyama, K.: Vapor condensation on nanoparticles in the mixer of a particle size magnifier, Int. J. Heat Mass Tran., 50, 587–594, https://doi.org/10.1016/j.ijheatmasstransfer.2006.10.046, 2007.
Friedlander, S. K.: Smoke, dust, and haze, Oxford University Press, New York, https://doi.org/10.5860/choice.38-2208, 2000.
Fuchs, N. A.: The Mechanics of Aerosols, Pergamon Press, https://doi.org/10.1063/1.3047354, 1964.
Hao, W., Stolzenburg, M., Attoui, M., Zhang, J., and Wang, Y.: Optimizing the activation efficiency of sub-3 nm particles in a laminar flow condensation particle counter: Model simulation, J. Aerosol Sci., 158, 105841, https://doi.org/10.1016/j.jaerosci.2021.105841, 2021.
Hao, W., Mei, F., Hering, S., Spielman, S., Schmid, B., Tomlinson, J., and Wang, Y.: Mapping the performance of a versatile water-based condensation particle counter (vWCPC) with numerical simulation and experimental study, Atmos. Meas. Tech., 16, 3973–3986, https://doi.org/10.5194/amt-16-3973-2023, 2023.
Heathman, A. M. D. and Ensor, D.: Monitoring of nanoscale particles in cleanrooms: ISO 14644-12, J. IEST, 62, 50–59, https://doi.org/10.17764/1557-2196-62.1.50, 2019.
Hegg, D. A. and Larson, T. V.: The effects of microphysical parameterization on model predictions of sulfate production in clouds, Tellus B, 42, 272–284, https://doi.org/10.3402/tellusb.v42i3.15220, 1990.
Hering, S. V., Stolzenburg, M. R., Quant, F. R., Oberreit, D. R., and Keady, P. B.: A Laminar-Flow, Water-Based condensation particle Counter (WCPC), Aerosol Sci. Technol., 39, 659–672, https://doi.org/10.1080/02786820500182123, 2005.
Iida, K., Stolzenburg, M. R., and McMurry, P. H.: Effect of working fluid on sub-2 nm particle detection with a laminar flow ultrafine condensation particle counter, Aerosol Sci. Technol., 43, 81–96, https://doi.org/10.1080/02786820802488194, 2009.
Kangasluoma, J., Ahonen, L., Attoui, M., Vuollekoski, H., Kulmala, M., and Petäjä, T.: Sub-3 nm Particle Detection with Commercial TSI 3772 and Airmodus A20 Fine Condensation Particle Counters, Aerosol Sci. Technol., 49, 674–681, https://doi.org/10.1080/02786826.2015.1058481, 2015.
Kousaka, Y., Niida, T., Okuyama, K., and Tanaka, H.: Development of a mixing type condensation nucleus counter, J. Aerosol Sci., 13, 231–240, https://doi.org/10.1016/0021-8502(82)90064-7, 1982.
Kuang, C., Chen, M., McMurry, P. H., and Wang, J.: Modification of laminar flow ultrafine condensation particle counters for the enhanced detection of 1 nm condensation nuclei, Aerosol Sci. Technol., 46, 309–315, https://doi.org/10.1080/02786826.2011.626815, 2012.
Li, Y. R., Wu, J., Wu, H., Liu, X. M., Zhou, Q., Lu, Y. Q., Wu, Y. H., Liu, M. Y., Ou, H. J., Mai, S. X., He, X. H., Song, H. Y., Wang, H. Q., Zeng, P., Wang, Y. M., Wang, D. B., Zhang, Q., Deng, J. G., Shi, J. W., Li, X. X., Zhao, J., Zhang, F., Huang, C., Zheng, M., Hao, J., and Jiang, J. K: A bipolar SMPS network for measuring atmospheric aerosols using natural air ions, Atmos. Environ., 325, 120462, https://doi.org/10.1016/j.atmosenv.2024.120462, 2024a.
Li, Y., Chen, X., Wu, J., Zhang, Q., Zhang, Z., Hao, J., and Jiang, J.: A convertible condensation particle counter using alcohol or water as the working fluid, Aerosol Sci. Technol., 59, 185–194, https://doi.org/10.1080/02786826.2024.2395939, 2024b.
Mavliev, R.: Turbulent mixing condensation nucleus counter, Atmos. Res., 62, 303–314, https://doi.org/10.1016/S0169-8095(02)00016-9, 2002.
Mei, F., Spielman, S., Hering, S., Wang, J., Pekour, M. S., Lewis, G., Schmid, B., Tomlinson, J., and Havlicek, M.: Simulation-aided characterization of a versatile water-based condensation particle counter for atmospheric airborne research, Atmos. Meas. Tech., 14, 7329–7340, https://doi.org/10.5194/amt-14-7329-2021, 2021.
Menter, F. R.: Zonal two equation k–w turbulence models for aerodynamic flows, AIAA Pap., https://doi.org/10.2514/6.1993-2906, 1993.
Menter, F. R., Kuntz, M., and Langtry, R.: Ten years of industrial experience with the SST turbulence model, in: Turbulence, Heat and Mass Transfer, edited by: Hanjalic, K., Nagano, Y., and Tummers, M., Begell House Inc., Danbury, CT, USA, vol. 4, 625–632, ISBN 978-1-56700-196-9, 2003.
Pradhan, B., Jayaratne, R., Thompson, H., Buonanno, G., Mazaheri, M., Nyarku, M., Lin, W., Pereira, M. L., Cyrys, J., Peters, A., and Morawska, L.: Utility of outdoor central site monitoring in assessing exposure of school children to ultrafine particles, Sci. Total Environ., 859, 160162, https://doi.org/10.1016/j.scitotenv.2022.160162, 2022.
Seinfeld, J. H. and Pandis, S. N.: Atmospheric chemistry and physics: From air pollution to climate change, John Wiley & Sons, ISBN 978-1-118-94740-1, 2016.
Sgro, L. A. and De La Mora, J. F.: A Simple Turbulent Mixing CNC for Charged Particle Detection Down to 1.2 nm, Aerosol Sci. Technol., 38, 1–11, https://doi.org/10.1080/02786820490247560, 2003.
Takegawa, N., Nagasaki, A., Fushimi, A., Fujitani, Y., Murashima, Y., and Sakurai, H.: Volatility of aircraft exhaust ultrafine particles inferred from field measurements at Narita International Airport, Atmos. Environ., 292, 119391, https://doi.org/10.1016/j.atmosenv.2022.119391, 2022.
Thomas, J. M., Chen, X., Maißer, A., and Hogan, C. J.: Differential heat and mass transfer rate influences on the activation efficiency of laminar flow condensation particle counters, Int. J. Heat Mass Tran., 127, 740–750, https://doi.org/10.1016/j.ijheatmasstransfer.2018.07.002, 2018.
Vanhanen, J., Mikkilä, J., Lehtipalo, K., Sipilä, M., Manninen, H. E., Siivola, E., Petäjä, T., and Kulmala, M.: Particle size magnifier for Nano-CN detection, Aerosol Sci. Technol., 45, 533–542, https://doi.org/10.1080/02786826.2010.547889, 2011.
Wang, H., Zhou, J., Pang, A., Lei, X., Huang, C., and Chen, D.: A small-scale mixing-type condensation particle counter and its working method, China Patent CN 119827382 B, 3 October, Hefei Institutes of Physical Science, Chinese Academy of Sciences, Application No.: ZL 2025 1 0077265.X, 2025.
Wang, J., McNeill, V. F., Collins, D. R., and Flagan, R. C.: Fast mixing condensation nucleus counter: application to rapid scanning differential mobility analyzer measurements, Aerosol Sci. Technol., 36, 678–689, https://doi.org/10.1080/02786820290038366, 2002.
Wlasits, P. J., Stolzenburg, D., Tauber, C., Brilke, S., Schmitt, S. H., Winkler, P. M., and Wimmer, D.: Counting on chemistry: laboratory evaluation of seed-material-dependent detection efficiencies of ultrafine condensation particle counters, Atmos. Meas. Tech., 13, 3787–3798, https://doi.org/10.5194/amt-13-3787-2020, 2020.
Wlasits, P. J., Enroth, J., Vanhanen, J., Pajunoja, A., Grothe, H., Winkler, P. M., and Stolzenburg, D.: Reduced particle composition dependence in condensation particle counters, Aerosol Research, 2, 199–206, https://doi.org/10.5194/ar-2-199-2024, 2024.