
the Creative Commons Attribution 4.0 License.
the Creative Commons Attribution 4.0 License.
 | 18 Sep 2026
Role of low-level jet evolution in vertical aerosol redistribution: a Doppler wind lidar study over East China
Tianle Bai
Yuanyi Lin
Mengya Wang

Tianwen Wei
Fangzhi Wei
Kuancheng Lv
Haiyun Xia
Low-level jets (LLJs) play an important role in aerosol transport and boundary-layer processes. This study utilizes coherent Doppler wind lidar observations to investigate the relationship between LLJ evolution and vertical aerosol redistribution during two dust episodes over Hefei, East China. Results show that changes in LLJ core height are associated with distinct aerosol distribution patterns during the two dust events. In the April 2021 event, the northwesterly jet core exhibits a dynamic vertical migration, descending from 2.5 to 0.3 km before reascending to 1.0 km during the surface PM10 peak (410 µg m−3). The descending jet is accompanied by enhanced vertical wind shear (>0.04 s−1) near the lower jet interface and increased spectral width, together with a downward shift in the enhanced backscatter region. These changes coincide with the rapid increase in surface PM10 concentration, suggesting that enhanced dynamical variability and mixing conditions may have contributed to the downward redistribution of dust. Conversely, the March 2022 event is characterized by a relatively stable LLJ core and persistent lower tropospheric stability, which is associated with the persistence of aerosols within an elevated layer. Persistent wind shear and enhanced spectral width below the LLJ core coincided with the enhanced backscatter region. The PM10 peak occurred at 16:00 LT (UTC+8 h) on 14 March 2022, approximately 8 h after the inferred onset of frontal influence, coinciding with weakening lower tropospheric stability and changes in the backscatter structure above the site. Wind hodographs show a clockwise rotation of wind vectors that is qualitatively consistent with a possible contribution from inertial oscillation during LLJ evolution. Overall, the observations suggest two contrasting aerosol redistribution processes associated with LLJ evolution: rapid downward redistribution during jet descent and delayed surface influence when aerosols remain elevated under stable conditions. The results provide an observational basis for refining boundary-layer parameterizations in numerical weather prediction and air quality models.
- Article
(14100 KB) - Full-text XML
- BibTeX
- EndNote


Aerosols play an important role in the Earth's radiation budget and climate system through their scattering and absorption of solar radiation (Kok et al., 2023; Li et al., 2016, 2019). Beyond radiative effects, interactions between aerosols and boundary-layer processes critically influence air quality and public health (Li et al., 2017; Pöschl, 2005), particularly during pollution episodes when downward transport and vertical confinement enhance surface concentrations (Guo et al., 2016; Tian et al., 2017). In East China, a region frequently affected by transboundary aerosol transport (Huang et al., 2020b; Qin et al., 2016), stratified aerosol structures are shaped by the combined influence of large-scale synoptic circulation and boundary-layer dynamical processes (Chen et al., 2018; Zheng et al., 2015). However, direct observational evidence on the high-frequency response of aerosol layering to the rapid structural evolution of wind fields remains limited.
Among these processes, low-level jets (LLJs) are localized wind maxima in the lower troposphere that play an important role in regional-scale pollutant transport and boundary-layer regulation (Sullivan et al., 2017; Wei et al., 2023; Wu et al., 2020; Zhang et al., 2001). LLJs also influence regional climate through their control on the horizontal and vertical redistribution of heat and moisture and their role in modulating deep convective activity (Stensrud, 1996). In addition to horizontal advection, the persistent vertical wind shear associated with LLJs can create favorable conditions for turbulent mixing, thereby influencing the vertical structure of the lower atmosphere (Gutierrez et al., 2017; Yang et al., 2023). However, these effects are not a simple linear response to wind speed or shear magnitude but depend on the continuous evolution of the jet's vertical position and intensity as well as concurrent changes in atmospheric stability (Banta et al., 2002; Mahrt, 1998). Consequently, the life cycle of jet structures is closely associated with variations in aerosol vertical distribution, highlighting the need to examine the concurrent evolution of wind profiles and aerosol stratification.
Within this framework, LLJ evolution may be associated with different aerosol redistribution processes under varying atmospheric conditions. One process involves enhanced wind shear and increased Doppler spectral variability during changes in LLJ structure, which may contribute to the downward mixing of elevated aerosol layers (Heinold et al., 2013, 2015). Another process involves changes in aerosol layer confinement associated with variations in jet core height and boundary layer stability (Su et al., 2020; Wang et al., 2019). Despite this conceptual understanding, how LLJ evolution is associated with changes in aerosol distribution under rapidly evolving atmospheric conditions remains poorly constrained. In particular, the timing and vertical relationship between jet evolution, turbulence variations, and aerosol structure changes in the lower troposphere are not yet well resolved, limiting the interpretation of aerosol vertical redistribution processes and their implications for pollution near the surface.
To investigate the dynamical and structural pathways associated with LLJ-related aerosol redistribution, observational tools capable of resolving the evolution of both the wind field and aerosol layering at high temporal and vertical resolution are essential. Coherent Doppler wind lidar (CDWL) provides this capability by simultaneously measuring wind profiles, vertical wind shear, turbulence related parameters, and aerosol backscatter with fine spatiotemporal resolution (Banakh et al., 2017; Frehlich, 1994; Shangguan et al., 2023, 2024; Wang et al., 2024; Wei et al., 2025b). These measurements allow for the assessment of the temporal relationship between LLJ evolution, including changes in jet core height and intensity, and aerosol vertical distribution (Andújar-Maqueda et al., 2026; Beu and Landulfo, 2022; Huang et al., 2020a; Shangguan et al., 2022; Wei et al., 2025a). Previous lidar-based studies have primarily documented the vertical structure and temporal variability of LLJs or identified elevated aerosol layers associated with synoptic-scale transport during specific events (Andújar-Maqueda et al., 2026; Dieudonné et al., 2023; Huang et al., 2021b, a; Iwai et al., 2011; Tuononen et al., 2017; Yang et al., 2019). However, how aerosol vertical structure changes during the rapid evolution of LLJ dynamics at the event scale remains insufficiently explored.
In this study, we investigate the role of LLJ evolution in vertical aerosol redistribution using coherent Doppler wind lidar observations over Hefei, East China. Two dust transport events with different LLJ evolution characteristics are analyzed: an April 2021 episode featuring pronounced vertical migration of the jet core, and a March 2022 episode characterized by a relatively stable jet core and a stratified aerosol structure. By integrating synoptic analyses, high-resolution lidar measurements, and surface air quality observations, this study aims to characterize the simultaneous evolution of LLJ structures and aerosol stratification and examine how these observed changes are associated with variations in pollution near the surface.
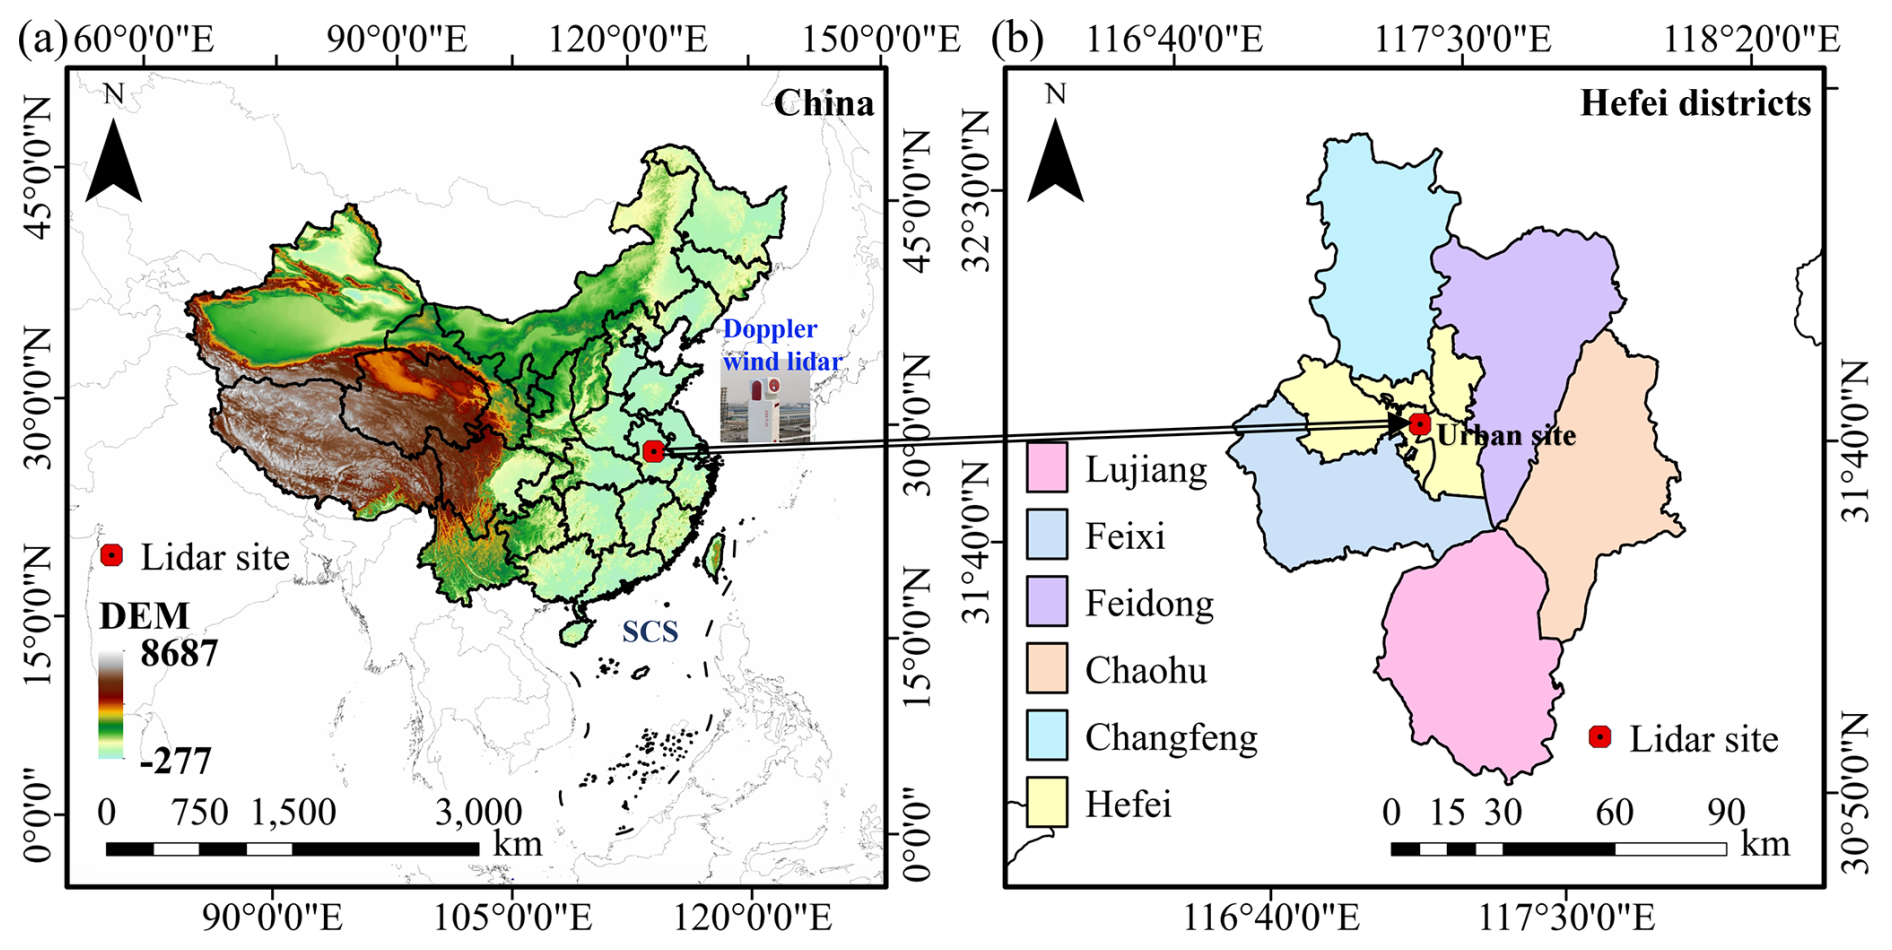
Figure 1Overview of the study area and observational site: (a) Topographic map of China indicating the location of the coherent Doppler wind lidar (CDWL) station in Hefei; (b) administrative map of Hefei districts, with the red dot marking the specific urban site where the CDWL measurements are conducted. The color-coded areas in (b) represent the distinct administrative subdivisions of Hefei.
2.1 Study area and instrument
Hefei (Fig. 1a) is situated on the Jiang-Huai Plain in East China, occupying a transitional location between the Yangtze and Huaihe River basins. The topography is characterized by flat and low-lying terrain, with elevations ranging from 15 to 80 m (Zhao and Zou, 2018). The region is governed by a humid subtropical monsoon climate, which serves as a climatic transition zone between northern and southern China. This positioning results in distinct seasonal variations, with an annual precipitation of approximately 1000 mm concentrated during the summer months (Wang et al., 2023b).
Given its location downwind of major East Asian dust sources, Hefei is frequently affected by the long-range transport of mineral dust from the Gobi and Taklamakan Deserts, particularly during the spring transition (Zhou et al., 2002). The low surface roughness of the expansive plain is associated with the frequent development of LLJs, which is a prominent feature of the nocturnal boundary layer in this region. Furthermore, the rapid expansion of the Hefei metropolitan area has intensified the local anthropogenic emissions, primarily from transportation and industrial activities (Zhou et al., 2021). During dust events, the interaction between these local pollutants and descending dust layers leads to complex aerosol stratification (Wang et al., 2023a). Consequently, the integration of these geographical and meteorological factors makes the city well suited for investigating the relationship between LLJ evolution and aerosol vertical distribution during dust transport events.
The CDWL system (Fig. 1b) is installed on the roof of the School of Earth and Space Science building at the University of Science and Technology of China (31.83° N, 117.25° E) in Hefei. It is utilized to measure vertical profiles of the aerosol backscatter coefficient and wind velocity with high spatiotemporal resolution. The system operates at an eye-safe wavelength of 1.5 µm and emits pulses of 300 µJ at a 10 kHz repetition rate, providing a maximum detection range of 15 km. To derive three-dimensional wind vectors (Banakh et al., 2010; Smalikho, 2003), the CDWL employs a velocity azimuth display (VAD) scanning mode at a constant elevation angle of 60°. The azimuth angle ranges from 0 to 300° with an interval of 5°. Under this scanning geometry, the horizontal wind direction increases clockwise (0° for true north), and negative vertical velocities denote updrafts. Detailed information and validation of the CDWL can be found in previous studies (Jia et al., 2019; Wei et al., 2019, 2020).
2.2 Doppler lidar parameter retrieval
To ensure the reliability of the retrieved wind and aerosol profiles, a rigorous quality control (QC) procedure is implemented. First, a carrier-to-noise ratio (CNR) threshold of −28 dB is applied to remove signals dominated by background noise while retaining the continuity of aerosol and wind structures in the lower troposphere. The retrieved profiles are further visually examined for temporal continuity across neighboring range gates in order to minimize contamination from transient hard targets and isolated noisy bins. Second, a continuity check is performed on the vertical velocity and horizontal wind vectors to identify and remove outliers caused by transient hard targets (e.g., birds or aircraft) or extreme atmospheric turbulence.
The attenuated aerosol backscatter coefficient (β) is retrieved from the CNR using a semi-qualitative calibration method (Huang et al., 2021b; Pentikäinen et al., 2020; Wei et al., 2022). The calculation is expressed as:
where r denotes the range, C refers to a calibration factor determined by integrating backscattered signals from optically thick, non-drizzling stratocumulus clouds (O'Connor et al., 2004). Tf(r) represents the focus function, which is derived from horizontal scans assuming a homogeneous aerosol distribution (Yang et al., 2020). To better characterize the mean vertical position of aerosol backscatter within the lidar observation range, the backscatter centroid height (zc) is used as an integrated diagnostic quantity. It should be noted that the centroid height does not represent the actual trajectory of an individual aerosol plume. At each time step, the centroid height is calculated as the backscatter weighted mean height within the 0–5 km range:
where zc represents the centroid height of aerosol backscatter, zi denotes the altitude of the ith range gate, and βi(t) is the attenuated aerosol backscatter coefficient at altitude zi and time t. The summation is performed over all range gates within the 0–5 km altitude range, which was selected to cover the main dust layers and LLJ related structures during both events. Applying the same altitude range to both cases ensures consistency in the comparison and reduces the influence of weak signals at higher altitudes.
To further describe changes in the vertical extent of aerosol backscatter structures, the aerosol layer top (ALT) is introduced. ALT is defined as the lowest altitude where the attenuated backscatter coefficient decreases below 10−6 m−1 sr−1. The threshold was selected because log10(β) provides a stable and distinguishable criterion for identifying enhanced aerosol structures in both cases. These quantities describe temporal changes in aerosol structures above a fixed observation site and cannot independently distinguish horizontal advection from local vertical redistribution.
Vertical wind shear (S) is calculated as the magnitude of the horizontal wind vector difference between two adjacent height levels:
where the vector difference between the horizontal wind at two altitudes is normalized by the vertical distance (Δz) between them. The Doppler spectral width is used to describe Doppler velocity variability in this study. It can be affected by turbulence, wind shear, and other atmospheric motions. Therefore, spectral width is interpreted together with wind shear and aerosol observations, rather than as a direct measurement of turbulence intensity. Because the Doppler wind lidar provides observations at a fixed location, temporal variations in aerosol backscatter structures may result from both horizontal advection and local vertical redistribution. Therefore, the relationships between LLJ evolution and aerosol structures are interpreted based on their temporal and vertical consistency rather than as direct evidence of individual aerosol transport trajectories.
2.3 The identification of LLJs
Building upon the classification schemes in our previous work (Wei et al., 2025b), we identify LLJ events in Hefei based on the following objective criteria: (1) The maximum wind speed (Vmax) in the lower troposphere must reach or exceed 8 m s−1; (2) A distinct jet core must be present, defined by a significant wind speed decrease of at least 4 m s−1 () between the jet core and the first local minimum (Vmin) above it; (3) The LLJ core height is determined by the altitude of Vmax. In cases where multiple wind speed maxima occur simultaneously at different levels, the lowest jet layer is prioritized as it exerts the most direct influence on surface pollution patterns. This criterion is particularly relevant for dust-transport cases because the lowest jet core has a stronger potential coupling with near-surface aerosol concentration variations. These thresholds are applied consistently to both events in order to ensure a comparable identification of LLJ structures across cases.
After identifying LLJ events, the jet types are classified according to the LLJ core height following Du et al. (2014). LLJs with cores below 1 km above ground level are classified as boundary layer jets (BLJs), whereas LLJs with cores between 1 and 4 km are classified as synoptic system related LLJs (SLLJs). BLJs are generally associated with boundary layer diurnal evolution, while SLLJs are usually related to larger scale synoptic systems. In this study, the jet core height is used as the operational classification criterion, while the synoptic background is considered only as supporting information for physical interpretation. Because LLJ cores may migrate vertically during their lifecycle, jets crossing the 1 km height threshold are described according to their core height at different stages rather than being assigned a fixed type throughout the entire period.
2.4 Meteorological and air quality data
All times reported in this study are local time (LT, UTC+8 h) unless otherwise stated. The synoptic weather charts explicitly labeled as UTC are presented in Coordinated Universal Time. The ambient air quality data (i.e., PM2.5 and PM10 concentrations) are obtained from the National Real-Time Air Quality Reporting System of the China National Environmental Monitoring Center (CNEMC; http://www.cnemc.cn/, last access: 21 March 2026). This study utilizes city-wide average values from multiple monitoring stations in Hefei to represent regional pollution levels; specific locations for all sites are available on the official portal (https://aqicn.org/city/hefei/, last access: 21 March 2026). The nearest monitoring station to the CDWL system is located on Changjiang Middle Road (31.852° N, 117.25° E), approximately 2.7 km to the northwest. The surface meteorological data (i.e., air temperature and dew point temperature) are acquired from the National Meteorological Information Center (NMIC; http://data.cma.cn/, last access: 21 March 2026). The ERA5 reanalysis data are used to characterize the synoptic conditions and the vertical thermal structure of the atmosphere (Hersbach et al., 2020). The dataset provides hourly estimates for numerous atmospheric, oceanic, and land-surface quantities on a 0.25°×0.25° regular latitude-longitude grid.
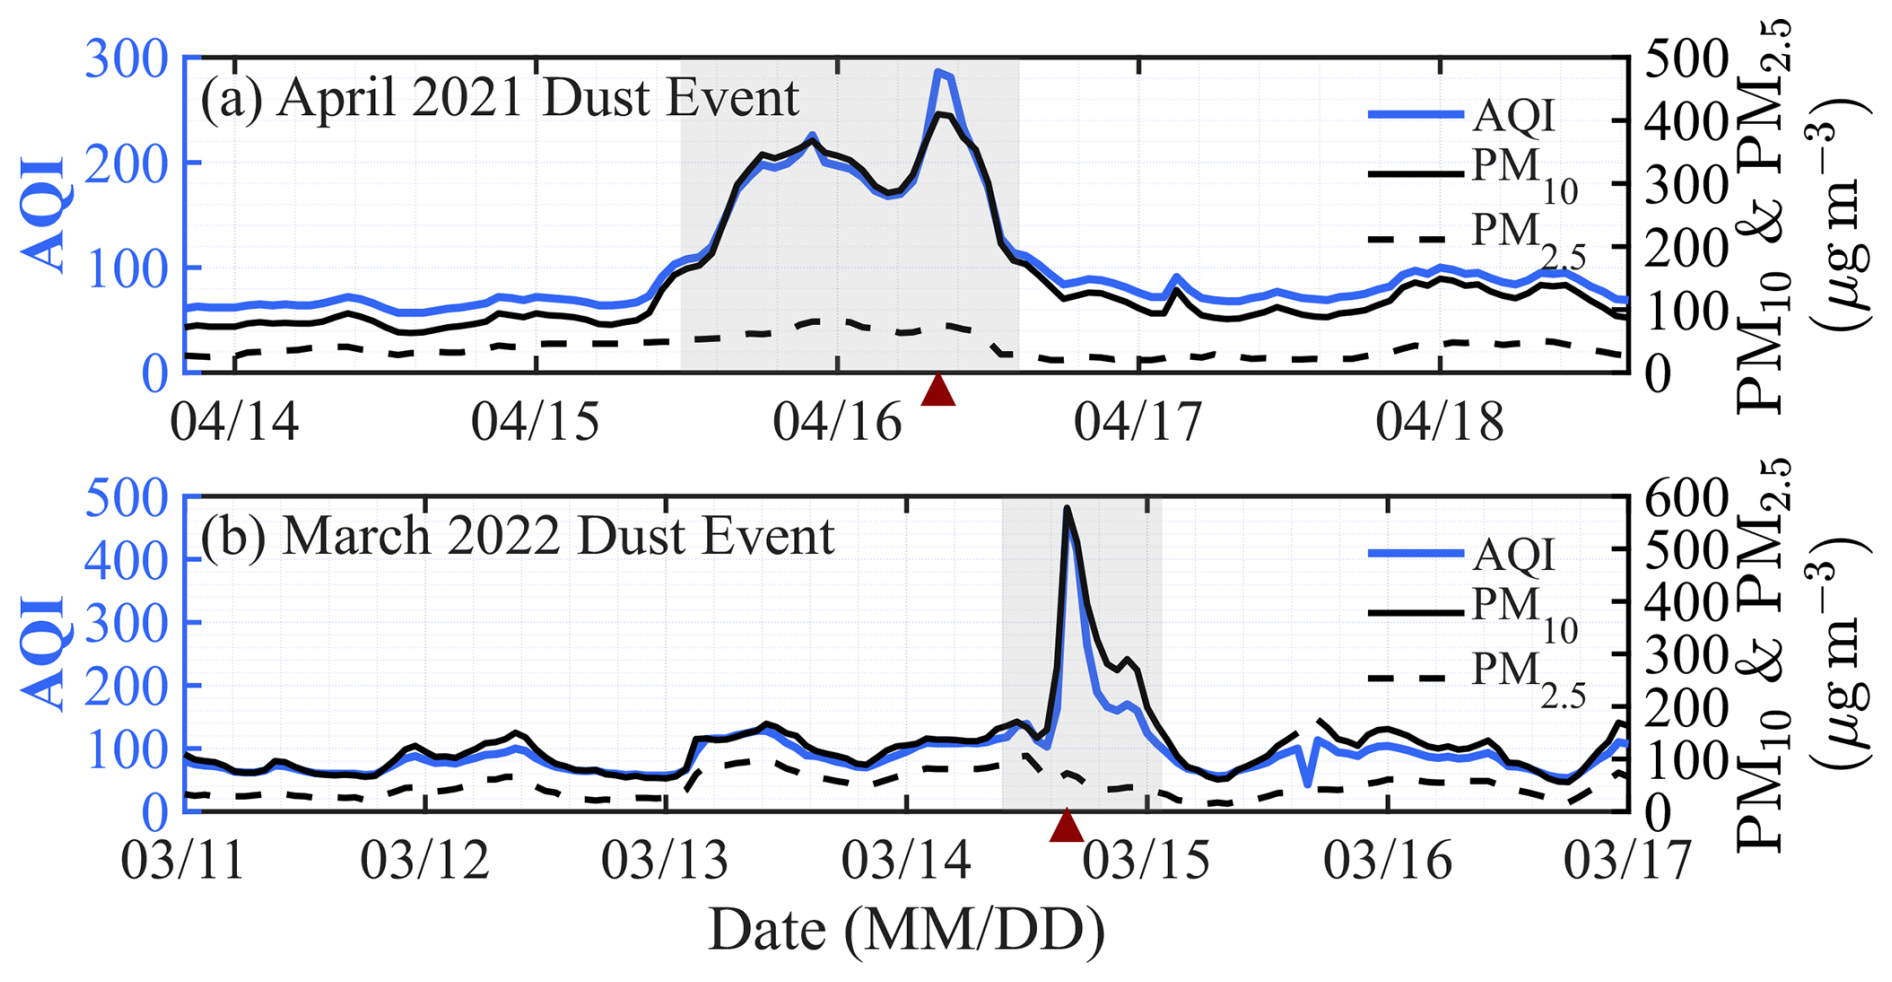
Figure 2Time series of air quality parameters during the dust events in (a) April 2021 and (b) March 2022. The blue solid line represents the Air Quality Index (AQI), while the black solid and dashed lines denote PM10 and PM2.5 concentrations (µg m−3), respectively. The grey shaded areas indicate the identified dust event periods, and the red triangles mark the occurrence of the peak PM10 concentration.
According to the Atmospheric Environmental Meteorological Bulletin issued by the China Meteorological Administration (https://www.cma.gov.cn/zfxxgk/gknr/qxbg/, last access: 21 March 2026), the regional dust episode (No. 202107) from 14–16 April 2021 is classified as a dust storm. This episode occurred under the coupling of a Mongolian cyclone and an associated surface cold front. The bulletin reported that the dust originated in central Inner Mongolia and propagated southeastward, resulting in blowing or floating dust across central and northern Anhui Province. Preceding drought conditions that loosened the topsoil, combined with intensified near-surface winds, facilitated the emission and long-range dispersion of dust particles (Mai et al., 2021). Similarly, the regional dust episode (No. 202202) from 13–16 March 2022 reached dust storm intensity. Under the combined forcing of a Mongolian cyclone and a cold front, dust was reported to originate mainly from central Inner Mongolia. As the plume moved eastward and southward, it affected central and northern Anhui, reducing air quality and horizontal visibility. This episode involved widespread dust activity across multiple northern provinces, impacting the regional atmospheric environment (Mai and Zhang, 2022).
Building upon the identification and preliminary aerosol characterization of these two episodes reported by Wang et al. (2024), the present study conducts a more detailed investigation into boundary layer processes associated with these events. Utilizing a PM2.5 PM10 ratio below 0.18 and an hourly PM10 concentration exceeding 150 µg m−3 as identification criteria, the two dust episodes (Fig. 2) are defined from 11:00 on 16 April to 14:00 LT on 17 April 2021 (April 2021 event), and from 09:00 on 14 March to 01:00 LT on 15 March 2022 (March 2022 event). While previous work focused on the general aerosol properties, the current analysis examines the relationship between LLJ evolution and aerosol vertical distribution. Specifically, the focus is on how the evolution of vertical wind structures and atmospheric stability is associated with the distinct surface pollution patterns observed in these two dust episodes.
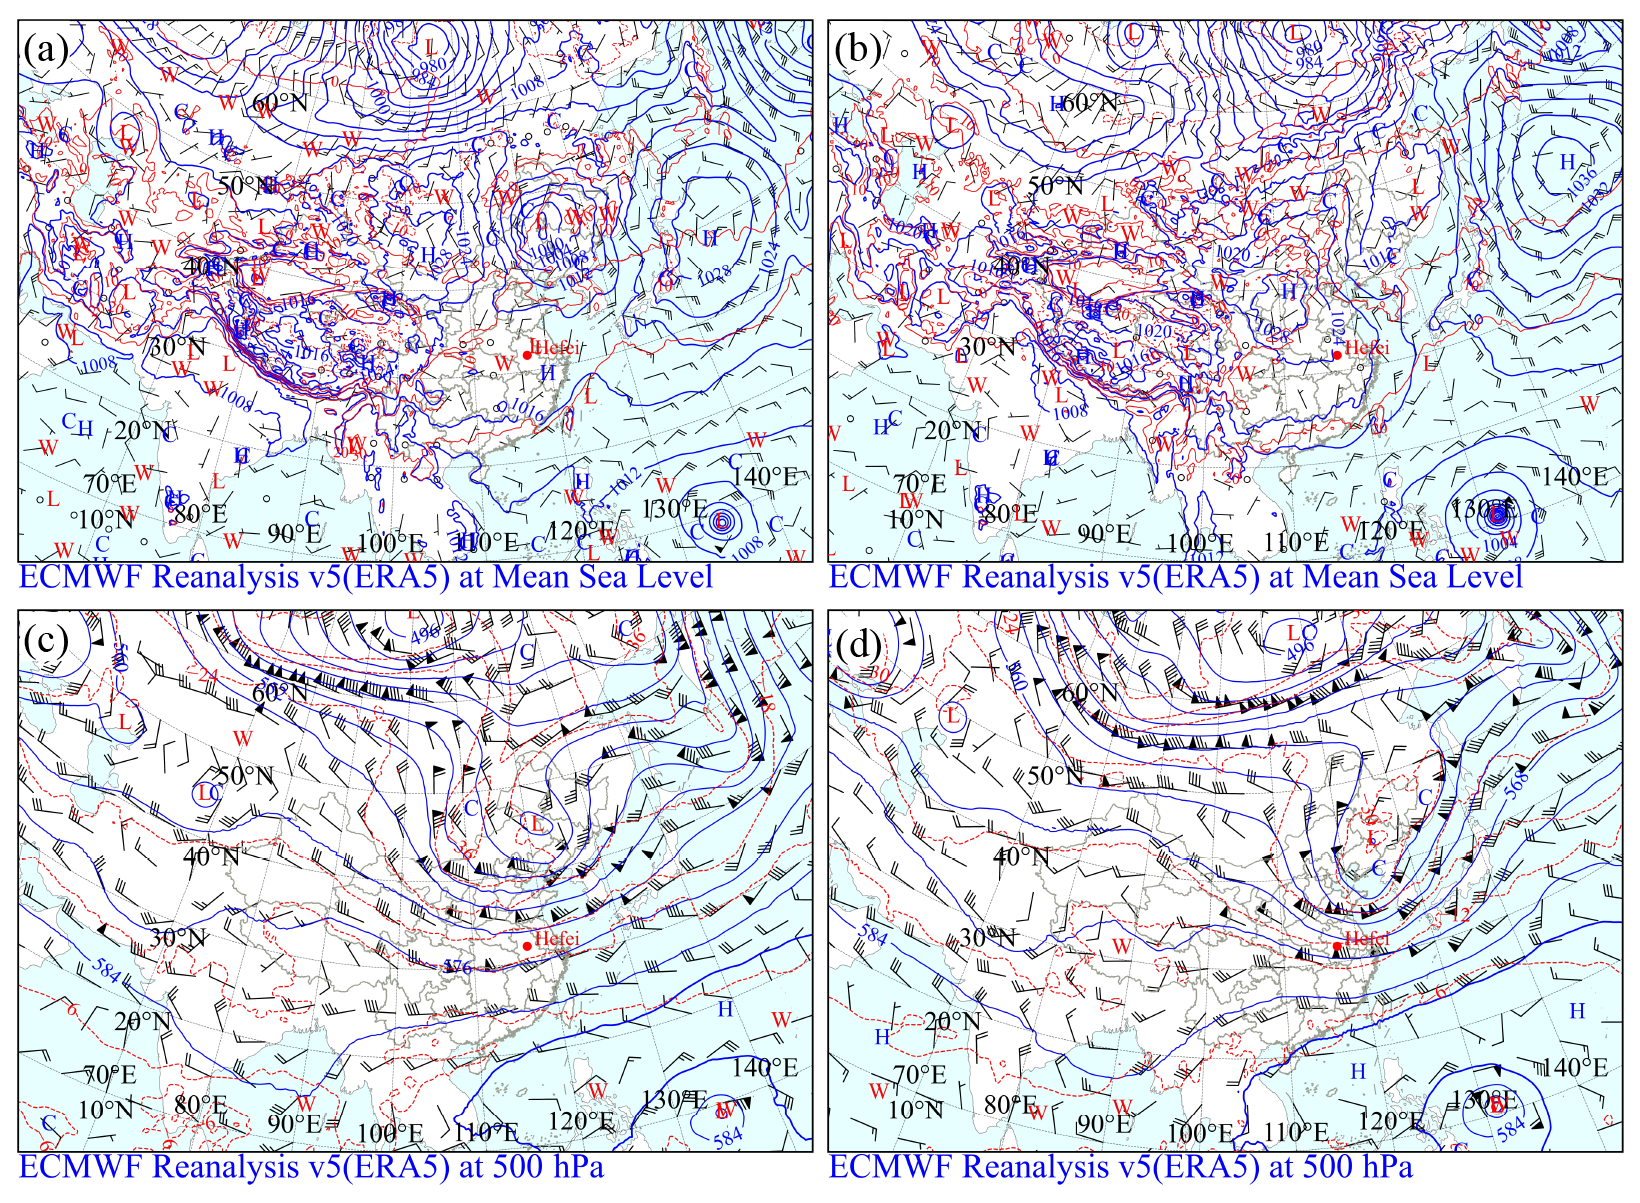
Figure 3Synoptic weather patterns for the April 2021 dust event: (a) surface weather map at 00:00 UTC, 16 April 2021; (b) surface weather map at 00:00 UTC, 17 April 2021; (c) 500 hPa geopotential height (blue lines, dagpm), isotherms (red lines, °C), and wind barbs at 00:00 UTC, 16 April 2021; (d) same as (c) but for 17 April 2021. The letters “L” and “C” indicate low-pressure and cold centers, respectively; the letters “H” and “W” indicate high-pressure and warm centers.
3.1 The April 2021 dust event
Preceding the April 2021 event, the dust source regions in northern China and Mongolia experience a notably warm spring, with temperatures 1.1 °C above the climatological mean. This prolonged warming, coupled with a significant precipitation deficit in April (less than 10 mm in parts of Inner Mongolia), leads to the desiccation of the topsoil. Dynamically, the synergistic influence of a deep Mongolian Cyclone and a Northeast Cold Vortex (Fig. 3a–b) provides the primary driving force for large-scale dust emission and the long-range transport. At mean sea level, the cyclone deepens during its eastward propagation, accompanied by strong northwesterly winds. At 500 hPa (Fig. 3c–d), the deepening cold vortex guides polar cold air southward, overlapping with the low-level cold advection. The presence of an 850 hPa warm ridge beneath 500 hPa cold advection creates a thermodynamic instability (warm-below and cold-above), which may facilitate vertical mixing. This synoptic forcing corresponds to the air quality profile observed in Hefei (Fig. 2a). As the cold front passes, the surface PM10 concentration exhibits a multi-peak pattern, increasing from background levels to a maximum of 410 µg m−3 at 08:00 LT on 17 April 2021. This intrusion is characterized by a rapid response to the downward transfer of high-level momentum and dust particles, reflecting an unstable boundary layer where strong synoptic-scale forcing dominates local stratification.
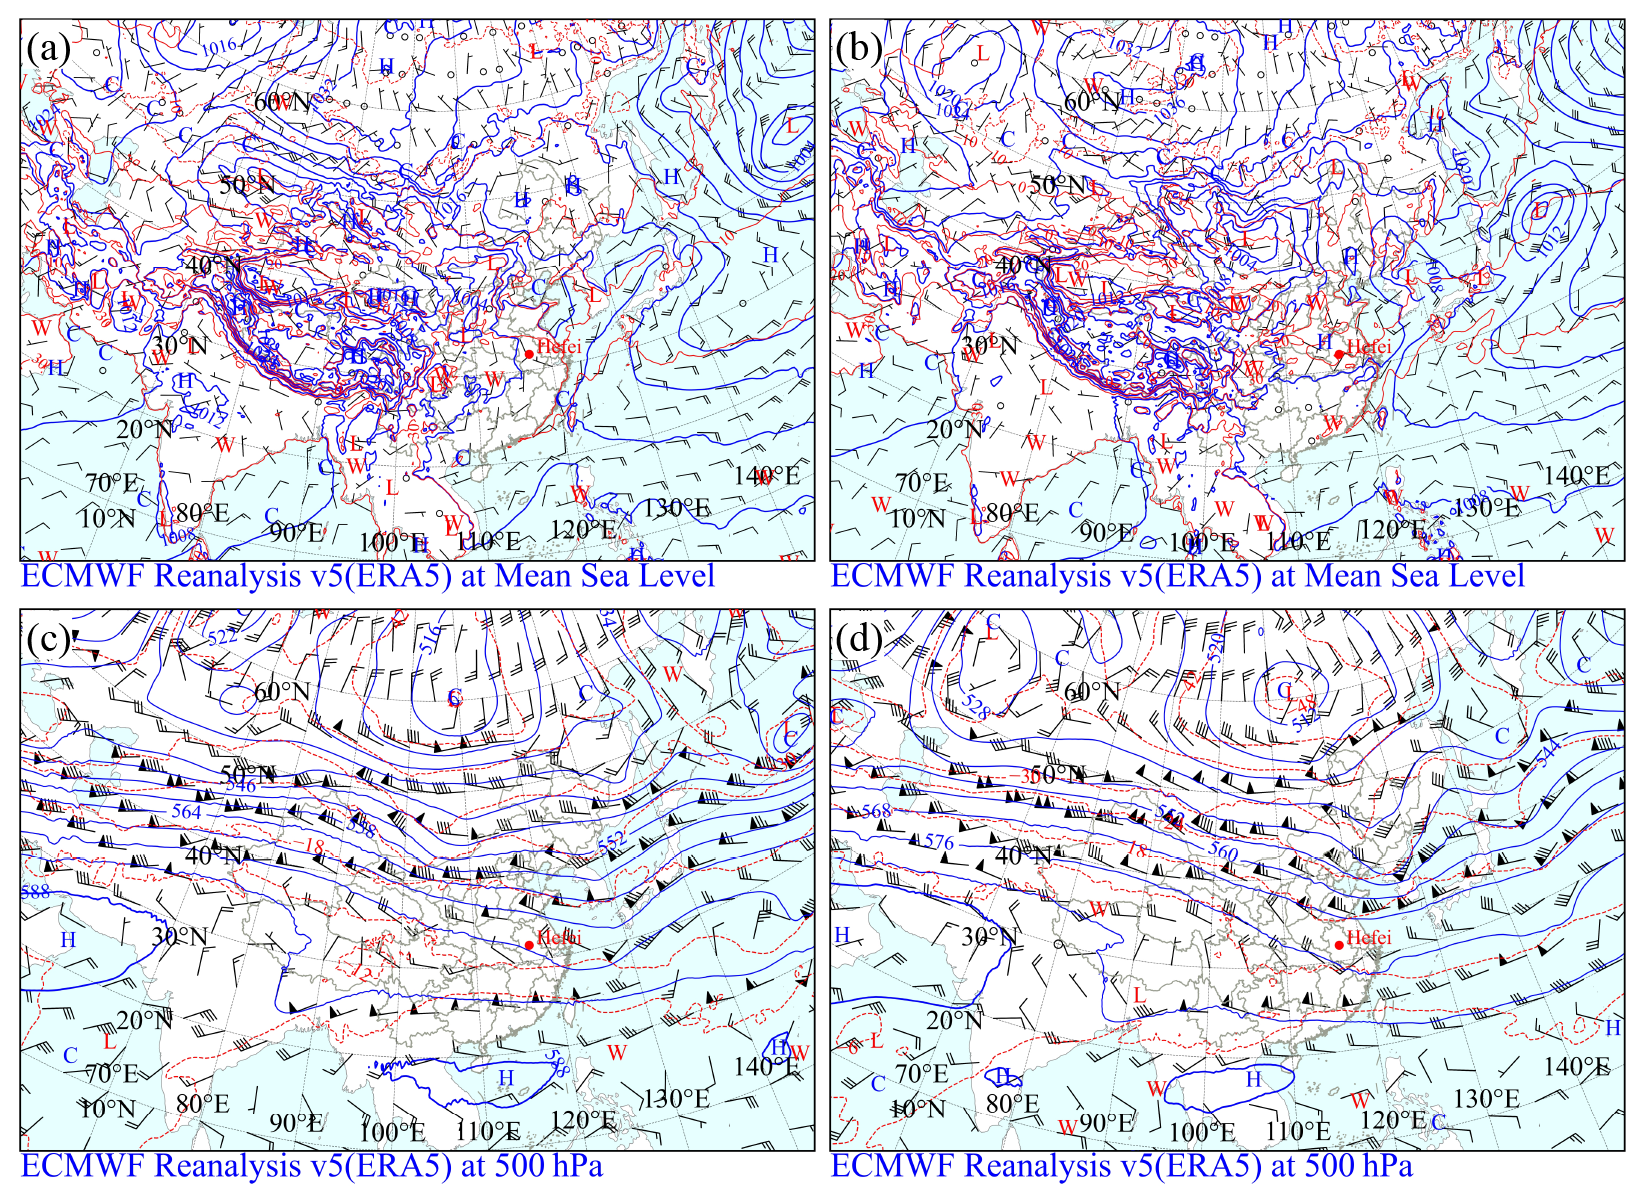
Figure 4Synoptic weather patterns for the March 2022 dust event: (a) surface weather map at 08:00 UTC on 13 March 2022; (b) surface weather map at 08:00 UTC on 14 March 2022; (c) 500 hPa weather map at 08:00 UTC on 13 March 2022; (d) 500 hPa weather map at 08:00 UTC on 14 March 2022. Notation follows Fig. 3.
3.2 The March 2022 dust event
The March 2022 event exhibits different circulation characteristics. Although spring 2022 also experiences record-high temperatures, a 25 % increase in March precipitation over the dust source regions enhances soil moisture and inhibits dust deflation. Furthermore, a weaker polar vortex and a shallower East Asian Trough restrict the intensification of the Mongolian Cyclone (Fig. 4a–b), resulting in weaker surface dynamic forcing compared to the previous year. At 500 hPa (Fig. 4c–d), the primary driver is a southward-extending East Asian Trough. The northwesterly jet behind this trough provides sustained momentum for the southward advection of dust particles. The subsidence and dry air masses associated with the rear of the trough favor the long-range transport and gradual deposition of dust in downstream regions. Correspondingly, the surface air quality in Hefei (Fig. 2b) exhibits a single, pronounced PM10 peak (578 µg m−3) at 16:00 LT on 14 March 2022. Despite the weaker surface pressure gradient, the stable upper-level trough-driven transport allows dust to be advected within an elevated layer. The sudden surface peak occurs under relatively stable synoptic conditions, suggesting that the pollution maximum is not exclusively a result of frontal passage but is likely associated with localized boundary-layer dynamics, including LLJ-related downward redistribution. These contrasting synoptic configurations, which are characterized by the unstable intrusion in 2021 and the advection-dominant transport in 2022, provide the background for the distinct LLJ behaviors. Their subsequent impacts on aerosol particle redistribution are further analyzed using lidar observations in the following sections.
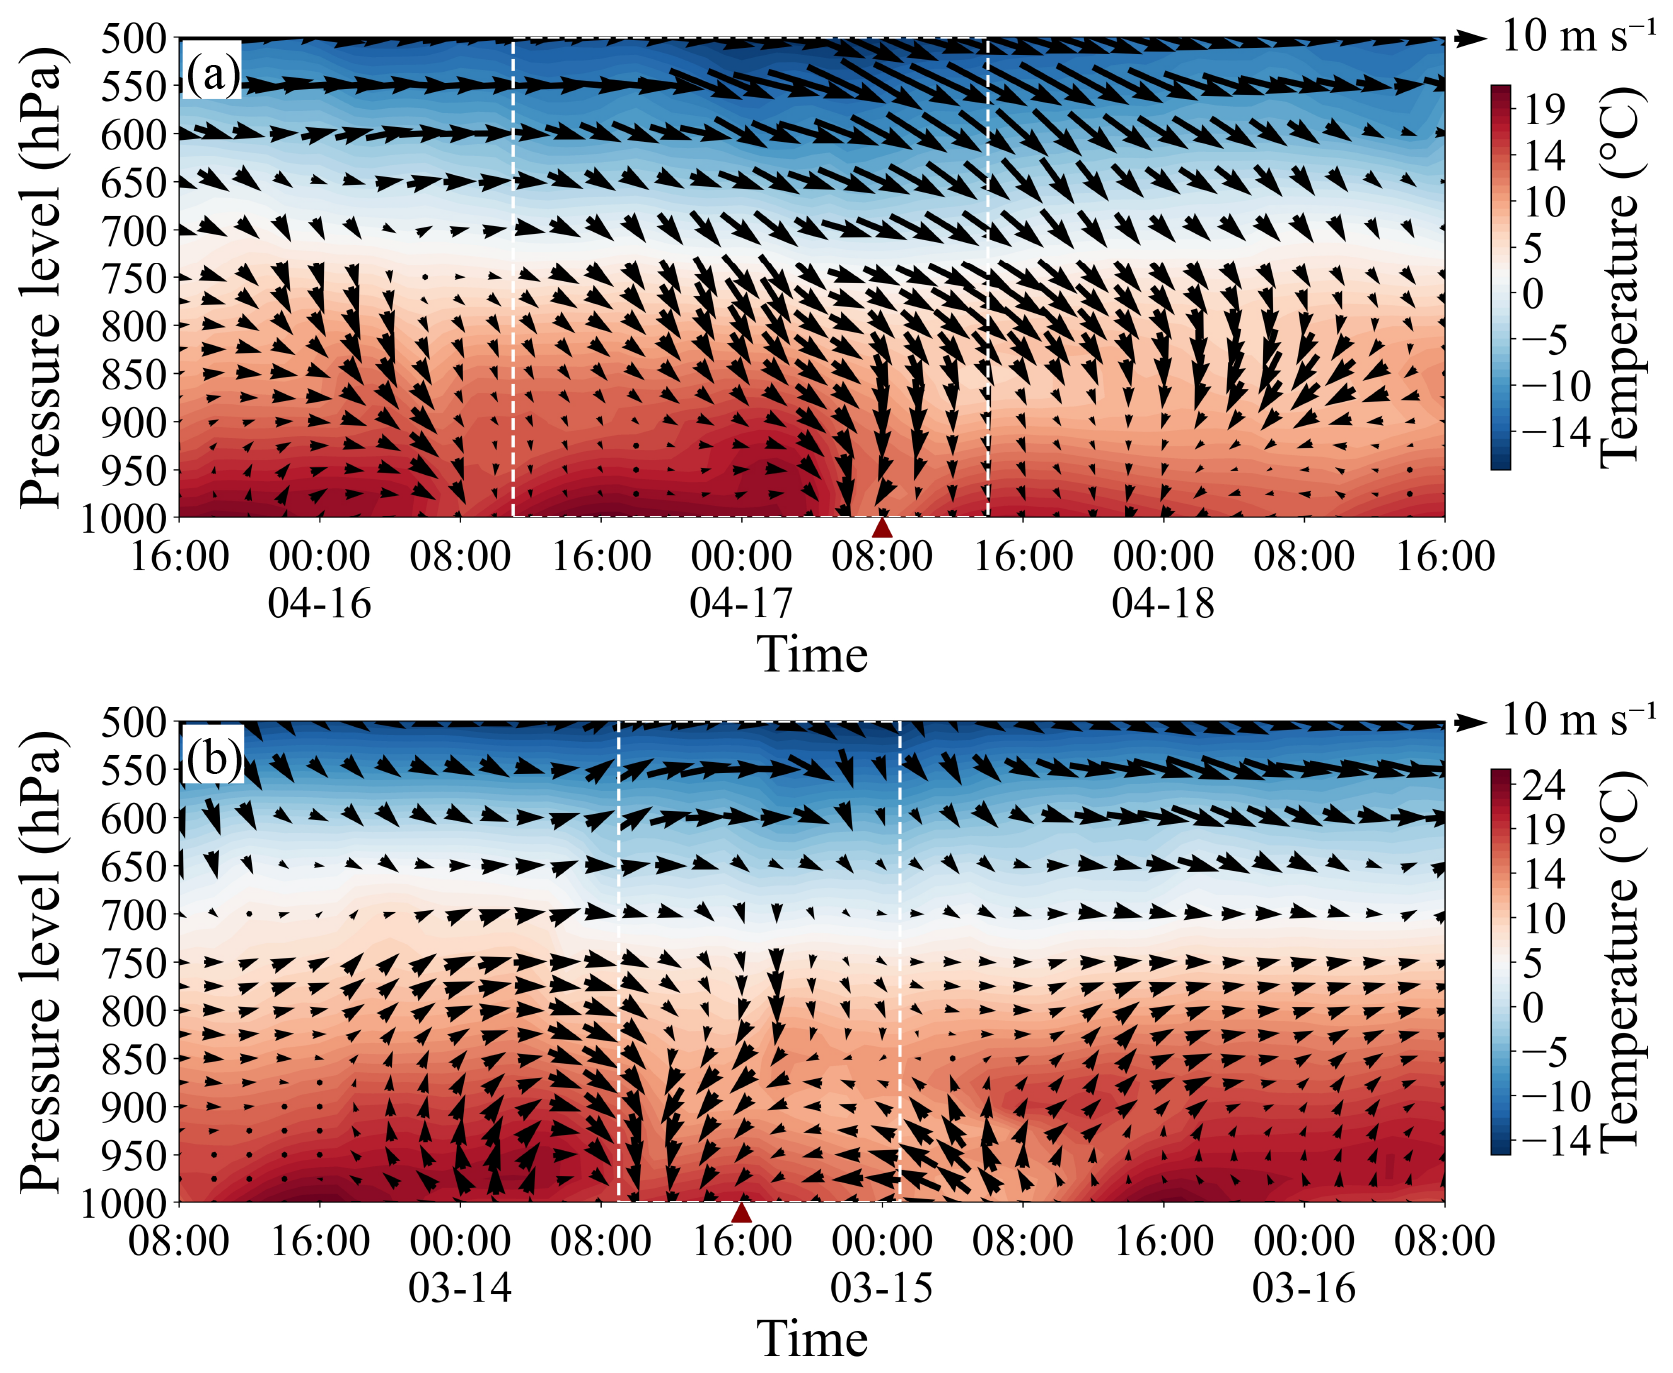
Figure 5Hourly evolution of vertical wind and temperature fields at different pressure levels during the dust events. Black arrows represent horizontal wind vectors (upward direction indicates North). White dashed boxes denote the duration of the dust episodes, and red triangles mark the timing of the peak PM10 concentration. (a) 15–18 April 2021; (b) 13–16 March 2022. All data are retrieved from the ERA5 hourly reanalysis datasets (0.25°×0.25°).
4.1 Vertical evolution of meteorological fields and inversion structure
Figure 5 illustrates the hourly vertical evolution of the wind and temperature fields at the Hefei site which are derived from the ERA5 hourly reanalysis datasets. As described in Sect. 2.4, ERA5 pressure level data are used to describe the large-scale thermal structure of the lower troposphere rather than to precisely determine the height, thickness, or breakdown time of shallow boundary layer inversions. In the April 2021 event (Fig. 5a), a prominent warm air mass occupies the lower troposphere (below 900 hPa) before 06:00 LT on 17 April. The 20 °C isotherm shifts downward toward the surface in Fig. A1a, which is consistent with warming in the lower troposphere before the frontal transition. The ERA5 temperature profiles indicate enhanced stability near the surface below approximately 950 hPa between 05:00 and 09:00 LT (Fig. A2a). After 06:00 LT, this warm zone is abruptly truncated by the advancing leading edge of the cold front, marked by a sharp temperature drop and downward-slanting wind vectors. This thermal and wind field transition coincided with significant increases in surface PM10 and AQI (Fig. 2a). Moreover, this process is accompanied by a rapid intensification of northwesterly winds aloft and northerly winds near the surface. The resulting cold advection leads to a substantial temperature decline of ∼ 9 °C, coinciding with the surface PM10 peak at 08:00 LT.
In contrast, the March 2022 event (Fig. 5b) exhibits a less significant temperature decline prior to the PM10 peak at 16:00 LT on 14 March. During this period, the low-level wind field displays a distinct orientation, characterized by northeasterly or northerly winds, which contrasts with the northwesterly flow observed above 700 hPa. This vertical wind direction shear, coupled with a minimum wind speed zone near 750 hPa, indicates a decoupling between the boundary layer and the free atmosphere. ERA5 temperature profiles show persistent stability signals between the 900 and 875 hPa pressure levels from the beginning of the dust episode until the early afternoon (Fig. A2b). This stable stratification is consistent with the isotherm distribution in Fig. A1b, where the isotherms are densely layered below 900 hPa and become sparse in the overlying layer (900 to 800 hPa). The thermal structure represented by ERA5 is consistent with relatively stable conditions in the lower troposphere and potentially weakened vertical exchange, providing a thermal background for the elevated aerosol structures observed by lidar in Sect. 4.2. This configuration distinguishes the event from the rapid dynamic forcing observed in 2021.
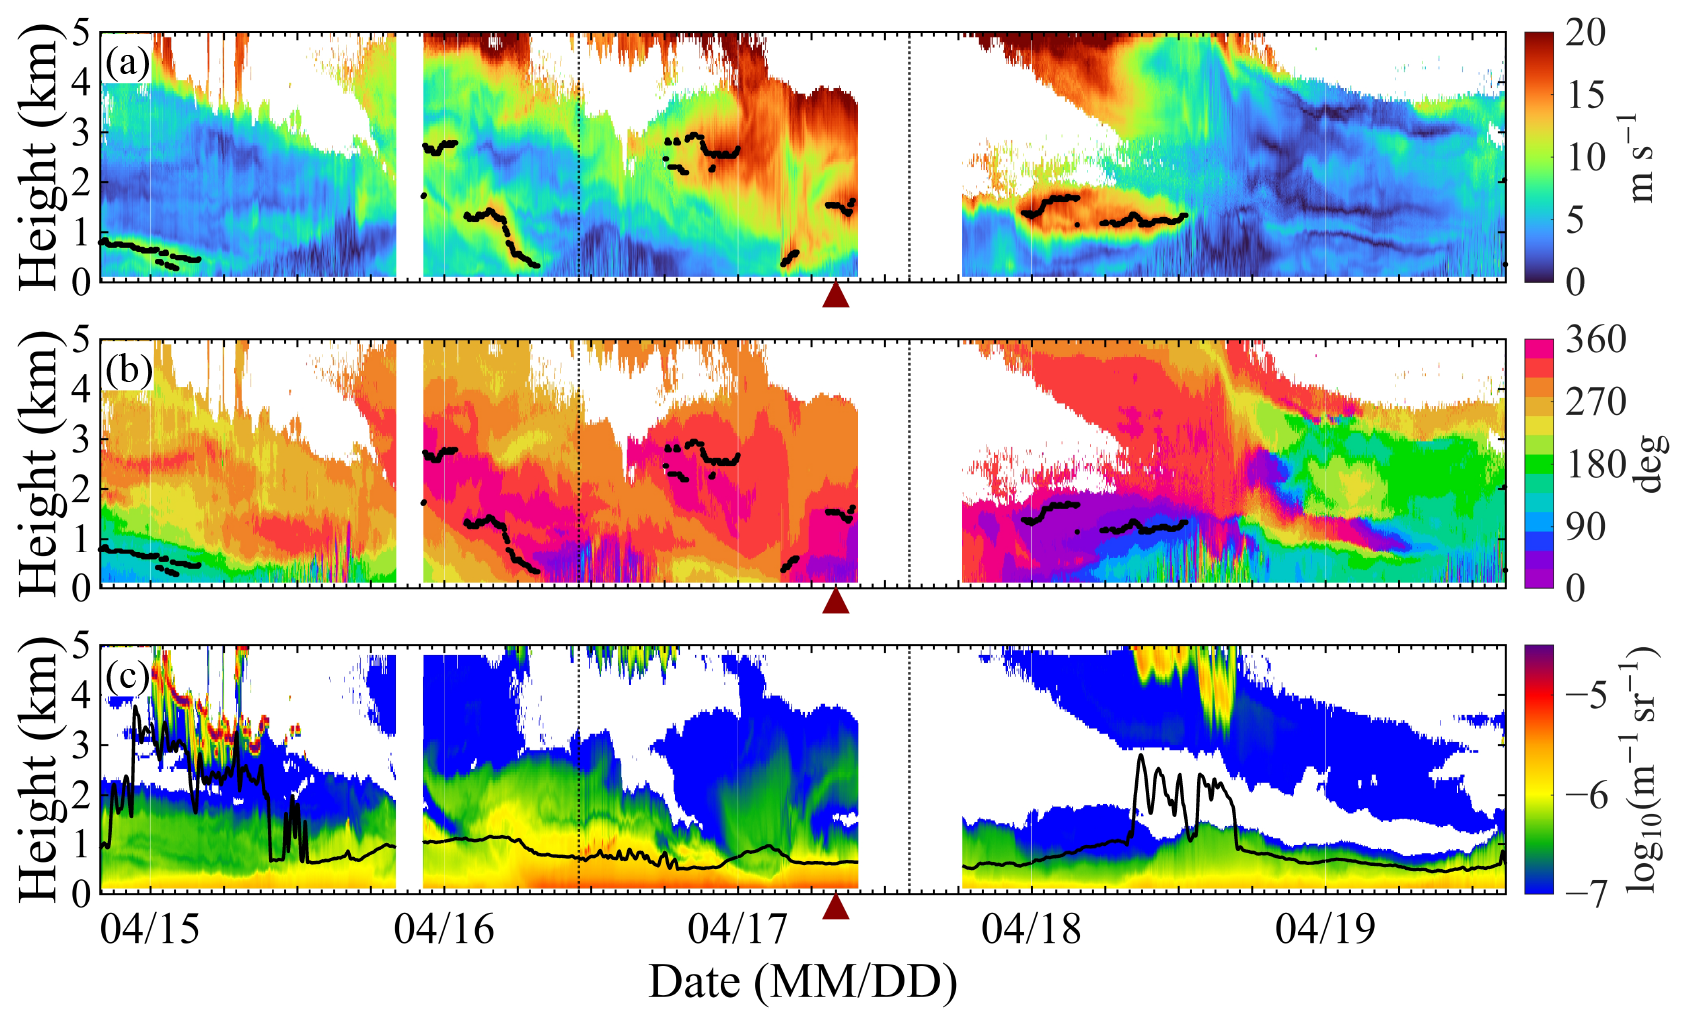
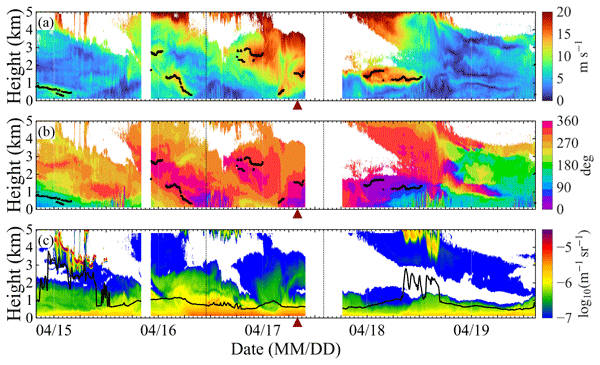
Figure 6Lidar observations from 20:00 LT on 14 April to 15:00 local time on 19 April 2021: (a) horizontal wind speed (m s−1); (b) horizontal wind direction (deg, where 0° represents North); (c) logarithmic attenuated backscatter coefficient (log10 (m−1 sr−1)). Black dots in (a) and (b) denote the low-level jet core height (km); the thin black line in (c) indicates the aerosol backscatter centroid height (km). The filled dark-red triangle indicates the timing of the PM10 peak concentration. The labels “MM/DD” on the horizontal axis represent the month and day, respectively.
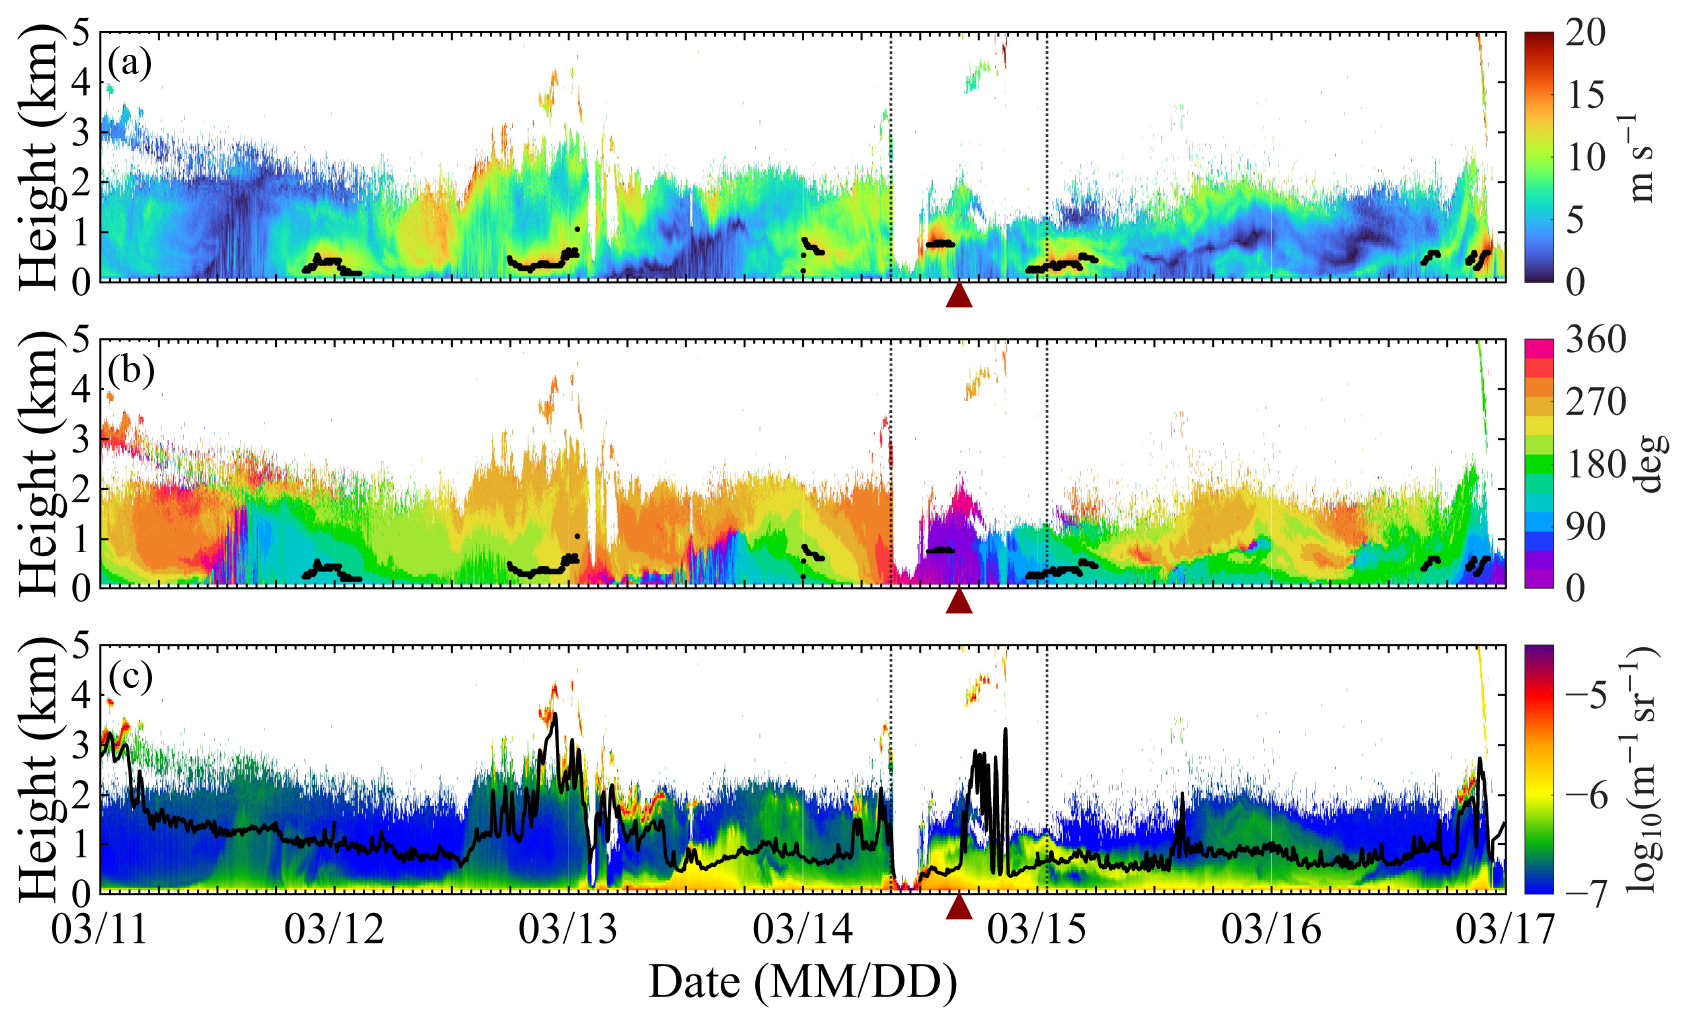
Figure 7Lidar observations from 00:00 on 11 March to 00:00 local time on 17 March 2022. Notation follows Fig. 6.
4.2 Co-evolution of LLJ and aerosol vertical distribution
Figure 6 presents the time-height evolution of horizontal wind speed, wind direction, and the logarithmic attenuated backscatter coefficient (β) during the April 2021 event. The backscatter centroid height and aerosol layer top (ALT) are calculated following the definitions described in Sect. 2.2. The centroid height represents the backscatter weighted mean height within 0 to 5 km, while ALT describes the vertical extent of enhanced aerosol backscatter structures.
Observations from the pre-event stage (15–16 April) establish the baseline boundary-layer conditions prior to the dust transport. Prior to the dust intrusion (15 April), the lower atmosphere is characterized by a persistent southeasterly boundary-layer jet (BLJ, >8.4 m s−1) below 1 km. During this period, the backscatter intensity remains weak, indicating a clean background with low local aerosol loading. By the early hours of 16 April, the transition to a synoptic-system-related LLJ (SLLJ) with northwesterly winds (>10.7 m s−1) indicates the approach of the cold frontal system. As the jet core descends from 2.7 to 0.3 km, the ALT increases from 0.4 (04:00 LT) to 1.5 km (06:00 LT), indicating enhanced aerosol loading and changes in the vertical distribution of aerosols during the frontal transition. Subsequently, the broadly synchronous descent of the ALT and centroid height suggests that the enhanced backscatter region evolves together with the descending jet structure and remains mainly elevated before a strong increase in near surface aerosol concentration occurs.
During the dust influence stage (11:00 LT on 16 April to 14:00 LT on 17 April), an intensified cold air surge is associated with the development of an SLLJ with speeds of 15.5 m s−1 (18:00 to 00:00 LT). Initially situated at a mean core height of 2.5 km, the jet core descends sharply to 0.5 km by 03:30 LT with speeds exceeding 13.4 m s−1 on 17 April. Approximately 30 min before the jet core reaches 0.3 km, ALT begins to rise, reaching 0.7 km as the jet dissipates. This height fluctuates around the period of the surface PM10 peak, suggesting that enhanced wind shear and increased Doppler velocity variability associated with the evolving jet structure may have contributed to enhanced vertical mixing and the observed downward redistribution of dust. The low background concentrations on 15 April and the progressive downward migration of enhanced aerosol backscatter structures on 16 April suggest that the surface peak on 17 April may be associated with enhanced downward mixing conditions during the frontal transition.
In the post-event stage, a final SLLJ (23:00 LT on 17 April to 03:45 LT on 18 April) with a mean core height of 1.5 km and speeds exceeding 15.8 m s−1 continues to modulate the aerosol vertical structure. High backscatter values ( m−1 sr−1) extend downward to approximately 0.5 km following the period of maximum jet height. The eventual shift to northeasterly winds and the decrease in ALT indicate a reduction in the vertical extent of the dust layer signal and the restoration of typical atmospheric conditions.
Prior to the dust intrusion (12–13 March), the lower atmosphere is characterized by alternating LLJ regimes. From 18:00 LT on 12 March to 01:00 LT on 13 March, a southwesterly LLJ (>10.9 m s−1) is observed with a mean core height of 0.4 km (Fig. 7a–b). Unlike the 2021 case where the northwesterly LLJ coincides with enhanced dust transport, this southwesterly jet occurs under relatively stable conditions in the lower atmosphere, while ALT remains below 0.1 km. Following the dissipation of this jet and a subsequent shift to northwesterly winds, the ALT gradually ascends to 1.0 km by 12:00 LT on 13 March, marking a significant vertical expansion. By 17:37 LT, the near-surface wind shifts to southeasterly and the ALT drops below 0.1 km, reflecting the suppression of vertical mixing after sunset. In the early morning of 14 March, a brief southwesterly LLJ (>10.6 m s−1) with a mean core height of 0.7 km occurs under stable nocturnal conditions, with ALT remaining low. The onset of daytime convective mixing and a shift to northwesterly winds by 08:00 LT lead to a rapid rise in ALT, preceding the main dust intrusion.

Figure 8Vertical profiles of the logarithmic attenuated backscatter coefficient (log10(m−1 sr−1)) during representative periods before, around, and after the surface PM10 peak. Panels (a)–(c) show the April 2021 event: (a) 13:00–13:30 LT on 16 April, (b) 07:45–08:15 LT on 17 April, and (c) 00:30–01:00 LT on 18 April. Panels (d)–(f) show the March 2022 event: (d) 02:00–02:30 LT on 14 March, (e) 15:45–16:15 LT on 14 March, and (f) 07:30–08:00 LT on 15 March. Grey lines represent 3 min actual profiles; blue lines represent 30 min mean profiles.
The main phase of the dust intrusion (09:00 LT on 14 March to 01:00 LT on 15 March) exhibits features consistent with predominantly horizontal transport. A strong northwesterly LLJ (>12.1 m s−1) with a relatively stable core height of approximately 0.7 km shows a close correspondence with the elevated ALT. In contrast to the descending jet observed in April 2021, the March 2022 jet core remains at a relatively stable height and coincides with a persistent layered aerosol backscatter structure below approximately 1.5 km. As the LLJ weakens after 15:00 LT, the ALT decreases, followed by the surface PM10 peak at 16:00 LT on 14 March.
During the post-event stage (after 01:00 LT on 15 March), a shallow LLJ with a mean core height of 0.3 km accompanies the final attenuation of the dust layer. A relatively low backscatter zone ( m−1 sr−1) at 0.5 km slowly subsides to 0.3 km until the jet disappears after 06:00 LT, indicating the restoration of typical atmospheric conditions.
To further quantify the vertical structure, β profiles are analyzed across three stages: pre-peak, during-peak, and post-peak. The during-peak stage is defined as a 30 min window centered on the PM10 peak, whereas the pre- and post-peak periods were selected to represent the surrounding event stages. The exact periods are provided in Fig. 8 and its caption. Figure 8 illustrates the 3 min instantaneous profiles (grey) alongside the 30 min means (blue) to assess structural variability. All numerical values discussed below refer to log10(β). For each selected height interval, the mean vertical rate of change in log10(β) is calculated as , where Δz is expressed in meters. This finite difference quantity is used to compare changes among selected height intervals and is not interpreted as a formal vertical gradient.
In the April 2021 event, the profiles exhibit distinct stage-wise transitions. Across all stages, the near-surface signals remain relatively stable with minimal standard deviation (SD <0.01). During the pre-peak stage (Fig. 8a), β decreases with altitude in an oscillatory pattern, with values exceeding 10−5.5 m−1 sr−1 below 0.33 km and reaching a minimum of 10−6.8 m−1 sr−1 at 2.93 km. A localized low-value zone ( m−1 sr−1) is identified between 1.54 and 1.63 km, which is consistent with the layered structure in the time-height sections. A variance maximum (SD =0.18) at 0.93 km indicates a layer of increased signal volatility. During the peak stage (Fig. 8b), the profile shows its most pronounced vertical change, decreasing and then increasing with altitude. The mean vertical rate of change in log10(β) is m−1 below 1.30 km and m−1 between 1.30 and 1.54 km, indicating that log10(β) decreases more rapidly over the latter height interval. During the post-peak stage (Fig. 8c), β profiles show a general decreasing trend with altitude with a mean vertical rate of change in log10(β) of m−1 below 1 km. β above 0.69 km decreases by approximately one order of magnitude relative to the pre-peak levels.
The March 2022 event shows more pronounced layered variations in the log10(β) profiles across the three selected periods, particularly below approximately 1.5 km. During the pre-peak stage (Fig. 8d), β declines from 10−5.7 to 10−6.7 m−1 sr−1 within the 0.09–0.69 km layer. Subsequently, the profile remains relatively constant, with a slight increase up to approximately 1.57 km (10−6.9 m−1 sr−1). During the peak stage (Fig. 8e), the vertical structure becomes more complex. Below 0.84 km, β decreases from 10−5.4 to 10−6.4 m−1 sr−1, and then increases to a secondary peak of 10−6.2 m−1 sr−1 at 1.06 km. This is followed by a sharp decline to a minimum (10−7.1 m−1 sr−1) at 1.21 km, after which the signal increases again. This fluctuating pattern below 1.5 km represents a more stratified dust layer compared to the 2021 peak. During the post-peak stage (Fig. 8f), β first decreases from 10−6.0 to 10−6.3 m−1 sr−1 (0.09–0.21 km), then recovers to 10−6.0 m−1 sr−1at 0.36 km, followed by a decline to its absolute minimum of 10−7.2 m−1 sr−1at 1.03 km. Finally, the profile increases once more within a relatively low-value zone ( m−1 sr−1) between 0.93 and 1.57 km. This pattern indicates a substantial structural reconfiguration during the waning phase.
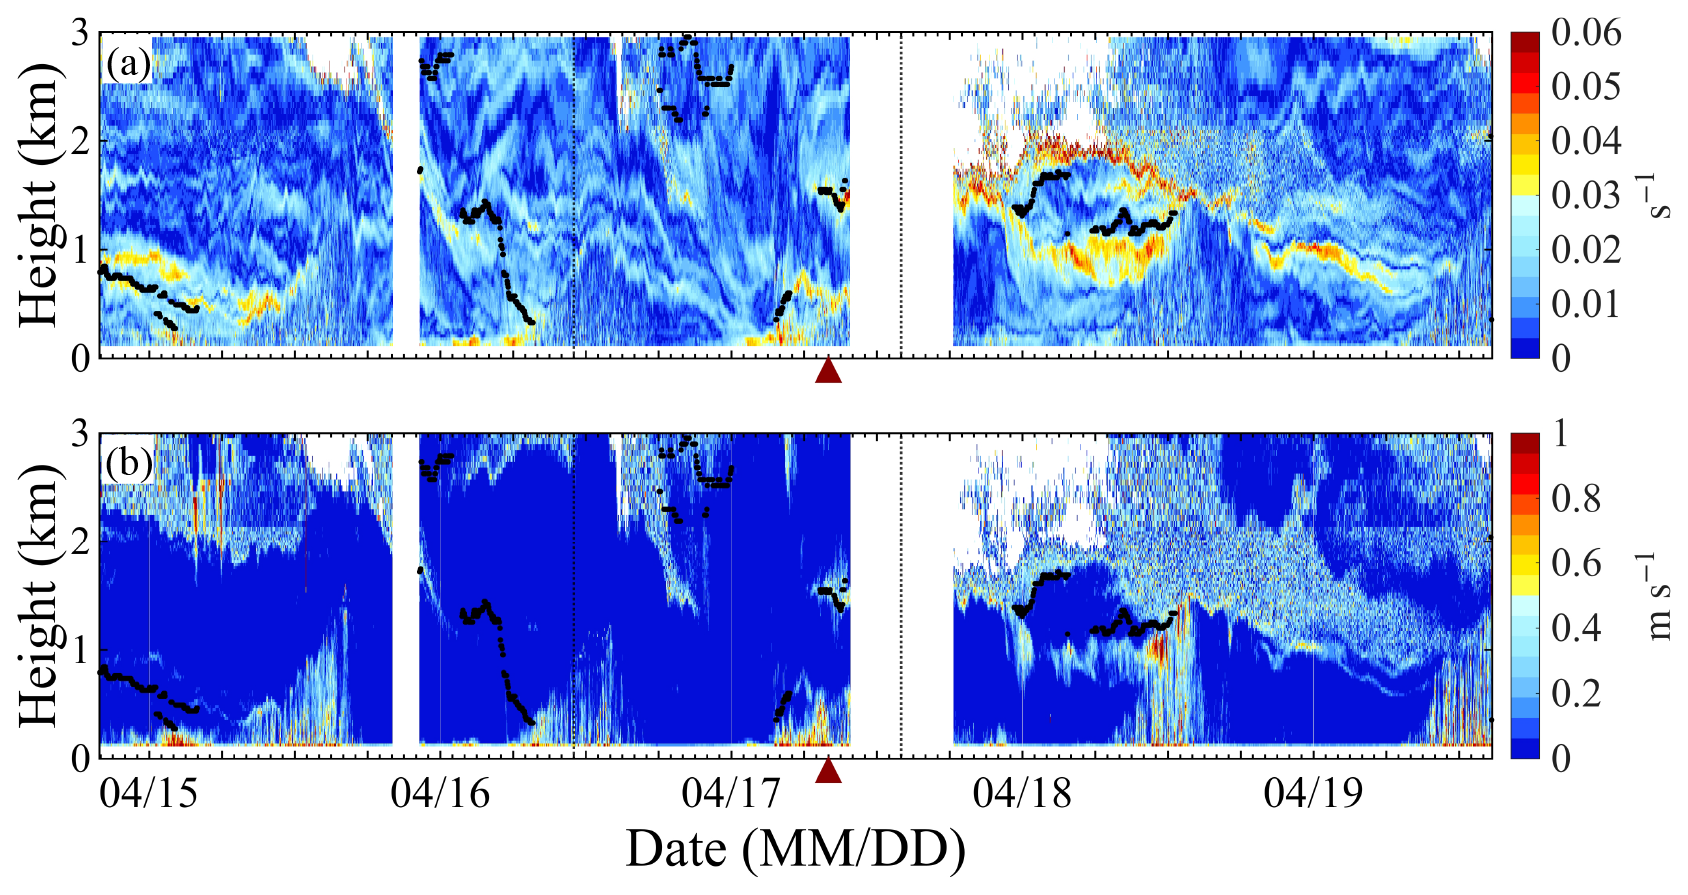
Figure 9Lidar observations from 20:00 LT on 14 April to 15:00 LT on 19 April 2021: (a) vertical wind shear (s−1), and (b) velocity spectral width (m s−1). Black dots indicate the LLJ core height, and the filled dark-red triangle represents the time of peak PM10 concentration. The labels “MM/DD” on the horizontal axis represent the month and day, respectively.
4.3 Impact of LLJs on the vertical wind shear and velocity spectral width
Figure 9 presents the vertical wind shear (s−1) and velocity spectral width (m s−1) retrieved from the Doppler wind lidar during the April 2021 event. Significant wind shear zones (WSZ, >0.02 s−1) and spectral width zones (SWZ, >0.2 m s−1) are analyzed to characterize their evolution in relation to the LLJ. Prior to the dust intrusion, the lower troposphere is characterized by typical diurnal boundary layer evolution. On 15 April, daytime convective mixing dominates, and the upper boundary of the SWZ extends to approximately 1.5 km, coinciding with an increase in ALT. On 16 April, a high-level LLJ (2.7 km) descends and attenuates near 0.3 km by 07:38 LT. During this descent, near surface vertical wind shear exceeding 0.04 s−1 is observed. The SWZ subsequently extends to approximately 1.1 km around 14:00 LT and then contracts. These variations provide the background for the stronger wind shear and spectral width observed during the main dust influence stage.
During the influence stage on 17 April, the LLJ core descends from 2.5 to 0.5 km within three hours. Notably, the WSZ ascends from 0.2 to 1.0 km prior to the jet's descent, with strong near-surface wind shear (>0.04 s−1) appearing at 0.2 km as the jet core reaches 1.0 km. Furthermore, the SWZ expands upward from the surface after the jet core descends to 0.5 km, reaching a maximum height of 0.4 km at 07:30 LT, approximately 30 min before the surface PM10 peak. The simultaneous enhancement of wind shear and spectral width in the lower layer indicates increased dynamical variability and may provide favorable conditions for turbulent mixing. Together with the changes in near surface backscatter and PM10 described in Sect. 4.2, these observations are consistent with a possible contribution from local vertical redistribution. However, the presence of a residual LLJ at 1.5 km late in the event coincides with low backscatter coefficients ( m−1 sr−1), suggesting that dynamic disturbances and aerosol distributions are not necessarily vertically synchronized.
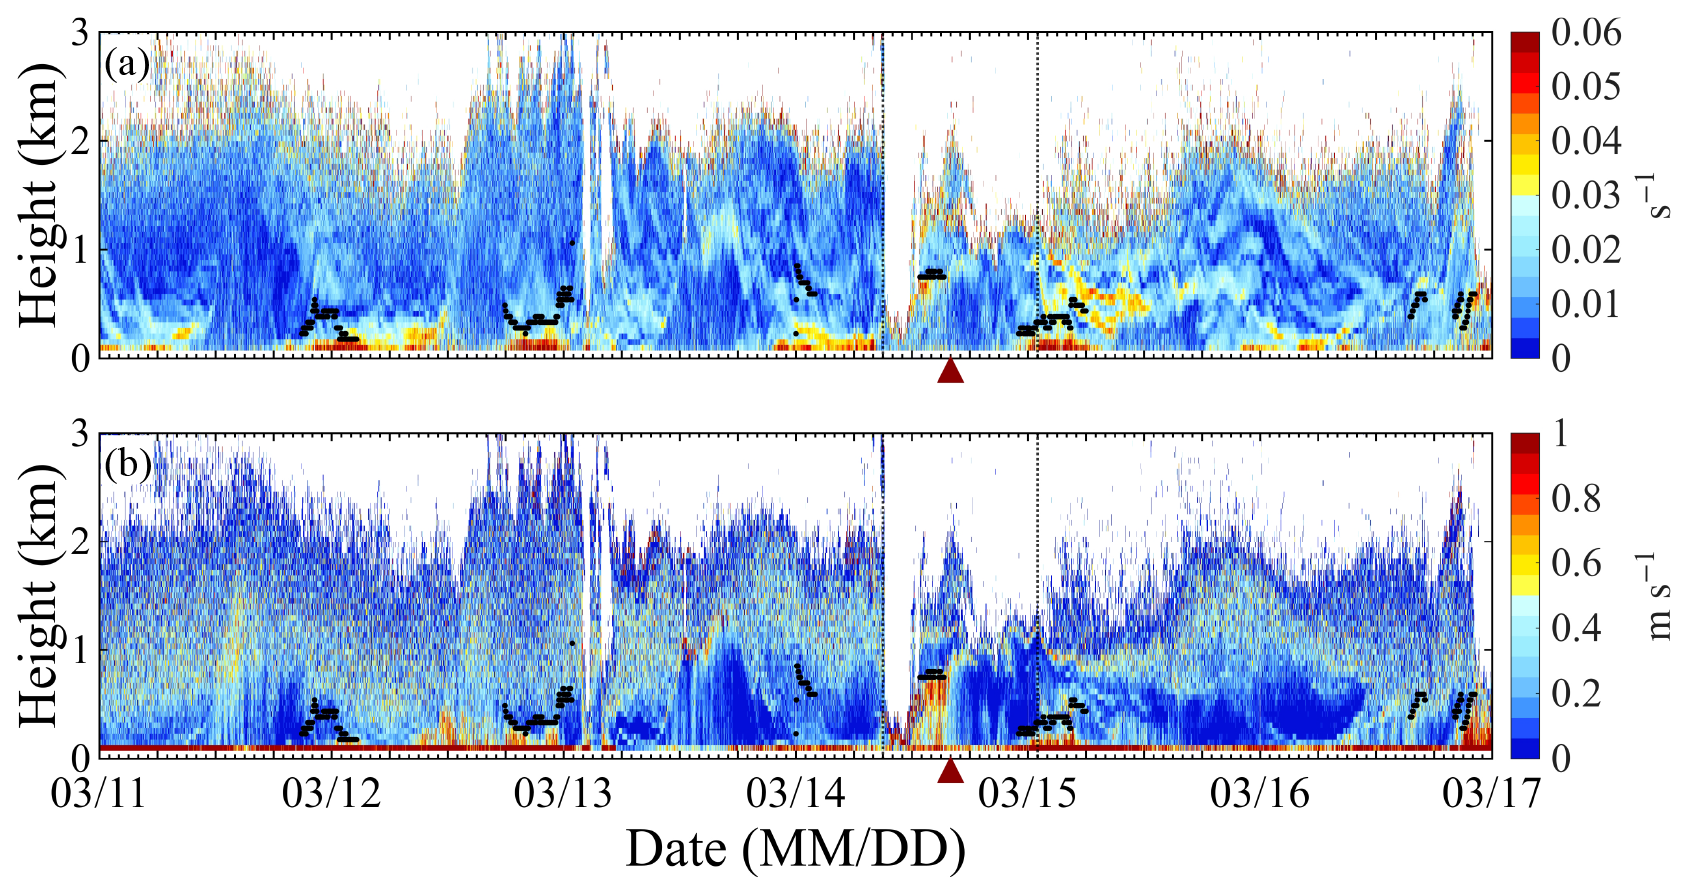
Figure 10Lidar observations from 00:00 local time on 11 March to 00:00 local time on 17 March 2022. Notation follows Fig. 9.
During the post-event stage, the LLJ reappears at 1.5 km, rising to 1.7 km and accompanied by further changes in the vertical structures of wind shear and spectral width. As the jet core subsequently descends and dissipates at 1.3 km by 12:38 LT on 18 April, large spectral width values (>0.8 m s−1) at 1.0 km indicate enhanced Doppler velocity variability during the final stage of LLJ evolution. Following the dissipation, the re-establishment of the WSZ at 1.5 km and the decline of the SWZ toward the surface by 15:00 LT indicate the restoration of typical diurnal boundary-layer characteristics as the influence of the LLJ weakens.
Figure 10 illustrates the vertical wind shear and spectral width for the March 2022 event. To provide a meteorological reference, the pre-event stage (11–13 March) is briefly analyzed, showing a succession of LLJ activities with core heights between 0.2 and 0.4 km. These recurring BLJs coincide with strong spectral width zones that are mainly located below approximately 0.5 km. The persistent enhancement of spectral width contrasts with the weaker variability observed before the April 2021 event.
On 14 March, an initial LLJ is observed from 00:00 to 02:00 LT with an average core height of 0.7 km. Approximately 30 min before it appears, the WSZ height ascends from the near-surface to 0.4 km and maintains a height of 0.3 km until 09:00 LT, even after the jet dissipates. During the dust impact stage, intense spectral width (>0.8 m s−1) is observed at an altitude of 0.5 km, indicating enhanced velocity variability within this layer. Around 12:00 LT, a zone of strong wind shear exceeding 0.06 s−1 rises from below 0.5 to 0.7 km and expands further upward. The simultaneous enhancement of wind shear and spectral width indicates increased dynamical variability in the lower layer and may provide favorable conditions for turbulent mixing. As surface PM10 reaches its peak, the enhanced WSZ contracts toward the near-surface layer (<0.5 km). Between 01:00 and 15:00 LT, recurrent LLJ activity is observed with an average core height of 0.7 km, characterized by substantial wind shear and spectral width below the jet core. This temporal correspondence shows that changes in the BLJ are accompanied by enhanced wind shear and spectral width below the jet core during the dust influence stage.
In the post-event stage, a shallow BLJ reappears near 0.4 km and is accompanied by further adjustments in the vertical distributions of wind shear and spectral width near the surface, after which both gradually weaken. Unlike the rapid descent of the jet core in April 2021, the March 2022 event is characterized by more persistent shallow BLJ activity and repeated enhancements of wind shear and spectral width below the jet core. The contrasting wind structures in the two cases provide the dynamical background for the aerosol layer and surface PM10 evolution described in Sect. 4.2.
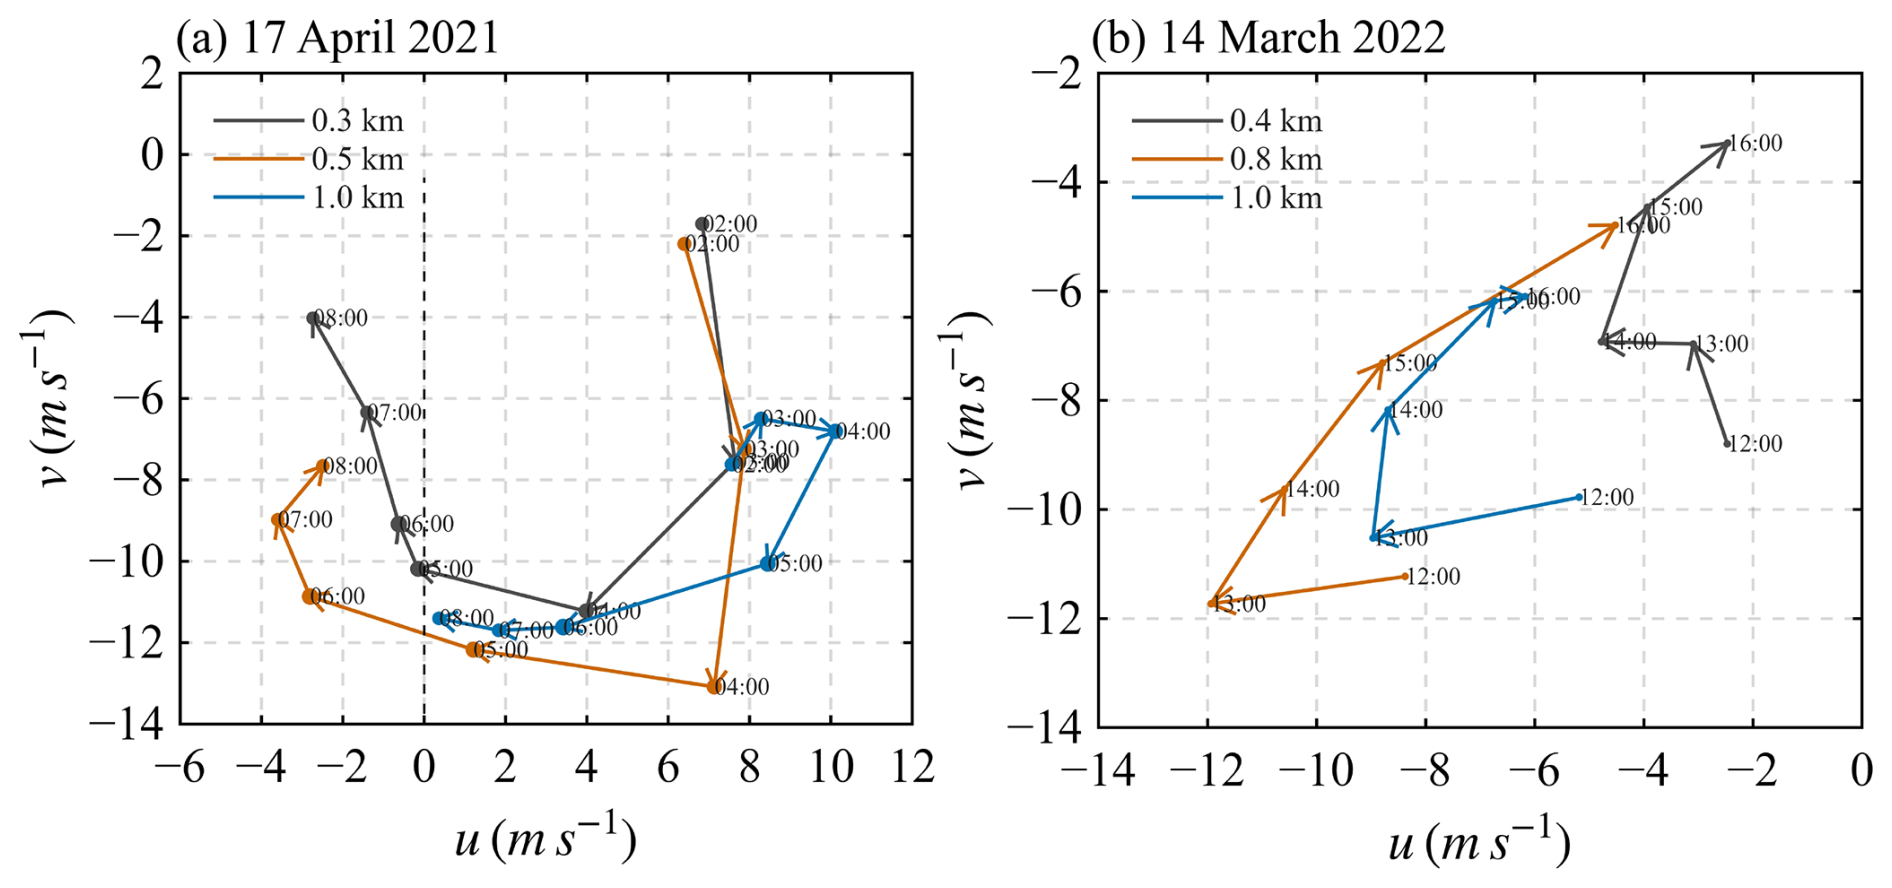
Figure 11Hodographs of horizontal wind vectors (u, v) at representative altitudes during (a) the April 2021 event and (b) the March 2022 event. Numbers adjacent to the vectors denote the Local Time (LT).
4.4 LLJ formation and its relationship with surface pollution peaks
The formation and evolution of LLJs are closely associated with variations in aerosol vertical distribution and surface PM10. To examine the underlying dynamical processes, Fig. 11 presents the wind hodographs (u, v components) during the periods immediately preceding and encompassing the PM10 peaks. Although these cases occur under strong synoptic forcing, the wind vectors at representative altitudes display a characteristic clockwise rotation during their respective periods approaching the peaks. This rotation is qualitatively consistent with a possible contribution from inertial oscillation after frictional coupling with the surface weakens. However, frontal forcing and synoptic wind turning may also contribute to the observed hodograph evolution.
In the April event, lidar observations show a close correspondence between the evolution of the LLJ and changes in aerosol backscatter. The high value region of β in Fig. 6c shifts upward as the jet core rises from 0.3 to 1.0 km during the passage of the deepening cold air mass. While the surface temperature begins to decline, the relatively stable dew point until 08:00 LT (Fig. A3a) suggests that the PM10 peak occurs close to the frontal leading edge. Although the jet core rises, vertical wind shear at its lower interface below 0.5 km remains strong (Fig. 9a). Together with the enhanced spectral width, changes in near surface backscatter, and the evolution of surface PM10, this persistent shear may provide favorable conditions for turbulent mixing and possible local vertical redistribution. The clockwise rotation (Fig. 11a) is qualitatively consistent with a possible inertial oscillation contribution, although the frontal circulation may also affect the wind vector evolution. Because this rotation is more pronounced above the shallow stable layer indicated by ERA5 (Fig. A2a), weakened frictional coupling may partly explain the observed phase evolution of the wind vectors and the sustained vertical wind shear. This dynamical configuration coincides with the initial approach of the cold front. While early cold advection enhances stability near the surface, the relatively shallow stable layer below approximately 0.5 km may still permit exchange between the elevated jet and the lower atmosphere when wind shear remains strong. The PM10 peak at 08:00 LT therefore coincides with a period of relatively strong coupling among the evolving jet, wind shear, aerosol backscatter, and surface pollution, before the jet core rises above the layer with more effective exchange near the surface.
In the March event, the PM10 peak occurs after the persistence of an elevated aerosol layer and subsequent changes in its vertical structure. Unlike the April event, the surface peak at 16:00 LT occurs considerably after the inferred onset of frontal influence, as indicated by the sharp dew point decrease beginning at 08:00 LT (Fig. A3b). This timing shift suggests that the event develops under cold advection following the frontal passage. ERA5 temperature profiles indicate persistent stability between the 900 and 875 hPa pressure levels (Fig. A2b), rather than resolving the exact height or thickness of a capping inversion. Throughout the early afternoon, this stable thermal structure is consistent with weakened vertical exchange, while the low value gap in spectral width from 12:00 to 15:00 LT (Fig. 10b) coincides with the persistence of enhanced aerosol backscatter within the 0.5–1.0 km layer. The stable conditions also coincide with distinct clockwise wind vector rotation above 0.6 km (Fig. 11b), which is qualitatively consistent with weakened frictional coupling and a possible inertial oscillation contribution. These hodograph features should be regarded as indicators of the evolving wind structure rather than direct evidence that inertial oscillation maintains momentum or aerosols within the stable layer. The PM10 peak at 16:00 LT coincides with weakening stability in the lower troposphere and a reorganization of the elevated backscatter structure (Fig. 7c). These simultaneous changes are consistent with a possible contribution from local vertical redistribution to the delayed surface response, although horizontal advection cannot be excluded from the single site observations. The stable thermal structure subsequently strengthens again during the late evening from 17:00 to 21:00 LT.
To facilitate a direct comparison of the temporal evolution of the two events, Table 1 summarizes the major stages and the corresponding changes in LLJ structure, aerosol layer distribution, vertical wind shear, spectral width, ERA5 thermal background, and surface PM10. The table is intended to show the temporal correspondence among these observations and does not imply a single causal relationship. This synthesis highlights that the two dust events represent different coupled evolutions of LLJ structure, aerosol distribution, and boundary layer conditions rather than universal transport pathways.
Table 1Comparison of LLJ, aerosol, wind shear, spectral width, and surface PM10 evolution during the two dust events.
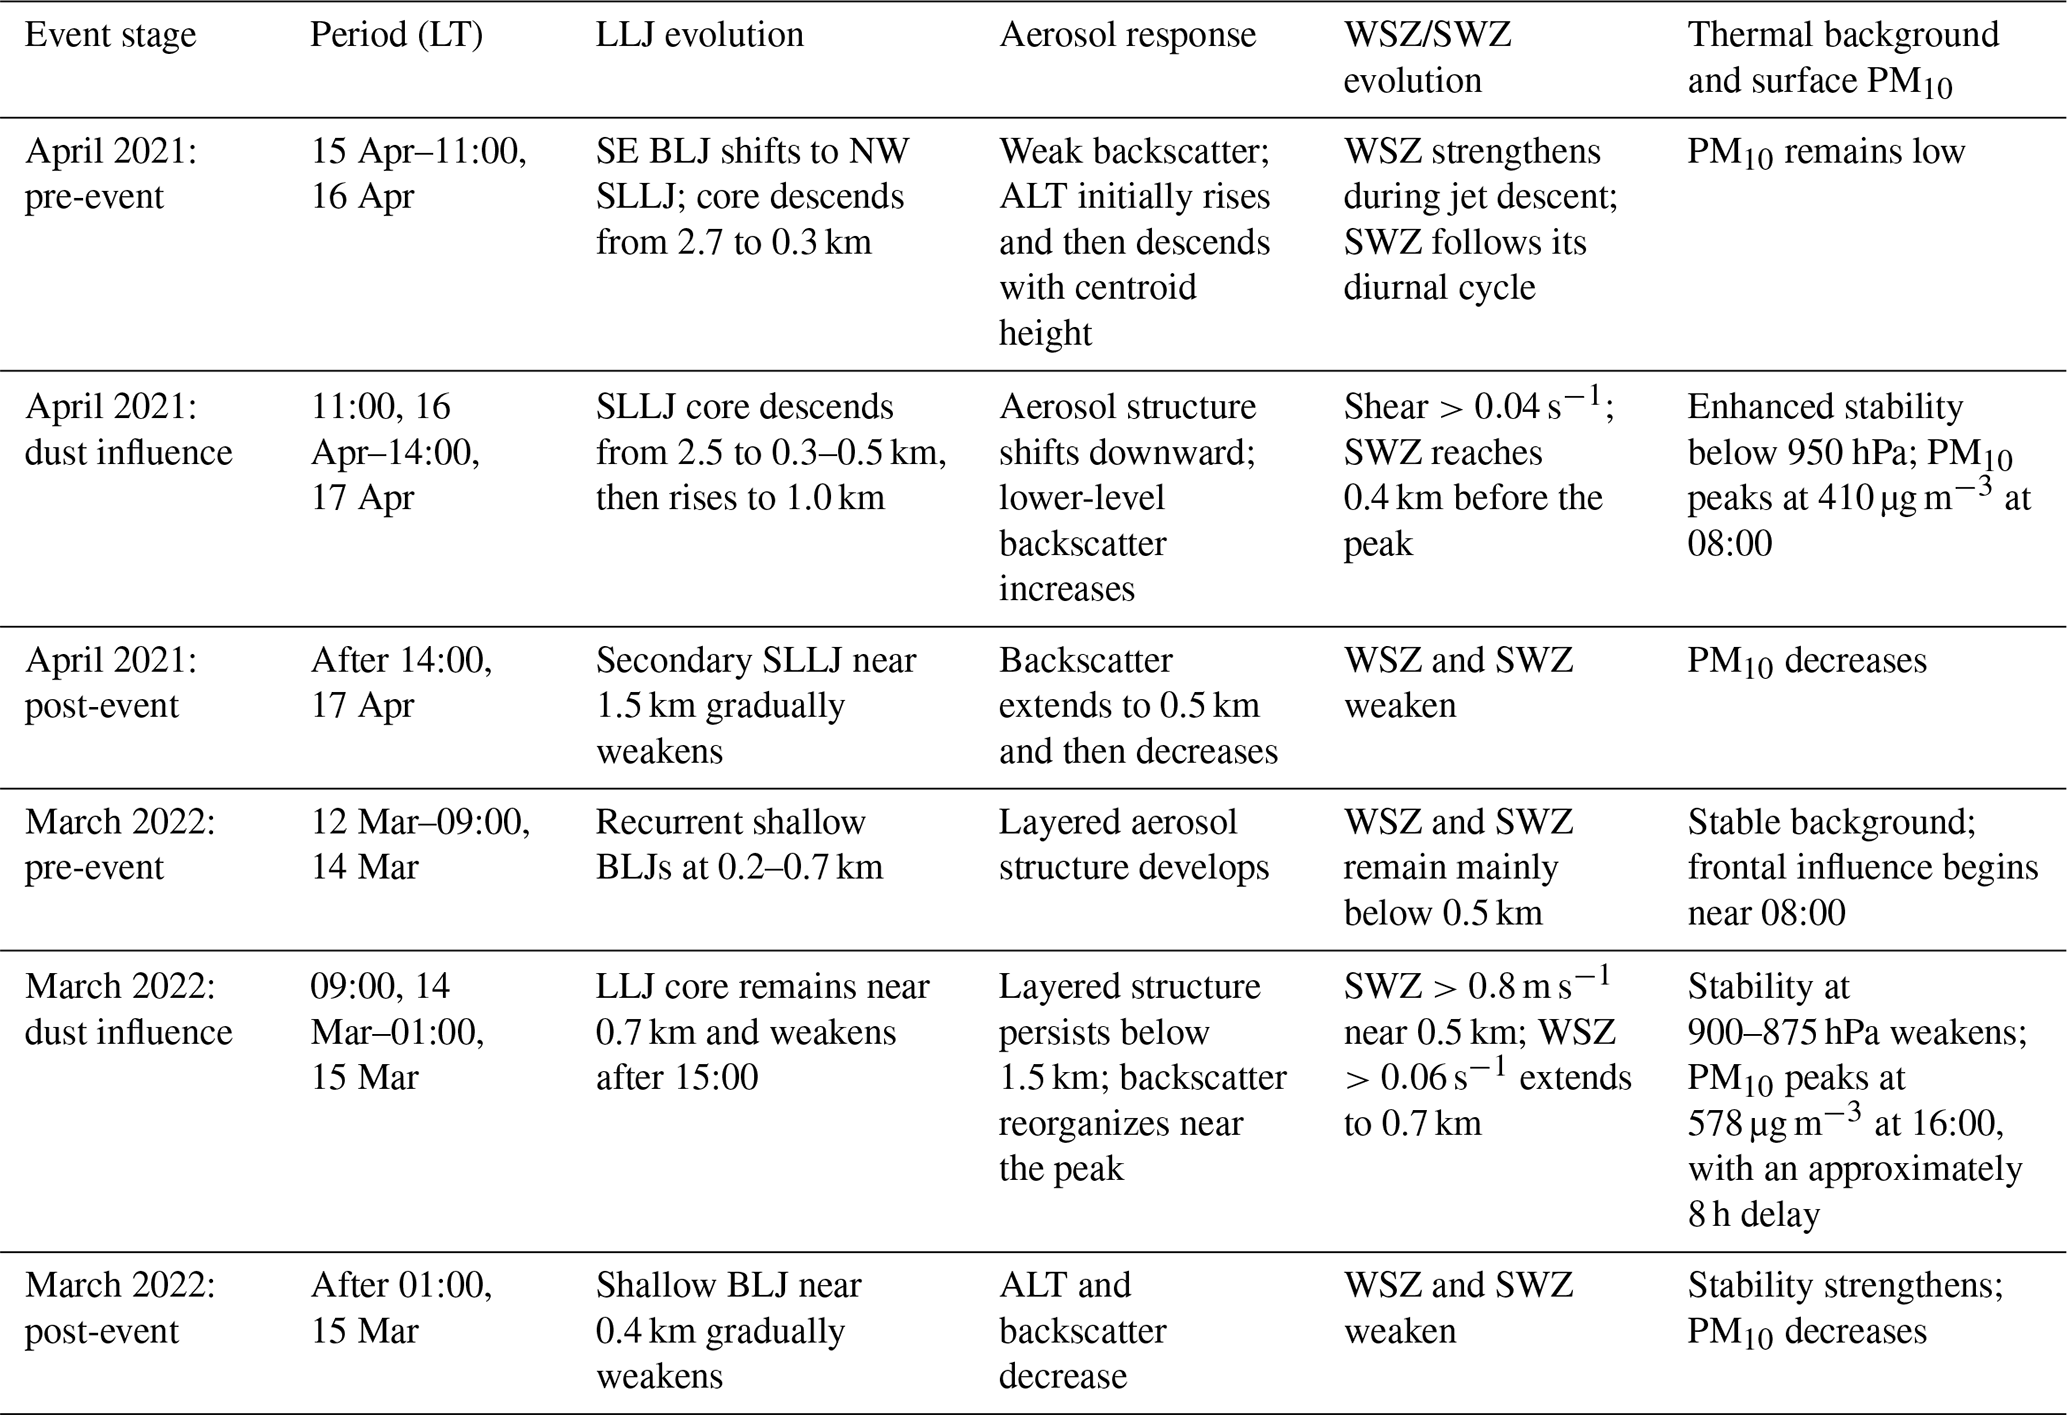
Note: ALT denotes aerosol layer top; WSZ denotes the enhanced wind-shear zone; SWZ denotes the enhanced Doppler velocity spectral-width zone. Heights are given above ground level.
The contrasting observations between the April 2021 and March 2022 episodes highlight different types of LLJ associated aerosol evolution under distinct boundary layer conditions. The April 2021 case is consistent with the downward momentum-flux mechanism described in previous mineral dust studies (Knippertz and Todd, 2012; Fiedler et al., 2013). The rapid evolution of the SLLJ core, enhanced wind shear near the jet interface, and concurrent changes in aerosol backscatter structure suggest that dynamical mixing may have contributed to the observed increase in surface PM10. However, the relative contributions of local vertical redistribution and horizontal advection cannot be separated using single site observations. In contrast, the March 2022 event represents a case in which elevated aerosol layers persisted under relatively stable lower tropospheric conditions and a relatively stable LLJ structure. The stable stratification limits vertical exchange and may have contributed to the delayed surface PM10 response during the horizontal transport of dust aerosols. This phenomenon is consistent with the barrier effect described in previous studies (Ren et al., 2022), in which stable layers can inhibit vertical mixing and maintain elevated aerosol layers above the surface. In this study, ERA5 thermal profiles are used to characterize the background thermal conditions and do not directly resolve the detailed structure or evolution of shallow inversion layers.
These results highlight the importance of considering the timing of surface pollution peaks relative to synoptic forcing and LLJ evolution. While surface dust enhancement is often attributed to the immediate passage of cold fronts or strong surface winds, the approximately 8 h delay observed in the March 2022 event indicates that the persistence of elevated aerosol layers and boundary layer conditions can strongly influence the timing of surface pollution responses. Compared with previous studies that mainly relied on surface observations or discrete soundings, high resolution Doppler lidar observations provide continuous profiles of wind and aerosol structures. Such observations help capture transient changes between elevated aerosol layers and surface pollution responses that may be missed by conventional observations with limited temporal resolution (Pichugina et al., 2017; Wang et al., 2026).
The wind vector evolution in the hodographs provides additional information on the changing dynamical environment of dust bearing LLJs. The clockwise rotation of wind vectors is qualitatively consistent with the inertial oscillation framework proposed by Blackadar (1957), which may occur after the boundary layer becomes partially decoupled from surface friction. However, the observed rotation cannot be attributed solely to inertial oscillation because frontal evolution and synoptic wind changes may also contribute to the hodograph changes. In the April 2021 event, this dynamical evolution occurs together with rapid changes in LLJ structure and aerosol distribution, whereas in the March 2022 event, the persistent wind rotation occurs during a period of elevated aerosol storage under stable conditions. These results suggest that LLJ evolution provides an important dynamical context for aerosol redistribution rather than acting as an independent controlling factor.
This event based perspective may help explain why downstream regions such as the Jiang-Huai Plain can experience severe pollution even after the strongest synoptic forcing weakens. The different responses observed here also contrast with previous studies in Beijing, where LLJs were often associated with pollutant dilution (Miao et al., 2019), indicating that the impact of LLJs on air quality depends on the surrounding thermal structure, wind evolution, and aerosol distribution. Such high-resolution observations are valuable for improving the representation of boundary layer processes in numerical models, which have been shown to underestimate LLJ strength and its influence on air quality (Sandu et al., 2013; Wei et al., 2023).
From a measurement perspective, this study also demonstrates the value of CDWL for resolving the coupled evolution of jet structure, wind shear, spectral width, and aerosol backscatter at event scale. The continuous high-resolution profiles provide information that cannot be captured by conventional surface observations or discrete soundings alone, particularly during short-lived transitions between elevated transport, downward mixing, and temporary aerosol storage. These observations provide useful constraints for improving the representation of boundary layer processes in numerical weather prediction and air quality models.
This study investigates the contrasting roles of LLJ evolution in aerosol vertical redistribution during two dust episodes in Hefei, utilizing high-resolution Doppler wind lidar observations. The results reveal two contrasting patterns of LLJ-associated aerosol evolution under distinct boundary layer conditions in the two dust events. In the April 2021 event, the observations are consistent with a dynamic injection process associated with rapid LLJ evolution and enhanced lower level wind shear. The northwesterly jet core exhibits a pronounced vertical migration, descending from 2.5 to 0.3 km before re-ascending to around 1.0 km during the peak period, tracking the advancing cold front. This evolution generates intense wind shear exceeding 0.04 s−1 at the jet's lower interface, which may contribute to enhanced dynamical mixing conditions and local downward redistribution of aerosols. The backscatter profiles are consistent with this interpretation, showing enhanced vertical variation of aerosol backscatter during the peak stage and concurrent changes in aerosol layer structure. Consequently, the surface PM10 peak (410 µg m−3) exhibits little temporal delay relative to the frontal signal, with the rapid surface response occurring during a period of strong coupling among LLJ evolution, wind shear, aerosol structure, and surface pollution.
In contrast, the March 2022 event represents a stratified transport condition associated with persistent aerosol layers and stable lower tropospheric conditions. Here, the LLJ maintains a stable altitude (∼ 0.7 km), while ERA5 temperature profiles indicate persistent stability between 900 and 875 hPa, providing a thermal background for reduced vertical exchange rather than directly defining the structure of a capping inversion. Under these conditions, aerosols remain within an elevated layer during horizontal advection. The backscatter profiles exhibit a persistent multi-layered structure across the pre-peak and dust influence stages, further illustrating this vertical confinement. This configuration results in an approximately 8 h phase lag between the surface frontal signal and the PM10 peak (578 µg m−3). The peak occurs together with weakening stability and reorganization of the elevated aerosol structure, suggesting a possible contribution from local vertical redistribution to the delayed surface response.
The clockwise rotation of wind vectors in hodographs provides additional evidence of evolving wind structures during periods of reduced surface friction. This rotation is qualitatively consistent with a possible inertial oscillation contribution, although frontal evolution and synoptic wind changes may also influence the observed wind evolution. By resolving fine-scale temporal transitions in vertical wind shear, spectral width, and aerosol backscatter, this study provides observational evidence of the coupled evolution of LLJ structures and aerosol vertical distributions during dust events. These findings indicate that LLJ evolution is associated with different aerosol responses depending on LLJ structure, atmospheric stability, and the stage of the pollution event, including rapid surface responses and delayed redistribution processes. These observations provide useful constraints for improving boundary layer parameterizations in numerical models. Future work should leverage multi-site lidar networks to statistically validate the prevalence of these processes and assess their broader implications for regional air quality under varying synoptic conditions.
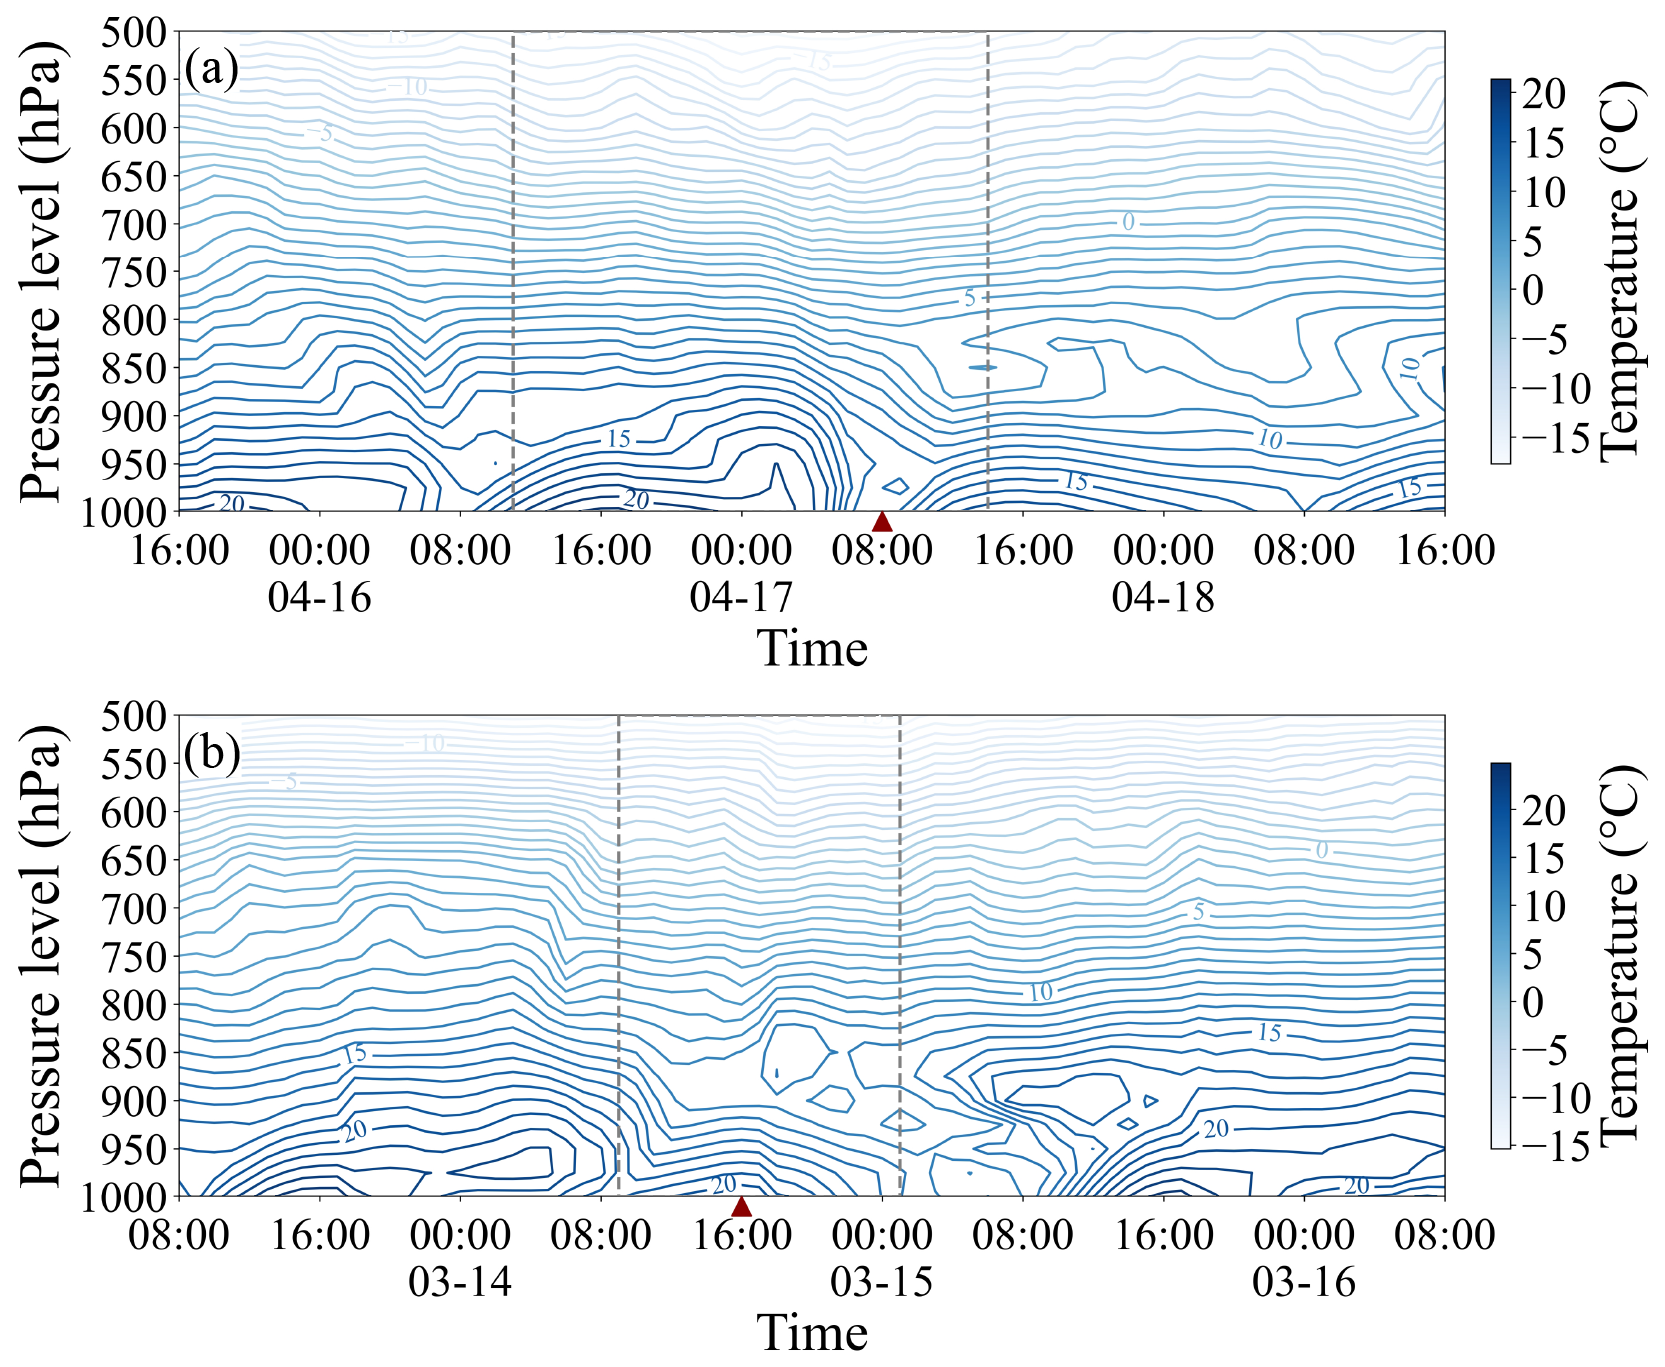
Figure A1Time-pressure cross sections of temperature (isotherms) during the dust events. Gray dashed boxes denote the duration of the dust episodes, and dark-red triangles mark the timing of the peak PM10 concentration. (a) 15–18 April 2021; (b) 13–16 March 2022. All data are retrieved from the ERA5 hourly reanalysis datasets (0.25°×0.25°).
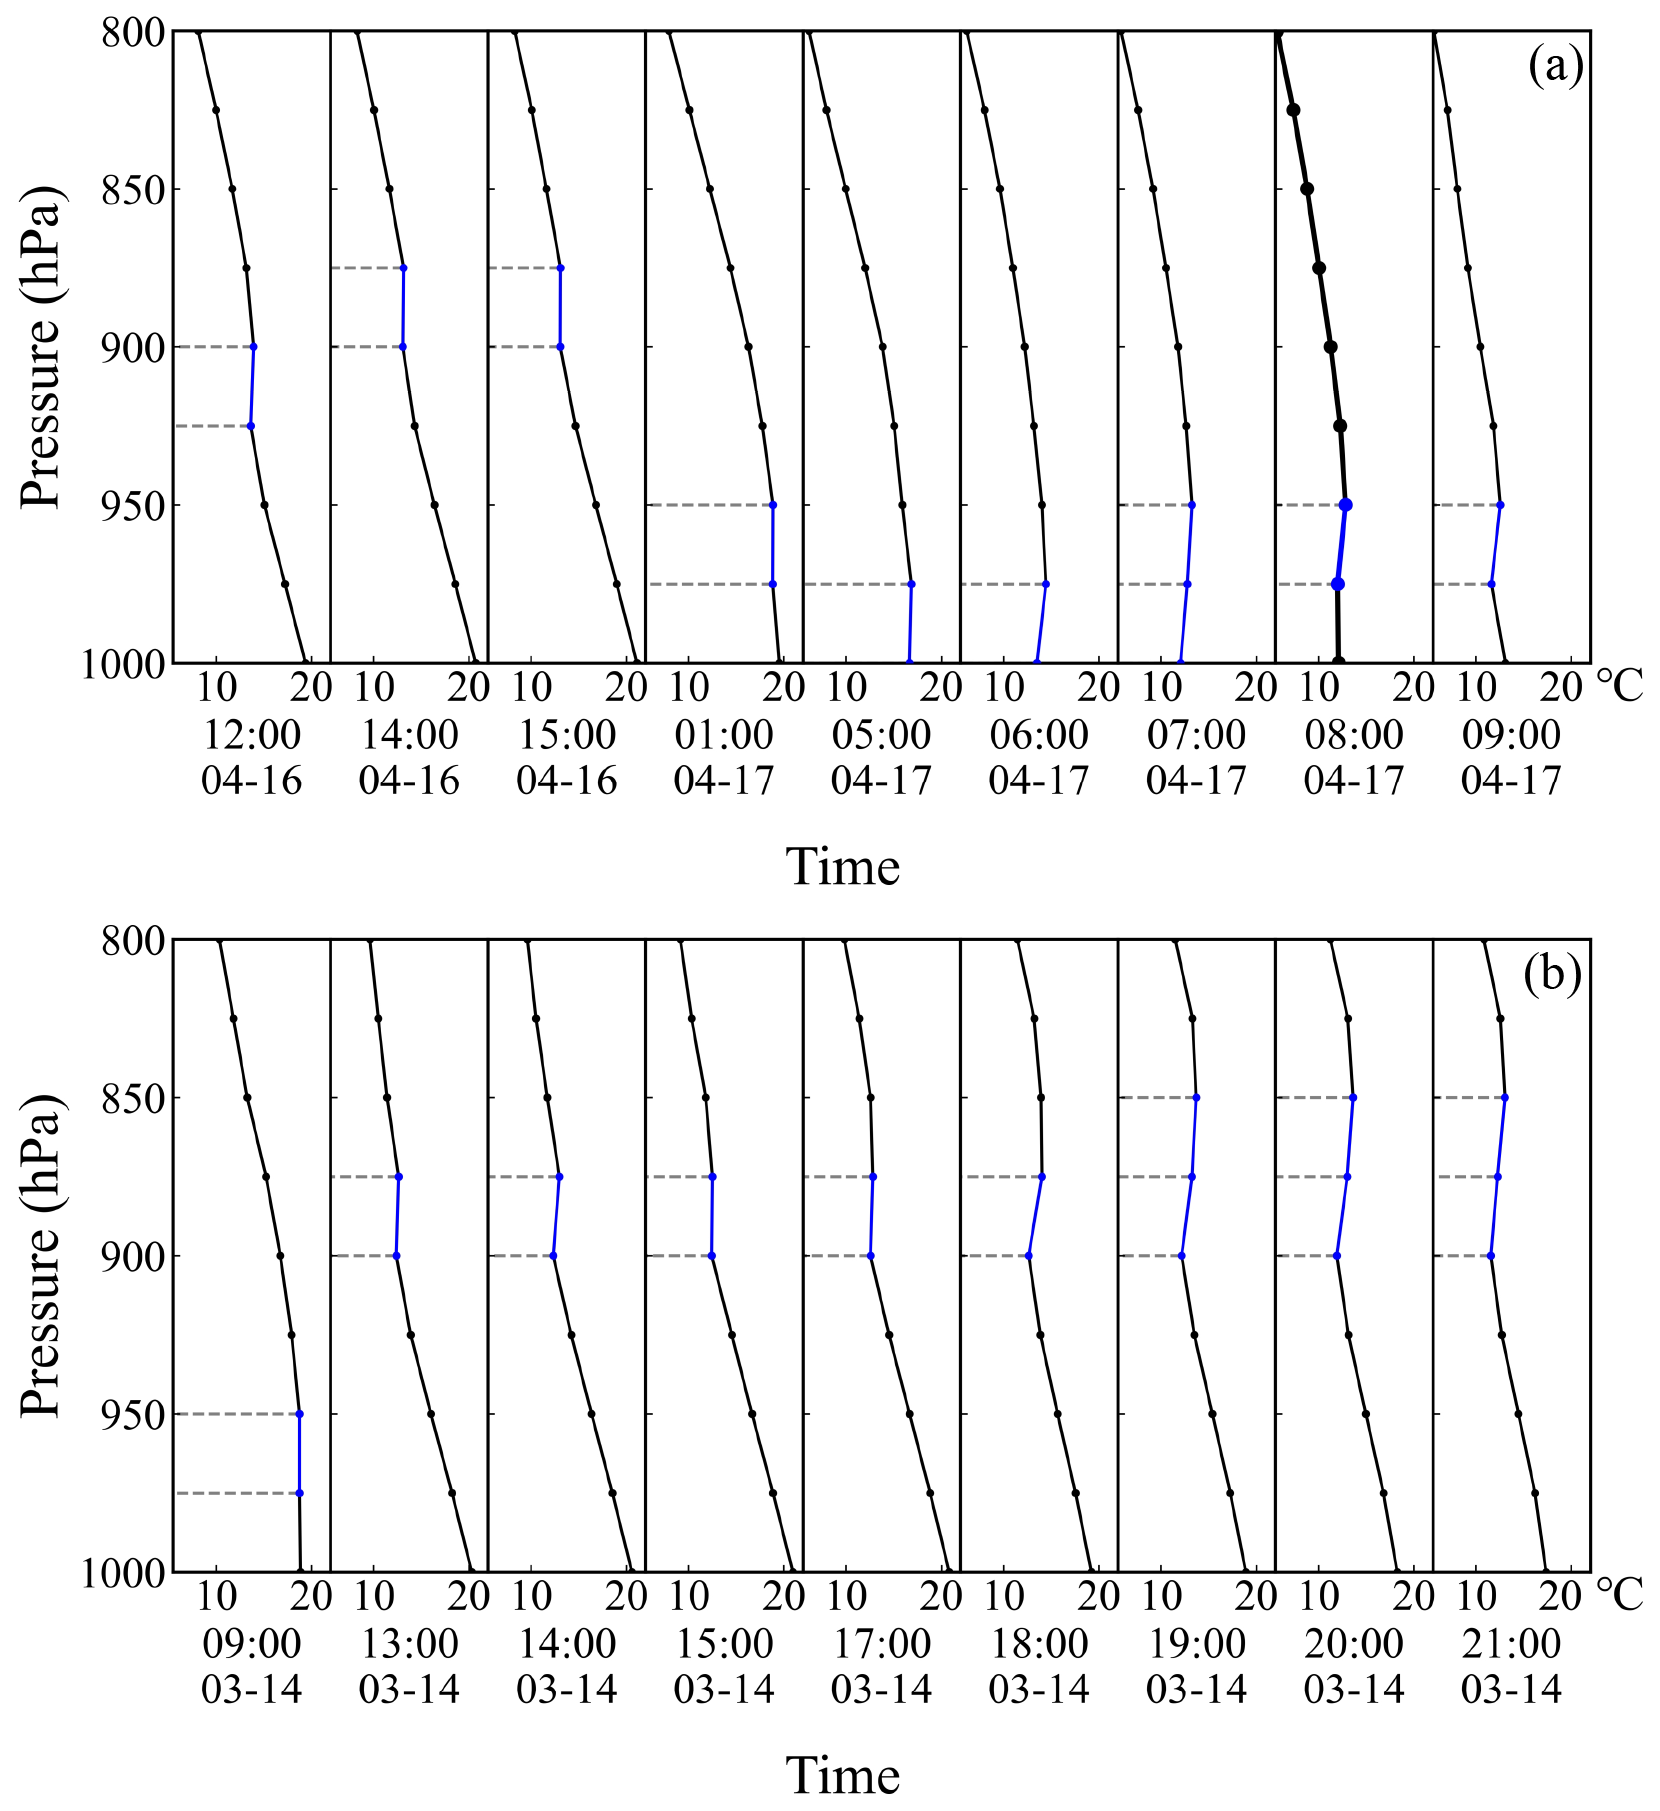
Figure A2Evolution of the ERA5-derived lower-tropospheric thermal structure during the dust events. (a) 16–17 April 2021; (b) 14 March 2022. All data are retrieved from the ERA5 hourly reanalysis datasets (0.25°×0.25°).
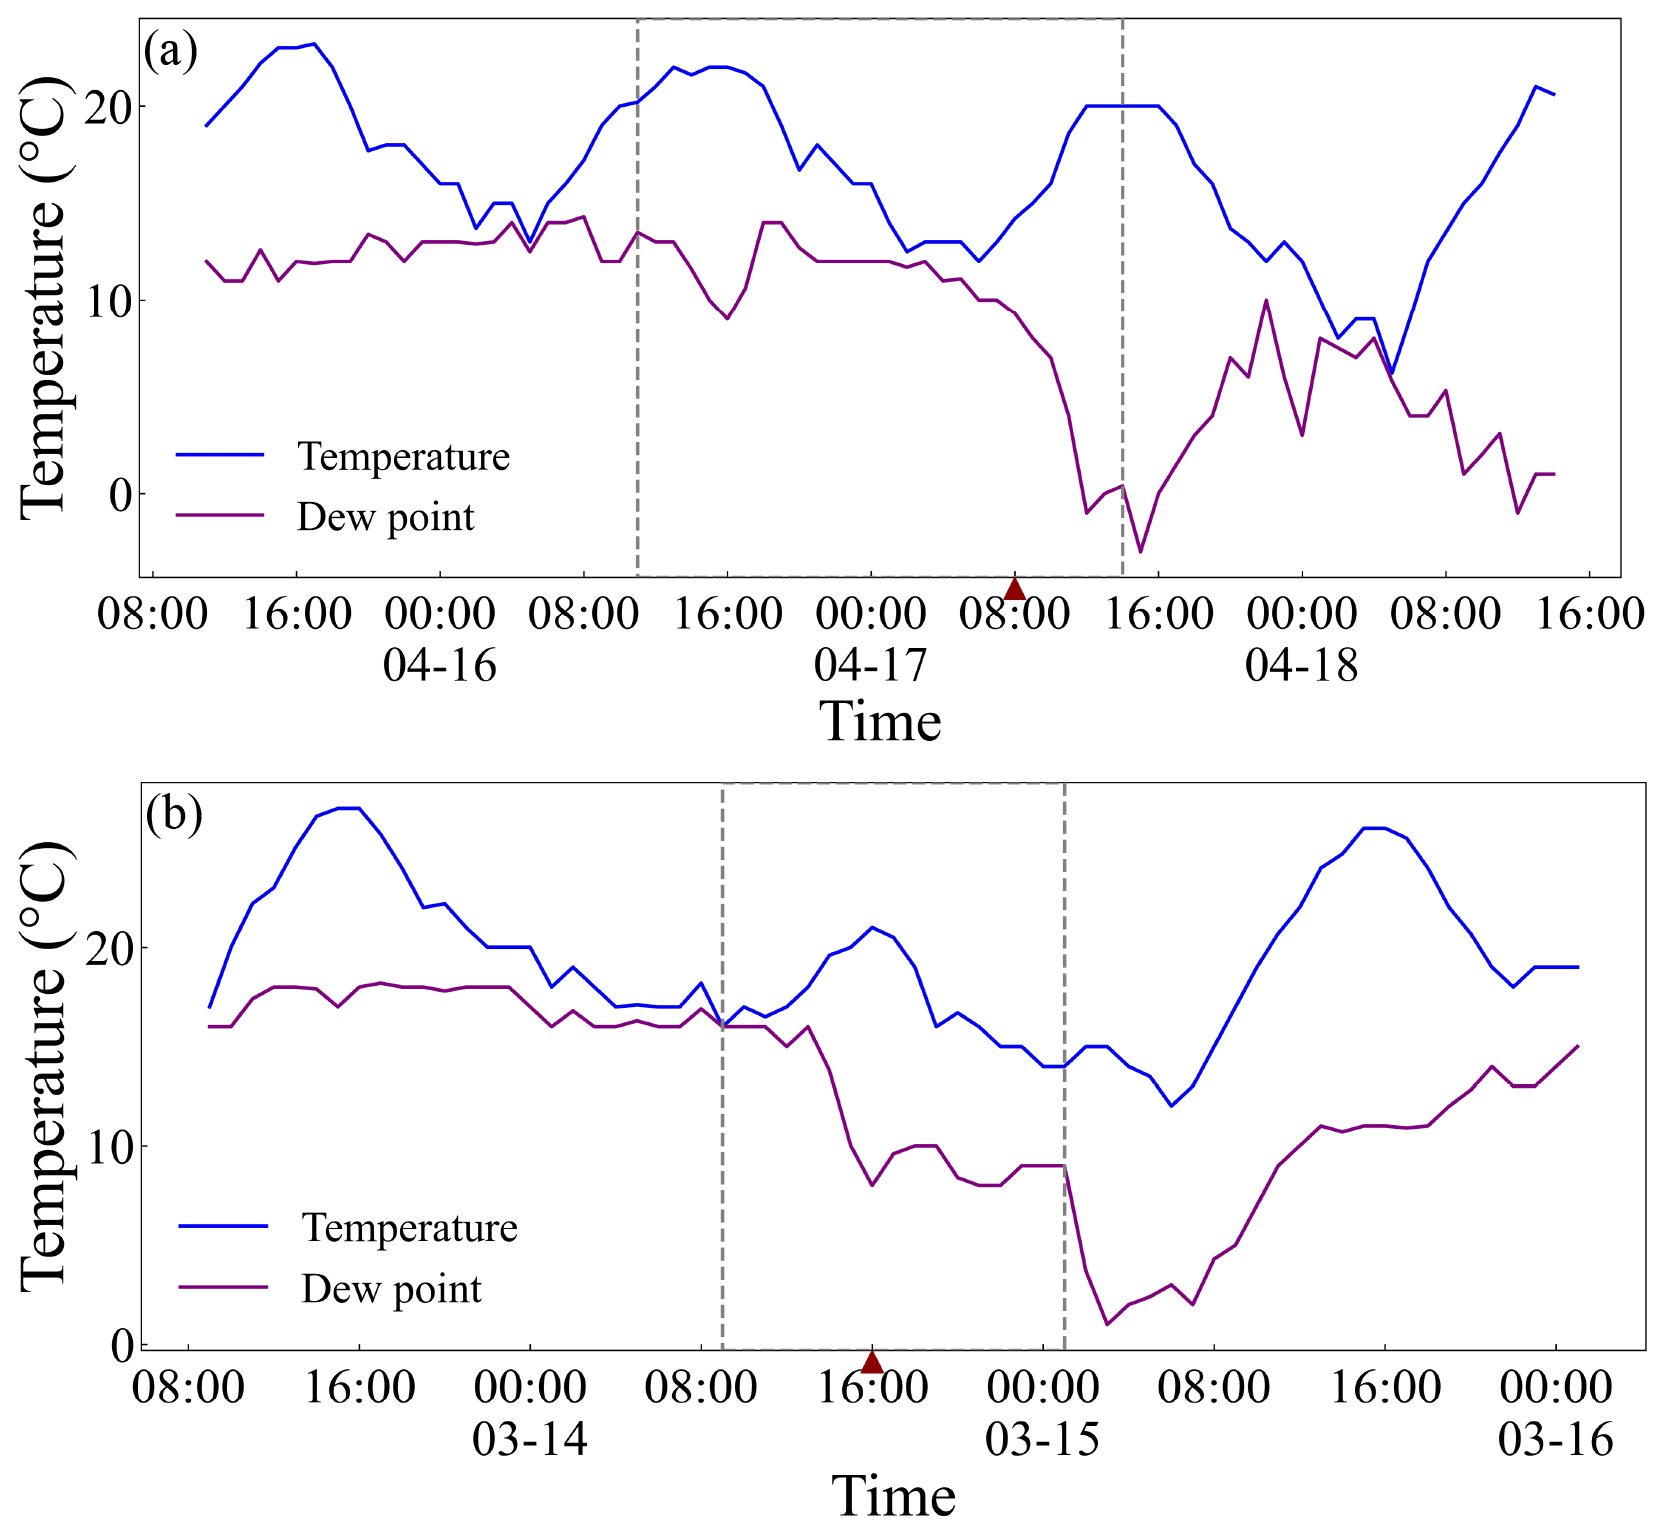
Figure A3Hourly variations of surface air temperature and dew point temperature during the dust events. Gray dashed boxes denote the duration of the dust episodes, and dark-red triangles mark the timing of the peak PM10 concentration. (a) 15–18 April 2021; (b) 13–16 March 2022. All data are extracted from meteorological station (ID: 58321) in Hefei city.
No custom model code or dedicated analysis software was developed for this study. The Doppler wind lidar data used in this study are available from the corresponding author (Mengya Wang: wmengya123@nuist.edu.cn) upon reasonable request for non-commercial research purposes. The data include the processed wind profiles, attenuated backscatter coefficient, vertical wind shear, and spectral width for the two dust episodes analyzed in this study. The ERA5 reanalysis data are publicly available from the ECMWF Climate Data Store (https://doi.org/10.24381/cds.bd0915c6, Hersbach et al., 2023). Ambient air quality data are available from the China National Environmental Monitoring Center (CNEMC, http://www.cnemc.cn/, last access: 16 September 2026). Surface meteorological data are available from the National Meteorological Information Center (NMIC, http://data.cma.cn/, last access: 16 September 2026).
Tianle Bai: Methodology, Data curation, Formal analysis, Visualization, Writing – original draft. Yuanyi Lin: Formal analysis, Visualization, Writing – original draft. Mengya Wang: Conceptualization, Methodology, Investigation, Writing – review & editing, Validation. Tianwen Wei: Methodology, Resources, Data curation. Fangzhi Wei: Resources, Data curation. Kuancheng Lv: Resources, Data curation. Haiyun Xia: Supervision, Resources, Validation.
The contact author has declared that none of the authors has any competing interests.
Publisher's note: Copernicus Publications remains neutral with regard to jurisdictional claims made in the text, published maps, institutional affiliations, or any other geographical representation in this paper. The authors bear the ultimate responsibility for providing appropriate place names. Views expressed in the text are those of the authors and do not necessarily reflect the views of the publisher.
The authors thank the China National Environmental Monitoring Center (CNEMC) and the National Meteorological Information Center (NMIC) for providing the air quality and surface meteorological data used in this study. The authors are grateful to the ECMWF for making the ERA5 reanalysis datasets publicly available. We also acknowledge the support of the School of Atmospheric Physics, Nanjing University of Information Science and Technology, for providing the research infrastructure.
This work was supported in part by the Project of the National Key Laboratory of Climate System Prediction and Change Response (CPRM-2025-NUIST-012).
This paper was edited by Daniel Perez-Ramirez and reviewed by two anonymous referees.
Andújar-Maqueda, J., Ortiz-Amezcua, P., Demoz, B., Roots, M., Abril-Gago, J., Pandey, S., Pérez-Ramírez, D., Alados-Arboledas, L., and Guerrero-Rascado, J. L.: Doppler lidar observations of low-level jets and wind maxima over urban complex terrain in the southeastern Iberian Peninsula, Urban Clim., 65, 102744, https://doi.org/10.1016/j.uclim.2025.102744, 2026.
Banakh, V. A., Brewer, A., Pichugina, E. L., and Smalikho, I. N.: Measurements of wind velocity and direction with coherent Doppler lidar in conditions of a weak echo signal, Atmos. Oceanic Opt., 23, 381–388, https://doi.org/10.1134/S1024856010050076, 2010.
Banakh, V. A., Smalikho, I. N., and Falits, A. V.: Estimation of the turbulence energy dissipation rate in the atmospheric boundary layer from measurements of the radial wind velocity by micropulse coherent Doppler lidar, Opt. Express, 25, 22679–22692, https://doi.org/10.1364/oe.25.022679, 2017.
Banta, R. M., Newsom, R. K., Lundquist, J. K., Pichugina, Y. L., Coulter, R. L., and Mahrt, L.: Nocturnal low-level jet characteristics over Kansas during CASES-99, Bound.-Lay. Meteorol., 105, 221–252, https://doi.org/10.1023/A:1019992330866, 2002.
Beu, C. M. L. and Landulfo, E.: Turbulence kinetic energy dissipation rate estimate for a low-level jet with Doppler lidar data: A case study, Earth Interact., 26, 112–121, https://doi.org/10.1175/EI-D-20-0027.1, 2022.
Blackadar, A. K.: Boundary layer wind maxima and their significance for the growth of nocturnal inversions, B. Am. Meteorol. Soc., 38, 283–290, https://doi.org/10.1175/1520-0477-38.5.283, 1957.
Chen, G., Wang, W.-C., and Chen, J.-P.: Circulation responses to regional aerosol climate forcing in summer over East Asia, Clim. Dynam., 51, 3973–3984, https://doi.org/10.1007/s00382-018-4267-3, 2018.
Dieudonné, E., Delbarre, H., Sokolov, A., Ebojie, F., Augustin, P., and Fourmentin, M.: Characteristics of the low-level jets observed over Dunkerque (North Sea French Coast) using 4 years of wind lidar data, Q. J. Roy. Meteor. Soc., 149, 1745–1768, https://doi.org/10.1002/qj.4480, 2023.
Du, Y., Zhang, Q., Chen, Y.-L., Zhao, Y., and Wang, X.: Numerical simulations of spatial distributions and diurnal variations of low-level jets in China during early summer, J. Climate, 27, 5747–5767, https://doi.org/10.1175/JCLI-D-13-00571.1, 2014.
Fiedler, S., Schepanski, K., Heinold, B., Knippertz, P., and Tegen, I.: Climatology of nocturnal low-level jets over North Africa and implications for modeling mineral dust emission, J. Geophys. Res.-Atmos., 118, 6100–6121, https://doi.org/10.1002/jgrd.50394, 2013.
Frehlich, R.: Coherent Doppler lidar signal covariance including wind shear and wind turbulence, Appl. Optics, 33, 6472–6481, https://doi.org/10.1364/AO.33.006472, 1994.
Guo, J., Miao, Y., Zhang, Y., Liu, H., Li, Z., Zhang, W., He, J., Lou, M., Yan, Y., Bian, L., and Zhai, P.: The climatology of planetary boundary layer height in China derived from radiosonde and reanalysis data, Atmos. Chem. Phys., 16, 13309–13319, https://doi.org/10.5194/acp-16-13309-2016, 2016.
Gutierrez, W., Ruiz-Columbie, A., Tutkun, M., and Castillo, L.: Impacts of the low-level jet's negative wind shear on the wind turbine, Wind Energ. Sci., 2, 533–545, https://doi.org/10.5194/wes-2-533-2017, 2017.
Heinold, B., Knippertz, P., Marsham, J. H., Fiedler, S., Dixon, N. S., Schepanski, K., Laurent, B., and Tegen, I.: The role of deep convection and nocturnal low-level jets for dust emission in summertime West Africa: Estimates from convection-permitting simulations, J. Geophys. Res.-Atmos., 118, 4385–4400, https://doi.org/10.1002/jgrd.50402, 2013.
Heinold, B., Knippertz, P., and Beare, R. J.: Idealized large-eddy simulations of nocturnal low-level jets over subtropical desert regions and implications for dust-generating winds, Q. J. Roy. Meteor. Soc., 141, 1740–1752, https://doi.org/10.1002/qj.2475, 2015.
Hersbach, H., Bell, B., Berrisford, P., Hirahara, S., Horányi, A., Muñoz-Sabater, J., Nicolas, J., Peubey, C., Radu, R., Schepers, D., Simmons, A., Soci, C., Abdalla, S., Abellan, X., Balsamo, G., Bechtold, P., Biavati, G., Bidlot, J., Bonavita, M., De Chiara, G., Dahlgren, P., Dee, D., Diamantakis, M., Dragani, R., Flemming, J., Forbes, R., Fuentes, M., Geer, A., Haimberger, L., Healy, S., Hogan, R. J., Hólm, E., Janisková, M., Keeley, S., Laloyaux, P., Lopez, P., Lupu, C., Radnoti, G., De Rosnay, P., Rozum, I., Vamborg, F., Villaume, S., and Thépaut, J.-N.: The ERA5 global reanalysis, Q. J. Roy. Meteor. Soc., 146, 1999–2049, https://doi.org/10.1002/qj.3803, 2020.
Hersbach, H., Bell, B., Berrisford, P., Biavati, G., Horányi, A., Muñoz Sabater, J., Nicolas, J., Peubey, C., Radu, R., Rozum, I., Schepers, D., Simmons, A., Soci, C., Dee, D., and Thépaut, J.-N.: ERA5 hourly data on pressure levels from 1940 to present, Copernicus Climate Change Service (C3S) Climate Data Store (CDS) [data set], https://doi.org/10.24381/cds.bd0915c6, 2023.
Huang, T., Yim, S. H., Yang, Y., Lee, O. S., Lam, D. H., Cheng, J. C., and Guo, J.: Observation of turbulent mixing characteristics in the typical daytime cloud-topped boundary layer over Hong Kong in 2019, Remote Sens., 12, 1533, https://doi.org/10.3390/rs12091533, 2020a.
Huang, T., Li, Y., Cheng, J. C. H., Haywood, J., Hon, K. K., Lam, D. H. Y., Lee, O. S. M., Lolli, S., O'Connor, E. J., Lee, H. F., Wang, M., and Yim, S. H. L.: Assessing transboundary-local aerosols interaction over complex terrain using a Doppler LiDAR network, Geophys. Res. Lett., 48, e2021GL093238, https://doi.org/10.1029/2021GL093238, 2021a.
Huang, T., Yang, Y., O'Connor, E. J., Lolli, S., Haywood, J., Osborne, M., Cheng, J. C. H., Guo, J., and Yim, S. H. L.: Influence of a weak typhoon on the vertical distribution of air pollution in Hong Kong: A perspective from a Doppler LiDAR network, Environ. Pollut., 276, 116534, https://doi.org/10.1016/j.envpol.2021.116534, 2021b.
Huang, X., Ding, A., Wang, Z., Ding, K., Gao, J., Chai, F., and Fu, C.: Amplified transboundary transport of haze by aerosol–boundary layer interaction in China, Nat. Geosci., 13, 428–434, https://doi.org/10.1038/s41561-020-0583-4, 2020b.
Iwai, H., Murayama, Y., Ishii, S., Mizutani, K., Ohno, Y., and Hashiguchi, T.: Strong updraft at a sea-breeze front and associated vertical transport of near-surface dense aerosol observed by Doppler lidar and ceilometer, Bound.-Lay. Meteorol., 141, 117–142, https://doi.org/10.1007/s10546-011-9635-z, 2011.
Jia, M., Yuan, J., Wang, C., Xia, H., Wu, Y., Zhao, L., Wei, T., Wu, J., Wang, L., Gu, S.-Y., Liu, L., Lu, D., Chen, R., Xue, X., and Dou, X.: Long-lived high-frequency gravity waves in the atmospheric boundary layer: observations and simulations, Atmos. Chem. Phys., 19, 15431–15446, https://doi.org/10.5194/acp-19-15431-2019, 2019.
Knippertz, P. and Todd, M. C.: Mineral dust aerosols over the Sahara: meteorological controls on emission and transport and implications for modeling, Rev. Geophys., 50, 2011RG000362, https://doi.org/10.1029/2011RG000362, 2012.
Kok, J. F., Storelvmo, T., Karydis, V. A., Adebiyi, A. A., Mahowald, N. M., Evan, A. T., He, C., and Leung, D. M.: Mineral dust aerosol impacts on global climate and climate change, Nat. Rev. Earth Environ., 4, 71–86, https://doi.org/10.1038/s43017-022-00379-5, 2023.
Li, Z., Lau, W. K.-M., Ramanathan, V., Wu, G., Ding, Y., Manoj, M. G., Liu, J., Qian, Y., Li, J., Zhou, T., Fan, J., Rosenfeld, D., Ming, Y., Wang, Y., Huang, J., Wang, B., Xu, X., Lee, S.-S., Cribb, M., Zhang, F., Yang, X., Zhao, C., Takemura, T., Wang, K., Xia, X., Yin, Y., Zhang, H., Guo, J., Zhai, P. M., Sugimoto, N., Babu, S. S., and Brasseur, G. P.: Aerosol and monsoon climate interactions over Asia, Rev. Geophys., 54, 866–929, https://doi.org/10.1002/2015RG000500, 2016.
Li, Z., Guo, J., Ding, A., Liao, H., Liu, J., Sun, Y., Wang, T., Xue, H., Zhang, H., and Zhu, B.: Aerosol and boundary-layer interactions and impact on air quality, Natl. Sci. Rev., 4, 810–833, https://doi.org/10.1093/nsr/nwx117, 2017.
Li, Z., Wang, Y., Guo, J., Zhao, C., Cribb, M. C., Dong, X., Fan, J., Gong, D., Huang, J., Jiang, M., Jiang, Y., Lee, S.-S., Li, H., Li, J., Liu, J., Qian, Y., Rosenfeld, D., Shan, S., Sun, Y., Wang, H., Xin, J., Yan, X., Yang, X., Yang, X., Zhang, F., and Zheng, Y.: East Asian study of tropospheric aerosols and their impact on regional clouds, precipitation, and climate (EAST-AIRCPC), J. Geophys. Res.-Atmos., 124, 13026–13054, https://doi.org/10.1029/2019JD030758, 2019.
Mahrt, L.: Nocturnal boundary-layer regimes, Bound.-Lay. Meteorol., 88, 255–278, https://doi.org/10.1023/A:1001171313493, 1998.
Mai, Z. and Zhang, T.: Analysis of the March 2022 atmospheric circulation and weather, Meteorol. Mon., 48, 794–800, https://doi.org/10.7519/j.issn.1000-0526.2022.051001, 2022 (in Chinese).
Mai, Z., Zhang, T., and Sheng, J.: Analysis of the April 2021 atmospheric circulation and weather, Meteorol. Mon., 47, 893–900, https://doi.org/10.7519/j.issn.1000-0526.2021.07.012, 2021 (in Chinese).
Miao, Y., Liu, S., Sheng, L., Huang, S., and Li, J.: Influence of boundary layer structure and low-level jet on PM2.5 pollution in Beijing: a case study, Int. J. Env. Res. Pub. He., 16, 616, https://doi.org/10.3390/ijerph16040616, 2019.
O'Connor, E. J., Illingworth, A. J., and Hogan, R. J.: A technique for autocalibration of cloud lidar, J. Atmos. Ocean. Tech., 21, 777–786, https://doi.org/10.1175/1520-0426(2004)021<0777:ATFAOC>2.0.CO;2, 2004.
Pentikäinen, P., O'Connor, E. J., Manninen, A. J., and Ortiz-Amezcua, P.: Methodology for deriving the telescope focus function and its uncertainty for a heterodyne pulsed Doppler lidar, Atmos. Meas. Tech., 13, 2849–2863, https://doi.org/10.5194/amt-13-2849-2020, 2020.
Pichugina, Y. L., Brewer, W. A., Banta, R. M., Choukulkar, A., Clack, C. T. M., Marquis, M. C., McCarty, B. J., Weickmann, A. M., Sandberg, S. P., Marchbanks, R. D., and Hardesty, R. M.: Properties of the offshore low level jet and rotor layer wind shear as measured by scanning Doppler Lidar, Wind Energy, 20, 987–1002, https://doi.org/10.1002/we.2075, 2017.
Pöschl, U.: Atmospheric aerosols: Composition, transformation, climate and health effects, Angew. Chem. Int. Edit., 44, 7520–7540, https://doi.org/10.1002/anie.200501122, 2005.
Qin, K., Wu, L., Wong, M. S., Letu, H., Hu, M., Lang, H., Sheng, S., Teng, J., Xiao, X., and Yuan, L.: Trans-boundary aerosol transport during a winter haze episode in China revealed by ground-based lidar and CALIPSO satellite, Atmos. Environ., 141, 20–29, https://doi.org/10.1016/j.atmosenv.2016.06.042, 2016.
Ren, Y., Zhang, H., Zhang, X., Wu, B., Cai, X., Song, Y., and Zhu, T.: Quantitative verification of the turbulence barrier effect during heavy haze pollution events, Environ. Res. Commun., 4, 045005, https://doi.org/10.1088/2515-7620/ac6381, 2022.
Sandu, I., Beljaars, A., Bechtold, P., Mauritsen, T., and Balsamo, G.: Why is it so difficult to represent stably stratified conditions in numerical weather prediction (NWP) models?, J. Adv. Model. Earth Sy., 5, 117–133, https://doi.org/10.1002/jame.20013, 2013.
Shangguan, M., Qiu, J., Yuan, J., Shu, Z., Zhou, L., and Xia, H.: Doppler Wind Lidar From UV to NIR: A Review With Case Study Examples, Front. Remote Sens., 2, 787111, https://doi.org/10.3389/frsen.2021.787111, 2022.
Shangguan, M., Yang, Z., Lin, Z., Lee, Z., Xia, H., and Weng, Z.: Compact long-range single-photon underwater lidar with high spatial-temporal resolution, IEEE Geosci. Remote S., 20, 1501905, https://doi.org/10.1109/LGRS.2023.3274449, 2023.
Shangguan, M., Yang, Z., Lin, Z., Weng, Z., and Sun, J.: Full-day profiling of a beam attenuation coefficient using a single-photon underwater lidar with a large dynamic measurement range, Opt. Lett., 49, 626–629, https://doi.org/10.1364/OL.514622, 2024.
Smalikho, I.: Techniques of wind vector estimation from data measured with a scanning coherent Doppler lidar, J. Atmos. Ocean. Tech., 20, 276–291, https://doi.org/10.1175/1520-0426(2003)020<0276:TOWVEF>2.0.CO;2, 2003.
Stensrud, D. J.: Importance of low-level jets to climate: A review, J. Climate, 9, 1698–1711, https://doi.org/10.1175/1520-0442(1996)009<1698:IOLLJT>2.0.CO;2, 1996.
Su, T., Li, Z., Li, C., Li, J., Han, W., Shen, C., Tan, W., Wei, J., and Guo, J.: The significant impact of aerosol vertical structure on lower atmosphere stability and its critical role in aerosol–planetary boundary layer (PBL) interactions, Atmos. Chem. Phys., 20, 3713–3724, https://doi.org/10.5194/acp-20-3713-2020, 2020.
Sullivan, J. T., Rabenhorst, S. D., Dreessen, J., McGee, T. J., Delgado, R., Twigg, L., and Sumnicht, G.: Lidar observations revealing transport of O3 in the presence of a nocturnal low-level jet: Regional implications for “next-day” pollution, Atmos. Environ., 158, 160–171, https://doi.org/10.1016/j.atmosenv.2017.03.039, 2017.
Tian, P., Cao, X., Zhang, L., Sun, N., Sun, L., Logan, T., Shi, J., Wang, Y., Ji, Y., Lin, Y., Huang, Z., Zhou, T., Shi, Y., and Zhang, R.: Aerosol vertical distribution and optical properties over China from long-term satellite and ground-based remote sensing, Atmos. Chem. Phys., 17, 2509–2523, https://doi.org/10.5194/acp-17-2509-2017, 2017.
Tuononen, M., O'Connor, E. J., Sinclair, V. A., and Vakkari, V.: Low-level jets over Utö, Finland, based on Doppler lidar observations, J. Appl. Meteorol. Clim., 56, 2577–2594, https://doi.org/10.1175/JAMC-D-16-0411.1, 2017.
Wang, L., Liu, J., Gao, Z., Li, Y., Huang, M., Fan, S., Zhang, X., Yang, Y., Miao, S., Zou, H., Sun, Y., Chen, Y., and Yang, T.: Vertical observations of the atmospheric boundary layer structure over Beijing urban area during air pollution episodes, Atmos. Chem. Phys., 19, 6949–6967, https://doi.org/10.5194/acp-19-6949-2019, 2019.
Wang, M., Wei, T., Lolli, S., Wu, K., Wang, Y., Hu, H., Yuan, J., Tang, D., and Xia, H.: A long-term Doppler wind LiDAR study of heavy pollution episodes in western Yangtze River Delta region, China, Atmos. Res., 310, 107616, https://doi.org/10.1016/j.atmosres.2024.107616, 2024.
Wang, M., Wei, T., Lolli, S., Rocadenbosch, F., Salcedo-Bosch, A., Du, Y., Wang, Y., Wang, C., Zong, L., Gu, Y., Wan, B., Su, L., Wei, F., and Xia, H.: A comparative study of low-level jets in different climate regions in China using multi-site Doppler wind lidar observations, IEEE T. Geosci. Remote, 4105014, https://doi.org/10.1109/TGRS.2026.3672972, 2026.
Wang, Y., Tang, J., Zhang, Z., Wang, W., Wang, J., and Wang, Z.: Hybrid Methods' Integration for Remote Sensing Monitoring and Process Analysis of Dust Storm Based on Multi-Source Data, Atmosphere, 14, 3, https://doi.org/10.3390/atmos14010003, 2023a.
Wang, Y., Li, B., Bao, P., Wang, R., Min, A., and Xiong, P.: A Case Study of Leaf Wettability Variability and the Relations with Leaf Traits and Surface Water Storage for Urban Landscape Plants, Water, 15, 2152, https://doi.org/10.3390/w15122152, 2023b.
Wei, T., Xia, H., Hu, J., Wang, C., Shangguan, M., Wang, L., Jia, M., and Dou, X.: Simultaneous wind and rainfall detection by power spectrum analysis using a VAD scanning coherent Doppler lidar, Opt. Express, 27, 31235–31245, https://doi.org/10.1364/oe.27.031235, 2019.
Wei, T., Xia, H., Wu, Y., Yuan, J., Wang, C., and Dou, X.: Inversion probability enhancement of all-fiber CDWL by noise modeling and robust fitting, Opt. Express, 28, 29662–29675, https://doi.org/10.1364/oe.401054, 2020.
Wei, T., Xia, H., Wu, K., Yang, Y., Liu, Q., and Ding, W.: Dark/bright band of a melting layer detected by coherent Doppler lidar and micro rain radar, Opt. Express, 30, 3654–3663, https://doi.org/10.1364/OE.450714, 2022.
Wei, T., Wang, M., Wu, K., Yuan, J., Xia, H., and Lolli, S.: Characterizing urban planetary boundary layer dynamics using 3-year Doppler wind lidar measurements in a western Yangtze River Delta city, China, Atmos. Meas. Tech., 18, 1841–1857, https://doi.org/10.5194/amt-18-1841-2025, 2025a.
Wei, T., Wang, M., Jiang, P., Wu, K., Zhang, Z., Yuan, J., Xia, H., and Lolli, S.: Retrieving aerosol backscatter coefficient using coherent Doppler wind lidar, Opt. Express, 33, 6832–6849, https://doi.org/10.1364/OE.551730, 2025b.
Wei, W., Zhang, H., Zhang, X., and Che, H.: Low-level jets and their implications on air pollution: a review, Front. Environ. Sci., 10, 1082623, https://doi.org/10.3389/fenvs.2022.1082623, 2023.
Wu, B., Li, Z., Ju, T., and Zhang, H.: Characteristics of low-level jets during 2015–2016 and the effect on fog in Tianjin, Atmos. Res., 245, 105102, https://doi.org/10.1016/j.atmosres.2020.105102, 2020.
Yang, B., Finn, D., Rich, J., Gao, Z., and Liu, H.: Effects of low-level jets on near-surface turbulence and wind direction changes in the nocturnal boundary layer, J. Geophys. Res.-Atmos., 128, e2022JD037657, https://doi.org/10.1029/2022JD037657, 2023.
Yang, S., Preißler, J., Wiegner, M., von Löwis, S., Petersen, G. N., Parks, M. M., and Finger, D. C.: Monitoring dust events using Doppler lidar and ceilometer in Iceland, Atmosphere, 11, 1294, https://doi.org/10.3390/atmos11121294, 2020.
Yang, Y., Yim, S. H. L., Haywood, J., Osborne, M., Chan, J. C. S., Zeng, Z., and Cheng, J. C. H.: Characteristics of Heavy Particulate Matter Pollution Events Over Hong Kong and Their Relationships With Vertical Wind Profiles Using High-Time-Resolution Doppler Lidar Measurements, J. Geophys. Res.-Atmos., 124, 9609–9623, https://doi.org/10.1029/2019JD031140, 2019.
Zhang, K., Mao, H., Civerolo, K., Berman, S., Ku, J.-Y., Rao, S. T., Doddridge, B., Philbrick, C. R., and Clark, R.: Numerical investigation of boundary-layer evolution and nocturnal low-level jets: Local versus non-local PBL schemes, Environ. Fluid Mech., 1, 171–208, https://doi.org/10.1023/A:1011557402158, 2001.
Zhao, W. and Zou, Y.: Hefei: An emerging city in inland China, Cities, 77, 158–169, https://doi.org/10.1016/j.cities.2018.01.008, 2018.
Zheng, X. Y., Fu, Y. F., Yang, Y. J., and Liu, G. S.: Impact of atmospheric circulations on aerosol distributions in autumn over eastern China: observational evidence, Atmos. Chem. Phys., 15, 12115–12138, https://doi.org/10.5194/acp-15-12115-2015, 2015.
Zhou, J., Yu, G., Jin, C., Qi, F., Liu, D., Hu, H., Gong, Z., Shi, G., Nakajima, T., and Takamura, T.: Lidar observations of Asian dust over Hefei, China, in spring 2000, J. Geophys. Res., 107, https://doi.org/10.1029/2001JD000802, 2002.
Zhou, L., Liu, G., Shen, M., Liu, Y., and Lam, P. K. S.: Characteristics of indoor dust in an industrial city: Comparison with outdoor dust and atmospheric particulates, Chemosphere, 272, 129952, https://doi.org/10.1016/j.chemosphere.2021.129952, 2021.