
the Creative Commons Attribution 4.0 License.
the Creative Commons Attribution 4.0 License.
 | 23 Sep 2026
A new balloon-borne system for measuring the vertical variability of aerosol optical properties using low-cost sensors
Michalina Broda

Olga Zawadzka-Mańko
Michał T. Chiliński
Katarzyna Nurowska
Szymon Kłapiński
Przemysław Makuch
Krzysztof M. Markowicz
This study presents a newly developed balloon-borne AeroSonde system equipped with calibrated low-cost optical particulate matter sensors (SPS30) for vertically resolved aerosol optical measurements. Calibration of the sensors against reference instruments (Aurora 4000 nephelometer and Laser Aerosol Spectrometer (LAS) 3340) enabled the estimation of scattering coefficients (ASC), scattering Ångström exponent (SAE), and effective particle radius (Reff), with Pearson correlation coefficients exceeding 0.88. The best agreement was obtained for ASC, while SAE and Reff showed substantially larger uncertainties, limiting their use to qualitative discrimination between fine- and coarse-mode particles.
The AeroSondes were deployed for the first time during measurement campaigns in June and August 2025 over southeastern Poland. Soundings with vertical resolution below 10 m reached altitudes of 10–27 km a.g.l. during episodes of long-range transport, including North American biomass-burning (BB) plumes and Saharan dust intrusions. The vertical distribution of aerosol layers observed by the AeroSonde is consistent with active remote sensing measurements, showing good agreement in both the optical layering structure and the absolute values of extensive aerosol properties, with correlation coefficients ranging from 0.74 to 0.81. The extended vertical sounding range allows the estimation of column-integrated quantities, such as aerosol optical depth, as well as their contributions from individual layers, for example, within the planetary boundary layer.
These results demonstrate that low-cost, balloon-borne AeroSonde sensors can provide reliable vertical profiles of aerosol properties, supporting enhanced spatio-temporal coverage and improved evaluation of atmospheric aerosol models.
- Article
(6232 KB) - Full-text XML
-
Supplement
(5516 KB) - BibTeX
- EndNote


Aerosol properties exhibit pronounced vertical variability that strongly influences their radiative effects, interactions with clouds, and atmospheric lifetimes (Li et al., 2022; IPCC, 2021). Accurate characterization of the vertical structure of aerosols is therefore essential for understanding their impacts on weather, air quality, and climate (Su et al., 2020). Aerosols within the planetary boundary layer (PBL) often differ substantially from those in the free troposphere in their optical, chemical, and microphysical properties (Chang et al., 2023; Su et al., 2022). These contrasts lead to distinct radiative behaviours and cloud interaction potentials. Consequently, vertically resolved aerosol observations are indispensable for improving radiative transfer calculations, validating satellite retrievals, and constraining atmospheric models (Mei et al., 2025; Bazo et al., 2023).
Vertical profiles of aerosols can be obtained using both in situ and remote sensing techniques. Recent advances in instrumentation have enabled increasingly detailed profiling of aerosol optical and microphysical characteristics (Dobracki et al., 2025; Papanikolaou et al., 2022). Ground-based and satellite-borne lidar systems have been widely employed to retrieve backscatter and extinction profiles (Chen et al., 2025; Lin et al., 2023). However, lidar observations are often constrained by signal attenuation in dense aerosol layers, operational challenges in complex or urban environments, and retrieval uncertainties associated with assumed aerosol types.
To validate the lidar observations, balloon-borne measurements could be used, such as those performed by Compact Optical Backscatter Aerosol Detector (COBALD) (Brunamonti et al., 2021), a lightweight aerosol backscatter detector.
In situ measurements from aircraft campaigns provide the most direct and accurate characterisation of aerosol properties (Cai et al., 2022; Harshvardhan et al., 2022). Nevertheless, the high operational costs and limited spatial and temporal coverage of aircraft observations restrict their routine use. Alternative approaches using unmanned aerial vehicles (UAVs), tethered balloons (Kalnajs and Deshler, 2022; Kezoudi et al., 2021), and other innovative platforms have gained increasing attention for profiling the lower troposphere and near-surface pollution layers (Zhu et al., 2025; Eckert et al., 2024). Further progress has been achieved through the use of cable cars (Posyniak et al., 2021; Zawadzka et al., 2017), mobile urban systems (Seidel et al., 2016), and measurement systems deployed on tall buildings or towers (Chiliński et al., 2025; Quan et al., 2025). Despite continued developments (Moormann et al., 2025), most current systems remain constrained by payload capacity, vertical range, or operational complexity.
There is therefore a continuing need for cost-effective, flexible, and high-vertical-resolution platforms capable of routine in situ aerosol profiling. To address this gap, we developed AeroSonde, a novel radiosonde-based system designed to measure vertical profiles of aerosol optical and microphysical properties, with a particular focus on long-range transport of aerosol (e.g., biomass burning (BB), dust, volcanic). The system can operate with tethered balloons, UAVs, or free-flying radiosondes, enabling measurements across diverse environments-from urban pollution layers to remote BB regions. The primary objective of this study was to assess the AeroSonde's performance and demonstrate its capability for vertical aerosol profiling. For this purpose, initial field deployments were conducted at the Poland-AOD atmospheric observation site in Strzyżów (Poland) (Markowicz et al., 2021) during episodes of elevated aerosol loading associated with long-range BB aerosol and mineral dust transport in summer 2025. In the absence of independent in situ reference measurements, remote sensing measurements were used to evaluate the optical properties retrieved from the AeroSonde.
The structure of this paper is organised as follows. Section 2 describes the AeroSonde, the set of instruments, and the measurement site. Section 3 outlines the calibration procedures and evaluates instrument performance. Section 4 presents the observational results, followed by a discussion of their implications in Sect. 5. The main conclusions and perspectives are summarised in Sect. 6.
2.1 Measurement site
The SolarAOT Radiative Transfer Station in Strzyżów (49.878° N, 21.861° E; 444 m a.s.l.), located on Niebylecka Hill in the Carpathians, southeastern Poland, represents a rural background site with minimal urban influence. The station is located approximately 200 m above a small town and about 5 km away from it in the horizontal direction. Operational since August 2013 as an Aerosol Robotic Network (AERONET) site, it is equipped with a polarized CIMEL sun photometer (Markowicz et al., 2021). The site provides continuous observations of standard meteorological variables, radiative fluxes, columnar and in situ aerosol properties, and vertical aerosol distribution and thermodynamic structure of the troposphere.
2.2 Measurement setup
The measurement setup combines the newly developed AeroSonde system and a standard Vaisala RS41 radiosonde attached to a single balloon, together with complementary instrumentation including a Raymetrics LB10-V-D200 lidar and ground-based aerosol instruments (Sect. 2.2.2). The integrated dataset enables the evaluation of vertical aerosol profiles in conjunction with thermodynamic soundings, surface optical measurements, and model simulations.
2.2.1 AeroSonde
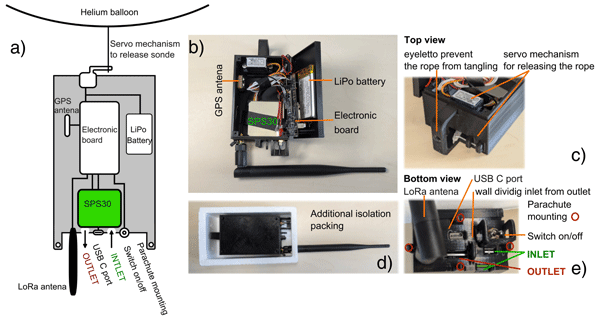
To establish a new methodology for measuring and retrieving vertical profiles of aerosol scattering properties, the AeroSonde, a new sounding system, was developed (Fig. 1). The AeroSonde is equipped with the following sensors: an SPS30 particulate matter sensor, a pressure sensor (type LPS22HB), a temperature and relative humidity sensor (SHTC3), and a GPS (L76K module) receiver (Fig. 1b). The mass of the AeroSonde is 105 g without the housing and 175 g with the housing. Its dimensions are 90 mm in length, 60 mm in width, and 40 mm in height. The AeroSonde operates with an average power consumption of approximately 125 mA.
Particulate matter sensor SPS30, manufactured by Sensirion (https://sensirion.com/products/catalog/SPS30, last access: 21 September 2025), is an affordable (approximately USD 40 per unit at 2025 retail prices), compact instrument for aerosol measurement. The device features a measuring chamber with a 660 nm laser diode, photodiode detector, and focusing optics. A small integrated fan ensures consistent airflow through the chamber. The SPS30 provides Inter-Integrated Circuit (I2C) and Universal Asynchronous Receiver-Transmitter (UART) outputs, reporting mass concentrations of particulate matter (PM) in the PM1, PM2.5, PM4.0, and PM10 fractions, as well as data in five particle size bins and the typical particle size (TPS). Measurements are computed from laser scattering intensity using proprietary onboard algorithms; however, the manufacturer does not disclose algorithmic details. Following the procedure outlined by (Markowicz and Chilinski, 2020), sensor-derived data can be used to estimate secondary aerosol parameters, including the aerosol scattering coefficient (ASC), the scattering Ångström exponent (SAE), and the effective aerosol radius (Reff).
The data acquisition process is managed by the Raspberry Pi RP2040 electronic system, which also handles wireless data transmission over Long Range Wide Area Network (LoRaWAN) with the LoRa SX1262 module to the ground-based receiver. The temperature and relative humidity sensors are mounted on the electronic board and are not intended for atmospheric measurements, but rather for monitoring the operating conditions of the electronic components.
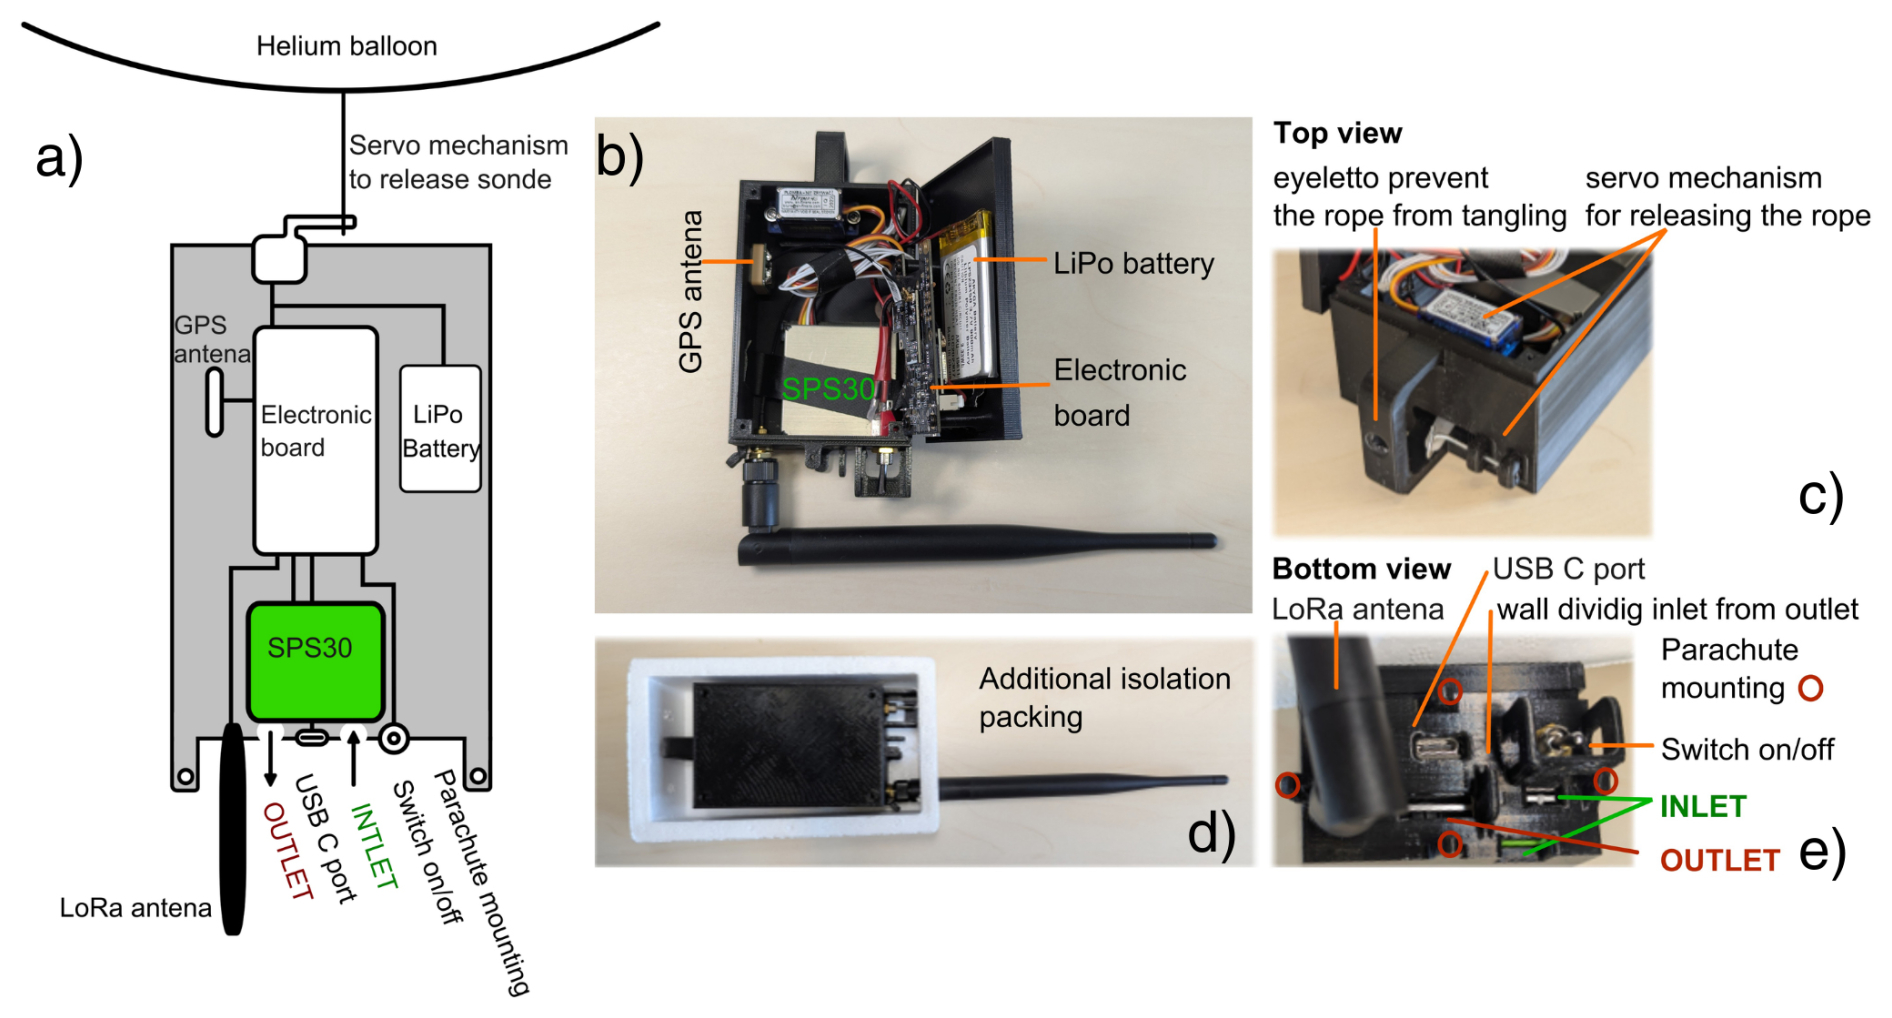
Figure 1Diagram of the AeroSonde construction showing labeled main components (a) and AeroSonde setup shown from multiple angles (b–e).
The AeroSonde's data transmission system is based on the LoRaWAN standard. The AeroSonde is equipped with an omnidirectional “rubber duck” antenna (Fig. 1d, e), typically made of a rubber or plastic housing with a copper or aluminium radiating element. Such an antenna is a half-wave, 5dBi, and terminated with a BNCSmart connector, allowing direct connection to the gateway or via a pigtail cable. The data transmission frequency band follows the EU 863–870 MHz specification.
The GPS sensor is an advanced multi-GNSS receiver supporting GPS, BeiDou, GLONASS, and QZSS constellations. It is equipped with an active ceramic antenna and a low-noise amplifier, ensuring fast and accurate positioning with a tracking sensitivity of −162 dBm.
The data receiver system consists of a ChirpStack LoRaWAN Network server with multiple routers (Semtech SX1302/SX1303) and two antennas – one omnidirectional (12 dBi) and one directional antenna (12C65VBZ type, 12 dBi), which is manually adjustable. Data from the AeroSonde is transmitted at a frequency of 1 Hz. Proper data reception was confirmed even when the horizontal distance between the probe and the receiving station exceeded 100 km, and the vertical separation surpassed 25 km. The AeroSonde dataframes were double timestamped by onboard GPS and by the ground station with its own GPS receiver and network time protocol client. The ground station time source allows sub-second time stamping for the purpose of clock-based time-of-flight geolocation.
Additionally, the AeroSonde system is equipped with a servo-based release mechanism that allows the balloon to be detached, enabling the probe to descend safely to the ground (Fig. 1c). The user can set the pressure threshold at which the servo mechanism is activated to release the measurement system.
Vaisala radiosonde RS41 is an instrument for upper-air profiling, providing accurate measurements of temperature, humidity, pressure, wind, and position up to 40 km altitude (Lee et al., 2022, 2021). Temperature measurements have an uncertainty between ≤ 0.11 °C (ground) and 0.17 °C (in situ). Relative humidity (RH) uncertainty is 0.5 %–2 % RH at room temperature and ranges from 0.9 % to 1.4 % RH at low temperatures. Pressure readings are SI-traceable, and GPS-based algorithms minimize the combined uncertainty. The uncertainty of wind speed is 0.15 m s−1, while the wind direction uncertainty is 2° for wind speeds above 3 m s−1. A Vaisala radiosonde was deployed together with an AeroSonde as part of the measurement payload to profile the atmosphere.
2.2.2 Other instruments
In addition to in situ measurements from the AeroSonde, ground-based remote sensing instruments were used to provide complementary information on aerosol properties and their vertical distribution. These comprise five instruments: two remote-sensing (the Raymetrics LB10-V-D200 lidar and the CIMEL CE-318 sun photometer) and three near-surface in situ (the AE31 aethalometer, the Aurora 4000 nephelometer, and the LAS 3340).
Lidar observations provide insight into the vertical structure of the atmosphere and support the interpretation of aerosol layering observed by the AeroSonde. Sun photometer measurements provide column-integrated aerosol optical properties, such as aerosol optical depth, which are used together with lidar signals in the Klett–Fernald–Sasano inversion algorithm to retrieve aerosol optical properties (Sanchez-Barrero et al., 2026; Klett, 1985; Sasano et al., 1979; Fernald, 1984).
It should be noted that lidar-derived quantities (e.g., aerosol extinction coefficient, AEC) and in situ measurements (e.g., ASC) represent different optical properties and are associated with different uncertainties. Therefore, lidar observations were used for qualitative comparison and consistency assessment of aerosol vertical structures rather than for direct validation of the AeroSonde data. Additional in situ instruments (e.g., nephelometer, aethalometer, Laser Aerosol Spectrometer) were used to characterize aerosol scattering and absorption properties at the surface, but also to calibrate the SPS30 sensors.
The Raymetrics LB10-V-D200 lidar operates at 532 nm using an Nd:YAG laser emitting 70 mJ pulses of 6–8 ns duration at 20 Hz repetition rate (Zieliński et al., 2012; Papayannis et al., 2007). The expanded beam divergence is < 0.3 mrad. Backscattered signals are collected by a 200 mm Cassegrain telescope with a field of view of 0.5–2 mrad and filtered through a 0.5 nm interference filter. Signal acquisition uses both analogue and photon-counting modes, with 7.5 m vertical and 50 s temporal resolution. Geometric overlap effects are negligible above approximately 500–700 m a.g.l.
The polarized variant of the CIMEL CE-318 sunphotometer extends the capabilities of the classical sun-sky photometer by adding polarimetric sensitivity across its spectral channels (Li et al., 2009). The instrument operates at a standard set of band-pass filters centered at 340, 380, 440, 500, 675, 870, 940, 1020, and 1640 nm, combining a silicon photodiode (for UV-NIR) and an InGaAs detector for the 1020/1640 nm channels. This configuration allows retrieval of aerosol optical depth (AOD), column water vapor, and enhanced microphysical properties such as the complex refractive index, size distribution, and particle nonsphericity by combining intensity and polarization measurements. The instrument operates as part of the global AERONET network (Holben et al., 1998), ensuring standardized calibration procedures, unified data processing, and long-term consistency with other sites worldwide. Level 1.5 inversion products are used in this study. SSA and Reff retrievals are reliable only for AOD440 > 0.4 (Zhang et al., 2025); this criterion was not met on any of the measurement days reported here, and these values are therefore treated as indicative.
The AE31 Aethalometers (Aerosol Magee Scientific, Slovenia) provide real-time measurements of light transmission through a spot on a quartz fiber filter tape (Pall Q250 quartz) and report the attenuation (ATN) at several wavelengths: 370, 470, 520, 590, 660, 880, and 950 nm (Hansen et al., 1984). The data at each wavelength is expressed as the concentration of equivalent black carbon (Petzold et al., 2013; Hansen et al., 1982), assuming black carbon is the sole absorber. However, the method has key limitations, including artifacts from light multi-scattering and aerosol loading (Collaud Coen et al., 2010; Arnott et al., 2005; Weingartner et al., 2003). The aerosol absorption coefficient (AAC) is computed according to the methodology by Segura et al. (2014), which applies corrections for the loading and multiple-scattering effects. The loading correction was applied using the parameterization proposed by Weingartner et al. (2003), where the correction factor depends on the aerosol attenuation and accounts for the non-linear filter response during particle accumulation. For this purpose, the f factor of 1.12 (at 520 nm) is used (see Eq. 8 in Weingartner et al., 2003). The multiple-scattering correction accounts for the enhanced optical path length within the filter and for scattering by particles embedded in the filter matrix. It was applied using wavelength-dependent correction coefficients C as reported by (Segura et al., 2014). In this study, a single value of C = 3.90 (at 520 nm) was used, as only one wavelength was analyzed in the case of AAC.
The Aurora 4000 polar nephelometer (Acoem Ecotech, Australia) can measure light scattered by aerosol particles over a broad range of angles and is also capable of determining total scattering and backscattering coefficients (Ran et al., 2023; Teri et al., 2022). The instrument features an LED array light source, which, along with a backscatter shutter, can be adjusted to different positions. This design enables the measurement of total scattering (from 9 to 170°) and angular scattering across 17 distinct angular segments at three wavelengths (450, 525, and 635 nm). Data processing for the Aurora 4000 incorporates several corrections: zero calibration based on Rayleigh scattering, adjustments for non-Lambertian illumination effects, and corrections for angular truncation errors (Markowicz et al., 2021; Müller et al., 2011).
The Laser Aerosol Spectrometer 3340 (LAS; TSI Inc., USA) measures aerosol particle number concentrations across 99 size channels, covering an aerodynamic diameter range from 0.09 to 7.5 µm (TSI Incorporated, 2024). The integration of wide-angle optics and an intracavity He–Ne laser extends the instrument's measurement range (Moore et al., 2021).
The data from the abovementioned instruments were recorded on a PC system synchronized via an NTP server.
The data analysis was supported by whole sky images acquired using a UVC G4 Bullet camera, with the aim of detecting cloud cover. In addition, we used atmospheric soundings data from the Tarnów WMO 12575 station located about 60 km from the Strzyżów site.
2.2.3 Back-trajectory and AOD models
We employed the LAGrangian ANalysis TOol (LAGRANTO) model to compute back-trajectories for identifying source regions and the International Cooperative for Aerosol Prediction Multi-Model Ensemble (ICAP-MME) to analyze dust and smoke AOD along these trajectories.
LAGRANTO is a widely used Lagrangian trajectory model for atmospheric research, applied to the analysis of transport processes, flow structures, and source-receptor relationships (Sprenger and Wernli, 2015; Wernli and Davies, 1997). The model computes forward and backward trajectories using a fourth-order Runge–Kutta integration scheme, with wind fields interpolated horizontally and vertically from gridded meteorological data. Owing to its flexibility and robustness, LAGRANTO has been widely applied in studies of atmospheric dynamics and in the interpretation of in situ and remote-sensing observations (Randazzo et al., 2026; Sellmaier et al., 2025). The current version of the model is available online at the official project website: https://iacweb.ethz.ch/staff/sprenger/lagranto/ (last access: 9 September 2026).
In the present research, air-mass back-trajectories were computed using the LAGRANTO (Lagrangian Analysis Tool) trajectory model via its FTP-based remote computation service hosted at ETH Zürich. The LAGRANTO model was driven by three-dimensional wind fields from the European Centre for Medium-Range Weather Forecasts (ECMWF). Operational analyses at 6 h temporal resolution were employed, with wind fields interpolated onto a 0.5° × 0.5° longitude/latitude grid. Data from the lowest 97 model levels (out of 137 total) were used, corresponding to approximately 10–12 km altitude (upper troposphere/lower stratosphere). Backward trajectories of 240 h were calculated, with the model run at a 3 min temporal resolution and output retrieved along the AeroSonde trajectories.
Smoke and dust aerosol optical depth was retrieved from the ICAP-MME forecast. The ICAP-MME is a multi-model ensemble with all members equally weighted (Sessions et al., 2015). Output is generated daily with 1° × 1° resolution at 00:00 UTC for 6-hourly forecasts out to 120 h with a 1 d latency (Xian et al., 2019). Within ICAP-MME, BB emissions are based on the Global Fire Assimilation System, which assimilates fire radiative power derived from the Moderate Resolution Imaging Spectroradiometer active fire products (Kaiser et al., 2012). For this research, AODsmoke and AODdust at 550 nm were retrieved for all time points of chosen backtrajectories.
2.3 Lidar retrievals and collocation with AeroSonde profiles
2.3.1 Lidar data processing
The range-corrected lidar signals were used as input to the inversion procedure for retrieving the aerosol optical properties. To obtain the range-corrected signal, a dead-time correction was first applied, followed by subtraction of the background estimated by averaging the raw signal above 100 km, and finally multiplication of the signal by the square of the range. The lidar signals were constructed by combining photon-counting and analog channels: the signals were merged within a photon-counting count-rate range of 5–10 MHz (5–10 × 106 counts s−1), while the photon-counting channel was used below 5 MHz and the analog channel above 10 MHz, ensuring a continuous dynamic range for further analysis.
To reduce noise, the data were smoothed using a temporal running mean with a 250 s window (five times the native temporal resolution) and a vertical running mean with a 37.5 m window (five times the native vertical resolution). The noise detection algorithm was then applied to the smoothed signal. The procedure consisted of: (i) identification of local extrema; (ii) application of a vertically moving 225 m window (30 times the vertical resolution), within which the fraction of extrema relative to the total number of data points was calculated; and (iii) flagging regions as noisy when this fraction exceeded 45 %. For these flagged regions, an additional vertical running mean with a 225 m window was applied. The threshold of 45 % was chosen empirically, based on inspection of multiple profiles and iterative testing.
Aerosol layers were identified based on the analysis of lidar backscatter profiles at 532 nm. In the absence of depolarization measurements, the distinction between aerosol and cloud layers was based on signal intensity and temporal continuity. Cloud presence was additionally assessed using an all-sky camera and vertical pointing infrared radiometers integrated within the microwave radiometer system, based on brightness temperature measurements (PolandAOD, 2025). Cloud-contaminated parts of the lidar profiles were replaced using linear interpolation between adjacent cloud-free layers.
Vertical profiles of the AEC were retrieved using the backward Klett algorithm (Klett, 1981), which assumes a constant lidar ratio (LR), defined as the ratio of the AEC to the backscatter coefficient. The algorithm can be initialized in two ways: by prescribing an LR (hereinafter referred to as Klett LR) or by constraining the solution using the measured AOD (Klett AOD). In the second case, the Klett–Fernald–Sasano method (Klett, 1985; Sasano et al., 1979; Fernald, 1984) was applied, with the LR adjusted to achieve consistency between the vertically integrated extinction and the observed AOD (see Appendix A1 for details). Two Klett-based approaches were applied to account for different observational constraints. The Klett LR method does not require measurement information and can therefore be used under all conditions, including periods without AOD measurements (e.g., nighttime), but it depends on the assumed constant lidar ratio, which introduces uncertainty. In contrast, the Klett AOD approach constrains the AEC using measured AOD, therefore limiting occurrences of unrealistic values.
The assumption of a constant LR introduces uncertainties, as aerosol properties within the PBL may differ from those of long-range transported aerosols in the free troposphere. Therefore, for smoke advection episodes, the assumed LR was based on the mean value reported in the literature for BB aerosol. A comprehensive list of LR values used in previous studies is provided in the Supplement of Adam et al. (2020). Based on this compilation, a mean LR value of 60.5 ± 27.5 sr was adopted in this study. For Saharan dust, an LR with a mean value of 50 ± 10 sr was applied, following Szczepanik et al. (2023).
To quantify the uncertainty of the retrieved extinction profiles, the Klett inversion was implemented within a Monte Carlo framework. For each realization, the reference height at which the inversion algorithm was terminated was randomly selected from a uniform distribution between 0.7 and 1.0 km a.g.l. The initialization height, corresponding to a molecular (aerosol-free) atmosphere, was randomly selected from a uniform distribution between 13 and 16 km a.g.l. To reduce the impact of noise in the molecular region (assumed to be located above 13 km a.g.l.), a moving average with a window length of 30 range bins (corresponding to 225 m) was applied to the signal. Additionally, perturbations were applied to the temperature and pressure profiles used for the calculation of molecular optical properties. Assuming a temperature uncertainty of less than 0.2 K and a pressure uncertainty of less than 1 hPa, normally distributed random values within these uncertainty ranges were generated and added to the temperature and pressure profiles at each height level in every Monte Carlo realization. These perturbed profiles were then used to calculate the molecular scattering coefficients required for the Klett inversion. Finally, the LR was randomly drawn from a normal distribution with a mean value of 60.5 ± 27.5 sr for BB aerosol cases, and a mean value of 50 ± 10 sr for Saharan dust cases.
The entire procedure was repeated 1000 times for every lidar profile included in the analysis. The mean extinction profile and its standard deviation were subsequently calculated from the ensemble of solutions, providing an estimate of the uncertainty associated with the extinction coefficient retrieved using the Klett algorithm.
AERONET AOD data at 500 nm corresponding to the measurement closest in time to the lidar observation were used to initialize the Klett algorithm without prescribing a fixed LR value. Instead, the AOD at 532 nm (AOD532, derived from Eq. A3) was used as a constraint.
In the case of the constant AOD assumption, the Monte Carlo approach followed the same procedure; however, instead of perturbing the LR, the AOD was randomly perturbed using a normal distribution with a standard deviation of 0.01.
For the final extinction profiles obtained using both Klett approaches, additional in situ measurements were incorporated. Specifically, the ASC measured by a nephelometer Aurora 4000 and the AAC measured by an AE31 aethalometer were summed to derive an independent estimate of the AEC. Subsequently, the extinction coefficient was linearly interpolated between the lowest Klett retrieval height (0.7 km a.g.l.) and the surface, resulting in a continuous final extinction profile from the ground level upward.
2.3.2 Spatio-temporal adjustment of lidar profiles to AeroSonde observations
Since the ascent of the AeroSonde lasted about 1–2 h, the atmospheric layering could change significantly during this period. That is why profiles used in the analysis were obtained using a spatiotemporal matching procedure. This approach involved aligning the AeroSonde and lidar data in time, height, and horizontal position. It was assumed that the horizontal wind speed was horizontally homogeneous at a given altitude z. To support this approximation, the terrain elevation beneath the AeroSonde was analysed (Fig. S3 in the Supplement). The analysis showed that the terrain traversed by the AeroSonde varies between 158 and 575 m a.s.l., i.e. by less than about 300 m relative to the launch site, suggesting that the impact of the orography on the stratification of the layers in which the aerosol is found is secondary. Horizontal wind speed and direction were obtained from the co-launched Vaisala RS41 radiosonde measurements. Time synchronization between the instruments described in Sect. 2.2.1, Sect. 2.2.2 ensured consistent temporal alignment between the datasets and enabled time matching of the measurements. For details of this approach, see Appendix A2.
The calibration and data evaluation process aimed to verify the consistency and accuracy of the optical sensors used in the study, as well as to assess their performance under real atmospheric conditions. Measurements were conducted at the Radiative Transfer Laboratory (RTL) of the Institute of Geophysics, University of Warsaw, over 22 d during the summer of 2025. Five SPS30 sensors were installed inside a meteorological shield to protect them from precipitation. The average Pearson correlation coefficient across all instrument pairs was 0.97 for PM10 and PM1, and 0.99 for TPS when 1 h averaging was applied. In contrast, for the original 1 s data (without averaging), the correlations decreased to 0.89 for PM10 and 0.90 for PM1. The mean relative differences were 8.9 % and 8.7 % for PM10 and PM1, respectively. Significantly larger differences (38 % for PM10) were observed for the non-averaged data (1 s resolution), which corresponds to the statistical noise of the detectors. In the case of TPS, the absolute mean difference between all SPS30 pairs was 0.023 µm, corresponding to a relative difference of 4.5 %. These results demonstrate that the discrepancies among the readings of the low-cost SPS30 sensors were surprisingly small.
Additionally, two experiments were conducted to evaluate the instrument’s response time and its performance under low atmospheric pressure conditions. In the first experiment, the sensor was placed in a chamber with a very high aerosol concentration (PM10 in the order of 200–300 µg m−3). The sensor's response to a sudden change in conditions showed that the time constant did not exceed a few seconds, typically being less than 5 s. For typical balloon ascent rates of 3–4 m s−1, this corresponds to a vertical resolution of no worse than 15–20 m. The sensor's performance under reduced pressure was tested in a laboratory vacuum chamber, modified to enable fan speed (revolutions per minute, RPM) measurements over a pressure range from 1000 to 50 hPa. One of the three wires of the SPS30's flow-inducing fan – corresponding to the tachometric (tachometer) output – was connected to an Arduino board to count pulses associated with fan rotations. The results indicated that the fan speed remained stable at approximately 6000 RPM throughout the experiment (see Fig. S1), confirming that SPS30 airflow does not require correction for altitude (pressure) effects.
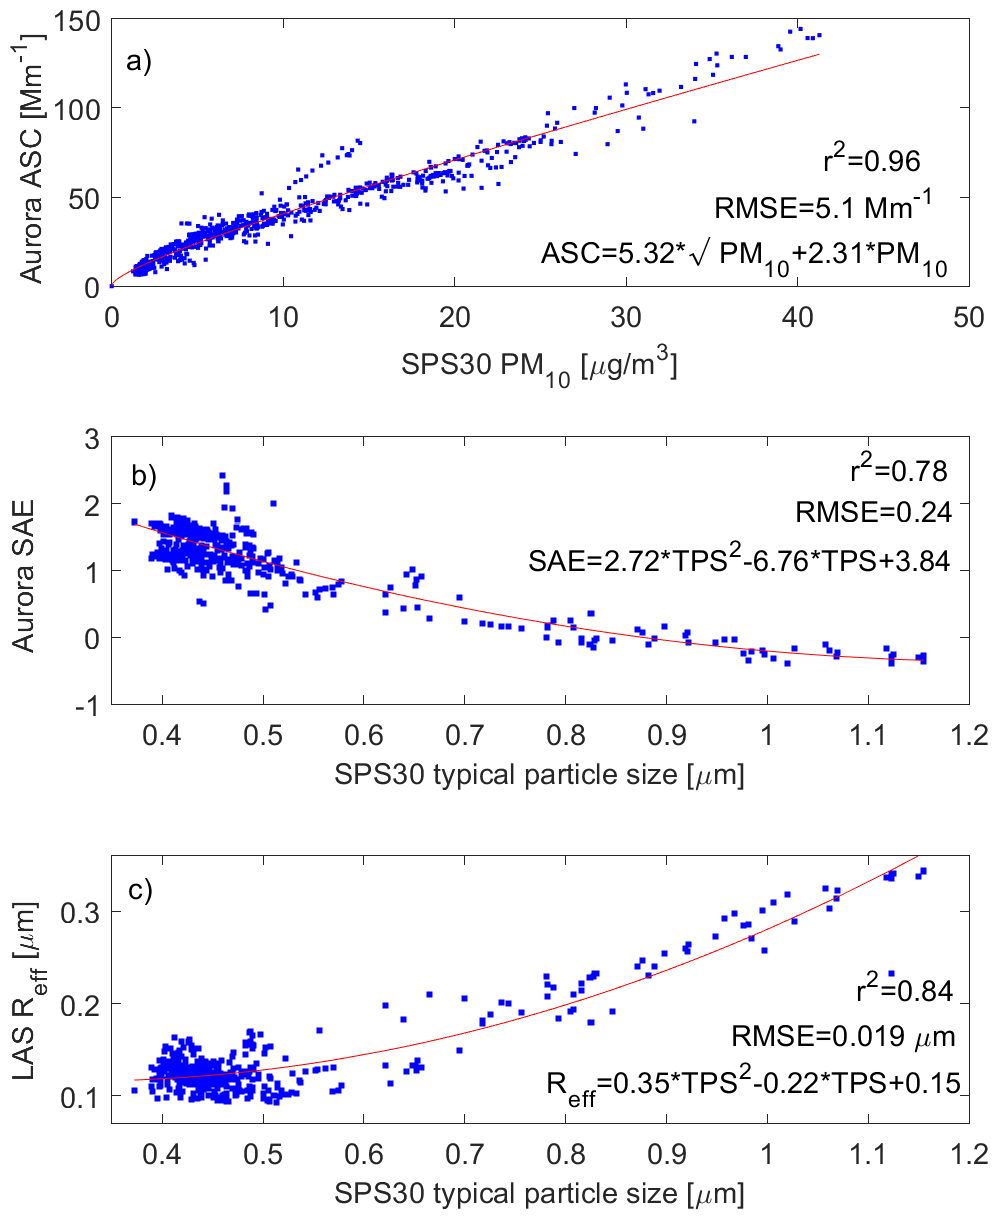
Figure 2Scatter plot and regression fit (red lines) of the 1 h mean (a) the PM10 from SPS30 and ASC at 525 nm from Aurora 4000, (b) SPS30 typical particle size [µm] and SAE from Aurora 4000, and (c) SPS30 typical particle size and effective radius from LAS 3340, both in [µm]. Data from five SPS30 sensors are averaged and visible as one point.
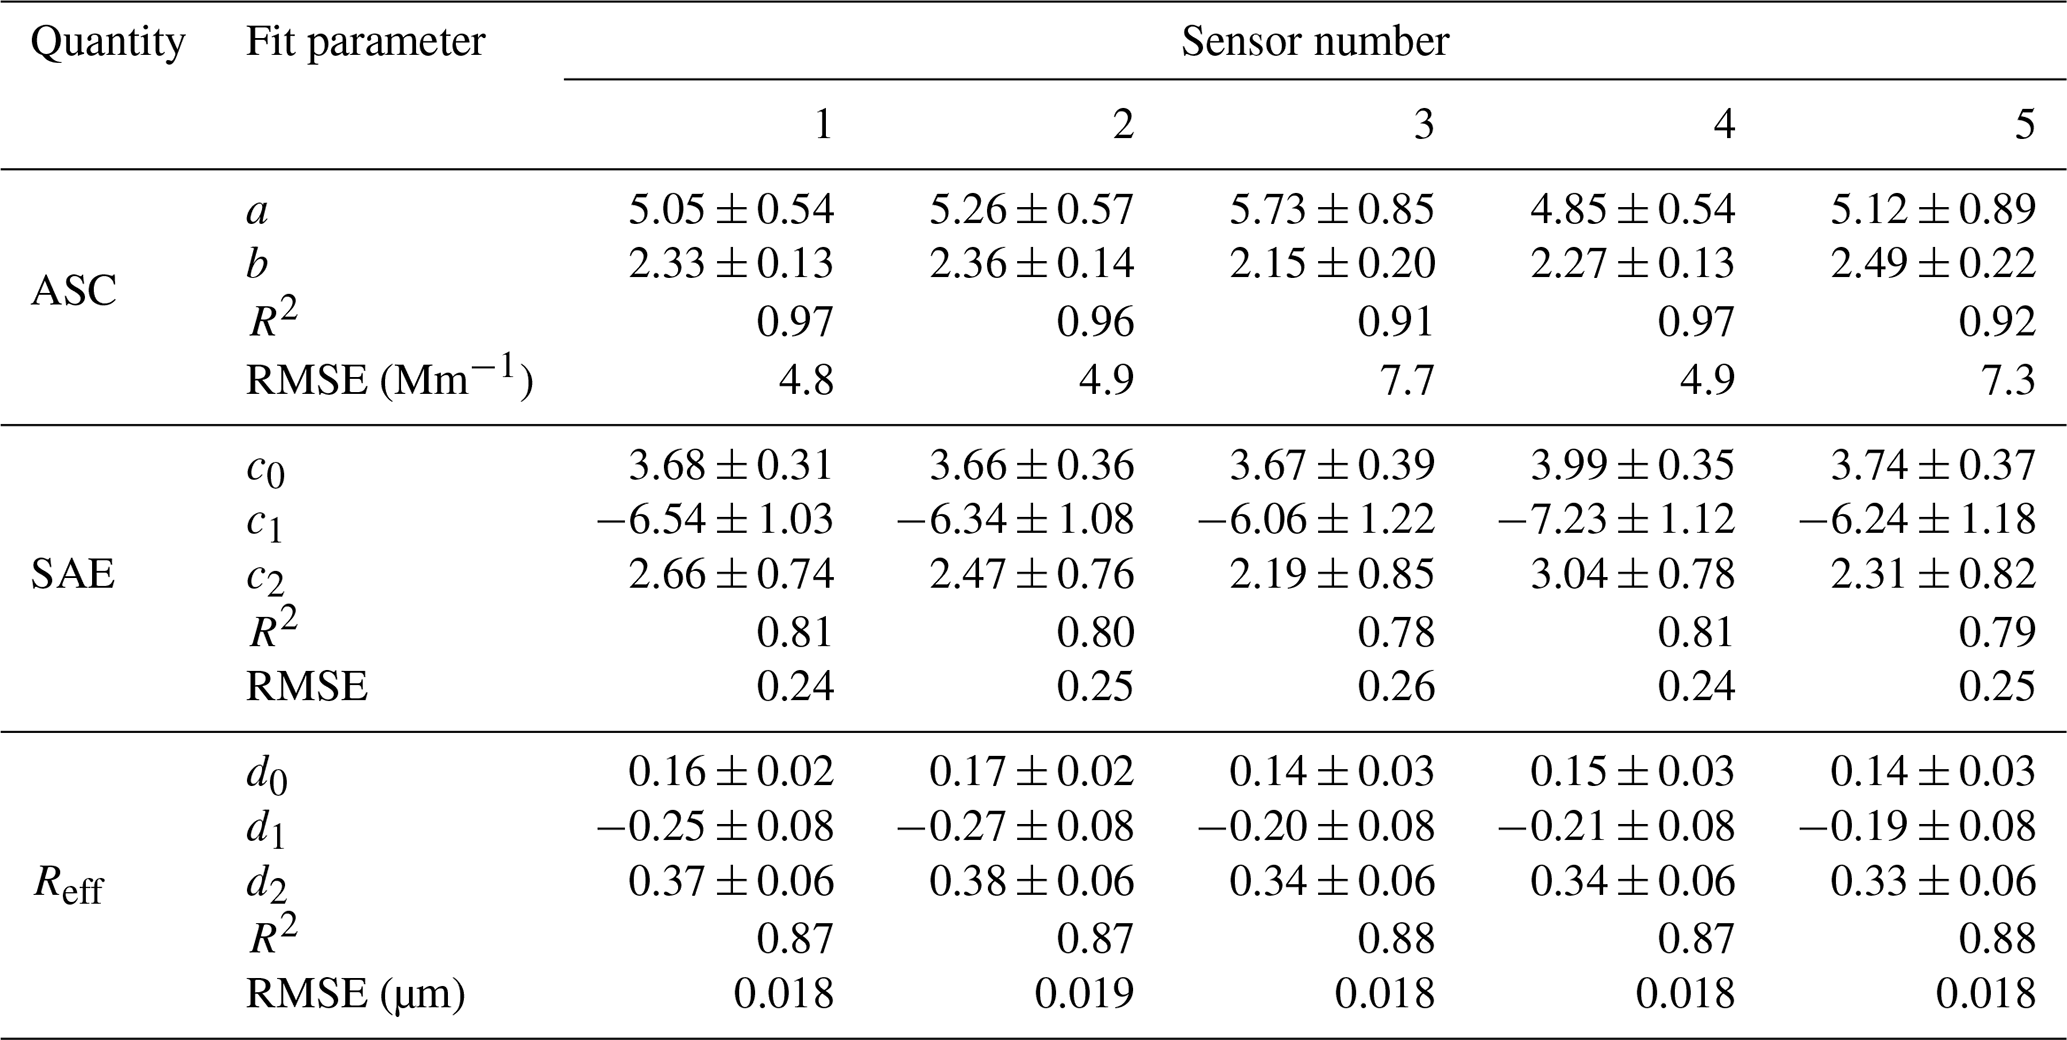
Table 1Statistics of SPS30 sensor calibration versus Aurora 4000 and LAS devices.
The low-cost optical particle sensors (SPS30) were calibrated against reference-grade aerosol instrumentation. The ASC and the SAE were referenced to an Ecotech Aurora 4000 integrating nephelometer, while the Reff was derived by comparison with the TSI 3340 LAS. For the ASC derived from the SPS30 sensors, a non-linear regression model was applied to convert particulate mass concentration to ASC, expressed as:
where a and b are empirical calibration coefficients determined by non-linear least-squares fitting. The proposed relationship between ASC and PM10, specifically the inclusion of both a linear and a square-root term, is supported by simulations conducted as part of this study. Lorenz-Mie simulations for spherical particles (Fig. S2) show that this functional form provides a good approximation of both the simulated and observed data, effectively capturing the combined effects of particle number concentration and particle size evolution. This suggests that the non-linear regression reflects the underlying physical processes governing aerosol behavior, including changes in particle size due to hygroscopic growth and coagulation. This interpretation is consistent with the findings of Malm and Hand (2007), who showed that mass scattering efficiency (i.e., the ASC to PM10 ratio) is a non-linear function of particle size. However, if the particle size distribution remains constant and only the particle number concentration varies, a linear relationship between ASC and PM10 would be expected. Figure 2a presents a scatter plot of PM10 from the SPS30 sensors versus ASC from the Aurora 4000 at 525 nm. Several data points deviating from the regression curve at PM10 concentrations of approximately 10–20 µg m−3 were associated with a single atypical aerosol episode. During this episode, aerosol transport models indicated the presence of sea-spray aerosol over Warsaw, located approximately 300 km from the Baltic Sea coast. The observed deviations may therefore be related to differences in aerosol type and particle properties during this episode, which can modify the relationship between PM10 mass concentration measured by the SPS30 and aerosol scattering measured by the Aurora 4000. Nevertheless, a very high coefficient of determination (R2 = 0.96) indicates good agreement between PM10 and ASC from the Aurora 4000. The root mean square error (RMSE) is 5.1 Mm−1, corresponding to only 3.8 %. These results are consistent with previous studies (Markowicz et al., 2025; Markowicz and Chilinski, 2020), which demonstrated that optical low-cost sensors can reliably measure ASC. The SAE from the SPS30 sensors was calibrated against reference values obtained from the Aurora 4000 nephelometer using a second-order polynomial regression based on the SPS30’s typical particle size (TPS):
where TPS represents an optical parameter derived from the SPS30 sensor, and c0, c1, c2 are the fitted coefficients. According to the manufacturer, TPS is related to the characteristic mean particle size of the sampled aerosol and correlates with the weighted average of the number concentrations measured in the particle-size bins. However, the detailed algorithm used to derive TPS is proprietary and is not disclosed by the manufacturer. Therefore, the polynomial relationship was determined empirically from the calibration data rather than derived from an assumed analytical relationship between TPS and SAE. Despite this uncertainty, the polynomial fits provide reasonable approximations, capturing the general trends observed in the data. This non-linear behavior is consistent with previous studies, which have shown that key optical parameters, such as the Ångström exponent, are non-linearly related to particle size (Schuster et al., 2006). Nevertheless, further studies are needed to refine these relationships and better understand the underlying physical processes. The agreement between SAE from the SPS30 and the Aurora 4000 reference is noticeably weaker (Fig. 2b; R2 = 0.78, RMSE = 0.24). This reflects both the limitations of the SPS30 in retrieving this parameter and the relatively high uncertainty of SAE even in professional nephelometer measurements. Nevertheless, the SPS30 can still be used to distinguish particle types characterized by different size distributions – for example, BB aerosol versus mineral dust or anthropogenic pollution (Sousan et al., 2021; Kuula et al., 2020; Tryner et al., 2020). Similarly, the Reff was estimated from the SPS30 TPS values by comparison with the LAS (TSI 3340) measurements. A quadratic regression model was applied:
where TPS represents an optical parameter derived from the SPS30 sensor, and d0, d1, d2 are the fitted coefficients. As in the case of SAE, the Reff can be estimated, albeit with relatively high uncertainty (Fig. 2c; RMSE = 0.019 µm). Table 1 summarizes the calibration statistics for all five SPS30 sensors against the Aurora 4000 nephelometer and the LAS instrument. The consistently high coefficients of determination confirm the strong agreement between the SPS30 sensors and the reference instruments. In contrast, the calibration of SAE and Reff is meaningful only when measurements include a sufficiently broad range of aerosol size conditions - particularly during episodes dominated by coarse-mode particles such as mineral dust or marine sea spray. Such conditions were present in our dataset, as indicated by elevated TPS values reported by the SPS30 sensors. In contrast, datasets without these episodes (with TPS typically ranging between 0.4 and 0.55 µm) provide too limited a dynamic range to enable reliable calibration of SAE or Reff.
The uncertainties of defined parameters (ASC, SAE, Reff) are calculated from the calibration curve error (Table 1) and the reference instrument (Aurora 4000 and LAS) error
where δfitASC is uncertainty of ASC calibration fit (Eq. 1) and δASCAurora is the uncertainty of Aurora ASC. For the remaining two quantities (SAE and Reff), an analogous equation applies.
The total uncertainty of the ASC measured with the Aurora 4000 was estimated by combining relative and absolute uncertainty components. Based on previous intercomparison studies and manufacturer data (World Meteorological Organization, 2016; Müller et al., 2011; Anderson and Ogren, 1998; Ecotech Pty Ltd, 2011), typical values of the relative uncertainties of individual components are span calibration (2.5 %), zero check (2 %), illumination/cosine response (5 %). In case of the truncation correction, the uncertainty depends on particle size and for fine particles is about 5 %, while for coarse mode it can be up to 33 % (Teri et al., 2022). Therefore, this term is estimated based on SAE as follows:
Assuming these errors are statistically independent, the combined relative uncertainty was estimated using the root-sum-square method. For the mean values listed above, the resulting total relative uncertainty of ASC is approximately 14 %. Since such relative uncertainty produces unrealistically small values of absolute uncertainty during very clean conditions, the absolute error is added. It accounts for instrumental baseline drift, zero offset, and electronic noise. We assume that this uncertainty is about 1 Mm−1. The total uncertainty δASCAurora of the scattering coefficient was thus calculated as:
where are the uncertainties of span calibration, zero check, truncation error, cosine response, and absolute calibration, respectively. The uncertainty of the SAE was then derived using standard propagation of uncertainty based on the SAE at two wavelengths (450 and 635 nm):
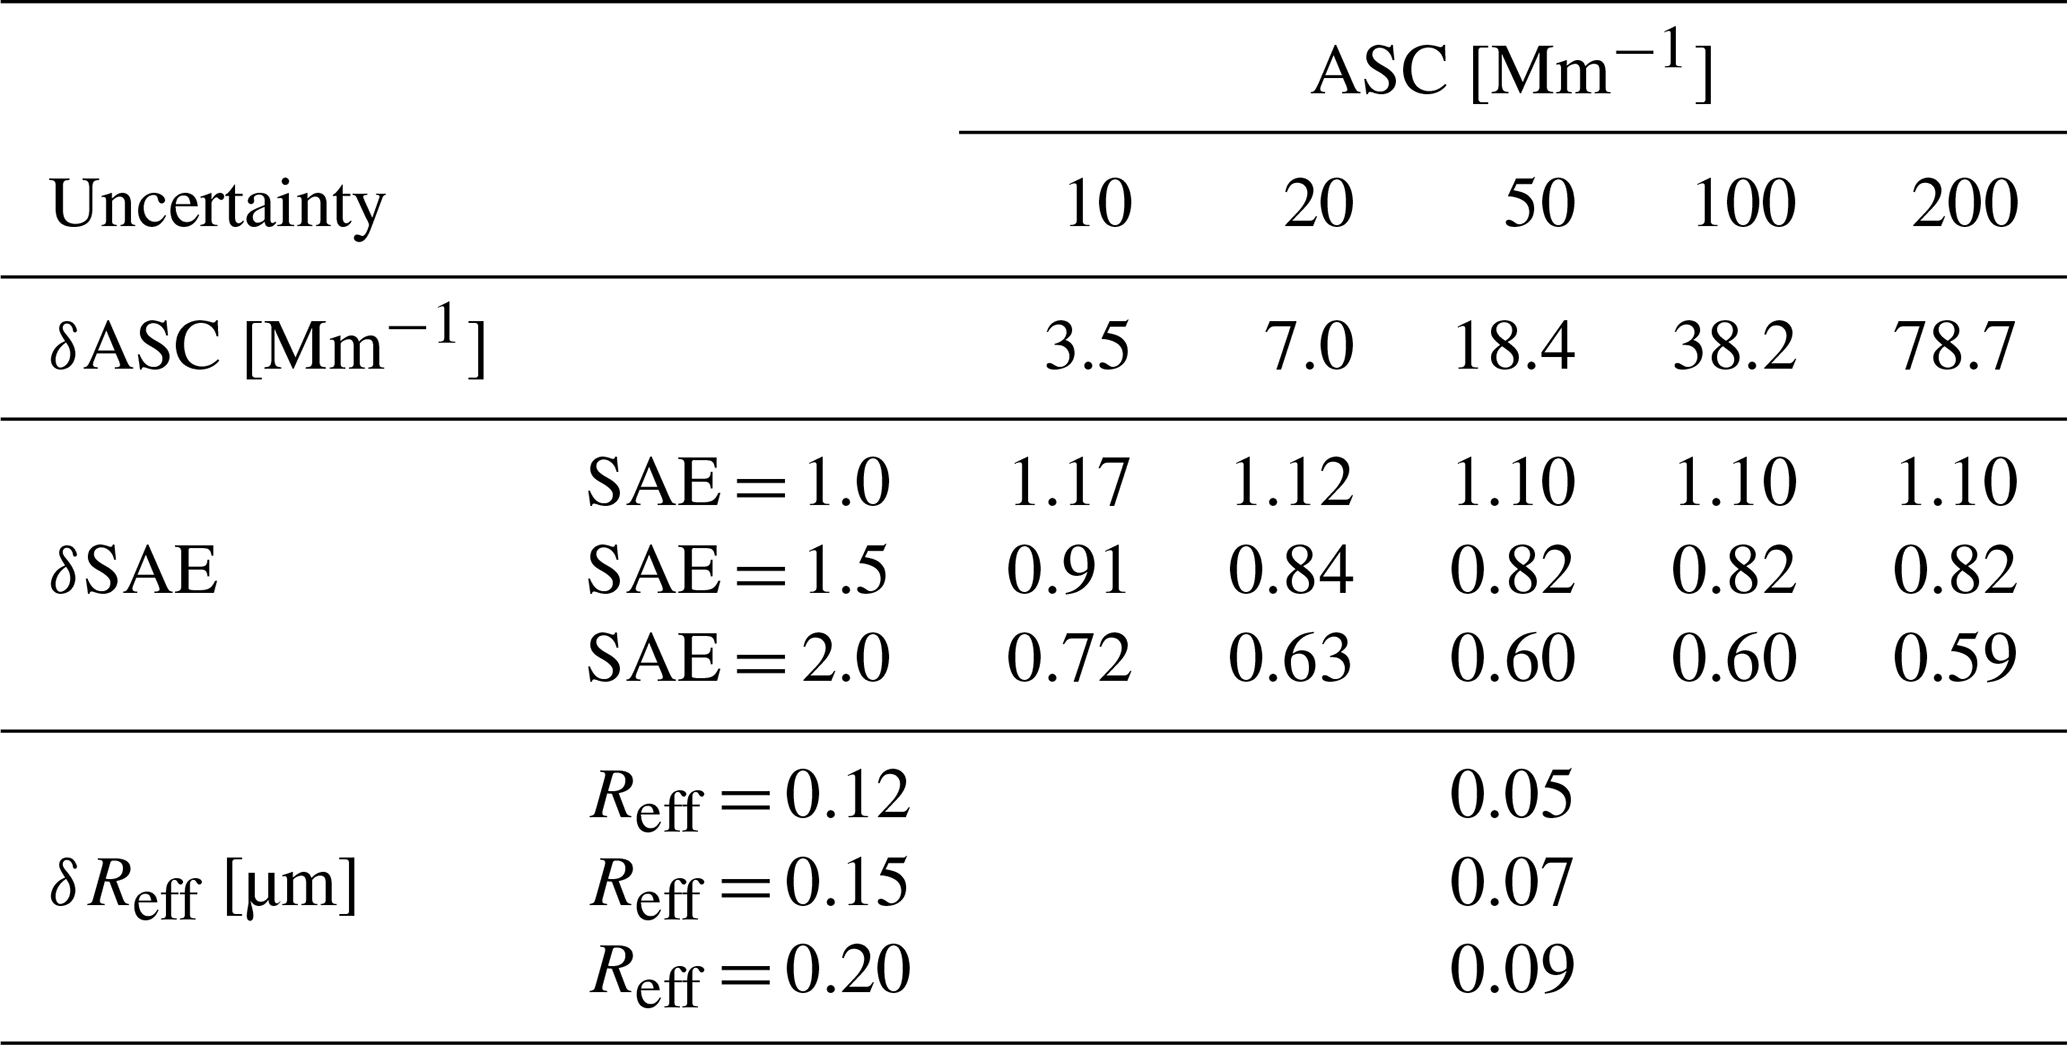
This approach provides a realistic estimate of the total uncertainty in both ASC and the spectral dependence of aerosol optical properties (SAE). The absolute uncertainty for SAE increases significantly for small ASC. In the case of the LAS instrument, the uncertainty of Reff was estimated during (Markowicz et al., 2026) two 2-week campaigns in Sopot (Poland) in 2023. Comparison of LAS to NanoScan SMPS Nanoparticle Sizer spectrometer and Optical Particle Sizer (OPS) 3330 devices allows us to estimate the Reff uncertainty as 0.028 µm. Table 2 summarizes the measurement uncertainties of ASC, SAE, and Reff under different optical conditions. The uncertainty in ASC shows only a weak dependence on pollution level, increasing slightly from approximately 35 % at ASC = 10 Mm−1 to about 39 % at ASC = 200 Mm−1. For SAE, the uncertainty decreases modestly with increasing ASC and declines more markedly with increasing SAE. In contrast, the uncertainty in Reff exhibits only a weak dependence on its magnitude. Overall, the uncertainties associated with SAE and Reff are substantial, indicating that these parameters can be retrieved from SPS30 measurements only with limited accuracy. For instance, for a typical SAE value of 1.50, the 95 % confidence interval spans nearly the full range of observed SAE variability.
Table 2Measurement uncertainties of ASC, SAE, and Reff estimated from the SPS30 sensor for different ASC.
The PM2.5 concentration is calibrated by the manufacturer against a TSI DustTrak DRX 8533, whereas PM10 is derived from the particle-size distribution measured by the SPS30. However, no independent field calibration of the PM2.5 and PM10 mass concentrations was performed in the present study, as no reference-grade PM mass instrument was available during the campaign. For reference, the manufacturer specifies a mass concentration precision of ±(5 µg m−3 + 5 % of the measured value) for PM2.5 and ±25 µg m−3 for PM10 in the concentration range of 0–100 µg m−3. These specifications represent the manufacturer-reported between-device variation rather than an uncertainty estimate established for the present measurements.
The AeroSonde system was tested in summer 2025. Three observational campaigns were conducted, during which five vertical profiles were obtained – for details see Table 3. Measurement dates were selected based on meteorological conditions favorable for remote sensing observations, as well as the occurrence of long-range transport episodes in the middle and upper troposphere. During the first two campaigns (9–10 June and 7 August), transport of BB aerosols from North America was observed, while the final campaign (29 August) captured a Saharan dust transport event. The mean ascent rate of the AeroSonde ranged from 2.7 to 3.9 m s−1, reaching altitudes from 10 to 26.8 km. Such vertical velocity corresponds to a vertical resolution of at least 15–20 m for the SPS30 sensor.
Table 3Summary of AeroSonde ascents conducted during the observation campaigns, including the date and launch time, the duration of ascent up to the maximum altitude where the signal from the AeroSonde was received, the maximum altitude where the signal was received, and the aerosol type with its main origin.

Due to strong wind speeds in the middle and upper troposphere, the AeroSonde experienced significant horizontal displacement (from approximately 75 to 120 km), mainly toward the east (BB case) and northeast (dust case, see Fig. 3a). The balloon trajectories are approximately linear. Only for the highest trajectories, a change in direction is observed.
Figure 3b shows the 3D trajectories of the AeroSonde platform carried by a balloon, highlighting the vertical variability of the ASC along the profiles.
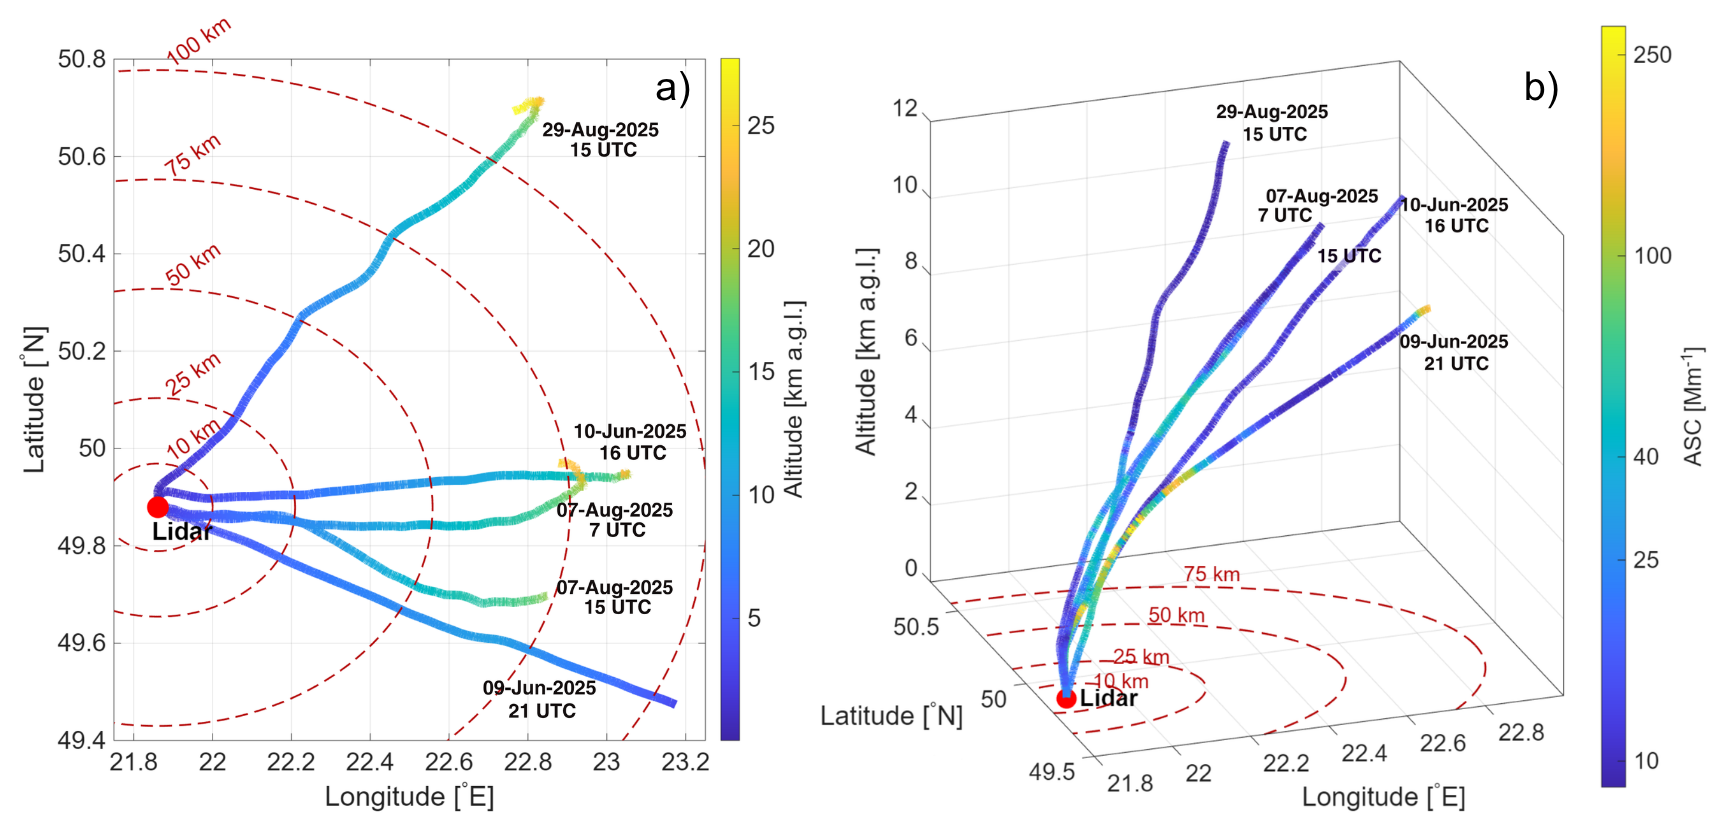
Figure 3Trajectories of the AeroSonde launched from the lidar station (red marker). (a) Horizontal trajectories colour-coded by altitude (km a.g.l.), illustrating the vertical evolution along the flight paths. Labels indicate the launch date and time (UTC). Dashed red circles denote radial distances from the station, providing a reference for horizontal displacement. (b) Aerosol scattering coefficient (ASC) profiles derived from AeroSonde measurements, shown in geographical coordinates (longitude, latitude) and altitude (km a.g.l.). Trajectories are colour-coded by ASC (logarithmic scale) and restricted to the altitude below 12 km a.g.l. For clarity, trajectories from 7 August 2025 are labelled once, with both measurement times (07:00 and 15:00 UTC) indicated.
The color-coded ASC values show a clear tendency toward higher values in the lower and middle troposphere. With increasing altitude, ASC generally decreases, except for the profile acquired on 9 June, where an increase in ASC is observed near 10 km. However, distinct elevated layers with enhanced ASC are intermittently observed, suggesting the presence of aerosol stratification and long-range transport features. These layers exhibit variability both within individual profiles and between different measurement days.
Due to the significant horizontal displacement of the sensors suspended beneath the balloon from the station, the methodology described in Sect. 2.3.2 was applied to get the AEC profiles. Comparison between profiles of ASC retrieved from AeroSonde measurements and AEC profiles obtained using the Klett LR method (AECLR; Fig. 4a) and the Klett AOD approach (AECAOD; Fig. 4b) was performed using 100 m vertical averages. Comparison was done for all available measurements, aggregated over all campaigns. For AECLR, ASC exhibits a Pearson correlation of r = 0.81 with an RMSE of 18.5 Mm−1, while for AECAOD, the correlation is slightly lower (r = 0.74) with a higher RMSE of 25.1 Mm−1. Both lidar retrievals show good agreement with AeroSonde-derived ASC, with the Klett LR method providing closer correspondence. The mean bias is positive in both cases-3.9 Mm−1 for AECLR and 6.4 Mm−1 for AECAOD-which is consistent with the expectation that AEC exceeds ASC due to aerosol absorption.
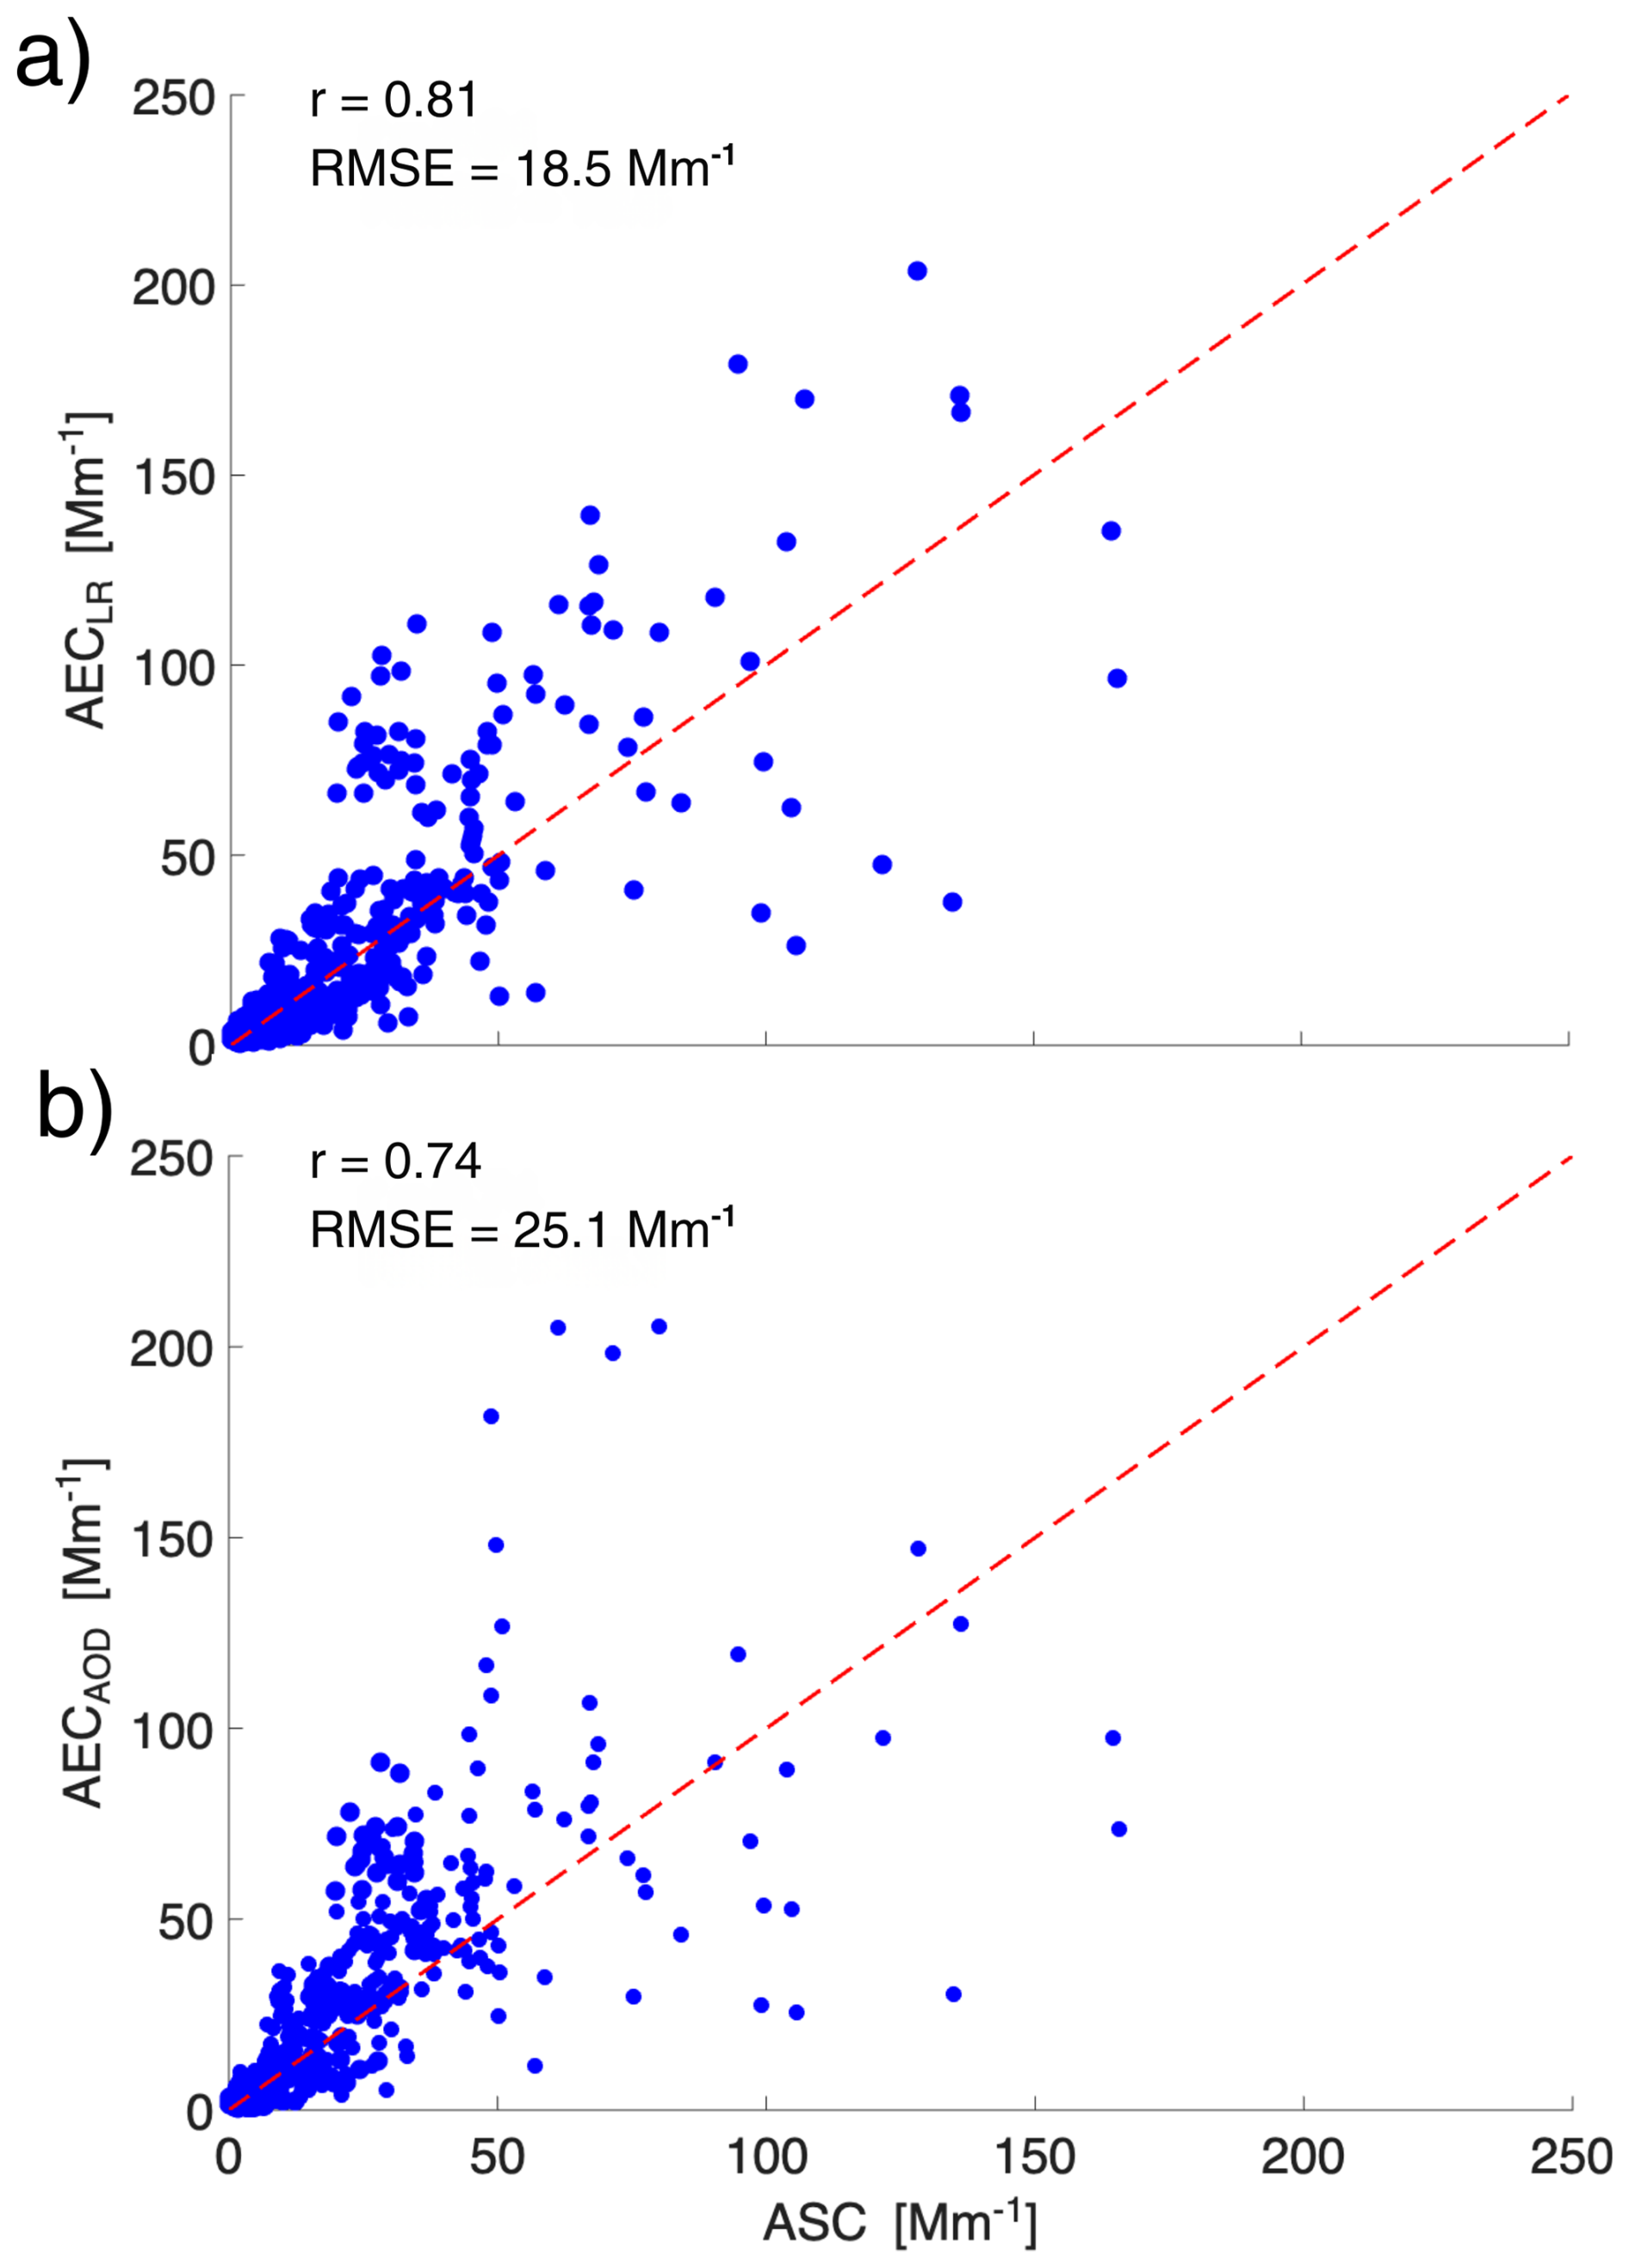
Figure 4Scatter plots of aerosol optical coefficients averaged within 100 m vertical intervals. The x axis shows the ASC at 525 nm retrieved from AeroSonde measurements, while the y axis presents the AEC at 532 nm derived from lidar observations. Panel (a) displays AEC retrieved using the Klett LR approach (AECLR), and panel (b) shows AEC from Klett AOD (AECAOD). For each panel, the Pearson correlation coefficient (r) and the root mean square error (RMSE) are reported.
Figure 5 shows the distributions of differences between AEC and ASC for all available measurements, aggregated over all campaigns. In the lowest layer (0.7–2 km) (Fig. 5a, b), both retrieval approaches exhibit a positive bias, which is larger for the AOD-constrained method (BIAS = 18.2 Mm−1, RMSE = 25.6 Mm−1) compared to the LR-based approach (BIAS = 12.5 Mm−1, RMSE = 16.3 Mm−1). The mean ASC in this layer is 20.5 Mm−1, while the AEC is 33.0 and 38.7 Mm−1, respectively, for the approach based on LR and AOD.
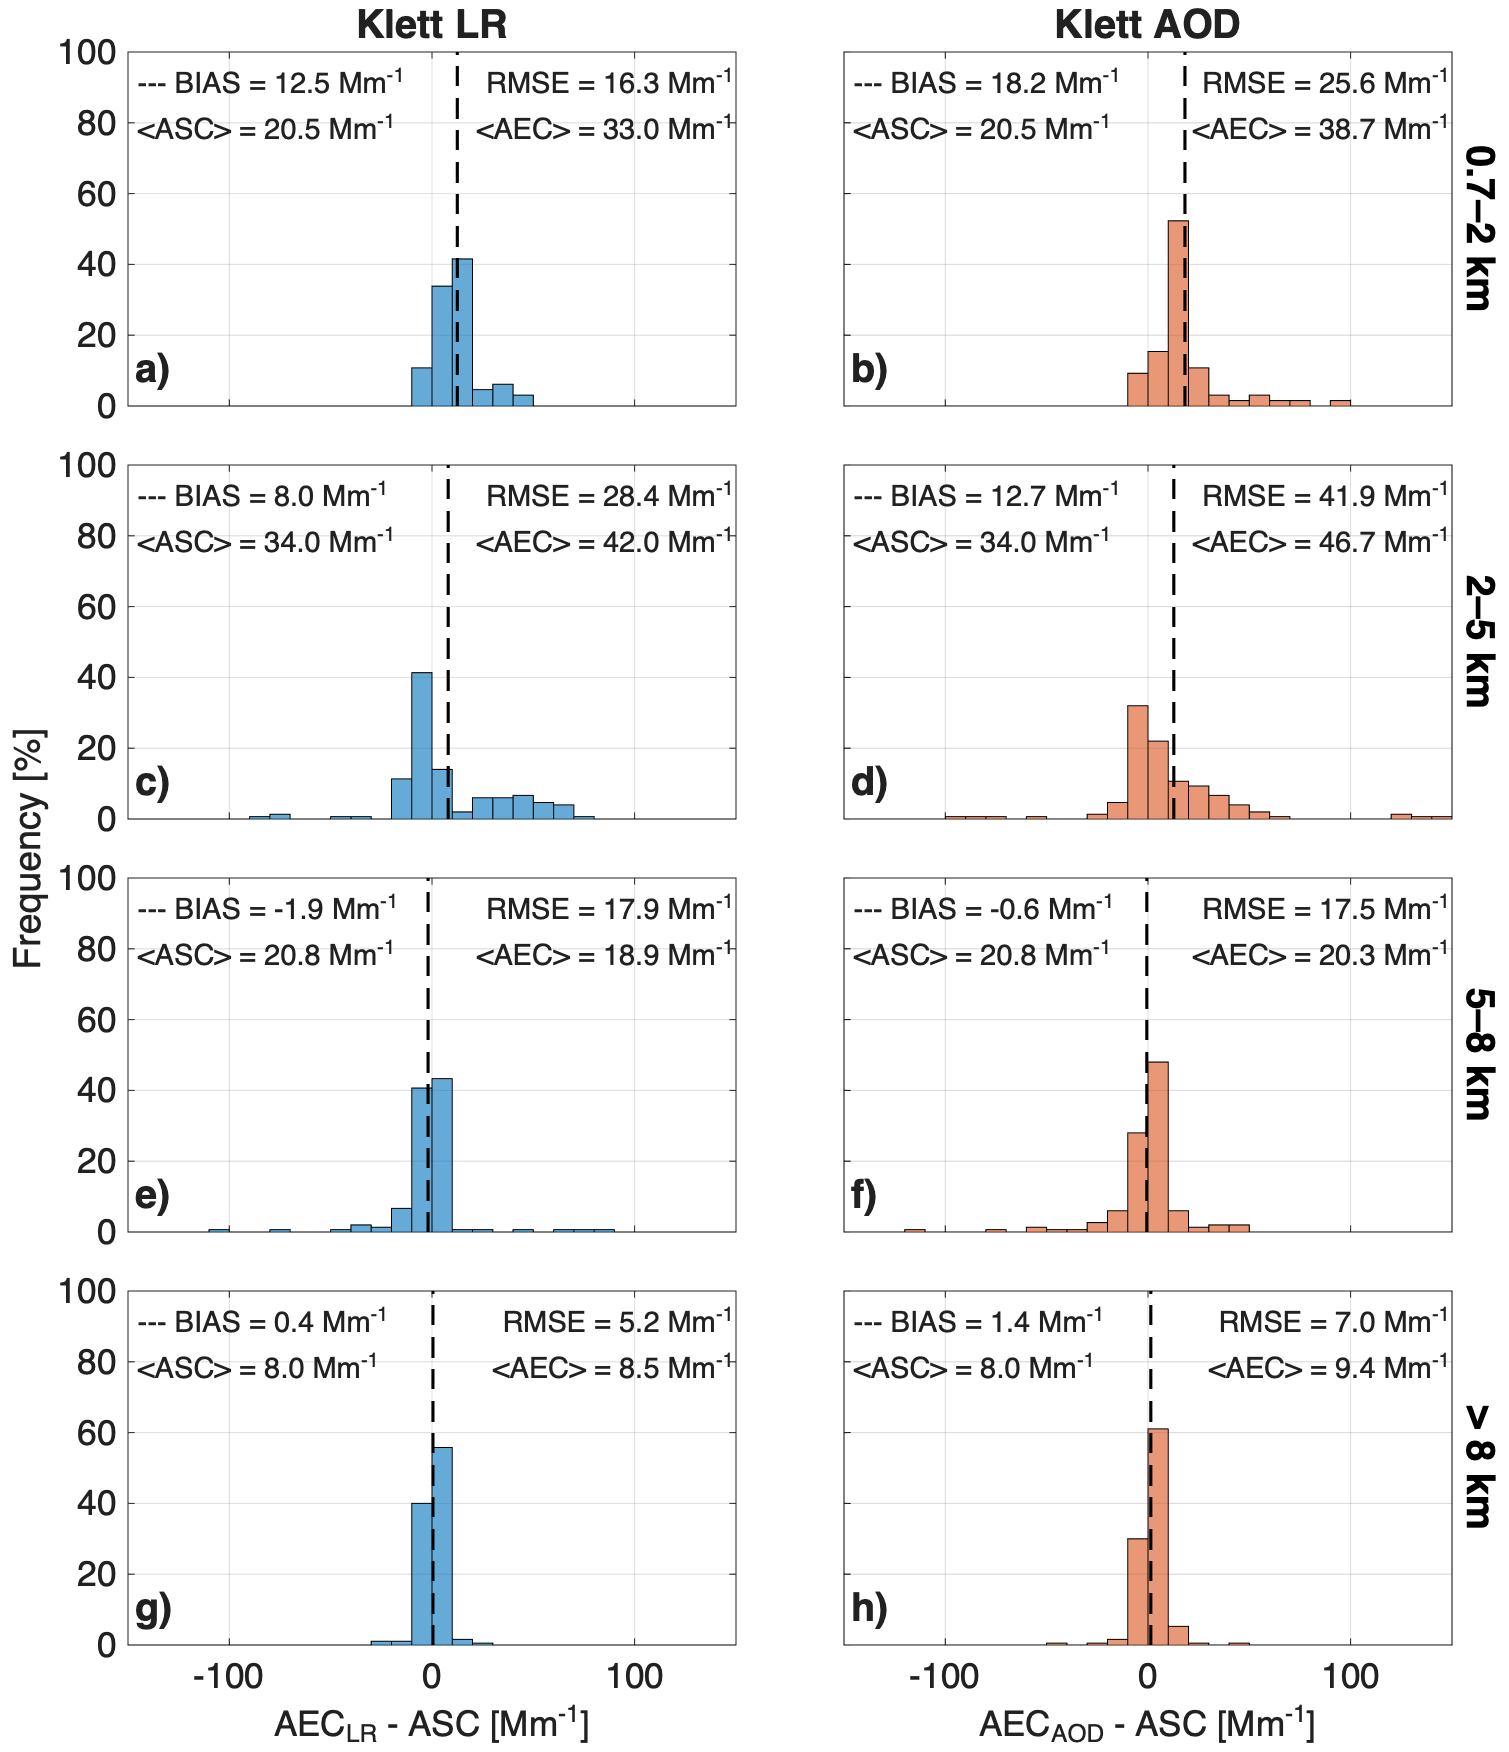
Figure 5Frequency distributions of the difference between the aerosol extinction coefficient at 532 nm (AEC) retrieved from lidar and the aerosol scattering coefficient at 525 nm (ASC) measured by the AeroSonde, using all data collected during the measurement campaigns. Columns correspond to the two lidar retrievals (Klett LR, blue; Klett AOD, orange) and rows to four altitude ranges, as indicated on the right-hand side. The dashed vertical line marks the mean bias (BIAS). Each panel also gives the root-mean-square error (RMSE) and the layer-mean values of ASC and AEC.
In the 2–5 km range (Fig. 5c, d), the distributions become broader for both lidar methods, indicating larger variability in AEC-ASC differences, with higher BIAS and RMSE for the AOD-based retrieval (BIAS = 12.7 Mm−1, RMSE = 41.9 Mm−1) than for the LR-based approach (BIAS = 8.0 Mm−1, RMSE = 28.4 Mm−1). In this layer the highest values of ASC (34.0 Mm−1) and AEC (42.0 and 46.7 Mm−1) are observed, indicating long-range transport of aerosols above the PBL.
At higher altitudes (5–8 km) (Fig. 5e, f), both methods show near-zero bias and narrower, more symmetric distributions, with BIAS = −1.9 and −0.6 Mm−1 and RMSE = 17.9 and 17.5 Mm−1 for the LR and AOD approaches, respectively. The slightly negative bias is somewhat unexpected, as AEC is generally expected to exceed ASC; however, the magnitude of this effect remains small. The mean ASC in this case is similar to mean between 0.7 and 2 km.
Above 8 km (Fig. 5g, h) both approaches also exhibit minimal bias (BIAS = 0.4 and 1.4 Mm−1) and low RMSE (5.2 and 7.0 Mm−1). In this case, the mean ASC is 8.0 Mm−1, while AEC is 8.5 and 9.4 Mm−1, respectively, for LR and AOD method.
4.1 Case Studies of Aerosol Vertical Profiles for Different Aerosol Types
To highlight the versatility of the AeroSonde system, we examine in detail two representative events, one dominated by BB aerosols and the other by mineral dust, showing how the system captures distinct vertical profiles.
4.1.1 Biomass burning aerosol
The first case covers measurements performed on 7 August 2025 at 15:20 UTC (Table 3). Under prevailing westerly flow, the ICAP forecast indicated a BB aerosol transport event from 7 to 11 August (see Fig. S4a). A high-pressure system over the measurement region led to subsidence inversions at 1.2–1.3 km (Fig. S5), which limited vertical mixing and favored the persistence of elevated aerosol layers above the PBL. As a result, aerosol layers were present throughout the day (Fig. S6), with well-defined structures between 4 and 11 km observed from 02:00 UTC onward. In the afternoon, under cloud-free conditions, as confirmed by whole sky camera observation, these layers descended and were primarily located between 3 and 8 km a.g.l.
All computed LAGRANTO back-trajectories initialized within the observed aerosol layers (except for the lowest at around 1 km) confirm long-range transport from Canada (Fig. 6). The trajectories follow consistent pathways across central Canada and the Atlantic, without strong curvature, spanning altitudes of 2–8 km. Along these pathways, air masses encountered regions over central Canada with high AODsmoke of up to 4.5, which gradually decreased toward Europe. Over Poland, AODsmoke exceeded 0.1, accounting for 61 % of the value of total AOD of around 0.3 (Fig. S4b). For the analyzed period AERONET observations reported an AOD500 of 0.23, with high AE440−870 (1.66) and SSA440 (0.996) (Table S1 in the Supplement).
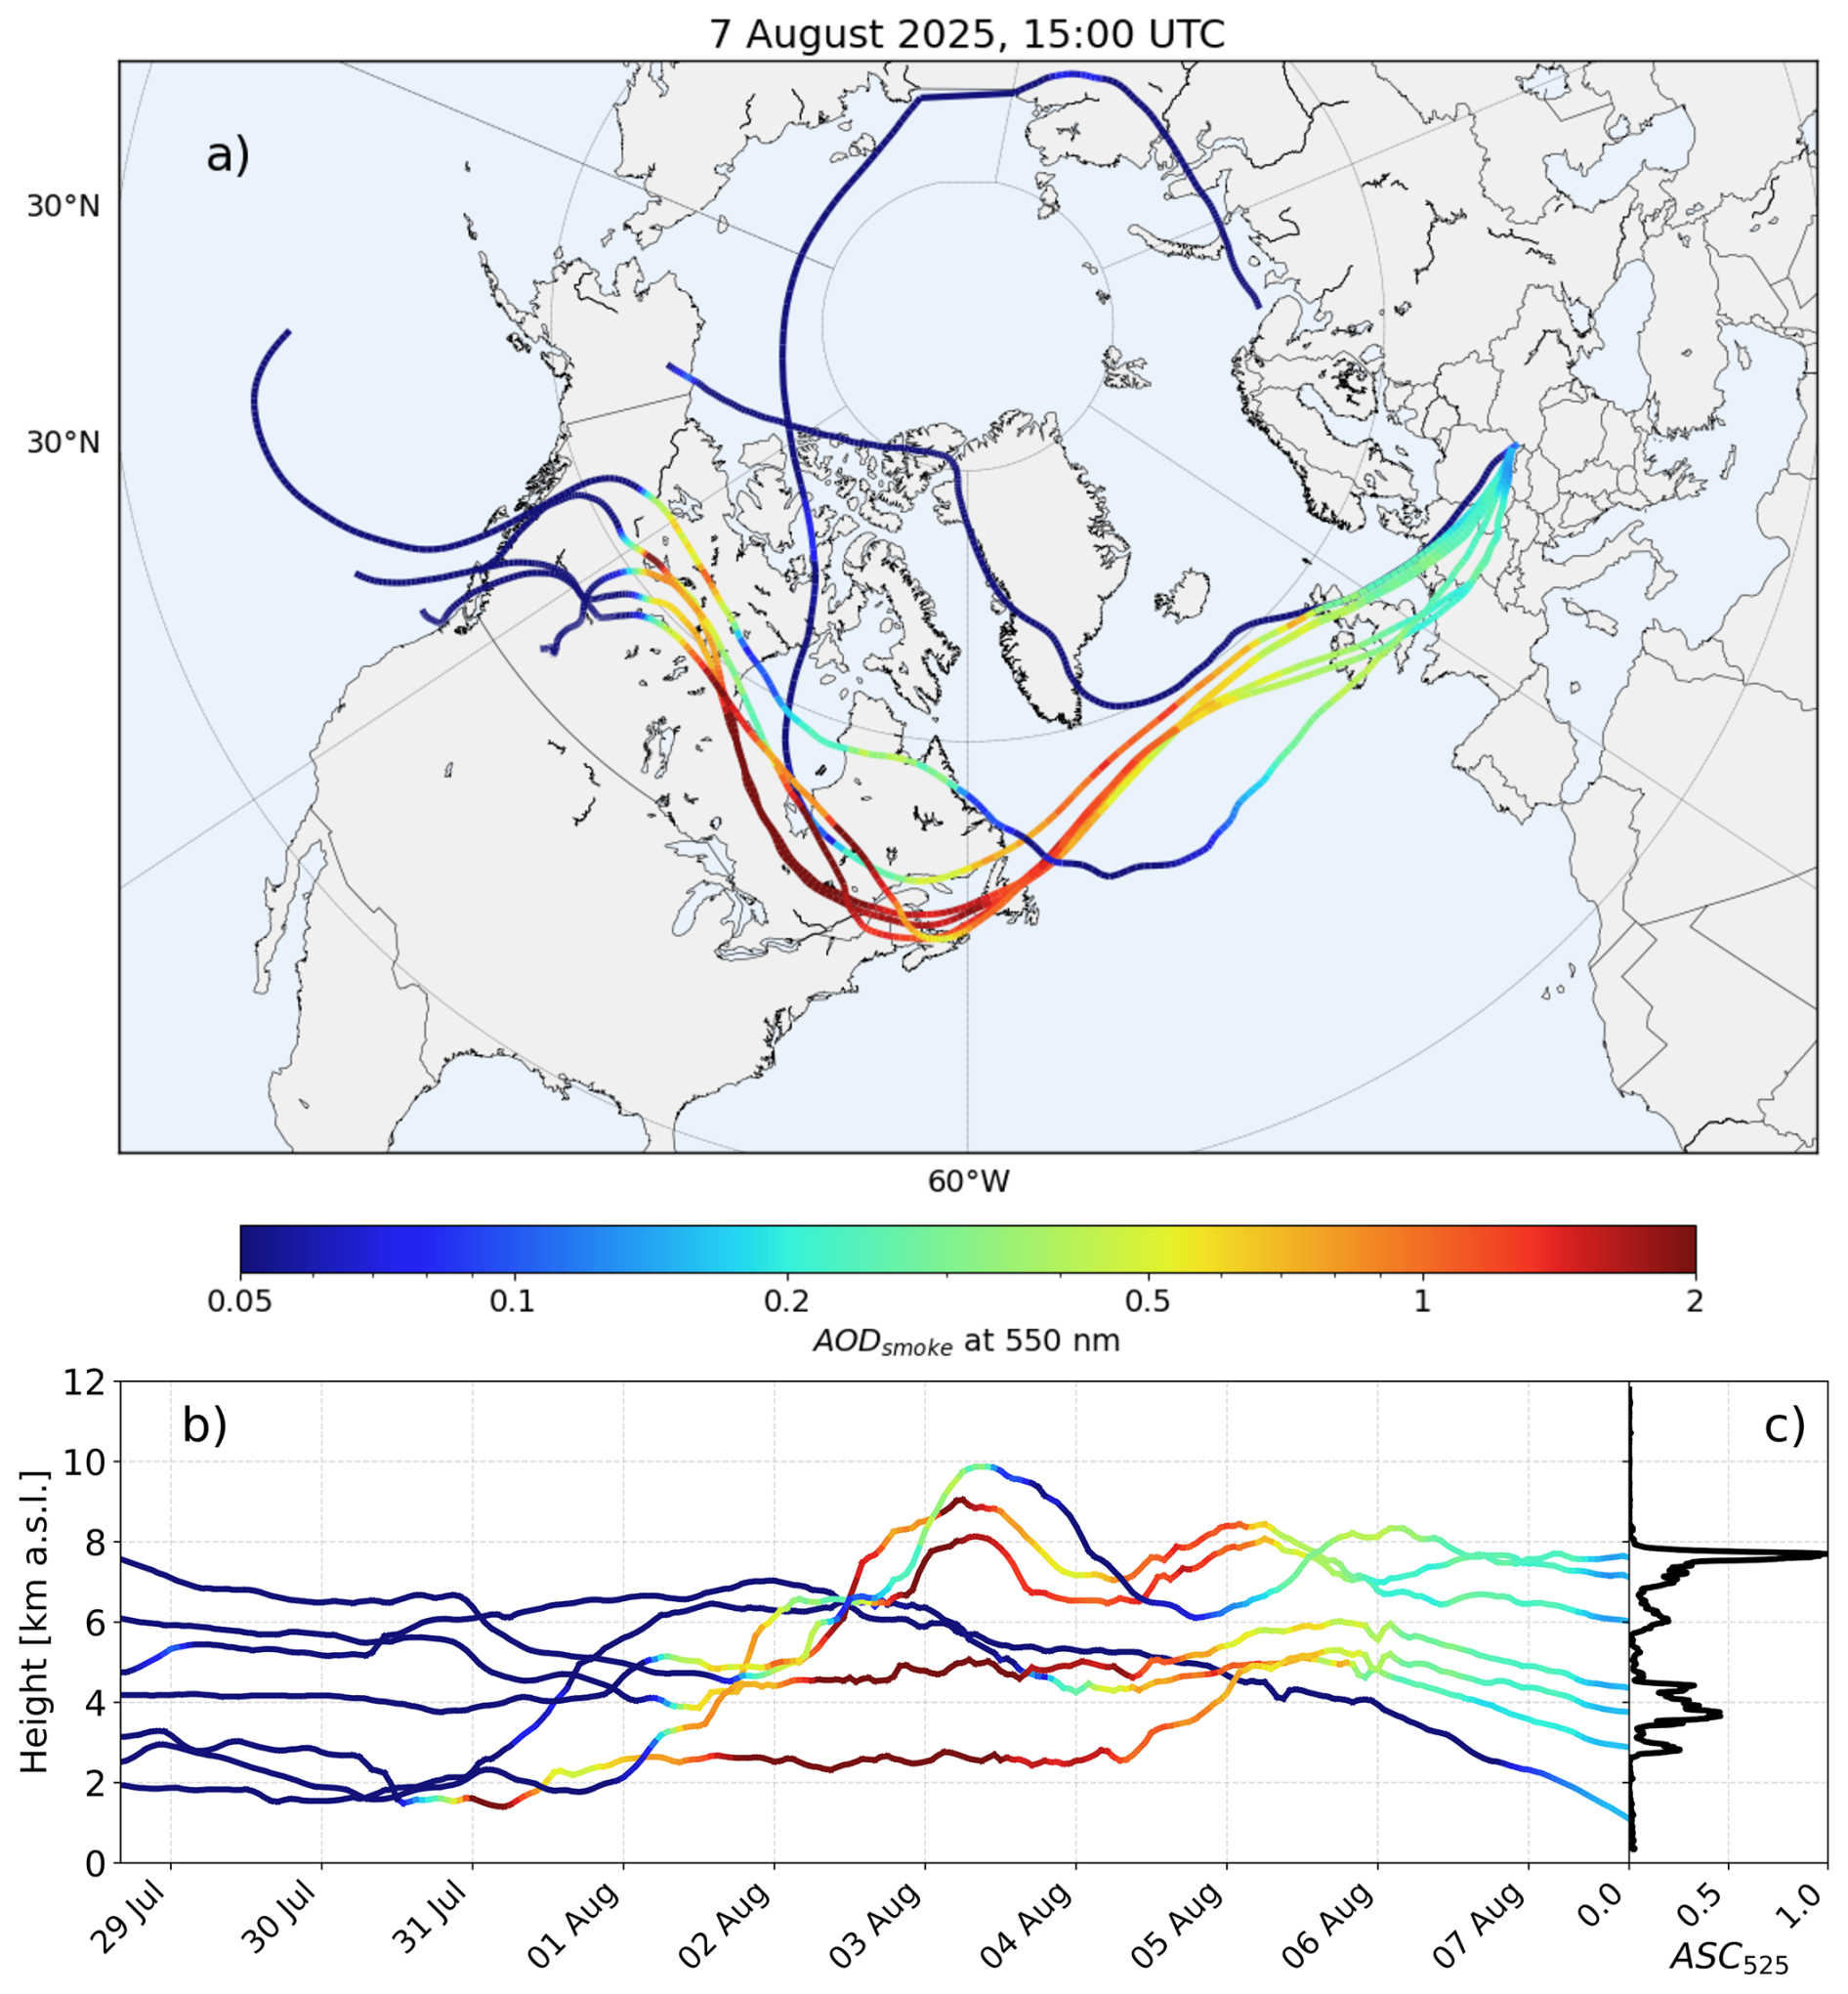
Figure 6LAGRANTO 10 d backtrajectories starting on 7 August 2025 at 15:00 UTC. Panels (a) and (b) show the geographical distribution and the vertical cross-section of the selected trajectories, respectively. Line colours represent ICAP AODsmoke at 550 nm. Panel (c) shows the normalised profile of ASC525 measured by the AeroSonde.
According to the raw (not calibrated) data obtained from the AeroSonde (Fig. 7), the identified aerosol layers are dominated by fine-mode particles, as PM1 closely follows PM10 throughout the profile (Fig. 7a). Several layers with elevated PM1 and PM10 concentrations, relative to near-surface values, are observed between approximately 2 and 8 km. This is further supported by the particle number concentrations, where contributions from size bins larger than 1 µm remain negligible across the entire profile (Fig. 7b). Additionally, the coarse-to-fine mass ratio (Fig. 7d) remains low, generally below 0.12, while the relative contribution of particles larger than 1 µm (Fig. 7e) does not exceed 2 % within the aerosol layer.
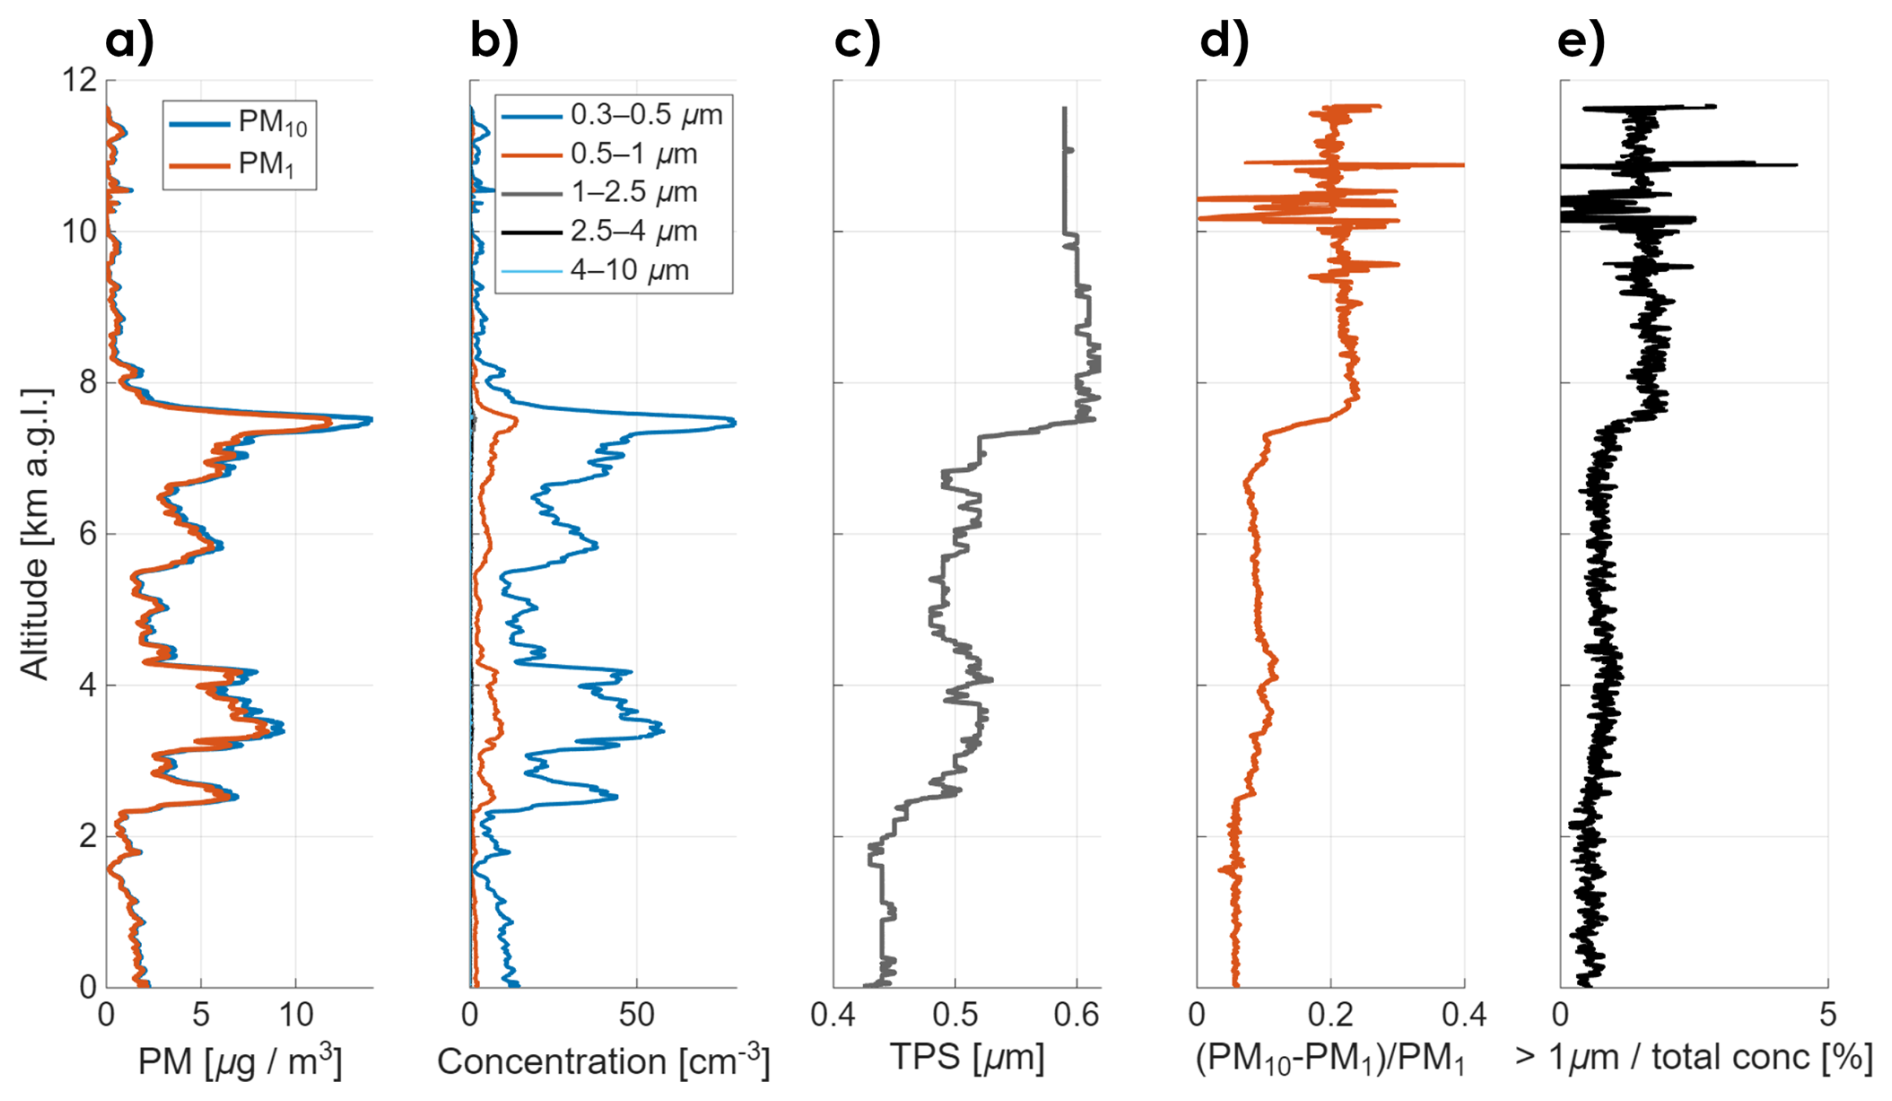
Figure 7Vertical profiles of raw data obtained by AeroSonde during measurements on 7 August 2025, 15:20-16:30 UTC. Panel (a) shows mass concentrations of PM1 and PM10. Panel (b) presents particle number concentrations for selected size ranges (0.3–0.5, 0.5–1, 1–2.5, 2.5–4, and 4–10 µm). Panel (c) shows the typical particles size parameter (TPS). Panel (d) displays the coarse-to-fine mass ratio expressed as (PM10 − PM1) PM1. Panel (e) presents the contribution of particles larger than 1 µm to the total number concentration.
Within the identified aerosol layers, the TPS profile (Fig. 7c) shows relatively limited variability, with values confined to the range of 0.45–0.55 µm. An increase in TPS is observed near the upper boundary of the main aerosol layer (below 8 km), coinciding with an increase in the coarse-to-fine mass ratio and the contribution of particles larger than 1 µm to the total number concentration. Above 10 km, the coarse-to-fine ratio exhibits increased variability; however, this behaviour is not reflected in the TPS profile, which remains relatively smooth. This may indicate the influence of the retrieval algorithm, which likely reduces sensitivity to noise in this parameter. It should be emphasized that aerosol concentrations above 8 km are very low, and therefore TPS measurements in this range are likely associated with significant uncertainties.
AeroSonde measurements captured the lower aerosol layers at around 2.3–4.3 km, and the upper layer (5.5–7.8 km a.g.l.), with peak values between 6.7 and 7.7 km (Fig. 8b). Retrieved ASC exceeded 40 Mm−1, reaching a maximum of 70 Mm−1 near 7.5 km, with an uncertainty of approximately 35 %. The aerosol layer terminates at an altitude of approximately 8 km, which is associated with a noticeable change in the temperature gradient (isothermal layer) and a sharp decrease in dew point temperature at this height (Fig. S5).
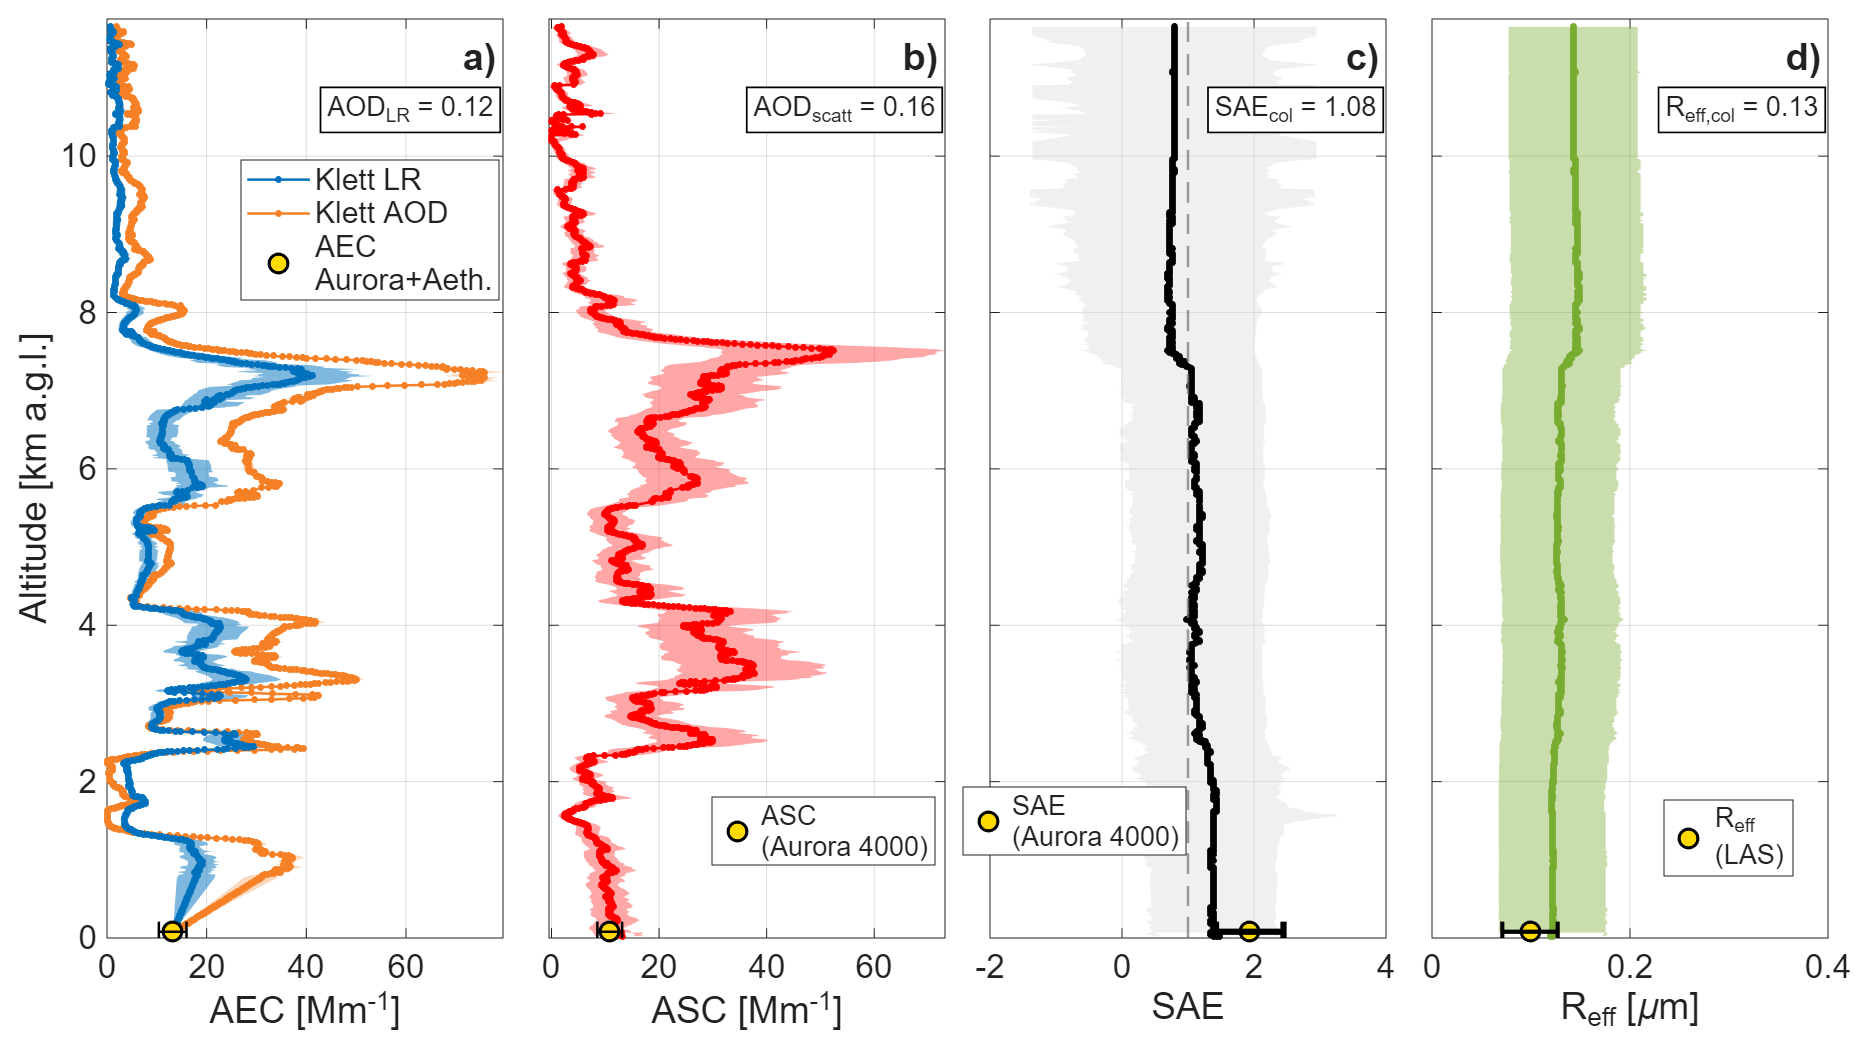
Figure 8Results of the measurements on 7 August 2025, 15:20–16:30 UTC. Panel (a) shows the aerosol extinction coefficient at 532 nm (AEC) retrieved from the Raymetrics LB10-V-D200 lidar signal, assuming either a constant lidar ratio (Klett LR, blue) or an AOD constraint (Klett AOD, red), temporally and vertically collocated with the AeroSonde ascent. Panel (b) shows the aerosol scattering coefficient at 525 nm (ASC) derived from the SPS30 sensor, panel (c) the scattering Ångström exponent (SAE), and panel (d) the effective radius (Reff), all derived from SPS30 data. The dashed vertical line in panel (c) marks SAE = 1, a commonly used threshold separating fine- from coarse-mode-dominated aerosol. The box in the upper right corner of each panel gives the corresponding column-integrated quantity: AOD from the Klett LR profile in panel (a), the scattering aerosol optical depth (SAOD) in panel (b), the columnar SAE (SAEcol, Eq. A7) in panel (c), and the columnar effective radius (Reff, col) in panel (d), each integrated over the altitude range shown. Yellow markers outlined in black show the near-surface reference values with their measurement uncertainties: in panel (a) the sum of ASC from the Aurora 4000 nephelometer and the aerosol absorption coefficient (AAC) from the AE31 aethalometer, in panels (b) and (c) the Aurora 4000 values, and in panel (d) the value from the LAS 3340.
In this case, the lower layer (2.3–4.3 km a.g.l.) contributed 32.1 % to the total AOD derived from AeroSonde ASC profiles, compared to 27.6 %–30.1 % from lidar. The upper layer (5.5–7.8 km a.g.l.) accounted for 36.3 % according to AeroSonde data and 34.1 %–38.8 % from lidar retrievals.
The correlation between AEC (Fig. 8a) and ASC (Fig. 8b) profiles was 0.75 for the Klett LR retrieval and 0.74 for the Klett AOD retrieval. The Klett LR method yielded a peak AEC of 41 Mm−1 at 7.2 km, whereas the Klett AOD approach produced a more pronounced maximum exceeding 75 Mm−1, representing the largest discrepancy between the methods. In other layers, AEC from the Klett LR retrieval was typically lower by 15–25 Mm−1. The LR-based profile shows layers between 2.5 and 4.2 km with maxima of 20–30 Mm−1, and values above 10 Mm−1 above 5.5 km. In contrast, the Klett AOD profile exceeds 25 Mm−1 in both lower and upper layers, reaching up to 50 Mm−1 at 3.3 km. The uncertainty of the Klett LR retrieval was approximately 24 % within aerosol layers, compared to around 3 % for the AOD-constrained method.
Reff remains nearly constant (Fig. 8c,d) throughout most of the lower and middle troposphere. A distinct change occurs near the top of the main aerosol layer, where an increase in Reff is accompanied by a decrease in SAE. Above this level, both parameters stabilize, although the aerosol load becomes sparse.
4.1.2 Dust aerosol
The second case covers measurements made on 29 August 2025, when the observation region lay between a low-pressure system over the United Kingdom and a high-pressure system over Eastern Europe, resulting in southwesterly flow over the region, favoring the advection of air masses from lower latitudes. Consistent with this synoptic setting, the ICAP forecast for 28 August–2 September indicated a dust aerosol influx, with a peak event on 29–30 August (Fig. S7a). On that day, there was one isothermal layer at an altitude of approximately 0.7 km and one thermal inversion layer in the middle troposphere at an altitude of 5.5 km (Fig. S8), the latter being characteristic of subtropical air masses and associated with large-scale subsidence (Barreto et al., 2022), thereby limiting vertical mixing and contributing to the stratified structure of the observed aerosol layers.
Lidar observations confirmed the presence of aerosol layers, extended from 1–1.5 up to 4–5 km a.g.l. (Fig. S9). Whole sky camera shows that clouds present above these layers dissipated after 15:00 UTC, resulting in cloud-free conditions during the AeroSonde measurements. The dust layers remained relatively stable, with a gradual ascent of the lower layer (1.5–2.5 km) and little variability above 3 km.
LAGRANTO back-trajectories indicate two distinct air-mass origins. The lowest trajectories (1–2.3 km a.s.l.) originated from the north and transported relatively clean air, whereas higher-altitude trajectories (2.6–5.3 km a.s.l.) passed over northern Africa, confirming Saharan dust transport (Fig. 9a). Consistently, the ICAP model shows AODdust values of up to 1.16 over northwestern Africa and 0.17 over Poland (Fig. 9b), with dust contributing 58 % to the total AOD (0.3–0.4) over Poland (Fig. S7b).
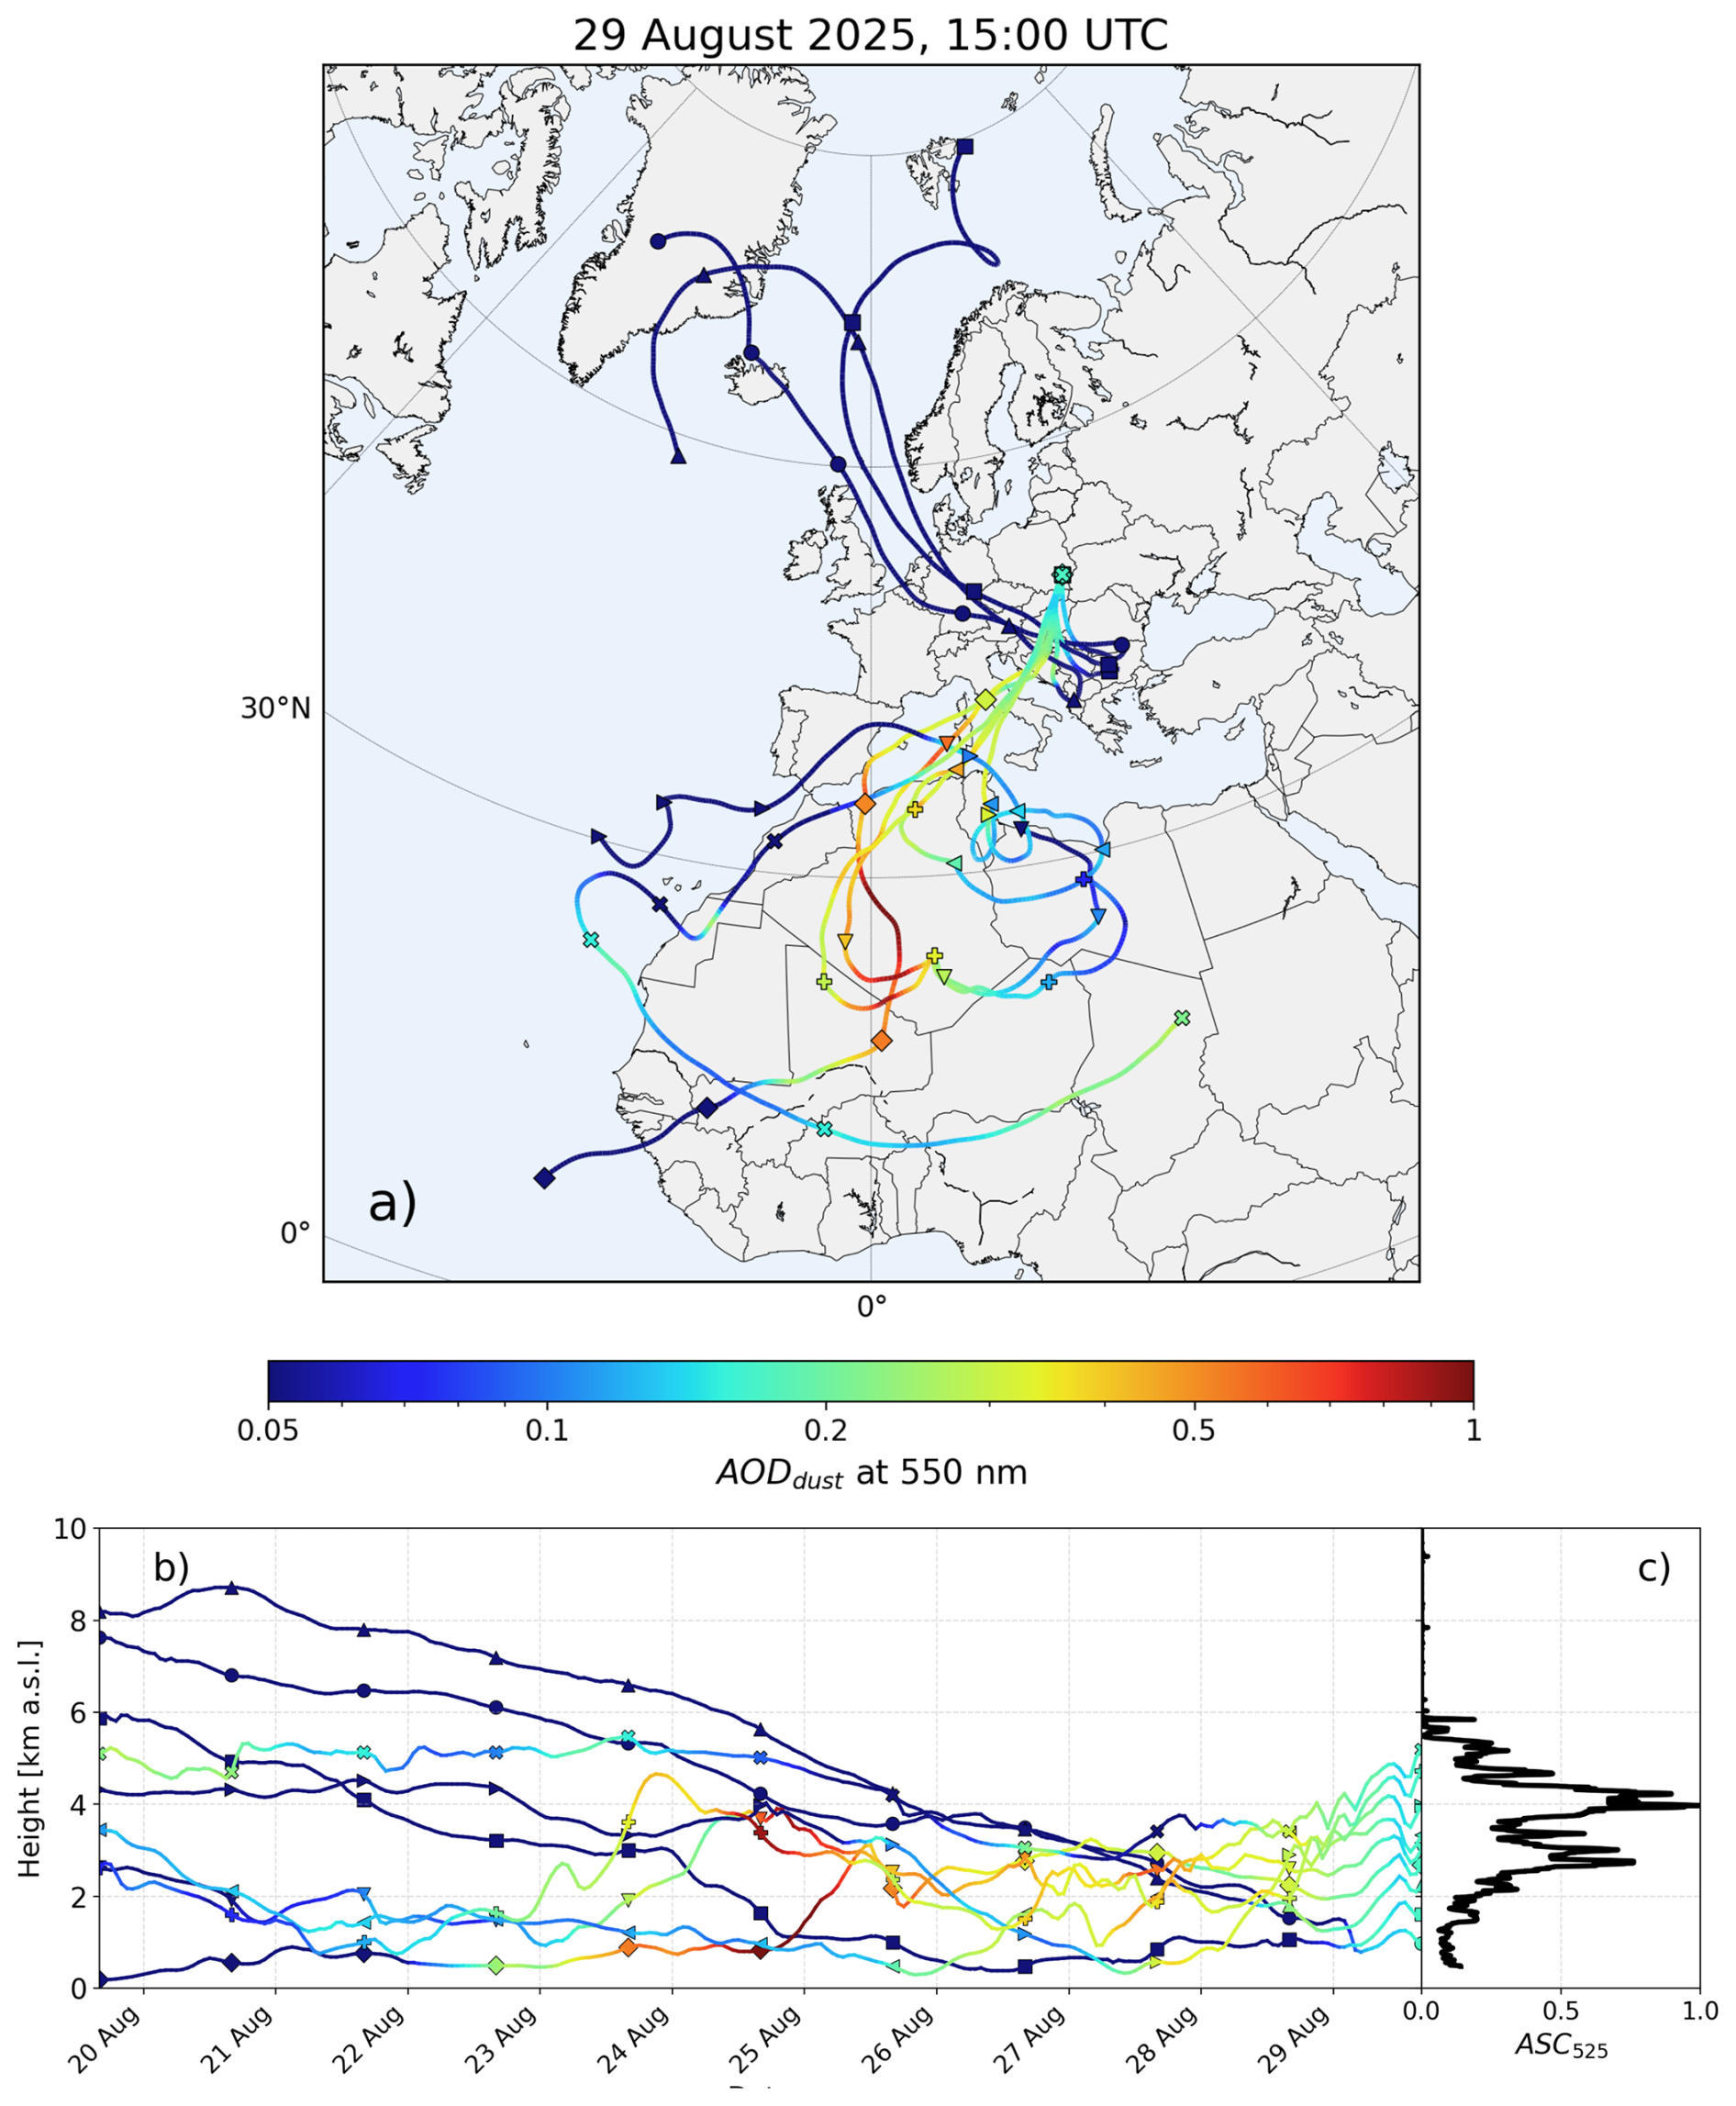
Figure 9LAGRANTO 10 d backtrajectories starting on 29 August 2025 at 15:00 UTC. Panels (a) and (b) show the geographical distribution and the vertical cross-section of the selected trajectories, respectively. Line colours represent ICAP AODdust at 550 nm, and, for clarity, each trajectory is marked with distinct symbols. Panel (c) shows the normalised profile of ASC525 measured by the AeroSonde.
At 15:20 UTC on 29 August, AERONET reported AOD500 of 0.30 (August mean: 0.19), with low AE440−870 (0.40) and SSA440 of 0.93, consistent with coarse-mode dust dominance.
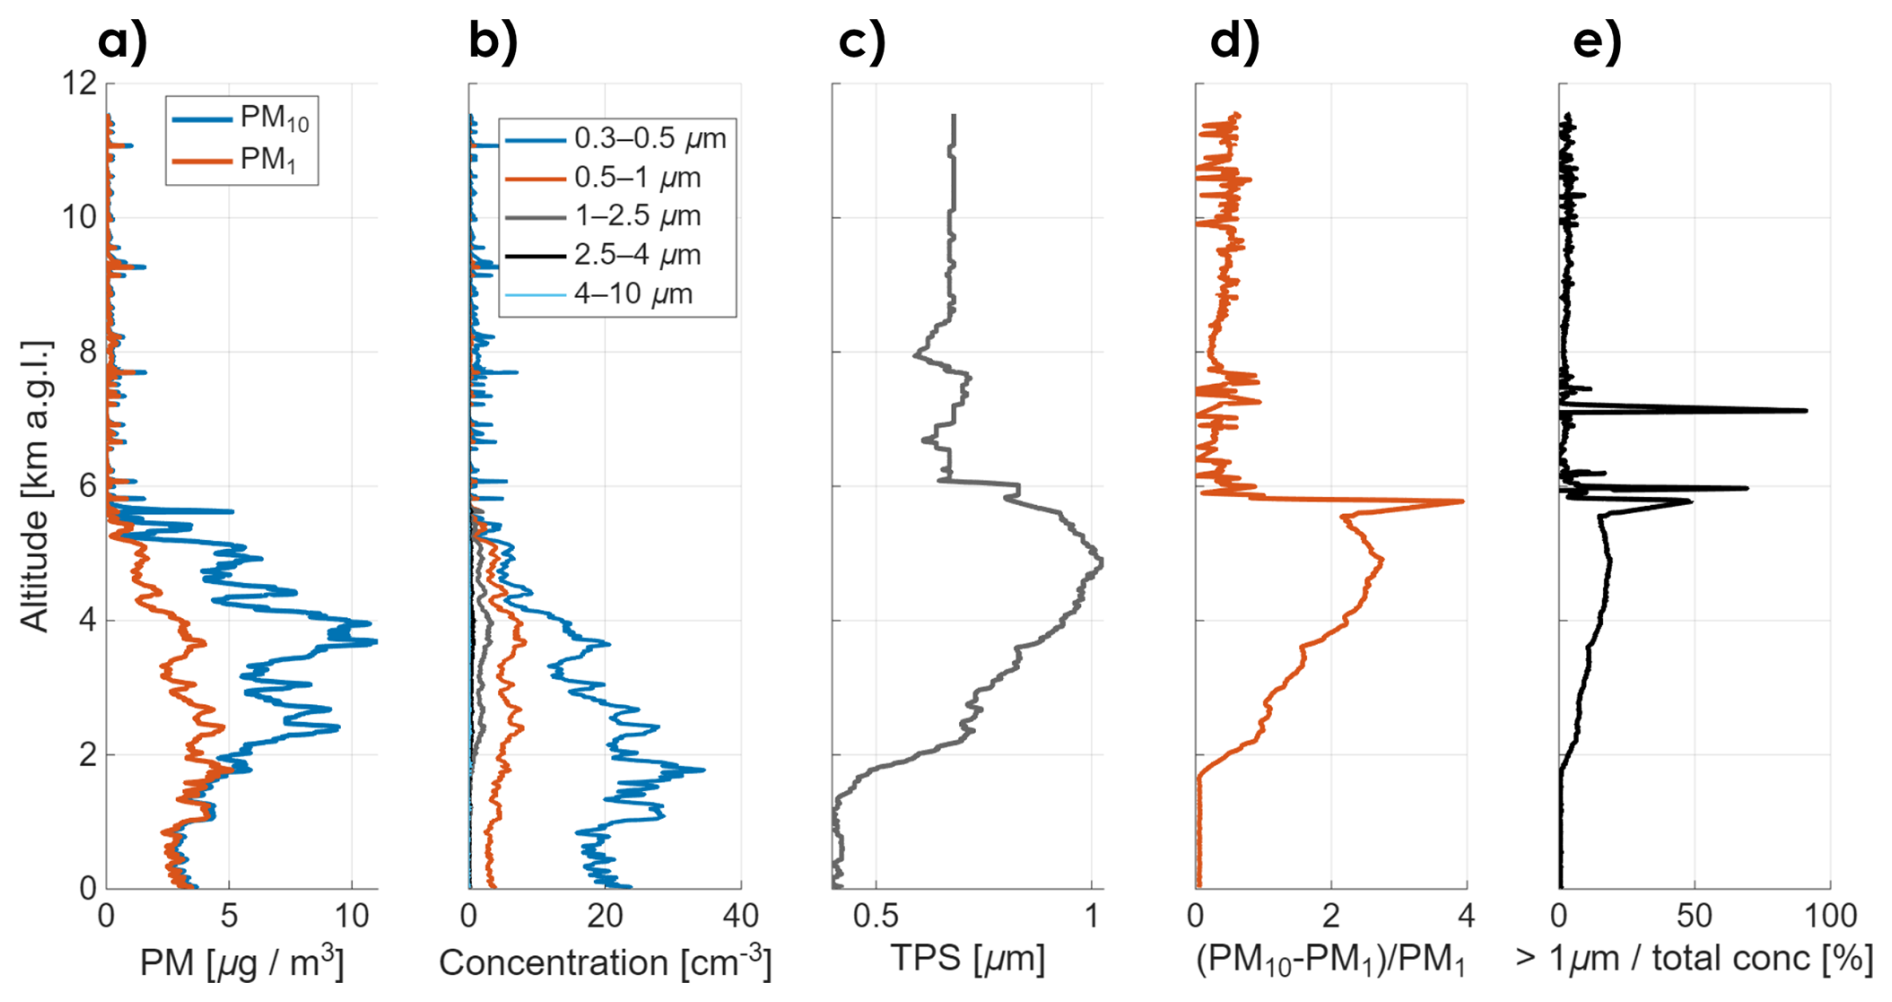
Figure 10Vertical profiles of raw data obtained by AeroSonde during measurements on 29 August 2025, 15:20–16:30 UTC. Same variables as in Fig. 7
On 29 August 2025, sounding was conducted from 15:00 to 17:00 UTC. In contrast to the BB case, the identified aerosol layer exhibits a substantial contribution from coarse-mode particles (Fig. 10). This is reflected in the divergence between PM1 and PM10 (Fig. 10a), particularly within the main layer between 3 and 6 km, where PM10 significantly exceeds PM1. This behaviour is further supported by the particle number concentrations (Fig. 10b), which show noticeable contributions from size bin 1–2.5 µm within the same altitude range. Additionally, the coarse-to-fine mass ratio (Fig. 10d) increases markedly within the layer, reaching values above 2–3, while the relative contribution of particles larger than 1 µm (Fig. 10e) rises up to 20 % where the aerosol load peaks.
The TPS profile (Fig. 10c) shows pronounced variability, with values increasing up to 1.0 µm within the main aerosol layer. The vertical structure of TPS generally follows that of the coarse-to-fine ratio and the contribution of particles larger than 1 µm, although it does not reproduce the sharp peaks observed in these profiles. This behaviour may indicate the influence of the retrieval algorithm, which likely smooths the TPS profile. At the same time, TPS responds to the presence of larger particles, increasing within the aerosol layer where the coarse-mode contribution is enhanced, while remaining relatively constant above the layer.
During this sounding, a single aerosol layer was observed, with elevated ASC values (> 15 Mm−1) extending from the surface up to a peak at approximately 3.7 km, reaching 40 Mm−1 (Fig. 11b). The highest values (> 30 Mm−1) occurred between 2.3 and 4 km, with an associated uncertainty of around 43 %. Above 5.8 km, ASC decreased to near-background levels. Thermodynamic profiles (Fig. S8) indicate that the aerosol layer was located above the PBL, with maximum humidity in its middle part (3–4 km). Its upper boundary coincides with a temperature inversion at around 5.5 km, although a small fraction of aerosol extends above this level, contributing 7 %–8 % to the total AOD and likely representing background free tropospheric aerosol. Aerosol found between 1.5–5.2 km a.g.l. contributed substantially to the total AOD: 43.1 % from AeroSonde ASC profiles, compared to 39.3 % and 33.1 % from the Klett LR and Klett AOD retrievals, respectively.
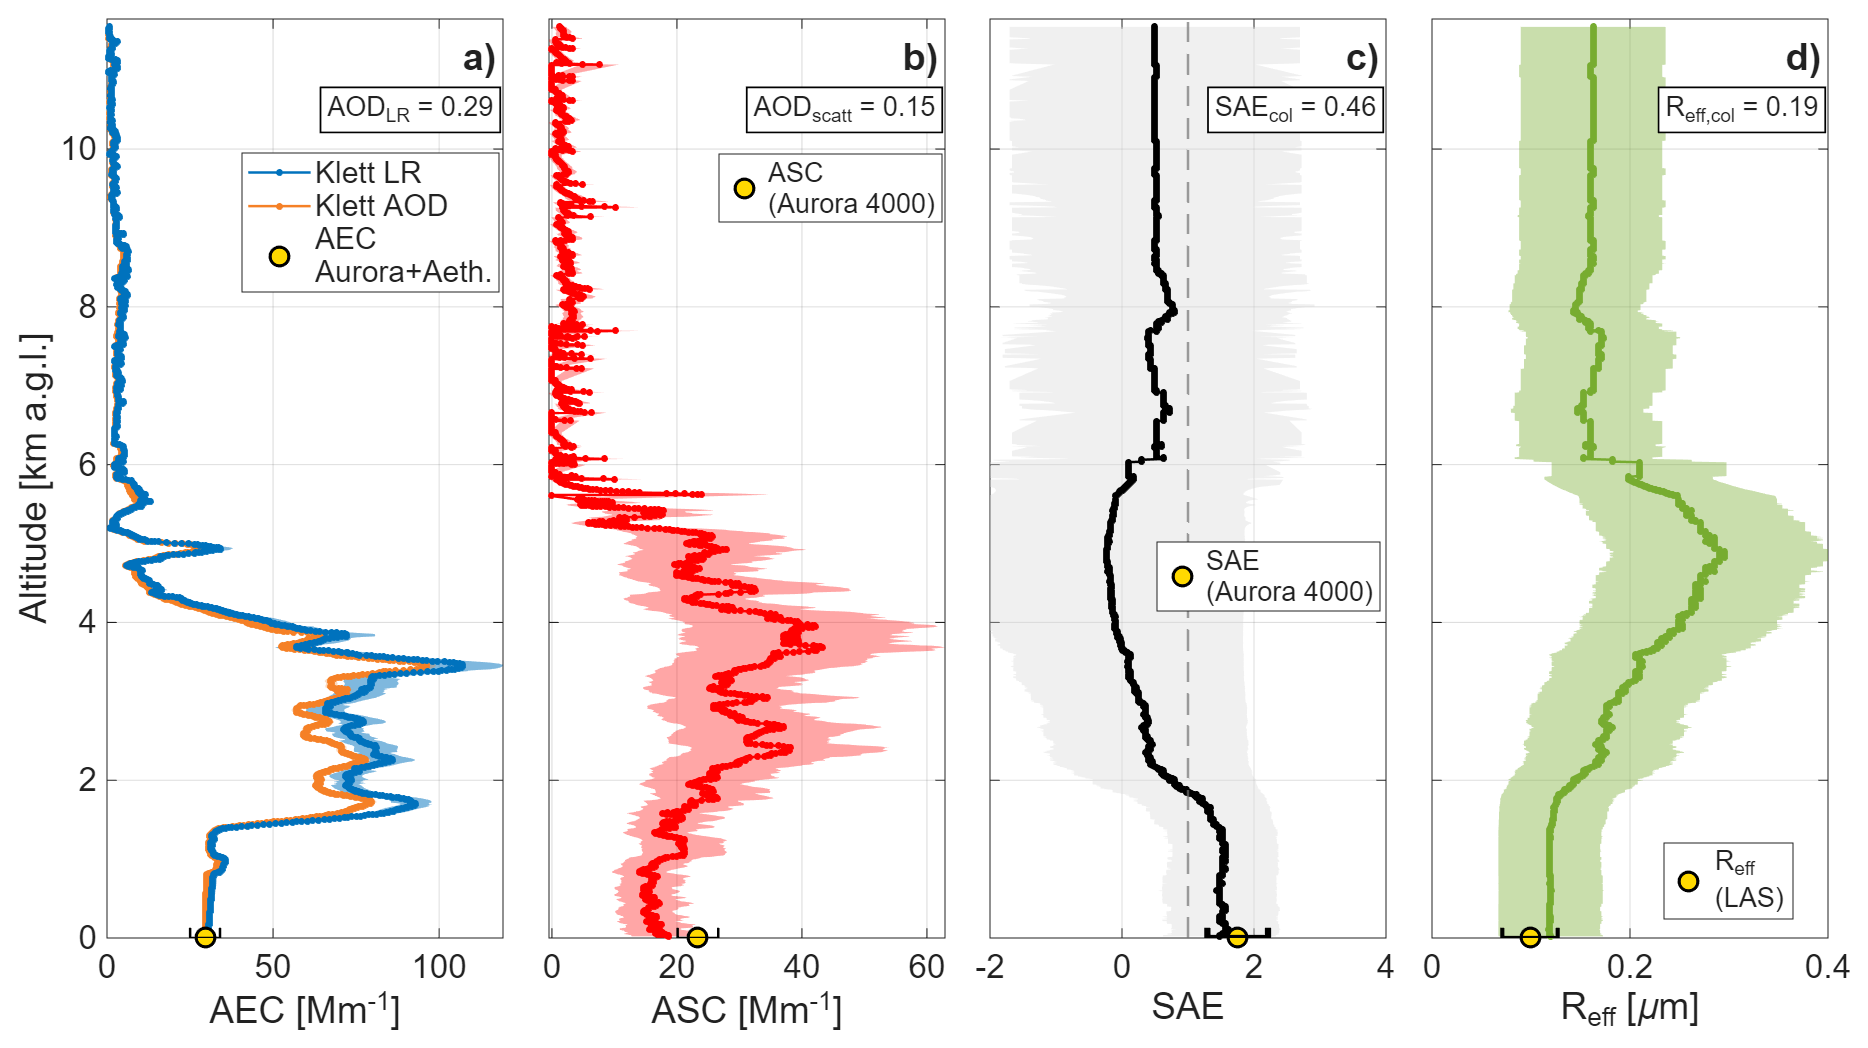
Figure 11Results of the measurements on 29 August 2025, 15:20–16:30 UTC. Same variables as in Fig. 8.
The correlation between AEC (Fig. 11a) and ASC (Fig. 11b) profiles was 0.85 for both Klett retrievals. Both AEC profiles show a distinct layer above 1.4 km, which is less pronounced in the ASC profile. The Klett LR retrieval yields slightly higher AEC values, with a peak of 107 Mm−1 at 3.5 km, and a secondary maximum of 35 Mm−1 near 5 km. Within the 1.5–4 km layer, AEC from the Klett LR method exceeds the AOD-constrained retrieval by 5–15 Mm−1, with differences of up to 20 Mm−1 near 5 km. The uncertainty is around 10 % for the LR retrieval and 2.5 % for the AOD-constrained approach.
Vertical profiles of microphysical parameters (Fig. 11c, d) show that Reff increases with altitude within the main aerosol layer, reaching a maximum near the peak aerosol loading, and decreases above this level. At higher altitudes, Reff stabilizes. In contrast, SAE remains nearly constant within the PBL and decreases above it, reaching a minimum where Reff is highest, before increasing again toward 5 km. At higher altitudes, SAE variability follows that of Reff, with lower values associated with larger particles. Above 8.5 km, both parameters become nearly constant.
Vertical profiles obtained using the AeroSonde and lidar show a similar aerosol layer structure in both qualitative and quantitative terms. Some differences in the values of optical parameters are evident and arise from several factors. First, they result from the different physical quantities measured by the two instruments (ASC versus AEC). Second, they are related to the measurement limitations of the SPS30 sensor and the inversion methods applied to lidar data in the elastic 532 nm channel. Third, they stem from the fact that the balloon-borne sonde does not follow a purely vertical path, and atmospheric conditions vary along its trajectory. Figures 8 and 11 show that the altitudes of layers with maximum values can differ by up to 100 m between AeroSonde and lidar measurements. Averaging over 100 m vertical intervals mitigates discrepancies arising from the differing sampling strategies of the two systems, with lidar probing a fixed vertical column and the AeroSonde following a slanted ascent profile. The assumption of horizontal homogeneity of the wind field, applied to enable lidar-sonde comparisons (Appendix A2), is a simplification of real atmospheric conditions and may introduce additional pointwise differences between AEC and ASC at individual altitudes. It should be noted that previous studies primarily focused on the validation of lidar-derived aerosol properties (backscattering coefficient) using in situ measurements (Brunamonti et al., 2021). Therefore, in the present work, lidar observations cannot be treated as an absolute reference, but rather as an independent dataset for comparison.
The vertical profiles of ASC obtained from the AeroSonde enable estimation of SAOD, columnar SAE, and, when combined with AERONET single-scattering albedo (SSA) data, also AOD. Table 4 compares these quantities with measurements from the sun photometer. The AOD comparison shows excellent agreement on 9 June (bias 0.01), moderate discrepancies on 7 August (0.05), and the largest difference on 29 August (0.11). During the Saharan dust intrusion, both AOD and ASC measured by the AeroSonde were significantly underestimated relative to AERONET and lidar-derived AEC.
Table 4Values of AOD532 calculated using Eq. (A3), and SSA532 obtained by linear interpolation between SSA at 440 nm and 675 nm, based on AERONET data (level 1.5). The scattering Angström exponent SAE440−675 is computed from AERONET AOD and SSA using Eq. (A11). SAOD denotes the integrated ASC from the AeroSonde measurements, while AOD represents the AOD retrieved from the AeroSonde profile using Eq. (A10). Additionally, the table includes the columnar SAEcol derived from AeroSonde data using Eq. (A7).
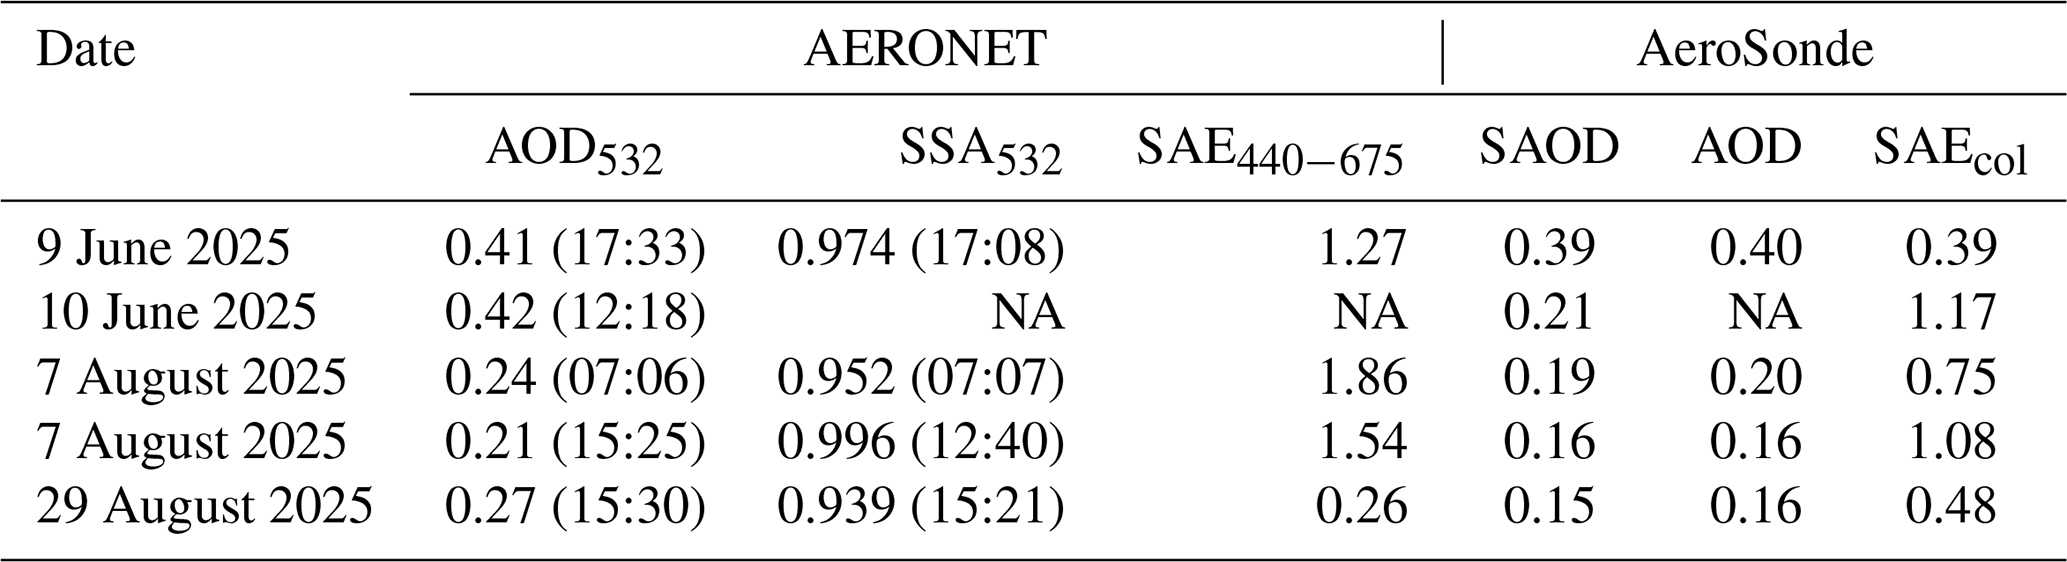
NA: not available.
Several factors contribute to these discrepancies. First, mineral dust can substantially increase AEC due to absorption (Müller et al., 2009), with reported single scattering albedo values typically ranging from approximately 0.85 to 0.95 depending on composition and wavelength (Dubovik et al., 2002; Sokolik and Toon, 1999). This indicates a non-negligible absorption contribution, particularly in the presence of iron oxides, which may lead to underestimation of extinction when using scattering-based measurements alone. Second, the use of only elastic lidar channels limits retrieval accuracy; Raman channels would provide more precise characterization (Ansmann et al., 1992), but were not available during these measurements. Third, particle nonsphericity and differing measurement geometries affect the comparisons: the SPS30 measures at a scattering angle of approximately 90°, whereas the lidar detects backscatter at 180°. For mineral dust, the scattering phase function reaches a minimum near 90°, causing the SPS30 to potentially underestimate ASC (Podgorny et al., 2000). It should also be noted that no depolarization measurements were available, as the lidar system operated at a single wavelength without polarization capability. Such measurements would enable the identification of nonspherical particles, such as mineral dust, and could therefore provide additional constraints to better interpret the observed discrepancies.
Previous studies indicate that the SPS30 performance decreases in the presence of coarse, dust-like aerosols, particularly for PM10 (Nevrlý et al., 2024; Kuula et al., 2020). Field observations during Saharan dust events show that PM10 is often underestimated relative to reference instruments, reflecting the sensor's design, which is better suited for fine-mode aerosols (Nevrlý et al., 2024; Tryner et al., 2020). Laboratory and intercomparison studies further demonstrate limited size selectivity in low-cost optical sensors, including the SPS30, with coarse particles (> 5 µm) prone to misclassification or undercounting due to restricted bin resolution and reliance on optical scattering principles (Kuula et al., 2020). Moreover, laboratory experiments with monodisperse aerosols reveal that the SPS30 response depends on particle size and material properties, with increasing deviations for larger particles (Nothhelfer et al., 2025).
These results highlight the need for aerosol-type-dependent calibration and careful interpretation of SPS30-derived PM10 data, particularly when relying on factory calibration in dust-influenced environments (Nothhelfer et al., 2025; AQMD, 2021; Tryner et al., 2020). To address this limitation, the SPS30 should be calibrated against the Aurora 4000 under a range of aerosol conditions, capturing the variability in the conversion between particle mass (as reported by the SPS30) and optical properties arising from differences in chemical composition and particle size. Accordingly, Eq. (1) should be revised to explicitly account for the relationship between reported mass concentration and ASC.
Differences in measurement geometry may also contribute to discrepancies between AeroSonde, lidar, and sun photometer columnar properties. During the Saharan dust event, the balloon-borne sonde travelled northeast, the lidar performed vertical profiling, and the sun photometer measured AOD along a westward slanted column. Given the strong spatial and temporal variability during this event, these differing measurement geometries could have introduced substantial variability in the retrieved optical quantities (Ryan et al., 2025).
The uncertainty of AeroSonde-derived ASC ranges from 35 %–43 %, while lidar AEC uncertainties vary between 10 %–35 % (Klett LR) and 2 %–19 % (Klett AOD). Derived quantities such as SAE and Reff exhibit larger uncertainties, particularly for clean layers with low ASC; these uncertainties amount to approximately ±1.0 for SAE and range from ±0.05 to ±0.1 µm for Reff. Columnar quantities (SAOD, SAEcol, Reff,col) were evaluated assuming full correlation of uncertainties with altitude, yielding upper-limit uncertainties of 33 %–43 % for SAOD and ±1.0 for SAEcol and ±0.07 µm for Reff,col. Comparisons with AERONET indicate that SAE retrievals from AeroSonde are less robust and should be interpreted cautiously.
A rigorous quantification of uncertainties in the column-integrated parameters (SAOD and SAEcol) remains challenging, as the vertical correlation of uncertainties in ASC and SAE is unknown. The maximum uncertainty in SAOD is estimated by assuming full correlation (correlation coefficient equal to 1) between ASC uncertainties at all altitude levels. Similarly, the upper-limit uncertainty of SAEcol is calculated under the assumption of full correlation between ASC and SAE uncertainties at each altitude. These estimates, therefore, represent conservative upper bounds rather than precise uncertainty quantification, since a realistic characterization of vertical error correlations is not feasible in the present study. Under these assumptions, the upper limit of SAOD uncertainty ranges from 33 % to 43 %.
In contrast, uncertainties in SAEcol and Reff,col are substantially larger, exceeding ±1.0 for SAEcol and ±0.06–0.07 µm for Reff,col. For AERONET AE440−870, reported uncertainties are on the order of ±0.3 at AOD440 ∼ 0.15, increasing to ±0.6 when AOD440 drops to ∼ 0.08, showing an approximate inverse dependence on AOD (Zhang et al., 2025). This comparison further indicates that SAE retrievals from AeroSonde data are less robust and should be interpreted with caution, particularly when used for aerosol-type classification.
Table 5The planetary boundary layer (PBL) height and the corresponding contribution of AOD within the PBL to the total AOD. Values are derived from AeroSonde vertical profiles and lidar retrievals (Klett LR and Klett AOD methods).
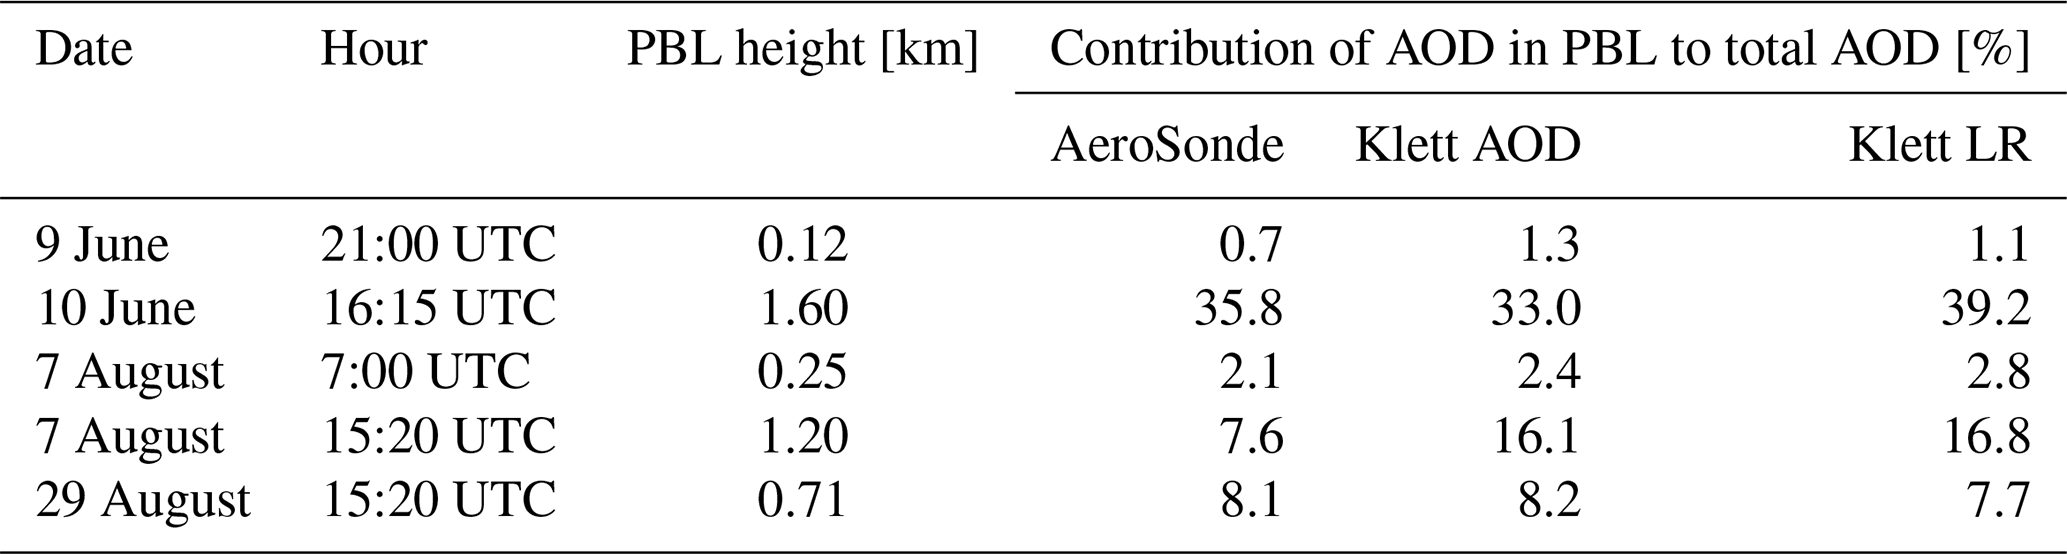
AeroSonde measurements also enable estimation of the contribution of the PBL to total AOD. During the analysed long-range transport events, the contribution from aerosol found within PBL ranged from approximately 1 % to 36 %, which is comparable to lidar-based estimates that varied between 1 % and 33 % for the Klett AOD retrieval and between 1 % and 39 % for the Klett LR method (Table 5). These findings are broadly consistent with CALIOP aerosol extinction data, indicating that roughly 69 % of tropospheric AOD originates within the PBL and 31 % in the free troposphere, with a similar day-night vertical distribution due to the persistence of a residual layer at night (Bourgeois et al., 2018). Regional lidar studies in Warsaw show that aerosols within the PBL contribute approximately 61 % of total AOD (Wang et al., 2019). Unlike lidar measurements, the AeroSonde approach is not affected by limitations associated with PBL heights below the lidar overlap layer, enabling more reliable characterization of boundary-layer aerosol contributions.
Compared to UAV-based measurement platforms, the balloon-borne AeroSonde offers several distinct advantages that enhance its suitability for atmospheric aerosol studies. Its passive ascent, without active air intake, prevents flow-induced artefacts and avoids particle size-selective sampling that can result from propeller-induced turbulence in drones, enabling a more representative characterization of the ambient aerosol population. Additionally, the AeroSonde can reach altitudes extending into the stratosphere, making it particularly valuable for monitoring phenomena such as volcanic eruption plumes, whereas UAV platforms are generally restricted to the lower troposphere. A notable limitation of the AeroSonde, however, is its typical non-recoverability after launch. In contrast, UAV systems allow sensors to be reused, facilitating repeated flights at lower operational cost. To ensure accurate measurements, each SPS30 sensor deployed on the AeroSonde must therefore be calibrated through colocated measurements with the Aurora 4000 across a wide range of aerosol conditions, capturing the full variability of both ASC and SAE.
Finally, the AeroSonde provides a valuable tool for validating vertical aerosol profiles from reanalysis and model products (e.g. CAMS, MERRA-2, NAAPS). Direct measurements of light scattering in the lower troposphere enable an independent assessment of modelled aerosol profiles.
Future work could expand the capabilities of the AeroSonde system. The measurement capability of the system could be extended by integrating additional sensors, subject to the mass constraints of the platform (currently 175 g including the housing). A single-channel aethalometer would allow the AAC, and hence the SSA, to be retrieved directly rather than relying on columnar AERONET values, which would substantially improve the AOD estimates discussed above. A dedicated optical particle sizer with extended size range would address the principal limitation identified in the dust case, namely the reduced sensitivity of the SPS30 to coarse-mode particles. A further possibility is closer integration with the meteorological radiosonde, so that thermodynamic and aerosol measurements are provided by a single unit. In each case, the added mass and power consumption must be weighed against the benefit.
Beyond the platform itself, combining the AeroSonde with a Raman lidar would allow retrieval of AEC without assuming a fixed LR or relying solely on AOD, improving the quantitative accuracy of vertical aerosol characterisation and enhancing closure studies.
This study presents and demonstrates a new balloon-borne measurement system (AeroSonde) designed to provide high-resolution, vertically resolved observations of aerosol optical properties, delivering profiles from the surface up to the upper troposphere and, in some cases, the lower stratosphere, with a vertical resolution of a few meters. The performance of the AeroSonde was evaluated across a limited number of case studies, which should be regarded as a proof-of-concept of the system’s capabilities. The measurements enable the estimation of ASC profiles, SAOD, and AOD, and show potential for supporting the evaluation of reanalysis products and satellite-based aerosol retrievals. The results indicate generally good agreement with lidar and AERONET observations, within the expected uncertainty range, and demonstrate that the SPS30 low-cost sensor is capable of capturing the main features of aerosol vertical structure. In particular, the system allows the identification of boundary-layer contributions and elevated layers associated with long-range transport. However, parameters such as SAE and Reff should be interpreted with caution and are better suited for qualitative characterization.
The most important findings are:
-
The vertical profiles of ASC measured by AeroSonde are consistent with simultaneous lidar observations, with Pearson correlation coefficients of 0.74–0.81 and RMSE values of 18.5–25.1 Mm−1, confirming the system's capability to resolve aerosol layering and optical properties.
-
AOD derived from AeroSonde agrees with AERONET values, with biases of 0.01–0.05 for BB and 0.11 for the dust case, which is consistent with the higher uncertainty associated with coarse-mode aerosol and its vertical variability.
-
Error analysis indicates that the AeroSonde is suitable for quantitative estimation of ASC, while SAE and Reff provide only a rough, qualitative characterization, particularly in terms of capturing vertical variability.
-
During long-range transport events, the contribution of AOD within the PBL does not exceed 33 %–39 %, and values derived independently from the AeroSonde and lidar remain mutually consistent, indicating that both measurement approaches capture a comparable vertical distribution of AOD.
Despite its limitations, the AeroSonde system demonstrates clear potential as a complementary tool to ground-based remote sensing and traditional radiosonde observations. Future work should focus on improved calibration strategies, particularly for coarse-mode aerosols such as mineral dust and sea salt, which remain a known limitation of low-cost optical sensors. Additional validation against reference-grade instruments is also required to better quantify measurement uncertainties, including the PM2.5 and PM10 mass concentrations, which were not independently calibrated in the present study. Validation covering a range of aerosol types and size distributions would allow a more robust assessment of performance of sensors and measurement uncertainty under atmospheric conditions. Furthermore, extended deployments under a wider range of aerosol regimes would help to assess the robustness of the proposed approach. The additional integration of the AeroSonde system with a Raman lidar would provide complementary information by enabling the retrieval of aerosol extinction profiles without assuming LR or AOD, which are typically required when using conventional lidar alone. Raman lidar, in particular, enables the determination of AE, which can be compared with the data obtained from the AeroSonde, offering deeper insight into the particle size distribution. Moreover, combining Raman lidar's AEC with the AeroSonde's ASC would allow estimation of the single scattering albedo. This combination would not only improve the accuracy of vertical aerosol profiles but also provide more reliable data for closure studies, as the dependence on assumptions such as LR and AOD would be minimized. These developments would further improve the quantitative capabilities of the AeroSonde system and broaden its applicability in atmospheric aerosol research.
A1 Lidar data processing
The recursive relationship used in the Klett algorithm is given by (Klett, 1985)
where βA and βR are the aerosol and molecular backscatter coefficients, S(z) is the range-corrected signal, Δz is the vertical resolution, RA is the inverse of the LR for aerosol scattering, and ψ is defined as
RR is the inverse of the LR for molecular scattering.
The AOD532 was derived from the 500 nm AOD (AOD500) and the Ångström exponent (AE440−870) calculated between 440 and 870 nm, according to
A2 Spatio-temporal adjustment of lidar profiles to AeroSonde observations
The procedure was as follows: for each AeroSonde measurement at altitude z, the horizontal distance d between the AeroSonde position (θ2,ϕ2) and the lidar site (θ1,ϕ1) was computed using the haversine formula:
where R is the Earth's radius, Δθ = θ2−θ1, and Δϕ = ϕ2−ϕ1 (latitudes and longitudes expressed in radians).
Using this distance, the temporal offset Δt was calculated as
where u(z) denotes the horizontal wind speed at altitude z. The time when the air parcel sampled by the AeroSonde was located above the lidar was then obtained as
where t is the AeroSonde timestamp.
For each altitude level z, the extinction coefficient was extracted from the lidar profile corresponding to time t′. In this way, a spatio-temporally matched extinction profile was reconstructed from the surface up to approximately 12 km.
The final profile was smoothed with a moving average using a five-point window. Given the typical AeroSonde vertical resolution of 5–9 m, this corresponds to an effective vertical averaging of approximately 25–45 m.
A3 AeroSonde data processing
Along with the retrieved aerosol extinction coefficient (AEC) profiles, aerosol scattering coefficient profiles (ASC), the scattering Ångström exponent (SAE), and the effective radius (Reff) were also derived, following the procedure described in Sect. 3. The correlation coefficient (r) was calculated between the ASC profiles derived from the AeroSonde and the AEC profiles retrieved from the lidar. Moreover, the columnar scattering Ångström exponent (SAEcol) was calculated as
and columnar effective radius (Reff,col) as
Using the ASC profile, the scattering aerosol optical depth (SAOD) was calculated as follows:
Using the calculated SAOD and the single scattering albedo (SSA) derived from AERONET, one can estimate AOD as:
Since AERONET does not provide SSA at 532 nm, the value was obtained by linear interpolation between SSA reported at 440 and 675 nm. The SAE from AERONET was calculated as:
where AOD440 and AOD675 are AOD at 440 and 675 nm, respectively, and SSA440 and SSA675 are SSA at 440 and 675 nm, respectively.
The resulting values of AOD, SAEcol and Reff,col were compared with those obtained from AERONET.
The AeroSonde, radiosonde, lidar and near-surface in situ data used in this study are openly available from RepOD at https://doi.org/10.18150/YGICBV (Broda, 2026). AERONET level 1.5 data for the Strzyżów site are available from https://aeronet.gsfc.nasa.gov/ (last access: 9 September 2026). ICAP-MME forecasts are available from https://usgodae.org/ (last access: 9 September 2026). LAGRANTO is available from https://iacweb.ethz.ch/staff/sprenger/lagranto/ (last access: 9 September 2026).
The supplement related to this article is available online at https://doi.org/10.5194/amt-19-5989-2026-supplement.
Conceptualization: OZM, MTC; Data curation: MB, OZM; Formal analysis: MB, OZM; Funding acquisition: OZM; Investigation: MB, KM, OZM, MTC, SK; Methodology: MB, OZM, MTC; Project administration: OZM; Resources: PM, KN; Software: MTC; Supervision: OZM; Validation: MB, OZM; Visualization: MB, OZM, KN; Writing – original draft preparation: OZM, MB, KM; Writing – review and editing: MB, OZM, MTC, KN, SK, PM, KM.
The contact author has declared that none of the authors has any competing interests.
Publisher's note: Copernicus Publications remains neutral with regard to jurisdictional claims made in the text, published maps, institutional affiliations, or any other geographical representation in this paper. The authors bear the ultimate responsibility for providing appropriate place names. Views expressed in the text are those of the authors and do not necessarily reflect the views of the publisher.
This research was carried out within the Polish National Science Centre Grant No. 2022/47/D/ST10/02099 and coordinated by the Institute of Geophysics, Faculty of Physics, University of Warsaw. The authors acknowledge AERONET-Europe for providing calibration services for the Strzyżów site. The authors would like to thank Justine Lunario for technical and electronic support related to the development of the AeroSonde system.
This research has been supported by the Narodowe Centrum Nauki (grant no. 2022/47/D/ST10/02099).
This paper was edited by Cuiqi Zhang and reviewed by Alkistis Papetta and two anonymous referees.
Adam, M., Nicolae, D., Stachlewska, I. S., Papayannis, A., and Balis, D.: Biomass burning events measured by lidars in EARLINET – Part 1: Data analysis methodology, Atmos. Chem. Phys., 20, 13905–13927, https://doi.org/10.5194/acp-20-13905-2020, 2020. a
Anderson, T. and Ogren, J.: Determining Aerosol Radiative Properties Using the TSI 3563 Integrating Nephelometer, Aerosol Sci. Tech., 29, 57–69, https://doi.org/10.1080/02786829808965551, 1998. a
Ansmann, A., Wandinger, U., Riebesell, M., Weitkamp, C., and Michaelis, W.: Independent measurement of extinction and backscatter profiles in cirrus clouds by using a combined Raman elastic-backscatter lidar, Appl. Optics, 31, 7113–7131, https://doi.org/10.1364/AO.31.007113, 1992. a
AQMD: Sensor Evaluation Report: Sensirion SPS30, Technical report, South Coast Air Quality Management District, https://www.aqmd.gov/docs/default-source/aq-spec/summary/sensirion-sps30---summary-report.pdf (last access: 17 December 2025), 2021. a
Arnott, W., Hamasha, K., Moosmüller, H., Sheridan, P., and Ogren, J.: Towards Aerosol Light-Absorption Measurements with a 7-Wavelength Aethalometer: Evaluation with a Photoacoustic Instrument and 3-Wavelength Nephelometer, Aerosol Sci. Tech., 39, 17–29, https://doi.org/10.1080/027868290901972, 2005. a
Barreto, Á., Cuevas, E., García, R. D., Carrillo, J., Prospero, J. M., Ilić, L., Basart, S., Berjón, A. J., Marrero, C. L., Hernández, Y., Bustos, J. J., Ničković, S., and Yela, M.: Long-term characterisation of the vertical structure of the Saharan Air Layer over the Canary Islands using lidar and radiosonde profiles: implications for radiative and cloud processes over the subtropical Atlantic Ocean, Atmos. Chem. Phys., 22, 739–763, https://doi.org/10.5194/acp-22-739-2022, 2022. a
Bazo, E., Granados-Muñoz, M., Román, R., Bravo-Aranda, J., Cazorla, A., Valenzuela, A., González, R., Olmo, F., and Alados-Arboledas, L.: Evaluation of the vertically-resolved aerosol radiative effect on shortwave and longwave ranges using sun-sky photometer and ceilometer measurements, Atmos. Res., 282, 106517, https://doi.org/10.1016/j.atmosres.2022.106517, 2023. a
Bourgeois, Q., Ekman, A. M. L., Renard, J.-B., Krejci, R., Devasthale, A., Bender, F. A.-M., Riipinen, I., Berthet, G., and Tackett, J. L.: How much of the global aerosol optical depth is found in the boundary layer and free troposphere?, Atmos. Chem. Phys., 18, 7709–7720, https://doi.org/10.5194/acp-18-7709-2018, 2018. a
Broda, M.: AeroSonde balloon-borne aerosol soundings and collocated lidar, radiosonde and surface observations, Strzyżów (Poland), June–August 2025, V2, RepOD [data set], https://doi.org/10.18150/YGICBV, 2026. a
Brunamonti, S., Martucci, G., Romanens, G., Poltera, Y., Wienhold, F. G., Hervo, M., Haefele, A., and Navas-Guzmán, F.: Validation of aerosol backscatter profiles from Raman lidar and ceilometer using balloon-borne measurements, Atmos. Chem. Phys., 21, 2267–2285, https://doi.org/10.5194/acp-21-2267-2021, 2021. a, b
Cai, Z., Li, Z., Li, P., Li, J., Sun, H., Yang, Y., Gao, X., Ren, G., Ren, R., and Wei, J.: Vertical distributions of aerosol microphysical and optical properties based on aircraft measurements made over the Loess Plateau in China, Atmos. Environ., 270, 118888, https://doi.org/10.1016/j.atmosenv.2021.118888, 2022. a
Chang, I., Gao, L., Flynn, C. J., Shinozuka, Y., Doherty, S. J., Diamond, M. S., Longo, K. M., Ferrada, G. A., Carmichael, G. R., Castellanos, P., da Silva, A. M., Saide, P. E., Howes, C., Xue, Z., Mallet, M., Govindaraju, R., Wang, Q., Cheng, Y., Feng, Y., Burton, S. P., Ferrare, R. A., LeBlanc, S. E., Kacenelenbogen, M. S., Pistone, K., Segal-Rozenhaimer, M., Meyer, K. G., Ryoo, J.-M., Pfister, L., Adebiyi, A. A., Wood, R., Zuidema, P., Christopher, S. A., and Redemann, J.: On the differences in the vertical distribution of modeled aerosol optical depth over the southeastern Atlantic, Atmos. Chem. Phys., 23, 4283–4309, https://doi.org/10.5194/acp-23-4283-2023, 2023. a
Chen, B., Thompson, S. A., Matthews, B. H., Sharma, M., Li, R., Nowotarski, C. J., Rapp, A. D., and Brooks, S. D.: A new technique to retrieve aerosol vertical profiles using micropulse lidar and ground-based aerosol measurements, Atmos. Meas. Tech., 18, 5841–5859, https://doi.org/10.5194/amt-18-5841-2025, 2025. a
Chiliński, M., Broda, M., Nurowska, K., and Markowicz, K.: The Near-Surface Vertical Variability of Aerosol Single-Scattering Properties over Warsaw: Case Study, Aerosol Air Qual. Res., 25, 14, https://doi.org/10.1007/s44408-025-00018-w, 2025. a
Collaud Coen, M., Weingartner, E., Apituley, A., Ceburnis, D., Fierz-Schmidhauser, R., Flentje, H., Henzing, J. S., Jennings, S. G., Moerman, M., Petzold, A., Schmid, O., and Baltensperger, U.: Minimizing light absorption measurement artifacts of the Aethalometer: evaluation of five correction algorithms, Atmos. Meas. Tech., 3, 457–474, https://doi.org/10.5194/amt-3-457-2010, 2010. a
Dobracki, A., Lewis, E. R., Sedlacek III, A. J., Tatro, T., Zawadowicz, M. A., and Zuidema, P.: Burning conditions and transportation pathways determine biomass-burning aerosol properties in the Ascension Island marine boundary layer, Atmos. Chem. Phys., 25, 2333–2363, https://doi.org/10.5194/acp-25-2333-2025, 2025. a
Dubovik, O., Holben, B., Eck, T., Smirnov, A., Kaufman, Y., King, M., Tanré, D., and Slutsker, I.: Variability of Absorption and Optical Properties of Key Aerosol Types Observed in Worldwide Locations, J. Atmos. Sci., 59, 590–608, https://doi.org/10.1175/1520-0469(2002)059<0590:VOAAOP>2.0.CO;2, 2002. a
Eckert, C., Hernandez-Jaramillo, D., Medcraft, C., Harrison, D., and Kelaher, B.: Drone-Based Measurement of the Size Distribution and Concentration of Marine Aerosols above the Great Barrier Reef, Drones, 8, 292, https://doi.org/10.3390/drones8070292, 2024. a
Ecotech Pty Ltd: Aurora 4000 Polar Nephelometer User Manual, Version: 1.0, Ecotech Pty Ltd, https://fixturlaser.com/wp-content/uploads/2023/05/Aurora-4000-User-Manual.pdf (last access: 9 September 2026), 2011. a
Fernald, F. G.: Analysis of atmospheric lidar observations: some comments, Appl. Optics, 23, 652–653, https://doi.org/10.1364/AO.23.000652, 1984. a, b
Hansen, A., Rosen, H., and Novakov, T.: Real-time measurement of the absorption coefficient of aerosol particles, Appl. Optics, 21, 3060–3062, https://doi.org/10.1364/AO.21.003060, 1982. a
Hansen, A., Rosen, H., and Novakov, T.: The Aethalometer: An instrument for the real-time measurement of optical absorption by particles, Sci. Total Environ., 36, 191–196, 1984. a
Harshvardhan, H., Ferrare, R., Burton, S., Hair, J., Hostetler, C., Harper, D., Cook, A., Fenn, M., Scarino, A. J., Chemyakin, E., and Müller, D.: Vertical structure of biomass burning aerosol transported over the southeast Atlantic Ocean, Atmos. Chem. Phys., 22, 9859–9876, https://doi.org/10.5194/acp-22-9859-2022, 2022. a
Holben, B., Eck, T., Slutsker, I., Tanré, D., Buis, J., Setzer, A., Vermote, E., Reagan, J., Kaufman, Y., Nakajima, T., Lavenu, F., Jankowiak, I., and Smirnov, A.: AERONET – A Federated Instrument Network and Data Archive for Aerosol Characterization, Remote Sens. Environ., 66, 1–16, https://doi.org/10.1016/S0034-4257(98)00031-5, 1998. a
IPCC: Climate Change 2021: The Physical Science Basis. Contribution of Working Group I to the Sixth Assessment Report of the Intergovernmental Panel on Climate Change, Tech. rep., Intergovernmental Panel on Climate Change, Cambridge, United Kingdom and New York, NY, USA, https://doi.org/10.1017/9781009157896, 2021. a
Kaiser, J. W., Heil, A., Andreae, M. O., Benedetti, A., Chubarova, N., Jones, L., Morcrette, J.-J., Razinger, M., Schultz, M. G., Suttie, M., and van der Werf, G. R.: Biomass burning emissions estimated with a global fire assimilation system based on observed fire radiative power, Biogeosciences, 9, 527–554, https://doi.org/10.5194/bg-9-527-2012, 2012. a
Kalnajs, L. and Deshler, T.: A New Instrument for Balloon-Borne In Situ Aerosol Size Distribution Measurements, the Continuation of a 50 Year Record of Stratospheric Aerosols Measurements, J. Geophys. Res.-Atmos., 127, e2022JD037485, https://doi.org/10.1029/2022JD037485, 2022. a
Kezoudi, M., Tesche, M., Smith, H., Tsekeri, A., Baars, H., Dollner, M., Estellés, V., Bühl, J., Weinzierl, B., Ulanowski, Z., Müller, D., and Amiridis, V.: Measurement report: Balloon-borne in situ profiling of Saharan dust over Cyprus with the UCASS optical particle counter, Atmos. Chem. Phys., 21, 6781–6797, https://doi.org/10.5194/acp-21-6781-2021, 2021. a
Klett, J.: Lidar inversion with variable backscatter/extinction ratios, Appl. Optics, 24, 1638–1643, https://doi.org/10.1364/AO.24.001638, 1985. a, b, c
Klett, J. D.: Stable analytical inversion solution for processing lidar returns, Appl. Optics, 20, 211–220, https://doi.org/10.1364/AO.20.000211, 1981. a
Kuula, J., Mäkelä, T., Aurela, M., Teinilä, K., Varjonen, S., González, Ó., and Timonen, H.: Laboratory evaluation of particle-size selectivity of optical low-cost particulate matter sensors, Atmos. Meas. Tech., 13, 2413–2423, https://doi.org/10.5194/amt-13-2413-2020, 2020. a, b, c
Lee, S.-W., Kim, S., Lee, Y.-S., Choi, B. I., Kang, W., Oh, Y. K., Park, S., Yoo, J.-K., Lee, J., Lee, S., Kwon, S., and Kim, Y.-G.: Radiation correction and uncertainty evaluation of RS41 temperature sensors by using an upper-air simulator, Atmos. Meas. Tech., 15, 1107–1121, https://doi.org/10.5194/amt-15-1107-2022, 2022. a
Lee, S.-W., Kim, S., Choi, B., Woo, S.-B., Lee, S., Kwon, S., and Kim, Y.-G.: Calibration of RS41 humidity sensors by using an upper-air simulator, Meteorol. Appl., 28, e2010, https://doi.org/10.1002/met.2010, 2021. a
Li, J., Carlson, B., Yung, Y., Daren, L., Hansen, J., Penner, J., Liao, H., Ramaswamy, V., Kahn, R., Zhang, P., Dubovik, O., Ding, A., Lacis, A., Zhang, L., and Dong, Y.: Scattering and absorbing aerosols in the climate system, Nature Reviews Earth & Environment, 3, 363–379, https://doi.org/10.1038/s43017-022-00296-7, 2022. a
Li, Z., Goloub, P., Dubovik, O., Blarel, L., Zhang, W., Podvin, T., Sinyuk, A., Sorokin, M., Chen, H., Holben, B., Tanré, D., Canini, M., and Buis, J.-P.: Improvements for ground-based remote sensing of atmospheric aerosol properties by additional polarimetric measurements, J. Quant. Spectrosc. Ra., 110, 1954–1961, https://doi.org/10.1016/j.jqsrt.2009.04.009, 2009. a
Lin, Y., Takano, Y., Gu, Y., Wang, Y., Zhou, S., Zhang, T., Zhu, K., Wang, J., Zhao, B., G., C., Zhang, D., Fu, R., and Seinfeld, J.: Characterization of the aerosol vertical distributions and their impacts on warm clouds based on multi-year ARM observations, Sci. Total Environ., 904, 166582, https://doi.org/10.1016/j.scitotenv.2023.166582, 2023. a
Malm, W. and Hand, J.: An Examination of the Physical and Optical Properties of Aerosols Collected in the Improve Program, Atmos. Environ., 41, 3407–3427, https://doi.org/10.1016/j.atmosenv.2006.12.012, 2007. a
Markowicz, K. and Chilinski, M.: Evaluation of Two Low-Cost Optical Particle Counters for the Measurement of Ambient Aerosol Scattering Coefficient and Ångström Exponent, Sensors, 20, 2617, https://doi.org/10.3390/s20092617, 2020. a, b
Markowicz, K., Chiliński, M., Panfil, W., Nurowska, K., Moczulski, W., Makuch, P., Acedański, S., Florczyk, G., and Kozuba, J.: High-resolution vertical profiling of aerosols microphysical and optical properties during the 2024 LEADER UAV campaign in Nadarzyce (Poland), Environ. Sci. Pollut. R., 32, 20695–20713, https://doi.org/10.1007/s11356-025-36887-2, 2025. a
Markowicz, K. M., Stachlewska, I., Zawadzka-Manko, O., Wang, D., Kumala, W., Chilinski, M., Makuch, P., Markuszewski, P., Rozwadowska, A., Petelski, T., Zielinski, T., Posyniak, M., Kaminski, J., Szkop, A., Pietruczuk, A., Chojnicki, B., Harenda, K., Poczta, P., Uscka-Kowalkowska, J., Struzewska, J., Werner, M., Kryza, M., Drzeniecka-Osiadacz, A., Sawinski, T., Remut, A., Mietus, M., Wiejak, K., Markowicz, J., Belegante, L., and Nicolae, D.: A Decade of Poland-AOD Aerosol Research Network Observations, Atmosphere, 12, 1583, https://doi.org/10.3390/atmos12121583, 2021. a, b, c
Markowicz, K. M., Markuszewski, P., Posyniak, M. A., Makuch, P., Kitowska, M., and Rozwadowska, A.: Aerosol microphysical and optical closure study in the Baltic Sea coastal zone, J. Aerosol Sci., 193, 106741, https://doi.org/10.1016/j.jaerosci.2025.106741, 2026. a
Mei, H., Wei, P., Ghadikolaei, M. A., Gali, N. K., Wang, Y., and Ning, Z.: Performance validation and calibration conditions for novel dynamic baseline tracking air sensors in long-term field monitoring, Atmos. Meas. Tech., 18, 1771–1785, https://doi.org/10.5194/amt-18-1771-2025, 2025. a
Moore, R. H., Wiggins, E. B., Ahern, A. T., Zimmerman, S., Montgomery, L., Campuzano Jost, P., Robinson, C. E., Ziemba, L. D., Winstead, E. L., Anderson, B. E., Brock, C. A., Brown, M. D., Chen, G., Crosbie, E. C., Guo, H., Jimenez, J. L., Jordan, C. E., Lyu, M., Nault, B. A., Rothfuss, N. E., Sanchez, K. J., Schueneman, M., Shingler, T. J., Shook, M. A., Thornhill, K. L., Wagner, N. L., and Wang, J.: Sizing response of the Ultra-High Sensitivity Aerosol Spectrometer (UHSAS) and Laser Aerosol Spectrometer (LAS) to changes in submicron aerosol composition and refractive index, Atmos. Meas. Tech., 14, 4517–4542, https://doi.org/10.5194/amt-14-4517-2021, 2021. a
Moormann, L., Böttger, T., Schuhmann, P., Valero, L., Fachinger, F., and Drewnick, F.: The Flying Laboratory FLab: development and application of a UAS to measure aerosol particles and trace gases in the lower troposphere, Atmos. Meas. Tech., 18, 1441–1459, https://doi.org/10.5194/amt-18-1441-2025, 2025. a
Müller, T., Schladitz, A., Massling, A., Kaaden, N., Kandler, K., and Wiedensohler, A.: Spectral absorption coefficients and imaginary parts of refractive indices of Saharan dust during SAMUM-1, Tellus B, 61, 79–95, https://doi.org/10.1111/j.1600-0889.2008.00399.x, 2009. a
Müller, T., Laborde, M., Kassell, G., and Wiedensohler, A.: Design and performance of a three-wavelength LED-based total scatter and backscatter integrating nephelometer, Atmos. Meas. Tech., 4, 1291–1303, https://doi.org/10.5194/amt-4-1291-2011, 2011. a, b
Nevrlý, V., Dostál, M., Bitala, P., Klečka, V., Sléžka, J., Polách, P., Nevrlá, K., Barabášová, M., Langová, R., Bernatíková, S., Martiníková, B., Vašinek, M., Nevrlý, A., Lazecký, M., Suchánek, J., Chaloupecká, H., Kiča, D., and Wild, J.: Varying Performance of Low-Cost Sensors During Seasonal Smog Events in Moravian-Silesian Region, Atmosphere, 15, https://doi.org/10.3390/atmos15111326, 2024. a, b
Nothhelfer, M., Todea, A., Bathen, D., and Asbach, C.: Performance Evaluation of Five Different Low-Cost Particulate Matter Sensors for Monodisperse Test Aerosols, Aerosol Air Qual. Res., 25, 17, https://doi.org/10.1007/s44408-025-00019-9, 2025. a, b
Papanikolaou, C., Papayannis, A., Mylonaki, M., Foskinis, R., Kokkalis, P., Liakakou, E., Stavroulas, I., Soupiona, O., Hatzianastassiou, N., Gavrouzou, M., Kralli, E., and Anagnou, D.: Vertical Profiling of Fresh Biomass Burning Aerosol Optical Properties over the Greek Urban City of Ioannina, during the PANACEA Winter Campaign, Atmosphere, 13, https://doi.org/10.3390/atmos13010094, 2022. a
Papayannis, A., Zhang, H. Q., Amiridis, V., Ju, H. B., Chourdakis, G., Georgoussis, G., Pérez, C., Chen, H. B., Goloub, P., Mamouri, R. E., Kazadzis, S., Paronis, D., Tsaknakis, G., and Baldasano, J. M.: Extraordinary dust event over Beijing, China, during April 2006: Lidar, Sun photometric, satellite observations and model validation, Geophys. Res. Lett., 34, L07806, https://doi.org/10.1029/2006GL029125, 2007. a
Petzold, A., Ogren, J. A., Fiebig, M., Laj, P., Li, S.-M., Baltensperger, U., Holzer-Popp, T., Kinne, S., Pappalardo, G., Sugimoto, N., Wehrli, C., Wiedensohler, A., and Zhang, X.-Y.: Recommendations for reporting “black carbon” measurements, Atmos. Chem. Phys., 13, 8365–8379, https://doi.org/10.5194/acp-13-8365-2013, 2013. a
Podgorny, I., Conant, W., Ramanathan, V., and Satheesh, S.: Aerosol modulation of atmospheric and surface solar heating over the tropical Indian Ocean, Tellus B, 52, 947–958, https://doi.org/10.3402/tellusb.v52i3.17077, 2000. a
PolandAOD: MWR Radiometer, https://www.igf.fuw.edu.pl/~kmark/stacja/PolandAODdata.php?type=24&date=2025-06-10&next=-1&lev=1&stat=3 (last access: 8 April 2026), 2025. a
Posyniak, M., Markowicz, K., Czyzewska, D., Chilinski, M., Makuch, P., Zawadzka-Manko, O., Kucieba, S., Kulesza, K., Kachniarz, K., Mijal, K., and Borek, K.: Experimental study of smog microphysical and optical vertical structure in the Silesian Beskid - Poland, Atmos. Pollut. Res., 12, 101171, https://doi.org/10.1016/j.apr.2021.101171, 2021. a
Quan, J., Ma, P., Pan, Y., Cheng, S., Wang, Q., Lan, L., Dai, L., Wang, Y., and Liu, Y.: Vertical mixing of pollutants and secondary inorganic aerosol formations over Beijing, China, Atmos. Environ., 357, 121312, https://doi.org/10.1016/j.atmosenv.2025.121312, 2025. a
Ran, L., Zhou, F., Deng, Z., Zhou, M., and Wang, P.: A method to obtain scattering phase function based on particle size distribution and refractive index retrieved from Aurora 4000 multi-angle scattering measurements: A numerical study, Atmos. Environ., 315, 120138, https://doi.org/10.1016/j.atmosenv.2023.120138, 2023. a
Randazzo, G. S., Hill, S. A., Booth, J. F., and Field, R. D.: A Wall of Smoke: Understanding the Drivers of the June 2023 Canadian Wildfire Smoke Event for New York City, J. Geophys. Res.-Atmos., 131, e2025JD044798, https://doi.org/10.1029/2025JD044798, 2026. a
Ryan, R. G., Toms-Hardman, L., Smirnov, A., Harrison, D. P., and Schofield, R.: Measurement report: Aerosol vertical profiling over the Southern Great Barrier Reef using lidar and MAX-DOAS measurements, Atmos. Chem. Phys., 25, 11183–11197, https://doi.org/10.5194/acp-25-11183-2025, 2025. a
Sanchez-Barrero, M. F., Goloub, P., Blarel, L., Popovici, I. E., Torres, B., Dubois, G., Podvin, T., Ducos, F., de Filippi, R., Sicard, M., Bout Roumazeilles, V., and Skonieczny, C.: Aerosol variability over oceans using micro-pulse lidar and photometer: insights from TRANSAMA ship-based campaign, Atmos. Meas. Tech., 19, 507–528, https://doi.org/10.5194/amt-19-507-2026, 2026. a
Sasano, Y., Shimizu, H., Takeuchi, N., and Okuda, M.: Geometrical form factor in the laser radar equation: an experimental determination, Appl. Optics, 18, 3908–3910, https://doi.org/10.1364/AO.18.003908, 1979. a, b
Schuster, G., Dubovik, O., and Holben, B.: Angstrom exponent and bimodal aerosol size distributions, J. Geophys. Res.-Atmos., 111, https://doi.org/10.1029/2005JD006328, 2006. a
Segura, S., Estellés, V., Titos, G., Lyamani, H., Utrillas, M. P., Zotter, P., Prévôt, A. S. H., Močnik, G., Alados-Arboledas, L., and Martínez-Lozano, J. A.: Determination and analysis of in situ spectral aerosol optical properties by a multi-instrumental approach, Atmos. Meas. Tech., 7, 2373–2387, https://doi.org/10.5194/amt-7-2373-2014, 2014. a, b
Seidel, J., Ketzler, G., Bechtel, B., Thies, B., Philipp, A., Böhner, J., Egli, S., Eisele, M., Herma, F., Langkamp, T., Petersen, E., Sachsen, T., Schlabing, D., and Schneider, C.: Mobile measurement techniques for local and micro-scale studies in urban and topo-climatology, DIE ERDE – Journal of the Geographical Society of Berlin, 147, 15–39, 2016. a
Sellmaier, A., Damm, E., Sachs, T., Kirbus, B., Wiekenkamp, I., Rinke, A., Pätzold, F., Nomura, D., Lampert, A., and Rex, M.: New insights in atmospheric methane variability in the Arctic by ship-borne measurements during MOSAiC, Atmos. Chem. Phys., 25, 17685–17700, https://doi.org/10.5194/acp-25-17685-2025, 2025. a
Sessions, W. R., Reid, J. S., Benedetti, A., Colarco, P. R., da Silva, A., Lu, S., Sekiyama, T., Tanaka, T. Y., Baldasano, J. M., Basart, S., Brooks, M. E., Eck, T. F., Iredell, M., Hansen, J. A., Jorba, O. C., Juang, H.-M. H., Lynch, P., Morcrette, J.-J., Moorthi, S., Mulcahy, J., Pradhan, Y., Razinger, M., Sampson, C. B., Wang, J., and Westphal, D. L.: Development towards a global operational aerosol consensus: basic climatological characteristics of the International Cooperative for Aerosol Prediction Multi-Model Ensemble (ICAP-MME), Atmos. Chem. Phys., 15, 335–362, https://doi.org/10.5194/acp-15-335-2015, 2015. a
Sokolik, I. and Toon, O.: Incorporation of mineralogical composition into models of the radiative properties of mineral aerosol from UV to IR wavelengths, J. Geophys. Res.-Atmos., 104, 9423–9444, https://doi.org/10.1029/1998JD200048, 1999. a
Sousan, S., Regmi, S., and Park, Y.: Laboratory Evaluation of Low-Cost Optical Particle Counters for Environmental and Occupational Exposures, Sensors, 21, https://doi.org/10.3390/s21124146, 2021. a
Sprenger, M. and Wernli, H.: The LAGRANTO Lagrangian analysis tool – version 2.0, Geosci. Model Dev., 8, 2569–2586, https://doi.org/10.5194/gmd-8-2569-2015, 2015. a
Su, T., Li, Z., Li, C., Li, J., Han, W., Shen, C., Tan, W., Wei, J., and Guo, J.: The significant impact of aerosol vertical structure on lower atmosphere stability and its critical role in aerosol–planetary boundary layer (PBL) interactions, Atmos. Chem. Phys., 20, 3713–3724, https://doi.org/10.5194/acp-20-3713-2020, 2020. a
Su, T., Li, Z., Zheng, Y., Wu, T., Wu, H., and Guo, J.: Aerosol-boundary layer interaction modulated entrainment process, npj Clim. Atmos. Sci., 5, https://doi.org/10.1038/s41612-022-00283-1, 2022. a
Szczepanik, D. M., Poczta, P., Talianu, C., Böckmann, C., Ritter, C., Stefanie, H., Toanca, F., Chojnicki, B. H., Schüttemeyer, D., and Stachlewska, I. S.: Spatio-temporal evolution of long-range transported mineral desert dust properties over rural and urban sites in Central Europe, Sci. Total Environ., 903, 166173, https://doi.org/10.1016/j.scitotenv.2023.166173, 2023. a
Teri, M., Müller, T., Gasteiger, J., Valentini, S., Horvath, H., Vecchi, R., Bauer, P., Walser, A., and Weinzierl, B.: Impact of particle size, refractive index, and shape on the determination of the particle scattering coefficient – an optical closure study evaluating different nephelometer angular truncation and illumination corrections, Atmos. Meas. Tech., 15, 3161–3187, https://doi.org/10.5194/amt-15-3161-2022, 2022. a, b
Tryner, J., Rucker, M., Berens, L., Cocker, D., and Volckens, J.: Effects of aerosol type and simulated aging on the performance of low-cost PM sensors, J. Aerosol Sci., 150, 105654, https://doi.org/10.1016/j.jaerosci.2020.105654, 2020. a, b, c
TSI Incorporated: Laser Aerosol Spectrometer Model 3340 – Technical Manual, https://tsi.com/discontinued-products/laser-aerosol-spectrometer-3340 (last access: 21 August 2026), 2024. a
Wang, D., Szczepanik, D., and Stachlewska, I. S.: Interrelations between surface, boundary layer, and columnar aerosol properties derived in summer and early autumn over a continental urban site in Warsaw, Poland, Atmos. Chem. Phys., 19, 13097–13128, https://doi.org/10.5194/acp-19-13097-2019, 2019. a
Weingartner, E., Saathoff, H., Schnaiter, M., Streit, N., Bitnar, B., and Baltensperger, U.: Absorption of light by soot particles: Determination of the absorption coefficient by means of aethalometers, J. Aerosol Sci., 34, 1445–1463, https://doi.org/10.1016/S0021-8502(03)00359-8, 2003. a, b, c
Wernli, H. and Davies, H.: A Lagrangian‐based analysis of extratropical cyclones. Part I: The method and some applications, Q. J. Roy. Meteor. Soc., 123, 467–489, https://doi.org/10.1002/qj.49712353811, 1997. a
World Meteorological Organization: Aerosol Measurement Procedures, Guidelines and Recommendations, Tech. rep., World Meteorological Organization, Global Atmosphere Watch (GAW), Geneva, https://www.wmo-gaw-sag-aerosol.org/files/FINAL_GAW_227.pdf (last access: 9 September 2026), 2016. a
Xian, P., Reid, J., Hyer, E., Sampson, C., Rubin, J., Ades, M., Asencio, N., Basart, S., Benedetti, A., Bhattacharjee, P., Brooks, M., Colarco, P., da Silva, A., Eck, T., Guth, J., Jorba, O., Kouznetsov, R., Kipling, Z., Sofiev, M., Perez Garcia-Pando, C., Pradhan, Y., Tanaka, T., Wang, J., Westphal, D., Yumimoto, K., and Zhang, J.: Current state of the global operational aerosol multi-model ensemble: An update from the International Cooperative for Aerosol Prediction (ICAP), Q. J. Roy. Meteor. Soc., 145, 176–209, https://doi.org/10.1002/qj.3497, 2019. a
Zawadzka, O., Posyniak, M., Nelken, K., Markuszewski, P., Chilinski, M., Czyzewska, D., Lisok, J., and Markowicz, K.: Study of the vertical variability of the aerosol properties based on cable cars in-situ measurements, Atmos. Pollut. Res., 8, 968–978, 2017. a
Zhang, Z., Li, J., Che, H., Dong, Y., Dubovik, O., Eck, T., Gupta, P., Holben, B., Kim, J., Lind, E., Saud, T., Tripathi, S. N., and Ying, T.: Long-term trends in aerosol properties derived from AERONET measurements, Atmos. Chem. Phys., 25, 4617–4637, https://doi.org/10.5194/acp-25-4617-2025, 2025. a, b
Zhu, S., Ma, N., Yu, P., Xie, L., Hong, J., Lu, N., Bai, Z., Deng, Z., Ran, L., Wu, Y., Bian, J., Wang, Q., Tao, J., Zhou, Y., Wang, Q., Su, H., and Cheng, Y.: Vertical Profiling of Aerosol Physicochemical Properties With a New Airborne Aerosol Sampling System for Unmanned Aerial Vehicles and Tethered Balloons, J. Geophys. Res.-Atmos., 130, e2024JD043148, https://doi.org/10.1029/2024JD043148, 2025. a
Zieliński, T., Petelski, T., Makuch, P., Strzałkowska, A., Ponczkowska, A., Markowicz, K., Chourdakis, G., Georgoussis, G., and Kratzer, S.: Studies of aerosols advected to coastal areas with the use of remote techniques, Acta Geophys., 60, 1359–1385, https://doi.org/10.2478/s11600-011-0075-4, 2012. a
- Abstract
- Introduction
- Data and methods
- AeroSonde processing, calibration, and data evaluation
- Results
- Discussion
- Conclusions
- Appendix A: Data processing details
- Data availability
- Author contributions
- Competing interests
- Disclaimer
- Acknowledgements
- Financial support
- Review statement
- References
- Supplement
- Abstract
- Introduction
- Data and methods
- AeroSonde processing, calibration, and data evaluation
- Results
- Discussion
- Conclusions
- Appendix A: Data processing details
- Data availability
- Author contributions
- Competing interests
- Disclaimer
- Acknowledgements
- Financial support
- Review statement
- References
- Supplement