
the Creative Commons Attribution 4.0 License.
the Creative Commons Attribution 4.0 License.
 | 25 Sep 2026
Feasibility of measuring volcanic gas composition using sky-scattered sunlight and FTIR spectroscopy
Tobias D. Schmitt

Moritz Sindram
Benedikt A. Löw
Lukas Weis
Ralph Kleinschek
Nicole Bobrowski
André Butz
Monitoring volcanic emissions is essential for understanding volcanic processes and predicting eruption dynamics. Remote sensing is the only method that allows safe measurements right before, during, and after eruptions. Current monitoring relies on scattered sunlight, whose essentially unconstrained viewing geometry permits continuous and automated observation. It is, however, mostly limited to the ultraviolet and visible (UV-VIS) spectral ranges by the available sky brightness, restricting observations largely to SO2.
Here, we assess the feasibility of constraining volcanic emissions by passive Fourier transform infrared (FTIR) spectroscopy of sky-scattered sunlight in the near-infrared (NIR), where more gases of interest have absorption features. Combining an instrument model for the spectral signal-to-noise ratio (SNR) with an information-content analysis, and incorporating actual measurements to capture the systematic uncertainties inherent to atmospheric total column retrievals, we estimate detection limits for individual trace gas columns. The instrument model accurately reproduces the results of laboratory validation experiments. We use Mount Etna as a representative high-emission volcano. We find that CO2 column measurements remain challenging: the plume enhancement is small compared to the high and variable atmospheric background, and little scattered light is available in the NIR. Even under bright skies, reaching a detection limit comparable to the expected column enhancement takes about 5 min, and up to 2.5 h under dark conditions. Plume transects, which require many such measurements at substantially better precision, are therefore out of reach, whereas individual plume-composition measurements remain conceivable. In contrast, the strongly emitted halogen species HCl and HF, whose atmospheric background is low, are detectable within seconds under bright skies and within a few minutes under dark conditions. For these species, a multi-instrument approach makes plume-composition measurements practical: pairing the FTIR with co-aligned UV observations of SO2 yields gas ratios that, combined with established SO2 flux networks, give access to the halogen emissions. For CO2 this route is not excluded, but limited precision and the impact of radiative transfer errors on a background-dominated retrieval make the outcome hard to predict. Finally, this SNR and detection-limit analysis transfers to other instruments, spectral regions, target species, and emission sources.
- Article
(2173 KB) - Full-text XML
- BibTeX
- EndNote


Volcanic gases are central to eruption dynamics, and their flux and composition provide insights into subsurface processes. Once released into the atmosphere, these gases also influence atmospheric composition and climate, although the global volcanic fluxes remain poorly constrained. Only remote sensing methods allow measurements of these gases from a safe distance, including during periods of high volcanic activity.
As early as the 19th century, Judd (1881) suggested that spectroscopy could provide an important tool in volcanology. Verhoogen (1939) performed the first successful spectroscopic gas measurements, using light in the visible range. Delsemme (1960) and Murata (1960) performed the first measurements in the near-infrared (NIR) at Kilauea and Nyiragongo, respectively, both detecting CuCl in the volcanic gas plumes. In the late 1960s, Naughton et al. (1969) were the first to determine the main components of a volcanic plume by remote sensing, namely H2O, CO2, and SO2. They used infrared absorption between 2.5 and 14.5 µm, with the light emitted by a lava fountain of Kilauea volcano, Hawaii, United States, as the source.
The commercial availability of rugged, compact Fourier transform infrared (FTIR) spectrometers in the 1990s allowed for more frequent volcanological applications of infrared (IR) spectroscopy (e.g., Notsu et al., 1993; Mori et al., 1993; Francis et al., 1998; Oppenheimer et al., 1998). Operating in the infrared region (500–6000 cm−1) at spectral resolutions of up to 0.5 cm−1, these devices opened up the possibility of measuring many volcanic species of interest (including HCl, H2O, SO2, HF, CO2, SiF4, OCS, and CO) using their rotation-vibration line structures. Today, several research groups use IR spectroscopy to investigate volcanic degassing and have contributed to advancing our understanding of volcanic processes (e.g., Allard et al., 2005; Burton et al., 2007; Scott et al., 2023; Smekens et al., 2024).
However, IR remote sensing measurements are still seldom employed for volcanic monitoring, i.e., for ideally continuous and automated observations. The instruments are typically deployed in stationary positions on the ground and pointed at a hot source, either an artificial one or volcanically heated rock or lava. The availability of such a light source is the most serious limitation encountered in deployment: the number of active lava domes and lava fountains is small, and relying on them restricts the measurements to periods of eruptive activity. It is possible to exploit the thermal emission of the volcanic gases themselves when measuring in the thermal IR (Love et al., 1998), but this requires an estimate of the gas temperature, and strong water absorption quickly limits the viewing distance in more humid conditions (Love et al., 2000). Additionally, careful and regular radiometric calibration is necessary to allow for accurate retrieval of gas amounts and to correct for the thermal emission of the instrument itself. Such measurements can even enable the retrieval of CO2 for high emissions, but the high atmospheric background concentration remains a major challenge (Goff et al., 2001). Love et al. (1998) demonstrated sky-looking remote sensing in the mid-infrared (MIR), where thermal emission is less relevant, using sunlight scattered by bright high-altitude cloud layers. It is also possible to make use of solar radiation directly (Butz et al., 2017), but the sun is rarely in the required geometric relationship to plume and instrument.
Today, successful monitoring relies mainly on scattered sunlight in the ultraviolet (UV) region (Galle et al., 2003, 2010; Burton et al., 2009, 2015; Arellano et al., 2021). Using scattered sunlight has the advantage of not restricting the measurements to clear-sky conditions, and it resolves many geometric limitations. However, these monitoring efforts are mostly limited to SO2, since other gases of interest lack suitable absorption features in the UV and visible (UV-VIS) region, where plenty of scattered light is available. The question is therefore whether the comparatively low intensity of scattered sunlight in the NIR region permits detection limits small enough to resolve the expected plume enhancements of those gases of interest to volcanology that have characteristic absorption lines in this spectral range (e.g., H2O, CO2, HCl, and HF).
Section 2 introduces the concepts of measuring volcanic emissions by spectroscopy of sky-scattered sunlight. Section 3 presents the instrument used in this study, as well as proposed changes to optimize it for volcano measurements. Section 4 presents the predicted measurement performance of an optimized FTIR setup in the NIR region. To this end, we develop an instrument model for the spectral signal-to-noise ratio (SNR), validate it against laboratory measurements, and combine it with an information content analysis that links the SNR to the precision of retrieved trace gas columns for different target gases. Finally, Sect. 5 summarizes our findings and discusses their implications, including a multi-instrument strategy for volcanic monitoring, the radiative transfer challenges of scattered-sunlight observations, and the transferability of the approach to other emission sources.
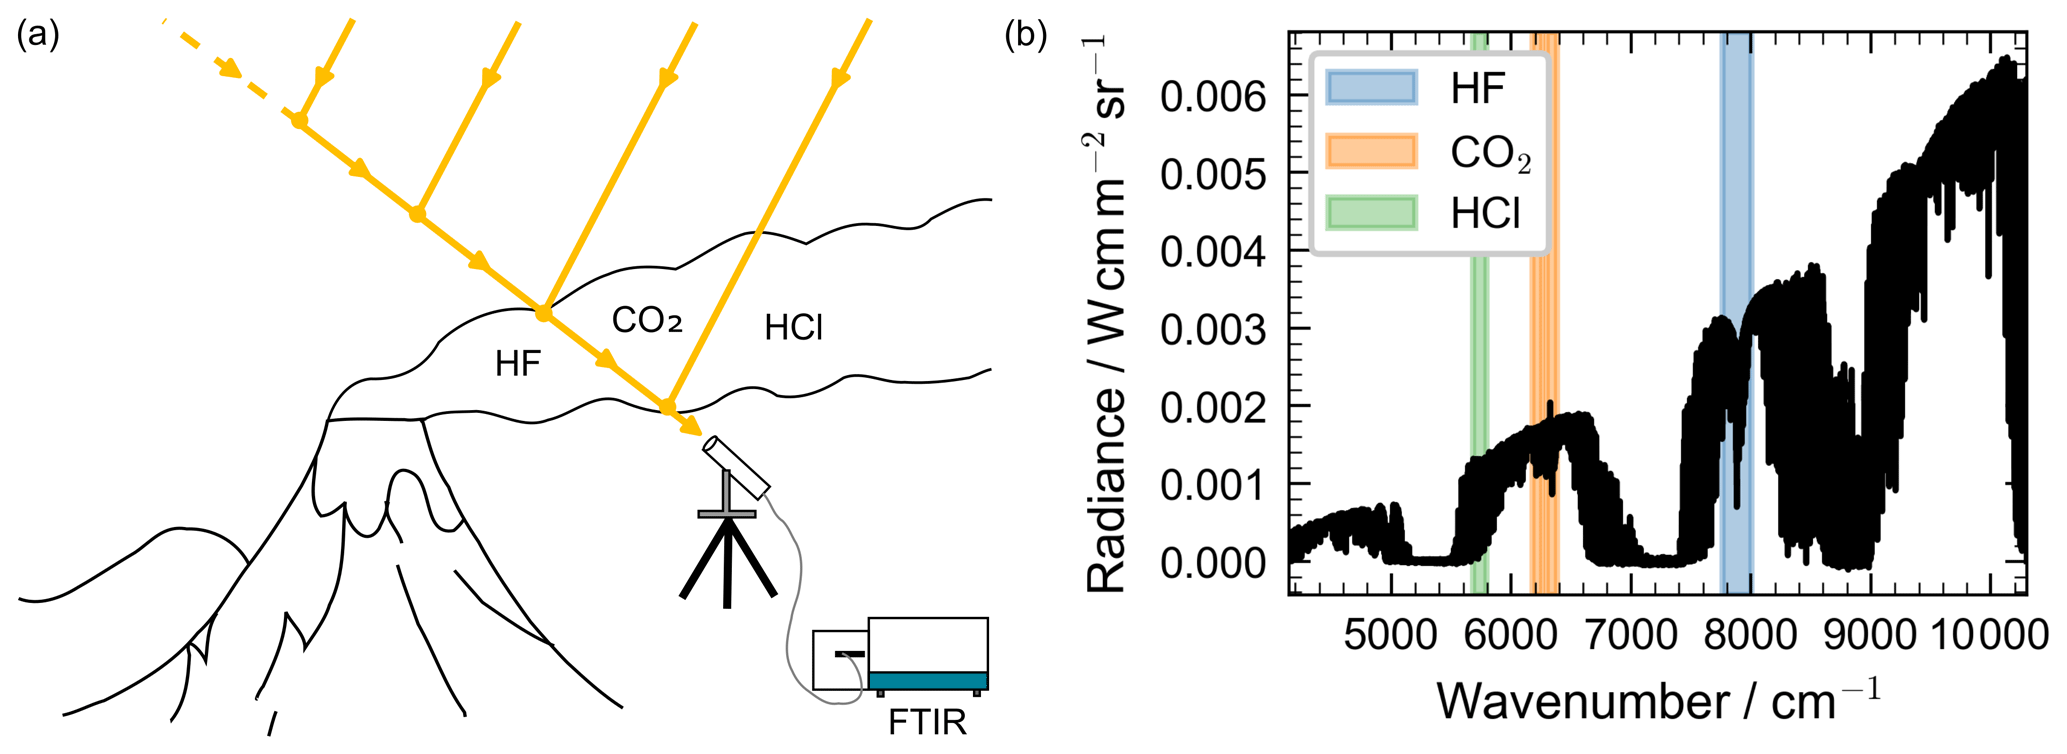
Figure 1Measurement concept of plume composition using sky-scattered sunlight. (a) Sketch of a measurement of sky-scattered sunlight at a volcano and contributing light paths for a certain viewing direction. (b) Spectrum of sky-scattered sunlight taken with the EM27/SCAv2 instrument in the same measurement geometry in Heidelberg.
We describe here an instrument concept that exploits spectra of sky-scattered sunlight in the NIR spectral region. The instrument itself, or a separate telescope, collects light from a chosen viewing direction (Fig. 1a) and forwards it to the spectrometer for analysis (Fig. 1b). A fitting routine retrieves the total-column abundance of the target trace gases, e.g., CO2, HF, and HCl, and provides ancillary information such as water-vapor content or total air mass, the latter derived from the O2 column.
By acquiring a series of measurements while scanning across the plume of an emission source, e.g., a volcano, we can infer the plume's target-gas enhancement and its spatial profile. These data, in turn, constrain the source's total emissions (e.g., Galle et al., 2010; Burton et al., 2015; Kern et al., 2015; Arellano et al., 2021; Knapp et al., 2024). Alternatively, when the plume's location is known a priori, measurements taken on-plume and off-plume provide direct information on plume composition.
The NIR spectral range offers a distinct advantage for these measurements: although its absorption features are generally weaker and the set of detectable species is smaller than in the MIR, Rayleigh and Mie scattering are stronger at shorter wavelengths, yielding a considerably brighter background signal.
For laboratory verification and for reference measurements of sky-scattered sunlight, we employ an existing FTIR instrument that was originally developed for ground-scattered sunlight and is the successor of the instrument presented in Löw et al. (2023). In this work we refer to it as the “EM27/SCAv2”. The instrument is based on the commercially available Bruker EM27/SUN spectrometer. We equipped it with a Hamamatsu G12183-210KA-03 InGaAs photodiode, cooled by a two-stage thermoelectric cooler. In addition, we adapted its focal length and replaced the Jacquinot stop with a custom aperture optimized for maximum light throughput. A schematic of the instrument's internal layout is shown in Fig. A1.
To assess how such a system could perform for volcanic plume observations, we devised a second instrument version that is specifically optimized for the anticipated measurement conditions. For the purpose of this study we designate it “EM27/Volcano”. The principal modification is the substitution of the detector with a Hamamatsu G12181-210K photodiode. This device exhibits a higher responsivity around the target wavelength of 1.6 µm and possesses a substantially larger shunt resistance owing to its narrower spectral bandwidth.
The narrower bandwidth means that the strong CO2 absorption bands near 2 µm are no longer accessible. However, synthetic performance studies, similar in spirit to the analysis presented here but beyond the scope of this article, indicate that the resulting increase in spectral SNR more than compensates for the loss of the 2 µm lines. Consequently, the EM27/Volcano detector choice is expected to deliver the best overall CO2 performance for volcanic plume measurements.
Spectral fitting is performed with a variant of the RemoTeC algorithm (Butz et al., 2011; Löw et al., 2023) that assumes a ground-based upward-looking observer in a non-scattering atmosphere. To mimic the viewing geometry depicted in Fig. 1, we divide the atmosphere into six equidistant-pressure levels and assume that in the upper five layers the lightpath follows the direction defined by the solar zenith angle. The lowest layer is assumed to contain the path component along the instrument's viewing direction, and the gas concentrations are free to be fitted, essentially delivering the slant column densities (SCDs), i.e., the gas concentrations integrated along the lightpath. This procedure neglects that the actual scattering-modulated lightpath in the atmosphere might have experienced slightly different ambient pressure and temperature conditions. Note that our assessment only uses the algorithm to propagate the spectral noise into SCD errors; it does not make use of the SCDs per se.
The prediction of the overall measurement performance consists of two largely independent parts: (i) an estimation of the quality of the optical measurement itself, and (ii) an information content analysis, which links the spectral performance to the measurement target, i.e., the retrievable trace gas columns.
In the first component, we estimate the spectral SNR using an instrument model based on fundamental principles of optics and detector electronics, complemented by FTIR-specific characteristics.
The second component translates the achievable SNR into trace gas retrieval performance using an information content analysis. For this purpose, we select Mount Etna as a test case. It is one of the largest halogen point sources on Earth (Aiuppa et al., 2005), among the strongest volcanic emitters of CO2 (Aiuppa et al., 2019), and one of the most significant continuous emitters of volcanic gases worldwide (Pyle and Mather, 2009). In addition, the results of Butz et al. (2017) provide a benchmark for expected gas column enhancements at Mount Etna, and radiometrically calibrated measurements of sky radiances were available to us to constrain our simulations. This use of real observations also allows us to consider systematic effects that typically occur in total column measurements of trace gases.
Section 4.1 describes the instrument model and SNR estimation. Section 4.2 presents a laboratory validation of the model. Section 4.3 reports on the information content analysis and links spectral SNR to the precisions of trace gas column densities. Finally, Sect. 4.4 brings all the steps together and delivers the final assessment of the trace gas performance in the volcano setting.
4.1 Instrument model and prediction of spectrometer performance
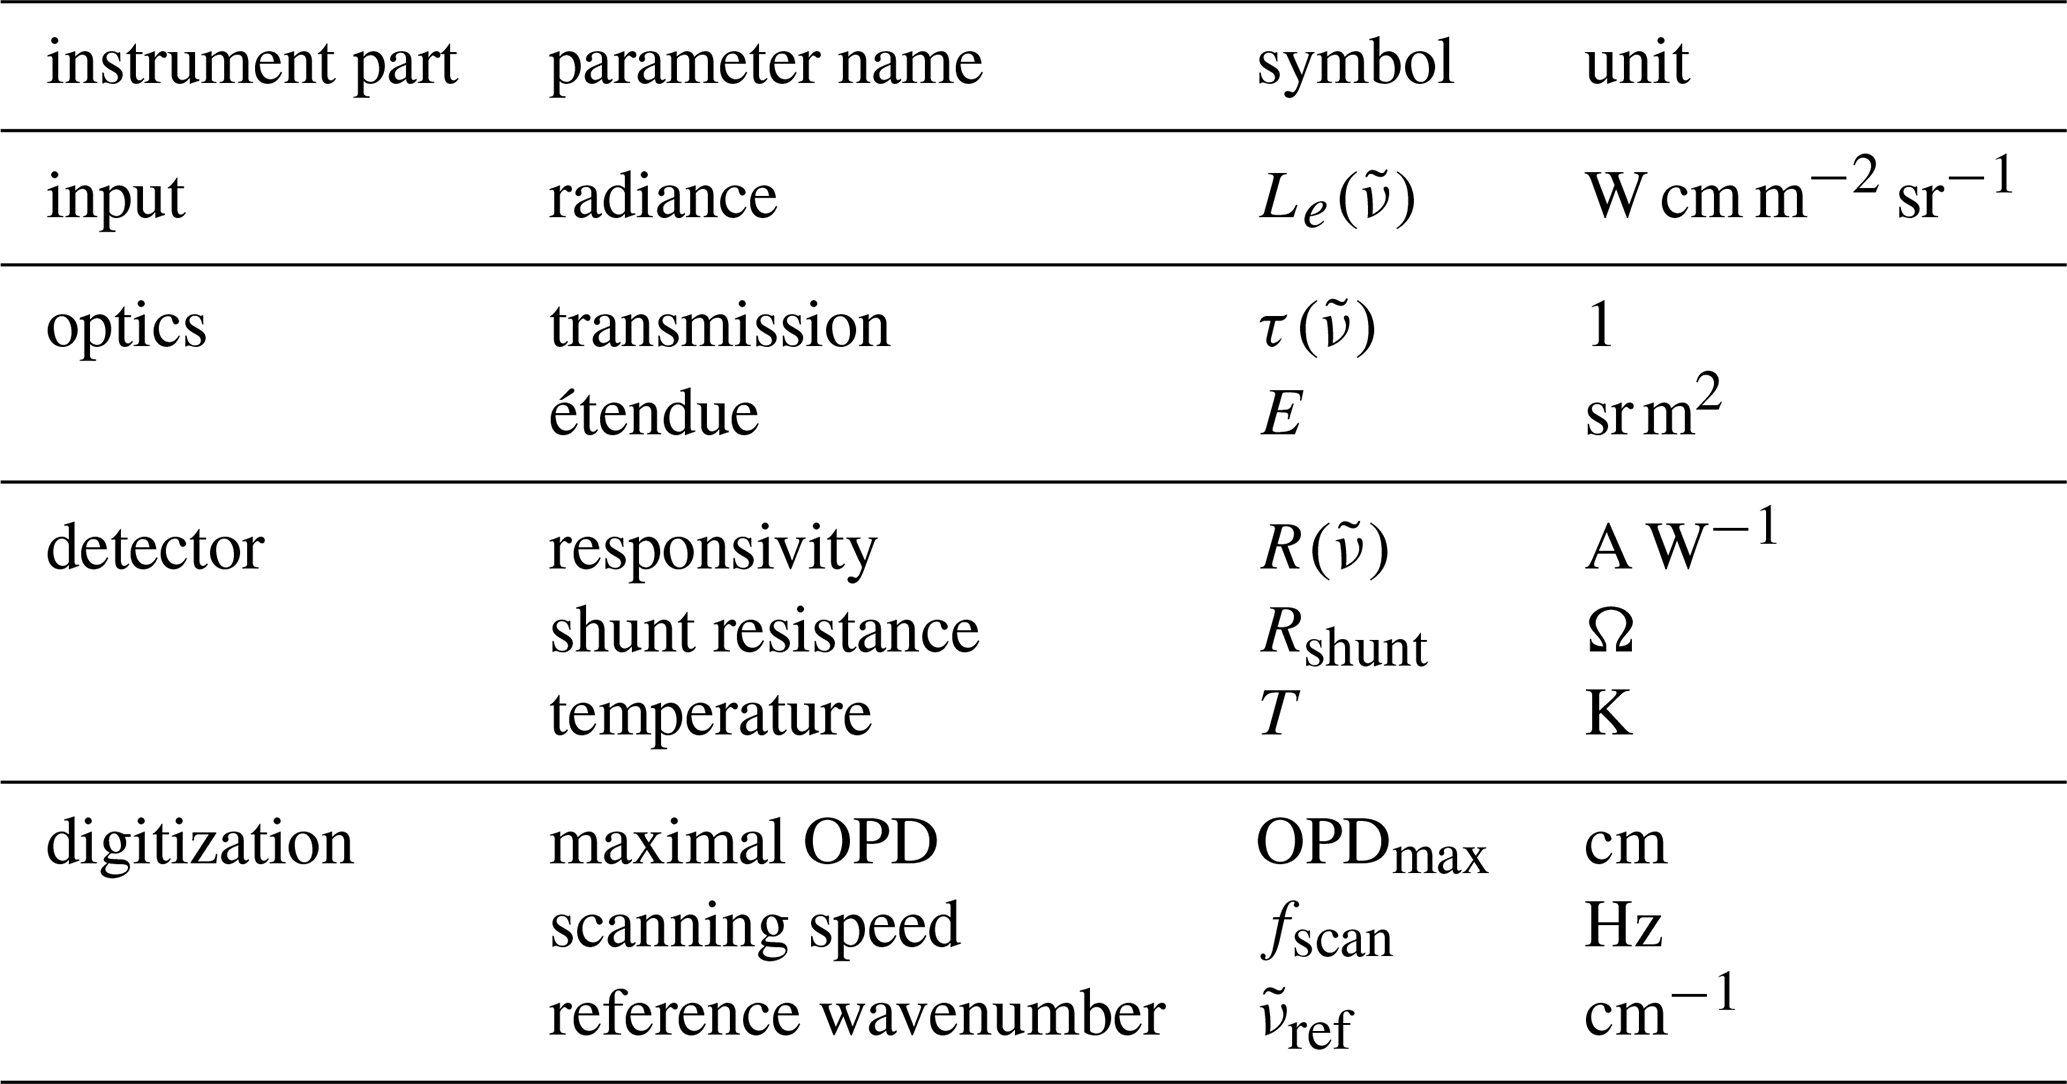
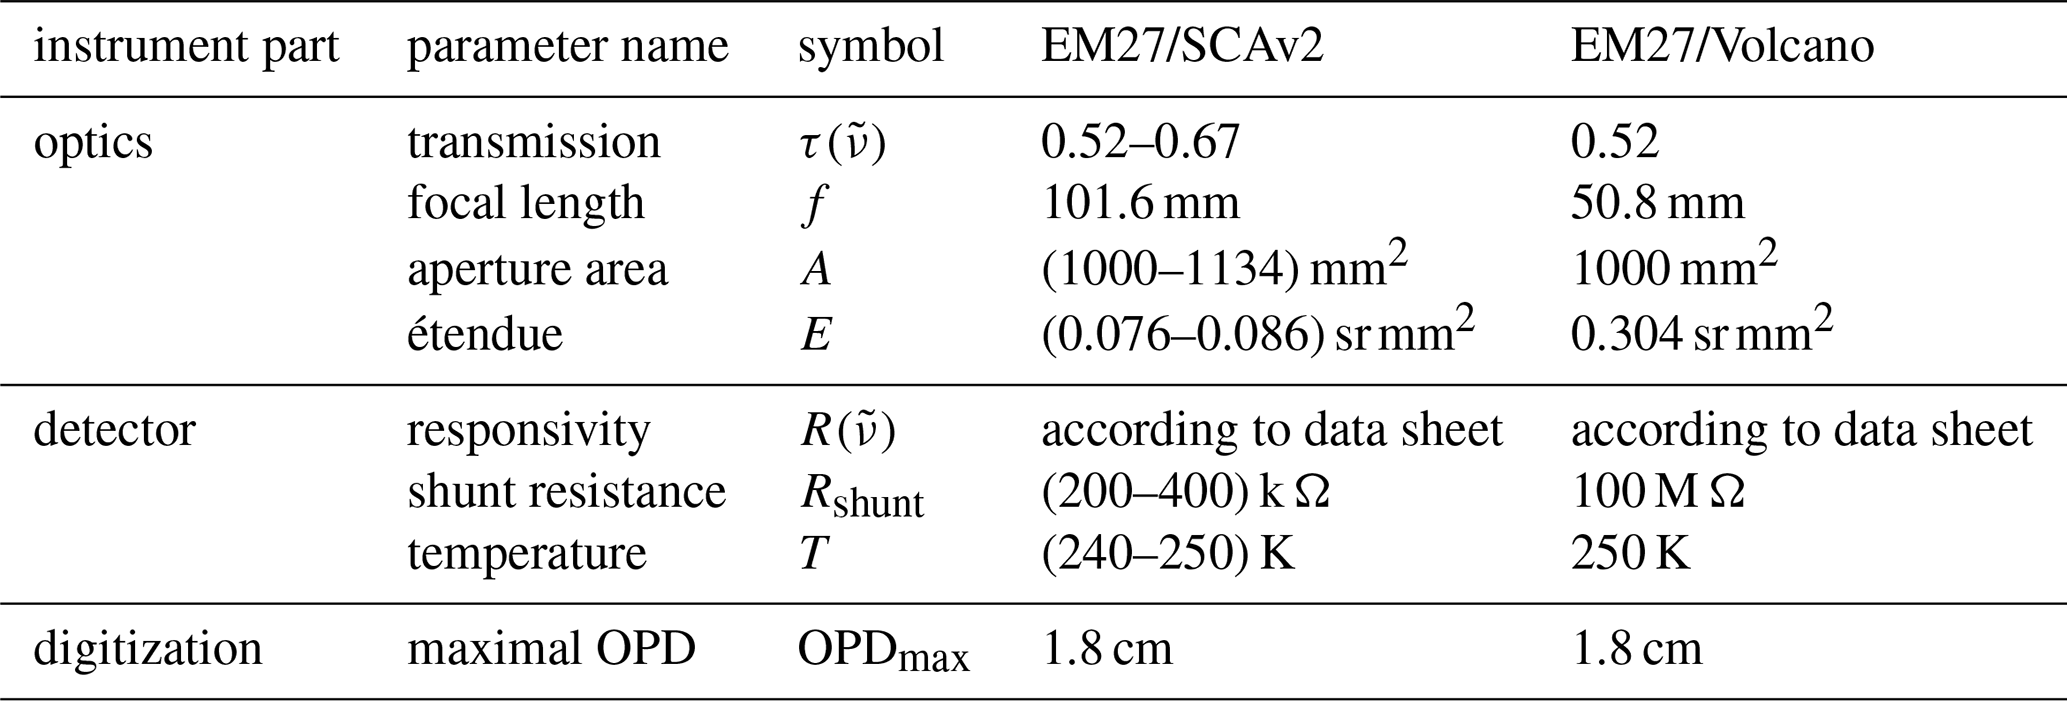
The instrument model for our FTIR measurement needs to address the three main systems of our instrument: First, the optics, which deliver the optical power to the detector. Second, the detector and its front-end, which convert the optical power into an electrical signal, but can also introduce noise. And finally, the sampling and digitization of the signal, which defines the resolution, noise bandwidth, and acquisition time. Table 1 lists all instrument parameters relevant to the instrument model. The following calculations are based on fundamental laws of optics and electronics, as well as on the basic measurement concept of FTIR spectroscopy. These are documented in many textbooks, e.g., Hobbs (2009) and Griffiths and De Haseth (2007).
Table 1Summary of the instrument parameters and their symbols. OPD denotes the optical path difference.
First, we determine the average spectral power on the detector , as a function of the wavenumber . This is given by the product of the source radiance , the transmission of all the optics combined , the geometric light throughput of the system E, also called étendue, and a factor due to the ideal average transmission of the interferometer:
The average power on the detector and the responsivity of the detector together give rise to an average photocurrent:
The dominant noise in the front-end can have different origins; ideally, it is the unavoidable shot noise, but for low-light measurements, the thermal noise of the diode's shunt resistance or of the gain resistance might dominate. In our case and parameter space, the thermal noise of the shunt resistance dominates at low light levels, and shot noise becomes increasingly relevant for brighter scenes. Their respective noise spectral densities S are given by the following equations, where kb is the Boltzmann constant, T the temperature of the diode, Rshunt its shunt resistance, and e the elementary charge:
They are essentially power quantities (units of A2 Hz−1), which is also why the photocurrent appears linearly in the expression for the shot noise. Also, they add directly to the total noise spectral density Stot:
Now, with a description of the signal power and detector noise, we address the digitization and processing. An FTIR instrument digitizes the signal as a function of optical path difference (OPD) up to a maximum (OPDmax), which results after a Fourier transform in a spectral bandwidth (or spectral sampling) of
The instrument scans the OPD at an optical speed of , where is the wavenumber of the reference laser of the instrument and fscan is the frequency of its resulting modulation in the interferometer at the set speed of the scanner. We follow the convention of calling the modulation frequency of the reference laser fscan the “scanning speed”, even though, for those unfamiliar with FTIR spectroscopy, calling a frequency a “speed” may be confusing. Using the above definition, the time of a single acquisition t0 is given by
and defines the equivalent bandwidth of a spectral bin in frequency space Δf accordingly. Assuming that and vary slowly on the scale of , the signal current for a spectral bin is defined by
and the corresponding noise current by
The spectral SNR of a single spectrum is now given by and the SNR of a measurement acquired over a measurement time t and averaged over single acquisitions is
Term C in Eq. (10) contains parameters that are, to some extent, chosen by the user, and it illustrates the typical trade-offs of (FTIR) spectroscopy: SNR improves with the square root of the number of averaged measurements, i.e., the measurement time, and decreases linearly with improved resolution, i.e., increased OPDmax. On the other hand, term B in Eq. (10) contains all fixed instrument parameters that are either available or can be easily estimated: the detector's responsivity can be obtained from its data sheet or from that of a similar detector. The same is true for the transmissions and reflectivities of the beam splitter, windows, and mirrors. The only exception is the noise spectral density, which may depend appreciably on the input radiance if we are in or near the shot-noise-limited regime. Finally, term A in Eq. (10) represents the linear increase of signal strength with increasing signal power, i.e., increasing input radiance . Figure 2 illustrates the SNR as a function of input radiance (using a typical radiance profile and scaling it in intensity). At low radiance levels, the relationship between spectral SNR and radiance is linear. For high radiances, spectral SNR rises only with the square root of the input radiance, since the noise spectral density Stot is dominated by shot noise and grows linearly with the radiance.
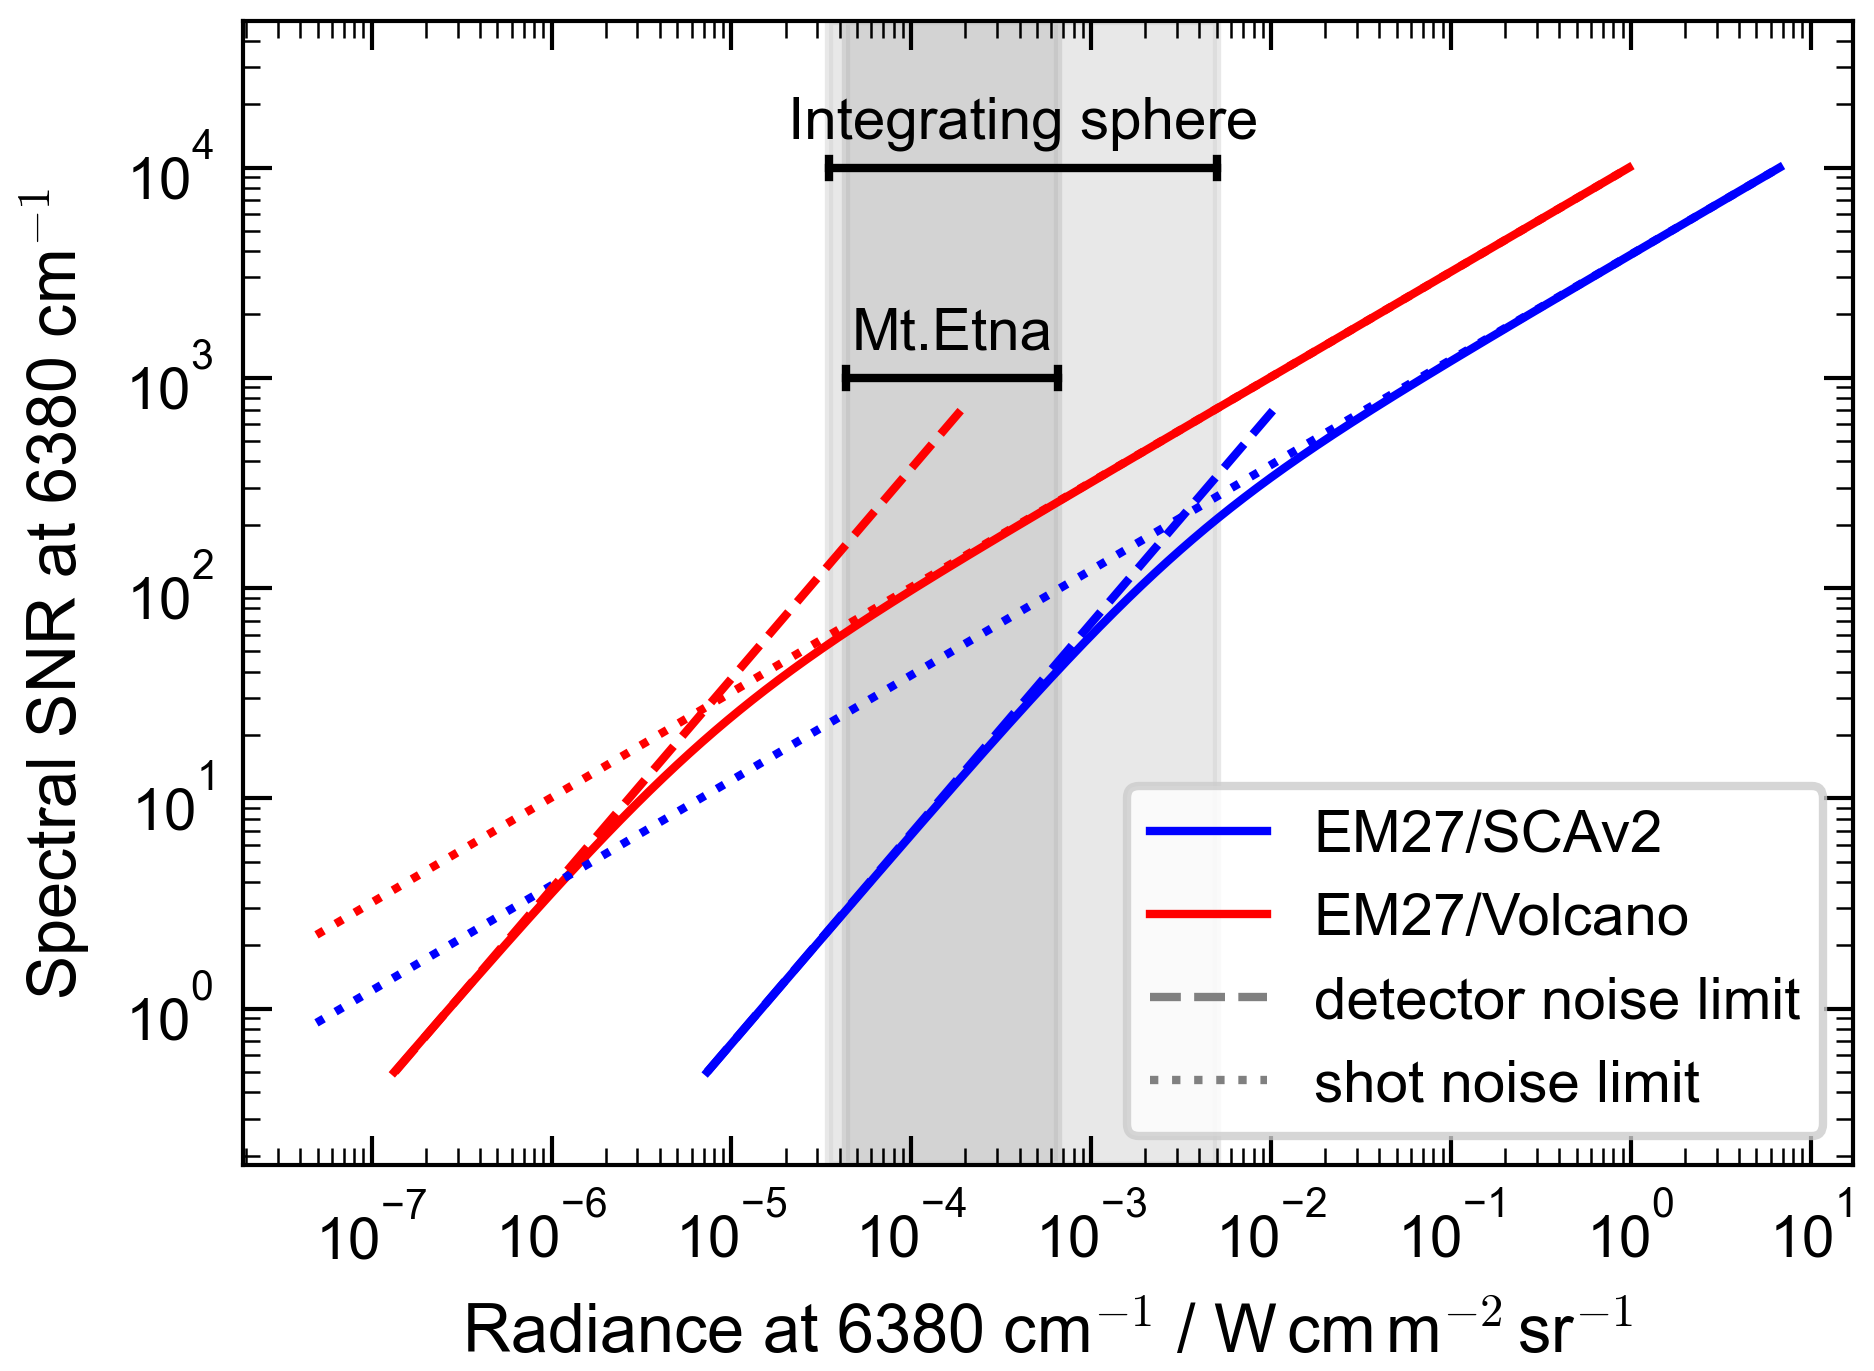
Figure 2Spectral SNR changing with increasing radiance (at 6380 cm−1) for two different sets of instrument parameters. One matches the EM27/SCAv2, the instrument used for the laboratory verification in Sect. 4.2 and one the EM27/Volcano, which is optimized for low radiance conditions. The total photocurrent is calculated assuming a typical spectrum like the one in Fig. 1b. The transition from a detector-noise-limited regime at low radiances to a shot-noise-limited regime is clearly visible for both parameter sets. The shaded areas give the range of radiances expected at Mount Etna, Italy, and emitted by the integrating sphere in the verification experiment of Sect. 4.2.
The radiance can be the most difficult parameter to estimate, depending on the application. For artificial light sources, consulting the data sheet might already provide a sufficient estimate. For sky-scattered sunlight, it is possible to obtain a lower bound by assuming blackbody radiation for the sun's spectrum and calculating Rayleigh scattering in a single-scattering approximation. An upper bound can be obtained by repeating the calculation with Mie scattering and a high assumed aerosol load. In our case, we had sufficiently calibrated measurements of the sky brightness, which informed us of a realistic range of radiances.
Finally, a brief remark on the choice of apodization. All the above calculations ignore apodization, i.e., they assume a “box-car” apodization and are correct for this case. Any other apodization function, for example one of the Norton-Beer functions, suppresses high-frequency contributions, which reduces the apparent noise when it is measured as a standard deviation and thus improves the baseline SNR. This apparent increase in SNR is, of course, not a real information gain, as apodization also weakens the spectroscopic features. Therefore, when combining the definition of baseline SNR with apodization, the SNR prediction needs to be scaled by an additional factor that accounts for this effect and depends on the specific function (e.g., for triangular apodization or 1.58 for the Norton-Beer medium function).
4.2 Experimental validation of the instrument model
To assess the predictive capability of the instrument model presented in Sect. 4.1, we carried out a straightforward laboratory test. First, we measured the radiance emitted from an integrating sphere with a calibrated spectrometer. Next, the obtained radiance spectrum, together with an expected value range for each model parameter, served as input for the instrument model to compute the expected SNR interval for the device under test, the EM27/SCAv2.
Subsequently, we measured the same radiance emitted from the integrating sphere with the device under test and extracted the actual SNR from the spectrum. We repeated the procedure for seven different source brightness levels, deliberately spanning the transition from shot-noise-limited to detector-noise-limited operation. Because raising the power supplied to the halogen lamps changes not only the overall intensity but also the shape of the spectrum, this test goes beyond a simple scaling of the spectrum shown in Fig. 2.
Figure 3 displays the results of this experiment. All measured SNR values lie within the model's predicted interval, and they follow a clear systematic trend: at low illumination, the points are biased towards the lower half of the interval, while at higher illumination, they drift toward the center of the interval. For low radiances, the width of the prediction band is dominated by the uncertainties in the detector's shunt resistance and its temperature. For high radiances, in the shot-noise-dominated regime, the width of the prediction band is governed by the total number of photons reaching the detector, and hence by the uncertainties in the total optical transmission and the étendue. This explains the gradual shift of the relative position of the measured performance within the prediction interval with increasing lamp power, and demonstrates the self-consistency of the model.
Table A1 details the specific parameter choices that generate the prediction envelope and provides additional technical information.
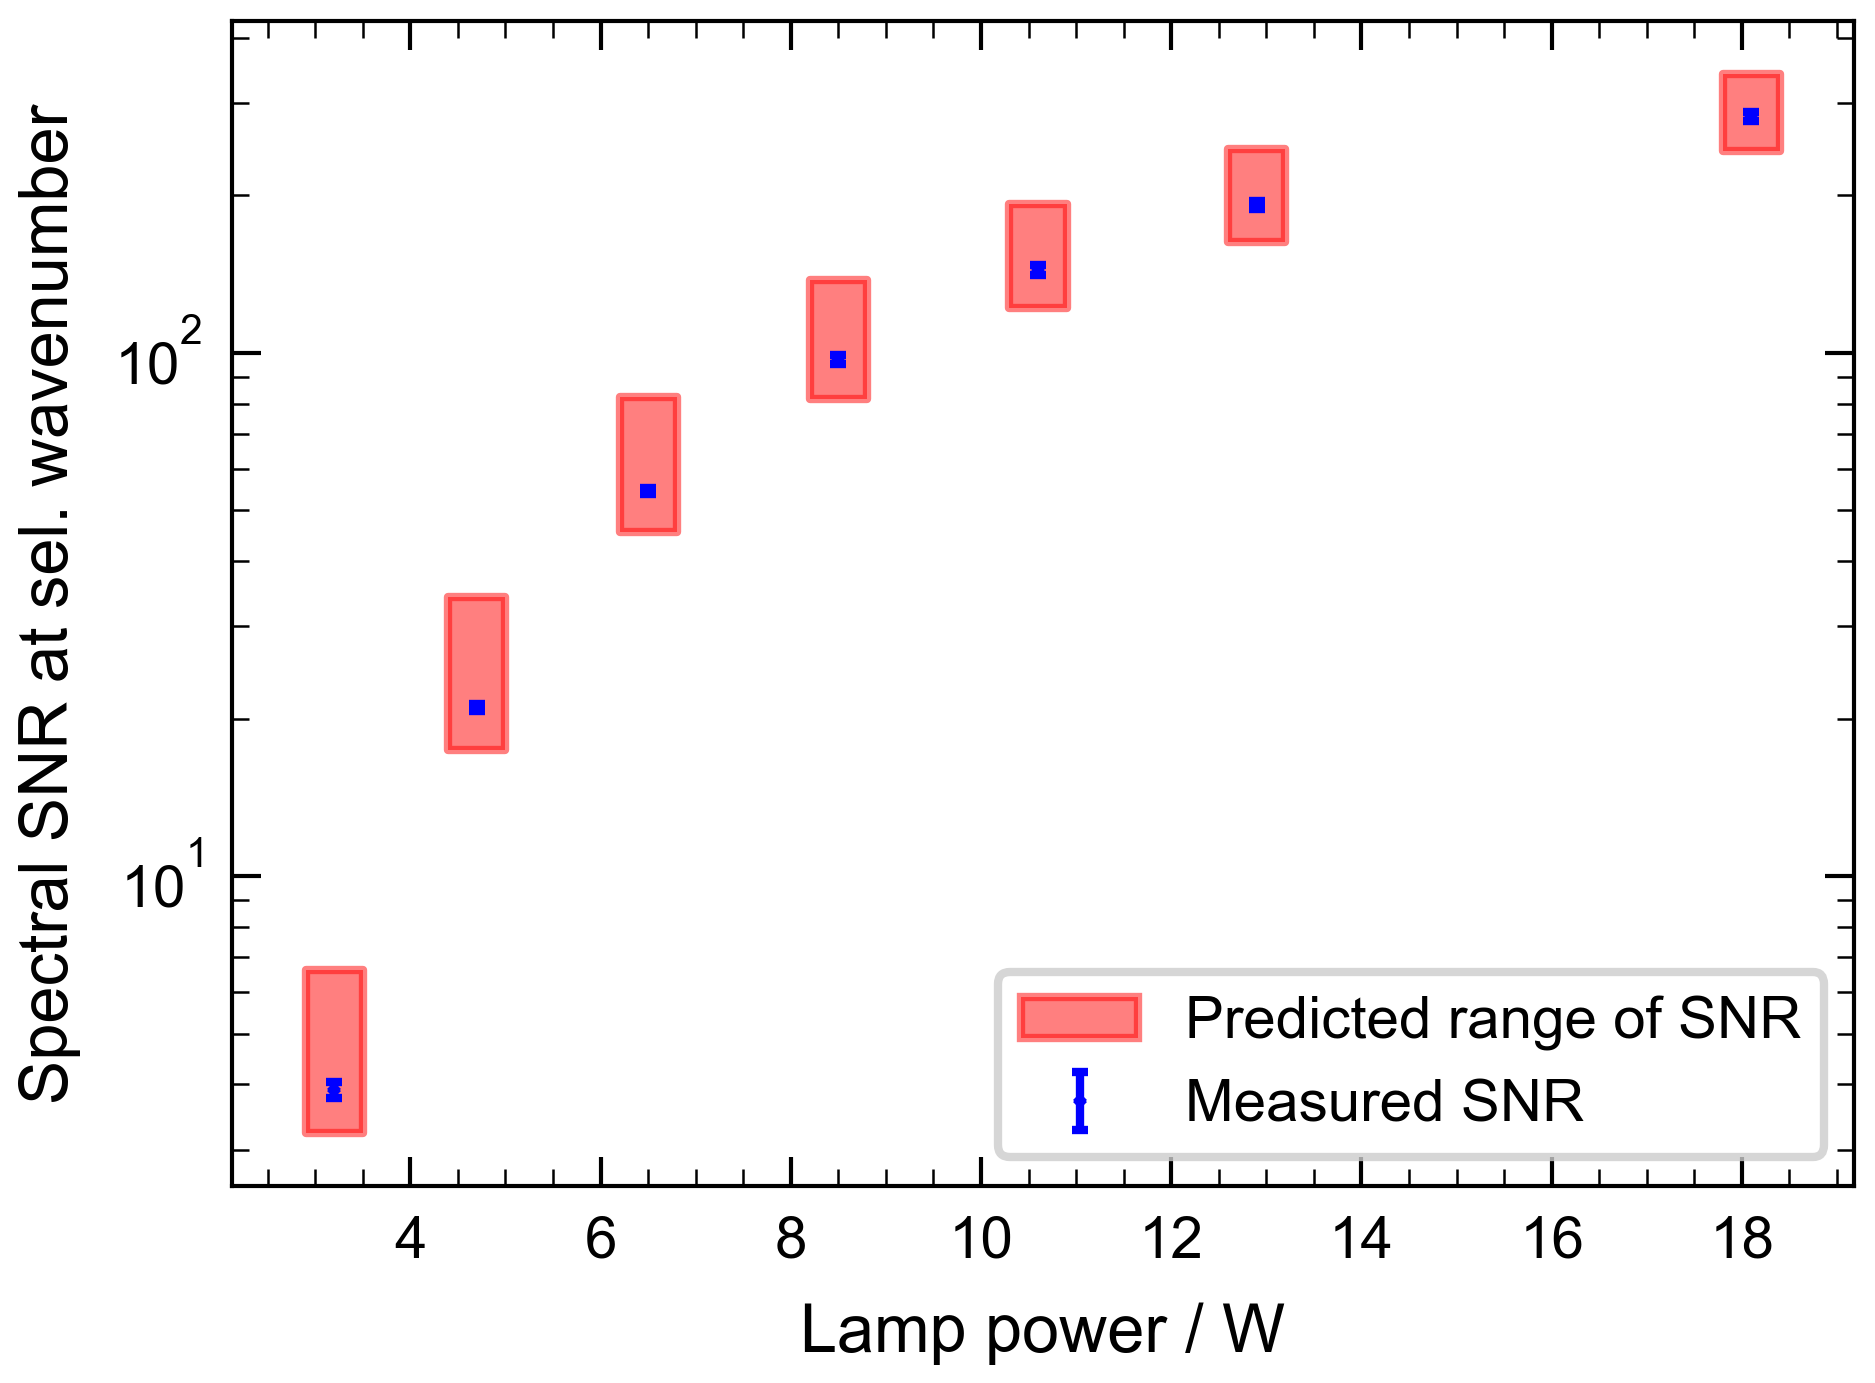
Figure 3Comparison of measured SNR to the range predicted by the instrument model and the input parameters as a function of optical input power to the integrating sphere. At low radiances, the large prediction span is dominated by the uncertainty in detector temperature and its shunt resistance. At high radiances, the span is dominated by the total transmission of the optical elements (mirrors, etc.) and the light throughput. Table A1 provides details on the specific parameter choices.
4.3 Linking spectral SNR to precision of trace gas columns
Linking the spectral SNR to the precision of trace gas column densities derived from the corresponding spectrum is the final step required to predict trace gas performance from a reference radiance spectrum.
In principle, a purely synthetic study could establish this relationship by using a radiative transfer model to generate the “true” spectrum. Adding random white noise to achieve a specific SNR and then propagating the error through the retrieval algorithm would provide the expected precision.
In practice, however, this approach neglects systematic errors that arise, among other things, from necessary simplifications in the atmospheric representation and from imperfections in the spectroscopic database. To capture these real-world effects, we use measurements taken with the EM27/SCAv2 instrument, together with the published data and instrument performance at Mount Etna reported by Butz et al. (2017).
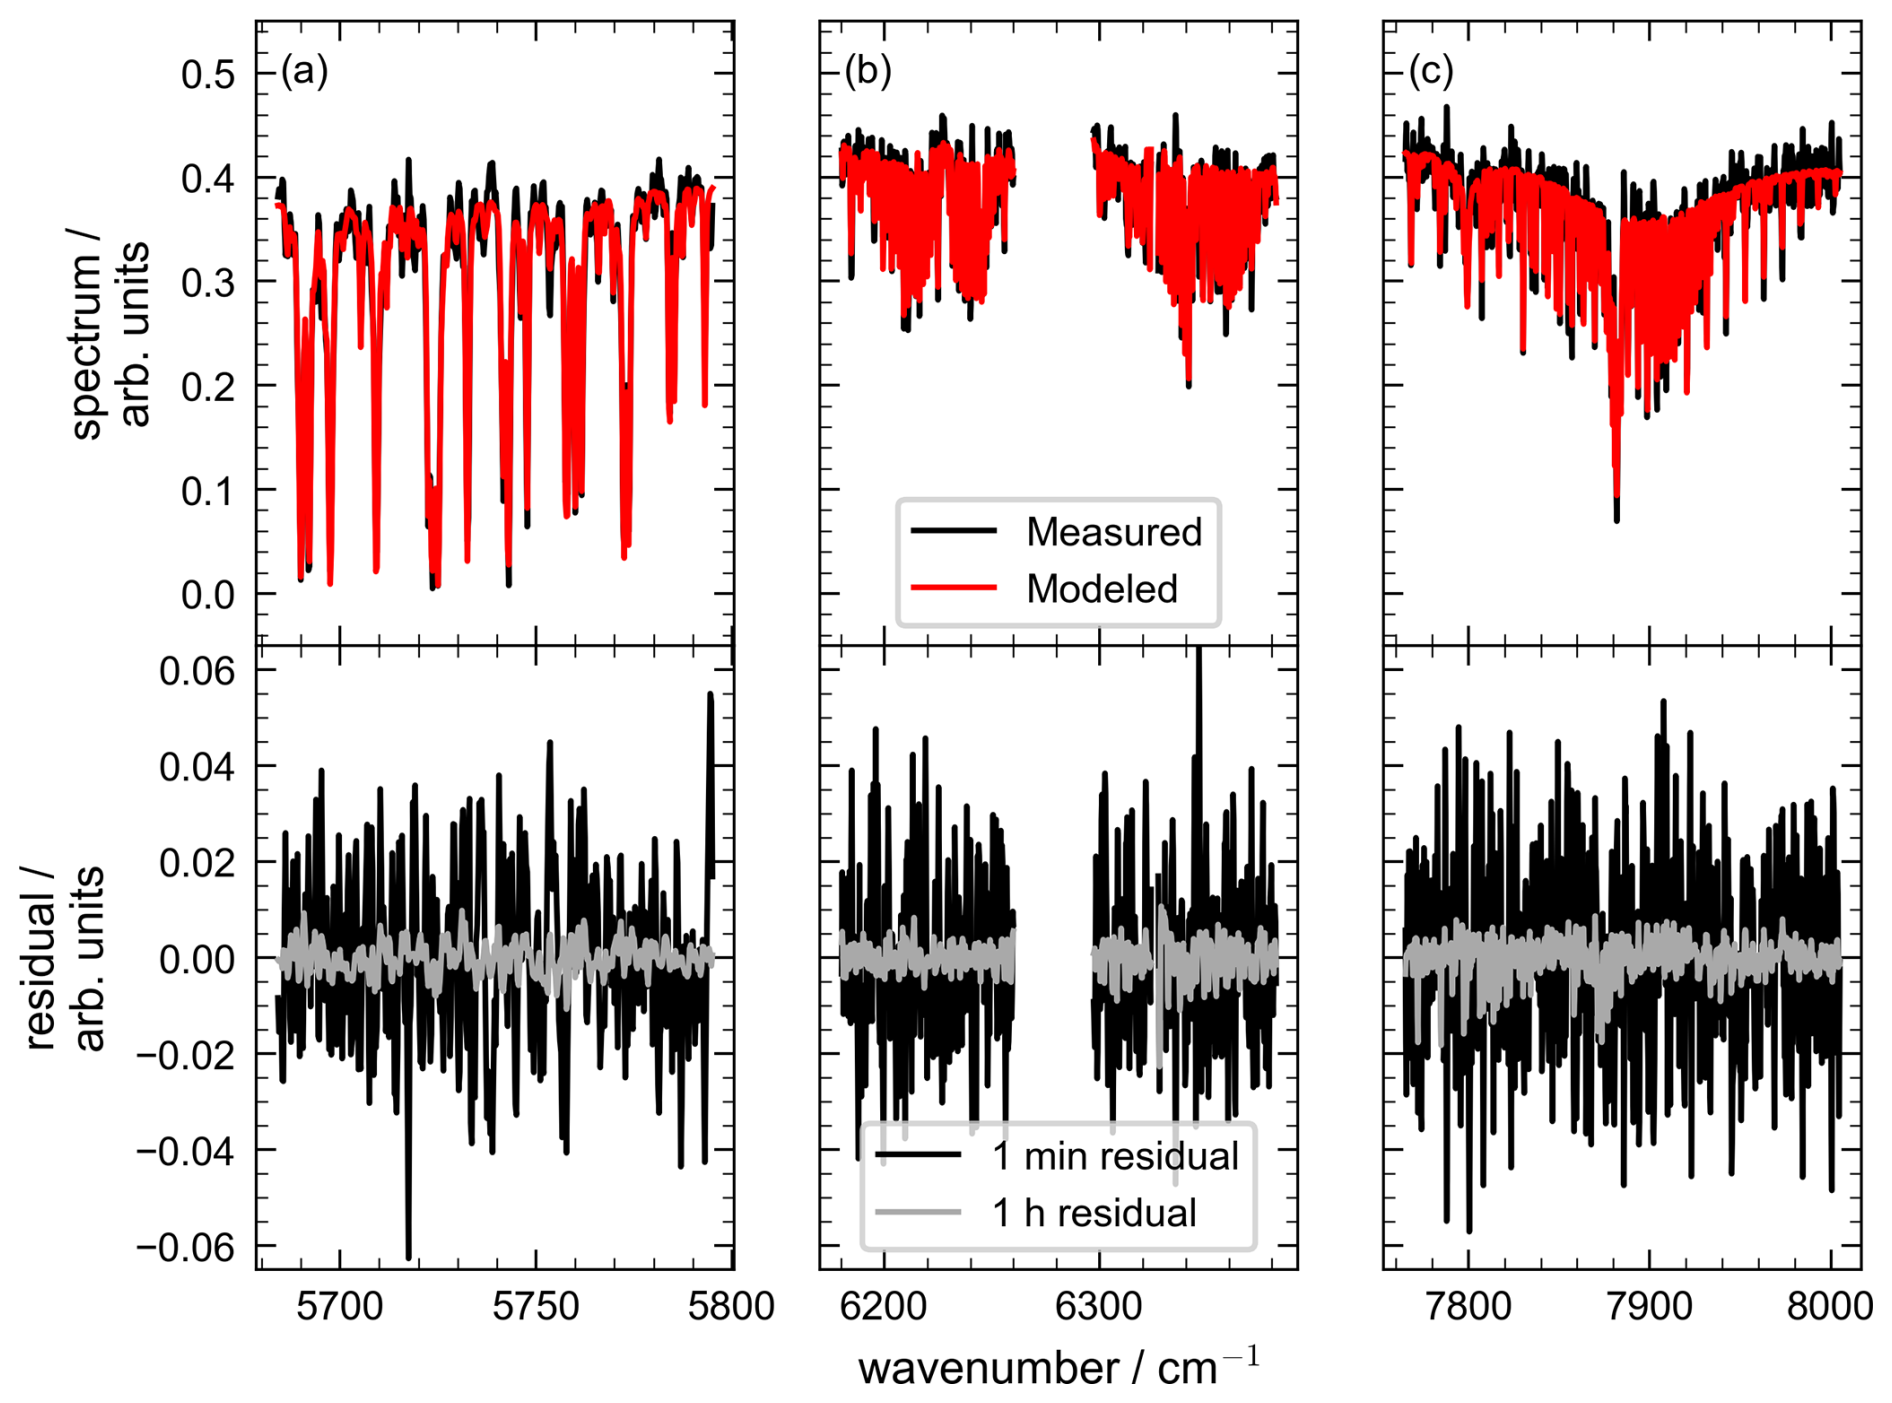
Figure 4Example of a spectral fit to the CO2 window (b) and the spectral regions where HCl (a) and HF (c) absorption features would be expected. The absorption in the spectrum of panel (c) is dominated by O2, which can serve as proxy for the light path. The top panels show the measured spectrum (black) and the fitted model (red). The bottom panels display the individual residuals (black) as well as systematic residuals averaged over 1 h of measurements (grey).
We recorded spectra of sky-scattered sunlight, 1 min each, at a viewing zenith angle of approximately 70 °, which is a realistic value for volcanic measurements. The measurements were performed in Heidelberg on the roof of the Institute of Environmental Physics (49.417342° N, 8.674536° E, 144 m above sea level), beginning at 07:00 UTC on 20 September 2024 and lasting about 5 h. We perform retrievals from these measurements to obtain CO2 slant column densities. Figure 4 presents a representative fit to the CO2 window, as well as the spectral regions where HCl and HF absorption features would be expected if these species were present in the atmosphere.
We investigate the impact of averaging on the retrieved CO2 column densities by averaging variable numbers of successive retrieval results. For each averaging interval, the corresponding SNR is determined from the averaged spectra underlying the retrievals. For the SNR calculation, we define the signal as the maximum spectral intensity in the range 6297–6382 cm−1, excluding the interval 6324–6327 cm−1. The noise is defined as the standard deviation of the spectral intensity in the range 2500–3056 cm−1, which lies beyond the long-wavelength cutoff of the photodiode. The SNR is then calculated as the ratio of the signal to the noise. Figure 5 displays the resulting dependence of retrieval precision on SNR. The plot resembles an Allan-Werle deviation curve (Werle et al., 1993), but the abscissa is spectral SNR rather than averaging time. At the lowest SNR, corresponding to a 1 min averaging time, the propagated retrieval error amounts to approximately 80 % of the empirical precision shown in Fig. 5, indicating good agreement between the two estimates. The apparent degradation in CO2 column precision at the longest averaging intervals does not represent a true loss of performance. Instead, it reflects the increasing influence of changes in the SCD caused by the changing solar position, which eventually dominate over purely statistical noise. In the regime where the curve follows the expected trend (the first few data points), we determine a proportionality constant of 1.9×10²² molec. cm−2.
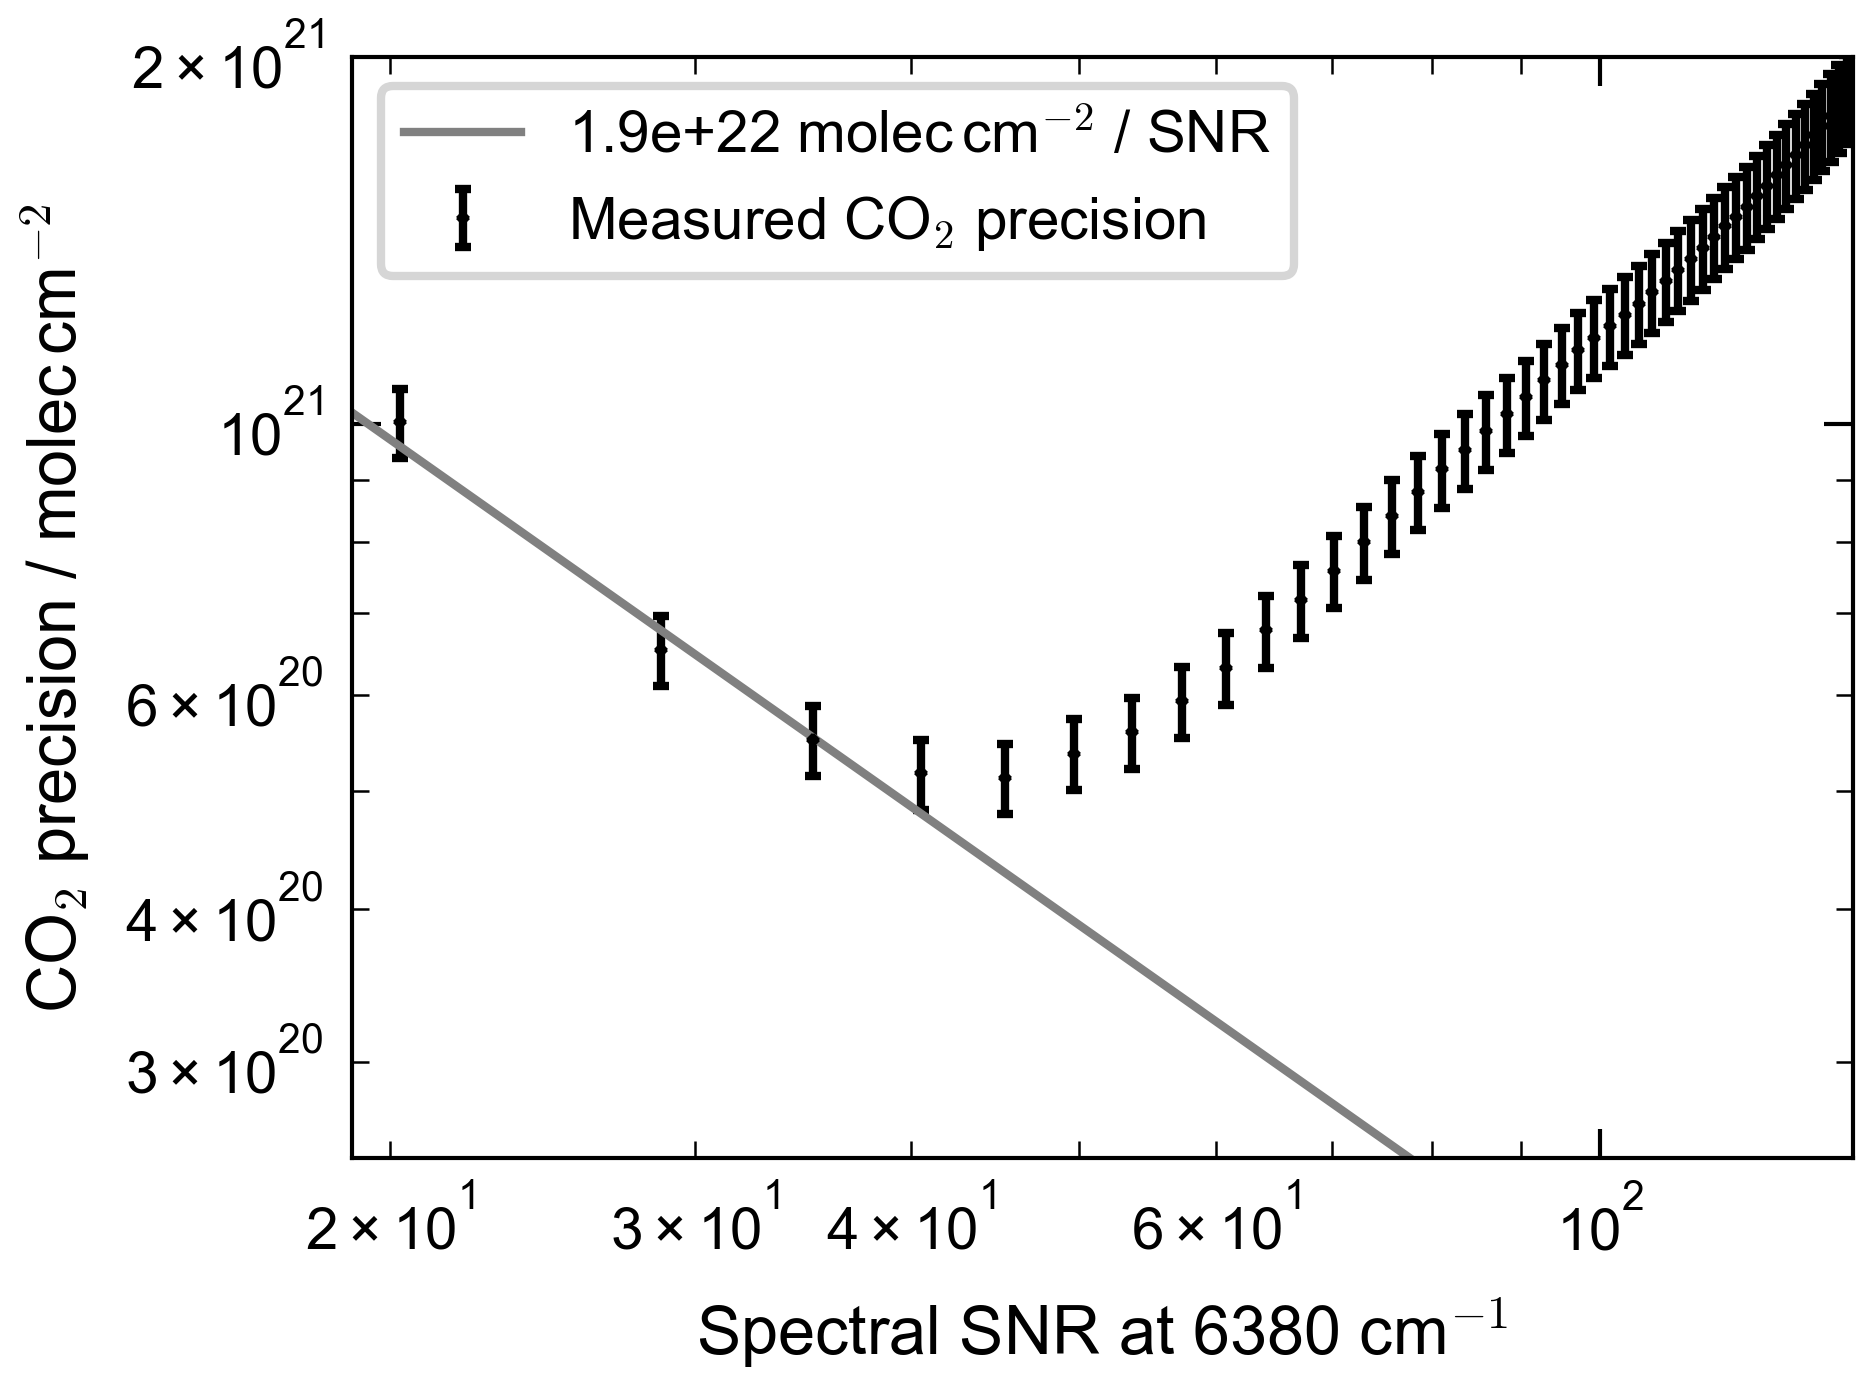
Figure 5Relation between spectral SNR at 6380 cm−1 and the precision of the retrieved CO2 slant column density. One-minute spectra constitute the data basis. Data points for higher spectral SNR result from averaging consecutive spectra, similar to an Allan deviation. At high spectral SNR, the curve departs from the expected inverse trend because atmospheric variability dominates at longer averaging times. The propagated retrieval uncertainty for one minute averaging time (the left most data point) is 7.8×10²⁰ molec. cm−2, which compares well to the empirically observed uncertainty of 1.0×10²¹ molec. cm−2.
To convert the spectral SNR into a slant column precision for HF and HCl, we cannot follow the same direct route used for CO2, since HF and HCl are essentially absent from the spectra acquired for this study. Instead, we adopt the empirical relationship reported by Butz et al. (2017) to link HF or HCl precision to CO2 precision, i.e.,
where x indicates the species HF or HCl and the index lit marks values taken from Butz et al. (2017).
4.4 Prediction of trace gas performance in a volcano setting for a given spectrometer performance
Bringing all of the pieces together, we can now predict the trace gas performance for CO2, HF, and HCl for a volcanic measurement with an FTIR instrument observing sky-scattered sunlight.
To estimate the input radiance, we consult radiance measurements recorded during a 2021 measurement campaign at Mount Etna, Italy, with a radiometrically calibrated grating spectrometer. We consider a clear sky as the lower bound and an aerosol-laden sky as the upper bound for the input radiance, the two differing by about an order of magnitude in the NIR. Figure 6 shows gray-scale images of the respective scenes to illustrate the brightness in the NIR.
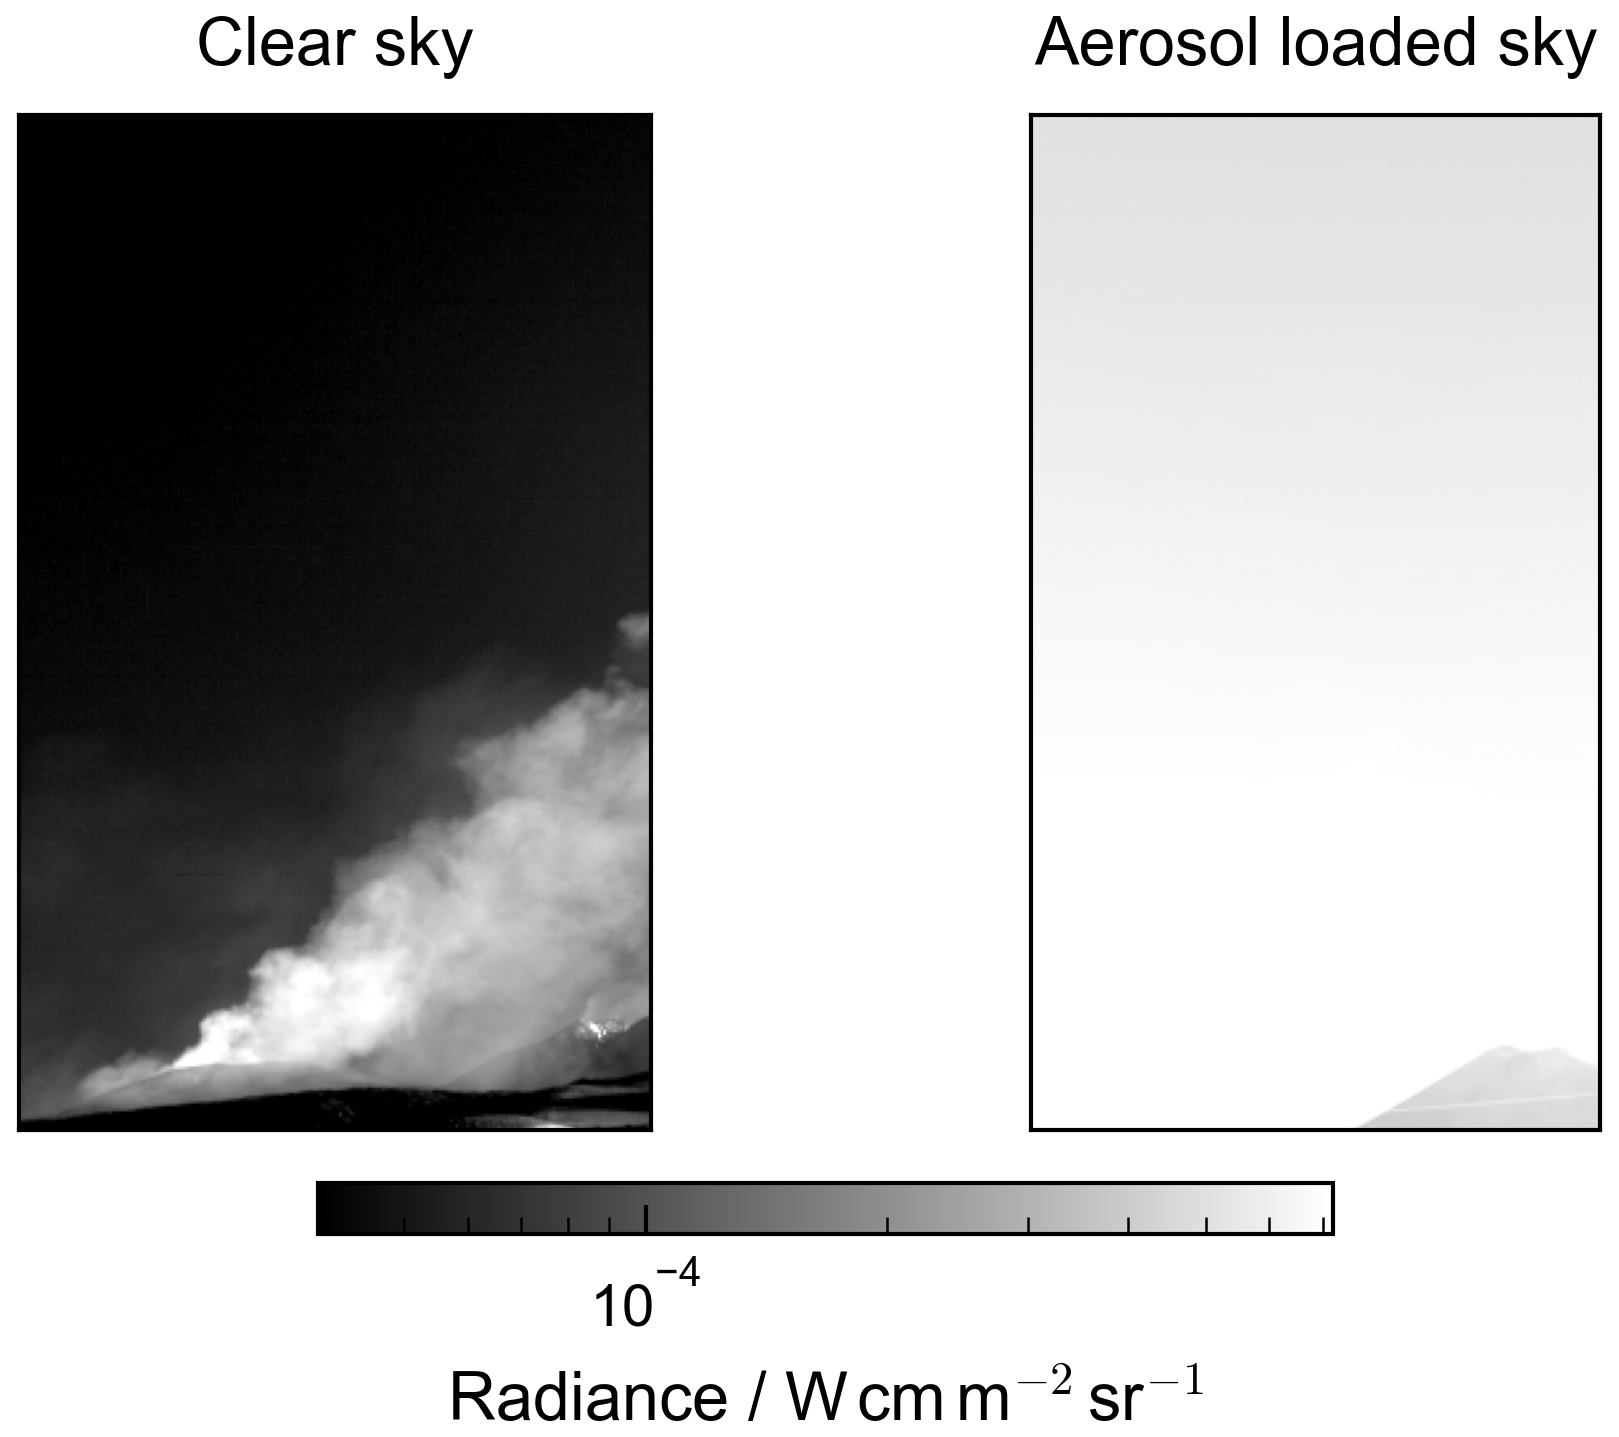
Figure 6Gray-scale images demonstrating the considered range of sky brightness at 6380 cm−1 in the NIR.
The EM27/Volcano, the optimized but hypothetical instrument under consideration, uses a narrower-bandwidth detector, which shows an improved responsivity at 1.6 µm and a substantially higher shunt resistance, allowing for shot-noise-limited operation at lower radiances. Performance in the shot-noise-limited regime is further improved by three factors (see Fig. 2): the improved responsivity, a long-pass filter at 1.1 µm that reduces the relative number of non-signal photons on the detector, and a doubling of the instrument's field of view (FOV) compared to the EM27/SCAv2. The selected FOV represents a compromise between maximizing the light throughput and ensuring that the required detector focal length can be practically realized and aligned.
Using the instrument model developed in Sect. 4.1, in particular Eq. (10), we estimate the spectral performance for these input radiances as a function of measurement time. The results from Sect. 4.3, in particular the scaling factor derived from Fig. 5, link these to CO2 precision and, by scaling according to the results from Butz et al. (2017), i.e., Eq. (11), to HF and HCl precision. Note that the scaling factor shown in Fig. 5 is derived from measurements with the EM27/SCAv2 and is therefore strictly valid only for its FOV. Since the EM27/Volcano has a larger assumed FOV, it starts to experience self-apodization, resulting in an instrument line shape that is up to 6 % broader. This leads to a slight overestimation of the trace gas retrieval precision achievable by the instrument, but by at most the same fraction. Since this is a minor effect compared to the uncertainties discussed here, we neglect it in the following.
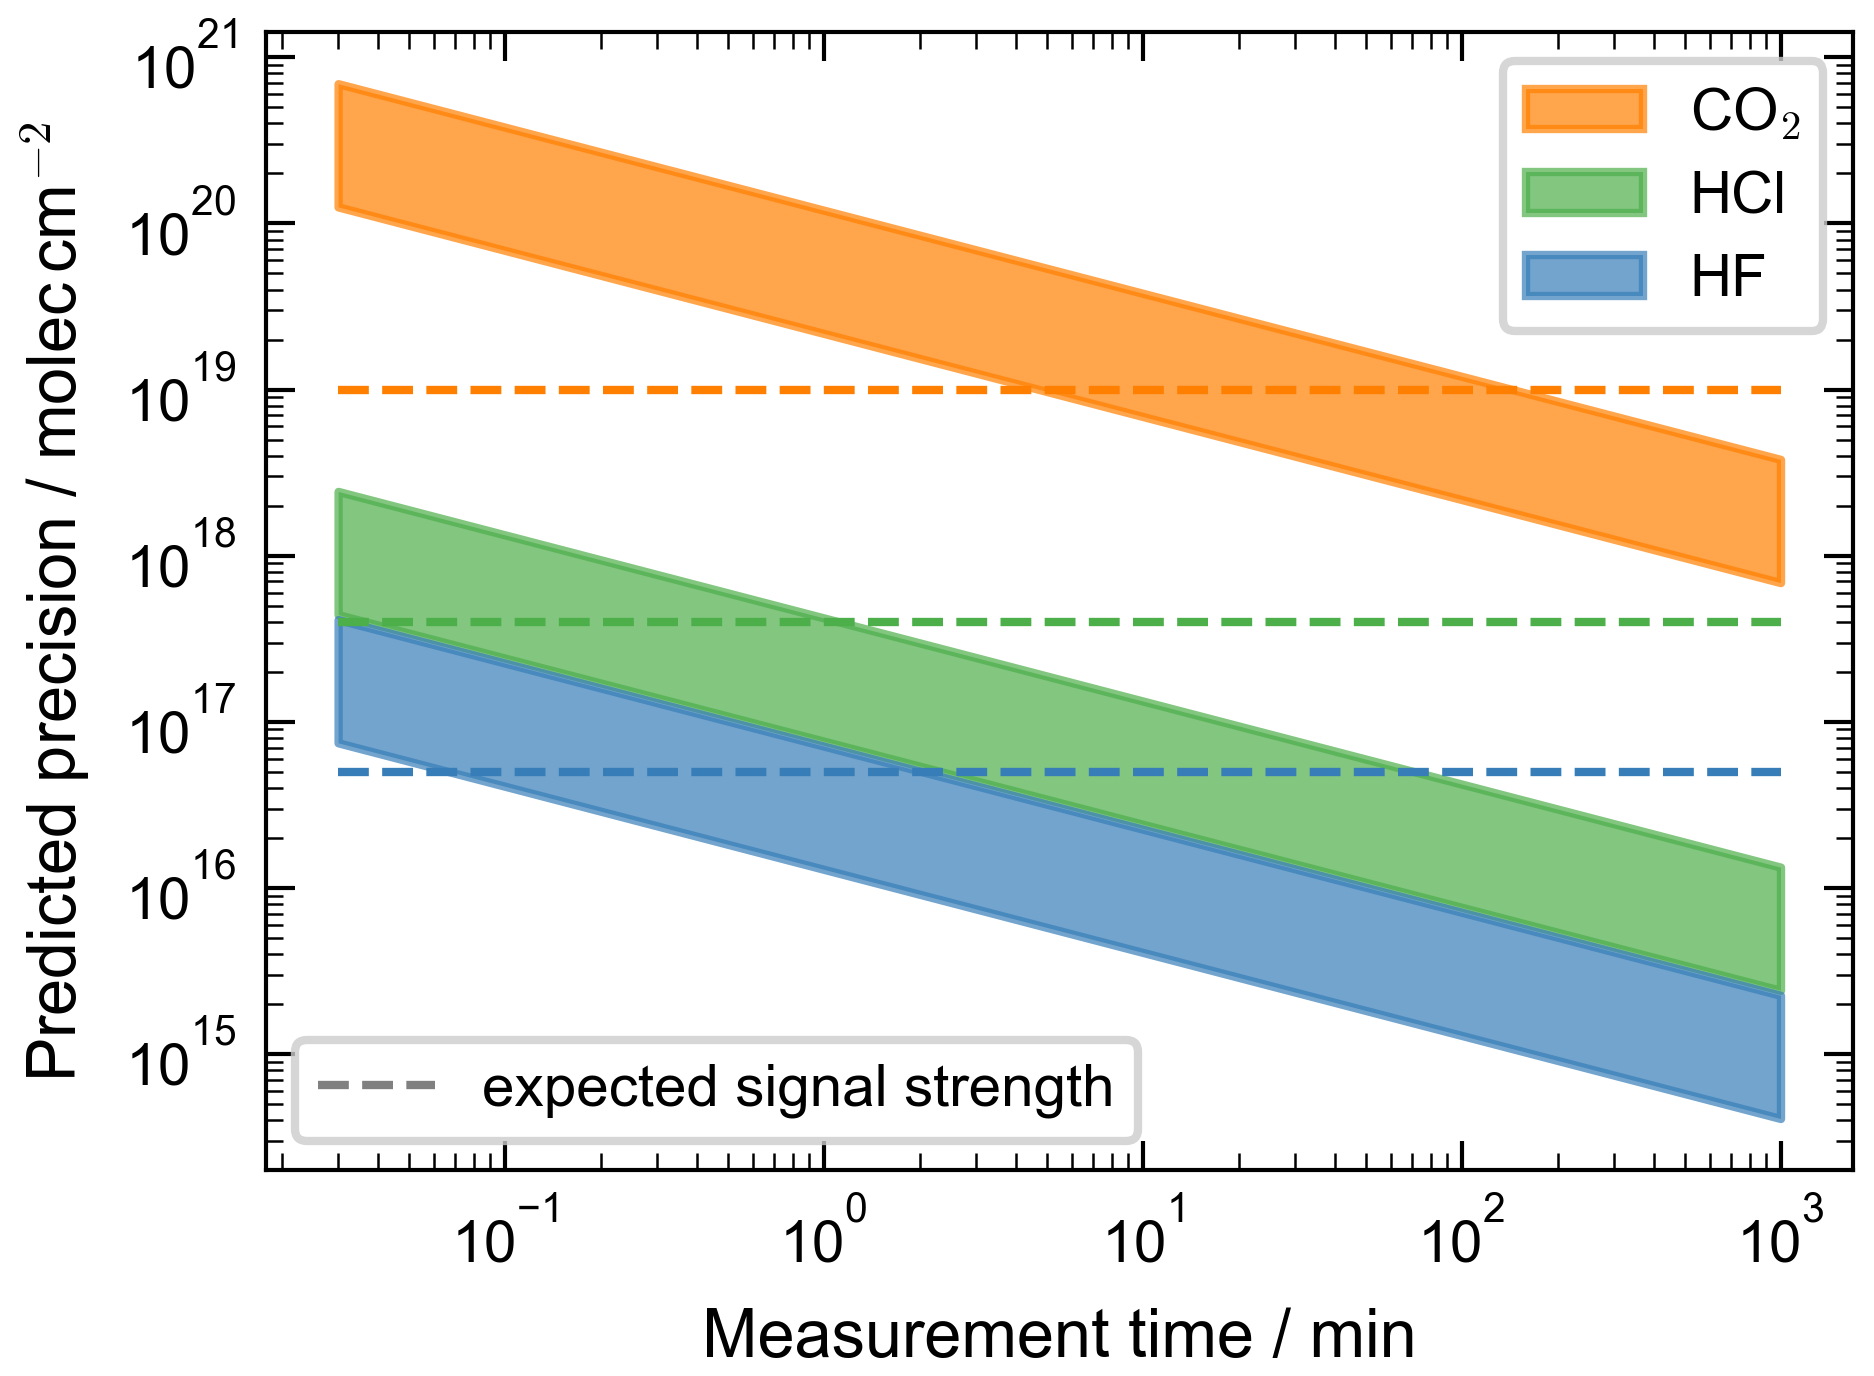
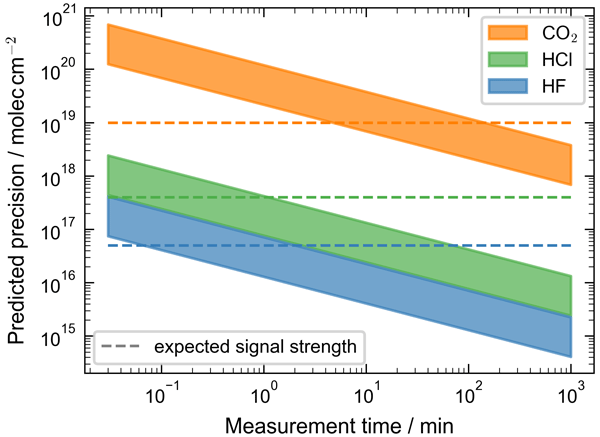
Figure 7Predicted precision of CO2, HCl, and HF as a function of measurement time. The shaded bars reflect the expected range of radiances (clear sky vs. aerosol-laden sky). The horizontal dashed lines indicate the maximum volcanic enhancements for each species, detected by Butz et al. (2017) at Mount Etna, Italy. A measurement of sufficient quality to inform on emissions, e.g., via plume transects, should have a precision of at most 10 % of the expected enhancement.
Figure 7 shows these resulting trace gas performances for all species as a function of measurement time, with the shaded area spanning the range between the bright and dark sky scenarios. Horizontal dashed lines show the column enhancements measured by Butz et al. (2017) and indicate a realistic signal strength. We can infer the measurement times required to detect a typical plume enhancement from the intersections of the dashed lines with the shaded areas. These times range from approximately 5 min to 2.5 h for CO2 and from approximately 3 s to 2 min for HCl and HF, with a slightly better performance for HCl. Adopting a precision requirement for plume transect measurements comparable to that of the Network for Observation of Volcanic and Atmospheric Change (NOVAC), an SO2 monitoring network (Galle et al., 2010), i.e., a precision ten times better than the expected enhancement, results in measurement times of 8 h to days for CO2 and of 5 min to 3 h for HCl and HF. A transect consisting of 30 or more data points could only be realized for HCl and HF under favorable conditions and would still require hours, rather than the 5 to 15 min typical of the NOVAC network. Plume transect measurements of CO2 therefore appear infeasible.
In this study, we assessed the feasibility of constraining volcanic emissions by passive FTIR spectroscopy of sky-scattered sunlight in the NIR. We developed an instrument SNR model, validated it with laboratory measurements, and combined it with an information-content analysis to estimate detection limits for trace gas columns under realistic conditions.
Our results indicate that reliably measuring CO2 columns in volcanic plumes remains challenging. Even under bright sky conditions, the SNR is insufficient to resolve typical plume enhancements with the precision required for robust flux estimates. As a result, constraining CO2 emissions via plume transects would likely require alternative observational strategies or measurement concepts. In contrast, halogen species such as HCl and HF are detectable at volcanoes with high emissions. Their low atmospheric background concentrations result in substantially higher signal-to-background ratios. The expected performance for a sky of average brightness is comparable to that of the measurements of Love et al. (1998, Fig. 2c), performed in the MIR with bright cloud layers as the light source: they measured signals of 100 ppm m (250 ppm m) for HF (HCl) with a relative precision of approximately 10 % in 8 min. Converting these values using an air density of 1.5×1025 yields 1.5×10¹⁷ for HF and 3.8×10¹⁷ for HCl. A precision of about 10 % of these values for measurement times of 8 min is very similar to the respective averages of our estimated performance ranges in Fig. 7 for both gases. Such averaging times are still likely too long for plume transect measurements, since a full scan of the plume would require hours, even under bright sky conditions.
As an alternative to plume transect measurements, a multi-instrument approach, in which the FTIR instrument measures only the plume enhancement, would be more promising: a co-aligned differential optical absorption spectroscopy (DOAS) measurement (as in, e.g., Butz et al., 2017; Enders et al., 2026) could extend the measurement to SO2, allowing for the retrieval of gas ratios, which are in themselves already a useful tool in volcanology. In combination with an SO2 observatory such as the NOVAC stations, this would then give access to the emissions of HCl and HF. An additional SO2 camera could provide real-time information on the position of the plume, ensuring that the FTIR and its co-aligned DOAS instrument sample the center of the plume. While constraining halogen emissions with such a setup seems feasible, it is less likely for CO2: the lower sensitivity of the measurement would probably restrict the approach to a single retrieved value per day even under favorable conditions, but more importantly, the high atmospheric background concentration of CO2 and its variability make the retrieval itself significantly more challenging. We therefore cannot rule out CO2 by this route, but any attempt would have to rest on the multi-instrument approach and likely also on a measurement concept of substantially better precision.
If an instrument such as the one described here, with potentially better noise performance, were to be deployed for remote sensing at a volcano, the follow-up challenge for obtaining meaningful information about plume gas concentrations would be to develop accurate radiative transfer simulations of the lightpath. The lightpath conceptually divides into a component behind the plume, where sunlight is scattered into the viewing direction, a component inside the plume, where the targeted gas enhancements are accumulated, and a component between the plume and the observer (Platt et al., 2018). The solution to this problem largely depends on the scattering properties of the background atmosphere and of the plume in terms of aerosol load, aerosol types, and height distributions, which are all highly variable and poorly constrained by external information for the instantaneous and local measurements envisioned here. The complexity also depends on whether the target gas occurs in large background concentrations such as for CO2 or whether it only occurs within the plume such as for HF and HCl. For the latter, observations of the plume geometry might deliver sufficient information to obtain a meaningful estimate of the respective plume concentrations, provided the plume is not too opaque, so that the (infrared) sunlight can be assumed to travel through the entire plume cross section. For the former, one would need either accurate radiative transfer simulations fed with accurate aerosol properties or a proxy gas that shares the same lightpath but is not emitted by the volcano. In this case, the radiative transfer problem is similar to the one encountered in UV SO2 measurements (e.g., Kern et al., 2013). For CO2, such a proxy is typically methane (CH4), which has a similar distribution of background concentrations but is not emitted in relevant amounts by the volcano. CH4 also has absorption features in spectral proximity to CO2 (around 1650 nm), such that the spectral variation of the optical scattering properties is mild enough to assume very similar lightpaths. Overall, the complexity of radiative transfer is a further major challenge to the type of volcano remote sensing we investigated here.
The limitations of the spectral measurement itself arise fundamentally from the limited amount of scattered NIR light and are largely independent of the specific spectroscopic implementation (FTIR in this study). Any method aiming to overcome this limitation would likely need to either collect substantially more light, restrict observations to a narrow spectral region around the CO2 lines to increase the ratio of signal photons to irrelevant background photons, or combine both approaches. Restricting the spectral range introduces additional challenges: it can complicate the baseline estimation and it reduces the information available to characterize scattering in the retrieval. If the spectral range were narrowed enough to improve the performance for a specific trace gas appreciably, the measurement would likely be restricted to that single species. A meaningful increase in the light throughput also appears unlikely: the proposed instrument already uses 2-inch optics, no suitable FTIR platforms with larger optics are commercially available, and the added size and mass would make the instrument too bulky and heavy for field deployment. An increase in the FOV, achieved either by enlarging the field stop (which is the detector size) or by further shortening the focal length of the focusing optics, is also unlikely to help: a larger detector quickly results in worse noise performance, while a shorter focal length cannot be realized with off-the-shelf mirrors and would lead to significant alignment challenges and to detrimental effects on the instrument line shape, and thus on the quality of the spectral retrieval. Additionally, increasing the FOV beyond that of the proposed instrument would quickly result in self-apodization, reducing the effective resolution and with it the spectral signatures of the trace gases. It is possible that a setup with a reduced resolution (meaning a reduced maximal OPD) and a larger FOV could still provide an overall performance gain, but the information content does not scale linear as Eq. (10) implies. A smaller maximal OPD also causes a linear decrease in spectral sampling. This should result in an effective scaling of the information content closer to the inverse square root of the maximal OPD. So even if this parameter is tuned (and this would require a different development platform) there is likely just a factor, not an order of magnitude to gain and the detrimental impact of a decreased spectral resolution on the trace gas performance is complex and challenging to predict (Wilzewski et al., 2020).
Despite these constraints, the concept retains a decisive advantage in its viewing geometry: it depends neither on a hot emission source nor on a favorable solar position, so the instrument can be pointed freely and operated continuously and automatically, which is the prerequisite for monitoring rather than campaign-style measurements. For the strongly emitted halogens HCl and HF, the required measurement times are short enough that such monitoring appears within reach, particularly when the FTIR measurement is combined with co-aligned UV observations of SO2. For CO2, the limiting factor is the small plume enhancement relative to the large and variable atmospheric background, which in addition leaves the retrieval far more sensitive to errors in the radiative transfer. Additionally, the detection limits reported here are a property of the method and instrument concept and can therefore be applied to any source whose expected column enhancement is known. Anthropogenic super-emitters such as power plants or industrial facilities, for instance, produce CO2 enhancements far larger than those of a volcanic plume. For such targets, CO2 observations in sky-scattered sunlight may well prove feasible, and a flexible viewing geometry would be equally valuable there.
This study provides a systematic assessment of NIR FTIR spectroscopy of sky-scattered sunlight, in general and for volcanic applications in particular, and it identifies the limitations of the concept. Turning the concept into an operational measurement requires two further steps: a retrieval that solves the lightpath problem outlined above and, particularly for the multi-instrument approach proposed here, the assembly and co-deployment of the required instrumentation. Alternatively, one could pursue a measurement concept that overcomes the light-throughput and resolution constraints identified in this study. The framework we used, i.e., an instrument SNR model combined with an information content analysis anchored in actual measurements, applies equally to other instruments, spectral regions, and target species, and can guide such assessments before hardware is built.
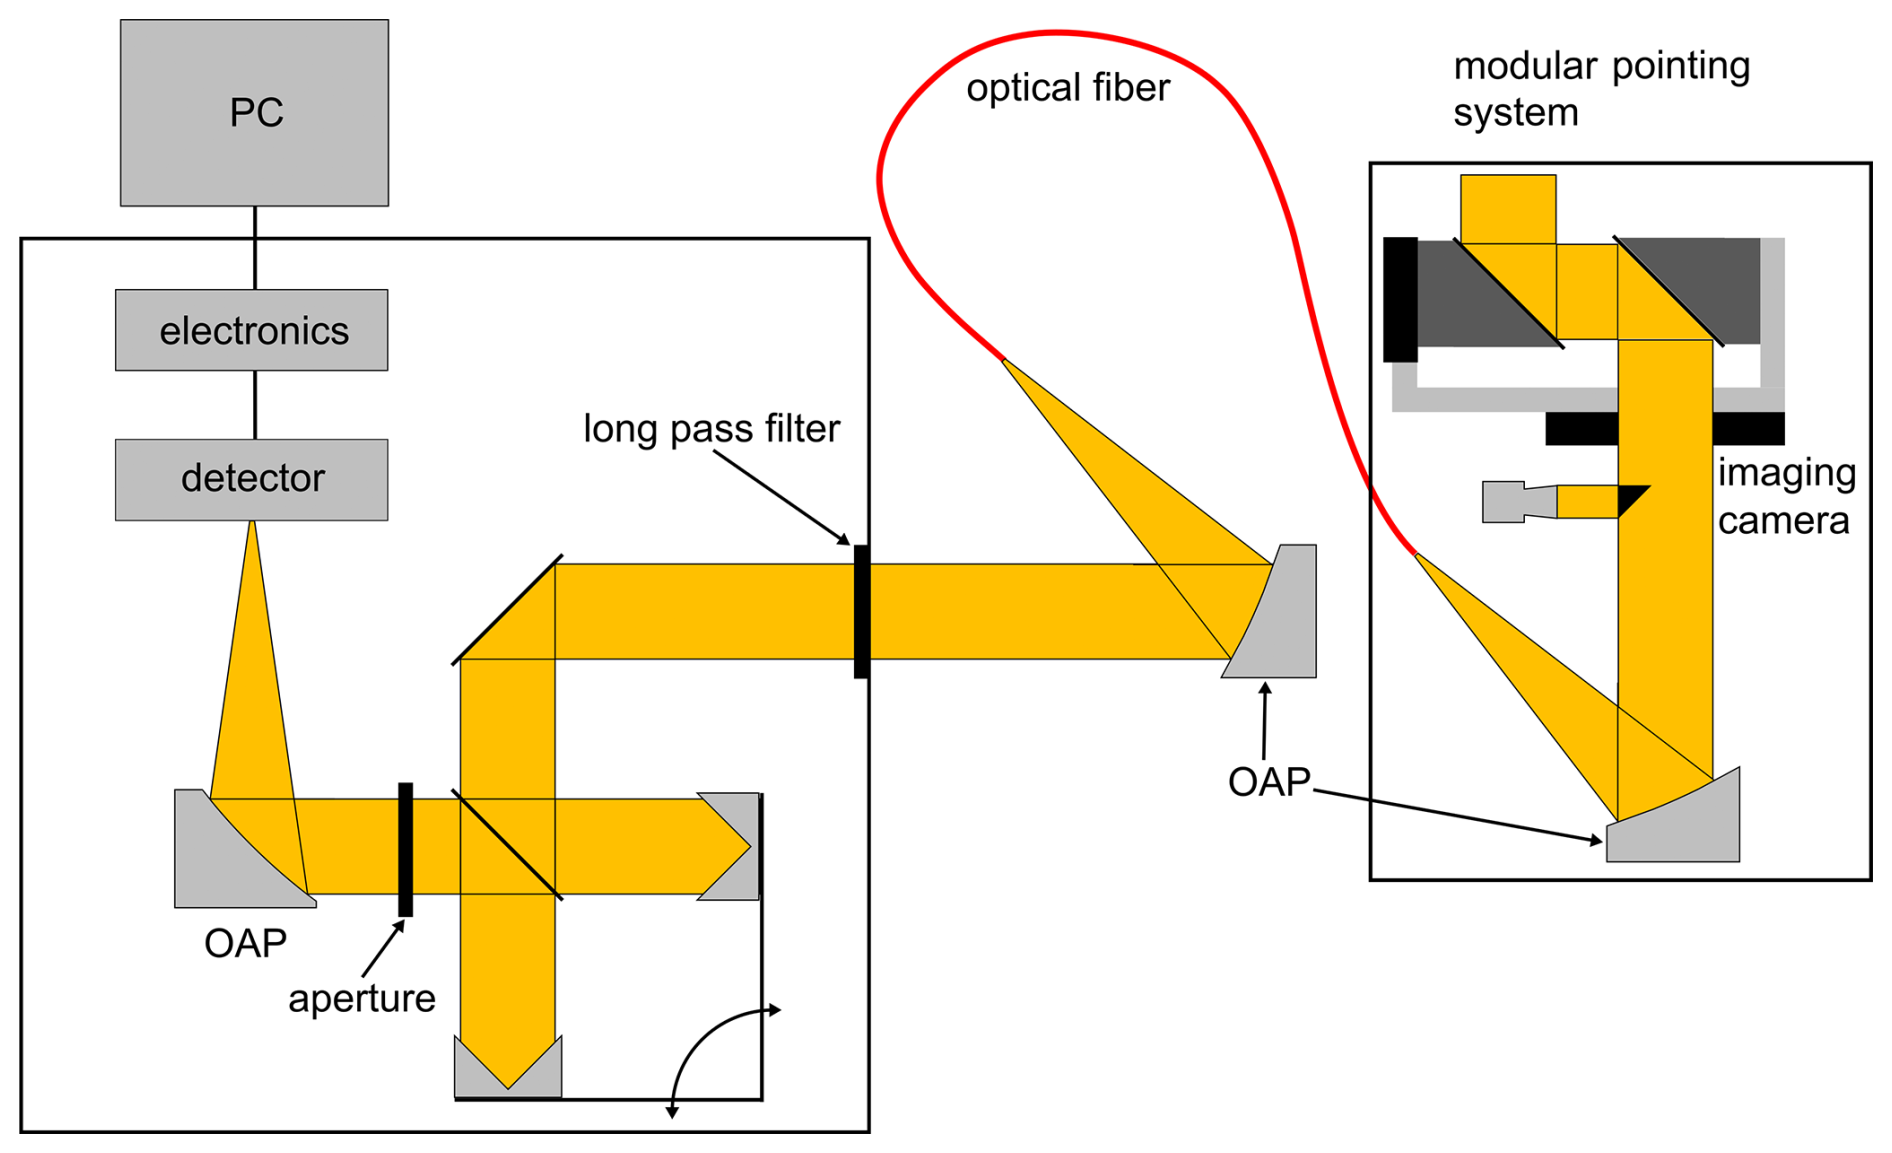
Figure A1Schematic of the EM27/SCAv2 instrument. On the right side is a modular pointing system in a robust and weatherproof housing. It couples the captured light into an optical fiber and guides it to the spectrometer (on the left). In the spectrometer, the light is modulated by the interferometer and imaged on the photodiode/detector. The front-end and sampling electronics process and digitize the signal and send it to the PC. The imaging camera in the pointing system enables precise aiming and monitoring.
Table A1Hardware parameters used in the instrument model and the corresponding assumption-based value ranges for the two instrument versions considered in this study, the EM27/SCAv2 and the EM27/Volcano. The parameters of the EM27/SCAv2 are used to derive the prediction interval shown in Fig. 3, while those of the EM27/Volcano are used for the performance predictions shown in Fig. 7. The total optical transmission efficiency accounts for losses due to mirrors, windows, filters, the optical fiber, and the (non-ideal) beam splitter.
Spectra of the lab verification or the scattered light FTIR measurement, as well as the hyperspectral images can be obtained from the authors upon reasonable request.
MS performed all measurements and carried out the formal data analysis. TDS and MS developed the instrument model. BAL provided the reference instrument and its radiometric calibration. BAL supported the analysis for the full-physics retrieval. LW developed and built the current version of the instrument with RK and BAL supporting the process. NB supported the project with her expertise in volcano field measurements. TDS, MS, and NB wrote the paper, and all authors commented on the draft. TDS conceptualized the feasibility study and the experimental validation of the instrument model. AB supervised the study and hypothesized that volcanic CO2 measurements in sky-scattered sunlight are possible.
At least one of the (co-)authors is a member of the editorial board of Atmospheric Measurement Techniques. The peer-review process was guided by an independent editor, and the authors also have no other competing interests to declare.
Publisher's note: Copernicus Publications remains neutral with regard to jurisdictional claims made in the text, published maps, institutional affiliations, or any other geographical representation in this paper. The authors bear the ultimate responsibility for providing appropriate place names. Views expressed in the text are those of the authors and do not necessarily reflect the views of the publisher.
Special thanks go to Marvin Knapp for recording the NIR measurements of the sky at Mount Etna with the Hyspex instrument during a measurement campaign in summer 2021. The availability of these data made this study more straightforward and more robust. The authors further acknowledge the use of large language model based AI tools to assist in drafting, revising, and developing material related to this manuscript. All AI-generated output, including text and plotting scripts, was critically reviewed, edited, and validated by the authors, who take full responsibility for the final content. Finally, the authors thank the referees at AMT for their critical and constructive questions and suggestions, which contributed to a significant improvement of the manuscript.
This paper was edited by Nicholas Deutscher and reviewed by two anonymous referees.
Aiuppa, A., Federico, C., Franco, A., Giudice, G., Gurrieri, S., Inguaggiato, S., Liuzzo, M., McGonigle, A. J. S., and Valenza, M.: Emission of Bromine and Iodine from Mount Etna Volcano, Geochem. Geophy. Geosy., 6, 2005GC000965, https://doi.org/10.1029/2005GC000965, 2005. a
Aiuppa, A., Fischer, T. P., Plank, T., and Bani, P.: CO2 Flux Emissions from the Earth's Most Actively Degassing Volcanoes, 2005–2015, Sci. Rep., 9, 5442, https://doi.org/10.1038/s41598-019-41901-y, 2019. a
Allard, P., Burton, M., and Muré, F.: Spectroscopic Evidence for a Lava Fountain Driven by Previously Accumulated Magmatic Gas, Nature, 433, 407–410, https://doi.org/10.1038/nature03246, 2005. a
Arellano, S., Galle, B., Apaza, F., Avard, G., Barrington, C., Bobrowski, N., Bucarey, C., Burbano, V., Burton, M., Chacón, Z., Chigna, G., Clarito, C. J., Conde, V., Costa, F., De Moor, M., Delgado-Granados, H., Di Muro, A., Fernandez, D., Garzón, G., Gunawan, H., Haerani, N., Hansteen, T. H., Hidalgo, S., Inguaggiato, S., Johansson, M., Kern, C., Kihlman, M., Kowalski, P., Masias, P., Montalvo, F., Möller, J., Platt, U., Rivera, C., Saballos, A., Salerno, G., Taisne, B., Vásconez, F., Velásquez, G., Vita, F., and Yalire, M.: Synoptic analysis of a decade of daily measurements of SO2 emission in the troposphere from volcanoes of the global ground-based Network for Observation of Volcanic and Atmospheric Change, Earth Syst. Sci. Data, 13, 1167–1188, https://doi.org/10.5194/essd-13-1167-2021, 2021. a, b
Burton, M., Allard, P., Muré, F., and La Spina, A.: Magmatic Gas Composition Reveals the Source Depth of Slug-Driven Strombolian Explosive Activity, Science, 317, 227–230, https://doi.org/10.1126/science.1141900, 2007. a
Burton, M., Caltabiano, T., Murè, F., Salerno, G., and Randazzo, D.: SO2 Flux from Stromboli during the 2007 Eruption: Results from the FLAME Network and Traverse Measurements, J. Volcanol. Geoth. Res., 182, 214–220, https://doi.org/10.1016/j.jvolgeores.2008.11.025, 2009. a
Burton, M., Salerno, G., D'Auria, L., Caltabiano, T., Murè, F., and Maugeri, R.: SO2 Flux Monitoring at Stromboli with the New Permanent INGV SO2 Camera System: A Comparison with the FLAME Network and Seismological Data, J. Volcanol. Geoth. Res., 300, 95–102, https://doi.org/10.1016/j.jvolgeores.2015.02.006, 2015. a, b
Butz, A., Guerlet, S., Hasekamp, O., Schepers, D., Galli, A., Aben, I., Frankenberg, C., Hartmann, J.-M., Tran, H., Kuze, A., Keppel-Aleks, G., Toon, G., Wunch, D., Wennberg, P., Deutscher, N., Griffith, D., Macatangay, R., Messerschmidt, J., Notholt, J., and Warneke, T.: Toward Accurate CO2 and CH4 Observations from GOSAT: GOSAT CO2 and CH4 Validation, Geophys. Res. Lett., 38, L14812, https://doi.org/10.1029/2011GL047888, 2011. a
Butz, A., Dinger, A. S., Bobrowski, N., Kostinek, J., Fieber, L., Fischerkeller, C., Giuffrida, G. B., Hase, F., Klappenbach, F., Kuhn, J., Lübcke, P., Tirpitz, L., and Tu, Q.: Remote sensing of volcanic CO2, HF, HCl, SO2, and BrO in the downwind plume of Mt. Etna, Atmos. Meas. Tech., 10, 1–14, https://doi.org/10.5194/amt-10-1-2017, 2017. a, b, c, d, e, f, g, h, i
Delsemme, A. H.: Spectroscopie de flammes volcaniques. Bulletin des Séances de l'Académie Royale des Sciences d'Outre-Mer, Nouvelle Série, 6, 507–519, 1960. a
Enders, V., Müller, A., Frey, M. M., Hase, F., Kleinschek, R., Knapp, M., Löw, B., Morino, I., Nakaoka, S.-I., Nara, H., Tanimoto, H., Vardag, S. N., Voss, K., and Butz, A.: Towards routine shipborne measurements of columnar CO2, CH4, CO, and NO2: a case study for tracking regional-scale emission patterns, Atmos. Meas. Tech., 19, 2633–2655, https://doi.org/10.5194/amt-19-2633-2026, 2026. a
Francis, P., Burton, M. R., and Oppenheimer, C.: Remote Measurements of Volcanic Gas Compositions by Solar Occultation Spectroscopy, Nature, 396, 567–570, https://doi.org/10.1038/25115, 1998. a
Galle, B., Oppenheimer, C., Geyer, A., McGonigle, A. J., Edmonds, M., and Horrocks, L.: A Miniaturised Ultraviolet Spectrometer for Remote Sensing of SO2 Fluxes: A New Tool for Volcano Surveillance, J. Volcanol. Geoth. Res., 119, 241–254, https://doi.org/10.1016/S0377-0273(02)00356-6, 2003. a
Galle, B., Johansson, M., Rivera, C., Zhang, Y., Kihlman, M., Kern, C., Lehmann, T., Platt, U., Arellano, S., and Hidalgo, S.: Network for Observation of Volcanic and Atmospheric Change (NOVAC) – A Global Network for Volcanic Gas Monitoring: Network Layout and Instrument Description, J. Geophys. Res.-Atmos., 115, 2009JD011823, https://doi.org/10.1029/2009JD011823, 2010. a, b, c
Goff, F., Love, S. P., Warren, R., Counce, D., Obenholzner, J., Siebe, C., and Schmidt, S. C.: Passive Infrared Remote Sensing Evidence for Large, Intermittent CO2 Emissions at Popocatépetl Volcano, Mexico, Chem. Geol., 177, 133–156, https://doi.org/10.1016/S0009-2541(00)00387-9, 2001. a
Griffiths, P. R. and De Haseth, J. A.: Fourier Transform Infrared Spectrometry, no. 171 in Chemical Analysis, Wiley-Interscience, Hoboken, 2nd edn., ISBN 978-0-471-19404-0, https://doi.org/10.1002/047010631x, 2007. a
Hobbs, P. C.: Building Electro-Optical Systems: Making It All Work., John Wiley & Sons, 2nd edn., https://doi.org/10.1002/9780470466339, 2009. a
Judd, J. W.: Volcanoes: What They Are and What They Teach, vol. 35, The International Scientific Series, D. Appleton and Company, New York, https://www.gutenberg.org/ebooks/67873 (last access: 23 September 2026), 1881. a
Kern, C., Werner, C., Elias, T., Sutton, A. J., and Lübcke, P.: Applying UV Cameras for SO2 Detection to Distant or Optically Thick Volcanic Plumes, J. Volcanol. Geoth. Res., 262, 80–89, https://doi.org/10.1016/j.jvolgeores.2013.06.009, 2013. a
Kern, C., Lübcke, P., Bobrowski, N., Campion, R., Mori, T., Smekens, J.-F., Stebel, K., Tamburello, G., Burton, M., Platt, U., and Prata, F.: Intercomparison of SO2 Camera Systems for Imaging Volcanic Gas Plumes, J. Volcanol. Geoth. Res., 300, 22–36, https://doi.org/10.1016/j.jvolgeores.2014.08.026, 2015. a
Knapp, M., Kleinschek, R., Vardag, S. N., Külheim, F., Haveresch, H., Sindram, M., Siegel, T., Burger, B., and Butz, A.: Quantitative imaging of carbon dioxide plumes using a ground-based shortwave infrared spectral camera, Atmos. Meas. Tech., 17, 2257–2275, https://doi.org/10.5194/amt-17-2257-2024, 2024. a
Love, S. P., Goff, F., Counce, D., Siebe, C., and Delgado, H.: Passive Infrared Spectroscopy of the Eruption Plume at Popocatépetl Volcano, Mexico, Nature, 396, 563–567, https://doi.org/10.1038/25109, 1998. a, b, c
Love, S. P., Goff, F., Schmidt, S. C., Counce, D., Pettit, D., Christenson, B. W., and Siebe, C.: Passive Infrared Spectroscopic Remote Sensing of Volcanic Gases: Ground-based Studies at White Island and Ruapehu, New Zealand, and Popocatépetl, Mexico, in: Geophysical Monograph Series, American Geophysical Union, 116, 117–138, https://doi.org/10.1029/GM116p0117, 2000. a
Löw, B. A., Kleinschek, R., Enders, V., Sander, S. P., Pongetti, T. J., Schmitt, T. D., Hase, F., Kostinek, J., and Butz, A.: A portable reflected-sunlight spectrometer for CO2 and CH4, Atmos. Meas. Tech., 16, 5125–5144, https://doi.org/10.5194/amt-16-5125-2023, 2023. a, b
Mori, T., Notsu, K., Tohjima, Y., and Wakita, H.: Remote Detection of HCl and SO2 in Volcanic Gas from Unzen Volcano, Japan, Geophys. Res. Lett., 20, 1355–1358, https://doi.org/10.1029/93GL01065, 1993. a
Murata, K. J.: Occurrence of CuCl Emission in Volcanic Flames, Am. J. Sci., 258, 769–772, https://doi.org/10.2475/ajs.258.10.769, 1960. a
Naughton, J. J., Derby, J. V., and Glover, R. B.: Infrared Measurements on Volcanic Gas and Fume: Kilauea Eruption, 1968, J. Geophys. Res., 74, 3273–3277, https://doi.org/10.1029/JB074i012p03273, 1969. a
Notsu, K., Mori, T., Igarashi, G., Tohjima, Y., and Wakita, H.: Infrared Spectral Radiometer: A New Tool for Remote Measurement of SO2 of Volcanic Gas, Geochem. J., 27, 361–366, https://doi.org/10.2343/geochemj.27.361, 1993. a
Oppenheimer, C., Francis, P., Burton, M., Maciejewski, A., and Boardman, L.: Remote Measurement of Volcanic Gases by Fourier Transform Infrared Spectroscopy, Appl. Phys. B, 67, 505–515, https://doi.org/10.1007/s003400050536, 1998. a
Platt, U., Bobrowski, N., and Butz, A.: Ground-Based Remote Sensing and Imaging of Volcanic Gases and Quantitative Determination of Multi-Species Emission Fluxes, Geosciences, 8, 44, https://doi.org/10.3390/geosciences8020044, 2018. a
Pyle, D. and Mather, T.: Halogens in Igneous Processes and Their Fluxes to the Atmosphere and Oceans from Volcanic Activity: A Review, Chem. Geol., 263, 110–121, https://doi.org/10.1016/j.chemgeo.2008.11.013, 2009. a
Scott, S., Pfeffer, M., Oppenheimer, C., Bali, E., Lamb, O. D., Barnie, T., Woods, A. W., Kjartansdóttir, R., and Stefánsson, A.: Near-Surface Magma Flow Instability Drives Cyclic Lava Fountaining at Fagradalsfjall, Iceland, Nat. Commun., 14, 6810, https://doi.org/10.1038/s41467-023-42569-9, 2023. a
Smekens, J.-F., Mather, T. A., Burton, M. R., Varnam, M., and Pfeffer, M. A.: Rapid Primary Sulfate Aerosol Generation Observed With OP-FTIR in the Eruptive Plume of the Fagradalsfjall Basaltic Eruption, Iceland, 2021, J. Geophys. Res.-Atmos., 129, e2023JD040574, https://doi.org/10.1029/2023JD040574, 2024. a
Verhoogen, J.: New Data on Volcanic Gases; the 1938 Eruption of Nyamlagira, Am. J. Sci., 237, 656–672, https://doi.org/10.2475/ajs.237.9.656, 1939. a
Werle, P., Mücke, R., and Slemr, F.: The Limits of Signal Averaging in Atmospheric Trace-Gas Monitoring by Tunable Diode-Laser Absorption Spectroscopy (TDLAS), Appl. Phys. B, 57, 131–139, https://doi.org/10.1007/BF00425997, 1993. a
Wilzewski, J. S., Roiger, A., Strandgren, J., Landgraf, J., Feist, D. G., Velazco, V. A., Deutscher, N. M., Morino, I., Ohyama, H., Té, Y., Kivi, R., Warneke, T., Notholt, J., Dubey, M., Sussmann, R., Rettinger, M., Hase, F., Shiomi, K., and Butz, A.: Spectral sizing of a coarse-spectral-resolution satellite sensor for XCO2, Atmos. Meas. Tech., 13, 731–745, https://doi.org/10.5194/amt-13-731-2020, 2020. a
- Abstract
- Introduction
- Measuring volcanic plumes using sky-scattered sunlight
- Instruments utilized in this study
- Prediction of measurement performance and limits
- Discussion and conclusion
- Appendix A
- Data availability
- Author contributions
- Competing interests
- Disclaimer
- Acknowledgements
- Review statement
- References
- Abstract
- Introduction
- Measuring volcanic plumes using sky-scattered sunlight
- Instruments utilized in this study
- Prediction of measurement performance and limits
- Discussion and conclusion
- Appendix A
- Data availability
- Author contributions
- Competing interests
- Disclaimer
- Acknowledgements
- Review statement
- References