
the Creative Commons Attribution 4.0 License.
the Creative Commons Attribution 4.0 License.
 | 05 Oct 2026
On-line analysis of N2O isotopic composition during biological nitrogen removal in wastewater treatment to disentangle production and reduction processes

Laurence Strubbe
Paul M. Magyar
Adriano Joss
Andreas Froemelt
André Kupferschmid
Klaus-Holger Knorr
Joachim Mohn
Nitrous oxide (N2O) is a potent greenhouse gas, and emissions from wastewater treatment plants (WWTPs) represent a significant and highly variable source. Understanding the dynamics in microbial pathways of N2O formation and reduction during biological nitrogen removal is essential for targeted mitigation strategies. Stable isotope analysis of N2O (δ15Nα, δ15Nβ, δ18O, and 15N site preference) provides a powerful tool to disentangle and quantify N2O production and reduction processes, yet conventional analytical approaches lack temporal resolution. Here, we present the first long-term application of an off-axis integrated cavity output spectrometer for real-time N2O isotopic analysis at a pilot-scale WWTP over one year of operation. We developed a dynamic dilution system and implemented correction protocols for drift, N2O mole fraction dependence, and gas matrix effects on isotopic results, achieving uncertainties of 0.8 ‰ (δ15Nα), 1.1 ‰ (δ15Nβ), 0.8 ‰ (δ15Nbulk), 0.5 ‰ (δ18O) and 1.1 ‰ (15N site preference). Representative datasets demonstrate the system's capability to (i) identify dominant N2O production pathways under standard WWTP operation, (ii) quantify N2O reduction in relation to dissolved oxygen concentration, and (iii) trace nitrogen transformation during low-level 15N-labelling experiments. Our results indicate nitrifier or heterotrophic denitrification as the main source of N2O, and that N2O reduction efficiency is strongly controlled by oxygen availability. This study highlights the potential of laser spectroscopy for continuous isotopic monitoring in real-world engineered systems and provides practical guidelines for uncertainty reduction and data interpretation. More specifically, our work forms a foundation for further investigations of the operational factors controlling N2O formation and N2O reduction in biological WWTPs and other complex anthropogenically-perturbed settings.
- Article
(3645 KB) - Full-text XML
- BibTeX
- EndNote


Nitrous oxide is one of the most important greenhouse gases in the atmosphere, with a 100-year global warming potential of 273 CO2 equivalents and a relative contribution to the total radiative forcing of about 6 % (IPCC, 2021). Anthropogenic activities enhance N2O emissions, outweighing stratospheric destruction and leading to an increase in atmospheric N2O mole fractions from 1750 to 2022 by about 25 % with an annual growth rate currently exceeding 1 ppb yr−1 (WMO, 2024). On a global scale the largest share of man-made emissions is attributed to the agricultural sector, followed by fossil fuel combustion and industrial processes (Tian et al., 2024). N2O emissions from wastewater treatment plants (WWTP) have long been underestimated, but long-term full-scale monitoring data have provided evidence for higher and more variable emission factors than had previously been assumed (Daelman et al., 2015; Gruber et al., 2021; Kosonen et al., 2016). As N2O emission monitoring is not part of normal operation control at WWTPs, countries and WWTP facilities still rely on using emission factors for their reporting. Emission factors for N2O from wastewater treatment were adjusted to 1.6 % of the total nitrogen load, as compared to a previously applied value as low as 0.035 % (EEA, 2017; IPCC, 2019). However, different emission factors are still implemented for reporting in European countries (EEA, 2023). Moreover, emissions were found to be related to plant operation (Gruber et al., 2021), and intermittency controlled by problematic situations, such as hampered microbial conversion or addition of supernatant from anaerobic digestion (Froemelt et al., 2025; Gruber et al., 2021). Applying a country-specific approach, Switzerland's National Greenhouse Gas Inventory reports wastewater treatment as the second largest source of N2O accounting for about 20 % of national N2O emissions, only topped by agriculture (BAFU, 2025). Consequently, the relevance of WWTPs as N2O emission point-sources and their controlled operation makes them attractive targets for N2O emission mitigation.
Nitrous oxide from WWTPs mainly originates from the biological nitrogen removal process (Kampschreur et al., 2009). In a conventional biological nitrogen removal process, N2O is primarily produced by three microbial pathways mediated by two bacterial groups. Bacterial ammonium oxidizers emit N2O during two processes, namely hydroxylamine oxidation (Hy) and nitrifier denitrification (nD). Hydroxylamine oxidation forms N2O as a side product during NH oxidation to NO. Nitrifier denitrification reduces NO to N2O with NH as the electron donor. The second bacterial group, the ordinary heterotrophic organisms, couple oxidation of organic substrates to reduction of NO, NO, NO, and N2O in heterotrophic denitrification (hD). During hD NO and N2O can be emitted as obligatory intermediates. However, hD can also act as a N2O sink process, reducing N2O to N2. The relative contributions and interactions of these pathways in a process workflow with variable control parameters and substrate availability remain poorly understood (Law et al., 2012). A comprehensive assessment of the active biological processes and their interplay is crucial for a targeted control and optimization of reactor and process design to minimize N2O emissions, while maintaining efficient nitrogen removal.
Analyzing the stable isotopic composition (15N 14N, 18O 16O) of the asymmetric N2O molecule has proven to be a powerful tool to disentangle N2O production pathways and to quantify the extent of N2O reduction to N2 in laboratory and full-scale WWTP settings (Gruber et al., 2022; Harris et al., 2015; Tumendelger et al., 2016; Wunderlin et al., 2013; Toyoda et al., 2011). The relative abundances of the rare N2O isotopologues 14N15N16O (15N in the central, α position), 15N14N16O (15N in the terminal, β position), and 14N14N18O, relative to the main isotopic species (14N14N16O) in a sample are expressed relative to standards (air-N2 for 15N 14N, VSMOW for 18O 16O) in the δ-notation (Camin et al., 2025; Toyoda and Yoshida, 1999). Transformations during metabolic pathways (i.e. Hy, hD and nD) are associated with kinetic or equilibrium fractionation processes and leave their imprint on the isotopic composition of the emitted N2O (Toyoda et al., 2015). An important characteristic of a N2O formation process is the difference in 15N substitution in the central and terminal position, named site preference (SP = δ15Nα − δ15Nβ), which is mainly controlled by the N–N bond formation (Toyoda et al., 2015). Data are often presented in a dual isotopic plot of SP versus δ18O or SP versus δ15Nbulk (δ15Nbulk = (δ15Nα + δ15Nβ) 2) and compared to isotopic signatures retrieved from pure culture studies to aid the identification of N2O source processes (Yu et al., 2020). Furthermore, during N2O reduction to N2 by hD, N2O molecules in which 14N is bound to 16O are preferentially reduced, leading to an enhancement in δ15Nbulk, SP, and δ18O in the remaining N2O pool (Lewicka-Szczebak et al., 2017; Ostrom et al., 2007). This observation can be exploited to calculate the residual, non-reduced fraction of N2O (), if the isotopic signature of the initial unaffected N2O pool for either δ15Nbulk, SP, or δ18O (i.e. δ0) is known and the corresponding composition of the remaining N2O fraction (δR) is measured (Lewicka-Szczebak et al., 2017; Mariotti et al., 1981; Ostrom et al., 2007):
This calculation utilizes literature estimates for ϵ, the enrichment factor for N2O reduction, here defined so that a negative value corresponds to a mass-dependent isotope effect, i.e. the light isotope reacts faster than the heavier one (Yu et al., 2020; Ostrom et al. 2007). The fraction of reduced N2O, i.e. the fraction of formed N2 (), can be calculated by .
To date, however, most N2O isotope studies, whether using natural isotopic abundance or 15N or 18O-labelling, have quantified N2O reduction using bag sampling and subsequent laboratory analysis, which is labour intensive and offers only limited temporal resolution, incapable of tracing process changes at timescales relevant for WWTPs that exhibit strong daily as well as seasonal dynamics (Domingo-Félez et al., 2024; Gruber et al., 2020).
Laser absorption spectroscopy offers the potential for continuous data on the isotopic composition of greenhouse gases, but apparent δ-values are dependent on the composition of the analyte gas and need correction schemes to produce accurate data (e.g. Sperlich et al., 2024). The fundamental reasoning behind these phenomena is the difference in pressure broadening caused by different bulk gases (e.g. N2, O2, Ar) and spectral interferences by non-target gaseous species with absorptions in the analysed spectral range. Furthermore, changes in analyte gas concentration can lead to inaccurate apparent δ-values due to detector non-linearities, residual baseline effects or other phenomena. It is therefore good practice to apply isotopic reference gases, which mimic the composition of the sample in target gas concentration, matrix composition and relevant trace gases. In this respect, process studies with strong changes in gas composition pose an inevitable challenge, as the reference gas can only be adapted to the most relevant or average sample gas composition, while residual variability has to be monitored and δ-values post-corrected, if changes pass a critical threshold. In recent years, different optical detection schemes, such as direct absorption spectroscopy, cavity ring-down spectroscopy and off-axis integrated cavity output spectroscopy (OA-ICOS) have been implemented for analysis of N2O isotopic composition (e.g. Harris et al., 2020). Analyser models from different manufacturers, including the OA-ICOS spectrometer model applied here, have been tested under laboratory settings (Harris et al., 2020) and the mathematical formalism for data processing has been implemented and validated (Havsteen et al., 2026). However, until now, very few long-term applications of laser spectroscopy for N2O isotope analysis under field conditions have been realized.
Here, we implemented and tested a laser spectroscopic platform capable of real-time analysis of N2O mole fractions and isotopic composition. We demonstrate the first on-line measurements during aeration phases at a pilot-scale WWTP over one year of operation to illustrate its potential for process identification. More specifically, we present three representative data sets: the first originates from periods of standard reactor operation that will help us distinguishing between the N2O production pathways of Hy and denitrification (nD and hD); the second aims at exploring the influence O2 availability on the N2O reduction dynamics; and the third to demonstrate the systems potential for N2O isotope analysis in low-level 15N labelling studies. We provide practical recommendation on how to reduce contributions to uncertainty in δ-values from variable gas composition and give guidelines on data analysis and uncertainty assessment.
2.1 Laser spectroscopic platform
An OA-ICOS (N2OIA-30e-EP, model 914-0027, serial number: 14-0283, ABB – Los Gatos Research Inc., USA) was used to analyse the abundance of gaseous N2O and its isotopic composition (δ15Nα, δ15Nβ, δ18O). The analyser uses a quantum cascade laser emitting at 2192.1–2192.5 cm−1, which covers the target species but also spectral lines of CO2 and CH4 (Harris et al., 2020). The analyser has a built-in sample pump which maintains the target pressure in the cavity (60.12 hPa) and a sample gas flow of about 200 mL min−1. The analyser software displays the absorption signal and provides N2O mole fractions and δ-values in real-time at maximum temporal resolution of one spectrum per second. Further information on the analytical platform is described in Baer et al. (2002).
2.2 Identify optimal measurement conditions for wastewater treatment
In this study we target real-time data analysis using a practical instrumental approach, which can be implemented at WWTPs. Analysing N2O from the undiluted source process for source attribution, we aim at a maximum uncertainty of 1 ‰ for δ15Nα, δ15Nβ, δ15Nbulk, δ18O and SP for final corrected δ-values. In the following sections, optimal averaging times, drift correction and calibration approaches, as well as uncertainty contributions from variable gas composition are evaluated. We followed the mathematical formalism and adapted the MATLAB algorithm provided by Havsteen et al. (2026).
2.2.1 Allan precision
In an initial test phase, important characteristics of the analyser performance were determined in accordance with Harris et al. (2020) to define a strategy for real-time measurements at WWTPs. Optimal averaging times to reach adequate precision levels (i.e. 0.2 ‰) and drift effects were determined using the Allan variance technique (Allan, 1966; Werle et al., 1993). For this, a gas mixture with known N2O isotopic composition (Cal1, see Table 1) was dynamically diluted with N2O-free synthetic air (SA) to a mole fraction of 12 ppm N2O and a total flow of 300 mL min−1 and measurements were recorded for more than 3.5 d. The Allan precision for δ-values for 5 and 10 min integration time were 0.08 ‰–0.09 ‰ and 0.06 ‰–0.07 ‰, respectively (Fig. 1). Instrumental drifts over 24 h periods were estimated on basis of the Allan analysis and accounted for 0.26 ‰, 0.36 ‰, 0.05 ‰, 0.40 ‰, and 0.85 ‰ for δ15Nα, δ15Nβ, δ15Nbulk, δ18O, and SP, respectively.
Table 1N2O mole fractions, isotopic composition and gas matrix of the calibration gases (Cal1, Cal2), the target gas and the synthetic air (SA) used in this study.
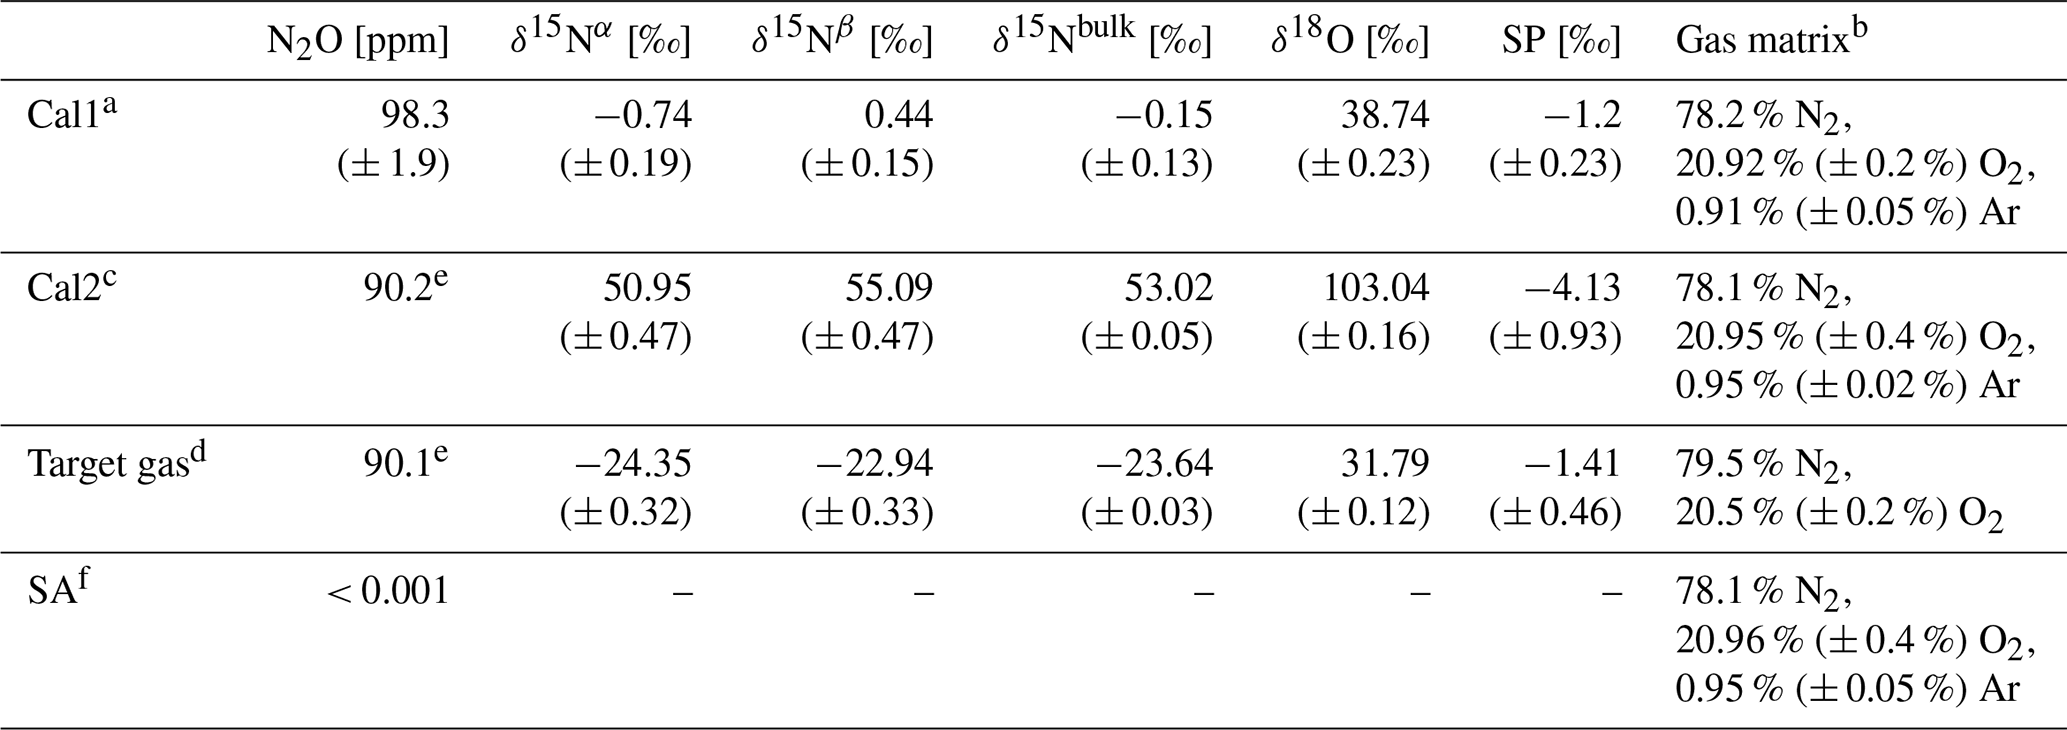
a Commercial gas mixture, procured from Linde Gas AG (Switzerland), isotopic composition analysed by Empa (Heil et al., 2014). The precision indicated is the standard deviation for replicate sample measurements and does not include the uncertainties of the calibration chain. b Manufacturer's specifications. c Empa cylinder D689516; N2O isotopic composition of pure N2O gas reported in Mohn et al. (2022); the gas matrix contains additional trace gases: 400 (± 8) ppm CO2, 2 (± 0.2) ppm CH4, 200 (± 40) ppb CO (manufacturer's specifications). Differences in gas matrix composition, i.e. presence of trace gases (CO2, CH4, CO) in Cal2, given the applied strong dilution with high purity SA are not expected to affect analytical results (see Harris et al., 2020). d Empa cylinder CA06266; N2O isotopic composition analysed by IRMS by Sakae Toyoda at Science Tokyo. The precision indicated is the standard deviation for replicate sample measurements and does not include the uncertainties of the calibration chain. e N2O mole fractions estimated from N2O and SA volume used for production. f Carbagas AG, Switzerland.
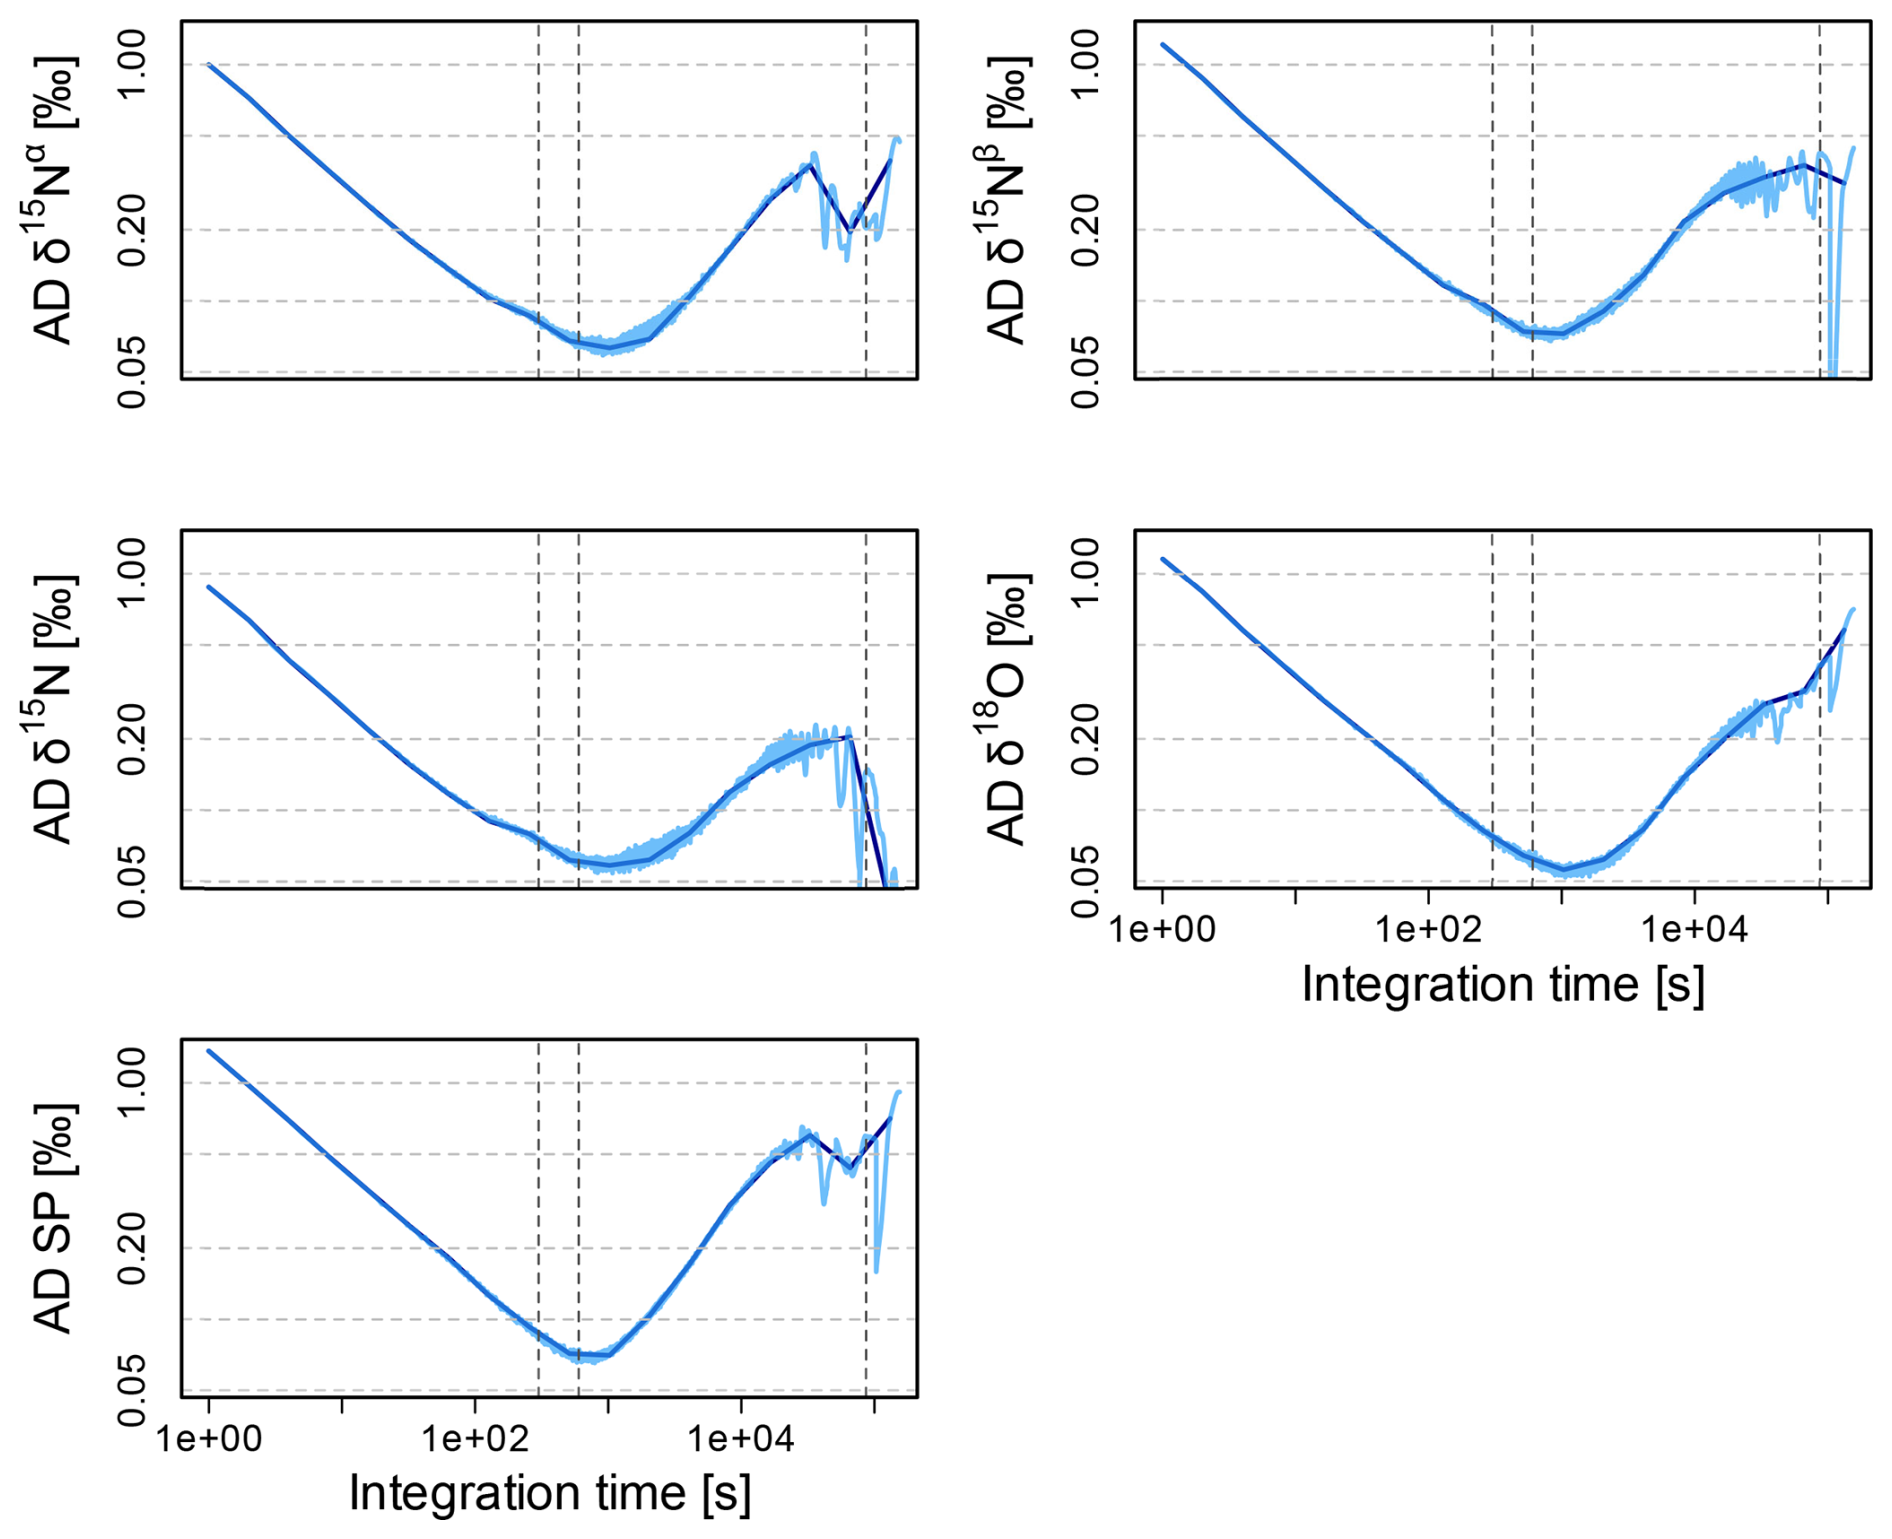
Figure 1Allan deviations (AD), i.e. precision as function of integration time for δ15Nα, δ15Nβ, δ15Nbulk, δ18O, and SP measured by an OA-ICOS analyser at 12 ppm N2O. Dashed vertical lines are placed at 5 and 10 min and at 24 h integration time.
2.2.2 Calibration procedure, drift correction and target gas measurements
From every 8 to 10 min measurement interval the first three to 5 min were discarded to assure complete exchange of the analyte gas and only the last 5 min were averaged before further data processing. To reduce drift effects and enable offset correction, every analyte gas measurement was bracketed by a calibration gas (Cal1, Table 1) measurement. A second calibration gas (Cal2, Table 1) was measured before and after each experiment or every 8 h during continuous measurements for two-point δ-calibration.
We acknowledge that δ-values of Cal1 and Cal2 do not cover most of the measurement range relevant for WWTP. The accuracy of measurement results, however, was assessed using target gas measurements (Table 1), at an isotopic composition typical for the WWTP application performed in four experiments distributed over the complete measurement period (24 September 2024, 30 and 31 January 2025, 11 September 2025). Each measurement block consisted of four 10 min analyses of the target gas and was performed in an identical manner as any experimental measurements, i.e. with two-point calibration before and after each target gas measurement block and bracketed with Cal1 measurements. Average results were −25.51 ± 0.3 ‰, −23.35 ± 0.9 ‰, −24.43 ± 0.5 ‰, 31.22 ± 0.2 ‰ and −2.15 ± 0.9 ‰ for δ15Nα, δ15Nβ, δ15Nbulk, δ18O and SP, respectively. Consequently, OA-ICOS results were systematically (0.4 ‰ to 1.2 ‰) lower than δ-values reported by IRMS (Table 1). This discrepancy is higher than differences observed in past inter-laboratory comparisons between Empa and Science Tokyo (Mohn et al., 2014; Ostrom et al, 2018) was not further addressed as it is within the uncertainty targets of our study. It might be rationalized by the absence of Ar in the target gas tank, which was shown to lead to lower apparent δ-values for OA-ICOS (Harris et al., 2020) or a potential uncertainty introduced by extrapolating calibration scales.
2.2.3 Nitrous oxide mole fraction dependence
The analyser's dependence of reported δ-values on variations in N2O mole fraction was assessed by dynamic dilution of a reference gas (Cal1) with N2O free dilution air to a sequence of N2O mole fractions ranging from 0.5 to 90 ppm. Gas mixtures were prepared at a flow rate of 300 mL min−1 and measurements recoded for 10 min per mole fraction step. To account for analyser drift, in-between every mole fraction step the Cal1 gas was diluted to 12 ppm and measured as a reference point. This experiment was repeated three times on different days prior to the measurement period at the pilot reactors and once after the measurement period of 12 months. This enabled us to assess the analyser-specific variation in N2O mole fraction dependence in the short and long term.
Figure 2 displays apparent δ-values for Cal1 measured between 0.5 and 90 ppm N2O. In accordance with earlier work (Harris et al., 2020) the mole fraction dependence (e.g. Δδ15Nbulk per Δ[N2O]) showed largest nominal values towards low, i.e. ambient, mole fractions and less pronounced above 6 ppm N2O. Only in a mole fraction range from 8 to 20 ppm N2O could reported δ15Nα and δ15Nβ values be described by a quadratic function. For δ18O the mole fraction range for which a quadratic correction function applies was even smaller, 8 to 16 ppm N2O. Like (Plouviez et al., 2026), we observed significant temporal changes in the N2O non-linearity over time, necessitating a dynamic dilution as well as corrections for the non-linear mole fraction dependence (see Sect. 2.4.1).
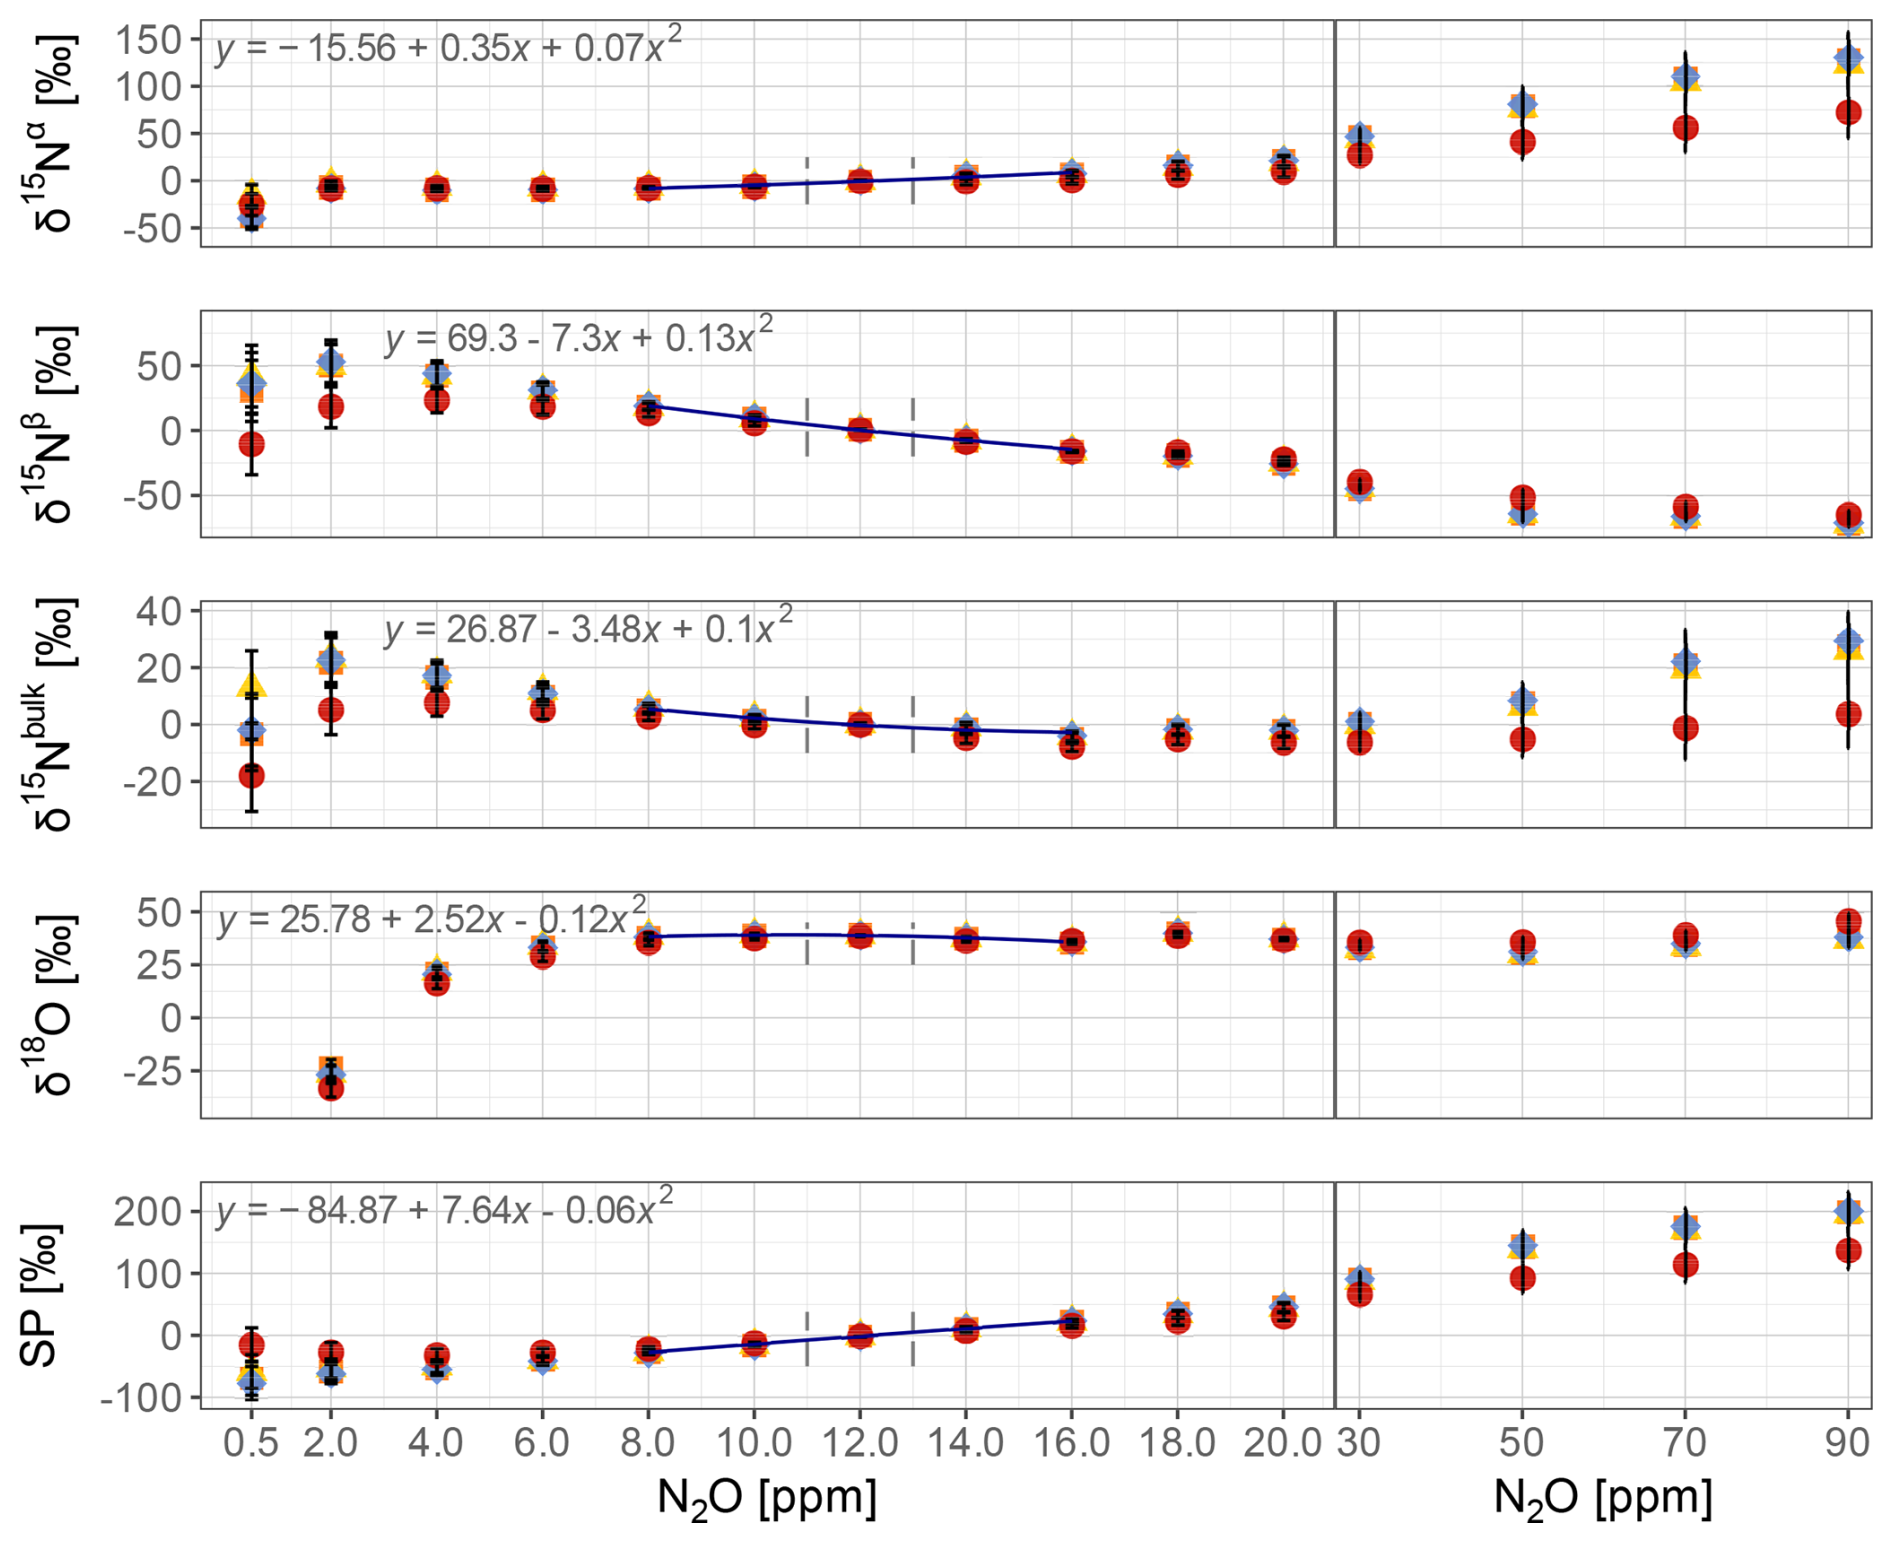
Figure 2N2O mole fraction dependence of apparent δ-values, δ15Nα, δ15Nβ, δ15Nbulk, δ18O, and SP, for N2O mole fractions ranging from 0.5 to 90 ppm as reported by the OA-ICOS analyser. The dotted lines indicate the range over which N2O mole fraction corrections were performed (11 to 13 ppm N2O). Note that for visual purposes the δ18O values for the lowest mole fraction were removed from the plot (mean −371.1 ± 80.1 ‰).
2.2.4 Gas matrix effects of oxygen
In nitrifying zones of WWTPs, ambient air is injected to oxidize NH to NO and NO as well as organic matter to CO2. Consequently, O2 mole fraction in the off-gas are at sub-ambient levels and the volumetric content of persistent gas components such as N2 and Ar is enhanced since any produced CO2 is removed prior to analysis (see Sect. 2.3.1 for details). We therefore tested the dependence of reported N2O mole fraction and δ-values on O2 mole fractions in the gas matrix. For this Cal1 was dynamically mixed with N2O free SA, and high purity N2 (99.999 %, Linde Gas AG, Switzerland) to incrementally vary the O2 mole fraction in the analyte gas from 4 % to 20.95 %, while N2O mole fractions were held constant at 12 ppm. As N2 did not contain Ar, in parallel with a decrease in O2 by e.g. 16 % Ar dropped by 0.7 %. Earlier studies (Harris et al., 2020) indicate that the gas matrix effect attributed to O2 for an OA-ICOS analyser as tested here might therefore be overestimated by around 10 %, and our uncertainty estimates (Sect. 2.5.2) are rather conservative. Gas mixtures were prepared at a flow rate of 300 mL min−1, and each sample was analysed for 10 min. To account for any analyser drift, in between every O2 mole fraction step, the Cal1 gas was measured at ambient O2 mole fractions (20.95 % O2). The O2 mole fraction dependence of apparent δ-values was linear over the entire range of O2mole fractions (4 % to 20.95 % O2; Fig. 3), with values of 1.45 ‰, 1.57 ‰, 1.51 ‰, 1.76 ‰, and −0.12 ‰ [% O2]−1 for δ15Nα, δ15Nβ, δ15Nbulk, δ18O, and SP, respectively. Oxygen mole fractions in the reactors' off-gas ranged from 19.8 % to 20.95 % over the entire 1-year experimental period (O2 mole fractions were measured using a PG-350E, Horiba, Japan). The average O2 mole fraction in the actual analyte gas is somewhat higher at 20.6 % (± 0.2 %) as the off-gas is diluted with high-purity SA (see above) to set the N2O mole fraction to 12 ppm. To account for a systematic reduction in O2 mole fractions by 0.35 %, δ15Nα, δ15Nβ, δ15Nbulk, δ18O, and SP values were corrected for 0.56 ‰, 0.53 ‰, 0.55 ‰, 0.83 ‰, and 0.04 ‰, respectively by using the linear models in Fig. 3. The variability in O2 mole fractions was considered in the uncertainty budget.
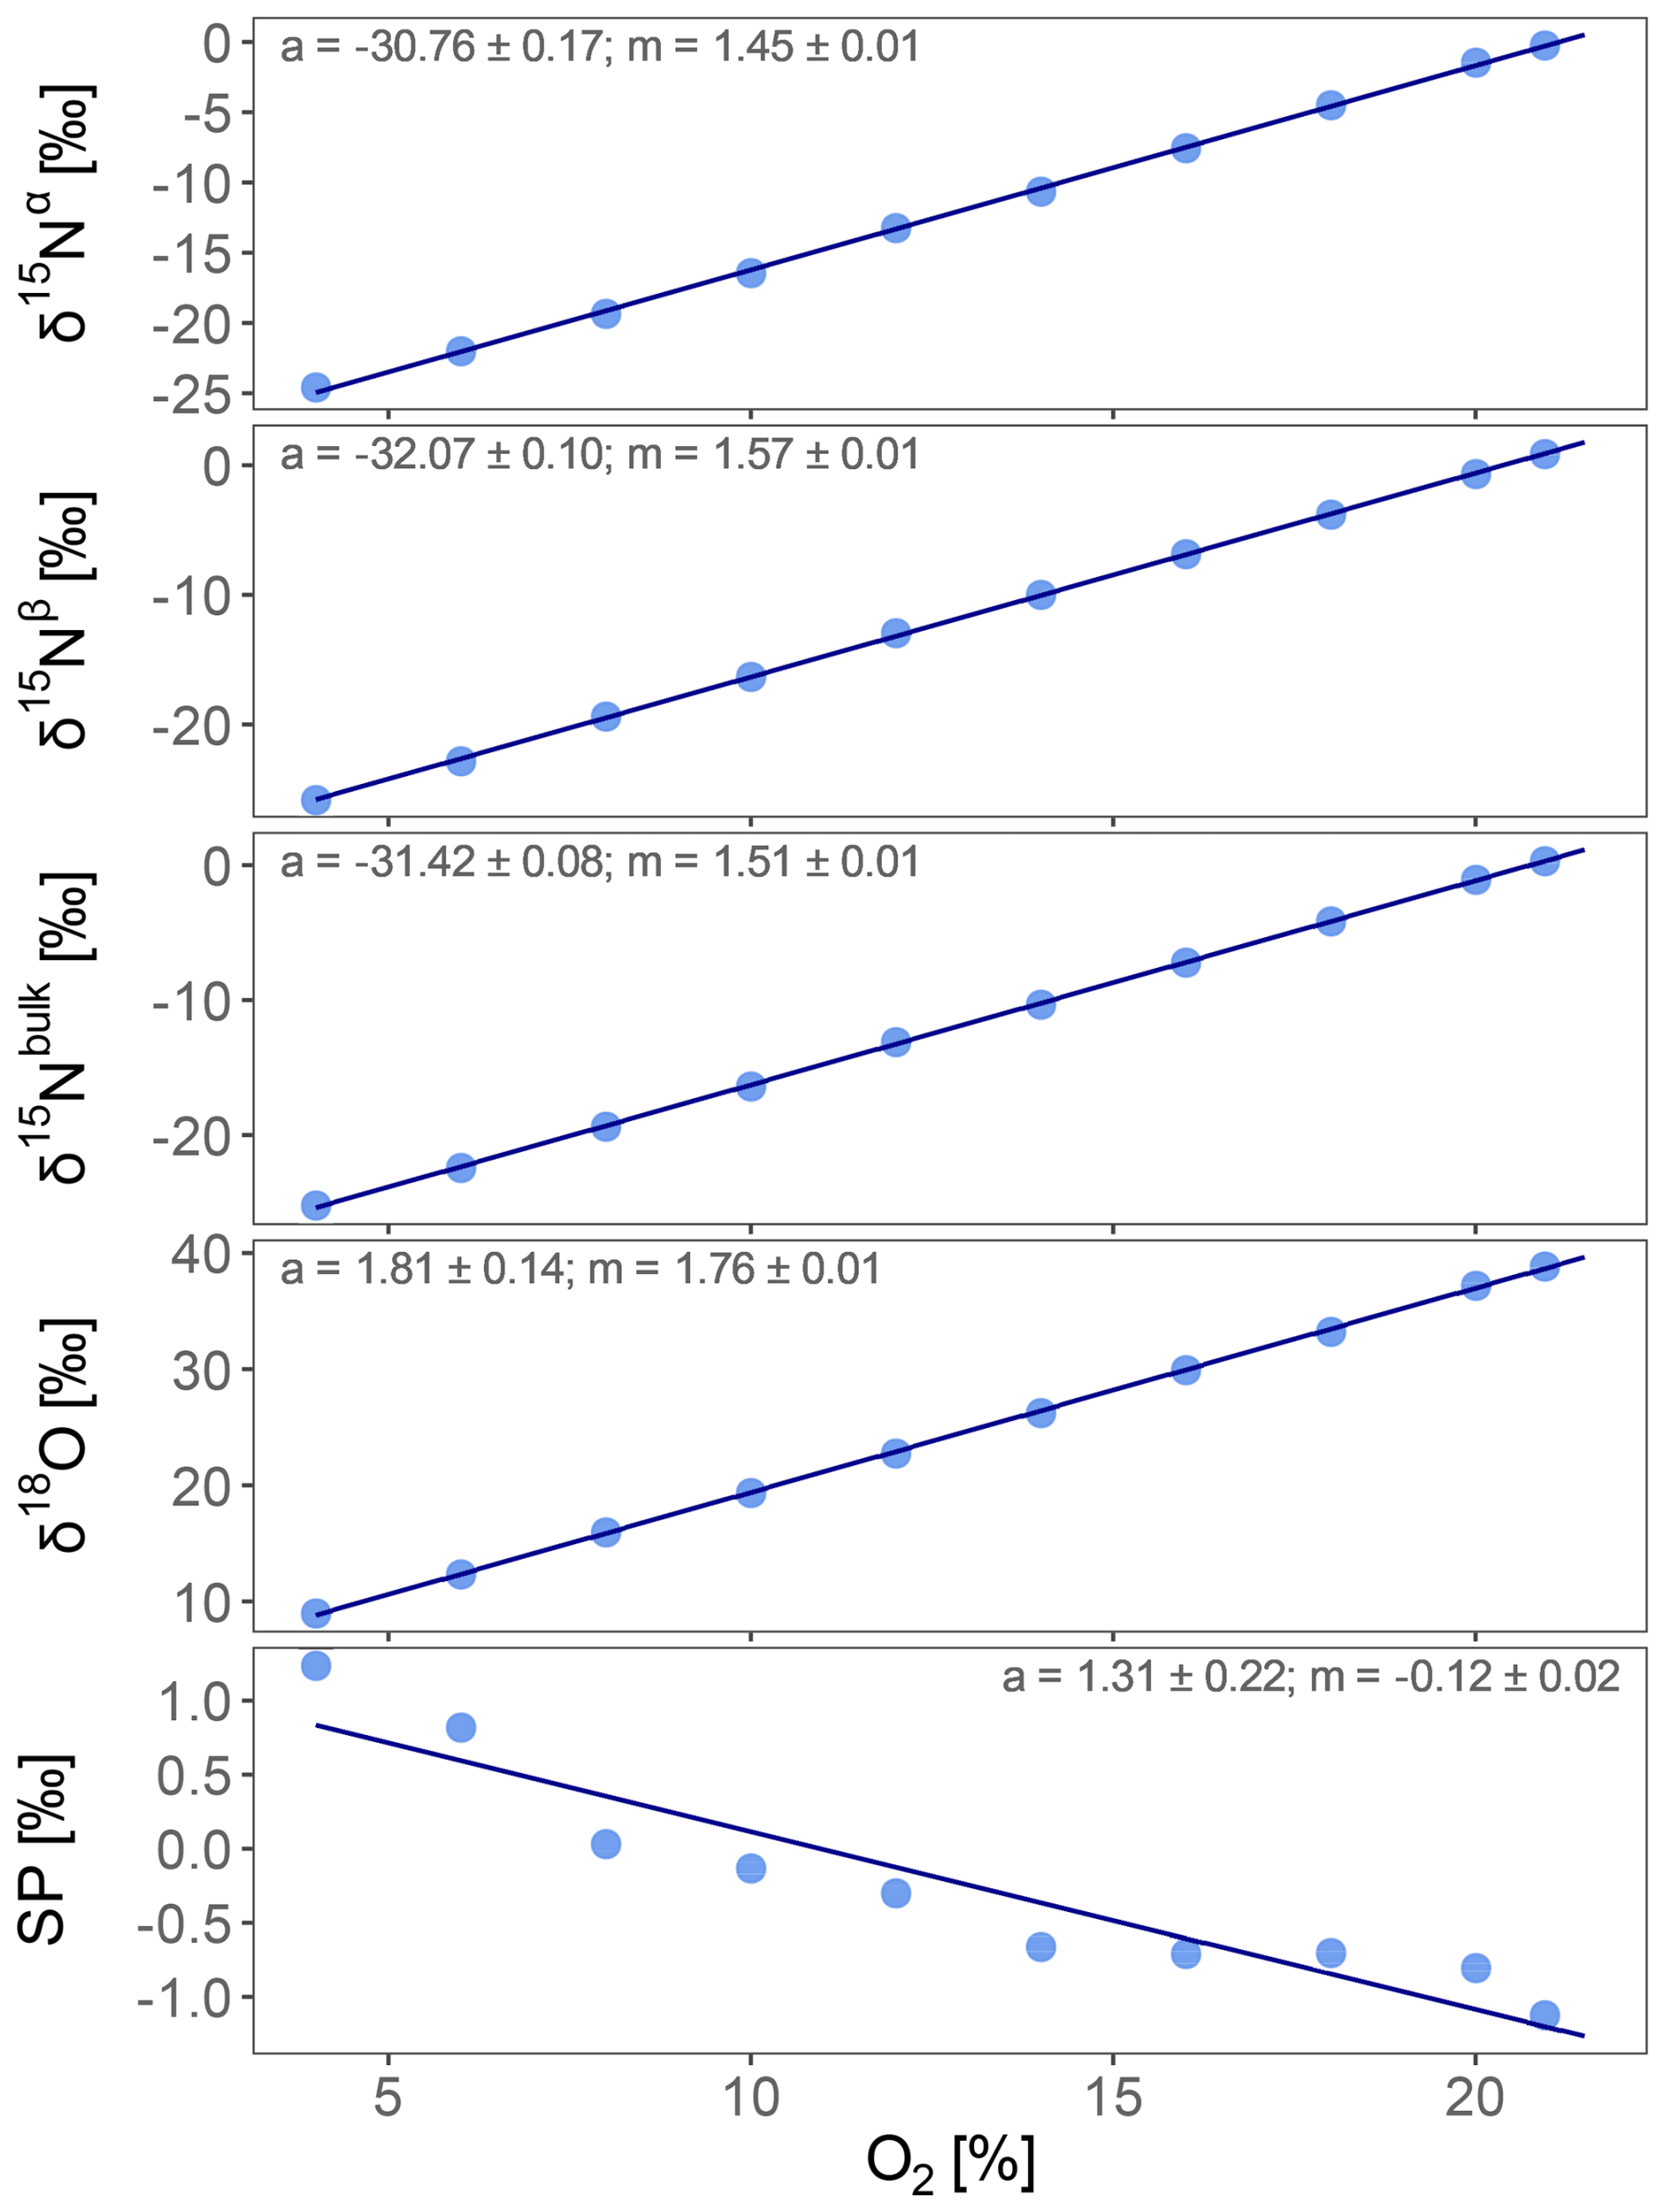
Figure 3Oxygen mole fraction dependence of apparent δ-values, δ15Nα, δ15Nβ, δ15Nbulk, δ18O, and SP in N2O, for O2 mole fractions in the gas matrix ranging from 4 % to 20.95 %. Intercept (a) and slope (m) with corresponding standard errors. Presented O2 gas matrix effects are conservative, i.e. overestimated, due to a parallel decrease in Ar mole fractions (0.5 % Ar per 10 % O2).
2.3 Implementing real-time nitrous oxide isotope analysis at a wastewater treatment plant
Dynamic dilution system
As the apparent δ-values reported by the OA-ICOS analyser are subject to a strong, time-variant N2O mole fraction dependence, as discussed in Sect. 2.2.3, we decided to implement a dynamic dilution system (Fig. 4) using N2O-free SA (N2O < 1 ppb) as dilutant to limit uncertainty contributions from N2O non-linearity corrections. The target mole fraction of the dilution system was set to 12 ppm N2O and data with N2O mole fractions outside the range of 11 to 13 ppm were discarded (53 % of data). Data passing this criterion were corrected for non-linearity using average correction functions (Fig. 2). The target N2O mole fraction (12 ppm) represents a compromise for analyser sensitivity and non-linearity, which both degrade data quality at low N2O concentrations and temporal coverage, i.e. sufficiently low N2O target concentration to cover relevant emissions.
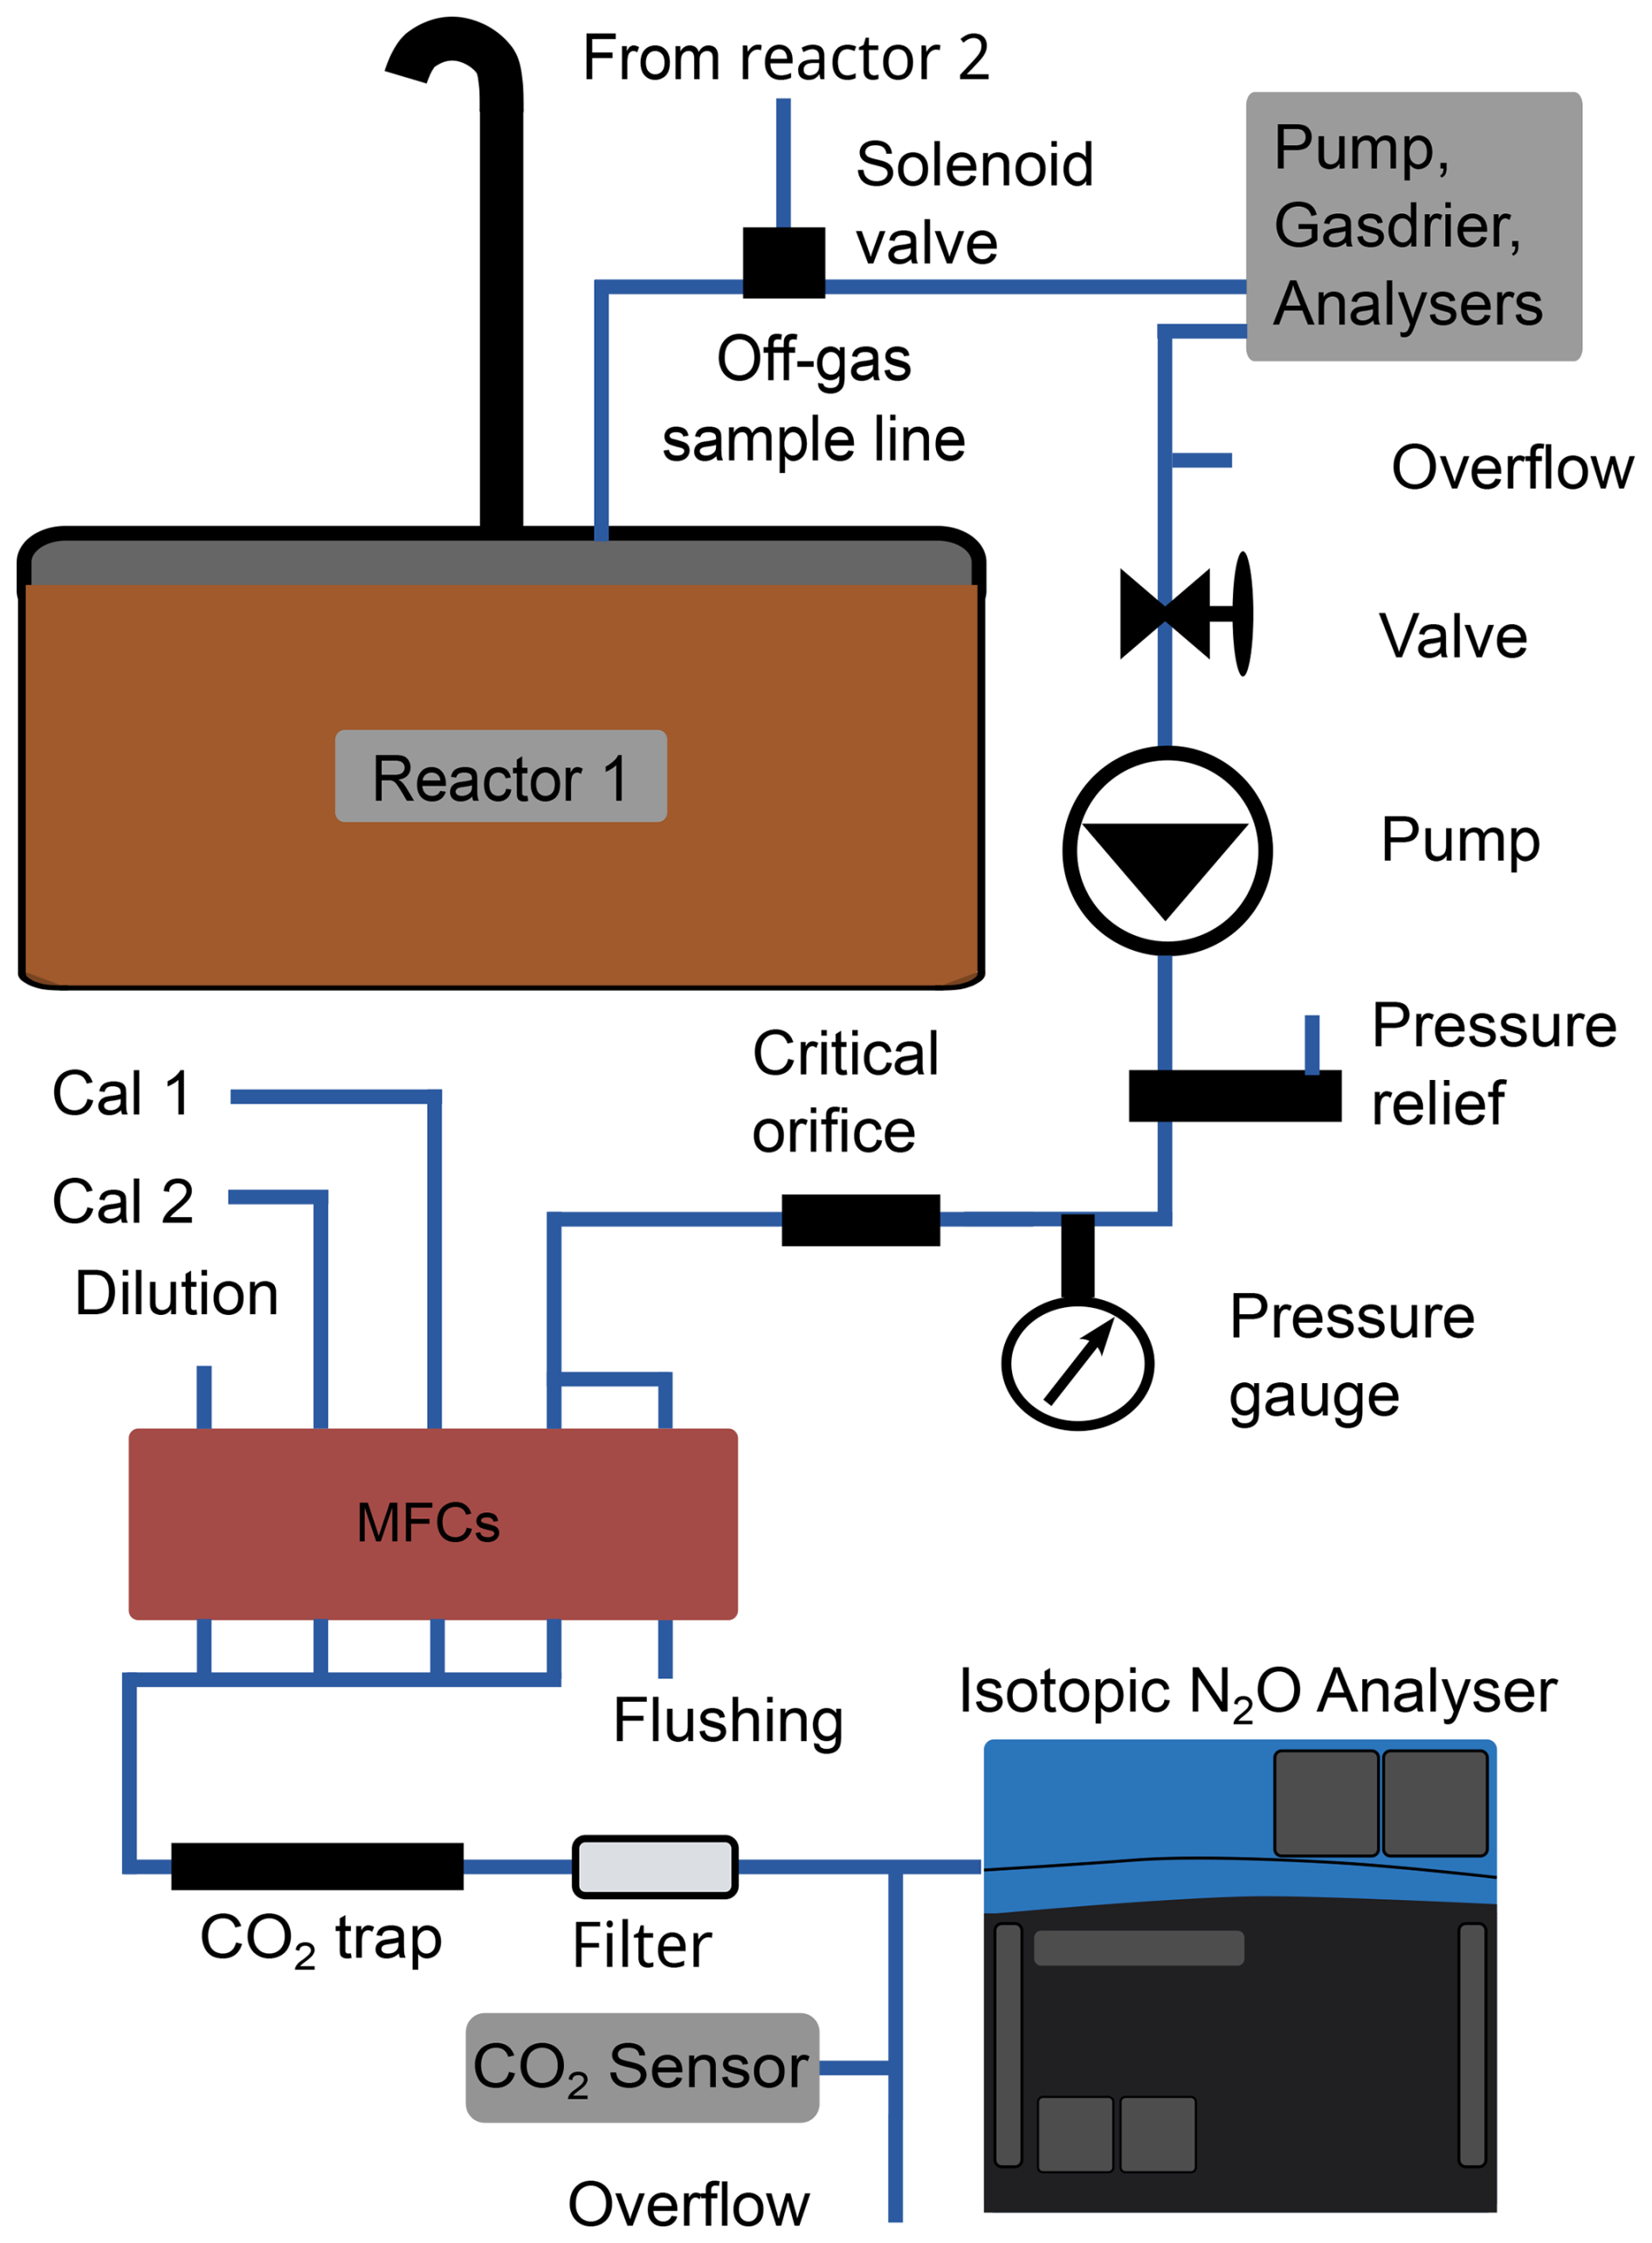
Figure 4Scheme of the experimental set-up applied for alternate sampling the off-gas of two wastewater treatment reactors and real time analysis of N2O mole fraction and isotopic composition using an OA-ICOS spectrometer. The analyte gas treatment includes sequential dehumidification, dilution using MFCs (mass flow controllers), CO2 removal and particle filtering. The CO2 sensor is implemented to monitor quantitative CO2 removal and thus the absence of CO2 spectral interferences.
The custom-built dilution system consisted of five mass flow controllers (MFC; Vögtlin Instruments GmbH, Switzerland), automated by a customized LabView programme (National Instruments, USA). Four MFCs were used to control flows of the analyte gas, Cal1, Cal2 and N2O-free SA to dilute the analyte gas to the target N2O mole fraction. One additional MFC set to 400 mL min−1 was used to maintain a constant flow of analyte gas during Cal1 and Cal2 measurements to reduce lag times during subsequent analyte gas measurements (Fig. 4). The dilution ratio and MFC flow rates were calculated based on a 20 s running average of the actual N2O mole fraction in the off-gas of the reactor provided by a NDIR analyser (X-STREAM X2XF, Rosemount Emerson, USA). The analyte gas was provided to the regulating MFC at 2.5 bar overpressure using a membrane pump (N86, KNF Holding AG, Switzerland). The intake of the pump was controlled with a needle valve, while the overpressure downstream of the membrane pump was monitored and manually adjusted with a pressure relief valve. To maintain stable operation of the MFC a critical orifice (bore diameter 150 µm) was installed in between membrane pump and MFC dampening pressure oscillations. The analyte gas was dehumidified by permeation drying (MD-070, Perma Pure, USA), CO2 removed by absorption (Ascarite, mesh size 20–30; Sigma Aldrich, USA) and particles retained using an in-line sintered metal filter (pore size 2 µm; Swagelok, USA). Part of the analyte gas was supplied to the OA-ICOS spectrometer (about 200 mL min−1), and the remainder (about 200 mL min−1) exhausted to ambient air passing a NDIR CO2 sensor (Sensair HPP, Sweden), to detect breakthrough of the CO2 trap.
2.4 Experiments at a pilot-scale wastewater treatment plant
Real-time analysis of N2O mole fraction and isotope δ-values was performed at two pilot-scale wastewater treatment reactors (volume per reactor: 8 m3) operated by Eawag in Dübendorf, Switzerland. The reactors were fed with local municipal wastewater taken directly from the sewer and were run as sequencing batch reactors in parallel. Each cycle consisted of an anoxic feeding phase, an aeration phase with duration controlled by NH concentration, a settling phase, and a discharge period with 25 % to 55 % volume exchange. After each cycle, the remaining sludge of both reactors was mixed to ensure a comparable microbiome between the two reactors (Strubbe et al., 2026). To distinguish between N2O production pathways, we analysed the N2O isotopic composition in the reactors' off-gas. During aeration periods the air volume in the reactors head space was constantly replaced by the aeration gas bubbling through the reactors liquid phase (Fig. 4). A subsample of the off-gas was constantly drawn from the emission duct to the analytic equipment and analysed for isotopic signatures. Only data from the aeration phases were used for further analysis. As O2 exchange between nitrogenous oxides and H2O can occur in abiotic systems but also mediated by microbes (Kool et al., 2007), the δ18O of N2O partly reflects the δ18O of the dissolution water. This dependency was considered by subtracting the δ18O signature of the local tap water (δ18O (H2O) = −11.2 ‰) from the δ18O of N2O before further interpretation. Experiments were conducted over a period of 12 months with 998 h of measurement time. While this study focuses on performance and usability of the described analytical setup and corresponding methodological aspects based on a selection of representative data sets, follow up manuscripts will address more specific wastewater treatment related research questions in detail (e.g. Strubbe et al., 2026).
The following representative datasets were obtained under three different experimental conditions and are used to demonstrate the usability and applicability of our analytical setup:
-
Experiment 1: To determine the predominant N2O biological production pathway, we analysed the N2O isotopic composition over four months (September to December 2024) under standard WWTP operation, i.e. at a dissolved O2 (DO) concentration setpoint of 2 mg L−1 (± 0.5 mg L−1) and without N-substrate additions.
-
Experiment 2: To assess the usability of our on-line isotopic measurement setup in capturing relevant process dynamics, we designed experiments in which the DO concentration was varied between reactors while all other parameters remained constant. This allowed us to investigate effects of different DO concentrations on microbial pathways and N2O reduction. In short, we ran one reactor at a DO concentration of 2 mg L−1, while the second was run at a DO concentration of 0.5 mg L−1. At the start of the aeration phase, each reactor received 118 g NaNO2 (targeting 3 mg N L−1 in the reactor) to stimulate N2O production. Beforehand, the δ18O-NO of the NaNO2 solutions was set by equilibrating (74 h at 40 °C, 74 h at reactor temperature) with the local tap water (δ18O (H2O) = −11.2 ‰).
-
Experiment 3: As a third application of our on-line isotopic measurement setup, we investigated its usability for low-level 15N-labelling, a novel methodology that uses the addition of small amounts of labelled substrate to increase δ-values to a level above natural abundance but low enough to still allows the use of natural abundant fractionation factors as well as standard isotopic measurement methods (Deb et al., 2025). This method is very valuable to investigate N-transformation processes and nD and hD activity during different operational conditions of WWTPs. We therefore performed a low-level 15N-labelling experiment in one of the two reactors. In short, the following procedure was applied: At the beginning of the aeration phase the reactor was depleted of NH, by setting the DO concentration to 6 mg L−1 until the NH concentration was below detection limit of the NH sensor (COS61, ISEmax CAS40, Endress+Hauser, Switzerland). Then, the DO concentration setpoint was reduced to 4 mg L−1, and the NO concentration increased to 10 mg N L−1 by adding NaNO3. Additionally, NH concentrations were increased to 10 mg N L−1 by adding 15N-labelled NH, to set δ15N in the reactor to approx. 100 ‰. The duration of the aeration phase was manually set to 3 h, during which the N2O isotopic composition was monitored. During the subsequent cycle, i.e. after an exchange of 60 % of the reactor content with fresh municipal wastewater, the DO setpoint was reduced to 2 mg L−1 and no substrates were added. Again, the isotopic composition was analysed during the aeration phase.
2.5 Data processing
Data processing was performed using a MATLAB script adapted from Havsteen et al. (2026) (MATLAB version R2022b Update 3). This script was used to import spectrometer data as well as combine measurement data with labels of the analyte gas identity (reactor 1/2, Cal1, Cal2). Analyte labels provide start/end times for each measurement interval. The last 5 min of each interval, when mole fractions and δ-values reached a plateau were used to calculate average N2O mole fractions ([N2O]S,Av), δ-values, and their standard deviations. For further data quality assurance, any averaged δ-values with a standard deviation > 5 ‰ were disregarded from further data processing (4.1 % of total data). To correct for N2O mole fraction dependence, and for data visualization RStudio (2025.05.1, R version 4.5.1; R Core Team, 2025) and the packages ggplot2 and datatable were used (Barrett et al., 2025; Wickham, 2016).
The raw sample δ-values provided by the analyser () were corrected for drift (ΔδDrift), N2O mole fraction dependence () and the dependence of apparent δ-values on the O2 mole fraction ():
Since CO2 was systematically removed prior to analysis, no correction for CO2 spectral interferences relevant for the applied OA-ICOS analyser (Harris et al., 2020) was implemented. Analyser drift was monitored and corrected by regular analysis of reference gas Cal1 (Havsteen et al., 2026). For each sample interval at time tS, the drift-related offset was determined by subtracting the overall mean based on all Cal1 intervals recorded during an experiment () from the linear interpolation of δ-values of the two nearest bracketing Cal1 intervals ( and ) during time and :
The N2O mole fraction dependence of δ-values was corrected using quadratic correction functions (Fig. 2):
where b and c represent fitting parameters of the quadratic correction function and [N2O]S the observed N2O mole fraction of the sample and [N2O]Cal1 the true mole fraction of the Cal1 gas.
With respect to the O2 mole fraction correction of δ-values an offset correction to average O2 mole fractions in the analyte gas (20.6 % O2) was applied over the entire measurement period, instead of a correcting for actual O2 mole fraction values (Fig. 3):
where represents the slope of the respective linear correction function and [O2]S,avg, [O2]Cal1 are the average O2 mole fraction of the analyte gas and Cal1.
Corrected δ-values were calibrated as follows:
where and represent the “true” δ-values of the applied reference gases.
2.5.1 Fraction of reduced nitrous oxide
Based on the isotopic signatures, the fraction of residual, non-reduced N2O () for each measurement (δi) was estimated quantitatively by reformulating Eq. (1) to:
where δR is the isotopic signature (SP) of the residual N2O fraction, δ0 represents the SP end-member value of the initial N2O, i.e. N2O not yet affected by reduction, and ϵ is the enrichment factor for SP (i.e. ϵ −5.9 ‰; Yu et al., 2020).
As relevant δ0 values for SP reported in literature span from −7.5 ‰ to 1.9 ‰ (hD: −7.5 ‰ to 3.7 ‰; nD: −13.6 ‰ to 1.9 ‰; Yu et al. 2020), we estimated our system specific δ0 value based on our dataset. First, it was ensured that the SP-δ18O regression slope fell within the expected range reported in literature (0.23 to 0.98; Yu et al. 2020), then the value of δ0 was estimated for SP by ranking observations according to the sum of their δ18O and SP values of which we retained the five lowest-ranked points. Further, the perpendicular distance of each of the lowest-ranked observations in the SP and δ18O space to the regression line was calculated and the observations with the smallest distance selected. The corresponding SP value was defined as δ0 (Fig. 5).
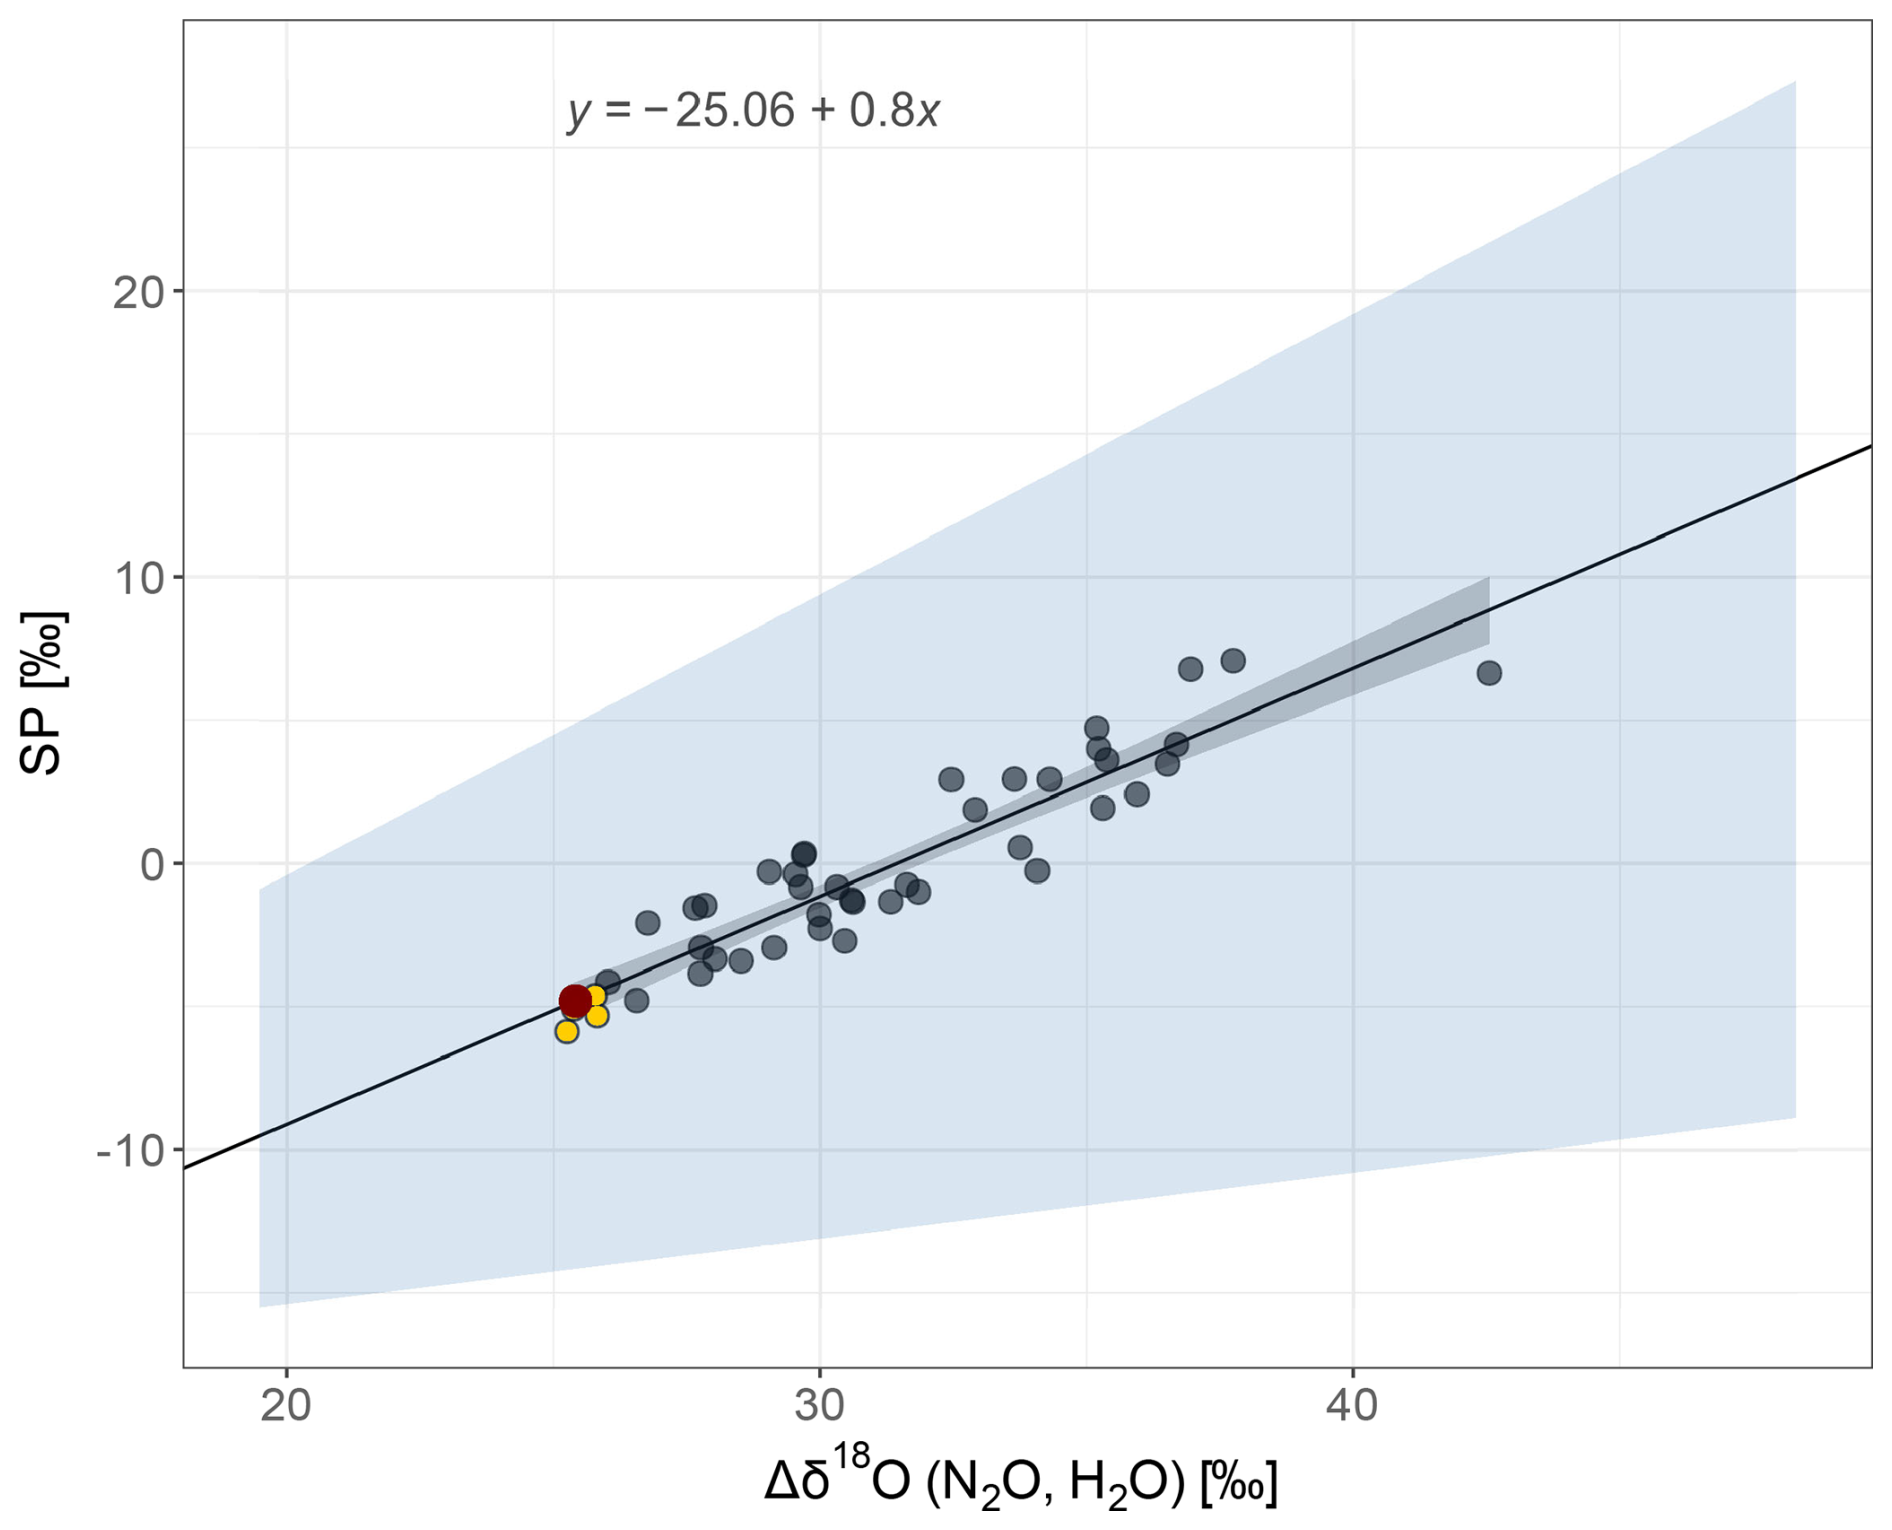
Figure 5SP plotted against Δδ18O (N2O, H2O) with the linear regression line representing the study-specific reduction line. Grey area covers the 99 % confidence interval; the blue area indicates the range of reduction slopes reported in the literature (Yu et al., 2020); the red dot represents δ0 and the yellow dots the five lowest-ranked points as estimated by the method described in Sect. 2.3.1. Data from 5 to 21 February 2025; n = 45.
The fraction of reduced N2O () was calculated as . Here, we used SP as input variables to calculate , as SP is independent of the isotopic signature of the source. Signatures of δ15Nbulk however, are dependent on the isotopic signature of the substrate and may vary over the course of the aeration time and was therefore not used to calculate .
2.5.2 Uncertainty assessment
The total uncertainty associated with the corrected δ-values (σi) was assessed by combining uncertainty contributions from (i) the N2O mole fraction correction (), (ii) the correction for the gas matrix effect of O2 (), and (iii) the repeatability of the instrument (σrep i). To do so, the law of error propagation was applied on the respective correction functions.
Table 2Uncertainty contributions to the total uncertainty of corrected δ-values originating from N2O mole fraction correction, gas matrix effects and repeatability.
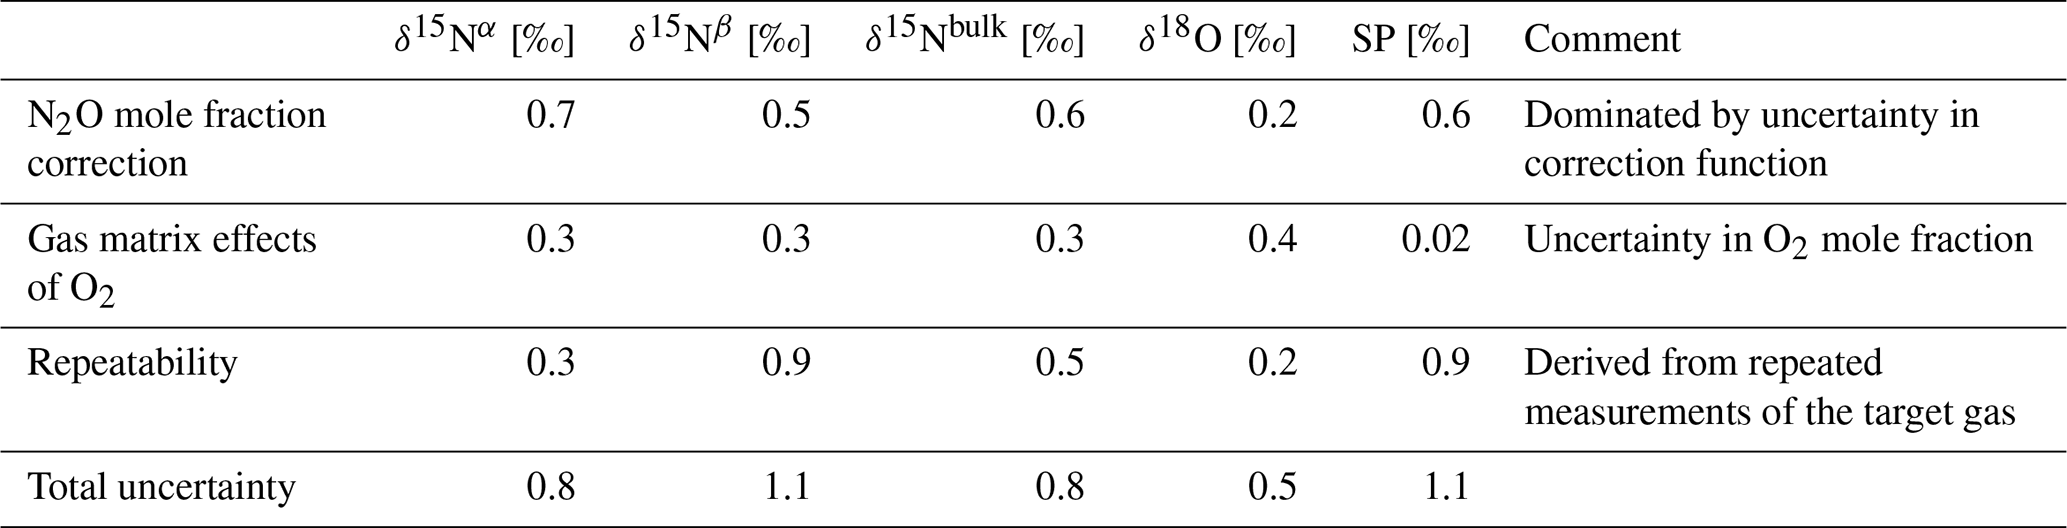
The uncertainty of the N2O mole fraction correction was estimated from the uncertainty in the quadratic correction function. For this the 95th confidence interval of the fit was chosen at a mean N2O mole fraction of 12 ppm. In contrast, the uncertainty related to the correction of the O2 gas matrix effect was assumed to be dominated by the variability of O2 mole fractions in the actual analyte gas (20.6 ± 0.2 %). Individual uncertainty contributions are shown in Table 2. To obtain the total uncertainty of the corrected isotope values the individual contributions were combined in quadrature:
The combined uncertainty (σi) represents the 1-sigma uncertainty of the final corrected δ-value. Combined uncertainties were 0.85 ‰, 1.08 ‰, 0.81 ‰, 0.48 ‰, and 1.09 ‰ for δ15Nα, δ15Nβ, δ15Nbulk, δ18O, and SP respectively (see Table 2).
The uncertainty estimate for the reduced N2O fraction () was provided, propagating the uncertainty of SP (σi), accounting for the number of samples (n) following first-order Taylor expansion:
3.1 Performance of the measurement setup
The dynamic dilution system reliably diluted the reactor off-gas to a target mole fraction of approximately 12 ppm (Fig. 6, note that the figure shows raw data, i.e. prior to calibration and corrections). It performed particularly well if N2O mole fractions in the reactor off-gas were consistent throughout the measurement interval. Initially, under rapid mole fraction changes, particularly at high N2O mole fractions (above approx. 100 ppm), however, the off-gas transfer from the N2O mole fraction analyser to the dilution system occasionally lagged. This led to enhanced variability in the analyte N2O mole fraction and partly to invalid isotope data due to N2O mole fractions outside the 11 to 13 ppm N2O target range. The situation was improved by increasing the gas flow rate and implementing an additional mass flow controller to flush the sample stream during Cal1 measurements between each sample analysis (Fig. 6). Another challenge throughout the experimental period was maintaining consistent CO2 removal rates, as the absorbent traps regularly showed CO2 breakthrough before the trap capacity was reached. We assume the occurrence of preferential flow paths to be responsible for this. As all data acquired during breakthrough periods were discarded, data quality was not compromised. A possible strategy to avoid future data loss could be the more frequent automated change of traps as integrated by Ibraim et al. (2019) or the development of an alternative dual-trap system with regenerative adsorbent. A further possible constraint is the necessity to use relatively large volumes of N2O free dilution air and the need for frequent drift corrections and calibrations, especially as necessary isotopic calibration standards at the required process mole fractions and in the appropriate gas matrix are not yet commercially available (Mohn et al., 2022; Ostrom et al., 2018). However, the resulting efforts and costs need to be evaluated against the alternatives. Intermittent sampling protocols bear significant labour costs as the samples need to be collected manually, the sample containers need to be cleaned and prepared beforehand and the analytics adapted for the target application. In addition, procedures for sample storage need to be carefully tested to avoid sample loss or increased uncertainty due to fractionation effects. Furthermore, off-line analytics requires a similar analytical setup, dilution gas and isotopic calibration standards. Furthermore, the setup described in this study is scalable, i.e. the measurement frequency can be increased significantly if higher temporal resolution is needed or for sequential analysis of multiple reactors. This enables high-frequency monitoring to capture short-term fluctuations and dynamic processes. Resulting data enables more accurate characterisation of N2O emission patterns like diurnal cycles and reduces uncertainty associated with interpolation between sparse data points. With minor adaptations the introduced isotopic measurement setup presented here will be capable of performing long-term measurements at full-scale WWTPs to provide on-line data that enables direct control in on-site mitigation efforts. Thus, the isotopic data are actionable, enabling the identification of the root source of emissions and their underlying drivers in near real-time. This information can improve the understanding of the emission dynamics and support evidence-based targeted mitigation strategies, thereby enhancing the ability of WWTP operators to reduce N2O emissions effectively.
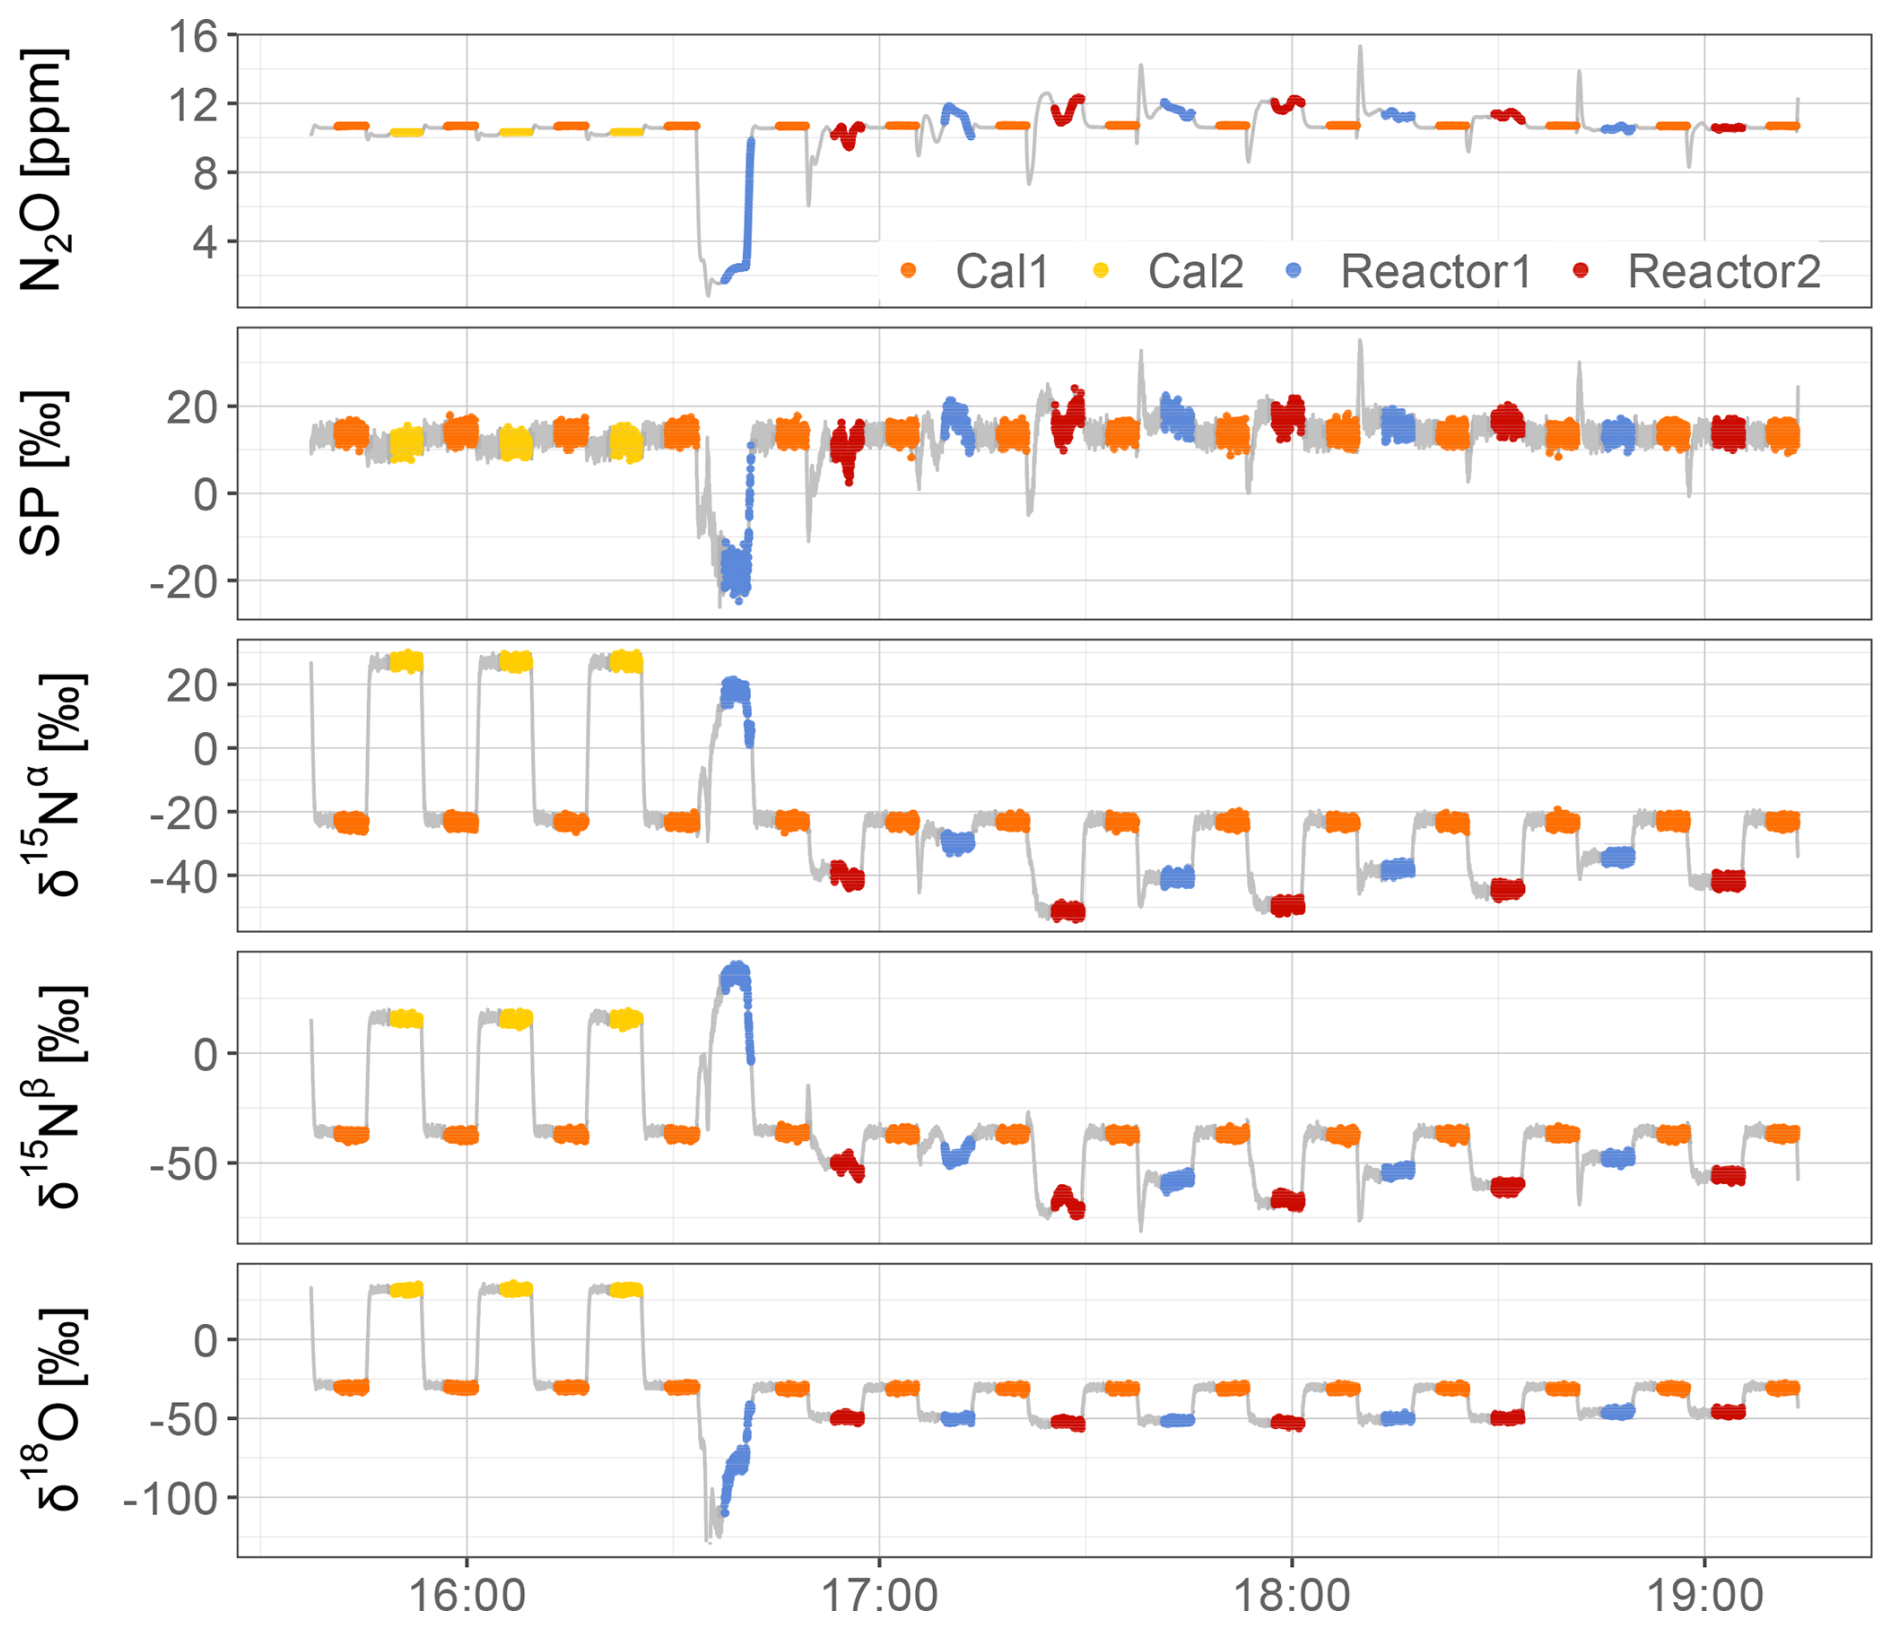
Figure 6N2O mole fraction data and SP, δ15Nα, δ15Nβ, δ18O values as provided by the laser spectrometer, i.e. prior to corrections and calibration. Data from 12 June 2025 under standard WWTP operation conditions. A measurement interval of 8 min was chosen and only the last 5 min of each interval were used for further analysis to assure complete exchange of the analyte gas in the gas pretreatment and analyser. Cal1 measurements are shown in orange, Cal2 measurements in yellow and sample measurements in blue (reactor 1) and red (reactor 2).
3.2 Representative data sets demonstrating system applicability
3.2.1 Experiment 1: Constraining nitrous oxide production pathways under standard WWTP operation
To determine the predominant microbial N2O production pathway, we analysed the N2O isotopic composition over several months (September to December 2024) under standard WWTP operation, i.e. at a dissolved O2 concentration setpoint of 2 mg L−1 (± 0.5 mg L−1) and without N-substrate additions. Figure 7 displays the N2O isotopic composition during standard operation of the two wastewater treatment reactors presented as a dual isotopic plot of SP versus δ18O (N2O) values, after data processing (Sect. 2.3). Isotopic signatures of relevant production processes (Hy, nD, and hD) derived from laboratory studies are indicated as rectangular shaded areas for comparison (Yu et al., 2020). Concurrent changes in SP and Δδ18O (N2O, H2O) along a straight line with a slope of 0.37 indicate successive reduction of N2O to N2 as the slope falls within a range defining the reduction line (spanning from 0.23 to 0.98, see Yu et al., 2020) and therefore validating the activity of N2O reduction. From Fig. 7 we can infer nD or hD as the dominant N2O production process, as measurements fall within the range of isotopic signatures expected for denitrification processes with a minimal effect of N2O reduction (Yu et al., 2020) and are in accordance with other studies on wastewater treatment (Gruber et al., 2022; Wunderlin et al., 2013). Furthermore, the absence of elevated SP values (> 30 ‰) suggests that Hy was not a source term during our measurements (Frame and Casciotti, 2010; Sutka et al., 2006; Wunderlin et al., 2013; Yu et al., 2020). This interpretation may strike the reader as odd, as the data points so obviously lay out-side of the shaded source signature areas that are traditionally visualised as boxes in dual isotope plots. These source signature areas (see Figs. 7 and 8a) are based on a limited number of pure culture studies and laboratory incubations (Yu et al., 2020) and therefore cannot be perceived as hard limits but require refinement to fully capture the dynamics of complex mixed microbial communities as are found in wastewater treat-ment reactors. Thus, the isotopic source signatures and their overlaps will be subject to change with increasing understanding of the complexities of managed and natural N2O source systems. To determine system-specific source signature areas and to robustly differentiate between the contributions of nD and hD to N2O formation requires further dedicated experiments that aim at stimulating both processes independently. A series of such experiments applying the analytical toolkit developed in this study is described in Strubbe et al. (2026). Controlling the concentration of ammonium, nitrite, and DO nitrifier denitrification was successfully isolated from heterotrophic denitrification and became more active at lower DO concentrations. Lower DO, higher organic carbon availability, and lower pH increased N2O production by heterotrophic denitrification during aeration. These new insights provide a systematic framework for understanding N2O dynamics and support the development of mitigation strategies at full-scale.
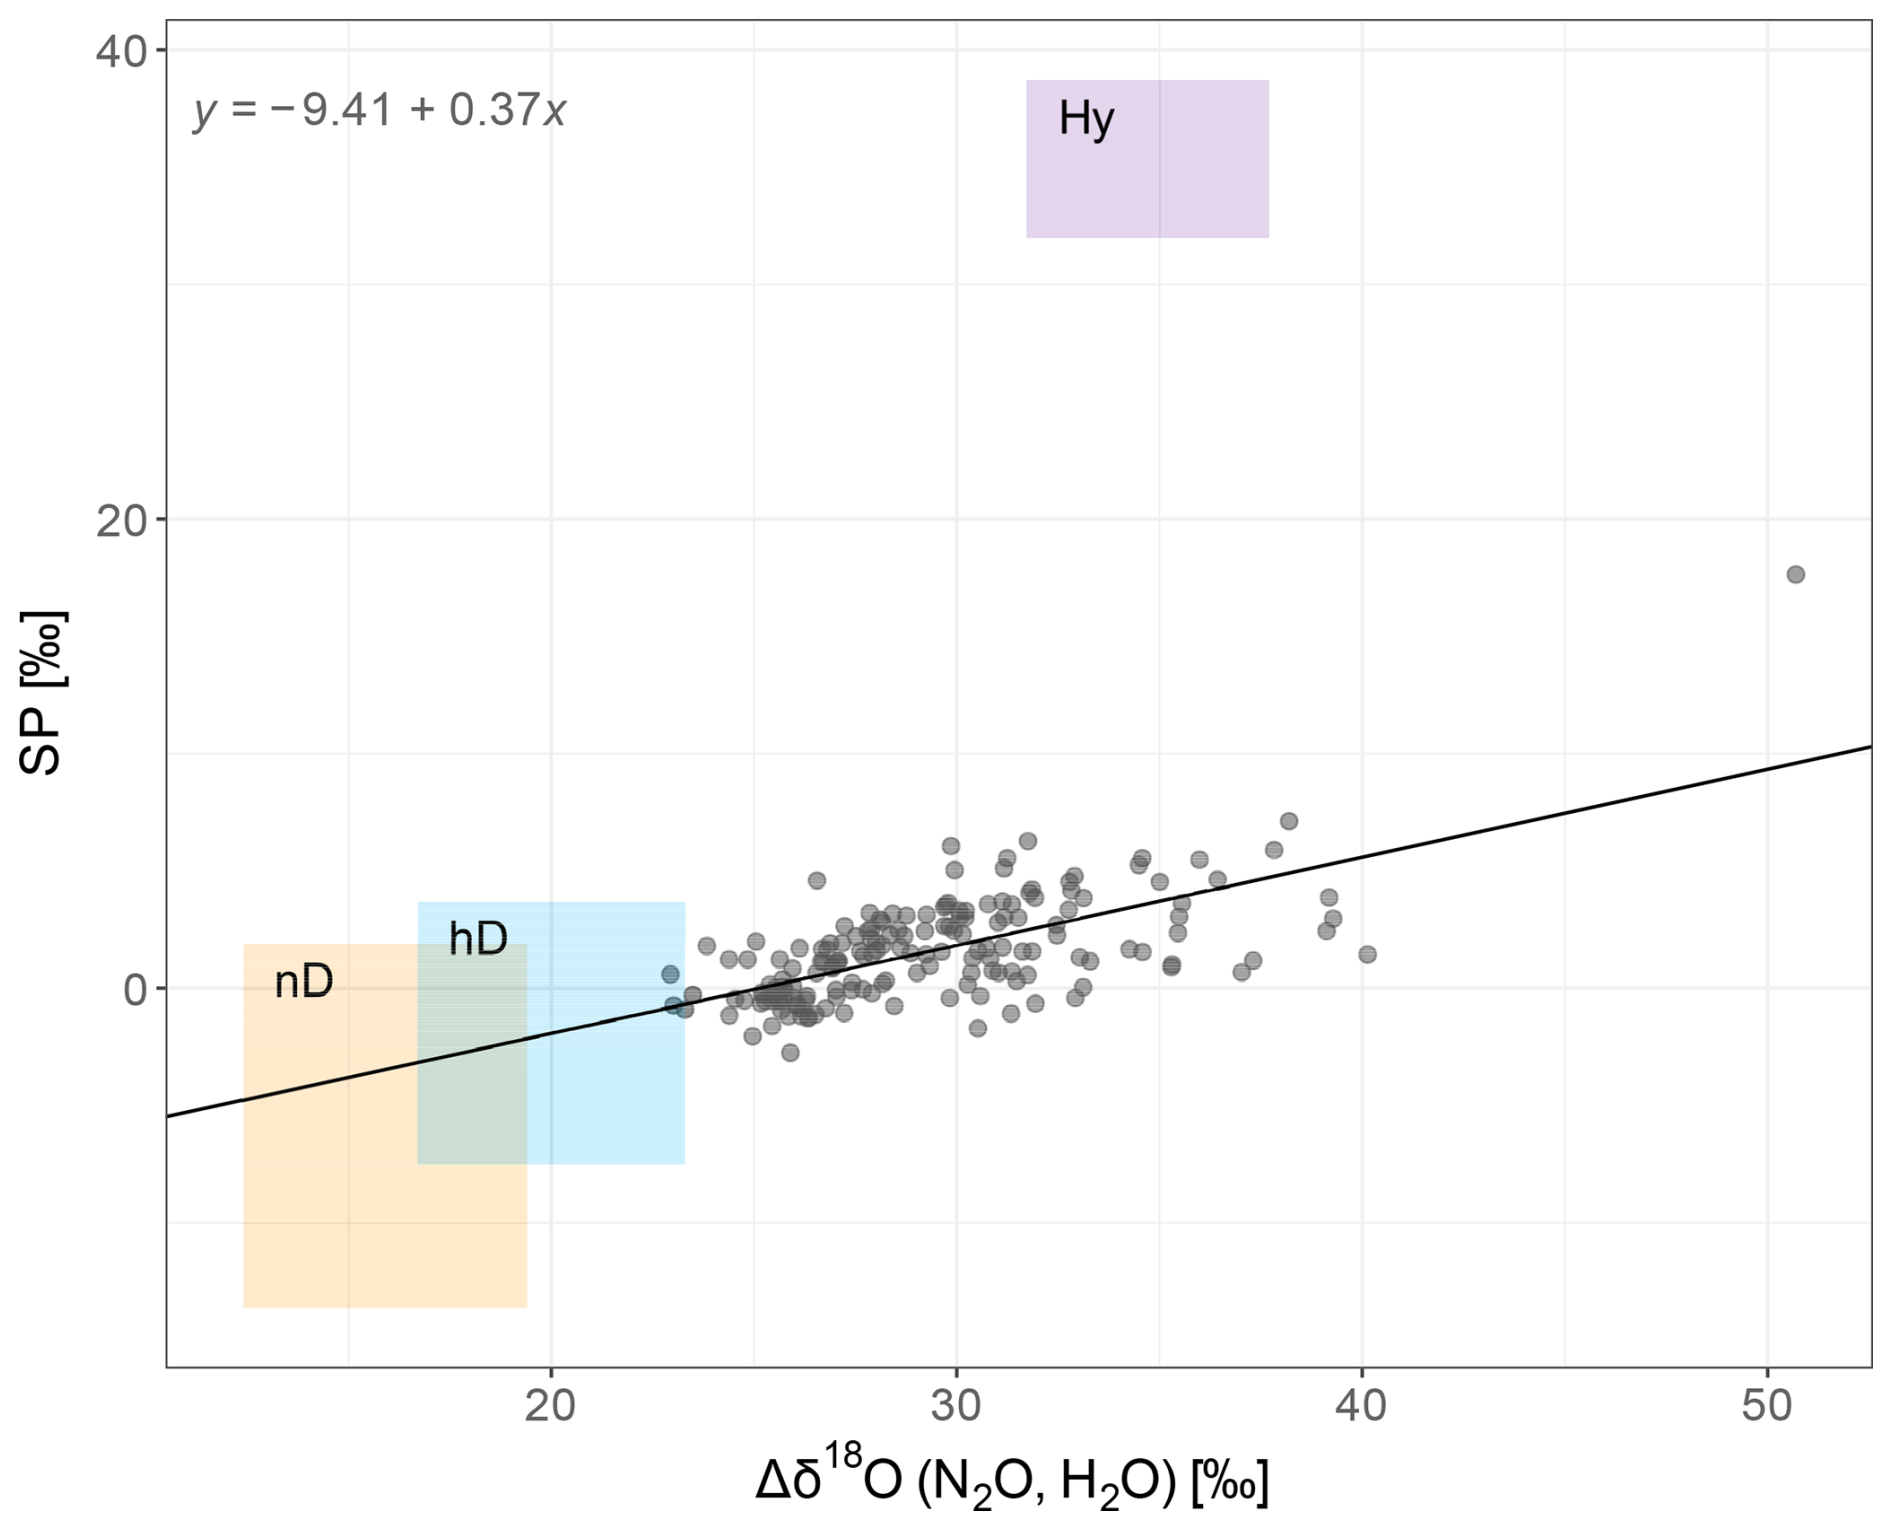
Figure 7Dual-isotope plot of SP and Δδ18O (N2O, H2O) measured during standard operations of wastewater treatment (data from September to December 2024, n = 170). Total uncertainties are 1.09 ‰ for SP and 0.48 ‰ for δ18O (N2O). Coloured boxes indicate expected source signatures of N2O production pathways without fractionation effects from partial N2O to N2 reduction (Yu et al., 2020). The linear regression (black line; slope of 0.37) represents the so-called “reduction line”, i.e. the progressive increase in SP and δ18O with progressive heterotrophic N2O reduction. Differences in reduction slopes observed for different experiments are likely due to variations in the microbial community (Hy: hydroxylamine oxidation, nD: nitrifier denitrification, hD: heterotrophic denitrification).
3.2.2 Experiment 2: Assessing the degree of nitrous oxide reduction as a function of dissolved oxygen concentration
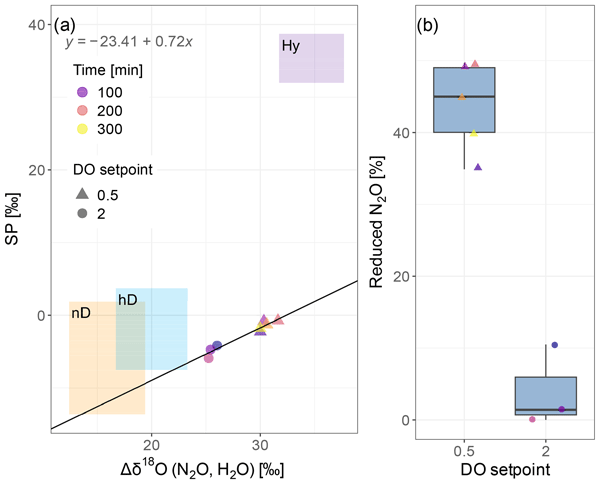
During heterotrophic N2O reduction to N2, the N2O molecule is preferentially split between the N–O bond of lighter isotopes, leading to an enhancement in δ15Nbulk, SP, and δ18O in the remaining N2O pool (Lewicka-Szczebak et al., 2017; Ostrom et al., 2007). The enrichment of SP, and δ18O caused by N2O reduction in experiment 2 is characterised by a slope of 0.72 (Fig. 8a), which falls within the data range defined by Yu et al. (2020) for such a process, supporting the validity of the here reported N2O reduction fractions. As the two experiments (1 and 2) are separated in time, the difference in the reduction line slopes is likely related to a shift in the active microbial community over time. This variability is within the range seen in scientific literature under similar settings (Gruber et al., 2022; Yu et al., 2020; Strubbe et al., 2026) but still represents an open research question worthwhile exploring in more detail. Dissolved O2 concentration was identified as an important driver of N2O to N2 reduction by hD (Fig. 8b). In general, higher N2O reduction was seen in the reactor set to a lower DO concentration. This can be seen in Fig. 8a, as the data from the reactor with a lower DO have progressed further along the SP δ18O line compared to those from the other reactor. Intuitively, this can be explained by the enzymes responsible for N2O reduction preferentially cleaving the bonds between lighter isotopes, i.e. between 14N–16O rather than between 15N–16O or 14N–18O, which leads to an accumulation of molecules with 18O and 15N in the central molecular position in the residual, unreduced N2O fraction. When applying Eq. (8) to calculate the for both scenarios, we can quantify the difference in . The low DO concentration setpoint of 0.5 mg L−1 led to an increase in by 40 % (± 1.7 %) compared to the DO setpoint of 2 mg L−1. Therefore, on-line isotopic analysis can highlight periods during which the DO set-points can be optimised for N2O emission reduction.
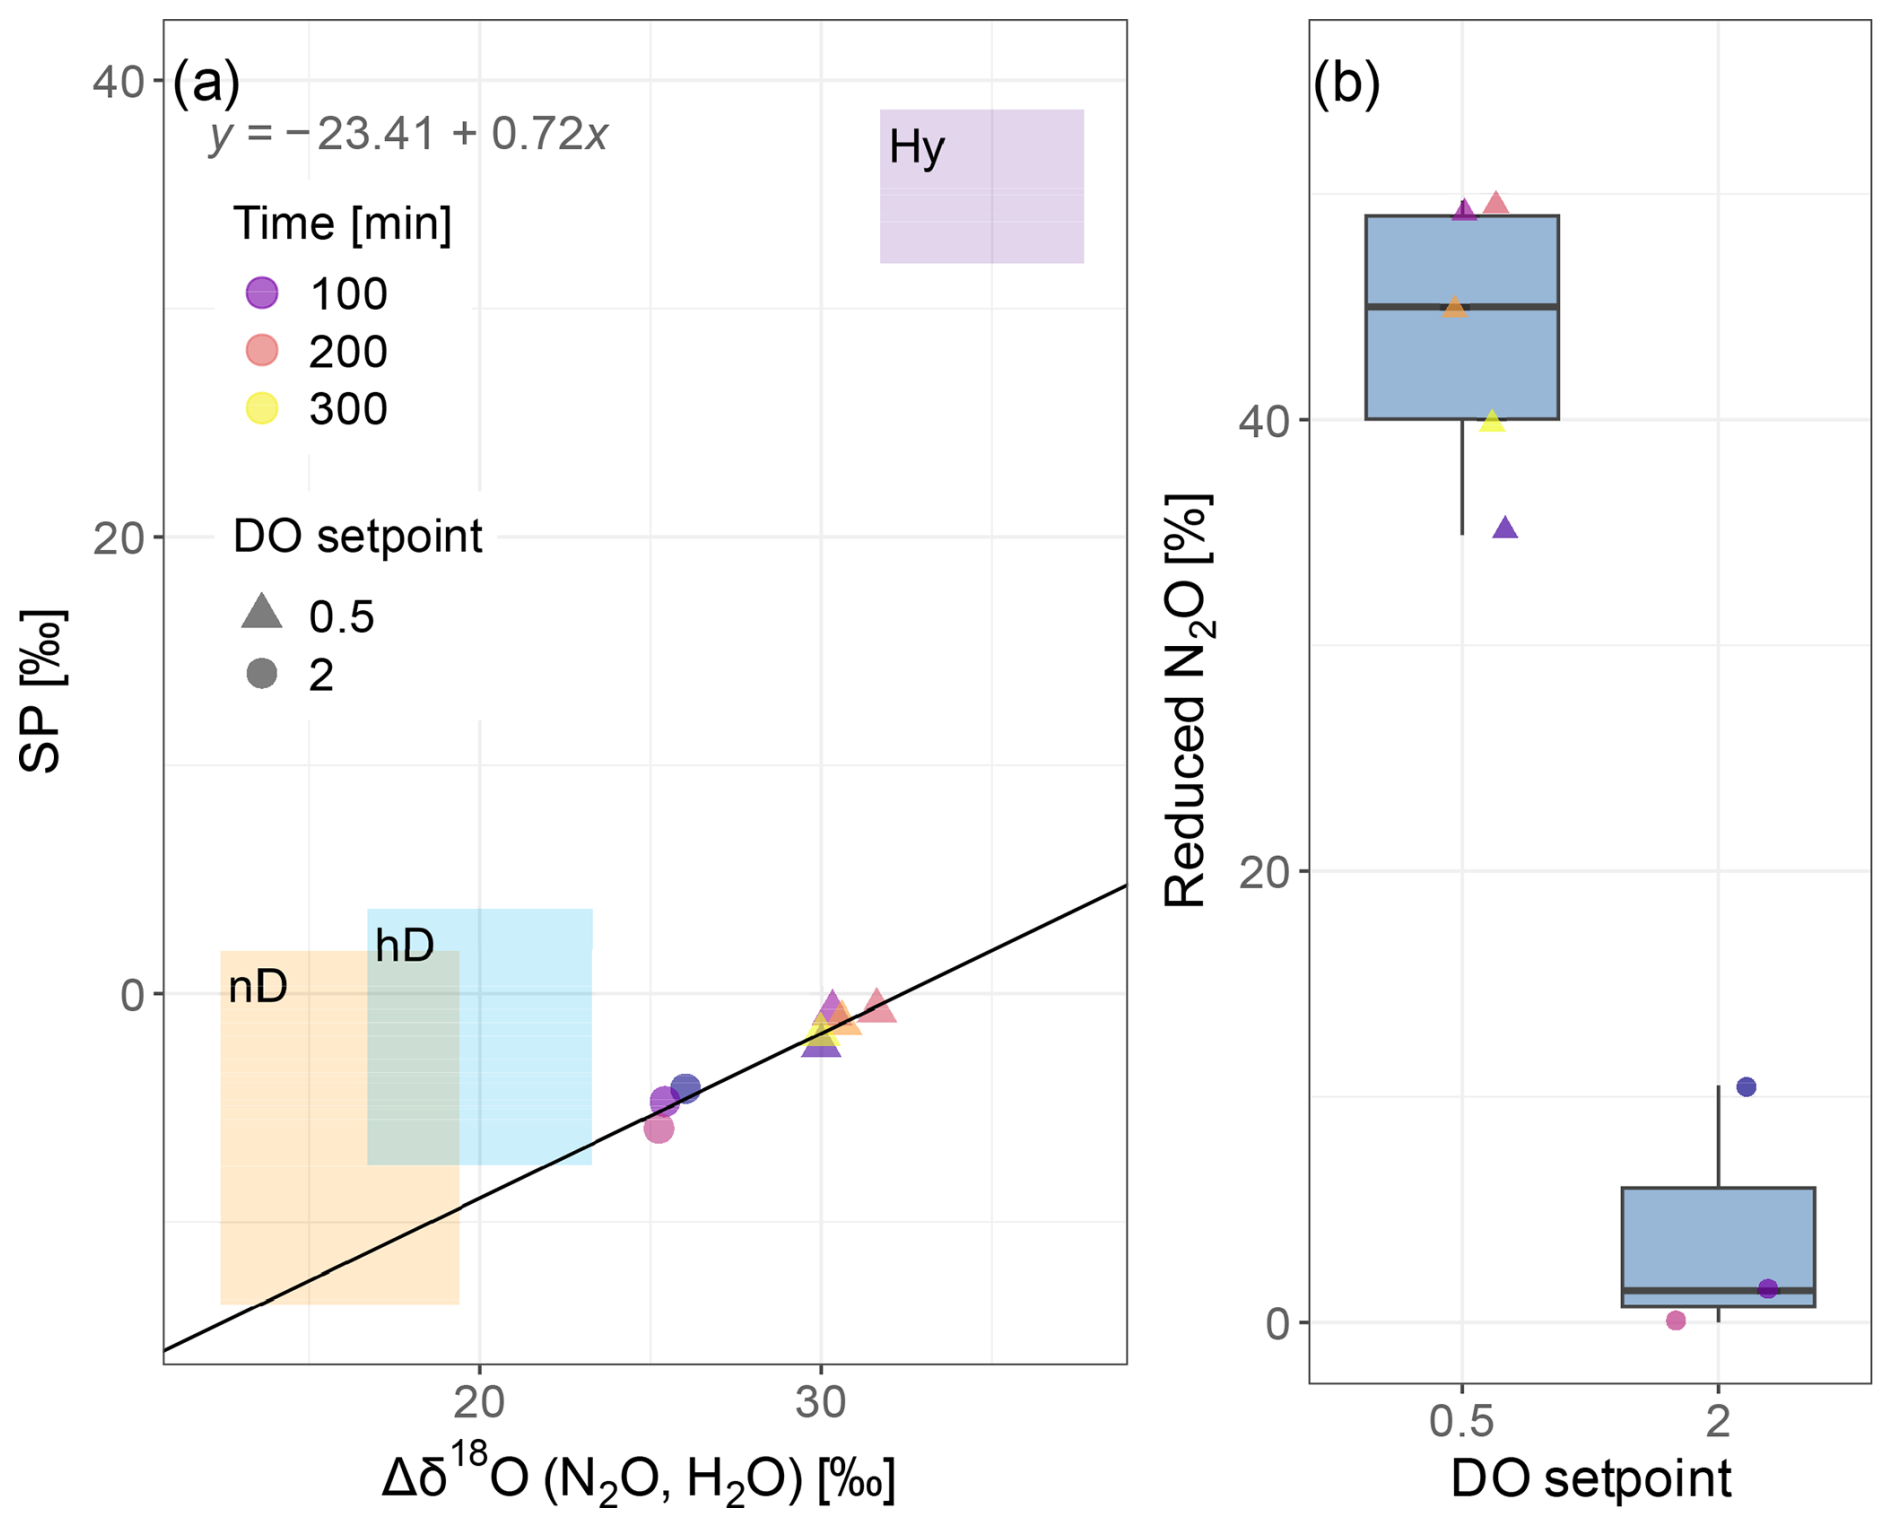
Figure 8(a) Dual-isotope plot of SP and Δδ18O (N2O, H2O) measured during experiments with distinctly different dissolved O2 (DO) content in both reactors. Coloured boxes indicate expected source signatures of N2O production pathways without N2O to N2 reduction (Yu et al., 2020), the linear regression (black line; slope of 0.72) represents the “reduction line” (Hy: hydroxylamine oxidation, nD: nitrifier denitrification, hD: heterotrophic denitrification). (b) Comparison of the fraction of reduced N2O () for the two DO setpoints. Uncertainties for are estimated to be 2 %. The colour gradient of the symbols in panels (a) and (b) indicates the time passed since aeration started. The different number of data points for the low DO scenario (n = 5) and the high DO scenario (n = 3) is due to a longer N2O production phase at low DO. Data from 21 February 2025.
During the aeration phases both reactors showed a considerable dynamic in over time leading to a difference in of 10 % to 15 % over the course of the experiment. In detail, the wastewater treatment reactor set to low DO showed an increasing trend in from 35 % to 50 % followed by a decline to 40 % over the course of the experiment. In contrast, the reactor set to high DO displayed a steady decrease in the from 10 % to 0 %. The substantial difference between the two treatments can be explained by the O2-sensitive nature of the enzyme responsible for N2O reduction (Pomowski et al., 2011). These findings align with previous studies demonstrating that low DO concentrations enhance N2O reduction efficiency and vice-versa (Morley et al., 2008; Suenaga et al., 2018; Tang et al., 2022; Zhou et al., 2021). Different DO concentration thresholds were found to trigger N2O reduction, Tang et al. (2022) found the N2O reduction rate to increase exponentially with decreasing DO concentration below a threshold of 1.6 mg O2 L−1 in estuarine waters. In contrast, Rees et al. (2021) reported that in marine water samples, N2O consumption was observed at DO concentrations as high as 8 mg O2 L−1 and Körner and Zumft (1989) reported a threshold of 5 mg O2 L−1 below which N2O reductase expression was enhanced. This high variability of reported thresholds may be related to microbial species or community dependencies in the response of N2O reduction to DO concentrations (Cavigelli and Robertson, 2001; Suenaga et al., 2018; Zhou et al., 2021). The type and availability of organic carbon represents another factor parameter affecting N2O reduction, which likely controlled the decrease in N2O reduction over time, particularly at the high DO setpoint (Azam et al., 2002; Liu et al., 2022; Morley and Baggs, 2010). This suggests that a higher availability of organic carbon enhances N2O reduction. Isolating the N2O-to-N2 reduction step by on-line isotopic analysis for the first time provides insights into its key drivers, helping identify operational levers to reduce production and enhance consumption of N2O, supporting the design of net-zero emission treatment systems. The detailed interpretation of positive or negative effects of operational factors on N2O reduction beyond data shown here, i.e. pH, temperature, total air consumption, total suspended solids, will be published elsewhere.
3.2.3 Experiment 3: 15N-labelling
Low-level 15N-labelling is a novel methodology that uses the addition of labelled substrate to slightly increase δ15N values to a level above natural abundance (100 ‰ to 200 ‰) to achieve clear traceability through biogeochemical reactions, but within a range that still allows the use of natural abundant fractionation factors as well as standard isotopic measurement methods (Deb et al., 2025). Here, the addition of 15N–NH4 (δ15N–NH = 100 ‰ in the total NH pool) at the onset of the aeration phase 1 results in N2O emissions with distinctly higher δ15Nbulk values compared to the bulk of our measurements outside of the low-level labelling experiments (Fig. 9a). An initial increase in δ15Nbulk to 6.5 ‰ as compared to around −40 ‰ under standard WWTP operation is consistent with progressive conversion of 15N-labelled NH into NO and NO, which act as substrates for N2O formation (Fig. 9b). After the NH is depleted, δ15Nbulk of N2O stagnates. In the second cycle, after a volume exchange of ca. 38 % and an anoxic feeding phase, denitrification likely converted a large portion of the labelled inorganic 15N nitrogen substrate to N2O and N2 of which most was removed from the system but the δ15Nbulk values of −27 ‰ are still slightly elevated compared to standard WWTP operation. These results demonstrate the suitability of the on-line isotopic measurement setup for low-level 15N-labelling studies as well as the benefit of labelled substrate addition to isolate contributions from specific microbial conversions to the N2O that is produced. A more complete quantitative analysis of these results requires considering the δ15N of aqueous nitrogen species and will be published independently.
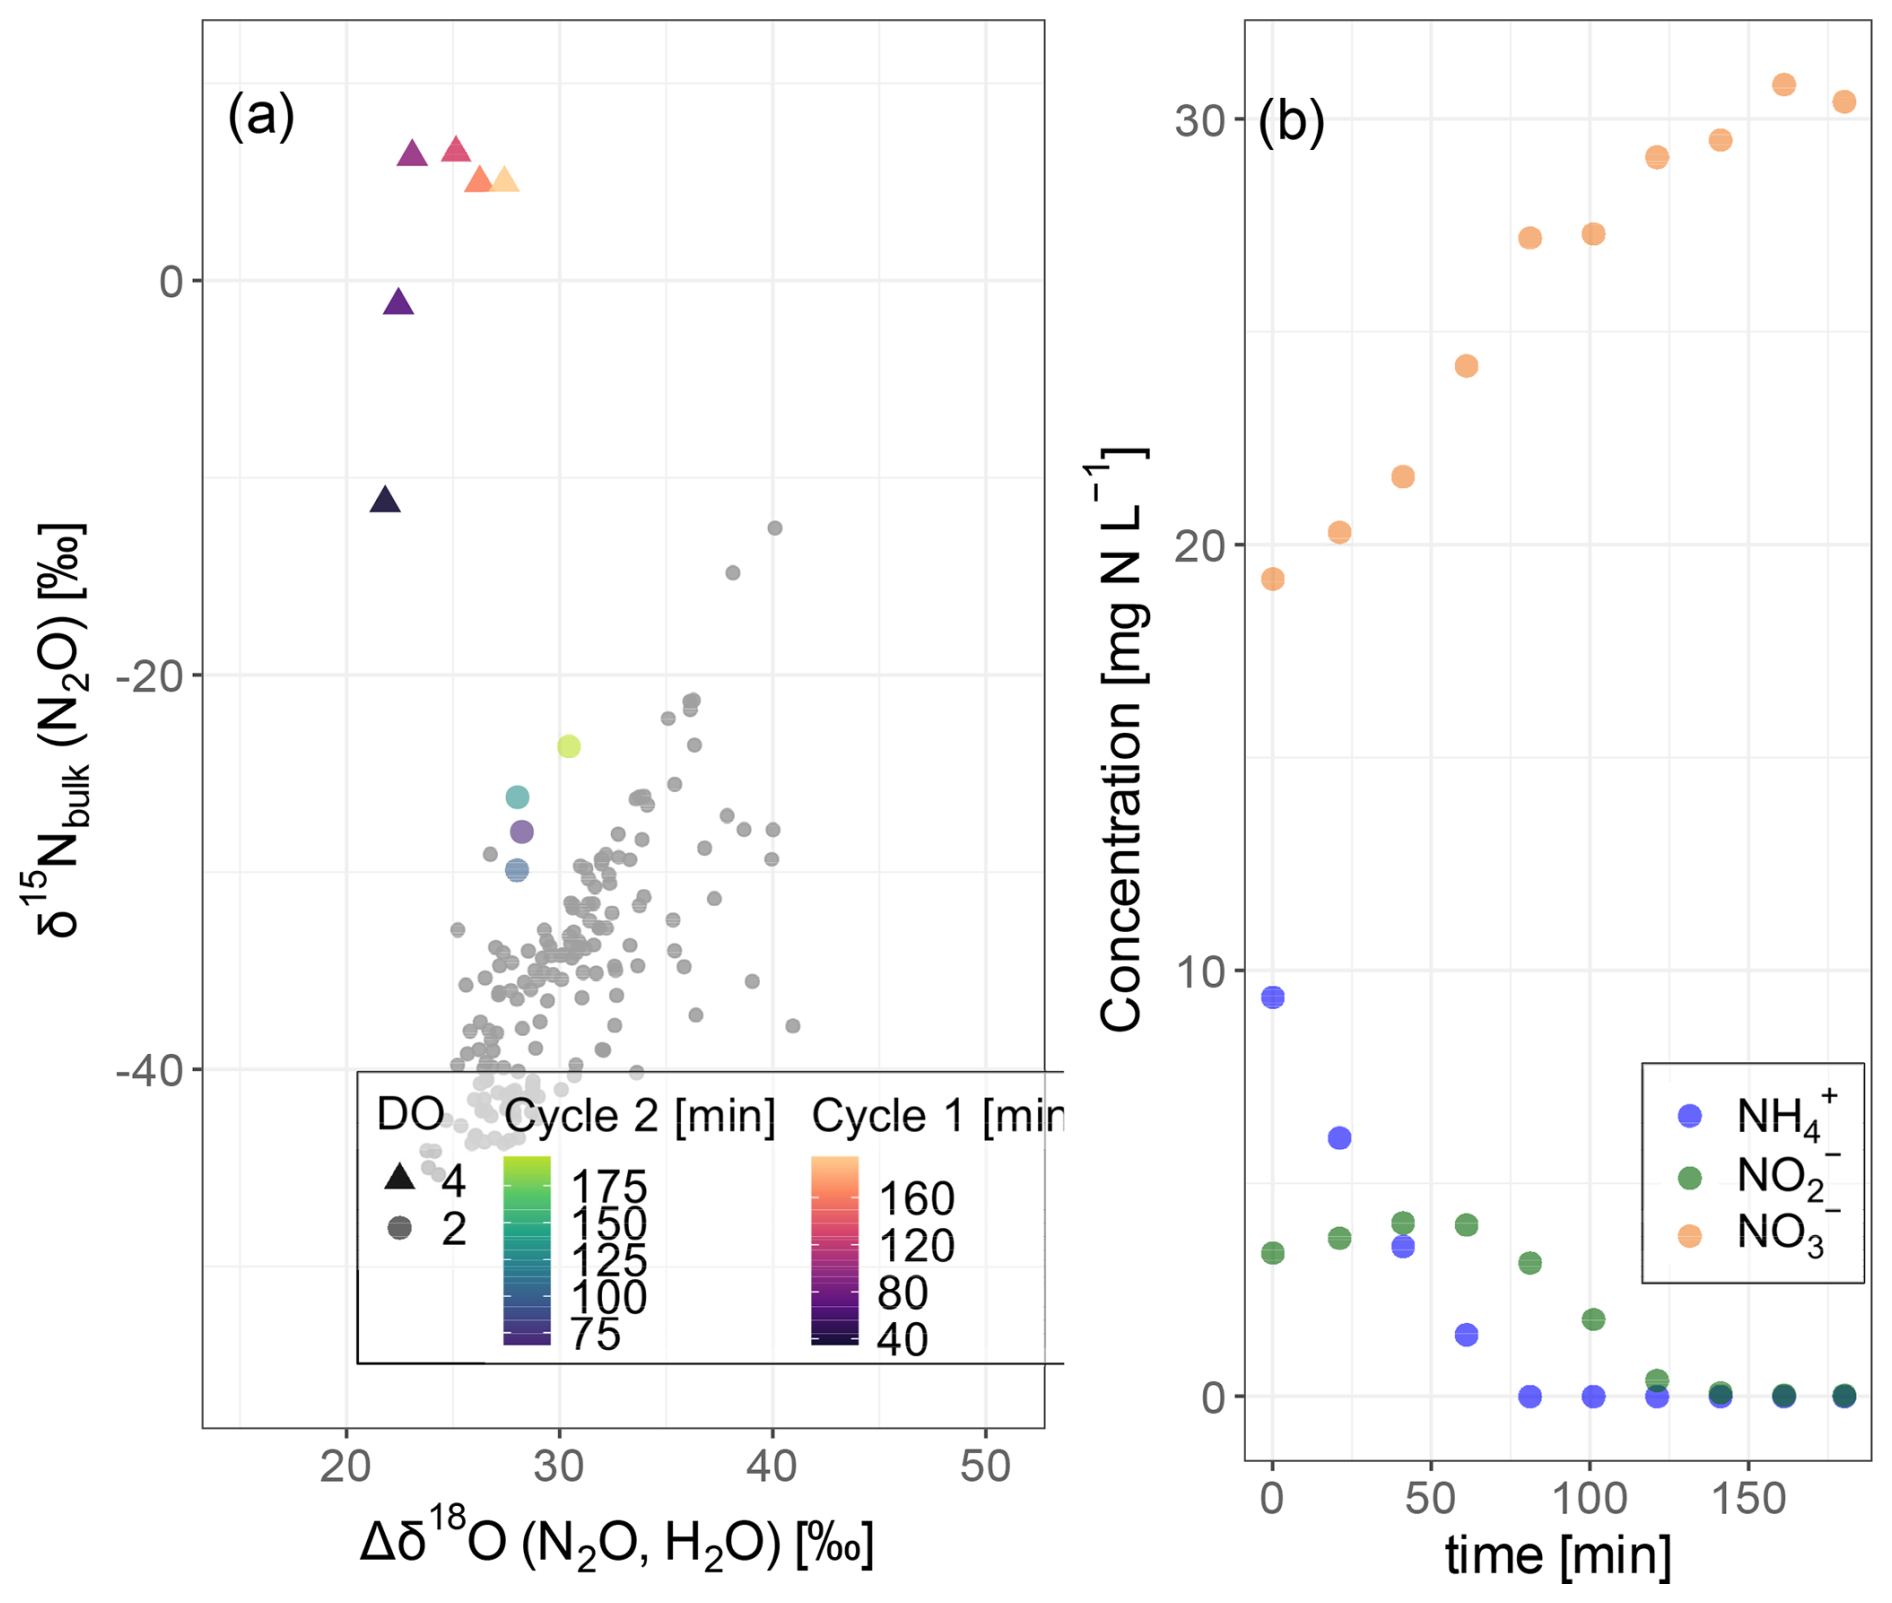
Figure 9(a) Dual-isotope plot of δ15Nbulk and Δδ18O (N2O, H2O) measured in a 15N labelling experiment for two consecutive aeration cycles, the first cycle after 15N–NH4 addition (δ15N–NH = 100 ‰) and the second cycle are printed in green and blue, respectively (data from 10 June 2025). Grey dots represent isotopic values during standard WWTP operation (data from September to December 2024, n = 170), given for comparison. The colour gradient indicates the time passed since aeration started. (b) Temporal trend of ammonium (NH), nitrate (NO), and nitrite (NO) concentration over the course of the first cycle.
This study demonstrates the feasibility and advantage of real-time N2O isotopic analysis using off-axis integrated cavity output spectroscopy in a pilot-scale wastewater treatment setting. By implementing a dynamic dilution system and robust correction protocols, we achieved accurate measurements of δ15Nα, δ15Nβ, δ15N, δ18O, including SP, under variable process conditions, most importantly analyte gas composition. Applying a fully-automated setup, with intermittent drift correction, up to three 5 min averaged gas sample measurements were realised per hour. Continuous monitoring in intermittent campaigns was demonstrated over a one-year study period, pointing out heterotrophic denitrification or nitrifier denitrification as the dominant N2O source and no signs indicative of hydroxylamine oxidation. Furthermore, the system enabled the assessment of N2O reduction dynamics and its dependence on process parameters, in our study DO variation were exemplarily tested. In a prototype application the analytical setup also proved suitable for 15N labelling experiments, offering new opportunities to study nitrogen transformation dynamics in complex environments with mixed microbial populations at high temporal resolution.
Beyond these initial applications, the platform offers significant potential for in-depth pathway characterisation by isolating contributions from individual microbial processes through targeted stimulation. It can support optimisation strategies by identifying the balance between N2O production and reduction in near real time and quantifying environmental constraints such as pH, carbon availability, micronutrient supply, or microbial composition. Importantly, the approach is not limited to pilot-scale reactors; it can be adapted for on-line monitoring at full-scale wastewater treatment plants, enabling integration into operational control and mitigation frameworks. Thus, the isotopic data are actionable and directly relevant for improved process understanding and optimization to support evidence-based operational decisions targeting the reduction of N2O emissions from WWTPs.
These findings underline the potential of laser spectroscopy as a practical tool for process optimisation and emission mitigation in wastewater treatment. Future work should focus on extending this approach to full-scale plants and incorporating isotopic data into advanced control strategies for greenhouse gas emission reduction.
All raw data and code can be provided upon request to the corresponding author.
HK tested and implemented the on-line isotopic analytic system guided by JM, contributed to the conceptualization of the study and the experimental strategy, performed data acquisition and analysis, and drafted the manuscript. LS operated the pilot reactors, contributed to the experimental strategy, to the interpretation of the results, and by editing the manuscript. PMM supported the conceptualization of the study and the formation of the experimental strategy and contributed to the manuscript by writing and editing. AJ provided the experimental wastewater treatment pilot setup, discussed the experimental strategy and contributed to writing and editing. AF discussed the experimental strategy and contributed to the manuscript by writing and editing. AK developed a solution for automatic calibration and dynamic dilution of the off-gas. KHK made the OA-ICOS available for this study and contributed to the manuscript by writing and editing. JM provided the framework to this study, prepared the calibration gases used in this study and made significant contributions to the conceptualisation as well as to the manuscript by writing and editing.
The contact author has declared that none of the authors has any competing interests.
Publisher's note: Copernicus Publications remains neutral with regard to jurisdictional claims made in the text, published maps, institutional affiliations, or any other geographical representation in this paper. The authors bear the ultimate responsibility for providing appropriate place names. Views expressed in the text are those of the authors and do not necessarily reflect the views of the publisher.
We thank Marco Kipf, Martin Breitenstein and the team at Eawag's pilot wastewater treatment plant for maintaining reactor operation and for their support during implementation of our on-line analytic system, Roland Werner for δ18O analysis of our water samples, and Pascal Rubli for providing us with a CO2 sensor. Christoph Hüglin, Stephan Henne, Liu Ye, Kristie Boering, and Lukas Emmenegger provided valuable input to conceptualization, data interpretation and analysis. Further, we would like to acknowledge the valuable comments received from two anonymous reviewers.
The project is part of Empa's and Eawag's contribution to the Swiss Center of Excellence on Net-Zero Emissions (SCENE), a joint initiative of all six institutions of the ETH Domain, which is partly funded by the ETH Board.
This paper was edited by Huilin Chen and reviewed by two anonymous referees.
Allan, D. W.: Statistics of atomic frequency standards, IEEE, 54, 221–230, 1966.
Azam, F., Müller, C., Weiske, A., Benckiser, G., and Ottow, J.: Nitrification and denitrification as sources of atmospheric nitrous oxide – role of oxidizable carbon and applied nitrogen, Biol. Fertil. Soils, 35, 54–61, https://doi.org/10.1007/s00374-001-0441-5, 2002.
Baer, D. S., Paul, J. B., Gupta, M., and O'Keefe, A.: Sensitive absorption measurements in the near-infrared region using off-axis integrated-cavity-output spectroscopy, Appl. Phys. B Lasers Opt., 75, 261–265, https://doi.org/10.1007/s00340-002-0971-z, 2002.
BAFU: Entwicklung der Treibhausgasemissionen der Schweiz seit 1990, https://www.bafu.admin.ch/de/treibhausgasinventar (last access: 2 October 2026), 2025.
Barrett, T., Dowle, M., Srinivasan, A., Gorecki, J., Chirico, M., Hocking, T., Schwendinger, B., and Krylov, I.: data.table: Extension of “data.frame”, R package version 1.18.99, https://r-datatable.com (last access: 2 October 2026), 2025.
Camin, F., Besic, D., Brewer, P. J., Allison, C. E., Coplen, T. B., Dunn, P. J. H., Gehre, M., Gröning, M., Meijer, H. A. J., Hélie, J.-F., Iacumin, P., Kraft, R., Krajnc, B., Kümmel, S., Lee, S., Meija, J., Mester, Z., Mohn, J., Moossen, H., Qi, H., Skrzypek, G., Sperlich, P., Viallon, J., Wassenaar, L. I., and Wielgosz, R. I.: Stable Isotope Reference Materials and Scale Definitions – Outcomes of the 2024 IAEA Experts Meeting, Rapid Commun. Mass Spectrom., 39, e10018, https://doi.org/10.1002/rcm.10018, 2025.
Cavigelli, M. A. and Robertson, G. P.: Role of denitrifier diversity in rates of nitrous oxide consumption in a terrestrial ecosystem, Soil Biol. Biochem., 33, 297–310, https://doi.org/10.1016/S0038-0717(00)00141-3, 2001.
Daelman, M. R. J., van Voorthuizen, E. M., van Dongen, U. G. J. M., Volcke, E. I. P., and van Loosdrecht, M. C. M.: Seasonal and diurnal variability of N2O emissions from a full-scale municipal wastewater treatment plant, Sci. Total Environ., 536, 1–11, https://doi.org/10.1016/j.scitotenv.2015.06.122, 2015.
Deb, S., Espenberg, M., Well, R., Bucha, M., Jakubiak, M., Mander, Ü., Jędrysek, M.-O., and Lewicka-Szczebak, D.: N transformations in nitrate-rich groundwaters: combined isotope and microbial approach, Biogeosciences, 22, 5535–5556, https://doi.org/10.5194/bg-22-5535-2025, 2025.
Domingo-Félez, C., Jensen, M. M., Bang, A., and Smets, B. F.: Variability and Uncertainty Analysis of N2O Emissions from WWTP to Improve the Accuracy of Emission Factors and the Design of Monitoring Strategies, ACS EST Water, 4, 2542–2552, https://doi.org/10.1021/acsestwater.4c00048, 2024.
EEA: Annual European Union greenhouse gas inventory 1990–2015 and inventory report 2017 (No. 6), Copenhagen, https://www.eea.europa.eu/en/analysis/publications/european-union-greenhouse-gas-inventory-2017 (last access: 2 October 2026), 2017.
EEA: Annual European Union greenhouse gas inventory 1990–2021 and inventory report 2023 (EEA/PUBL/2023/044), Copenhagen, https://www.eea.europa.eu/en/analysis/publications/annual-european-union-greenhouse-gas-2 (last access: 2 October 2026), 2023.
Frame, C. H. and Casciotti, K. L.: Biogeochemical controls and isotopic signatures of nitrous oxide production by a marine ammonia-oxidizing bacterium, Biogeosciences, 7, 2695–2709, https://doi.org/10.5194/bg-7-2695-2010, 2010.
Froemelt, A., Zueger, L., von Kaenel, L., Braun, D., and Gruber, W.: Pattern recognition of operational states leading to N2O-emissions in full-scale biological wastewater treatment, Water Res. X, 29, 100336, https://doi.org/10.1016/j.wroa.2025.100336, 2025.
Gruber, W., Villez, K., Kipf, M., Wunderlin, P., Siegrist, H., Vogt, L., and Joss, A.: N2O emission in full-scale wastewater treatment: Proposing a refined monitoring strategy, Sci. Total Environ., 699, 134157, https://doi.org/10.1016/j.scitotenv.2019.134157, 2020.
Gruber, W., von Känel, L., Vogt, L., Luck, M., Biolley, L., Feller, K., Moosmann, A., Krähenbühl, N., Kipf, M., Loosli, R., Vogel, M., Morgenroth, E., Braun, D., and Joss, A.: Estimation of countrywide N2O emissions from wastewater treatment in Switzerland using long-term monitoring data, Water Res. X, 13, 100122, https://doi.org/10.1016/j.wroa.2021.100122, 2021.
Gruber, W., Magyar, P. M., Mitrovic, I., Zeyer, K., Vogel, M., Von Känel, L., Biolley, L., Werner, R. A., Morgenroth, E., Lehmann, M. F., Braun, D., Joss, A., and Mohn, J.: Tracing N2O formation in full-scale wastewater treatment with natural abundance isotopes indicates control by organic substrate and process settings, Water Res. X, 15, 100130. https://doi.org/10.1016/j.wroa.2022.100130, 2022.
Harris, E., Joss, A., Emmenegger, L., Kipf, M., Wolf, B., Mohn, J., and Wunderlin, P.: Isotopic evidence for nitrous oxide production pathways in a partial nitritation-anammox reactor, Water Res., 83, 258–270, https://doi.org/10.1016/j.watres.2015.06.040, 2015.
Harris, S. J., Liisberg, J., Xia, L., Wei, J., Zeyer, K., Yu, L., Barthel, M., Wolf, B., Kelly, B. F. J., Cendón, D. I., Blunier, T., Six, J., and Mohn, J.: N2O isotopocule measurements using laser spectroscopy: analyzer characterization and intercomparison, Atmos. Meas. Tech., 13, 2797–2831, https://doi.org/10.5194/amt-13-2797-2020, 2020.
Havsteen, J. C., Fatima, M., Brunamonti, S., Pogány, A., Hausmaninger, T., Wolf, B., Well, R., and Mohn, J.: Correction and calibration protocol for isotope data via CRDS: a study case for N2O and other isotope systems, Atmos. Meas. Tech., 19, 3557–3580, https://doi.org/10.5194/amt-19-3557-2026, 2026.
Heil, J., Wolf, B., Brüggemann, N., Emmenegger, L., Tuzson, B., Vereecken, H., and Mohn, J.: Site-specific 15N isotopic signatures of aiotically produced N2O, Geochim. Cosmochim. Ac., 139, 72–82, https://doi.org/10.1016/j.gca.2014.04.037, 2014.
Ibraim, E., Wolf, B., Harris, E., Gasche, R., Wei, J., Yu, L., Kiese, R., Eggleston, S., Butterbach-Bahl, K., Zeeman, M., Tuzson, B., Emmenegger, L., Six, J., Henne, S., and Mohn, J.: Attribution of N2O sources in a grassland soil with laser spectroscopy based isotopocule analysis, Biogeosciences, 16, 3247–3266, https://doi.org/10.5194/bg-16-3247-2019, 2019.
IPCC: Chapter 6 Wastewater treatment and discharge, 2019 Refinement to the 2006 IPCC Guidelines for National Greenhouse Gas Inventories, https://www.ipcc-nggip.iges.or.jp/public/2019rf/vol5.html (last access: 2 October 2026), 2019.
IPCC: Climate Change 2021 – The Physical Science Basis: Working Group I Contribution to the Sixth Assessment Report of the Intergovernmental Panel on Climate Change, 1st edn. Cambridge University Press, https://doi.org/10.1017/9781009157896, 2021.
Kampschreur, M. J., Temmink, H., Kleerebezem, R., Jetten, M. S. M., and van Loosdrecht, M. C. M.: Nitrous oxide emission during wastewater treatment, Water Res., 43, 4093–4103, https://doi.org/10.1016/j.watres.2009.03.001, 2009.
Kool, D. M., Wrage N., Oenema1, O., Dolfing, J., and van Groenigen, J. W.: Oxygen exchange between (de)nitrification intermediates and H2O and its implications for source determination of NO3 and N2O: a review, Rapid Commun. Mass Spectrom., 21, 3569–3578, https://doi.org/10.1002/rcm.3249, 2007.
Körner, H. and Zumft, W.G.: Expression of Denitrification Enzymes in Response to the Dissolved Oxygen Level and Respiratory Substrate in Continuous Culture of Pseudomonas stutzeri, Appl. Environ. Microbiol., 55, 1670–1676, https://doi.org/10.1128/aem.55.7.1670-1676.1989, 1989.
Kosonen, H., Heinonen, M., Mikola, A., Haimi, H., Mulas, M., Corona, F., and Vahala, R.: Nitrous Oxide Production at a Fully Covered Wastewater Treatment Plant: Results of a Long-Term Online Monitoring Campaign, Environ. Sci. Technol., 50, 5547–5554, https://doi.org/10.1021/acs.est.5b04466, 2016.
Law, Y., Ye, L., Pan, Y., and Yuan, Z.: Nitrous oxide emissions from wastewater treatment processes, Philos. Trans. R. Soc. B Biol. Sci., 367, 1265–127, https://doi.org/10.1098/rstb.2011.0317, 2012.
Lewicka-Szczebak, D., Augustin, J., Giesemann, A., and Well, R.: Quantifying N2O reduction to N2 based on N2O isotopocules – validation with independent methods (helium incubation and 15N gas flux method), Biogeosciences, 14, 711–732, https://doi.org/10.5194/bg-14-711-2017, 2017.
Liu, Y., He, Y., Ren, S., Zhu, T., and Liu, Y.: Selective Organic Carbon Enrichment Influences Nitrous Oxide Reduction by Denitrifiers: Electron Competition Insights, ACS EST Water, 2, 1265–1275, https://doi.org/10.1021/acsestwater.2c00161, 2022.
Mariotti, A., Germon, J. C., Hubert, P., Kaiser, P., Letolle, R., Tardieux, A., and Tardieux, P.: Experimental determination of nitrogen kinetic isotope fractionation: Some principles; illustration for the denitrification and nitrification processes, Plant Soil, 62, 413–430, https://doi.org/10.1007/BF02374138, 1981.
Mohn, J., Wolf, B., Toyoda, S., Lin, C.-T., Liang, M.-C., Brüggemann, N., Wissel, H., Steiker, A. E., Dyckmans, J., Szwec, L., Ostrom, N. E., Casciotti, K. L., Forbes, M., Giesemann, A., Well, R., Doucett, R. R., Yarnes, C. T., Ridley, A. R., Kaiser, J., and Yoshida, N.: Interlaboratory assessment of nitrous oxide isotopomer analysis by isotope ratio mass spectrometry and laser spectroscopy: current status and perspectives. Rapid Commun, Mass Spectrom., 28, 1995–2007, https://doi.org/10.1002/rcm.6982, 2014.
Mohn, J., Biasi, C., Bodé, S., Boeckx, P., Brewer, P. J., Eggleston, S., Geilmann, H., Guillevic, M., Kaiser, J., Kantnerová, K., Moossen, H., Müller, J., Nakagawa, M., Pearce, R., Von Rein, I., Steger, D., Toyoda, S., Wanek, W., Wexler, S. K., Yoshida, N., and Yu, L.: Isotopically characterised N2O reference materials for use as community standards, Rapid Commun. Mass Spectrom., 36, e9296, https://doi.org/10.1002/rcm.9296, 2022.
Morley, N. and Baggs, E. M.: Carbon and oxygen controls on N2O and N2 production during nitrate reduction, Soil Biol. Biochem., 42, 1864–1871, https://doi.org/10.1016/j.soilbio.2010.07.008, 2010.
Morley, N., Baggs, E. M., Dörsch, P., and Bakken, L.: Production of NO, N2O and N2 by extracted soil bacteria, regulation by NO2− and O2 concentrations: Production of NO, N2O and N2 by extracted soil bacteria, FEMS Microbiol. Ecol., 65, 102–112, https://doi.org/10.1111/j.1574-6941.2008.00495.x, 2008.
Ostrom, N. E., Pitt, A., Sutka, R., Ostrom, P. H., Grandy, A. S., Huizinga, K. M., and Robertson, G. P.: Isotopologue effects during N2 O reduction in soils and in pure cultures of denitrifiers, J. Geophys. Res.-Biogeo., 112, 2006JG000287, https://doi.org/10.1029/2006JG000287, 2007.
Ostrom, N. E., Gandhi, H., Coplen, T. B. Toyoda, S., Böhlke, J. K., Brand, W. A., Casciotti, K. L., Dyckmans, J., Giesemann, A., Mohn, J., Well, R., Yu, L., and Yoshida, N.: Preliminary assessment of stable nitrogen and oxygen isotopic composition of USGS51 and USGS52 nitrous oxide reference gases and perspectives on calibration needs, Rapid Commun Mass Spectrom., 32, 1207–1214, https://doi.org/10.1002/rcm.8157, 2018.
Plouviez, M., Sperlich, P., Guieysse, B., Clough, T., Peethambaran, R., and Wells, N.: A novel laser-based spectroscopic method reveals the isotopic signatures of nitrous oxide produced by eukaryotic and prokaryotic phototrophs in darkness, Biogeosciences, 23, 497–508, https://doi.org/10.5194/bg-23-497-2026, 2026.
Pomowski, A., Zumft, W. G., Kroneck, P. M. H., and Einsle, O.: N2O binding at a [4Cu:2S] copper–sulphur cluster in nitrous oxide reductase, Nature, 477, 234–237, https://doi.org/10.1038/nature10332, 2011.
R Core Team: R: A Language and Environment for Statistical Computing, R Foundation for Statistical Computing, Vienna, Austria, https://www.r-project.org/ (last access: 2 October 2026), 2025.
Rees, A. P., Brown, I. J., Jayakumar, A., Lessin, G., Somerfield, P. J., and Ward, B. B.: Biological nitrous oxide consumption in oxygenated waters of the high latitude Atlantic Ocean, Commun. Earth Environ., 2, 36, https://doi.org/10.1038/s43247-021-00104-y, 2021.
Sperlich, P., Camin, F., Deufrains, K., Englund Michel, S., Hoheisel, A., Mohn, J., Schmidt, M., and Tarasova, O.: Measurement of the Stable Carbon Isotope Ratio in Atmospheric CH4 Using Laser Spectroscopy for CH4 Source Characterization, 1st edn., IAEA TECDOC Series International Atomic Energy Agency, Vienna, https://doi.org/10.61092/iaea.logm-wiux, 2024.
Strubbe, L., Keck, H., Magyar, P. M., Mohn, J., Joss, A., and Froemelt, A.: Activating specific N2O production pathways to understand emission dynamics in wastewater treatment, Water Res., 296, 125580, https://doi.org/10.1016/j.watres.2026.125580, 2026.
Suenaga, T., Riya, S., Hosomi, M., and Terada, A.: Biokinetic Characterization and Activities of N2O-Reducing Bacteria in Response to Various Oxygen Levels, Front. Microbiol. 9, 697, https://doi.org/10.3389/fmicb.2018.00697, 2018.
Sutka, R. L., Ostrom, N. E., Ostrom, P. H., Breznak, J. A., Gandhi, H., Pitt, A. J., and Li, F.: Distinguishing Nitrous Oxide Production from Nitrification and Denitrification on the Basis of Isotopomer Abundances, Appl. Environ. Microbiol., 72, 638–644, https://doi.org/10.1128/AEM.72.1.638-644.2006, 2006.
Tang, W., Jayakumar, A., Sun, X., Tracey, J. C., Carroll, J., Wallace, E., Lee, J. A., Nathan, L., and Ward, B.: Nitrous Oxide Consumption in Oxygenated and Anoxic Estuarine Waters, Geophys. Res. Lett., 49, e2022GL100657, https://doi.org/10.1029/2022GL100657, 2022.
Tian, H., Pan, N., Thompson, R. L., Canadell, J. G., Suntharalingam, P., Regnier, P., Davidson, E. A., Prather, M., Ciais, P., Muntean, M., Pan, S., Winiwarter, W., Zaehle, S., Zhou, F., Jackson, R. B., Bange, H. W., Berthet, S., Bian, Z., Bianchi, D., Bouwman, A. F., Buitenhuis, E. T., Dutton, G., Hu, M., Ito, A., Jain, A. K., Jeltsch-Thömmes, A., Joos, F., Kou-Giesbrecht, S., Krummel, P. B., Lan, X., Landolfi, A., Lauerwald, R., Li, Y., Lu, C., Maavara, T., Manizza, M., Millet, D. B., Mühle, J., Patra, P. K., Peters, G. P., Qin, X., Raymond, P., Resplandy, L., Rosentreter, J. A., Shi, H., Sun, Q., Tonina, D., Tubiello, F. N., van der Werf, G. R., Vuichard, N., Wang, J., Wells, K. C., Western, L. M., Wilson, C., Yang, J., Yao, Y., You, Y., and Zhu, Q.: Global nitrous oxide budget (1980–2020), Earth Syst. Sci. Data, 16, 2543–2604, https://doi.org/10.5194/essd-16-2543-2024, 2024.
Toyoda, S. and Yoshida, N.: Determination of Nitrogen Isotopomers of Nitrous Oxide on a Modified Isotope Ratio Mass Spectrometer, Anal. Chem., 71, 4711–4718, https://doi.org/10.1021/ac9904563, 1999.
Toyoda, S., Suzuki, Y., Hattori, S., Yamada, K., Fujii, A., Yoshida, N., Kouno, R., Murayama, K., and Shiomi, H.: Isotopomer analysis of production and consumption mechanisms of N2O and CH4 in an advanced wastewater treatment system, Environ. Sci. Technol., 45, 917–922, https://doi.org/10.1021/es102985u, 2011.
Toyoda, S., Yoshida, N., and Koba, K.: Isotopocule analysis of biologically produced nitrous oxide in various environments, Mass Spectrom. Rev., 36, 135–160, https://doi.org/10.1002/mas.21459, 2015.
Tumendelger, A., Toyoda, S., Yoshida, N., Shiomi, H., and Kouno, R.: Isotopocule characterization of N2O dynamics during simulated wastewater treatment under oxic and anoxic conditions, Geochem. J., 50, 105–121, https://doi.org/10.2343/geochemj.2.0390, 2016.
Werle, P., Mücke, R., and Slemr, F.: The limits of signal averaging in atmospheric trace-gas monitoring by tunable diode-laser absorption spectroscopy (TDLAS), Appl. Phys. B-Photo., 57, 131–139, https://doi.org/10.1007/BF00425997, 1993.
Wickham, H.: ggplot2: elegant graphics for data analysis, 2nd edn., Use R! Springer international publishing, Cham, https://doi.org/10.1007/978-3-319-24277-4, 2016.
WMO: WMO Greenhouse Gas Bulletin No. 20 – 28 October 2024, The State of Greenhouse Gases in the Atmosphere Based on Global Observations through 2023, WMO Greenhouse Gas Bulletin, Geneva, https://library.wmo.int/viewer/69057/#page=1&viewer=picture&o=download&n=0&q= (last access: 2 October 2026), 2024.
Wunderlin, P., Lehmann, M. F., Siegrist, H., Tuzson, B., Joss, A., Emmenegger, L., and Mohn, J.: Isotope Signatures of N2O in a Mixed Microbial Population System: Constraints on N2O Producing Pathways in Wastewater Treatment, Environ. Sci. Technol., 130118101927005, https://doi.org/10.1021/es303174x, 2013.
Yu, L., Harris, E., Lewicka‐Szczebak, D., Barthel, M., Blomberg, M. R. A., Harris, S. J., Johnson, M. S., Lehmann, M. F., Liisberg, J., Müller, C., Ostrom, N. E., Six, J., Toyoda, S., Yoshida, N., and Mohn, J.: What can we learn from N2O isotope data? – Analytics, processes and modelling, Rapid Commun. Mass Spectrom., 34, e8858, https://doi.org/10.1002/rcm.8858, 2020.
Zhou, Y., Suenaga, T., Qi, C., Riya, S., Hosomi, M., and Terada, A.: Temperature and oxygen level determine N2O respiration activities of heterotrophic N2O‐reducing bacteria: Biokinetic study, Biotechnol. Bioeng., 118, 1330–1341, https://doi.org/10.1002/bit.27654, 2021.