
the Creative Commons Attribution 4.0 License.
the Creative Commons Attribution 4.0 License.
 | 12 Oct 2026
The enhanced capabilities of mid-infrared limb emission sounding to observe stratospheric aerosol injection geoengineering
Pasquale Sellitto

Mona Kosary
Michael Höpfner
Bernd Funke
Alex Hoffmann
Jörn Ungermann
Quentin Errera
Simone Tilmes
Björn-Martin Sinnhuber
Using a model-based pseudo-reality (PR) future scenario and realistic pseudo-observations (POs) representative for a proposed satellite mission concept (CAIRT – the Changing-Atmosphere Infra-Red Tomography explorer), we analyse the capabilities of a high-spectral-resolution limb-emission sounding technique to detect and quantitatively monitor very weak stratospheric aerosol injections (SAI) geoengineering deployments, in terms of the injected sulphur dioxide (SO2) and its evolution into sulphate aerosols (SA). Our results suggest that this technique would detect SO2 injections, at the horizontal and vertical scale, within hours to a few days since the SAI deployment. This concept would quantify the SO2 injected mass, even for injections of the order of magnitude of a few hundreds of tonnes of SO2 per day, characteristic of “near-term” to “mid-term” experiments feasible even unilaterally, or in the context of small-scale outdoor experiments, with presently existing technology and at relatively low cost. In addition, our results suggest that this concept would be able to track the temporal evolution of the subsequently formed SA, as it spreads zonally and then toward higher latitudes through meridional dispersion, and to monitor changes in its vertical distribution over time through processes like self-lofting of the resulting SA plume. Existing satellite instruments, e.g. based on limb scattering, solar occultation, nadir observations and space LiDARs, do not have the capability to carry out such strategical observations of SAI. Our results stress the importance of increasing our global observational capabilities with high-spectral-resolution limb-emission satellite instruments, a capability not available at present and not foreseen in the near future.
- Article
(6264 KB) - Full-text XML
- BibTeX
- EndNote


As a result of human activity and, in particular, of the increase of anthropogenic emissions of greenhouse gases and their precursors, the global atmospheric composition and the Earth's climate system are undergoing substantial change (IPCC, 2021). Increased atmospheric concentrations of greenhouse gases, in particular carbon monoxide, methane and ozone, with respect to the pre-industrial era, have produced a significant radiative imbalance, due to the larger amount of terrestrial infrared radiation trapped in the atmosphere and therefore reduced outgoing longwave radiation from the Earth's system. This led to increasingly high global average surface temperatures and to other impacts on the climate system. Keeping the increase of surface temperature to values smaller than 1.5 or 2.0 °C with respect to the pre-industrial era has been suggested as a necessary measure to avoid large disruptions to ecosystems and societies (IPCC, 2018). However, large-scale mitigation efforts to limit anthropogenic greenhouse gases emissions might be presently insufficient to meet this target (IPCC, 2018), increasing the risks associated with climate change.
To offset anthropogenic-generated surface warming, geoengineering via stratospheric aerosol injection (SAI) has been proposed as a possible climate intervention (Crutzen, 2006; Lawrence et al., 2018), in conjunction with continued climate change mitigation and adaptation measures, and additional potential geoengineering via carbon dioxide removal from the atmosphere – see e.g. MacMartin et al. (2018) and United Nations Environment Programme (2023) for further discussions. The SAI techniques are based on artificial injections of sulphur dioxide (SO2) into the stratosphere with the aim of enhancing the formation of highly reflective and small-sized/long-lived sulphate aerosol (SA) particles in the stratosphere. Such enhanced layers of SA in the stratosphere could effectively scatter back an additional part of the incoming solar radiative flux, compared to background conditions, to counterbalance the reduction of outgoing longwave fluxes associated with the increase of greenhouse gas concentrations from anthropogenic emission. As such, SAI deployments would mimic the episodic natural occurrence of volcanic eruptions strong enough to inject their emissions into the stratosphere. Such stratospheric volcanic eruptions, including a number of events occurring during the satellite era, have been indeed associated with marked increases of stratospheric aerosol content and aerosol optical depth (AOD) (e.g. Kloss et al., 2021; Sellitto et al., 2022). In turns, this has been associated, in some cases, to temporary global mean temperature decreases of a few tenths of a degree Celsius (e.g. Ridley et al., 2014) to up to more than 1 °C, e.g. following the eruption of Mount Pinatubo (Philippines) in 1991 (e.g. Thompson et al., 2009). Presently, SAI techniques receive a considerable attention as potential interventions to rapidly reduce global warming (e.g., Helwegen et al., 2019), while being highly controversial. Several unwanted side effects have also been associated with SAI. These include regional effects on precipitation and induced inter-hemispheric and pole-to-equator gradients in surface temperature (Kravitz et al., 2019), as well as unintended modifications of the chemical composition of the stratosphere. Of particular concern is the expected thinning of the stratospheric ozone layer, which would significantly delay the recovery from the Antarctic ozone hole phenomenology (Tilmes et al., 2008). Importantly, a sudden termination of SAI deployment could potentially cause a catastrophic rapid and severe warming, due to different atmospheric lifetimes of greenhouse gases and SA, called the “termination shock”. This would require SAI deployments to be continuous and their reversal to termination be carried out with extreme caution (Bronsther and Xu, 2025). Many of the desired and undesired effects of possible SAI deployments have been recently studied with numerical modelling, including the modelling experiments of the Geoengineering Model Intercomparison Project (GeoMIP), during the latest Coupled Model Intercomparison Project Phase 6 (CMIP6) (e.g. Kravitz et al., 2015).
In addition to the mentioned considerable uncertainties in terms of impacts and risks, many questions remain in terms of global governance of geoengineering techniques, in particular for SAI. The deployment of SAI techniques outside a shared global governance framework has been identified as a potential source of societal risks, including of international conflicts, due to their intrinsic transboundary effects (United Nations Environment Programme, 2023). Unfortunately, such a global SAI governance framework still does not exist to date, even though the urgent need for such a framework was emphasised by different international (e.g. United Nations Environment Programme, 2023; European Parliament, 2026) and national institutions (e.g. Consortium National Interdisciplinary Climate Risk Assessment, 2025; Académie des Sciences, 2025). In the following, we will refer to hypothetical SAI deployments carried out outside global international agreements as “unilateral SAI deployments”. Inter-governmental debate, a coordinated global governance and continuing research-driven assessments of risks and opportunities of possible SAI deployments continue nowadays to be required before any potential deployment could even be considered (Bellamy, 2025).
Monitoring, testing and verifying impacts of SAI, in particular for potential unilateral and uncoordinated SAI deployments, including small-scale outdoor experiment, is key in this phase. Despite the likely very small impacts on the radiative balance and climate system, this kind of weak deployments and tests are of a particular concern because they are widely considered an entry point to larger-scale uncoordinated SAI deployments (e.g. United Nations Environment Programme, 2023). Thus, particularly important is the evaluation of the global capabilities to detect these possible actions, even those at very small scale in terms of SO2 injection rates and geographical extent. Due to their global coverage, continuous operation, and ability to observe areas that are not physically accessible to in situ instruments or field campaigns, satellite observing systems are natural candidates for continuous operational monitoring to detect these activities. Stratospheric impacts of various recent moderate volcanic eruptions, natural analogues of SAI deployments, have been successfully observed and characterised with different existing satellite-based techniques, including limb scattering (e.g. Taha et al., 2022), solar occultation (e.g. Wrana et al., 2023), space LiDARs (e.g. Vernier et al., 2011; Duchamp et al., 2026; Khaykin et al., 2026) and nadir-viewing instruments (e.g. Haywood et al., 2010; Sellitto et al., 2024). Although the detection and characterisation of SO2 injections and subsequent SA formation for these volcanic events are relatively demanding, due to the relatively small amounts of SO2 injected and SA perturbations in the stratosphere compared to a full-blown SAI deployment, there are still fundamental differences with respect to initial or exploratory SAI at the regional scale, that could even be carried out nowadays (e.g. https://makesunsets.com/, last access: 8 October 2026). First, unilateral tests of SAI might be realised with extremely small amounts of SO2 injections, producing very small SA burdens. These are what can be defined as “near-term” or “mid-term SAI experiments”, i.e. stratospheric injections of only a few kilograms to a few hundreds of tonnes of SO2, for example using stratospheric balloons. These experiments are considered feasible even with presently existing technology and relatively low cost (between USD 10 million and USD 100 million, following studies under the EU-funded Co-Create project, https://co-create-project.eu/, last access: 8 October 2026). A typical moderate volcanic eruption with stratospheric injection, like those mentioned above, injects a few Tg of SO2 into the stratosphere, an amount that is tens of thousands to billion times larger than for this kind of exploratory SAI experiments. In addition, exploratory SAI dynamics (small injection rates at high altitude) differ from what is observed for volcanic eruptions, where a quasi-linear correlation between the magnitude of the SO2 injected mass and altitude has been found (Carn et al., 2016). In addition, volcanic eruptions generally produce SO2 injections over short time interval while SAI deployments are based on continuous injections with consequently smaller SO2 injection rates. Regarding the formed SA, moderate stratospheric eruptions can increase the background stratospheric aerosol extinction by orders of magnitude (e.g. Kloss et al., 2021). In contrast, for the small-sized near- and mid-term SAI experiments this perturbation might be difficult to distinguish from the background stratospheric levels.
The purpose of the case study presented here is to assess the capabilities of the high-spectral-resolution mid-infrared limb emission sounding satellite technique to detect the deployment of exploratory SAI interventions and to monitor their impact at a short-term time scale. This technique is modelled around the Changing-Atmosphere Infra-Red Tomography explorer (CAIRT) mission concept, one of the candidates to the European Space Agency (ESA) Earth Explorer 11 mission definition and feasibility studies (Phase 0/A). In this study, we specifically analyse the new capabilities of the CAIRT mission concept to simultaneously observe and characterise small injections of SO2 and the subsequently formed SA in case of early SAI experiments.
The CAIRT concept is introduced in Sect. 2. To generate realistic SAI scenarios, we use available global model fields from existing GeoMIP simulations, as synthetic reality (also called the pseudo-reality, PR, in this paper) (discussed in Sect. 3.1). From these, CAIRT pseudo-observations (PO) are obtained by sampling the modelled scenario datasets using a CAIRT scene generator and emulating the expected CAIRT observational performances by applying the CAIRT Fast Level 2 Simulator (FL2S) (discussed in Sect. 3.2). We assess the capabilities of CAIRT to detect the extremely small amounts of SO2 injected during the very first phases of SAI deployment in our PR scenarios, which has magnitudes consistent with near- or mid-term SAI experiments (Sect. 4.1). Then, we investigate the capabilities of CAIRT to quantify the perturbation of the stratospheric aerosol layer associated with the conversion of SO2 to SA, and to track its spatiotemporal variability (Sect. 4.2). These analyses evaluate whether CAIRT and CAIRT-like instruments could detect low-level SAI actions, which might include unilateral use of solar geoengineering techniques, a scenario considered increasingly likely to happen (Rabitz, 2016). The present capabilities to detect this kind of early SAI deployment with existing and future satellite instruments, and the added value brought by CAIRT-like instruments, are discussed in Sect. 5. Conclusions are given in Sect. 6.
The CAIRT concept (European Space Agency, 2025) was one of the four candidate missions down-selected within the European Space Agency (ESA) Earth Explorer 11 call. It was envisaged as the first limb sounder with imaging Fourier-transform thermal infrared (FTIR) technology in space, thus providing high-spectral resolution and vertically resolved infrared limb emission spectra with an additional across-track dimension. These spectra would allow unprecedented three-dimensional observations of numerous key parameters to characterise the atmospheric dynamics and composition from a limb geometry, throughout the middle atmosphere, including in the upper-troposphere and stratosphere (UTS). Thanks to an imaging array of thermal infrared (TIR) detectors, CAIRT would observe the limb at tangent heights from 5 to 115 km altitude continuously along the satellite track, and with a horizontal swath of 300 to 500 km for each overpass. This would provide vertical profiles of trace gases and aerosols, with vertical resolution between 1 and 3 km, and of temperature, with vertical resolution ≤ 2 km, in the upper troposphere and stratosphere. The horizontal resolution is between 100 and 300 km, with spatial sampling targets of 25–50 km across-track and 50 km along-track. The vertical coverage of CAIRT is driven by the need to observe key dynamical and chemical processes throughout the entire depth of the middle atmosphere. The CAIRT spacecraft was proposed to fly in a sun-synchronous orbit with a local time of descending node at 09:30 and a 29 d repeat cycle, in loose formation and with temporal co-registration with MetOp-SG. The instrument was expected to operate in the mid-infrared from 718 to 2200 cm−1 (4.55 to 13.93 µm), with a spectral resolution of ≤ 0.25 cm−1. Radiometric sensitivity, specified in terms of the noise equivalent spectral radiance, and radiometric offset and gain uncertainties, were stringently limited: additive offsets must remain below 3 (in the longwave infrared) and 0.3 nW cm−2 sr−1 cm−1, while gain errors must be < 1 %. The instrument's vertical instantaneous field of view is required to be ≤ 1.4 km below 80 km altitude and ≤ 3 km above. Tangent point altitude knowledge must be maintained within < 500 m. A summary of all major CAIRT requirements is provided in the CAIRT Report for Mission Selection (European Space Agency, 2025). The total uncertainty budget and vertical/horizontal resolution of SO2 molar fraction and SA mass fraction retrievals, the parameters analysed in this study, are discussed in Sect. 3.2. The CAIRT mission was designed for a duration (lifetime) of at least five years, and this study is set around the 2030s, the programmatic timeframe of Earth Explorer 11 operations. Unfortunately, CAIRT was not finally selected for implementation within the Earth Explorer 11 programme. Nevertheless, its scientific goals were recognised as timely and important. The mission concept remains unique in its potential to observe middle atmospheric gasses, particles and their inherent processes with high vertical and horizontal resolution (Sinnhuber et al., 2026).
3.1 The solar geoengineering scenario
The pseudo-reality (PR) used in the present case study is obtained from the Community Earth System Model version 2 (CESM2) simulations with version 6 of the Whole Atmosphere Community Climate Model (WACCM6), as described by Tilmes et al. (2020) and available at the following repository: https://rda.ucar.edu/datasets/d651024/ (last access: 8 October 2026). All the modelling experiments used in this work were realised in the context of the Coupled Model Intercomparison Project Phase 6 (CMIP6) (Eyring et al., 2010) and the GeoMIP (Geoengineering Model Intercomparison Project) project. The CESM2(WACCM6) model uses a finite-volume dynamical core (Gettelman et al., 2019) with a horizontal resolution of 1.25° longitude × 0.95° latitude and 70 vertical levels extending from the surface up to approximately 140 km in the lower thermosphere. The model includes a prognostic treatment of stratospheric aerosols derived from volcanic and anthropogenic sulphur emissions (Mills et al., 2017), enabling realistic simulation of aerosol-related radiative and chemical processes. These simulations are based on the SSP5-34-OS “overshoot” social development pathway (O'Neill et al., 2016). The general SSP5 group of scenarios is associated with a fossil-energy-intensive economy with a relatively optimistic trend for global societal development with respect to other SSP scenarios. Based on this, SSP5-OS-34 postulates a change of behaviour in the consumption of fossil fuel and related emissions, and assumes large amounts of carbon removal after the 2050–2060 decades. This produces a carbon dioxide concentration overshoot and a surface temperature profile that significantly overshoots the required temperature target before 2100.
Starting from the SSP5-34-OS baseline, modelling experiments are realised to account for an additional SAI deployment. In this paper, we use in particular the Geo SSP5-34-OS 2.0 scenario (Tilmes et al., 2020). In this solar geoengineering simulation, on top of the SSP5-34-OS baseline stratospheric sulphur injections are added, with the aim of limiting the global temperature increase to 2.0 °C above 1850–1900 conditions. For this experiment, SO2 injections were applied at four predefined latitudes, 30° N, 15° N, 15° S, and 30° S, and at altitudes between approximately 20 and 25 km (see Fig. 2 in Tilmes et al., 2020), to reach three surface temperature targets: global mean temperature limited at 2.0 °C above 1850–1900 conditions, and limited inter-hemispheric and pole-to-equator temperature gradients. The SAI deployment is tailored using a feedback injection algorithm, determining the time series of the SO2 injection rates at the four latitudes to reach the aforementioned targets. More specifically, for an entire year, the same injection rate was used, and then adjusted in the next year. We note that in the first year (2034), which is the main temporal interval targeted in this paper, the feedback algorithm chose to inject only at 15° N, 15° S while it continued with injections also at the other latitudes (30° N, 30° S) in the following years. Here, we have used the Geo SSP5-34-OS 2.0 scenario as our PR, which is basically characterised by smaller injections than the other CESM2(WACCM6) GeoMIP experiments (Tilmes et al., 2020). As mentioned in the Introduction, in this paper we test the capability of CAIRT-like instruments to detect and quantitatively characterise small SO2 injections and their effects, to represent the possible case of a near-term SAI experiment, a unilateral weak SAI deployment or a field experiment. Our PR scenario is meant to be a representative case in terms of the magnitude of the SO2 injections, but it is important to stress that it would be quite unlikely that such possible deliberate injections take place in the injection points of this specific scenario (over oceanic regions in the tropics). Despite this, our study does not loose generality, since it revolves around analyses of the observable magnitude of the resulting SO2 and SA fields. The present case study is focused on the ESA Earth Explorer 11 timeframe in which CAIRT was embedded. This is associated with a slow start of the SO2 injection rate, with SO2 releases starting in the year 2034. For the year 2034, the average SO2 emission flux is 0.035 Tg yr−1 (∼0.003 Tg per month or ∼ 1.1 kg s−1), at 15° N, and 0.005 Tg yr−1 (∼ 0.0004 Tg per month or 0.16 kg s−1), at 15° S. Then, global amounts of the injected SO2 rises from less than a tenth Tg of SO2 per year to a few Tg of SO2 per year in the 2040s. Due to the increasing surface temperatures until 2050, the injection rates increase dramatically and reach their maximum around 2050, before decreasing afterwards to intermediate values. Individual daily SO2 injections, in 2034, are of only a few hundreds of tonnes of SO2 (∼ 15 t at 15° S and ∼ 100 t at 15° N). Even when considering the overall annual injection in this PR scenario in the late 2030s and 2040s, this corresponds to the order of magnitude of stratospheric injections of quite moderate, if not small, stratospheric volcanic eruptions (e.g., Schmidt et al., 2018). For example, the recent eruption of Hunga volcano (Kingdom of Tonga) injected around 1.0 Tg of SO2 (Sellitto et al., 2024), while climate-relevant eruptions, like the one in 1991 from Mount Pinatubo (Philippines), can reach values as large as 15–20 Tg of SO2 (e.g. Aubry et al., 2021).
The first study presented hereafter (Sect. 4.1) aims at evaluating the capabilities of CAIRT to detect the extremely small amounts of the individual SO2 injections. To test this on an extreme case, we study here the very first individual SO2 injections in the Geo SSP5-34-OS 2.0 PR scenario, occurring in January–February 2034. In this time frame, as mentioned before, the spatial breakdown of the SO2 injection is dominated by an injection at 15° N, with smaller injections in the Southern Hemisphere. Figure 1a–c show the SO2 mixing ratio around the injection altitude (at 25 km altitude in the figure), right before (Fig. 1a), during and after these first injections (Fig. 1b–c), in our selected PR. Then, we study SA formation in the first year (2034) following this initial injection phase (in Sect. 4.2). The CESM2(WACCM6) PR provides SA concentration for 3 size bins (nucleation, accumulation and coarse mode); in most of the analyses of Sect. 4.2, these modes are aggregated to obtain a total SA mass burden. Figure 1d shows the SA column burden for this PR scenario, during the first 10 years of the experiment (2033–2042), and puts this first year (identified with red vertical dotted lines) into a larger temporal context. The overall SA burden during the year 2034 is several times smaller than in the following decade and more than 2 orders of magnitude smaller than in the period 2070–2080 (not shown here).
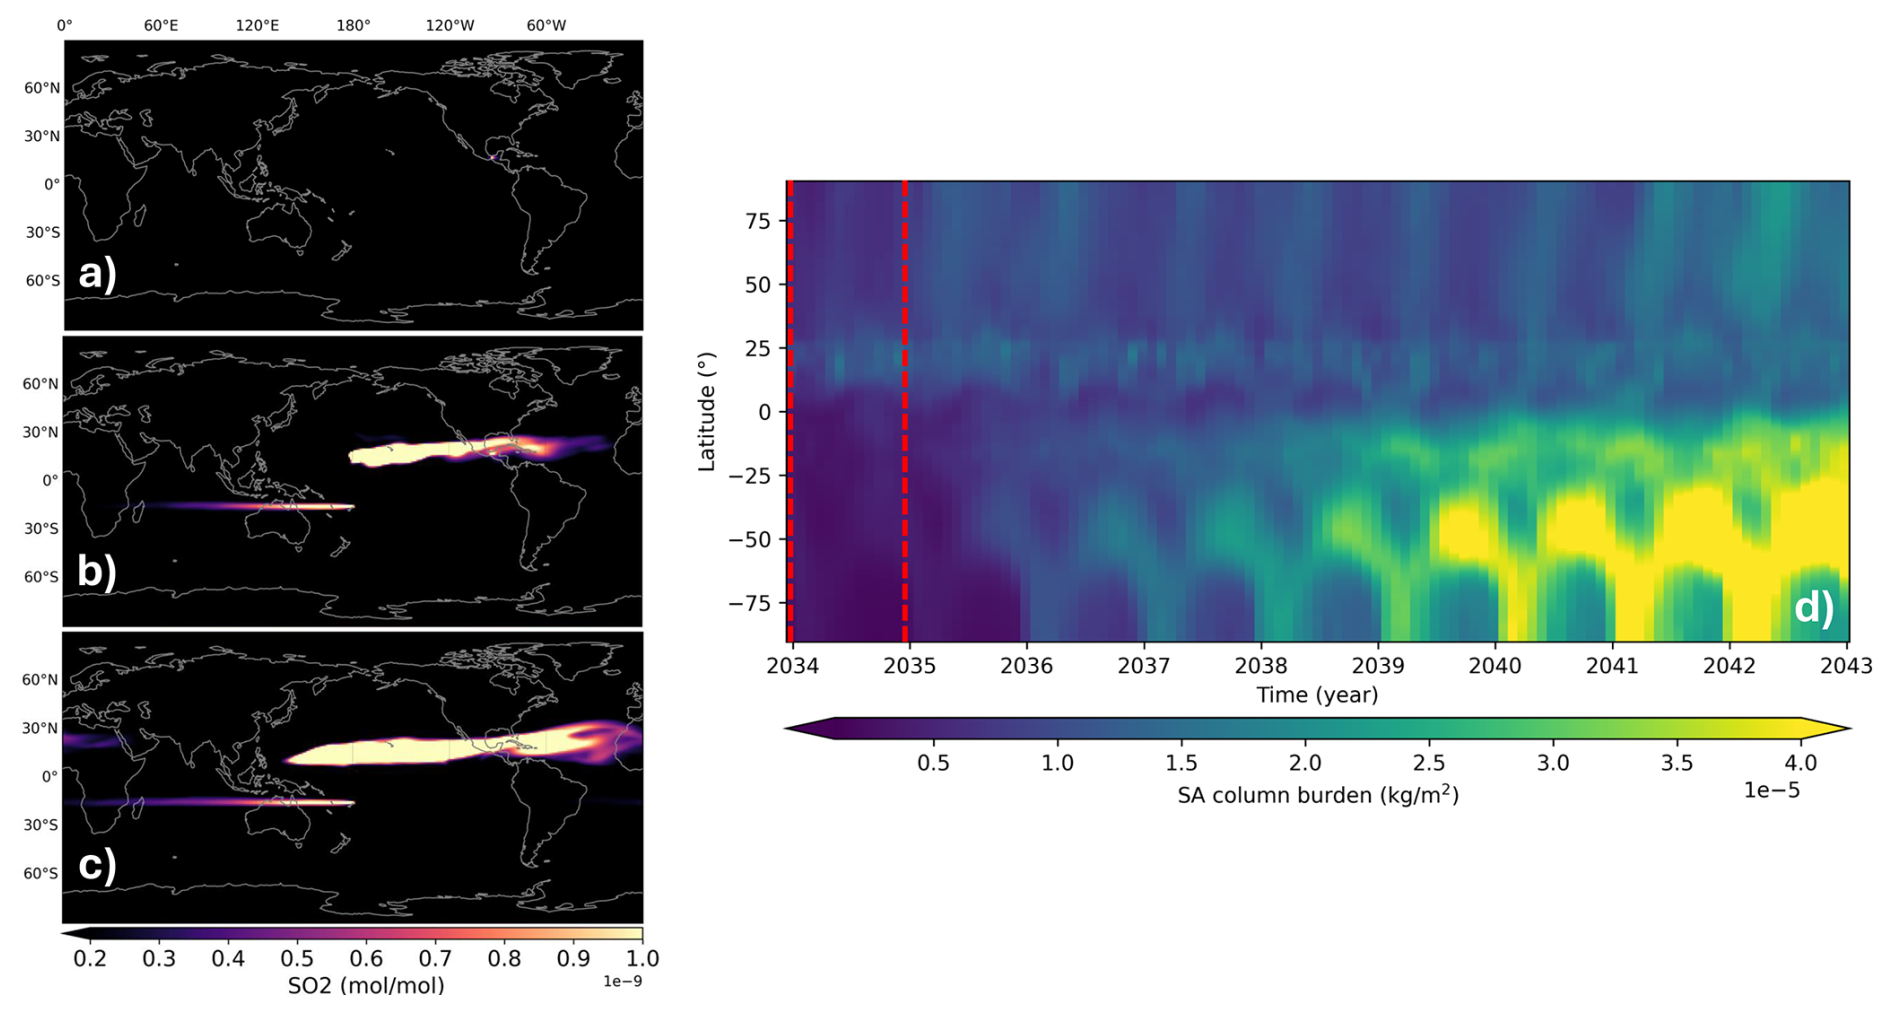
Figure 1(a–c) SO2 mixing ratio at 25 km altitude for December 2033, January and February 2034 for the Geo SSP5-34-OS 2.0 PR scenario. (d) Zonal average SA column burden in the period 2033–2042; the period addressed in this study, 2033–2034, is delimited by the dashed red lines.
3.2 The CAIRT pseudo-observations simulator
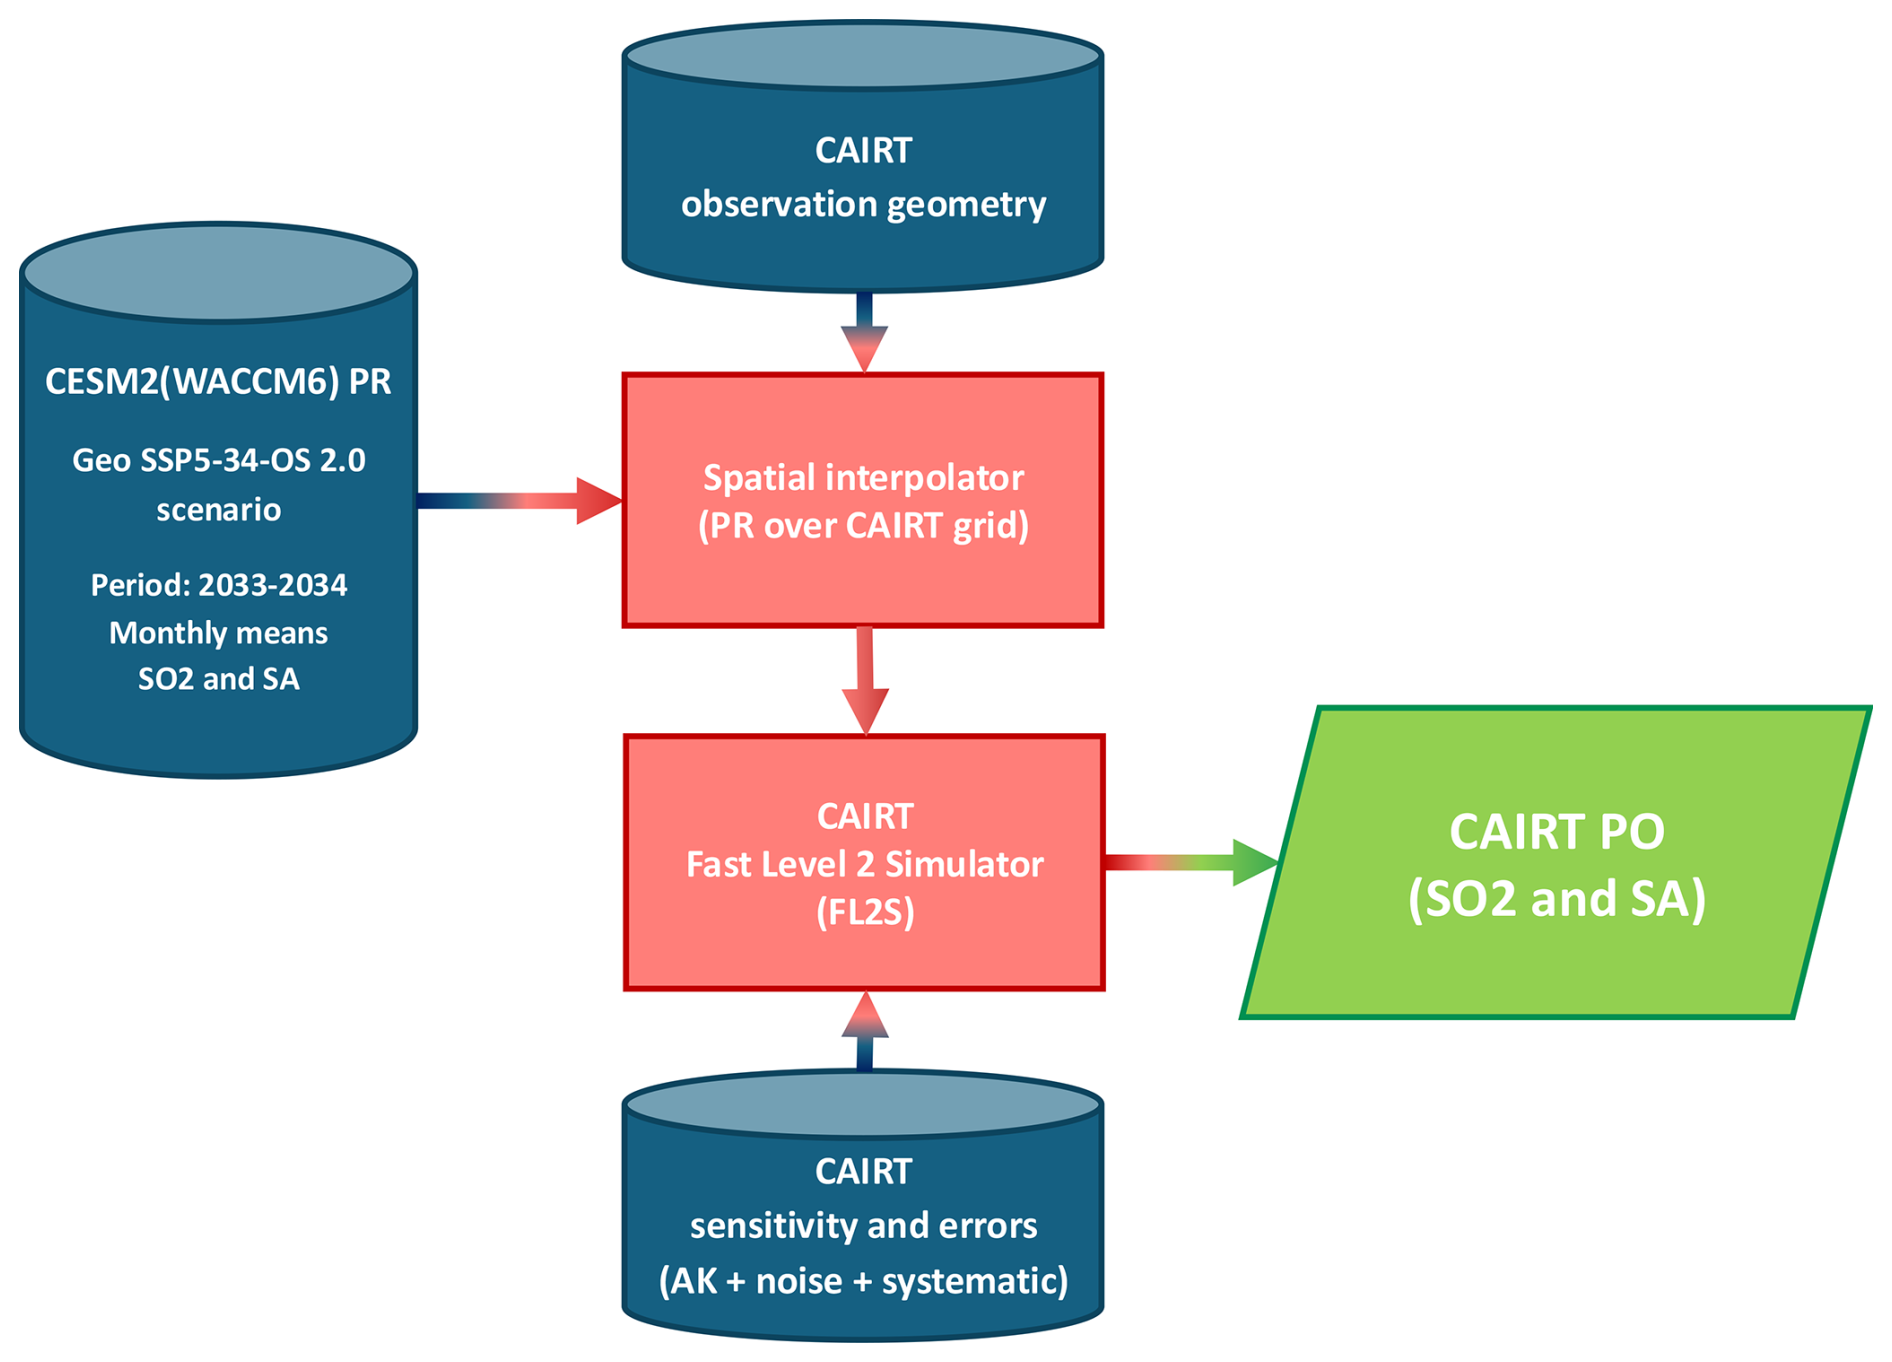
Based on the PR scenarios discussed in Sect. 3.1, we produced CAIRT POs using a two-step processing chain, with the CAIRT PO simulator shown in Fig. 2. First, we projected the CESM2(WACCM6) simulations PR onto the CAIRT retrieval grid along the orbital track, using a spatial interpolator as the CAIRT scene generator. Based on the CAIRT observation geometry developed during the CAIRT Phase 0 Scientific and Requirement Consolidation studies (SciReC), 1 d along-track segments covering ∼ 15 daily orbits were simulated, with a ∼ 1 km vertical grid and with 5 samples in the across-track direction. In practice, representative POs are obtained using one daily CAIRT tracks and monthly means PR. Thus, we obtain an intermediate data set, referred to as “PR over CAIRT grid”. Second, the PR over CAIRT grid data set is fed into the Fast Level 2 Simulator (FL2S, Höpfner et al., 2025; Funke et al., 2026). During this step, the impact of CAIRT's measurement performances (spatial smoothing and the propagation of random and systematic errors onto the CAIRT synthetic observations) was simulated. These uncertainty impacts were estimated based on calculations with the CAIRT linear performance estimator (LPE, Höpfner et al., 2025; Funke et al., 2026), realised during CAIRT Phase A Performance and Requirement Consolidation studies (PerReC). This processing chain is applied to SO2 and SA PR data sets (each with their own averaging kernels, measurement and systematic errors from Phase A studies).
The SO2 amounts are obtained through the exploitation of its ν1 and ν3 rotational-vibrational absorption/emission bands in the range 1000–1200 and 1300–1410 cm−1 (8.7 and 7.3 µm) (e.g. Carboni et al., 2012; Höpfner et al., 2015). The spectral absorption/emission signatures of SA peaking around 900 and 1200 cm−1 (12.5 and 8.3 µm), due to the peak of the imaginary part of the refractive index of SA particles, in particular due to the undissociated sulphuric acid in the SA droplets for their large acidity at stratospheric conditions (Sellitto and Legras, 2016; Günther et al., 2018), is used to observe the formed SA particles. Figure 3 shows the vertical and horizontal resolutions, and the random, systematic and total error budget of the individual CAIRT SO2 and SA POs. Typical vertical resolutions of 2 to 4 km, for SO2, and 1.5 to 2.5 km, for SA are found in the vertical range of interest for SAI. For the horizontal resolution, typical values of 100 to 220 km, for SO2, and 50 to 70 km, for SA, are found. The total uncertainty budget of SO2 mixing ratio (molar fraction) and SA mixing ratio (mass fraction) retrievals is largely dominated by the random error and has typical values of 0.15–0.25 × 10⁻⁹ mol mol−1, for SO2, and 1.0–1.5 × 10⁻⁹ kg kg−1, for SA. These uncertainties are very close to typical background unperturbed stratospheric mixing ratios of SO2 and SA (about 0.10 × 10⁻⁹ mol mol−1 and 1.0 kg kg−1, for SO2 and SA, respectively, see Günter et al., 2018). A significantly larger sensitivity of infrared spectra to SA than SO2 was found in the past for both nadir (Guermazi et al., 2017) and limb observations (Günther et al., 2018), which is also observed in CAIRT PO.
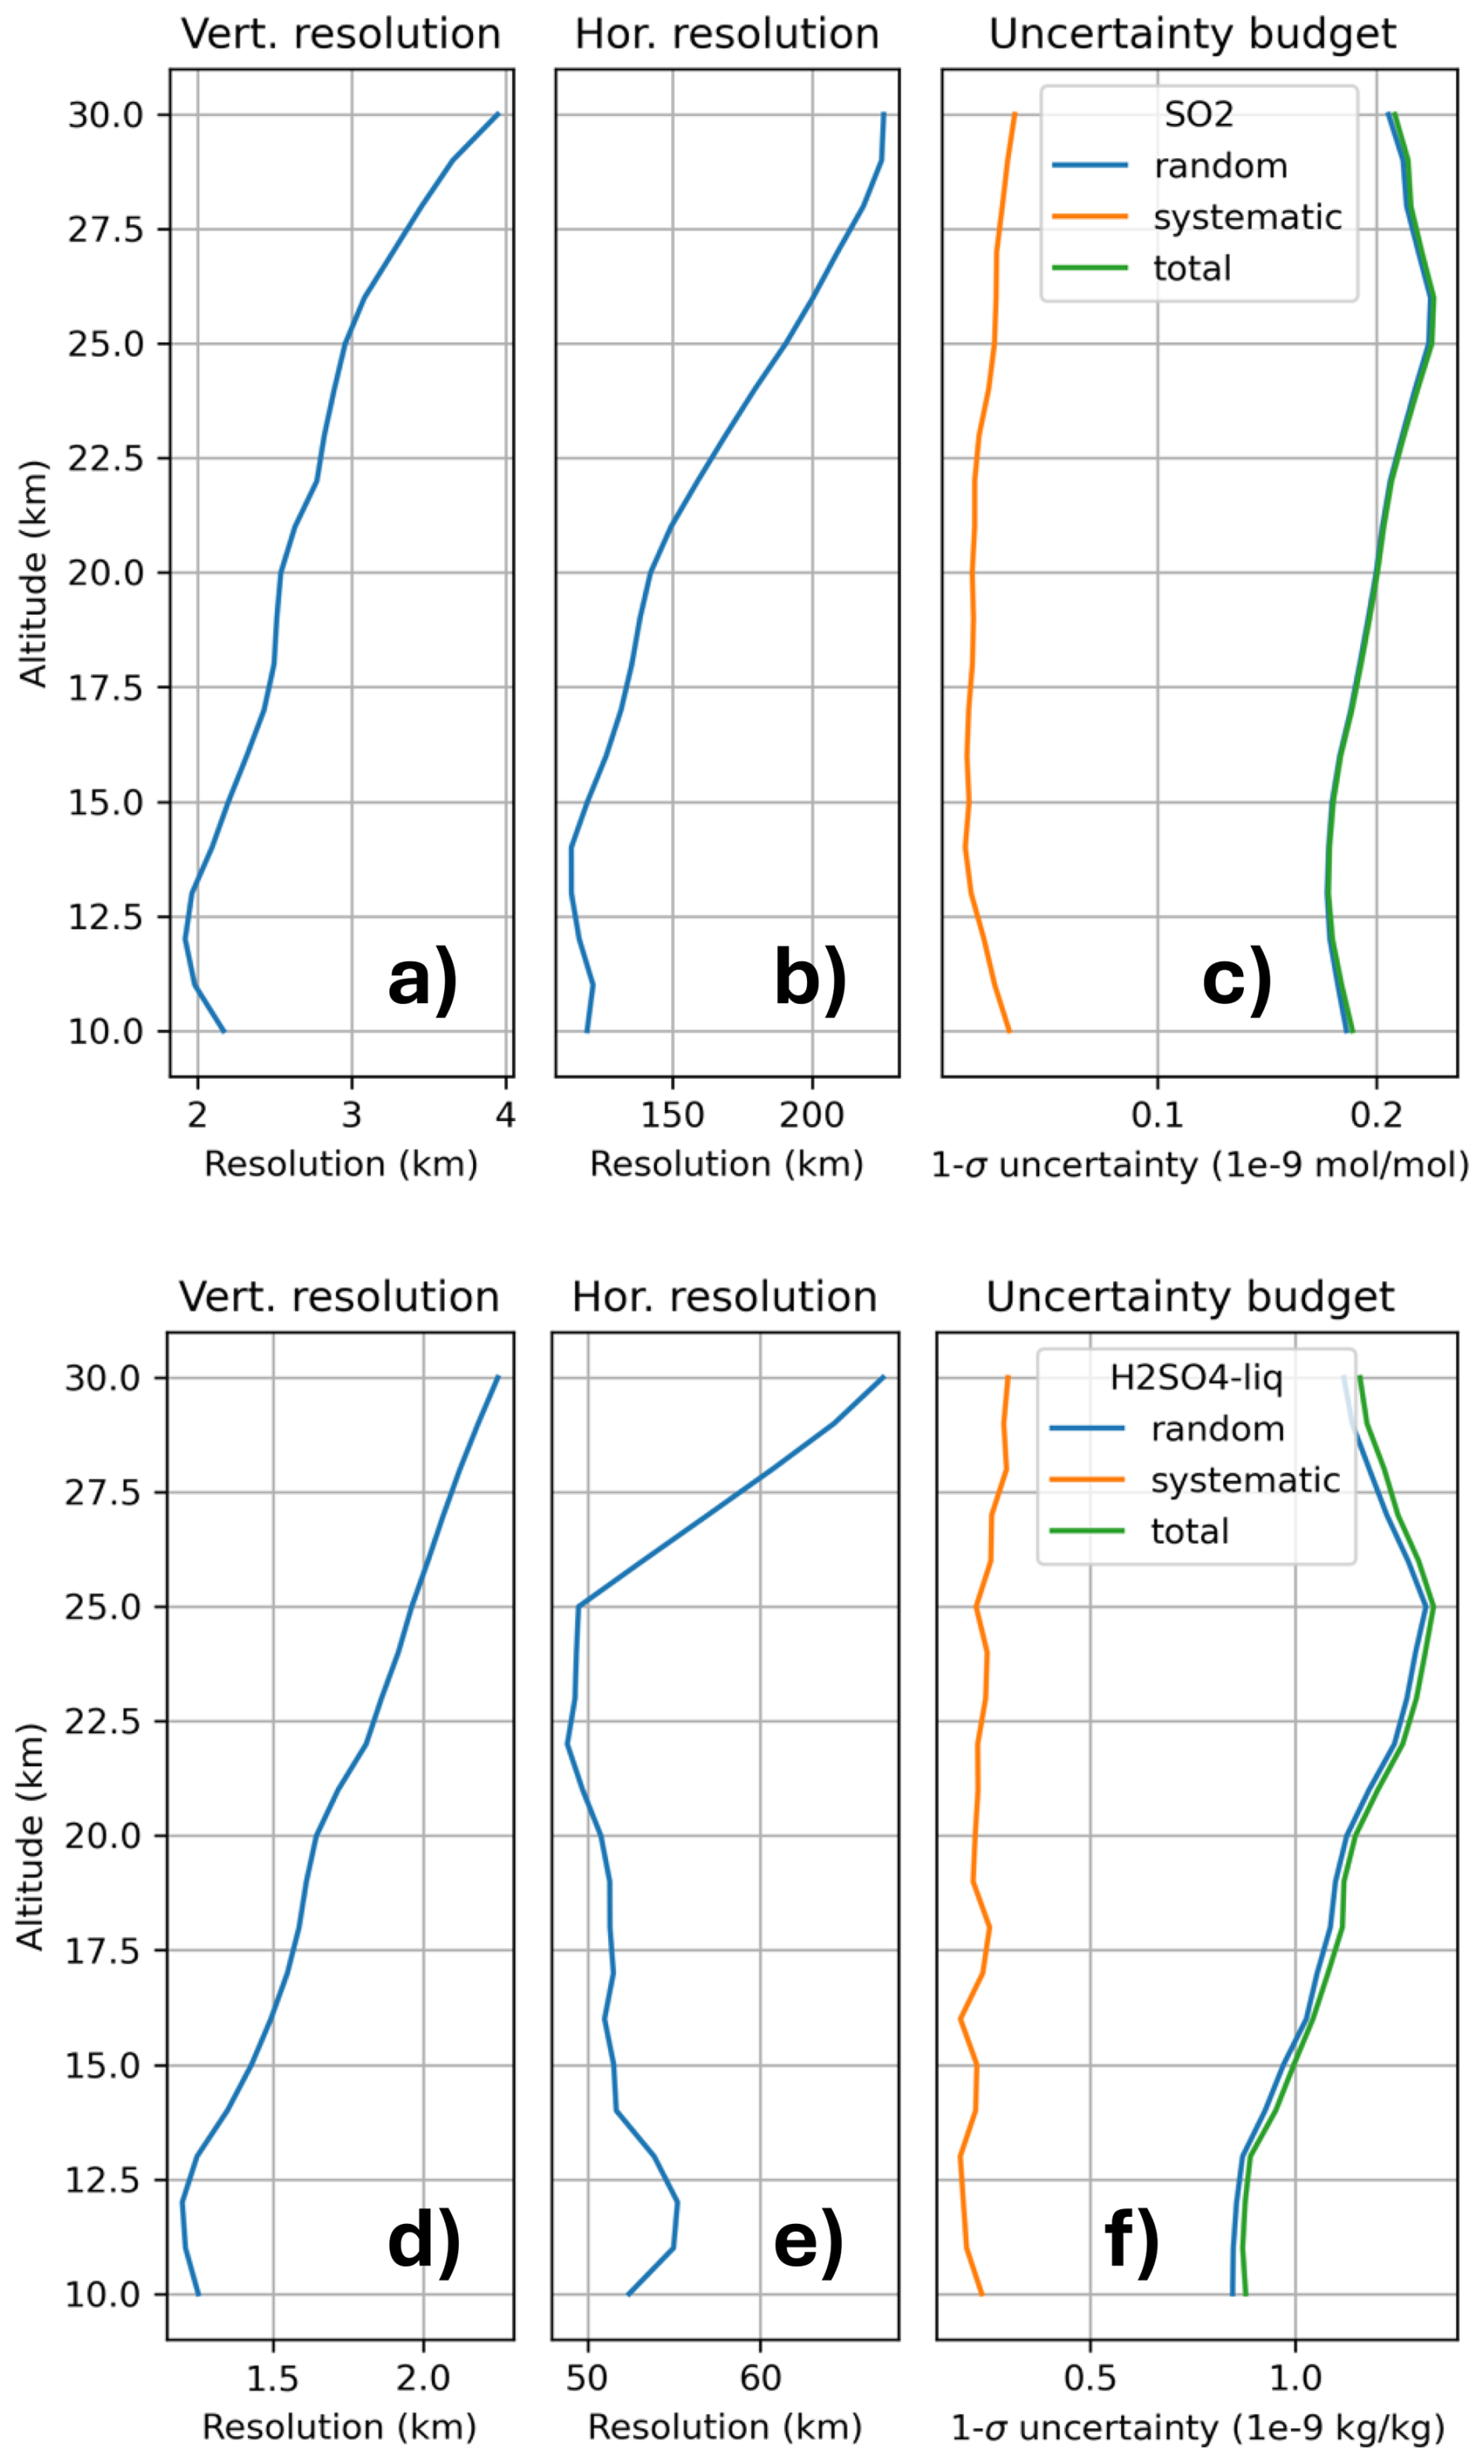
Figure 3Vertical profile of the vertical (a, d) and horizontal resolutions (b, e) and of the uncertainty budget (c, f) for SO2 (a–c) and SA CAIRT PO retrievals (d–f). In panels (c) and (f), the blue, orange and green curves represent the random, systematic and total uncertainties, respectively. The vertical and horizontal resolution and the uncertainty budget, for both SO2 and SA, are representative of individual retrievals with 100 km across-track binning.
The output of the CAIRT PO simulator of Fig. 2 are the SO2 and SA (3 modes, then aggregate to get total SA mass) CAIRT POs, i.e. realistic synthetic observations based on the CAIRT expected sensitivity and uncertainty budget.
4.1 Detecting the SO2 injections
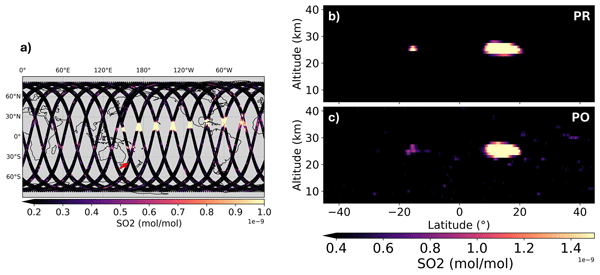
As mentioned in Sect. 3, the CAIRT sensor and CAIRT-like high-spectral-resolution thermal infrared instruments, can observe SO2 by exploiting its absorption/emission bands in the infrared region. Figure 4a shows the global map of the monthly average CAIRT SO2 PO (on one representative daily segment of 15 orbits). for February 2034, at 25 km altitudes (approximately corresponding to the PR of Fig. 1c). Both the spatial location of the SO2 injections, at 15° N and 15° S, and the first dispersion and chemical sink, for this first SAI action in the Geo SSP5-34-OS 2.0 PR scenario, are detected with CAIRT POs (compare with Fig. 1c). Figure 4b–c show the across-track average vertical SO2 profiles PR and CAIRT PO, for February 2034, for the selected CAIRT orbit segment individuated in Fig. 4a. The latitude location of the two SO2 injections and their altitude (15° N and S, at 25–30 km altitude) are well captured with CAIRT PO. Dynamical features of the SO2 plume, e.g. the descent in altitude, the rapid zonal dispersion and, then, the transport towards higher latitudes (more evident for the northern hemispheric SO2 injections), are also seen by CAIRT POs. The weaker SO2 injection in the Southern Hemisphere (cumulated injected SO2 mass less than a few hundreds tonnes overall until end February 2034) was also detected with CAIRT PO albeit being closer to the detection limit (but still well beyond that limit). From Fig. 4, it can be seen that even the smaller SO2 injections in the Southern Hemisphere, though several order of magnitude smaller than moderate volcanic eruptions, are well beyond the estimated total error of CAIRT SO2 retrievals. Limited and isolated pixel-wise small positive values are also noticeable in areas where the PR points at zero-values (e.g. around 40° N and 30 km altitude). These can be attributed to random PO errors and are still easily morphologically distinguishable from the identified plume-shaped and multi-pixels detection areas.
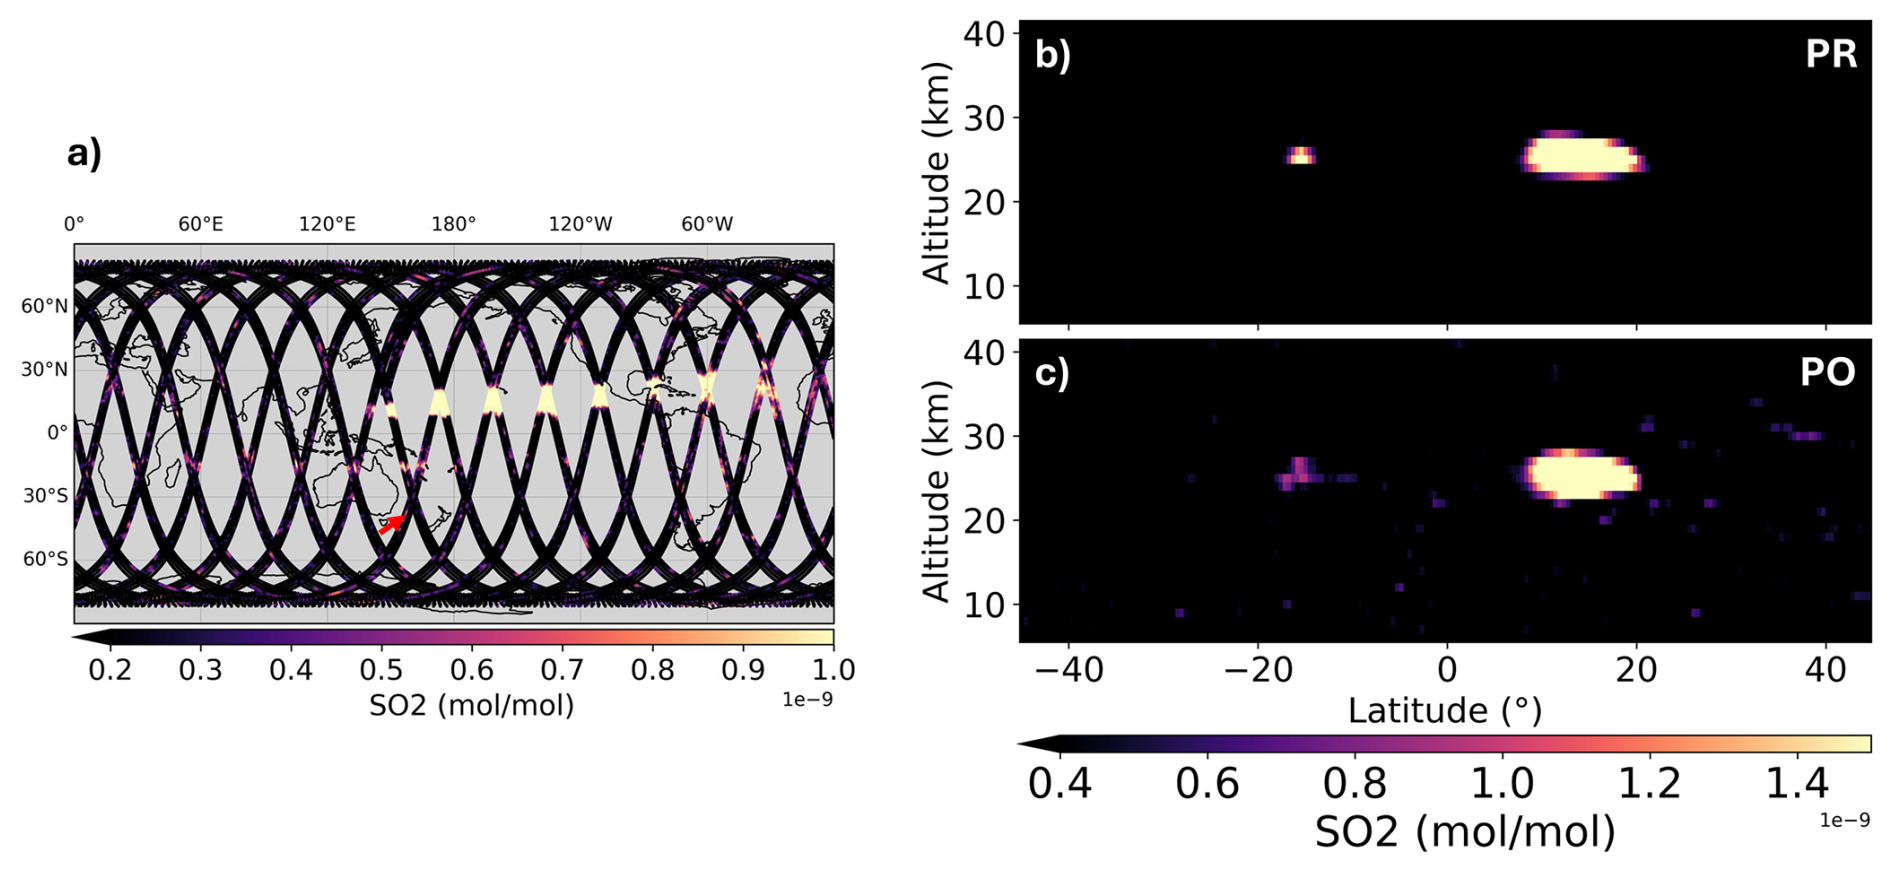
Figure 4(a) CAIRT POs of the SO2 mixing ratio for February 2034, at 25 km altitude. (b–c) Across-track average PR (b) and CAIRT PO (c) of the SO2 vertical profiles, for the orbit segment individuated with a red arrow in panel (a).
Figure 5 shows the average vertical PR and CAIRT PO SO2 profiles, around the injection points at 15° S (Fig. 5a) and 15° N (Fig. 4b), individuated in Fig. 4b–c. It is important to stress that what is shown in Figs. 1a–c and 4–5 are very weak initial SAI interventions, in the simulated SAI protocol of Geo SSP5-34-OS 2.0 PR scenario. The total SO2 mass values intercepted by this specific CAIRT orbit segment, in the area impacted by the two injection points, is 0.5 t (injection at 15° S, Fig. 5a) and 3.4 t (injection at 15° N, Fig. 5b), respectively. More in general, the total SO2 injected mass in the PR scenario, cumulated until end February 2034 (SO2 PR of Fig. 1c) does not exceed a few hundreds tonnes. As mentioned in the Introduction, these injections can be seen as analogues of “near-term” to “mid-term” experiments, i.e. scenarios considered feasible even with presently existing technology and relatively low cost. As shown in Figs. 4–5, CAIRT would be capable of detecting such deliberate releases, even those as small as those described in this work. In particular, CAIRT would be able to determine the geographical location, altitude, and quantitative amount (CAIRT POs: 0.4 and 3.1 t, in the area impacted by the two injection points, see caption of Fig. 5) of the injection, though possibly with a small bias (around 10 % and 25 % underestimation of the larger and smaller injection points, respectively, see caption of Fig. 5). Therefore, instruments like CAIRT would provide a unique capability to detect and quantitatively assess unilateral SAI tests or small-scale outdoor deployments within just hours to a few days from the injection, due to their high sensitivity and dense spatiotemporal coverage.
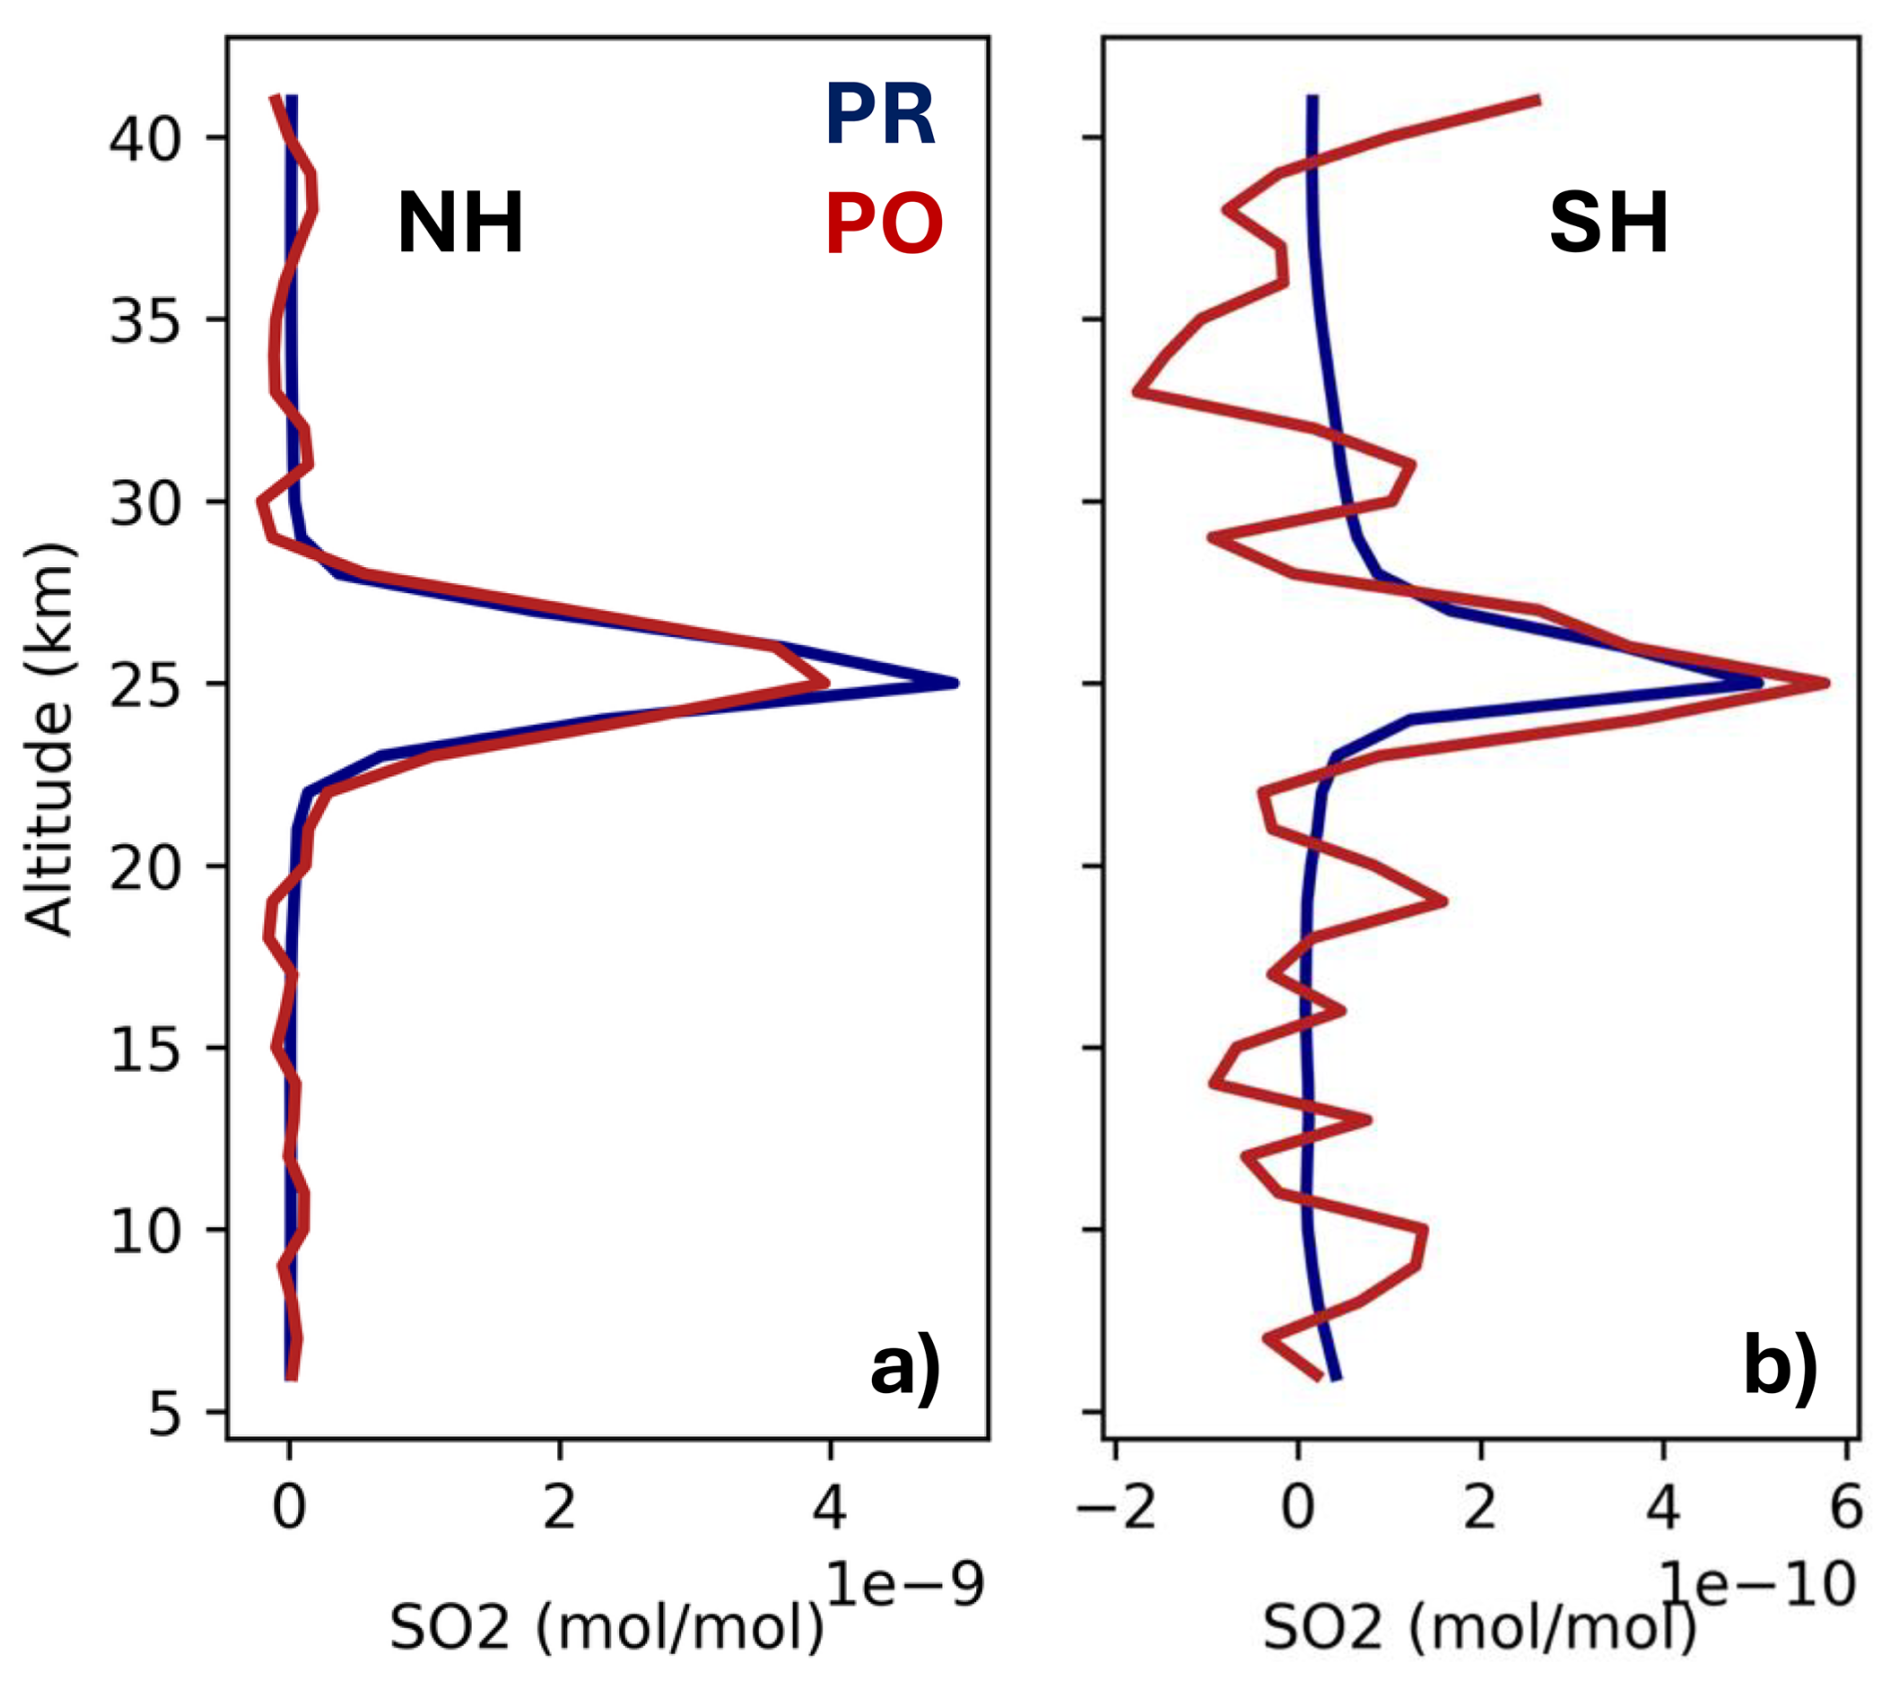
Figure 5Average vertical SO2 profiles, PR (blue lines) and CAIRT PO (red lines), for the two SO2 injection points visible in Fig. 4b–c (a: injection point in the NH, at 15° N; b: injection point in the SH, at 15° S). The total SO2 mass intercepted by the CAIRT POs, for the two injection points, is (a) 3.1 t (PR: 3.4 t) and (b) 0.4 t (PR: 0.5 t).
4.2 Tracking the SA formation and progression
The SO2 injections, as those discussed in Sect. 4.1 for this specific experiment, are then converted to solar-radiation-reflecting SA particles in the stratosphere, over timescales of a few weeks-to-months (e.g. Stevenson et al., 2003). In addition to detecting SO2 injections, CAIRT and CAIRT-like high-spectral-resolution thermal infrared instruments can observe SA by exploiting their spectral signatures in the infrared region (Sellitto and Legras, 2016; Günther et al., 2018). Figure 6 shows the time series, for the year 2034, of monthly average meridional mean total SA mass concentration (adding up the three SA modes), at the approximate altitude of SO2 injection of 25 km, for both the PR and PO, as well as their absolute difference. The SO2 injection occurs between 150 and 180° longitude, as visible in the SO2 PR of Fig. 1b and c. Correspondingly, the SA-enhanced layer starts to form at those longitudes in the PR, and then spread zonally towards covering all longitudes during the following months (Fig. 6a). The CAIRT SA PO are capable to catch both the longitude of injection and the zonal dispersion of the formed SA plume (Fig. 6b). The limited absolute differences in Fig. 6c mirror the accuracy of the CAIRT SA PO.
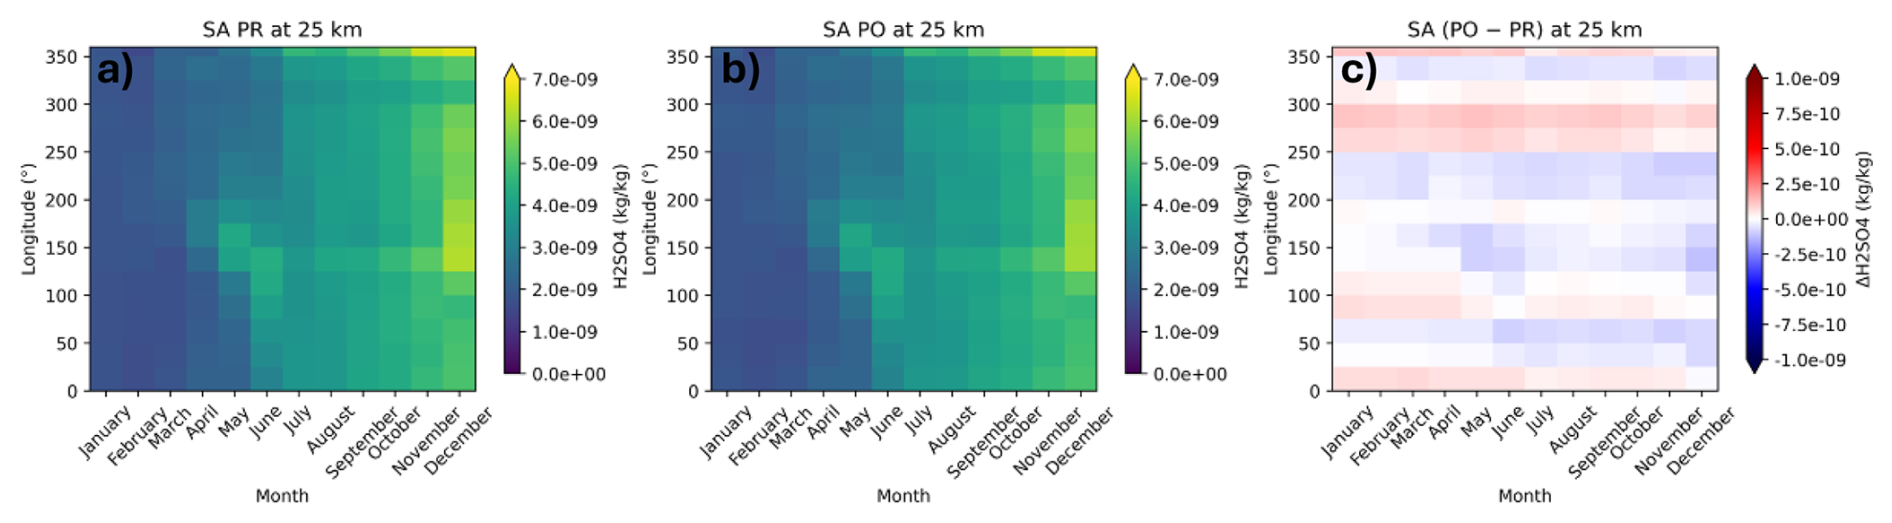
Figure 6Time series of monthly average meridional mean total SA mass concentration at 25 km altitude, for the Geo SSP5-34-OS 2.0 PR scenario (a) and corresponding CAIRT PO (b), for year 2034. The absolute difference of PO and PR monthly average meridional means are shown in panel (c).
Thanks to its observation geometry, CAIRT can also track the temporal evolution of the resulting SAI-enhanced SA layer as it spreads toward higher latitudes through meridional dispersion, as well as monitor changes in its vertical distribution over time. Figure 7 shows the progressive buildup of the first year of SAI-generated artificial perturbation of the stratospheric SA layer in the Geo SSP5-34-OS 2.0 PR scenario, with corresponding CAIRT POs. In particular, monthly means zonal average vertical SA (adding up the three SA modes) PR and PO profiles, at selected months in the year 2034, are shown in Fig. 7, together with absolute differences of PO and corresponding PR. The SA formed in 2034 follow SO2 injections analogous to the very first one discussed in Sect. 4.1, i.e. following a series of near/mid-term experiments. As visible from the figure, complementary with Fig. 6, CAIRT SA PO are capable of describing with accuracy the buildup of the SA plume and their global-scale dynamical features. The specific patterns of this buildup phase, evident in the PR, are also visible in the CAIRT POs. The initial formation of SA at the SO2 injection altitude is visible starting from January 2034 (not shown here) and for later months. The progressive spread of the SA layer at higher latitudes in both hemispheres can also be seen since March 2034, and more prominently during later months. The differences between PO and PR are generally very small, not exceeding 10 % in the regions occupied by the SA plume.
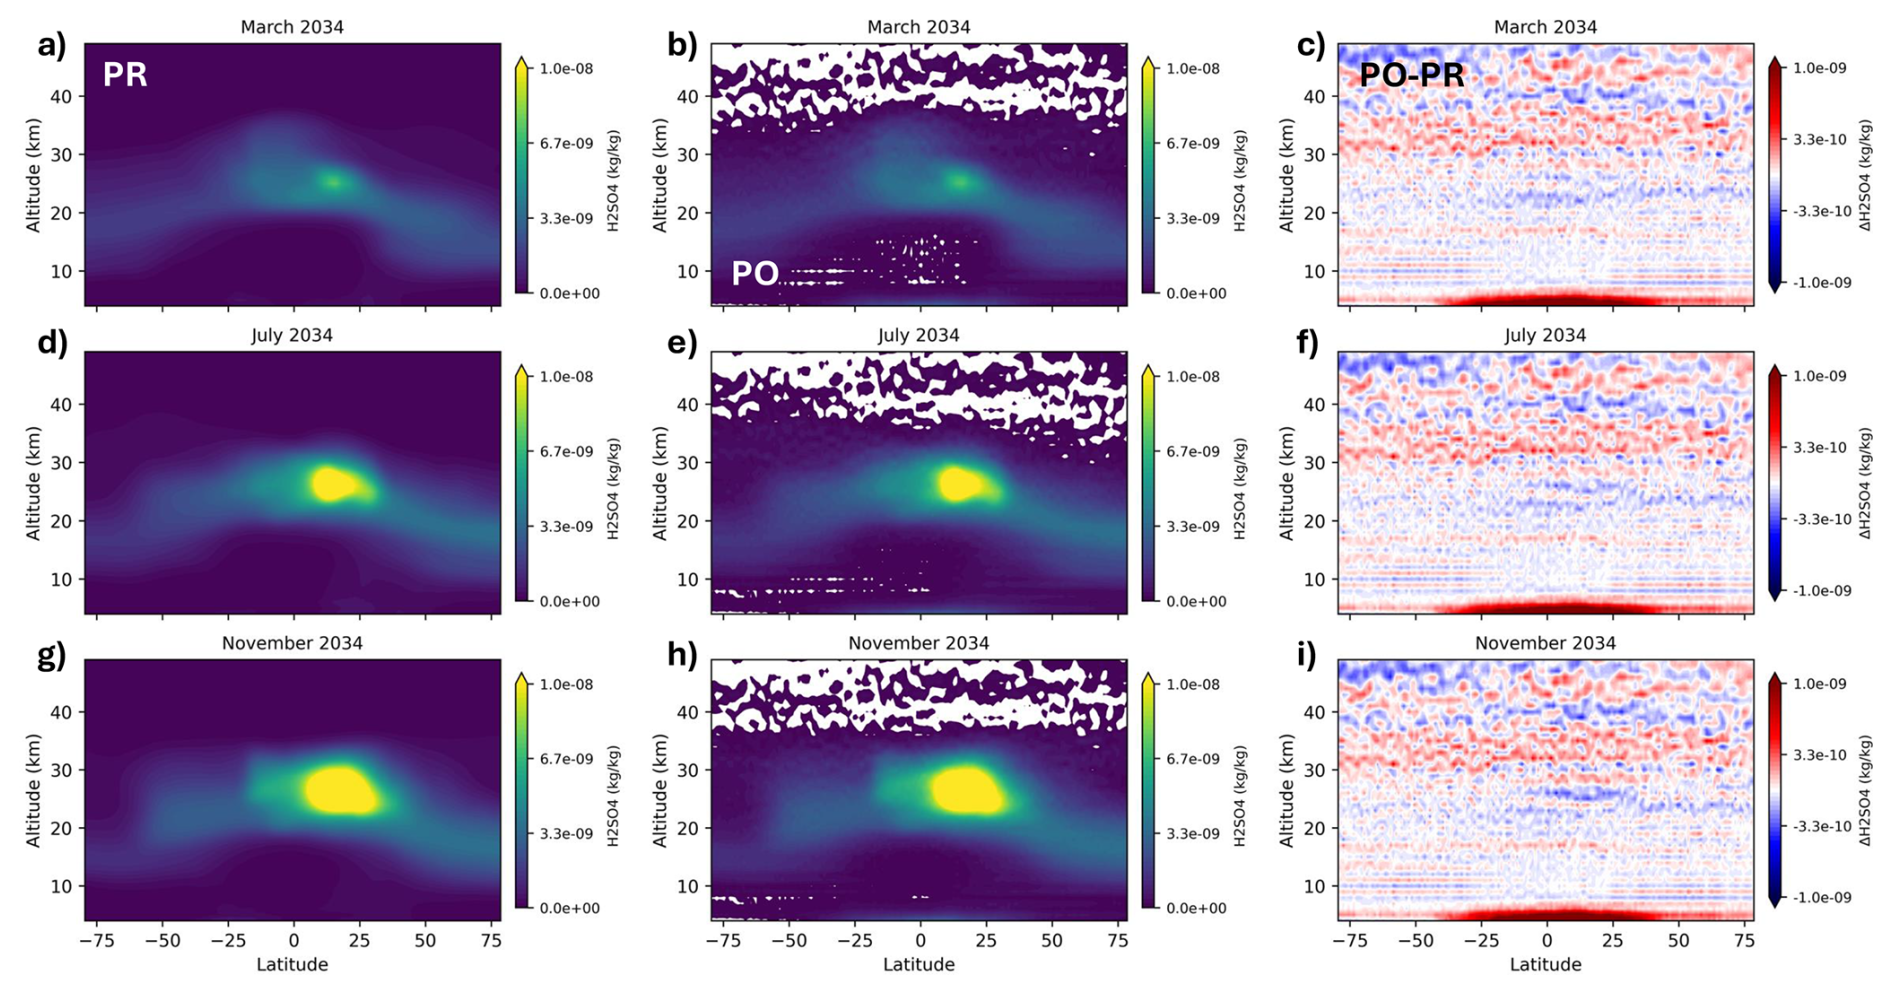
Figure 7Zonal average vertical profiles of the total SA mass concentration, for the Geo SSP5-34-OS 2.0 PR scenario, for selected months of the year 2034 – monthly averages (a, d, g) and corresponding CAIRT PO averages (b, e, h). The absolute difference of PO and PR average profiles are shown in the third column (c, f, i).
In addition, Fig. 8 shows the global and monthly average vertical profiles in 2034, for the SA nucleation mode only. This mode is selected here because its response to SO2 injections is quicker and more sensitive to their deployment than the other two larger-size modes in the model PR simulations and PO. A threshold of 1.0 ppb for the nucleation mode SA – arbitrarily chosen as a reference for a background stratospheric aerosol layer, e.g. Kremser et al. (2016) – is progressively exceeded at increasingly higher latitudes, in both hemispheres (but quicker in the Northern Hemisphere). This suggests a successful deployment of this simulated SAI, even if with generally small SO2 injections. In terms of the vertical distribution of SA, a progressive increase of their concentration at the injection altitude of about 25 km is observed in Fig. 8. A progressive increase of the altitude impacted by these SAI-generated perturbations is also discernible in Fig. 8. This is possibly associated with the self-lofting of the SA plume generated by the SO2 injections, due to radiative heating of the SA plume by solar radiation absorption. Self-lofting effects, while more typically associated with stronger solar-radiation-absorbing aerosols like those in biomass burning plumes (e.g. Sellitto et al., 2023), have also recently been observed also for volcanic plumes (Khaykin et al., 2022). The CAIRT POs are capable of detecting SA formation and of characterising these different processes, including the self-lofting of the SA concentration peak.
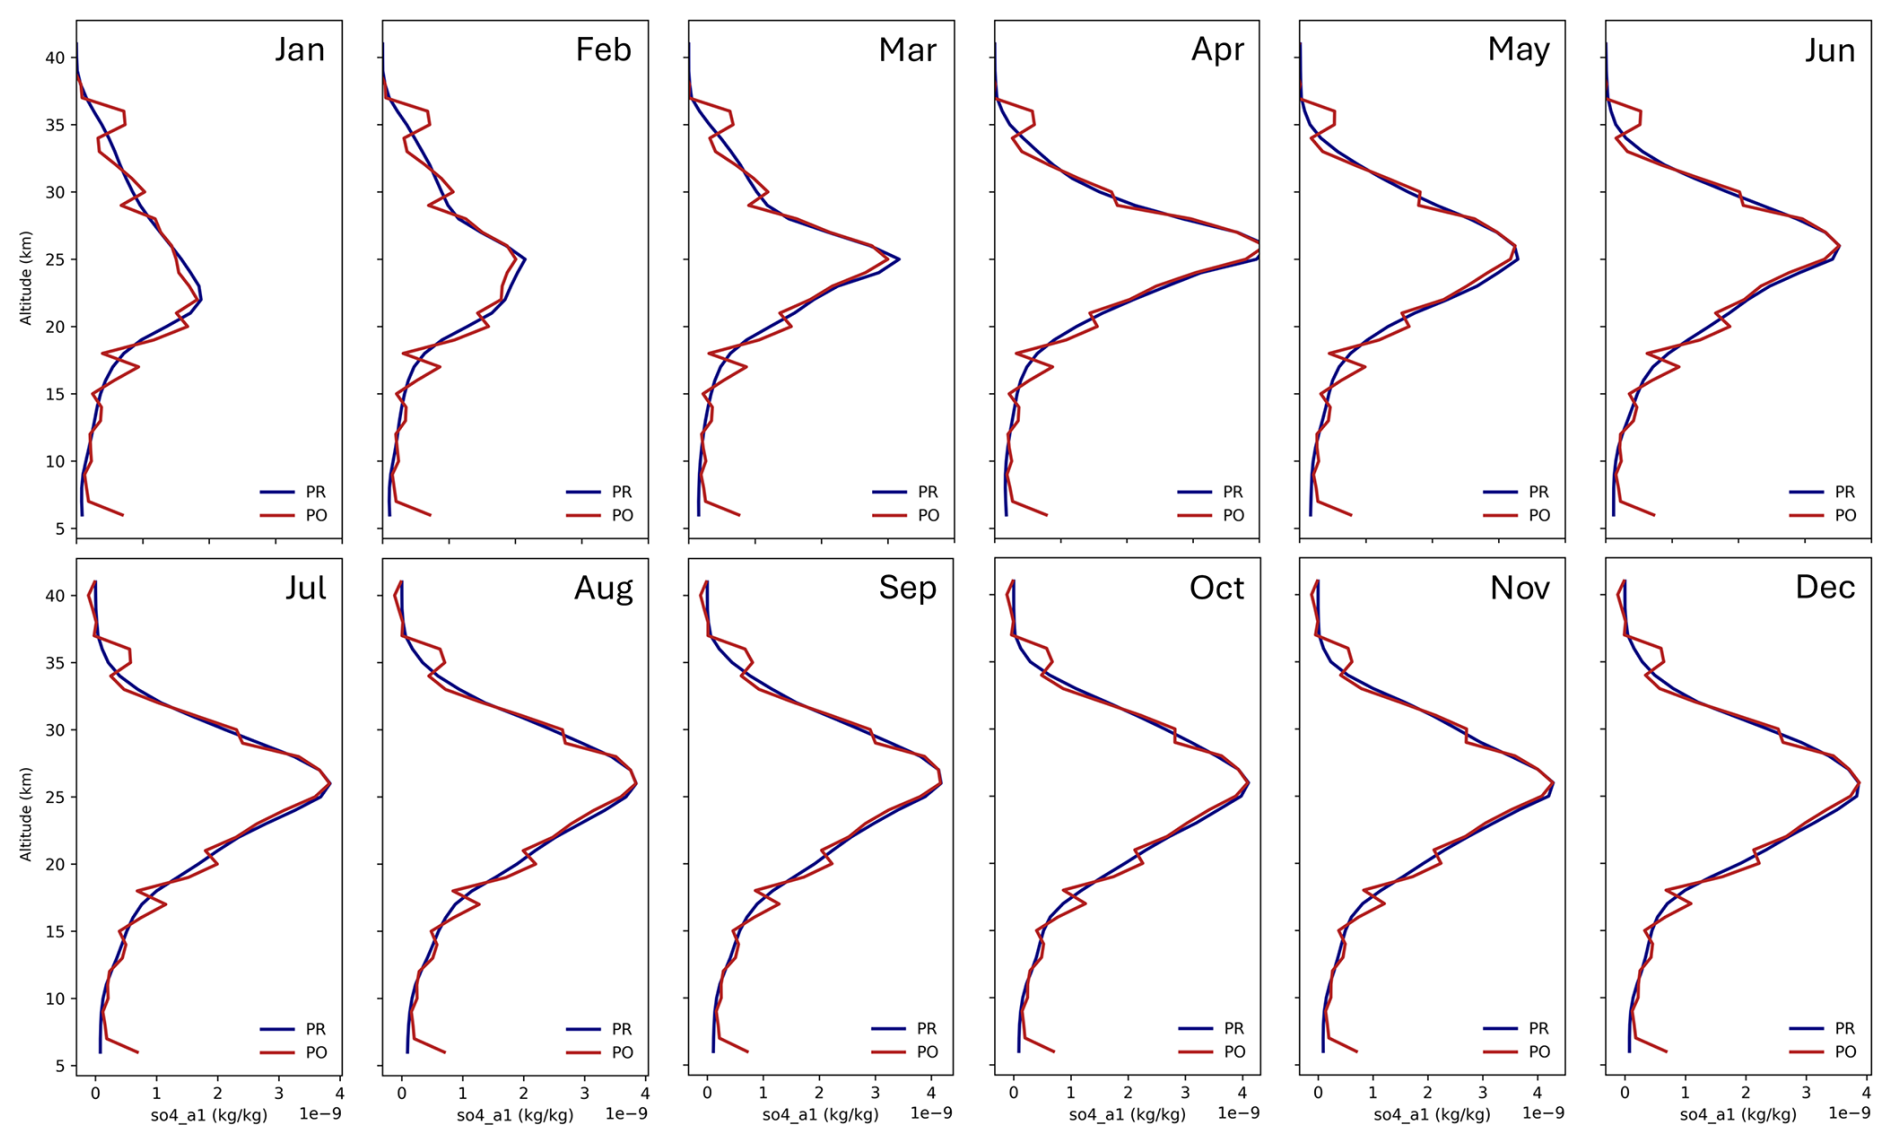
Figure 8Global average vertical profiles of nucleation mode SA concentration, for CAIRT POs based on the Geo SSP5-34-OS 2.0 PR scenario, as monthly means from January to December 2034 (PR in blue lines and CAIRT POs in red lines).
Finally, these simulations demonstrate that CAIRT's dense spatial sampling and relatively good revisit time, combined with its high vertical resolution, limited error budget and quantitative aerosol mass retrieval capability through high-spectral-resolution observations, would provide sufficient sensitivity and accuracy to detect and monitor SAI interventions and their impacts on the stratospheric aerosol layer, even under scenarios involving minimal injection rates.
Based on the analyses presented in the previous sections, we might wonder: would CAIRT-like mid-infrared limb emission observations provide a significant added value to the present capabilities to detect, track and characterise weak SAI deployments, i.e. a few to a few tens/hundreds of tonnes of SO2 and the resulting SA? What is the present capability to detect early, weak SAI deployments using existing satellite instrument? At present, a number of satellite techniques are available that would in principle be able to observe one or more SAI components (SO2 and/or SA): solar occultation, limb scattering, space LiDARs and, to a less extent, nadir measurements. As mentioned in the Introduction, these instruments were effectively used to observe stratospheric impacts of recent moderate volcanic eruptions, natural analogues of SAI. Nevertheless, more stringent conditions on the detection limits, vertical sensitivity and observation geometry exist for initial, possibly unilateral SAI deployments described in the present paper.
The solar occultation SAGE III/ISS (Stratospheric Aerosol and Gas Experiment on the International Space Station) instrument performs aerosol extinction observations with about lower than 5 % uncertainty, depending on altitude, for typical aerosol burdens of moderate volcanic eruptions, several order of magnitude larger than the one studied in this work (Kovilakam et al., 2023). By the way, in Sect. 4.1–4.2, we have shown that near/mid-term experiments would likely be associated with thousands of times smaller SO2 injections than moderate volcanic eruptions, and thus proportionally smaller resulting burdens of the formed SA. While the SA formed by a full-blown SAI deployment (i.e., with cumulated injected SO2 of the order of magnitude of a moderate volcanic eruption or more) would rather be observable by solar occultation instruments like SAGE III/ISS, initial or intermediate deployments, or limited-scale tests, will be harder to characterise with these instruments. As an example, Lange et al. (2025) demonstrate that it is possible to detect stratospheric aerosol perturbations resulting from SAI with SAGE III/ISS-like solar occultation instruments in case of injections of 1–2 Tg of sulfur per year, which is typical of (or even larger than) recent moderate volcanic eruptions and far larger than the magnitudes of the injections analysed in the present study. In that study, the cumulated effect of SAI on stratospheric aerosols burden in the first month of deployment, with total SAI 1 order of magnitude smaller than the mentioned 1–2 Tg of sulfur, was found undistinguishable from natural variability with SAGE III/ISS. Typical sensitivities of limb scattering instruments like OMPS-LP (Ozone Mapping and Profiler Suite – Limb Profiler) are generally worse than for solar occultation, due to a smaller signal-to-noise ratio. In addition, both SAGE III/ISS and OMPS-LP operate in the visible spectral range, which means that the spectral aerosol optical depth only can be derived from their observations and a chemical aerosol speciation, for example the specific detection of sulphate aerosols, is not possible. Space-based LiDARs, like the now discontinued CALIPSO-CALIOP (Cloud-Aerosol Lidar and Infrared Pathfinder Satellite Observation – Cloud-Aerosol Lidar with Orthogonal Polarization) and the presently in-space EarthCARE-ATLID (Earth Cloud, Aerosol and Radiation Explorer – Atmospheric Lidar), can detect the presence of relatively weak aerosol layers in the stratosphere but cannot distinguish specific aerosol compositions except for possible attribution to large aerosol classes through optical proxies of the composition (e.g. through the LiDAR ratio parameter). The aerosol speciation is a specific capability of infrared observations (e.g. Sellitto and Legras, 2016). Sulphate aerosols can be detected with nadir infrared observations, e.g. with IASI (Infrared Atmospheric Sounding Interferometer) but with a limited, if any, vertical information (e.g. Guermazi et al., 2021). The ACE-FTS (Atmospheric Chemistry Experiment–Fourier Transform Spectrometer, Bernath et al., 2005) is an infrared solar occultation instrument, but it is expected to be discontinued within the next few years. In terms of the observation geometry, instruments like SAGE III and ACE-FTS solar occultation sensors have scarce revisit times and horizontal coverage, providing sparse observations, thus impeding a quick detection of SAI, even in case of larger injections. Space LiDARs, through providing a very dense observation sampling along track, do not have across track capabilities. Finally, to detect this kind of SAI deployments, simultaneous observations of SO2 and SA would be important. The ideal satellite instruments to do so are high-spectral-resolution sensors operating in the mid-infrared, and with a reasonable spatial coverage, which can characterise, as said, the chemical composition of the observed aerosols, but also of gaseous species like SO2. Such instruments only exist for missions operating in a nadir observation geometry. Nevertheless, as mentioned, nadir sounders suffer from a poor vertical resolution that does not allow the detection of specific altitudes of SO2 injection and of the SA perturbations, and they are not capable of characterising thin layers associated with near- and mid-term experiments. Conversely, high-spectral-resolution infrared instruments measuring the limb emission spectra, are well-suited for this task. Finally, different satellite missions dedicated to the observation of the middle atmosphere are expected to be discontinued in the next few years, leading to what has been described as a “data desert” in stratospheric composition observations (Salawitch et al., 2025).
Considering all these elements, it can be affirmed that at present the international community does not have the capability to rapidly and effectively detect and characterise initial, weak SAI deployments, using satellite observations. This gap would be filled with one or more CAIRT-like mid-infrared limb emission instruments.
In this paper, we analyse the capabilities of future high-spectral-resolution mid-infrared limb emission sounding instruments of detecting and quantitatively monitoring very weak SAI deployments, in terms of the injected SO2 and its subsequent conversion into SA. This analysis is based on one specific mission concept, the CAIRT sounder – one of the four candidate missions down-selected within the ESA Earth Explorer 11 call. Based on the SSP5-34-OS social development pathway scenario, we define a SAI PR scenario (Geo SSP5-34-OS 2.0), associated with a globally moderate SAI deployment over a few decades. Here, we study the very initial SAI deployment phase, in the year 2034, in the PR scenario. This initial SAI phase is characterised, in this scenario, by very weak SO2 injections. Two analyses are carried out: (1) a test to evaluate the detectability and the capability of quantitative characterisation of the very first SO2 injection in January–February 2034, and (2) a test to assess the capability to track the SA formation throughout the year 2034. Based on this PR scenario, we generate corresponding CAIRT SO2 and SA POs, using a dedicated CAIRT PO simulator. This simulator emulates the CAIRT observation geometry and full error propagation and spatial smoothing characteristics, aligned with the expected CAIRT performances from the mission's Phase 0 and Phase A feasibility studies. Our results suggest that CAIRT would be able to detect SO2 injections and quantify their mass along the observational orbits segments, and to locate their horizontal and vertical injection position, even for these very weak initial injections in our PR scenario. These injections are of the order of magnitude of a few hundreds of tonnes of SO2 per day. Such amounts are tens of thousands to millions of times smaller than typical SO2 injections by moderate stratospheric volcanic eruptions and are characteristic of “near-term” to “mid-term” experiments, i.e. SAI scenarios considered feasible even unilaterally (outside a shared global SAI governance framework), or in the context of small-scale outdoor experiments, with presently existing technology and at relatively low cost, or isolated and regional SAI tests including those of uncoordinated nature with respect to the international community or any SAI international governance. In addition, our results suggest that CAIRT would be able to track the temporal evolution of the subsequently formed reflective SA, as they spread zonally and then toward higher latitudes through meridional dispersion, as well as to monitor changes in its vertical distribution over time. Processes like the self-lofting of the resulting SA plume, due to diabatic heating by radiation absorption, are also well reproduced with CAIRT PO. It is important to stress that a CAIRT-like instrument would have impacts well beyond those analysed in this paper. A high-spectral-resolution limb-emission infrared instrument would improve our overall capabilities to characterise the stratospheric aerosol layer, e.g. to improve our understanding of increasingly important, and less well known, stratospheric aerosol sources like those from wildfires or space debris. Beyond that, such type of instrument would also help to better characterise the atmospheric circulation and the modifications due to climate change, would allow a more complete characterisation and quantification of the gravity waves, would better address issues related on impacts of the variability in solar radiation and space weather on surface climate and more (Sinnhuber et al., 2026). Although CAIRT was not finally selected for implementation as ESA's Earth Explorer 11 mission, our results stress the importance of increasing our global observational capabilities with high-spectral-resolution limb-emission satellite instruments. At present, this capability is lacking, and simultaneous SO2 and SA observations, with the needed precision and spatiotemporal coverage/resolution to monitor early SAI attempts, are not possible with existing solar-occultation, limb-scattering, nadir-viewing and space-LiDAR instruments, nor with ground-based or in situ measurement techniques, while they can still produce partial information for possible larger SAI deployments. This issue is expected to become more urgent in the context of the future projected dearth of observations of stratospheric composition.
The CESM2(WACCM6) PR, for GeoMIP SSP5 pathway, are available from the NCAR Geoscience Data Exchange (GDEX) at https://doi.org/10.5065/3WEZ-DD73 (Tilmes, 2020). The CAIRT PO used in this paper are available at https://doi.org/10.5281/zenodo.17384389 (Kosary et al., 2025).
PS, MK and MH designed the study. PS and MK developed the CAIRT PO simulator. MH, BF, JU and QE provided the elements needed to develop the CAIRT PO simulator. ST provided the modelling data for the PR scenarios. MK run the PO simulations. BMS and AH contributed to funding acquisition and administration of the global CAIRT project. PS wrote the first version of the manuscript that was reviewed by all authors.
At least one of the (co-)authors is a member of the editorial board of Atmospheric Measurement Techniques. The peer-review process was guided by an independent editor, and the authors also have no other competing interests to declare.
Publisher's note: Copernicus Publications remains neutral with regard to jurisdictional claims made in the text, published maps, institutional affiliations, or any other geographical representation in this paper. The authors bear the ultimate responsibility for providing appropriate place names. Views expressed in the text are those of the authors and do not necessarily reflect the views of the publisher.
The discussions with Olivier Boucher and the STATISTICS consortium are gratefully acknowledged.
This research has been supported by the European Space Agency through the CAIRT PerRec and the STATISTICS projects and the Centre National d'Etudes Spatiales (CNES) through the EXTRA-SAT grant.
This paper was edited by Christian von Savigny and reviewed by two anonymous referees.
Académie des Sciences: Géo-ingénierie climatique : appel à la prudence et à un encadrement rigoureux, https://www.academie-sciences.fr/rapport-geo-ingenierie-clima tique-appel-la-prudence-et-un-encadrement-rigoureux (last access: 8 October 2026), 2025.
Aubry, T. J., Engwell, S., Bonadonna, C., Carazzo, G., Scollo, S., Van Eaton, A. R., Taylor, I. A., Jessop, D., Eychenne, J., Gouhier, M., Mastin, L. G., Wallace, K. L., Biass, S., Bursik, M., Grainger, R. G., Jellinek, A. M., and Schmidt, A.: The Independent Volcanic Eruption Source Parameter Archive (IVESPA, version 1.0): A new observational database to support explosive eruptive column model validation and development, J. Volcanol. Geoth. Res., 417, 107295, https://doi.org/10.1016/j.jvolgeores.2021.107295, 2021.
Bellamy, R.: Responsible research for space-based climate geoengineering, Environ. Sci. Policy, 172, 104213, https://doi.org/10.1016/j.envsci.2025.104213, 2025.
Bernath, P. F., McElroy, C. T., Abrams, M. C., Boone, C. D., Butler, M., Camy-Peyret, C., Carleer, M., Clerbaux, C., Coheur, P.-F., Colin, R., DeCola, P., DeMazière, M., Drummond, J. R., Dufour, D., Evans, W. F. J., Fast, H., Fussen, D., Gilbert, K., Jennings, D. E., Llewellyn, E. J., Lowe, R. P., Mahieu, E., McConnell, J. C., McHugh, M., McLeod, S. D., Michaud, R., Midwinter, C., Nassar, R., Nichitiu, F., Nowlan, Rinsland, C. P., Rochon, Y. J., Rowlands, N., Semeniuk, K., Simon, P., Skelton, R., Sloan, J. J., Soucy, M.-A., Strong, K., Tremblay, P., Turnbull, D., Walker, K. A., Walkty, I., Wardle, D. A., Wehrle, V., Zander, R., and Zou, J.: Atmospheric Chemistry Experiment (ACE): Mission overview, Geophys. Res. Lett., 32, L15S01, https://doi.org/10.1029/2005GL022386, 2005.
Bronsther, J. and Xu, Y.: The social costs of solar radiation management, npj Climate Action, 4, 69, https://doi.org/10.1038/s44168-025-00273-y, 2025.
Carboni, E., Grainger, R., Walker, J., Dudhia, A., and Siddans, R.: A new scheme for sulphur dioxide retrieval from IASI measurements: application to the Eyjafjallajökull eruption of April and May 2010, Atmos. Chem. Phys., 12, 11417–11434, https://doi.org/10.5194/acp-12-11417-2012, 2012.
Carn, S. A., Clarisse, L., and Prata, A. J.: Multi-decadal satellite measurements of global volcanic degassing, J. Volcanol. Geoth. Res., 311, 99–134, https://doi.org/10.1016/j.jvolgeores.2016.01.002, 2016.
Consortium National Interdisciplinary Climate Risk Assessment: National Interdisciplinary Climate Risk Assessment, https://metis.unibw.de/en/nike/ (last access: 8 October 2026), 2025.
Crutzen, P. J.: Albedo Enhancement by Stratospheric Sulfur Injections: A Contribution to Resolve a Policy Dilemma?, Climatic Change 77, 211–220, https://doi.org/10.1007/s10584-006-9101-y, 2006.
Duchamp, C., Legras, B., Podglajen, A., Sellitto, P., Bourassa, A. E., Rozanov, A., Taha, G., and Zawada, D. J.: Aerosol Composition and Extinction of the 2022 Hunga Plume Using CALIOP, Atmos. Meas. Tech., 19, 1675–1696, https://doi.org/10.5194/amt-19-1675-2026, 2026.
European Parliament: Briefing: Options for the responsible governance of research on solar radiation modification, https://www.europarl.europa.eu/thinktank/en/document/EPRS_BRI(2026)789310 (last access: 8 October 2026), 2026.
European Space Agency: Report for Mission Selection: Earth Explorer 11 Candidate Mission CAIRT, European Space Agency, Noordwijk, The Netherlands, ESA-EOPSM-CAIR-RP-4797, 230 pp., https://doi.org/10.5281/zenodo.15606819, 2025.
Eyring, V., Cionni, I., Lamarque, J. F., Akiyoshi, H., Bodeker, G. E., Charlton-Perez, A. J., Frith, S. M., Gettelman, A., Kinnison, D. E., Nakamura, T., Oman, L. D., Pawson, S., and Yamashita, Y.: Sensitivity of 21st century stratospheric ozone to greenhouse gas scenarios, Geophys. Res. Lett., 37, https://doi.org/10.1029/2010GL044443, 2010.
Funke, B., Höpfner, M., Bender, S., Errera, Q., Grabowski, U., Hoffmann, A., Liu, H.-L., Pedatella, N. M., Raspollini, P., Ungermann, J., and Sinnhuber, B.-M.: Linear tomographic retrieval characterisation and performance estimation for the ESA Earth Explorer 11 candidate CAIRT (Changing Atmosphere Infra-Red Tomography explorer), EGUsphere [preprint], https://doi.org/10.5194/egusphere-2026-3881, 2026.
Gettelman, A., Mills, M. J., Kinnison, D. E., Garcia, R. R., Smith, A. K., Marsh, D. R., Tilmes, S., Vitt, F., Bardeen, C. G., McInerny, J., Liu, H.-L., Solomon, S. C., Polvani, L. M., Emmons, L. K., Lamarque, J.-F., Richter, J. H., Glanville, A. S., Bacmeister, J. T., Phillips, A. S., Neale, R. B., Simpson, I. R., DuVivier, A. K., Hodzic, A., and Randel, W. J.: The Whole Atmosphere Community Climate Model Version 6 (WACCM6), J. Geophys. Res.-Atmos., 124, 12380–12403, https://doi.org/10.1029/2019JD030943, 2019.
Guermazi, H., Sellitto, P., Serbaji, M.M., Legras, B., and Rekhiss, F.: Assessment of the Combined Sensitivity of Nadir TIR Satellite Observations to Volcanic SO2 and Sulphate Aerosols after a Moderate Stratospheric Eruption, Geosciences, 7, 84, https://doi.org/10.3390/geosciences7030084, 2017.
Guermazi, H., Sellitto, P., Cuesta, J., Eremenko, M., Lachatre, M., Mailler, S., Carboni, E., Salerno, G., Caltabiano, T., Menut, L., Serbaji, M. M., Rekhiss, F., and Legras, B.: Quantitative Retrieval of Volcanic Sulphate Aerosols from IASI Observations, Remote Sens., 13, 1808, https://doi.org/10.3390/rs13091808, 2021.
Günther, A., Höpfner, M., Sinnhuber, B.-M., Griessbach, S., Deshler, T., von Clarmann, T., and Stiller, G.: MIPAS observations of volcanic sulfate aerosol and sulfur dioxide in the stratosphere, Atmos. Chem. Phys., 18, 1217–1239, https://doi.org/10.5194/acp-18-1217-2018, 2018.
Haywood, J. M., Jones, A., Clarisse, L., Bourassa, A., Barnes, J., Telford, P., Bellouin, N., Boucher, O., Agnew, P., Clerbaux, C., Coheur, P.-F., Degenstein, D., and Braesicke, P.: Observations of the eruption of the Sarychev volcano and simulations using the HadGEM2 climate model, J. Geophys. Res., 115, D21212, https://doi.org/10.1029/2010JD014447, 2010.
Helwegen, K. G., Wieners, C. E., Frank, J. E., and Dijkstra, H. A.: Complementing CO2 emission reduction by solar radiation management might strongly enhance future welfare, Earth Syst. Dynam., 10, 453–472, https://doi.org/10.5194/esd-10-453-2019, 2019.
Höpfner, M., Boone, C. D., Funke, B., Glatthor, N., Grabowski, U., Günther, A., Kellmann, S., Kiefer, M., Linden, A., Lossow, S., Pumphrey, H. C., Read, W. G., Roiger, A., Stiller, G., Schlager, H., von Clarmann, T., and Wissmüller, K.: Sulfur dioxide (SO2) from MIPAS in the upper troposphere and lower stratosphere 2002–2012, Atmos. Chem. Phys., 15, 7017–7037, https://doi.org/10.5194/acp-15-7017-2015, 2015.
Höpfner, M., Funke, B., Bender, S., Errera, Q., Sinnhuber, B.-M., and Ungermann, J.: D-04-01 CAIRT linear SWB ATBDD14-4-README-3, CAIRT PerRec, Zenodo, https://zenodo.org/records/18496134 (last access: 8 October 2026), 2025.
IPCC: Summary for Policymakers. In: Global Warming of 1.5°C. An IPCC Special Report on the impacts of global warming of 1.5°C above pre-industrial levels and related global greenhouse gas emission pathways, in the context of strengthening the global response to the threat of climate change, sustainable development, and efforts to eradicate poverty, edited by: Masson-Delmotte, V., Zhai, P., Pörtner, H.-O., Roberts, D., Skea, J., Shukla, P. R., Pirani, A., Moufouma-Okia, W., Péan, C., Pidcock, R., Connors, S., Matthews, J. B. R., Chen, Y., Zhou, X., Gomis, M. I., Lonnoy, E., Maycock, T., Tignor, M., and Waterfield, T., Cambridge University Press, Cambridge, UK and New York, NY, USA, 3–24, https://doi.org/10.1017/9781009157940.001, 2018.
IPCC: Climate Change 2021: The Physical Science Basis. Contribution of Working Group I to the Sixth Assessment Report of the Intergovernmental Panel on Climate Change, edited by: Masson-Delmotte, V., Zhai, P., Pirani, A., Connors, S. L., Péan, C., Berger, S., Caud, N., Chen, Y., Goldfarb, L., Gomis, M. I., Huang, M., Leitzell, K., Lonnoy, E., Matthews, J. B. R., Maycock, T. K., Waterfield, T., Yelekçi, O., Yu, R., and Zhou, B., Cambridge University Press, Cambridge, United Kingdom and New York, NY, USA, https://doi.org/10.1017/9781009157896, 2021.
Khaykin, S. M., de Laat, A. T. J., Godin-Beekmann, S., Hauchecorne, A., and Ratynski, M.: Unexpected self-lofting and dynamical confinement of volcanic plumes: the Raikoke 2019 case, Sci. Rep., 12, 22409, https://doi.org/10.1038/s41598-022-27021-0, 2022.
Khaykin, S., Sicard, M., Leblanc, T., Sakai, T., Balugin, N., Berthet, G., Chevrier, S., Chouza, F., Feofilov, A., Gantois, D., Godin-Beekmann, S., Haddouche, A., Jin, Y., Morino, I., Kadygrov, N., Lecas, T., Liley, B., Querel, R., Taha, G., and Yushkov, V.: Global transport of stratospheric aerosol produced by Ruang eruption from EarthCARE ATLID, limb-viewing satellites and ground-based lidar observations, Atmos. Chem. Phys., 26, 607–622, https://doi.org/10.5194/acp-26-607-2026, 2026.
Kloss, C., Berthet, G., Sellitto, P., Ploeger, F., Taha, G., Tidiga, M., Eremenko, M., Bossolasco, A., Jégou, F., Renard, J.-B., and Legras, B.: Stratospheric aerosol layer perturbation caused by the 2019 Raikoke and Ulawun eruptions and their radiative forcing, Atmos. Chem. Phys., 21, 535–560, https://doi.org/10.5194/acp-21-535-2021, 2021.
Kosary, M., Sellitto, P., and Höpfner, M.: CAIRT Synthetic SO2 and sulphate aerosol 2034-01:2034-12, Version v1, Zenodo [data set], https://doi.org/10.5281/zenodo.17384389, 2025.
Kovilakam, M., Thomason, L., and Knepp, T.: SAGE III/ISS aerosol/cloud categorization and its impact on GloSSAC, Atmos. Meas. Tech., 16, 2709–2731, https://doi.org/10.5194/amt-16-2709-2023, 2023.
Kravitz, B., Robock, A., Tilmes, S., Boucher, O., English, J. M., Irvine, P. J., Jones, A., Lawrence, M. G., MacCracken, M., Muri, H., Moore, J. C., Niemeier, U., Phipps, S. J., Sillmann, J., Storelvmo, T., Wang, H., and Watanabe, S.: The Geoengineering Model Intercomparison Project Phase 6 (GeoMIP6): simulation design and preliminary results, Geosci. Model Dev., 8, 3379–3392, https://doi.org/10.5194/gmd-8-3379-2015, 2015.
Kravitz, B., MacMartin, D. G., Tilmes, S., Richter, J. H., Mills, M. J., Cheng, W., Dagon, K., Glanville, A. S., Lamarque, J.-F., Simpson, I. R., Tribbia, J., and Vitt, F.: Comparing surface and stratospheric impacts of geoengineering with different SO2 injection strategies, J. Geophys. Res.-Atmos., 124, 7900–7918, https://doi.org/10.1029/2019JD030329, 2019.
Kremser, S., Thomason, L. W., von Hobe, M., Hermann, M., Deshler, T., Timmreck, C., Toohey, M., Stenke, A., Schwarz, J. P., Weigel, R., Fueglistaler, S., Prata, F. J., Vernier, J.-P., Schlager, H., Barnes, J. E., Antuña-Marrero, J.-C., Fairlie, D., Palm, M., Mahieu, E., Notholt, J., Rex, M., Bingen, C., Vanhellemont, F., Bourassa, A., Plane, J. M. C., Klocke, D., Carn, S. A., Clarisse, L., Trickl, T., Neely, R., James, A. D., Rieger, L., Wilson, J. C., and Meland, B.: Stratospheric aerosol – Observations, processes, and impact on climate, Rev. Geophys., 54, 278–335, https://doi.org/10.1002/2015RG000511, 2016.
Lange, A., Niemeier, U., Rozanov, A., and von Savigny, C.: Investigating the ability of satellite occultation instruments to monitor possible geoengineering experiments, Atmos. Chem. Phys., 25, 11673–11688, https://doi.org/10.5194/acp-25-11673-2025, 2025.
Lawrence, M.G., Schäfer, S., Muri, H., Scott, V., Oschlies, A., Vaughan, N. E., Boucher, O., Schmidt, H., Haywood, J., and Scheffran, J.: Evaluating climate geoengineering proposals in the context of the Paris Agreement temperature goals, Nat. Commun., 9, 3734, https://doi.org/10.1038/s41467-018-05938-3, 2018.
MacMartin, D. G., Ricke, K. L., Keith, D. W., Mitchell, D., Allen, M. R., Hall, J. W., Mueller, B., Rajamani, L., and Le Quéré, C.: Solar geoengineering as part of an overall strategy for meeting the 1.5 °C Paris target, Phil. Trans. R. Soc. A, 376, 20160454, https://doi.org/10.1098/rsta.2016.0454, 2018.
Mills, M. J., Richter, J. H., Tilmes, S., Kravitz, B., MacMartin, D. G., Glanville, A. A., Tribbia, J. J., Lamarque, J.-F., Vitt, F., Schmidt, A., Gettelman, A., Hannay, C., Bacmeister, J. T., and Kinnison, D. E.: Radiative and Chemical Response to Interactive Stratospheric Sulfate Aerosols in Fully Coupled CESM1(WACCM), J. Geophys. Res.-Atmos., 122, 13061–13078, https://doi.org/10.1002/2017JD027006, 2017.
O'Neill, B. C., Tebaldi, C., van Vuuren, D. P., Eyring, V., Friedlingstein, P., Hurtt, G., Knutti, R., Kriegler, E., Lamarque, J.-F., Lowe, J., Meehl, G. A., Moss, R., Riahi, K., and Sanderson, B. M.: The Scenario Model Intercomparison Project (ScenarioMIP) for CMIP6, Geosci. Model Dev., 9, 3461–3482, https://doi.org/10.5194/gmd-9-3461-2016, 2016.
Rabitz, F.: Going rogue? Scenarios for unilateral geoengineering, Futures, 84, 98–107, https://doi.org/10.1016/j.futures.2016.11.001, 2016.
Ridley, D. A., Solomon, S., Barnes, J. E., Burlakov, V. D., Deshler, T., Dolgii, S. I., Herber, A. B., Nagai, T., Neely III, R. R., Nevzorov, A. V., Ritter, C., Sakai, T., Santer, B. D., Sato, M., Schmidt, A., Uchino, O., and Vernier, J. P.: Total volcanic stratospheric aerosol optical depths and implications for global climate change, Geophys. Res. Lett., 41, 7763–7769, https://doi.org/10.1002/2014GL061541, 2014.
Salawitch, R. J., Smith, J. B., Selkirk, H., Wargan, K., Chipperfield, M. P., Hossaini, R., Levelt, P. F., Livesey, N. J., McBride, L. A., Millán, L. F., Moyer, E., Santee, M. L., Schoeberl, M. R., Solomon, S., Stone, K., and Worden, H. M.: The Imminent Data Desert: The Future of Stratospheric Monitoring in a Rapidly Changing World, B. Am. Meteorol. Soc., 106, E540–E563, https://doi.org/10.1175/BAMS-D-23-0281.1, 2025.
Schmidt, A., Mills, M. J., Ghan, S., Gregory, J. M., Allan, R. P., Andrews, T., Bardeen, C. G., Conley, A., Forster, P. M., Gettelman, A., Portmann, R. W., Solomon, S., and Toon, O. B.: Volcanic radiative forcing from 1979 to 2015, J. Geophys. Res.-Atmos., 123, 12491–12508, https://doi.org/10.1029/2018JD028776, 2018.
Sellitto, P. and Legras, B.: Sensitivity of thermal infrared nadir instruments to the chemical and microphysical properties of UTLS secondary sulfate aerosols, Atmos. Meas. Tech., 9, 115–132, https://doi.org/10.5194/amt-9-115-2016, 2016.
Sellitto, P., Podglajen, A., Belhadji, R., Boichu, M., Carboni, E., Cuesta, J., Duchamp, C., Kloss, C., Siddans, R., Bègue, N., Blarel, L., Jegou, F., Khaykin, S., Renard, J.-B., and Legras, B.: The unexpected radiative impact of the Hunga Tonga eruption of 15th January 2022, Communications Earth & Environment, 3, 288, https://doi.org/10.1038/s43247-022-00618-z, 2022.
Sellitto, P., Belhadji, R., Cuesta, J., Podglajen, A., and Legras, B.: Radiative impacts of the Australian bushfires 2019–2020 – Part 2: Large-scale and in-vortex radiative heating, Atmos. Chem. Phys., 23, 15523–15535, https://doi.org/10.5194/acp-23-15523-2023, 2023.
Sellitto, P., Siddans, R., Belhadji, R., Carboni, E., Legras, B., Podglajen, A., Duchamp, C., and Kerridge, B.: Observing the SO2 and sulfate aerosol plumes from the 2022 Hunga eruption with the Infrared Atmospheric Sounding Interferometer (IASI), Geophys. Res. Lett., 51, e2023GL105565, https://doi.org/10.1029/2023GL105565, 2024.
Sinnhuber, B.-M., Chipperfield, M. P., Dinelli, B. M., Errera, Q., Friedl-Vallon, F., Funke, B., Godin-Beekmann, S., Hoffmann, A., Holm, E., Höpfner, M., Malavart, A., Monge-Sanz, B. M., Op de beeck, M., Osprey, S., Papandrea, E., Polichtchouk, I., Preusse, P., Raspollini, P., Rhode, S., Riese, M., Sellitto, P., Ungermann, J., Vervalcke, S., Verronen, P. T., Voet, F., and Walker, K. A.: The need for a new comprehensive view of the middle atmosphere – the potential of infrared limb imaging tomography, B. Am. Meteorol. Soc., https://doi.org/10.1175/BAMS-D-24-0217.1, 2026.
Stevenson, D. S., Johnson, C. E., Collins, W. J., and Derwent, R. G.: The tropospheric sulphur cycle and the role of volcanic SO2, Geological Society, London, Special Publications, 213, 295–305, https://doi.org/10.1144/GSL.SP.2003.213.01.18, 2003.
Taha, G., Loughman, R., Colarco, P. R., Zhu, T., Thomason, L. W., and Jaross, G.: Tracking the 2022 Hunga Tonga-Hunga Ha'apai aerosol cloud in the upper and middle stratosphere using space-based observations, Geophys. Res. Lett., 49, e2022GL100091, https://doi.org/10.1029/2022GL100091, 2022.
Thompson, D. W., Wallace, J. M., Jones, P. D., and Kennedy, J. J.: Identifying Signatures of Natural Climate Variability in Time Series of Global-Mean Surface Temperature: Methodology and Insights, J. Climate, 22, 6120–6141, https://doi.org/10.1175/2009JCLI3089.1, 2009.
Tilmes, S., Müller, R., and Salawitch, R.: The Sensitivity of Polar Ozone Depletion to Proposed Geoengineering Schemes, Science, 320, 1201–1204, https://doi.org/10.1126/science.1153966, 2008.
Tilmes, S.: GeoMIP SSP5 run data, NSF National Center for Atmospheric Research [data set], https://doi.org/10.5065/3WEZ-DD73, 2020.
Tilmes, S., MacMartin, D. G., Lenaerts, J. T. M., van Kampenhout, L., Muntjewerf, L., Xia, L., Harrison, C. S., Krumhardt, K. M., Mills, M. J., Kravitz, B., and Robock, A.: Reaching 1.5 and 2.0 °C global surface temperature targets using stratospheric aerosol geoengineering, Earth Syst. Dynam., 11, 579–601, https://doi.org/10.5194/esd-11-579-2020, 2020.
United Nations Environment Programme: One Atmosphere: An independent expert review on Solar Radiation Modification research and deployment. Kenya, Nairobi, https://www.unep.org/resources/report/Solar-Radiation-Modification-research-deployment (last access: 8 October 2026), 2023.
Vernier, J.-P., Thomason, L. W., Pommereau, J.-P., Bourassa, A., Pelon, J., Garnier, A., Hauchecorne, A., Blanot, L., Trepte, C., Degenstein, D., and Vargas, F.: Major influence of tropical volcanic eruptions on the stratospheric aerosol layer during the last decade, Geophys. Res. Lett., 38, L12807, https://doi.org/10.1029/2011GL047563, 2011.
Wrana, F., Niemeier, U., Thomason, L. W., Wallis, S., and von Savigny, C.: Stratospheric aerosol size reduction after volcanic eruptions, Atmos. Chem. Phys., 23, 9725–9743, https://doi.org/10.5194/acp-23-9725-2023, 2023.
- Abstract
- Introduction
- The CAIRT mission concept
- Data and methods
- Results
- Do we have the capability to detect early SAI deployments with the present satellite instruments?
- Conclusions
- Data availability
- Author contributions
- Competing interests
- Disclaimer
- Acknowledgements
- Financial support
- Review statement
- References
- Abstract
- Introduction
- The CAIRT mission concept
- Data and methods
- Results
- Do we have the capability to detect early SAI deployments with the present satellite instruments?
- Conclusions
- Data availability
- Author contributions
- Competing interests
- Disclaimer
- Acknowledgements
- Financial support
- Review statement
- References