
the Creative Commons Attribution 4.0 License.
the Creative Commons Attribution 4.0 License.
 | 15 Oct 2026
An assessment of lunar photometry in AERONET
Joel Schafer

Thomas F. Eck
Ilya Slutsker
Pawan Gupta
Mikhail Sorokin
Alexander Sinyuk
Alexander Smirnov
AERONET has been acquiring direct beam lunar observations at six wavelengths from 440 to 1640 nm from most newer model T CIMEL sun-sky radiometers in the network for many years and producing a night-time AOD data set, which currently includes observations at 492 sites dating back as far as 2014. The new dataset of lunar AOD now uses an updated empirical correction for the ROLO lunar irradiance model and has been extensively analyzed for all long-term lunar-capable sites by evaluating the continuity of AOD between solar and lunar measurements during limited temporal windows. Comparison of daytime and nighttime AOD measurements shows good agreement at all sites with more than a decade of data with mean differences typically within ± 0.01 for AOD440 nm and similar or better agreement at longer wavelengths. Comparisons during 3 h transition periods between day and night observations during conditions of low and stable AOD found statistically negligible differences of AOD at all common wavelengths as well as for Ångström Exponent, column water vapor and AODfine and AODcoarse parameters from SDA. The lunar AOD product demonstrates consistency with solar AOD across diverse aerosol conditions at AERONET sites globally, validating the empirical correction approach.
- Article
(4730 KB) - Full-text XML
-
Supplement
(1153 KB) - BibTeX
- EndNote


The lunar AOD product from AERONET represents the most globally extensive ground-based database of nighttime AOD available with records at hundreds of sites for more than a decade. When lunar geometry is favorable, nearly full temporal coverage of nighttime AOD can be acquired in contrast to that from satellite sensors often limited to overpass periods. Nighttime AOD can differ significantly from daytime AOD due to potentially higher concentrations (shallower boundary layer), increased relative humidity that enhances hygroscopic growth, differences in emission rates in day versus night, diurnal differences in cloud-aerosol interactions and different chemical evolution pathways in the absence of sunlight (Jiang et al., 2024; Li et al., 2025b; Song et al., 2024). These measurements enable research that can provide a more complete picture of the 24 h aerosol cycle with applications for air quality trends and radiative forcing whereas at night aerosols commonly have a warming effect in contrast to daytime cooling (Ji et al., 2025). Nocturnal radiative forcing can cause radiative fog in moist surface layers which promotes aerosol processing, while monitoring of Arctic haze necessarily relies on lunar measurements as the only option during polar night which can last almost 4 months at high latitude AERONET sites such as Ny-Ålesund (78.92° N) in Svalbard (Wainwright et al., 2021). At such high latitudes, the seasonal intervals of continual day or night combined with insufficiently low solar position below the horizon in the adjacent periods to permit lunar observations means that there is almost no overlap of solar and lunar AOD observations in the AERONET record for such polar sites.
Nighttime observations present unique challenges such as reliance on an irradiance source (the Moon) that is more variable and much lower in signal than for solar (daytime) observations and current irradiance models are imperfect (Barreto et al., 2017; Zhu et al., 2026). Significant early research on modern lunar photometry was contributed by Berkoff et al. (2011), which provided a proof-of-concept for retrieving nocturnal aerosol optical depth (AOD) using a small-aperture automated photometer and the USGS ROLO irradiance model. This effort was expanded by Barreto et al. (2013), who introduced the Lunar-Langley Method, an absolute calibration technique that adapts Langley plots to account for the Moon's variable illumination. A major instrumental advance was the development of the Cimel CE318-T “triple” photometer, first introduced in Barreto et al. (2016), which described the use of the Sun-Moon gain factor method to transfer established daytime solar calibrations to the nocturnal lunar mode. Comparisons between extrapolated solar AOD and observed lunar AOD on 59 stable and low AOD days allowed (Barreto et al., 2017) to determine that systematic errors tied to the Moon's phase were linked to limitations in the ROLO model and proposed empirical parameterizations to correct the retrievals. These systematic errors associated with ROLO inaccuracies were also investigated in a multi-instrument nocturnal intercomparison campaign by Barreto et al. (2019), which observed significant moon phase dependent lunar AOD errors for several CIMELs and a LunarPFR but not for a stellar photometer (which does not depend on a lunar irradiance model). These analyses were further refined by Román et al. (2020), who used CIMEL data from 98 pristine, stable AOD nights at Izaña Observatory over approximately 4 years to produce a RIMO Correction Factor (RCF) for RIMO (an open-source implementation of ROLO) as a function of moon phase angle. Lunar AOD computed with this RCF adjustment were found to agree very well with independent star photometer measurements in Granada, Spain, with mean AOD differences generally below 0.015. The RIMO Correction Factor (RCF) was also used by Zhu et al. (2026) for data (raw signals) from a Cimel CE318-T photometer at the Beijing-CAMS site from January–October 2024 to compute lunar AOD using the RIMO model and found good agreement (correlation coefficients >0.99 and RMSE <0.01) with the reprocessed AERONET L1.5 lunar AOD for all night-time AOD channels (440, 500, 675, 870, 1020 and 1640 nm).
Perrone et al. (2022) used 3 years of provisional lunar AOD data from a CIMEL Sun–Sky–Moon photometer at Lecce University to evaluate day-night AOD differences. They compared the average of the last hour of daytime data with the first hour of nocturnal data (and the last hour of nocturnal data with the first hour of solar data), finding that the differences were within the accuracy of the solar AODs. These researchers also found no statistically significant differences in monthly averages of lunar and solar AOD when restricted to common days. Li et al. (2025a), using the current Level 2 (highest quality) Lunar AOD dataset, also found that nighttime optical properties, including AOD and AE, are generally consistent with daytime observations in six regions of East Asia, but noted that in polluted areas with high local emissions nighttime AOD and extinction profiles are generally lower than their daytime counterparts, whereas in areas with lower local emissions, nighttime AOD and extinction profiles tend to be equivalent to those during the daytime. Adding to these ground-based assessments, recent research has used the updated AERONET lunar AOD dataset to validate satellite-based nocturnal retrievals. Zhang et al. (2025) used Level 1.5 reprocessed lunar data to evaluate gridded nighttime AOD retrievals from VIIRS Day–Night Band (DNB) observations over the US, Middle East, and Indian Subcontinent which found correlations of approximately 0.8 between VIIRS and AERONET nighttime data. Similarly, Schlief et al. (2026) used Version 3 Level 2.0 nighttime AERONET data from Dakar, Senegal, to compare AOD derived from city light-based methods and moonlight reflectance during bright moon conditions, where fractional illumination is greater than 0.85. They achieved absolute errors versus AERONET of approximately 0.11 for the city lights technique and 0.17 for reflectance-based methods.
This study assesses the quality of the new lunar AOD product by evaluating the agreement of day and night measurements acquired with the same Cimel Sun–Sky–Moon photometer under stable AOD conditions for the full AERONET dataset. All solar and lunar data used in this paper are Level 2 data, representing the highest AERONET data quality, which incorporates statistically robust ROLO correction factors derived from over 5 years of high-altitude Langley data.
AERONET reference CIMELs are calibrated at high altitude observatories at Mauna Loa, Hawaii and Izaña, Canary Islands via the Langley method and the derived V0 (scaled appropriately for changes in earth-sun distance) can be used reliably to compute solar-based AOD so long as the instrument remains stable (Toledano et al., 2018). For solar measured AOD the small uncertainty in these V0's results in high accuracy AOD for reference instruments ranging from () at 340 nm to in the near infrared, where m is the optical airmass (Eck, 1999). These V0 represent the extrapolated instrument response at each wavelength at zero air mass and provide the signal in analog-to-digital units (ADU) or “counts” that would be expected for the top-of-atmosphere (TOA) irradiance, E0,solar. For lunar AOD, the situation is more complicated because lunar irradiance is highly variable with lunar phase angle and the V0 acquired from any lunar Langley is only valid for the current earth-moon configuration. The ROLO (RObotic Lunar Observatory) model (Kieffer and Stone, 2005; Stone et al., 2020) is the primary means to model lunar spectral irradiance, however it is not well suited as an absolute reference due in part to errors associated with atmospheric effects as it was developed from ground-based measurements. Consequently, early lunar AOD calculations that relied solely on this model for TOA lunar irradiance were not of adequate quality and often produced unphysical results, e.g. large negative AODs during low AOD intervals, see example from AERONET site Goddard Space Flight Center (GSFC) (Fig. 1).
Fundamentally this problem can be addressed either by (a) correcting the AOD product derived from imperfect irradiance input or (b) correcting the irradiance model. Kieffer (2022) describes one such improved model the Spectral Lunar Irradiance Model (SLIM) that incorporates data from 25 different instruments that is considered to significantly improve the accuracy of lunar irradiance predictions across the 350 to 2400 nm range compared to the ROLO model. SLIM also utilizes a new methodology (SLIMED) that includes a specialized libration model (MapLib) and is modeled continuously across all wavelengths and geometric parameters (phase angle, libration etc.) unlike prior models. Additionally, an alternative SI-traceable lunar irradiance model, the Lunar Irradiance Model of the European Space Agency (LIME), is under development (Toledano et al., 2024).
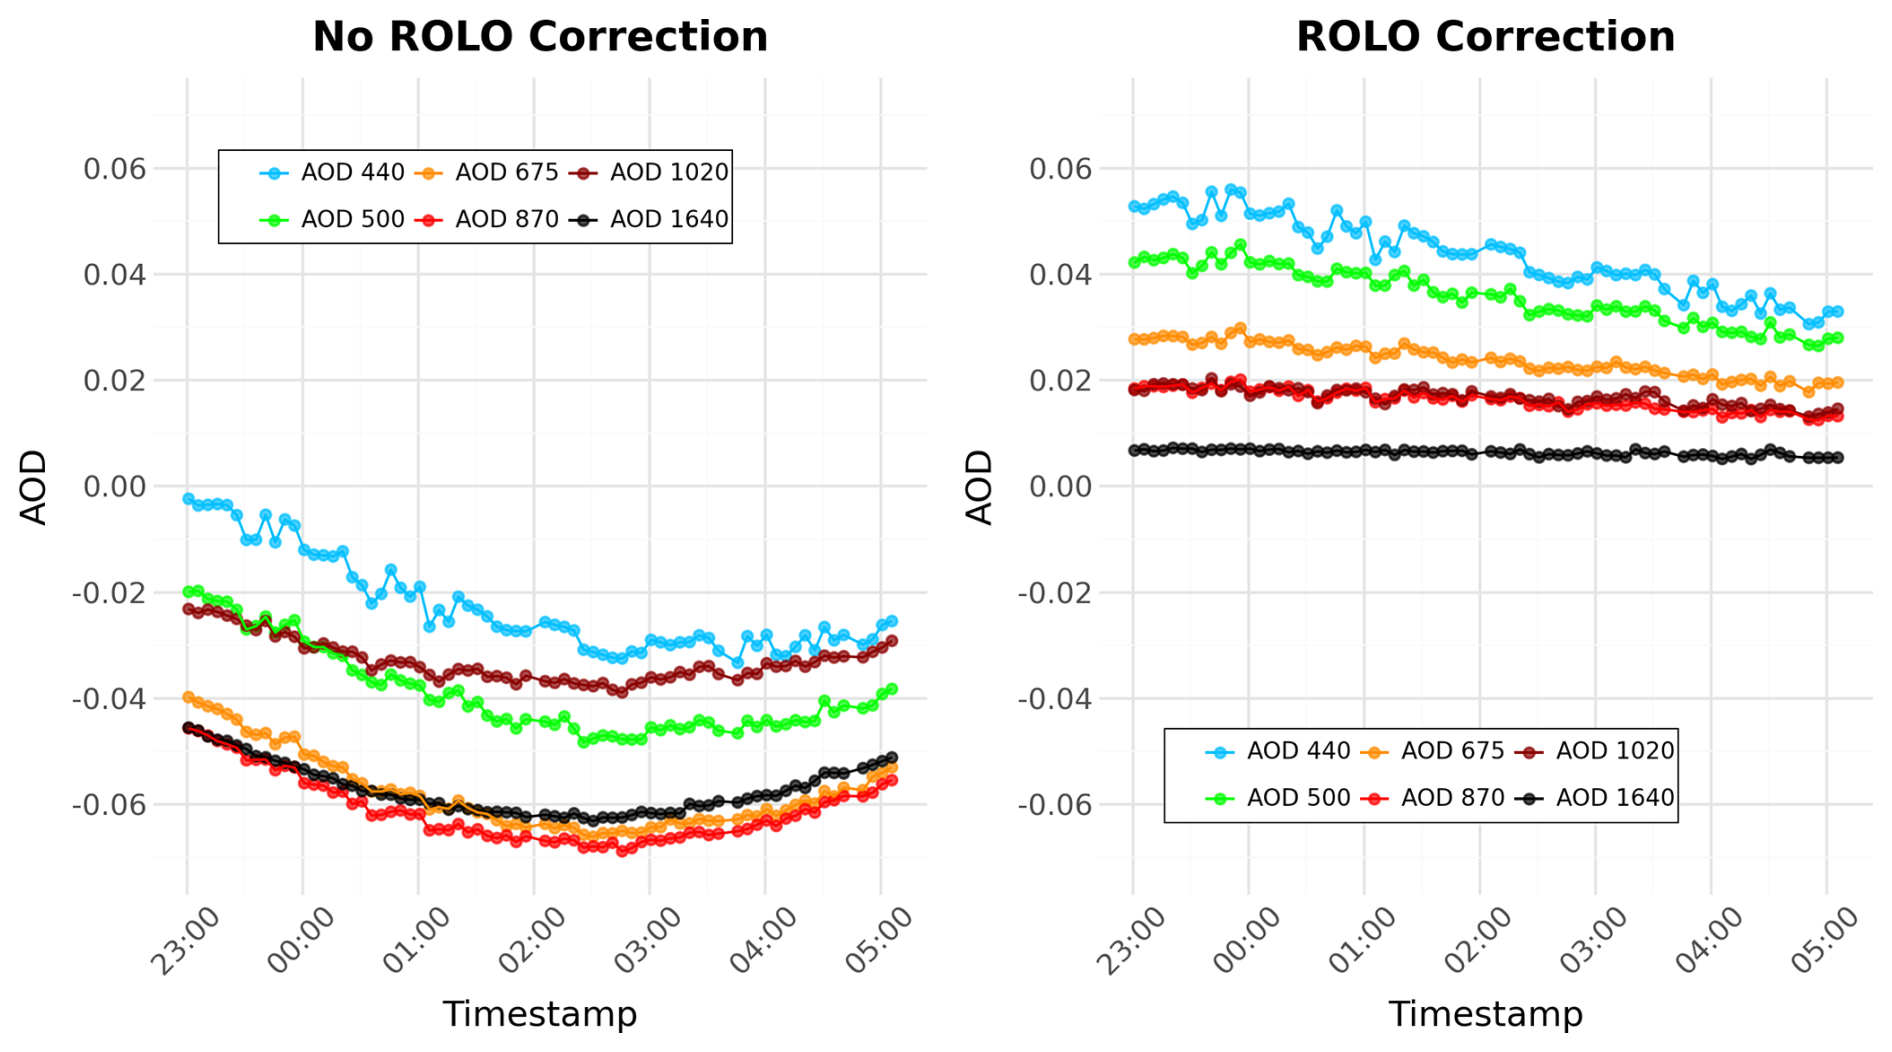
Figure 1AOD at GSFC on 21 January 2024 derived with uncorrected and with bias-corrected ROLO TOA irradiance.
The strategy adopted by AERONET for the provisional product (released in 2016) was to correct for the limitations of ROLO irradiance by comparing V0's from high elevation lunar Langleys with solar Langleys at Mauna Loa Observatory (MLO) and Izaña calibration facilities. For a given instrument, the solar to lunar V0 ratios should ideally match the sun/sky gain ratio of 4096 (Li et al., 2016). Thus, observed deviations from this nominal value could be determined as a function of lunar phase angle (LPA) and used as an empirical correction factor by which the baseline ROLO irradiances are modified. A large number of Automated Langleys (Langley pair counts ranged from 634 to 1537 depending on channel) were made with empirically determined thresholds based on AOD and correlation coefficient of the Langley fit with lunar Langleys computed following the same Langley protocol used for solar Langleys. The updated corrections in this paper are now based on a much larger set of solar/lunar Langley pairs than were used for the original provisional lunar dataset. For each corresponding pair of solar and lunar Langley, the pair was retained if the associated AOD was less than a maximum AOD (varies with wavelength, 0.015–0.04), if the average AOD during the solar and lunar Langley intervals agreed by a δ AOD and if the correlation coefficient was sufficiently high. These thresholds were selected to balance Langley quality with number of Langley pairs over the full LPA range (Table S2 in the Supplement). While neither solar nor lunar Langley V0's are strictly constant due to changing TOA irradiance over time, the solar irradiance changes in a highly predictable manner due to earth-sun distance. By contrast, the variation in lunar irradiance is more rapid and far more complex in nature. It is this variation in lunar irradiance that is particularly challenging to model precisely and this necessitates an empirical correction to the ROLO predicted values in order to compute accurate lunar AOD. Consequently, the process that has been employed is to take the solar V0, normalized to 1AU, convolved with the TSIS-1 Hybrid Solar Reference Spectrum, V2 (Coddington et al., 2023) in order to define a spectral irradiance calibration (W m−2 µm−1/ADU) for a given instrument. This instrument-specific calibration is then applied, with default sun/sky gain adjustment, to each evaluated V0,lunar to compute the inferred TOA lunar spectral irradiance E0,lunar. Finally, this E0,lunar is compared with the modeled E0,ROLO from ROLO for the specific lunar conditions; lunar phase angle, spectral and angular dependence of reflectance etc. to provide an empirical bias for the full range of moon scenarios. The lunar geometry inputs necessary for ROLO are computed from the NAIF SPICE library (Acton, 1996; Acton et al., 2018). This record of Langleys, acquired from MLO and Izaña, were used to fit a nonparametric local regression (LOESS) model and generate a lookup table (LUT: 0.8° resolution) of ROLO correction factors for each wavelength as a function of Lunar Phase Angle (LPA). The LPA is defined to be 0° at full moon and 90° (−90°) at waning (waxing) quarter moon. The per-instrument coefficient of variation (CV: std/mean) of the moon V0's was larger (0.52 %–1.05 %) than for the sun V0's (0.19 %–0.67 %) for all channels. The percentage adjustments for each solar/lunar Langley pair necessary for equal day/night V0's and the associated ROLO LOESS correction fit are shown for the 440 and 675 nm channels in Fig. 2. The greater noise in Fig. 2 at 440 nm is primarily attributable to the lower signal in this channel. Most of the scatter is associated with earlier versions of the Model T Sun–Sky–Moon photometer, whereas more recent instrument versions generally exhibit less divergence. However, the dataset was not restricted to the most recent CIMEL instruments because doing so reduced the number of Langley pairs by a factor of 2–3 and because the additional scatter is largely random. Nevertheless, the LOESS fits derived from each candidate dataset were very similar, with overlapping confidence intervals over all or most of the LPA range. The confidence interval band is noticeably narrower for the more inclusive dataset, which includes the earlier Model T instruments, particularly at large phase angles (°) where data are sparse. This increased precision is the expected benefit of the larger number of input observations. Once the LPA-adjusted calibration coefficient is acquired, the calculation of lunar AOD is carried out identically as for solar AOD. The bias correction determined for each channel is provided in the Supplement (Dataset S1).
While lunar libration (the apparent oscillation of the Moon that changes the viewing geometry of the lunar surface from Earth) is taken into account by the ROLO calculation, the AERONET bias correction is not explicitly a function of this parameter (libration varies independently of LPA) so it will introduce some additional variation which could be consequential at large lunar phase angles. This secondary effect is being assessed currently and the AERONET bias correction could potentially be refined to include this explicitly for an upcoming data version. Application of these LUT corrections are found to produce good continuity of AOD across day/night transitions (Fig. 3).
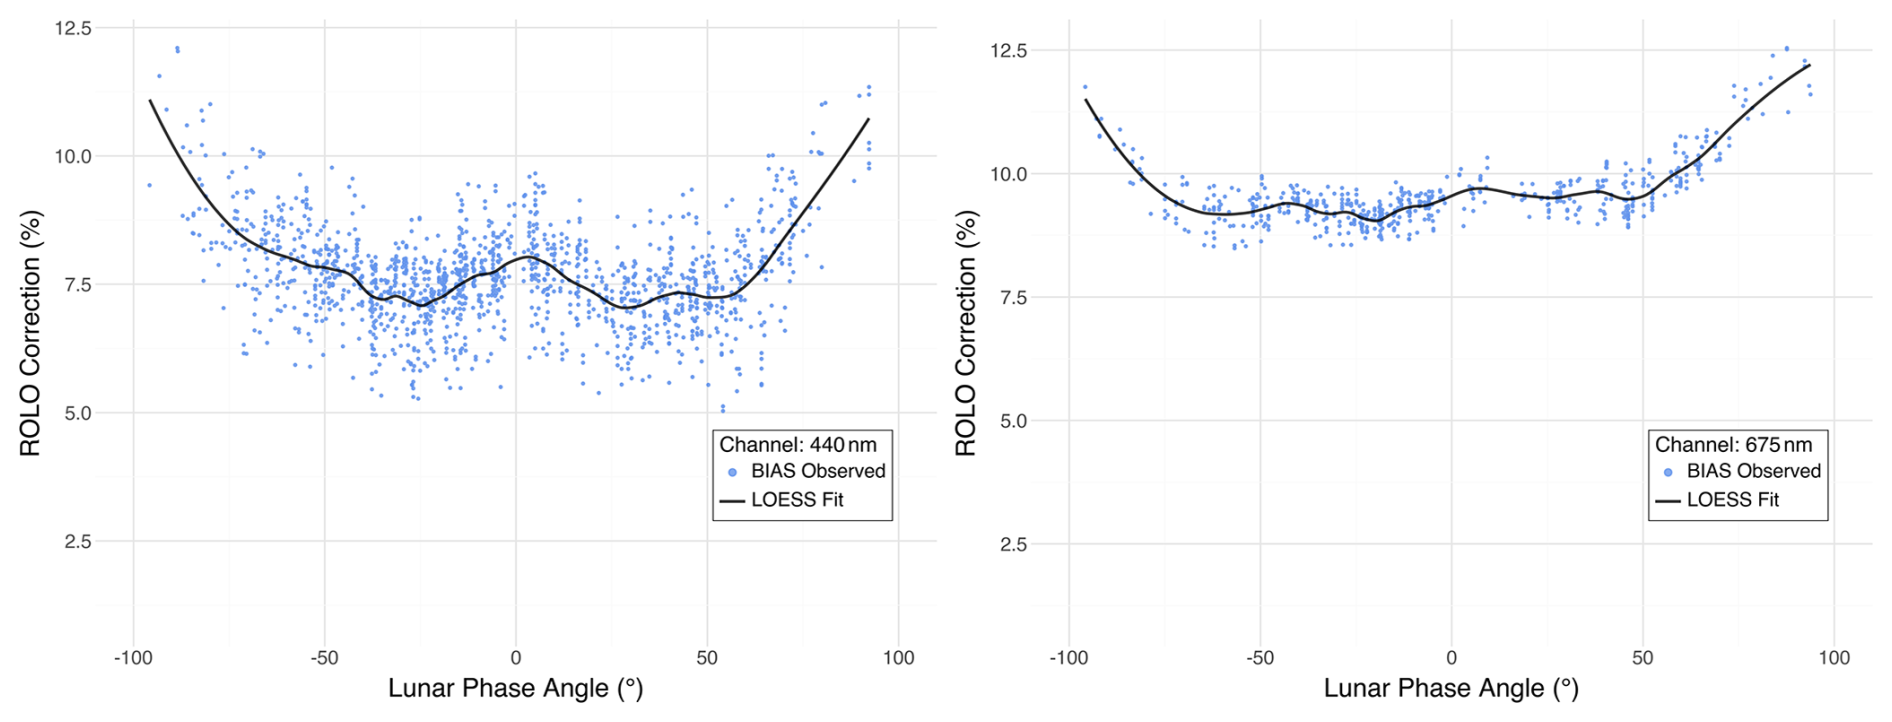
Figure 2Observed bias in solar/lunar Langley ratios and computed fit for correction (increase) of ROLO irradiance at 440 and 675 nm CIMEL wavelengths.
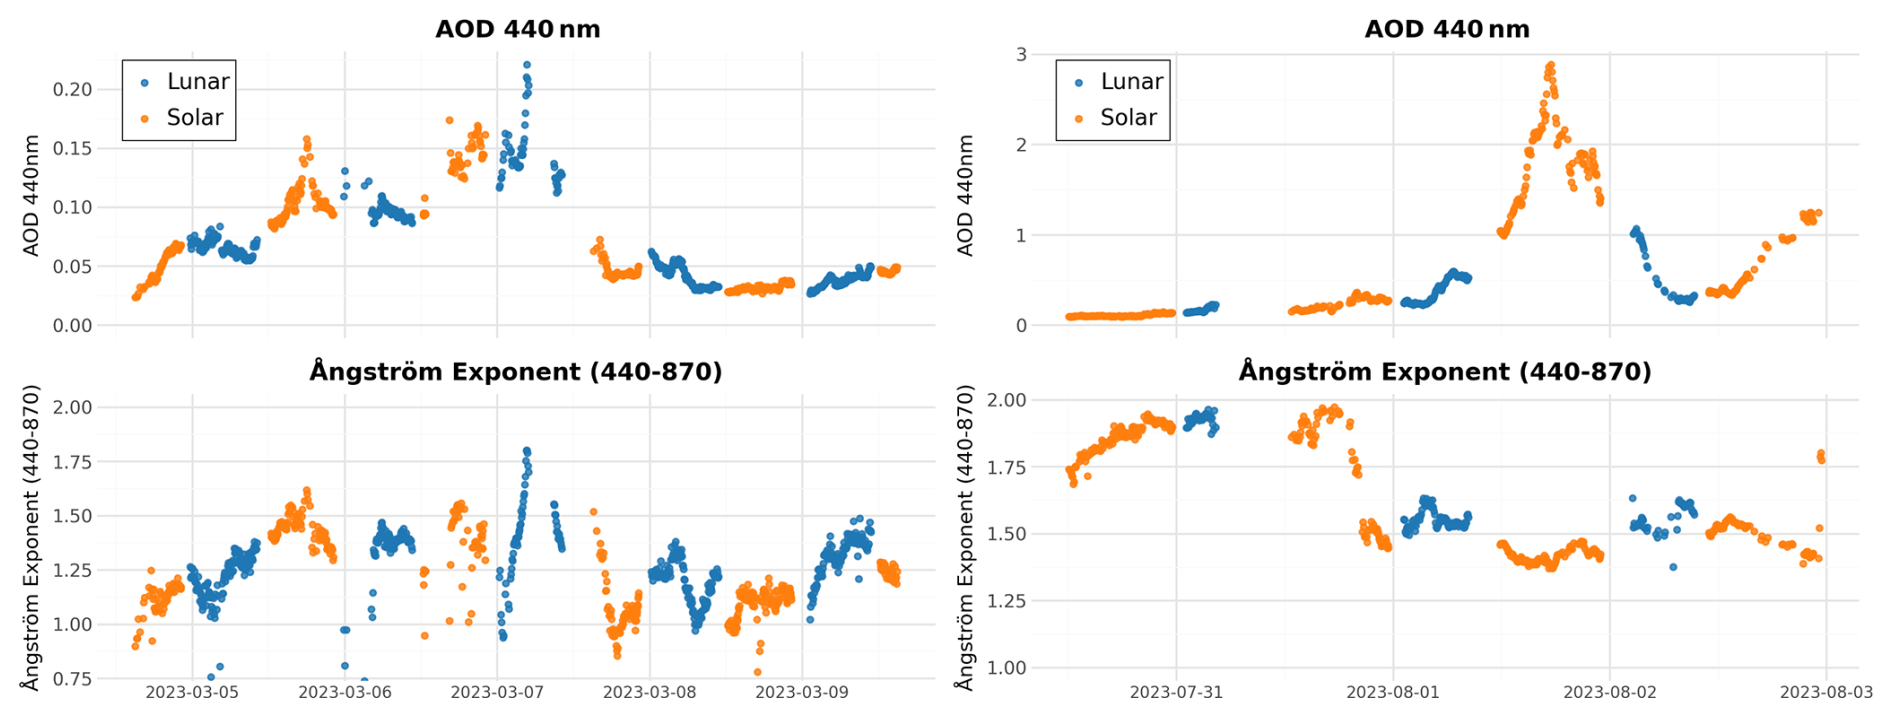
Figure 3AOD440 nm and Ångström exponent across day/night transitions for a low and high AOD interval at Goddard Space Flight Center.
3.1 Moon as Irradiance Source
Solar AOD calculations rely on the sun as a very stable source at top-of-atmosphere (TOA) with earth-sun distance on an annual cycle as the primary cause of changes in expected irradiance. While the sun is ultimately the source of the moon's reflected light, the lunar irradiance for an Earth observer additionally varies as a function of lunar phase angle (LPA), i.e., the fractional illumination as viewed from the surface) on a monthly scale with changes of significance to AOD over much smaller time intervals. The lunar surface itself is comprised of material types correlated with a range of albedos that affect lunar brightness depending on the particular portion of the moon that is illuminated, and the reflected light is further influenced by surface features that also vary with viewing angle. Although solar irradiance varies by ±3.4 % over the course of a year (with an additional small fluctuation due to an 11 year cycle of solar activity of 0.1 %), this is a simple geometric effect that can be corrected accurately and precisely. By contrast, the lunar irradiance can change by a percentage comparable to the annual solar change in 5–6 h or only 2–3 h in the period near a full moon. For the full moon period, this is due to a number of causes including the oppositional effect (“heiligenschein”) where the highly porous lunar regolith structure produces multiple scatter of the returned light that constructively interferes (Hapke et al., 1998). This phenomenon is further complicated by the occurrence of “shadow-hiding”, a purely geometric effect where the normally incident sunlight causes any shadows cast by lunar material to be hidden by the material itself resulting in substantial (∼ 40 %) increases in lunar brightness in the full moon intervals (LPA: −5 to +5°) which only lasts ∼20 h. The lunar brightness at full moon is 10× or more that at quarter moon representing an extremely large span of values over the range of lunar phase angles in which CIMEL measurements are made. Even outside of the full moon window, the change in signal from near full moon to quarter moon might be a 7:1 ratio which is much larger than expected if one simply assumed a sphere with lambertian scattering (), again a consequence of backscatter effects of irregular lunar regolith surface features. Additionally, the variation of earth-moon distance produces a variation of irradiance of ±12 % within 2 weeks from apogee to perigee. While the effects on lunar irradiance related to orbital geometry such as the non-linear phase function can be definitively modeled, computing the lunar signal remains far more challenging than that for the solar signal due the inhomogeneous and structurally complex lunar surface as well as spectral differences in reflectance and much smaller time scales of variation. Lower signal from the lunar source also precludes estimation of AOD for the UV channels and leads to increased triplet variability (variation of AOD taken at three discrete measurement times within a 1 min interval), particularly when both lunar phase angle (LPA) and lunar zenith angle (LZA) are large.
3.1.1 Difference in observational periods of solar and lunar AOD
While the daylength varies gradually over the course of the year, the corresponding night interval of lunar AOD cycles much more rapidly and can differ greatly in duration from that available for sun measurements; see example for 1 year at GSFC. Figure 4 presents the maximum day duration of solar AOD collection (SZ °) and the observable lunar interval refers to data when LPA is within the range −90 and 90° and when the solar zenith angle >=98° (to avoid solar contamination). The solar day at GSFC varies by about 5.5 h throughout the year, whereas observable lunar night duration can change by more than this (∼7 h) in less as few as 6 d and the annual trend is the inverse of the solar trend. Consequently, the difference between solar and lunar measurement windows can be significant at times. Additionally, the lunar phase angle constraints also limit the lunar AOD window to approximately half of every month period (typically allowing for 12–14 d of possible measurements) thus, solar and lunar AOD datasets differ markedly in temporal coverage on both daily and monthly time scales. Plots showing the potential observation hours by latitude for solar and lunar observations have been generated as well (Fig. S1 in the Supplement).
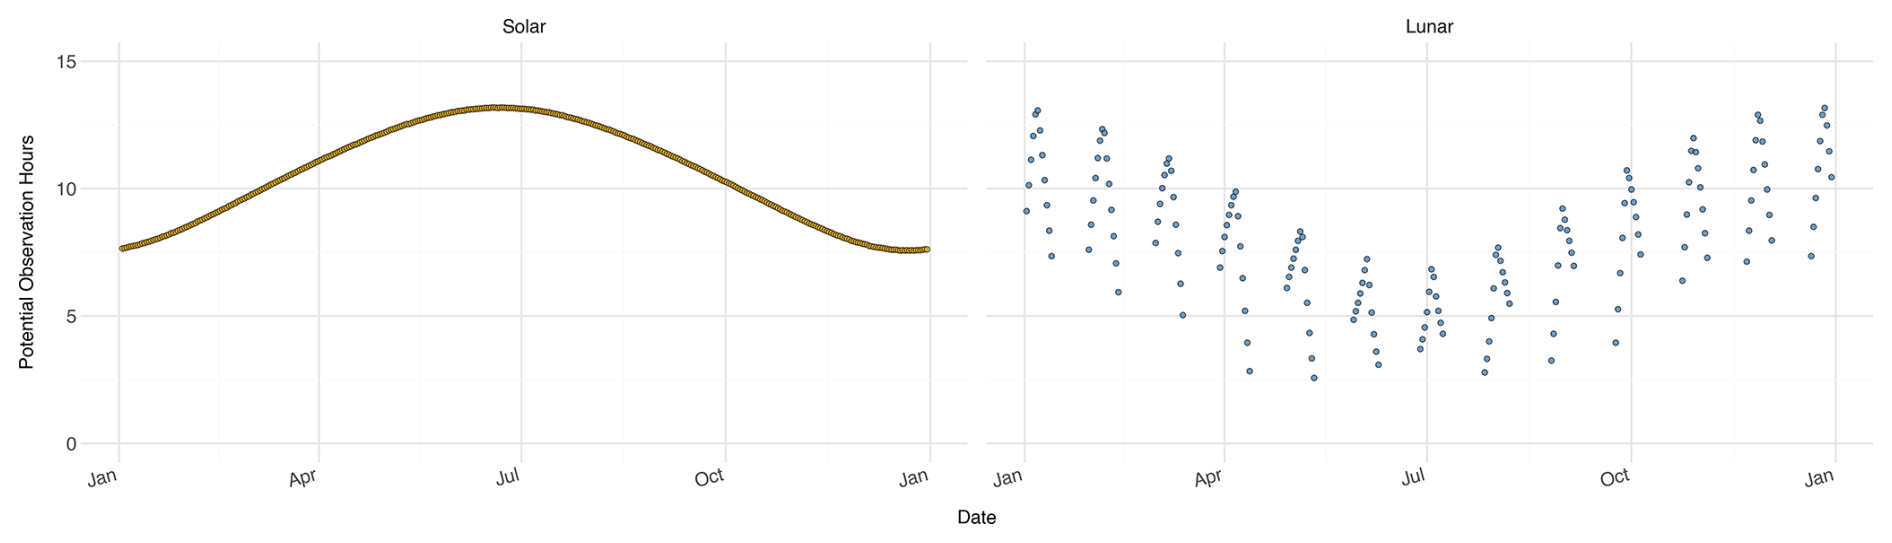
Figure 4Comparison of solar and lunar potentially measureable hours at GSFC (38.99° N, −76.84° W) for 1 year.
4.1 Assessing Bias Correction
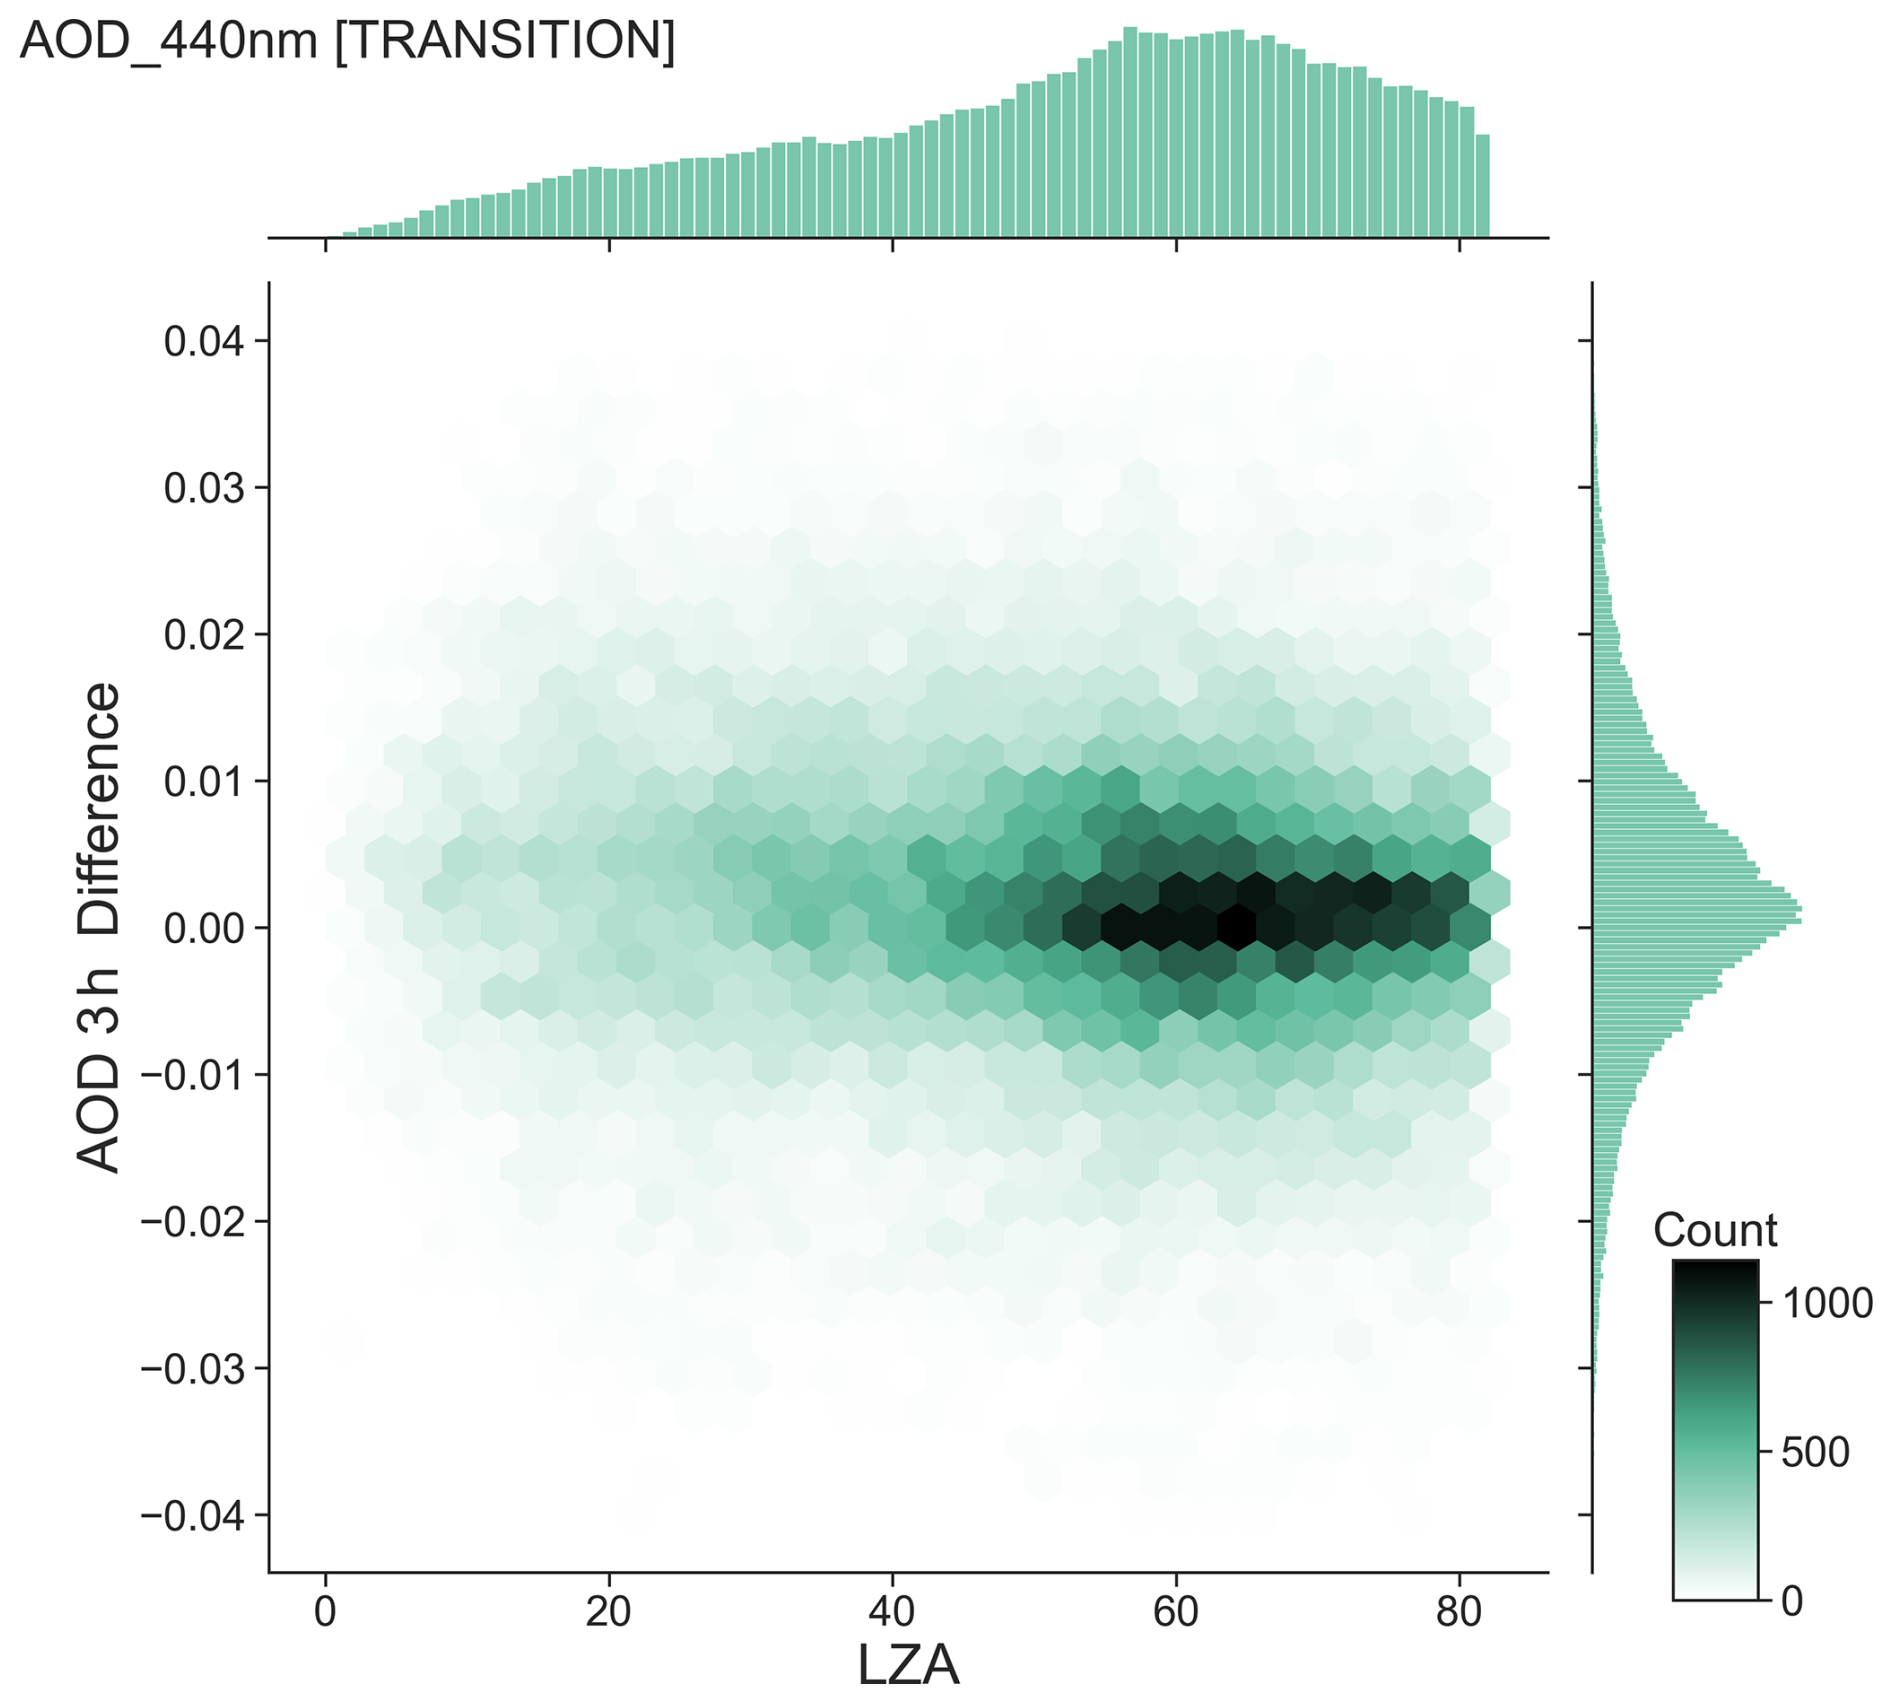
The applied adjustment to lunar irradiance due to the empirical bias correction can often be a large factor (∼10 %) so it's critically important to examine the resulting product for potential bias. For this purpose, the most straightforward standard of comparison would be the associated solar AOD for the same instrument. While the sun and moon measurement periods are mutually exclusive, the transition interval from day to night and vice versa provides an opportunity to quantify differences in this relatively short window for hundreds of sites on a large number of suitable days. Due to the need to avoid solar contamination of the signal, lunar AOD could not be acquired unless the sun was significantly below the horizon (SZA > 98°) which results in at least a couple hours without data following the final solar AOD measurement even if the moon is above the horizon at sunset (likewise lunar measurements will be precluded for some duration prior to sunrise). This transition interval was standardized for all sites by computing the mean and standard deviation of the average AOD difference for all 3 h windows during the period which included an hour of both day and night measurements with at least 6 observations in each day/night average (measurement protocol nominally has observation every 5 min). Since the nighttime calibration accuracy was specifically being examined in this exercise, the hour averaged data were also restricted to cases of low AOD with small standard deviation (AOD440 nm≤0.1 and SD<0.01) for both solar and lunar intervals to minimize the effects of potential cloud influence– though the choice of thresholds had little effect on the results. There are many environmental reasons why day and night AOD may differ that are unrelated to calibration such as changes in cloud cover, relative humidity and dominant emission sources. In situations where these factors notably change over the 2–3 h intercomparison window it is not expected that the solar and lunar AOD will agree over this transition. Therefore, these confounding factors have been minimized by looking at low AOD, stable conditions so any bias in calibration can be assessed properly. Figures 5 and 6 show these transition AOD 440nm differences from data acquired at 372 sites measured with 454 different CIMELs vs. lunar phase angle (LPA) and lunar zenith angle (LZA). The degree of agreement between solar and lunar AOD is not notably dependent on LZA despite lower signal at large lunar zenith while there is some varying structure to the differences in Fig. 5 as a function of LPA suggesting the complexities of lunar irradiance are not always perfectly bias-corrected though the deviations are minor, and diminish with increasing wavelength. When assessed in 10° lunar phase angle bins, the mean AOD 440nm transition differences were within ±0.005 for all bins except [80–90°] (0.0072) which has the lowest lunar signal but also compromises a small fraction of observations (2.7 %). Mean AOD differences for 675 nm and longer wavelengths were within ± 0.002 for all LPA bins. These statistics are presented in Table S3.
The transitions compare solar vs. lunar AOD over a ∼3 h interval when aerosol conditions may have changed, which would degrade the comparison accuracy. So, comparable datasets were produced with a similar comparison of AOD with 3 h lagged AOD for the same measurement type (using only solar AOD and only using lunar AOD). These comparisons would also experience effects due to real aerosol changes within the lagged window and thus provide statistics as a point of reference for the transition AOD differences.
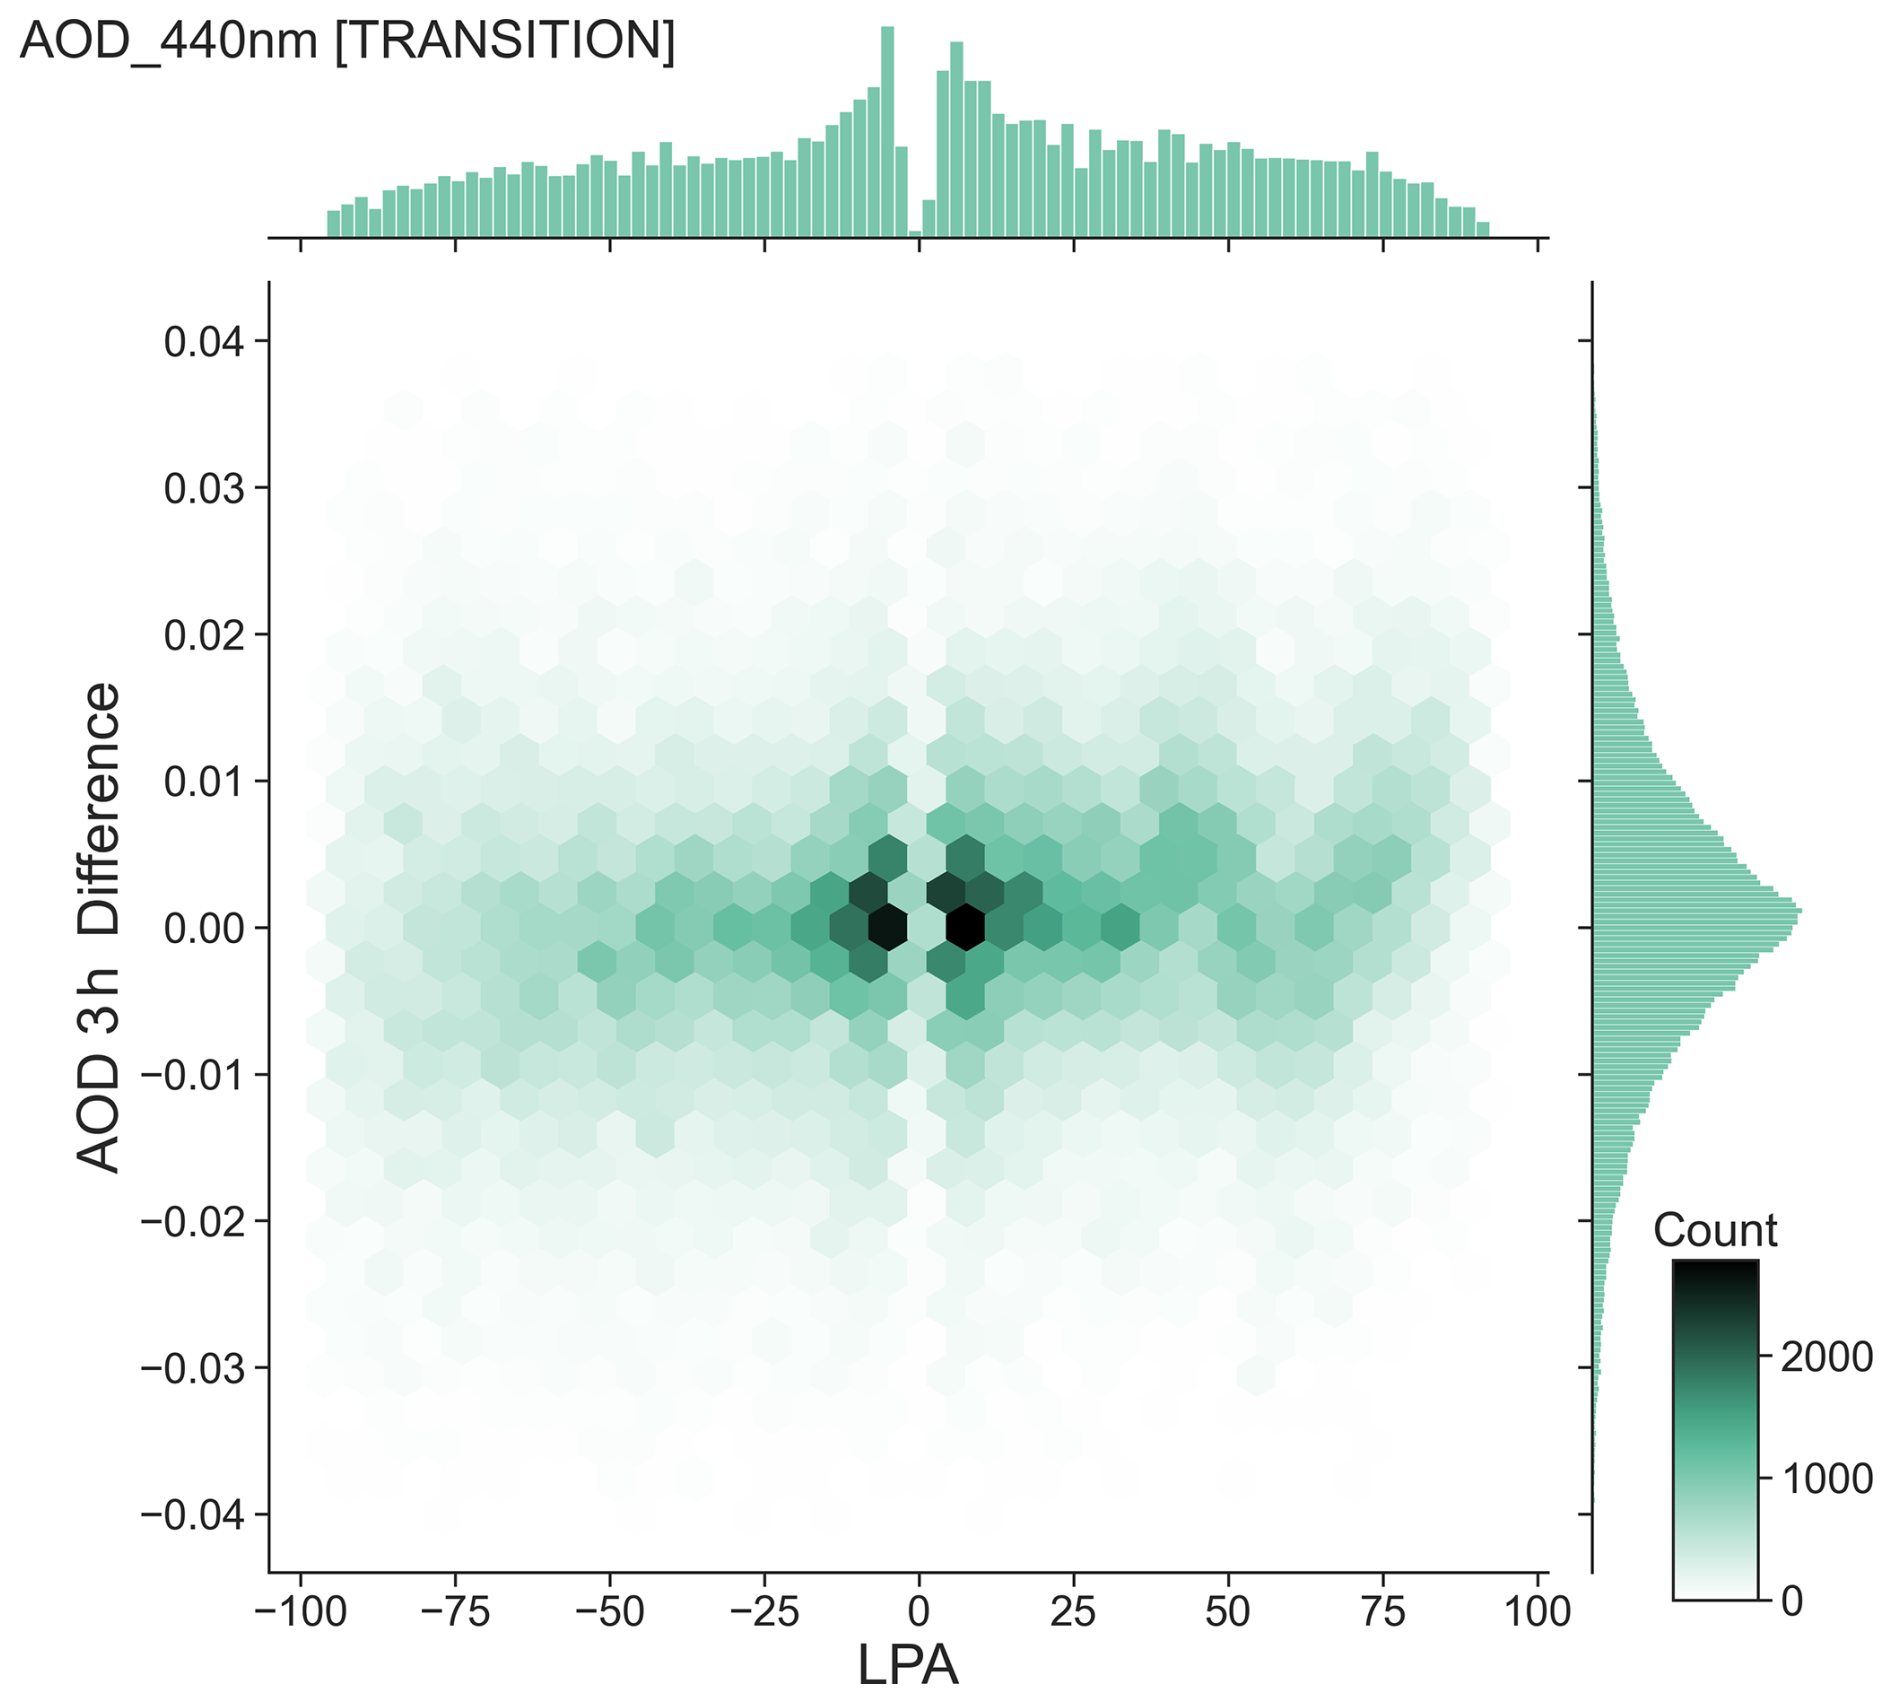
Figure 5Difference in 3 h window AOD440 nm for transition from day to night (night to day) vs. lunar phase angle from 372 sites (N=281 159).
The additional statistical analysis was restricted to 24 h periods containing all three measurement types: daytime solar AOD, nighttime lunar AOD, and transition AOD differences in order to maximize the commonality of the comparison. For every wavelength, the mean AOD differences across the transition from day-night (night-day) are negligibly small and similar or smaller than the differences observed within day or within night periods implying the absence of systematic bias in the lunar AOD (Table 1) as well as Ångström exponent (440–870 nm), Precipitable Water Vapor, fine and coarse mode AOD from the Spectral Deconvolution Algorithm (SDA) of O'Neill et al. (2003). (Table 2). While the statistics in these tables are for low AOD conditions, Figs. 7 and 8 show the night to day and day to night to day AOD correspondence up to AOD440nm=1.0 which adds data from an additional 50 sites previously excluded by the 0.1 AOD limit.
Table 13 h Time Interval AOD Difference Statistics by Interval (Means are computed from the set of interval averages from common 24 h windows).

Table 23 h difference of Ångström Exponent, precipitable water (cm), SDA AOD fine and coarse mode components for transition interval.

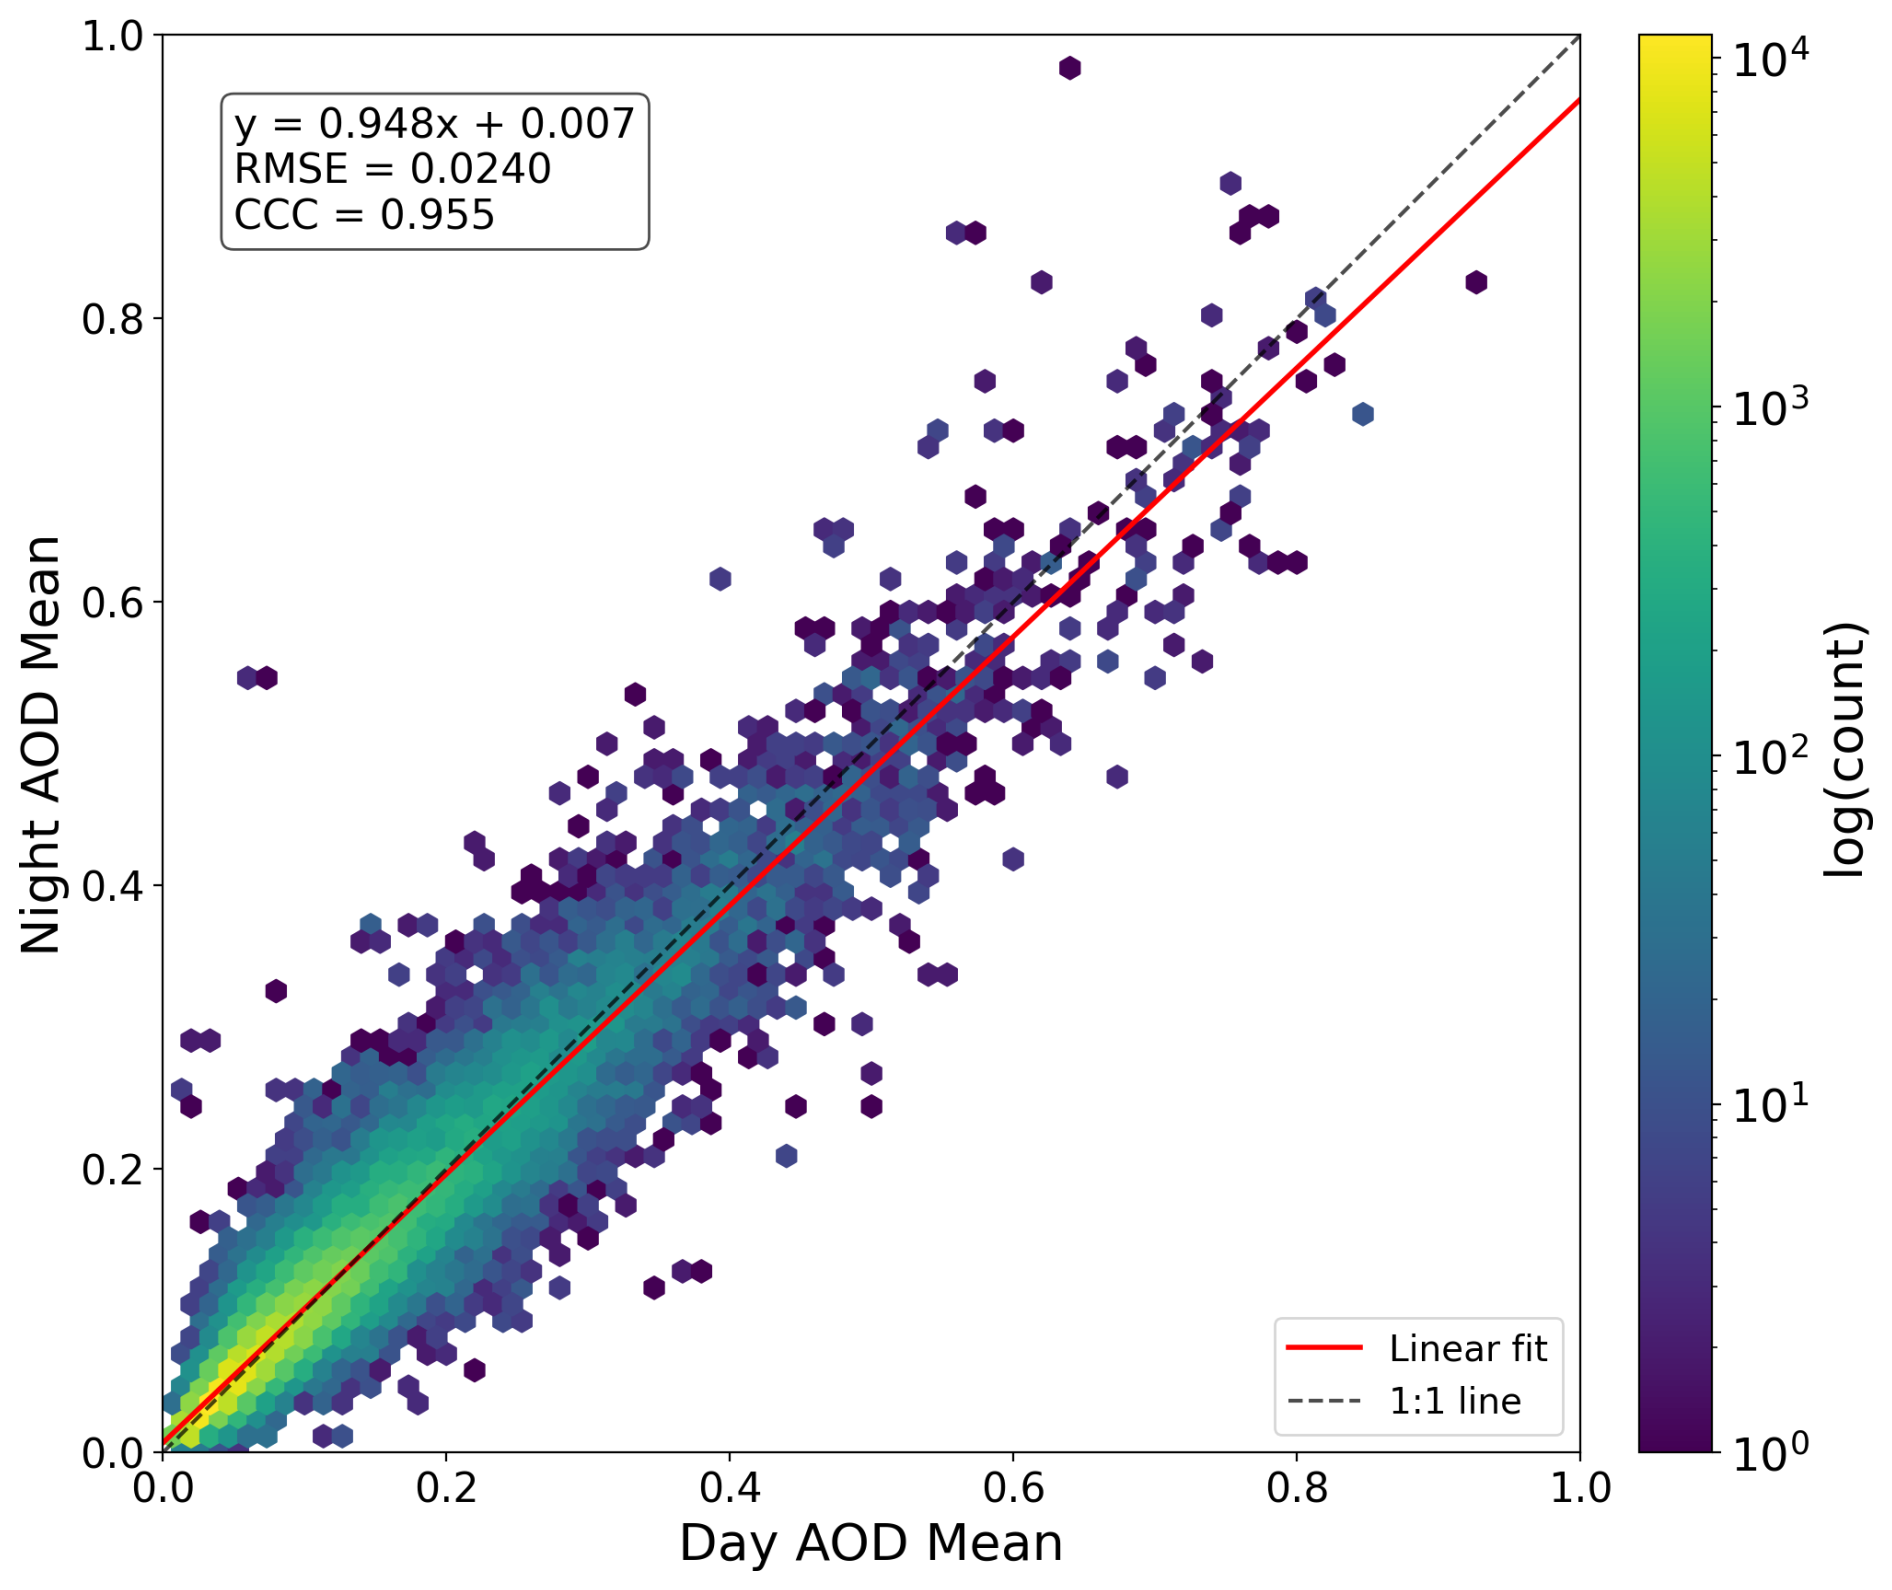
Figure 7Difference in 3 h window AOD440 nm difference for transition from day to night (, N=212 000).
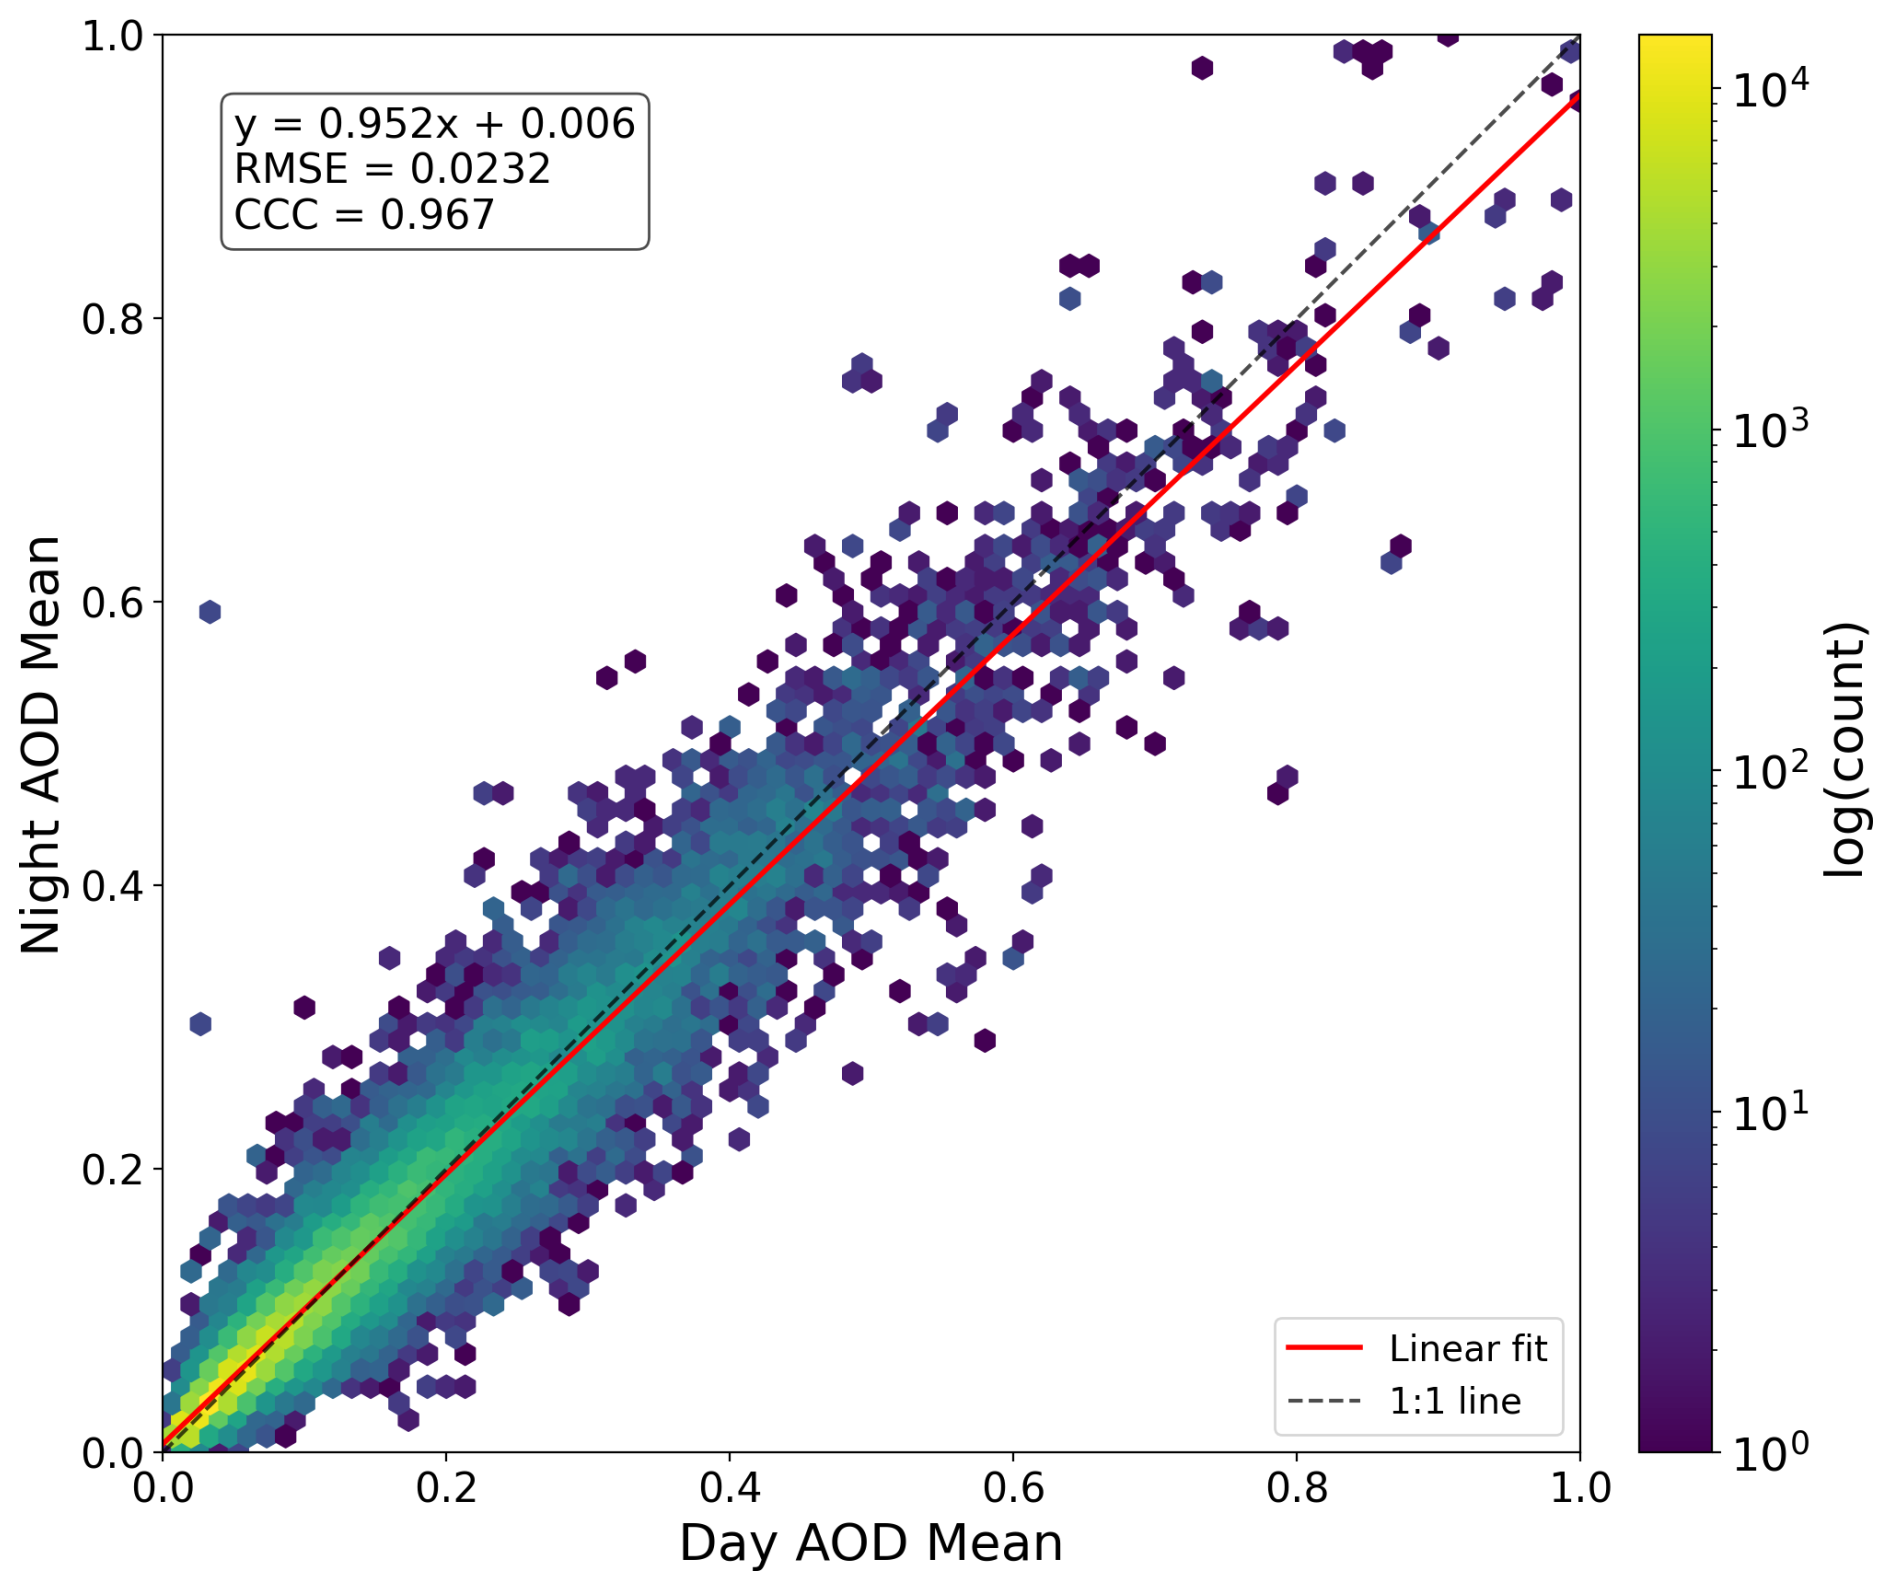
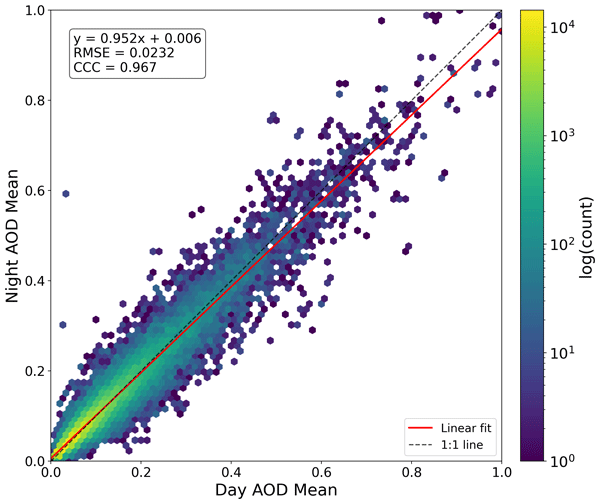
We are checking for systematic bias between lunar and solar AOD. Even with stability thresholds applied to the 1 h day/night AOD means, the random component of AOD differences increases substantially with increasing AOD due to real atmospheric aerosol variability over the ∼3 h transition interval. To explore this, means of AOD differences binned by the paired measurement mean AOD and associated 95 % confidence intervals were computed by two methods: a standard normal approximation based on the sample mean and standard error, and bootstrap resampling. The bootstrap method is distribution-free, does not assume Gaussian errors, and accommodates asymmetric sampling distributions – considerations particularly relevant at higher AOD where transition pair counts are lower and AOD difference distributions become increasingly skewed due to episodic aerosol loading. The two methods yield nearly identical confidence intervals across all bins through AOD440 nm∼0.8, providing mutual validation, with meaningful divergence only at the highest AOD440 nm bins (≥0.9) where sample sizes are greatly reduced. At low AOD440 nm (<0.2), the mean solar-lunar AOD differences are negligibly different, ∼0.002 for both 3 h solar-lunar transition interval directions (day to night, night to day), much less than the AERONET instrumental uncertainty of 0.01. Both diurnal transition scatter plots for day AOD vs. night AOD inclusive of all AOD < 1.0 (Figs. 7 and 8) have nearly identical slope ∼0.95 and CCC (concordance correlation coefficient) ∼0.96. A slope slightly below unity is consistent with a tendency for daytime AOD to exceed nighttime AOD440 nm at elevated aerosol loading. This binned mean difference analysis shows a small but statistically significant higher daytime AOD440 nm of 0.013 (night-to-day, CI: [0.011, 0.017]) and 0.016 (day-to-night, CI: [0.012, 0.020]) for AOD440 nm bin [0.6–0.8] which is the highest AOD bin with adequate sample size (n=2138 and n=2988 for day to night and night to day respectively). This should not be interpreted as a calibration or measurement difference between solar and lunar instruments, but rather as a plausible real diurnal aerosol signal, consistent with known daytime aerosol production mechanisms (photochemistry, greater daytime emission of anthropogenic and biomass burning aerosols, etc.) and the absence of any corresponding effect at low AOD.
The AOD measurement absolute accuracy does not depend on AOD level for CIMEL observations. However, the solar/lunar comparison is made after an interval of several hours when aerosol conditions can change. Higher AOD almost without exception occurs in more variable conditions, so the spread of AOD differences across this time window would be expected to increase (greater standard deviation of AOD difference) though this is mitigated to some degree by the stability check on the computed means. Even a small fractional change in AOD at higher aerosol loading over this interval would manifest as larger individual solar/lunar AOD differences – which would not be the case at low AOD (barring cloud-contamination).
The spread of day-night AOD differences, assessed as the standard deviation of linear regression residuals (observed AOD of the lagged interval minus the value predicted by the linear fit), was computed for 0.1 AOD bins for the combined day/night and night/day transitions as well as the corresponding 3 h lagged “within day” and “within night” comparisons (Fig. S2 and Table S4). Notably, all three groups show a progressively increasing standard deviation of AOD differences as AOD increases strongly suggesting this is fundamentally an effect of the increasing aerosol variability. The standard deviation of the AOD differences for the transition data is higher but quite similar to the lagged “within day” and “within night” values. The lagged AOD “night only” trend is comparable to the “day only” trend suggesting the increased scatter is not a product of low lunar signal at higher AOD. Note: The sample sizes are much larger for the “within day”/“within night” than the transition group and sample size drops off dramatically for the highest AOD bins. Good agreement of the solar and lunar AOD (within ± 0.0075) is also observed for individual sites as depicted in Fig. 9. This histogram shows all AERONET sites with more than 500 transition comparison events acquired from at least 50 different days (N=106 sites) and demonstrates that all these locations had average AOD440 nm differences between day and night less than ±0.01.
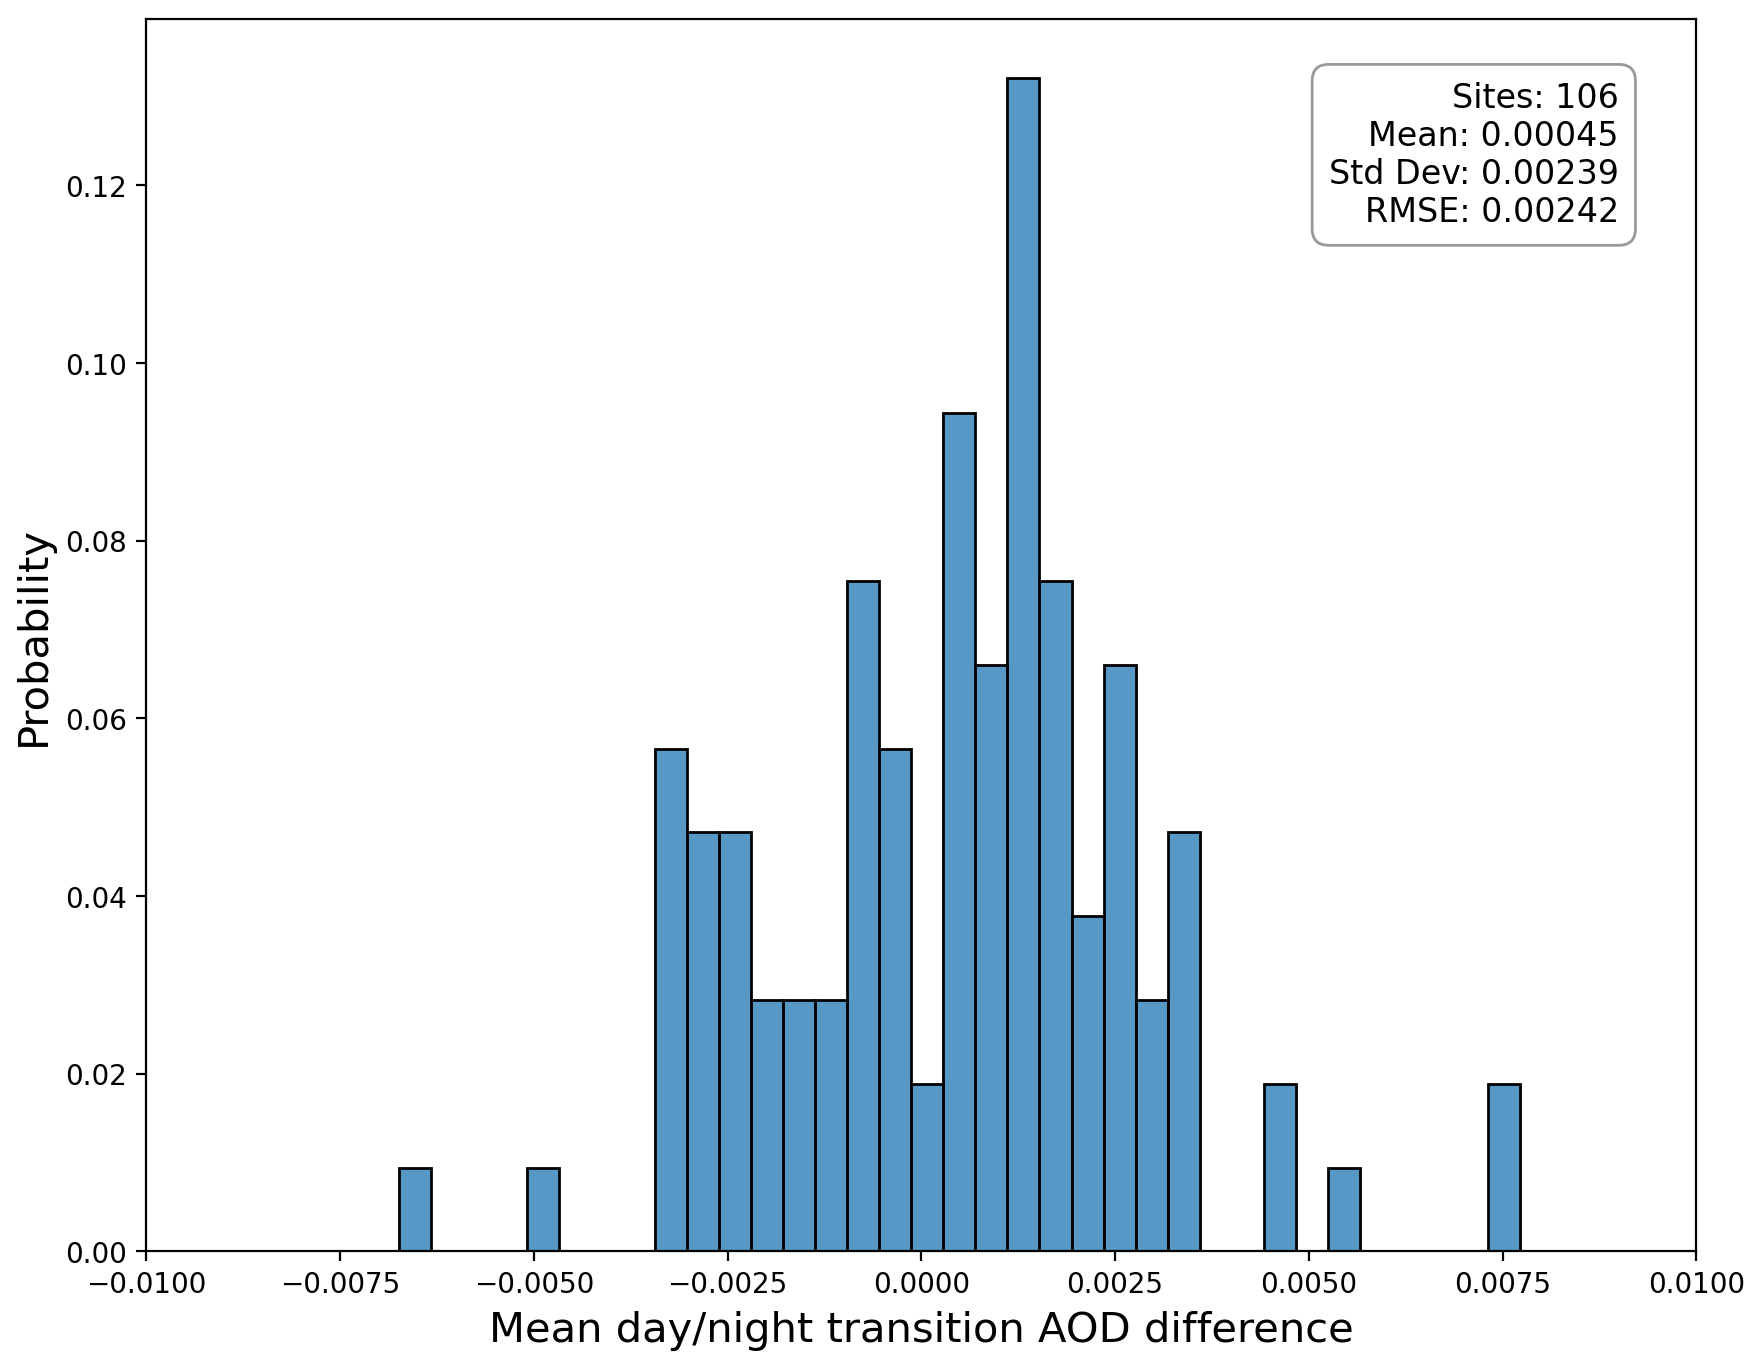
Figure 9Histogram of mean AOD440 nm differences for all sites with more than 500 transition comparison events (N=106 sites).
No dependence of the 3 h transition AOD difference on latitude is observed when the data are binned by latitude (see Table S5). Limited statistics (due to larger day/night time gaps at very high latitudes) at sites with ° can be computed for four sites: Kuopio (62.9°), Yellowknife_Aurora (62.5°), Narsarsauc (61.2°), and Marambio (−64.2°) which exhibit a very small mean AOD440 nm difference of 0.0009±0.014 (N=369).
4.2 Potential effects of differences in cloud-screening for lunar data
The cloud-screening protocols for lunar AOD are the same as for solar AOD with one exception. The lunar measurement sequence does not perform the cross-scan scenario (sky radiance measurements across the aureole during solar operation) which is used to identify clouds via the “curvature” check in the cloud-screening algorithm (Giles et al., 2019). This is primarily a check for thin cirrus clouds that are relatively uniform in space and time therefore not easily detected by the temporal variance checks in AERONET cloud screening. It's not possible to definitively determine the effect of omitting this check however we have attempted to estimate this by looking at the solar AOD data with only the curvature test disabled (other checks applied normally) and comparing the results to the standard cloud-screened data. The data removed by the curvature check represents only a subset of the total cloud-screened data in that the majority of cloud-influenced observations will have already been removed by triplet variability and daily time series variability checks in the preceding QC processing. Giles et al. (2019) calculated that 4.55 % of global solar Level 1.0 AOD observations are eliminated by the curvature check. Further, there is a practical limit to the range where curvature can reliably distinguish thin cirrus clouds from aerosols with effectiveness dropping off as the AOD becomes large, thus isolating the consequences of lacking curvature check is a nuanced assessment.
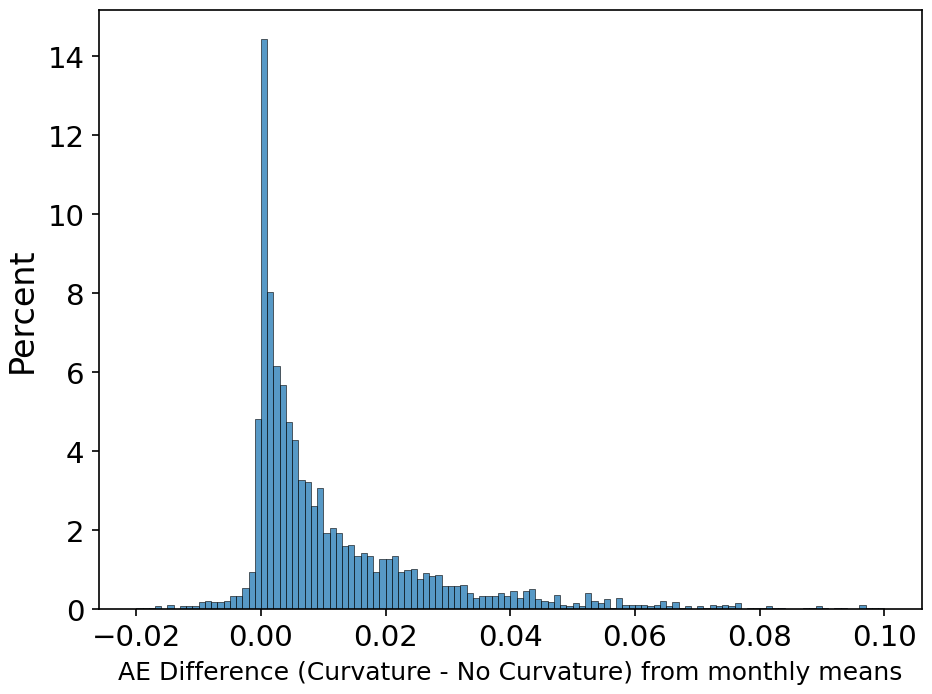
Both monthly and daily averages of AOD and Ångström exponent (AE) were computed for the solar AOD record at 259 sites with and without curvature check included in the cloud-screening. While there is an expected tendency of reduced AOD and increased AE when curvature check is utilized, the typical monthly differences are negligible (Figs. 10 and 11). Aggregated multi-year monthly average differences by site (curvature-no_curvature) of AOD 440nm are very small ranging from −0.0004 to −0.0014 and 97 % of the individual monthly means had mean AOD differences of <0.01 while 7 % of months had no difference. The differences shown in Figs. 10 and 11 are multi-year month averages so individual months would be expected to exceed this. However, even when monthly AOD and AE are considered individually, the statistical differences are typically quite small. Of 14 810 individual months, only 9 months (0.1 %) had a mean AOD difference greater than 0.02 and only 41 (0.3 %) had a mean AE difference greater than 0.1 when removing the curvature check. The potential for significant changes in daily averages is larger but even so only 1.1 % of days had an increase of AOD440 nm>0.02 and 2 % had an increase in AE > 0.1 (mean_AOD_diff440 nm=0.002, mean_AE_diff=0.0002). Therefore, in general the lack of curvature check would not normally be expected to have notable consequences for the lunar AOD cloud-screening, but note that there are seasonal intervals where changes in Ångström exponent are more pronounced and may be significant in some regions, such as southeast Asia often in association with monsoonal activity and a small number of locations had 5 %–10 % of the data record where day average AE was >0.1 lower without the curvature check. Even when the absence of curvature check does not profoundly affect mean AOD or AE, the additional number of observations removed can be substantial. For instance, at the AERONET site in Singapore the use of curvature removes 8351 more data points during the 2016–2024 interval than are removed without this screening mechanism, a 5.1 % higher exclusion rate.
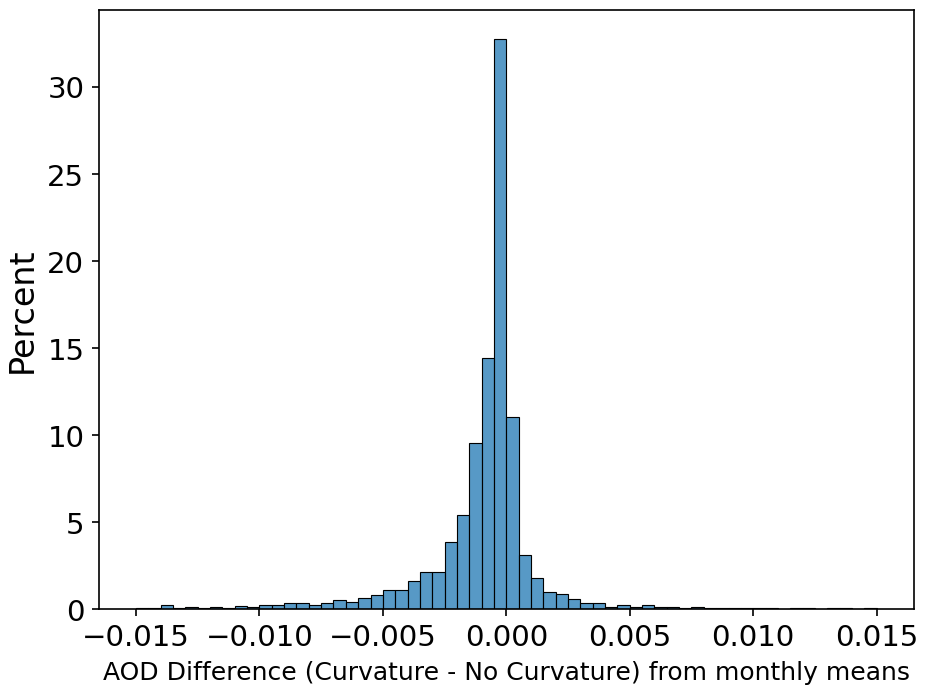
Figure 10Difference in AOD440 nm multi-year month averages with and without curvature check.
It should be noted that additional cloud-screening checks are being developed which are only applicable to daytime measurements so it's possible that disparity in cloud-screening efficiency will be greater in future versions of the database. Conversely, additional future cloud screening of AOD and AE time series by AI/ML algorithms may potentially result in a reduction in differences between solar versus lunar cloud screening.
Aerosol optical depth (AOD) measurements require sufficient direct-beam irradiance to ensure that diffuse light contributions to the direct beam do not result in an apparent AOD that is lower than the true value (Sinyuk et al., 2012; Kinne et al., 1997). To ensure this condition, AERONET applies a minimum signal threshold for valid sunphotometer measurements, defined as where V0 is the instrumental top-of-atmosphere signal. This minimum required signal imposes an inherent operational upper limit to the AOD that can be measured by solar or lunar photometry. Note that the V0 values are significantly smaller for lunar measurements as compared to solar measurements and the variation of V0 for lunar measurements is much greater as a function of lunar phase.
For both solar and lunar AOD, there is the potential for low signal observations to be excluded, an event which occurs with higher frequency as aerosol optical depth increases and disproportionately affects shorter wavelengths that typically have higher AOD, particularly when Ångström exponent is moderate or large. An effect of the lower reflected irradiance of the moon is that the lunar measurements experience even more significant reductions than solar observations. Although these considerations do not impact the accuracy of retained lunar AOD data, these factors may complicate comparisons of statistics between solar and lunar intervals especially when AOD is large enough that the reduced maximum AOD of lunar observations becomes relevant.
5.1 Empirical Maximum AOD
To quantify this measurement limitation, the solar AOD dataset for all sites with significant lunar AOD record were combined and the maximum possible measureable AOD was empirically estimated by finding the largest recorded AOD in airmass bins and an exponential equation was fit (Fig. 12). The same process was repeated using the lunar data record, but the lunar data were further divided into 3 lunar phase angle groups since maximal signal is substantially affected by this phase.
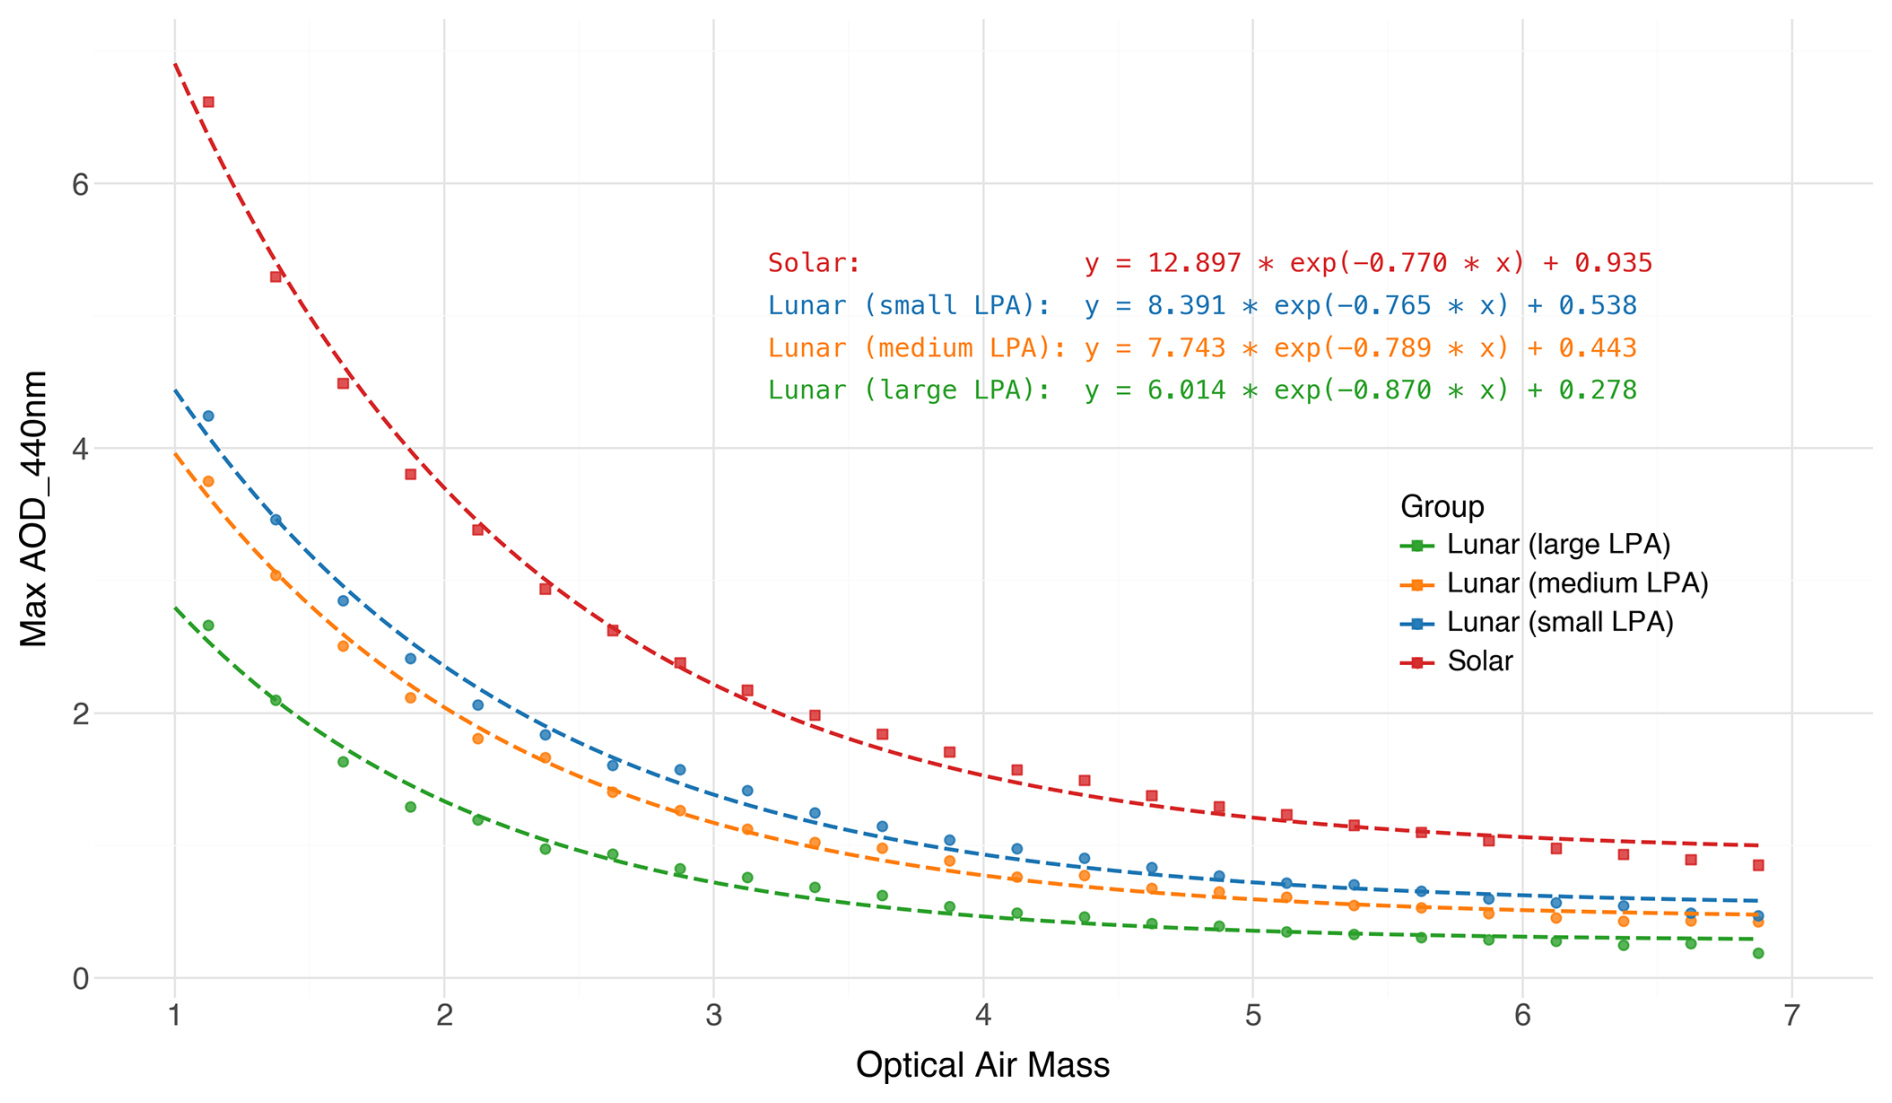
Figure 12Maximum observed AOD440 nm in airmass bin for solar and lunar (three lunar phase angle ranges) dataset.
Assuming the AERONET operational threshold Vmin, the maximum solar total atmospheric optical depth (Rayleigh plus aerosol plus gaseous) follows from the Beer-Lambert law where m is the optical airmass:
This limit allows for accurate total OD values up to 7.31 at an airmass of 1 (Giles et al., 2019) and 1.05 at an airmass of 7 which is consistent with observed 440 nm maxima of 6.91 and 0.99 in this AERONET solar AOD dataset. Note that the Rayleigh optical depth at 440 nm is 0.243 for mean sea level pressure (Bodhaine et al., 1999) and gaseous absorption OD is typically <0.01 at this wavelength. The maximum AOD limit has also been observed from solar measurements in very high smoke AOD cases in Indonesia in 2015 with a maximum AOD at 675 nm of 7.1 (Eck et al., 2019).
The complexities of lunar dynamics make theoretical calculations of lunar maximum measurable AOD more challenging so empirical determination of these potential limits is a useful estimation. Consistent with expectations, the periods with “bright moon” conditions (small LPA; <22.5°; and illumination of lunar disk >96 %) have the largest observed AOD at all airmass ranges. The lunar intervals that represent the minimum illumination allowed for lunar observations (large LPA; >72.5°; 50 %–65 % illumination) have a maximum observable AOD that is approximately half that of the bright moon conditions and 3× less than the corresponding solar AOD maximum. The ordering of these curves directly reflects the lower lunar V0 at larger LPA: a dimmer lunar source at large LPA provides less signal headroom above the noise floor, as aerosol attenuation drives the beam to unacceptably low signal-to-noise levels at lower AOD values than for a brighter moon or the sun.
5.2 High AOD Exclusion and Statistical Effects
Figure 13 shows lunar and solar AOD data from Ilorin, Nigeria an AERONET site that experiences significant Saharan dust as well as seasonal biomass burning aerosol. In this figure, the AOD observations have been partitioned by AOD bin and airmass range. The relative contribution of AOD in each AOD bin is shown and as air mass increases the fraction of higher AOD decreases as available signal decreases (larger zenith angles). While this is observed for each measurement type (solar/lunar), the elimination of the higher AOD components at large airmass is much more pronounced for lunar data. Note that the proportional contribution from each AOD bin range is similar for lunar (top) and solar (bottom) for small airmass (). Both solar and lunar measurements see attrition at larger airmass (AM>=4) due to inadequate signal but the lunar fractional contribution from lower AOD increases more substantially and observations from the three bins of largest AOD are entirely excluded while solar observations lose only the two largest AOD bins.
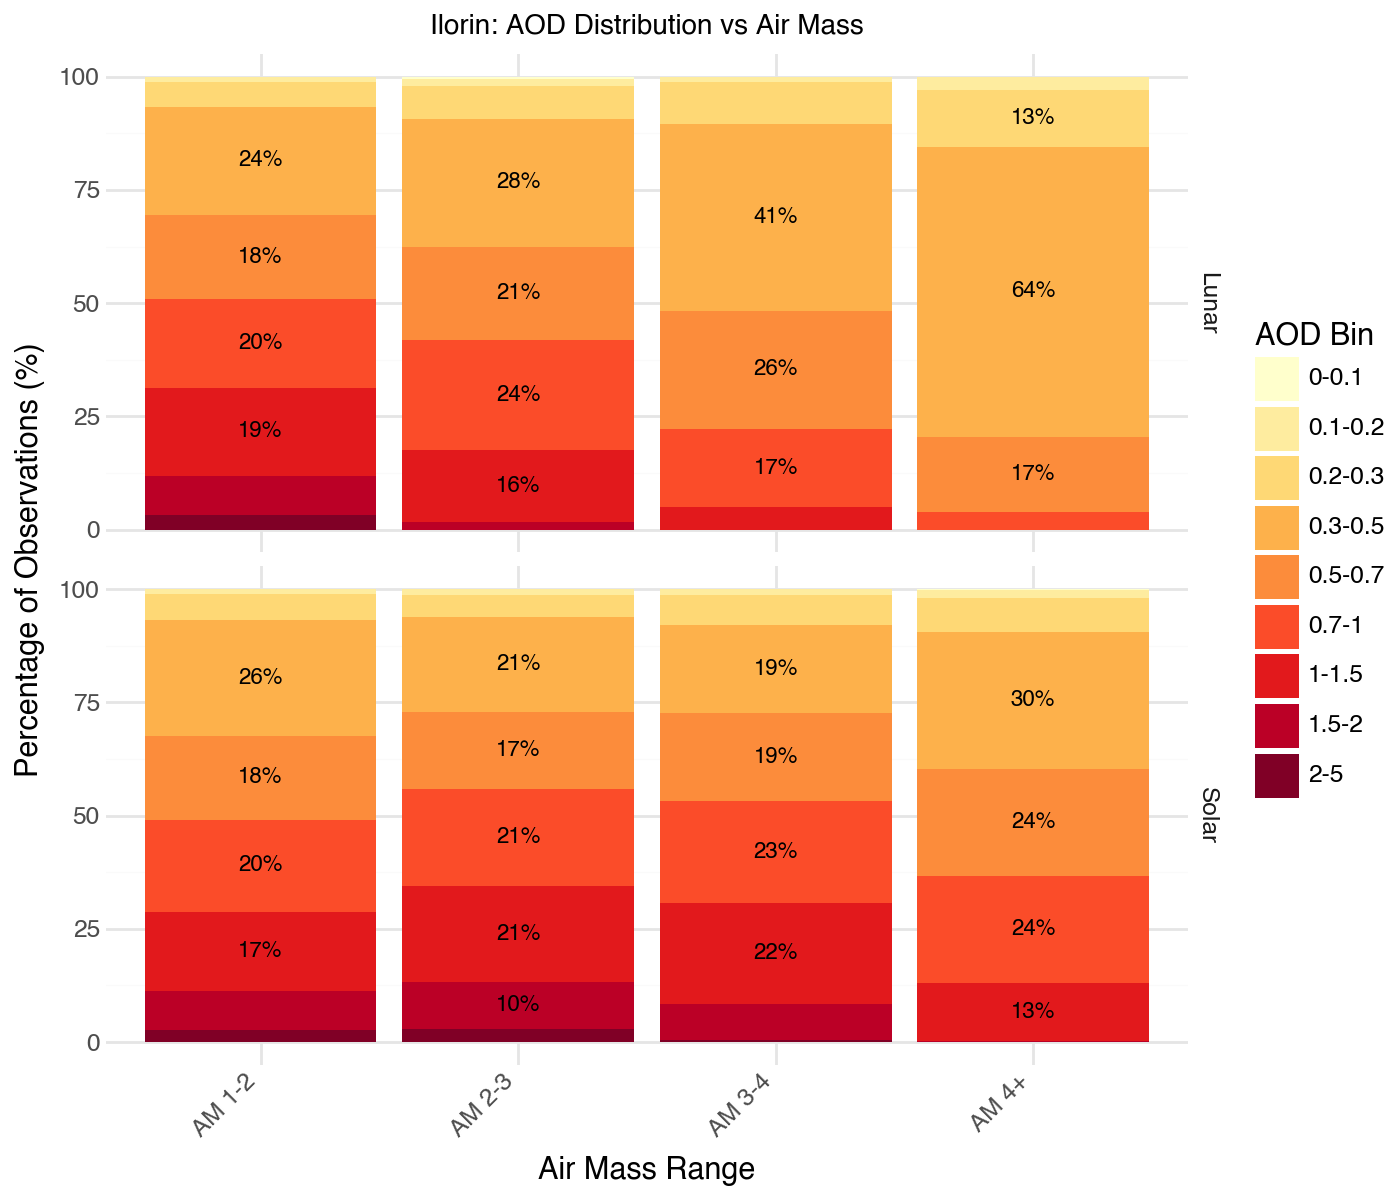
Figure 13AOD440 nm distribution vs. Airmass for solar and lunar data restricted to common days (Ilorin, Nigeria).
The broader consequence of this signal limitation on the AERONET data record is sampling bias, specifically truncation of large AOD observations as AOD (and airmass) increases, primarily for shorter wavelengths. While truncation is most visually apparent at large airmass, the signal ceiling is active across all airmass values – even at AM =1–2, the highest-AOD episodic events may exceed the lunar measurement ceiling, particularly at large LPA. This aspect is directly reflected in Fig. 14 which shows AOD440 nm histograms composited for common day data from 201 sites based on all 24 h periods with five or more L2 observations from both day and night (>5 million measurements of both lunar and solar data). These lognormal plots (O'Neill et al., 2000) show the increasing loss of higher AOD for both solar and lunar observations at larger airmass, with disproportionately larger such effect for the lunar dataset.
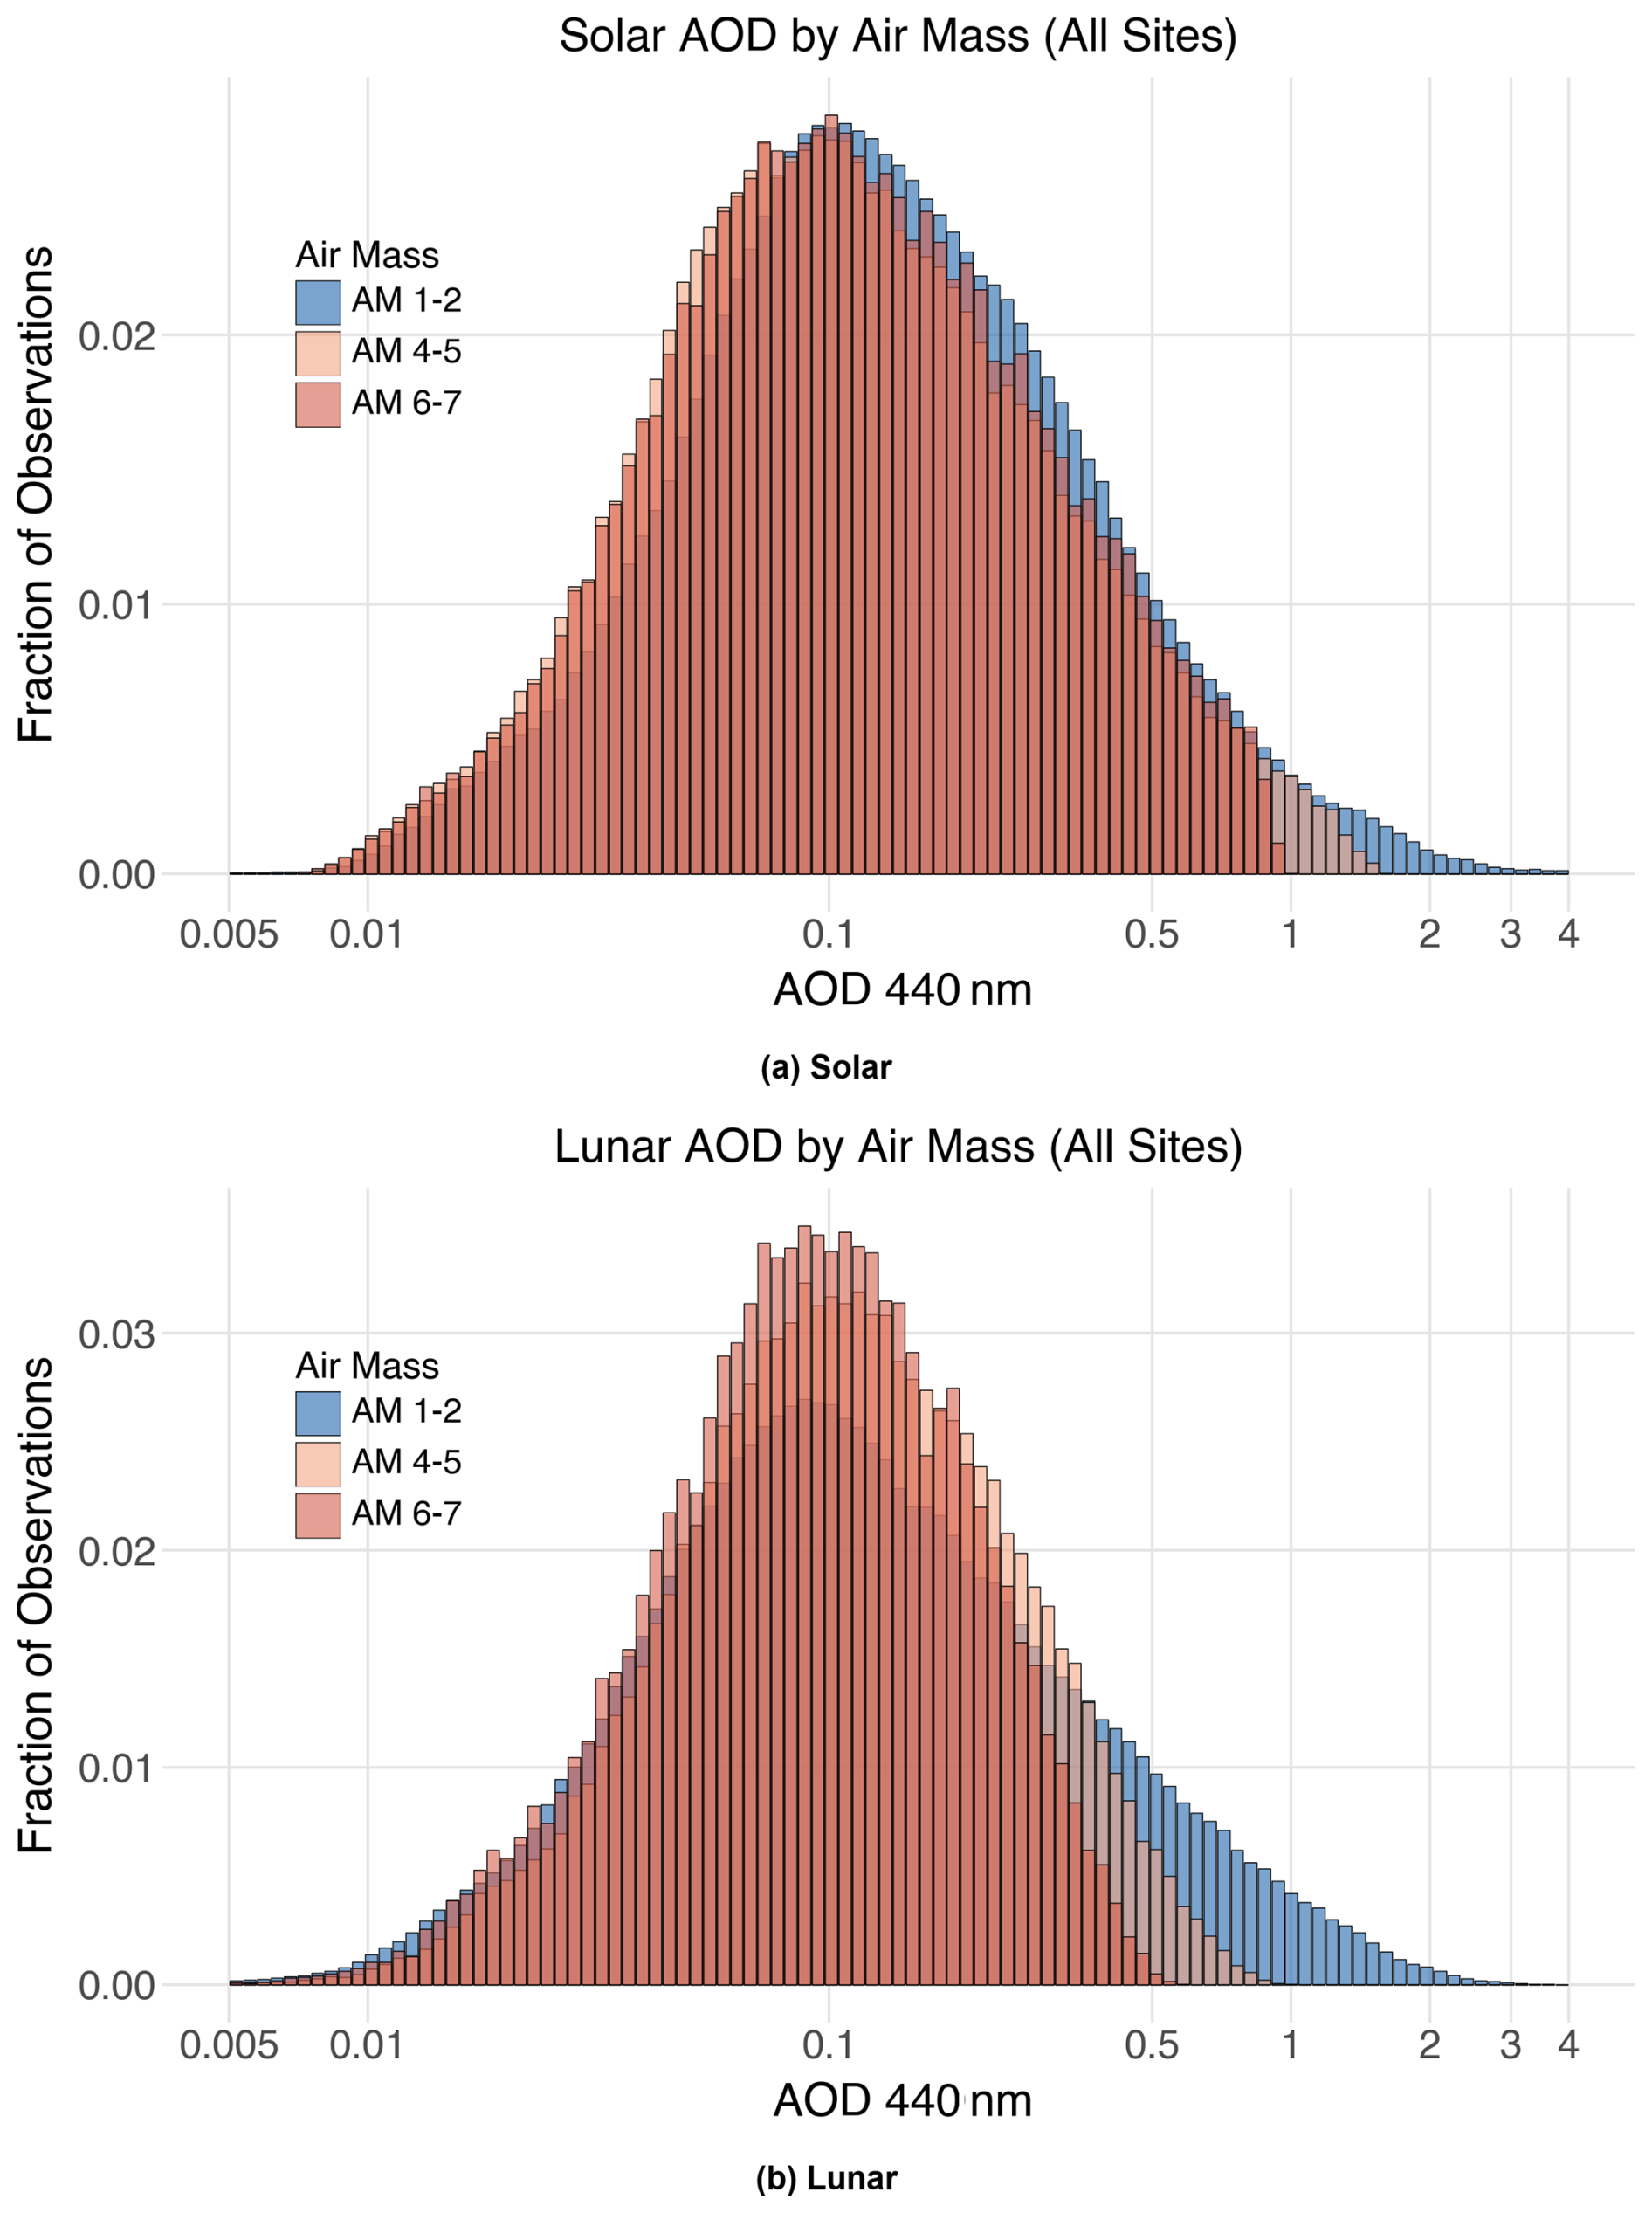
Figure 14Comparison of AOD440 nm histograms by airmass for 201 AERONET sites (Data restricted to common day set).
For this set of 201 sites, the average lunar removal percentage (from the L2 AOD dataset) for the 440 nm channel is 3.2 %, while the corresponding rates at 675 and 870 nm are quite small (0.3 % or less). However, this does not imply that the longer wavelengths do not also experience loss due to low signal rejection as there are cases when no channels reach Level 2 data status. The lunar data display much larger (3×) removal rates for 440 nm than do solar data as would be expected due to the lower possible maximum AOD for lunar measurements. Although overall the percentage of AOD that are excluded is small, the fractional loss of AOD can be significant for higher AOD locations with some sites excluding more than 8 % of L2 lunar measurements at 440 nm. The general pattern is that more observations are excluded as AOD increases and typically there is greater removal for lunar than solar measurements. The AOD removal rates for solar and lunar observations by wavelength are computed for a selection of individual sites (Table S1).
Figure 15 presents data from the AERONET site Palangkaraya where high AOD events are frequent. Figure 15a shows histograms of all L2 AOD870 nm which are overlaid with histograms of the AOD870 nm measurements from just the subset where AOD440 nm values have been excluded. Figure 15b shows the percentage of L2 data with an AOD measurement at AOD870 nm but not at AOD440 nm for the solar and lunar datasets. As expected, the absence of AOD440 nm is typically found when AOD870 nm is large, with an earlier onset of this feature for the lunar data. As AOD increases the fraction of L2 AOD870 nm measurements with no associated AOD440 nm becomes substantial and is normally greater for the lunar AOD where the Level 2 data often have 100 % of AOD 440 nm observations excluded for the highest aerosol loading cases. AOD at 440 nm will be significantly higher than 870 nm when Angstrom exponent is large so the removal due to the minimum signal threshold is disproportionately impactful resulting in a much higher rate of shorter AOD observations than that experienced at longer wavelengths.
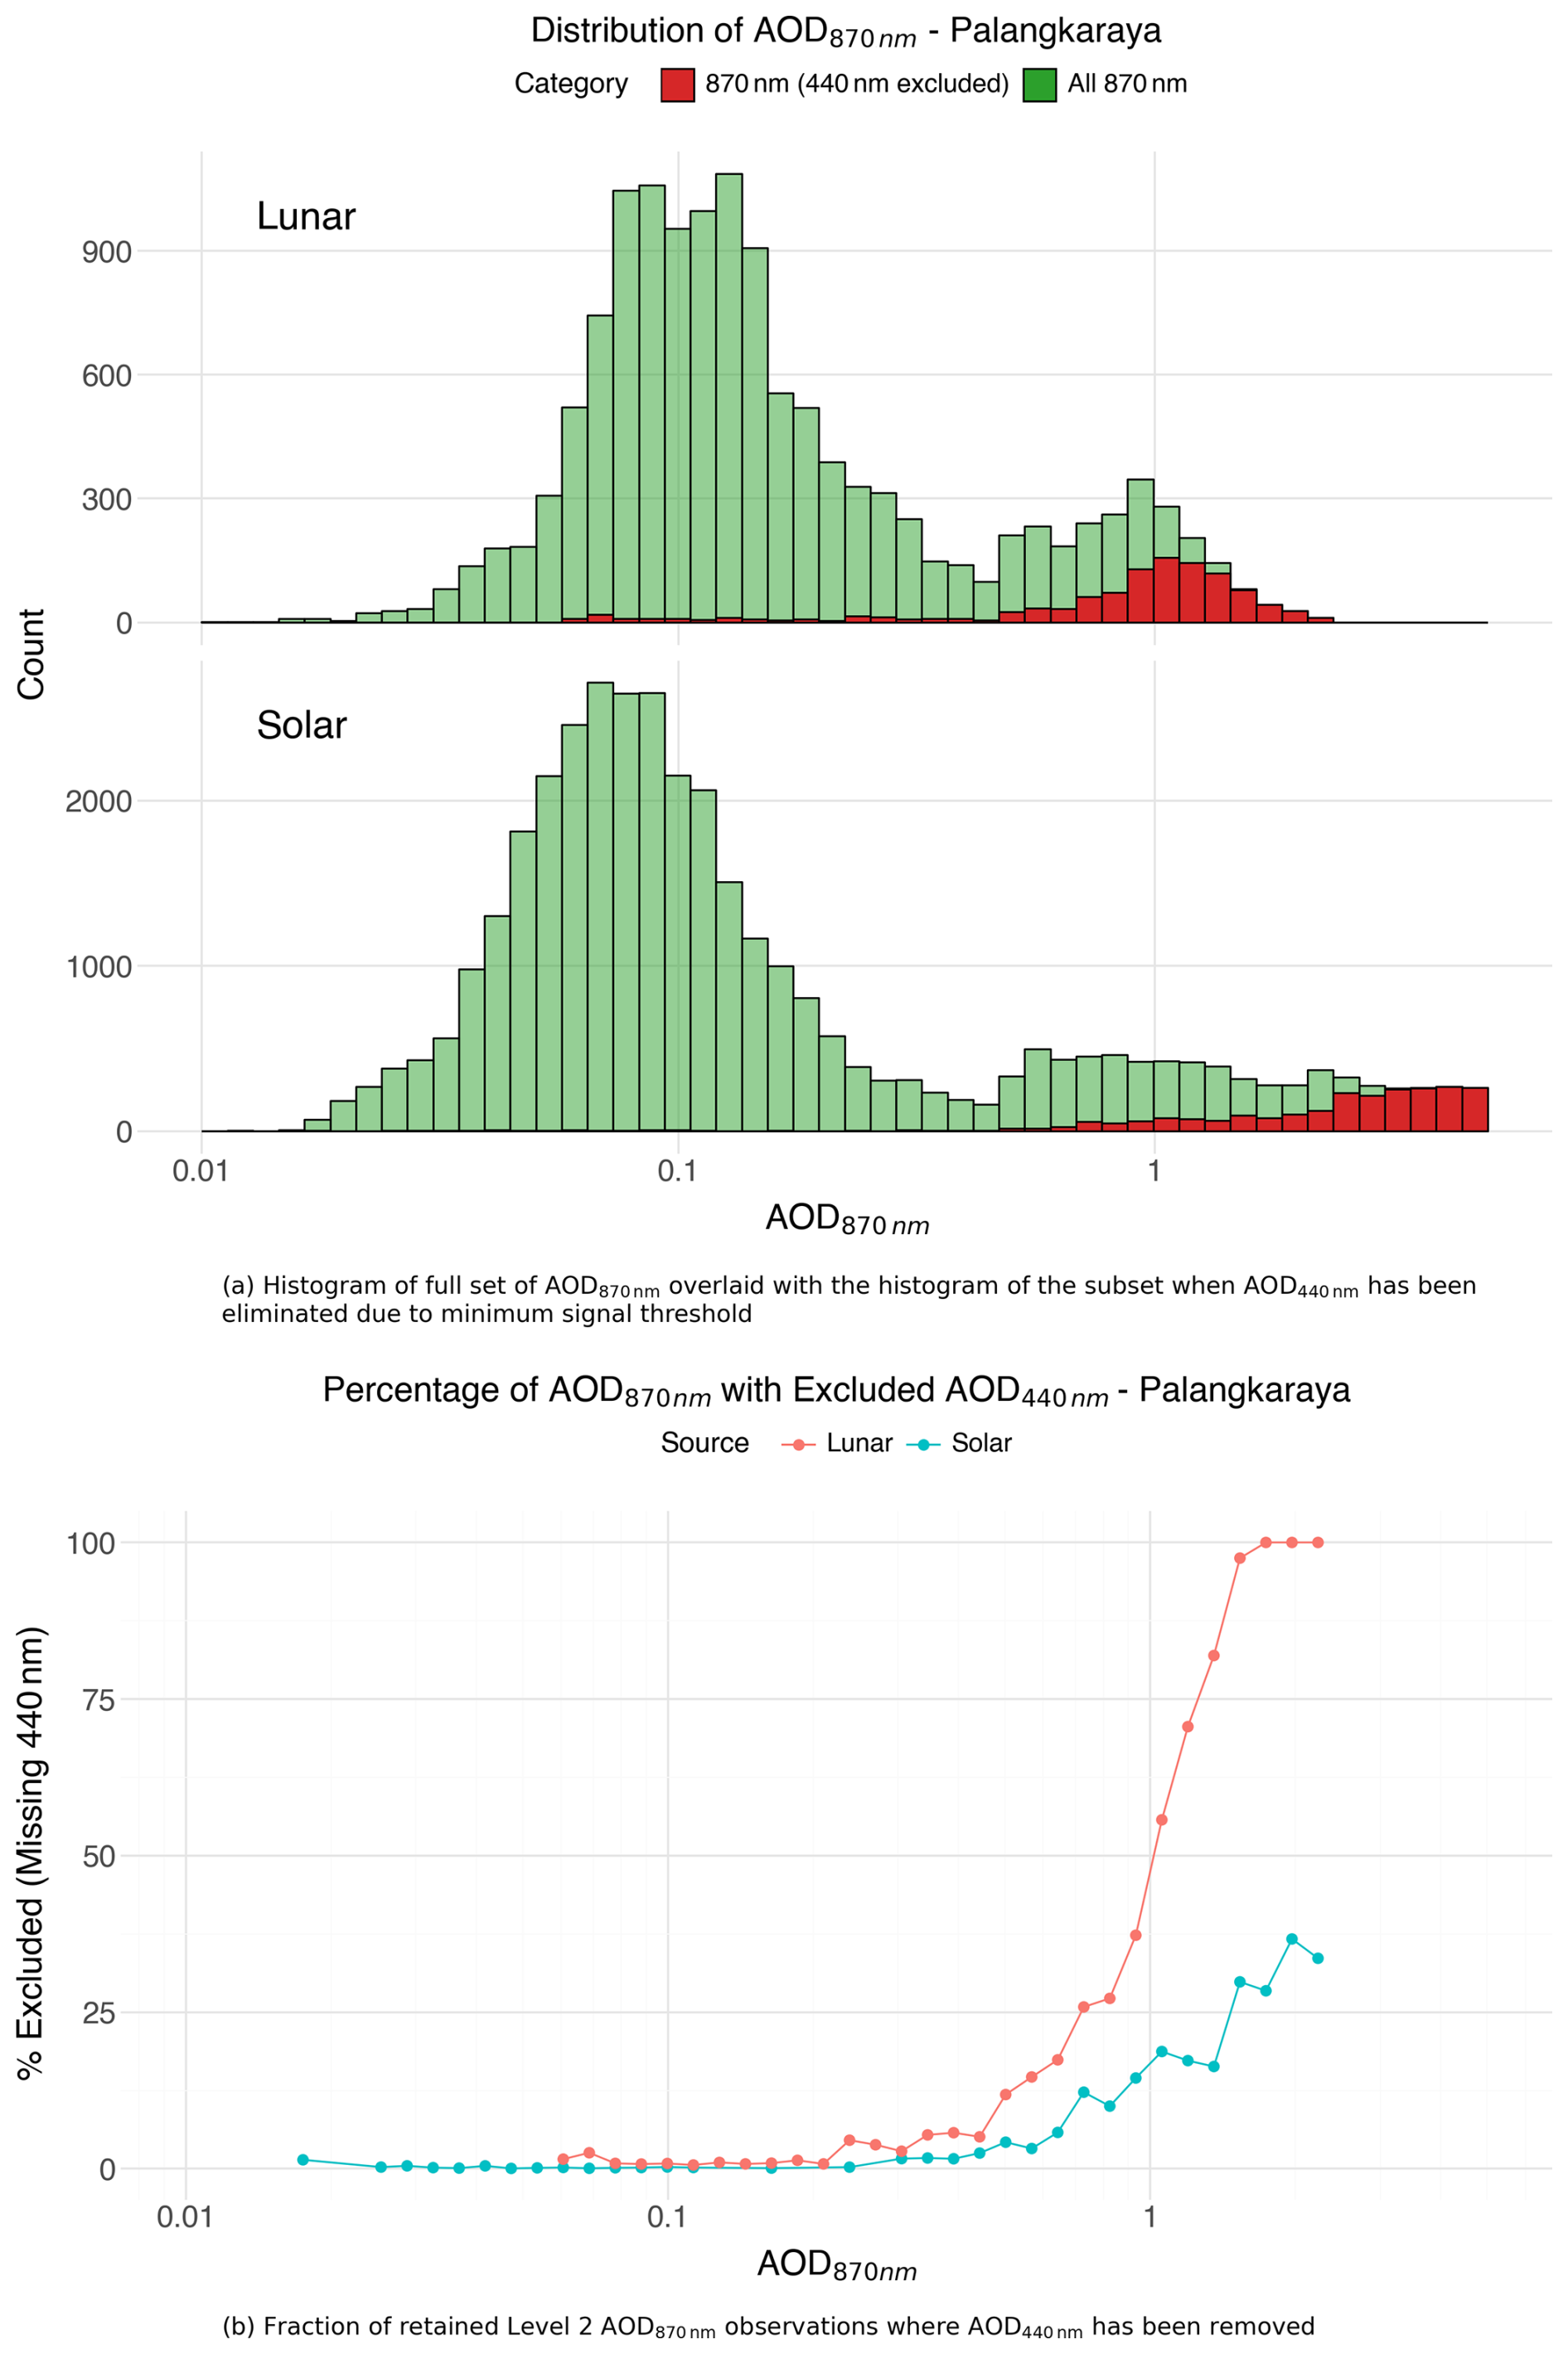
Figure 15Exclusion of Level 2 Solar and Lunar AOD440 nm at Palangkaraya, Indonesia (Lat.: 2.23° S, Lon.: 113.95° E, Elev: 27 m). (a) Histogram of full set of AOD870 nm overlaid with the subset where AOD440 nm has been eliminated due to the minimum signal threshold. (b) Fraction of retained Level 2 AOD870 nm observations where AOD440 nm has been removed.
Despite this selective reduction in higher AOD data, the majority of observations at a given site are for the airmass interval from 1–2 (Solar: 58 %, Lunar: 65.5 %) when the available signal is maximal and sampling bias is not impactful. Thus when comparing solar and lunar AOD distributions for all airmass levels, with sites sorted as either low () or high (>=0.4) AOD sites, the statistics of composited distributions of day and night observations are typically similar for both measurement types (LOW AOD: solar = 0.124 ± 0.137; lunar = 0.118 ± 0.117 HIGH AOD: solar = 0.658 ± 0.492; lunar = 0.636 ± 0.434) (Fig. S3).
5.3 AOD Triplet Variability
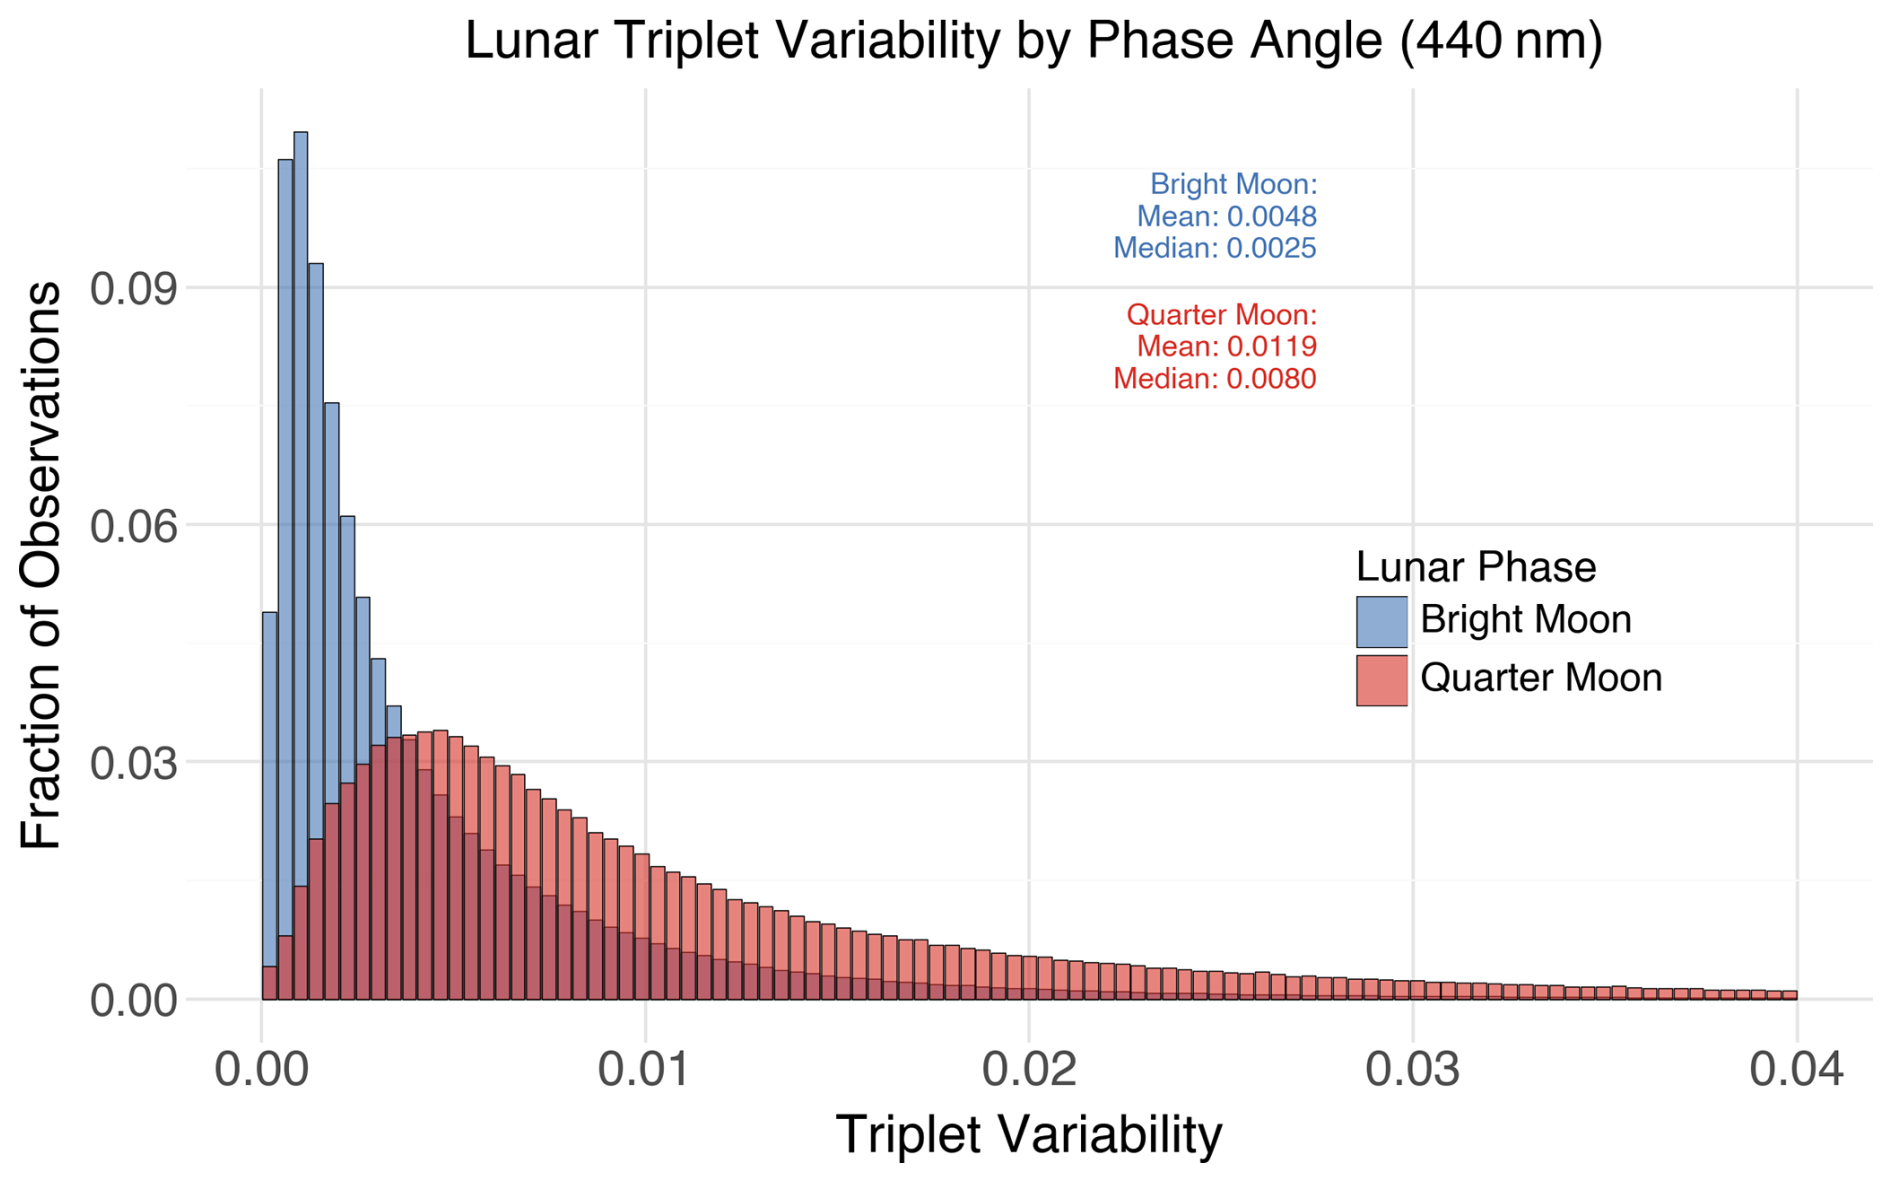
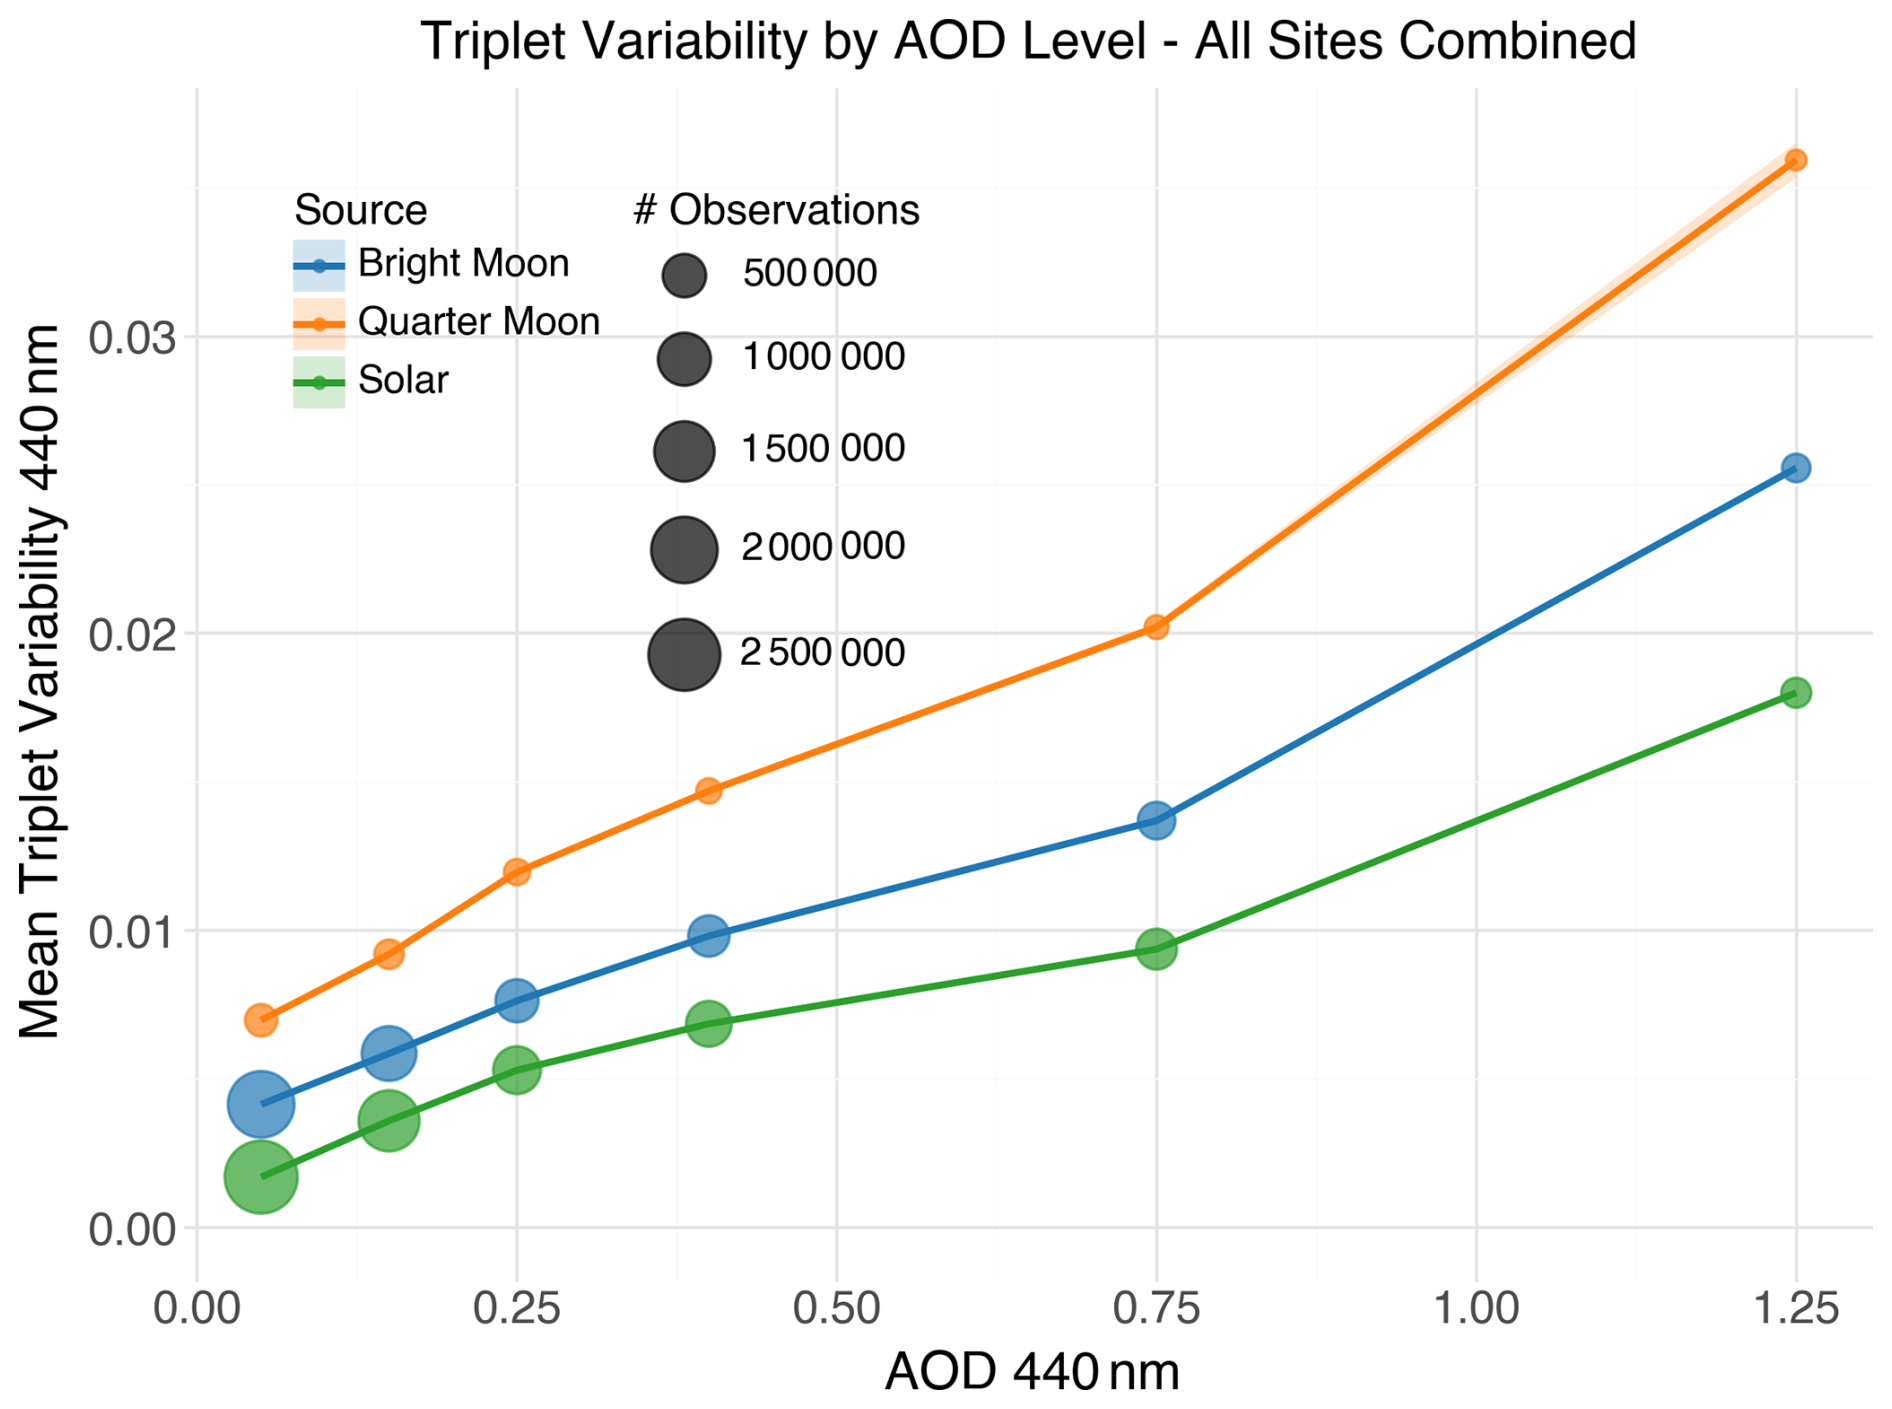
AERONET AODs are computed as the mean of a triplet of measurements taken at 30 s intervals over a 1 min period and diminished signal has effects on triplet variability. While the 24-bit ADC resolution of the amplified detector signal (current/voltage) is sufficient at all levels, lunar observations at the very lowest signal levels can experience greater triplet variability as instrumental noise becomes an appreciable fraction of the measured signal which likely results in higher rejection of AOD observations due to triplet variability thresholds. The triplet variability (max–min) is one metric used to screen for cloud presence and if the triplet variability of any longer wavelength (675, 870, 1020 nm) exceeds a dynamically defined threshold (Giles et al., 2019) it will typically be screened as cloudy. In most cases such measurements are excluded though there is a provision to “add back” a subset of these cases if there are additional factors (such as high Ångström Exponent) providing confidence that the variability is due to aerosol only. Differences exist in the variability of the measurements depending on the type (lunar, solar) with larger triplets observed for dimmer lunar phase periods than during near full moon conditions which may result in larger AOD uncertainty under those conditions (Fig. 16). In general, triplet variability is larger for lunar observations than solar observations (Fig. 17). These figures present variability of AOD440 nm which has no explicit threshold since as noted the filtering for triplet variability is only applied to longer wavelengths. The equivalent plot for 675 nm triplet variability partioned by moon phase is also available (Fig. S4).
This study presents a comprehensive assessment of the AERONET lunar AOD dataset and a detailed description of the methodology based on empirical corrections to the ROLO lunar irradiance model derived from a large set of automated solar and lunar langley calibration pairs acquired at high-latitude calibration sites, Mauna Loa and Izaña. LOESS-fitted lookup tables (0.8° lunar phase angle resolution) were created to for each wavelength to provide ROLO correction factors.
The accuracy of the bias-corrected lunar AOD was evaluated using day/night (night/day) transition comparison from 372 AERONET sites measured with 454 different CIMEL instruments. Mean AOD440 nm transition differences were within ±0.005 for all LPA bins except the interval (80–90°) which had a mean difference of 0.007. (2.7 % of data). At low AOD (<0.2), mean solar-lunar difference of ∼0.002 are well within the AERONET instrumental uncertainty of 0.01. Transition statistics were comparable to or smaller than lagged within-day and within-night AOD comparisons over the same 3 h interval, confirming the absence of systematic bias in the lunar calibration. A small but statistically significant tendency for daytime AOD to exceed nighttime AOD (∼0.013–0.016) was found at elevated aerosol loading (AOD bin [0.6–0.8]), consistent with known diurnal aerosol production mechanisms rather than a calibration artifact.
The maximum observable AOD for lunar measurements is found to be approximately 2–3 times lower than for solar measurements which results in greater exclusion rates of shorter wavelength AOD for lunar observations than solar observations when AOD is large.
Overall, AERONET lunar AOD provides accurate, well-characterized nighttime aerosol optical depth measurements that substantially extend network monitoring capabilities beyond daylight hours, enabling quantification of aerosol diurnal variability and detection of nocturnal aerosol events across a global network of sites.
AOD data for sites used in this study can be acquired at: https://aeronet.gsfc.nasa.gov/new_web/webtool_aod_v3.html (last access: 29 August 2025). ROLO bias correction table can be acquired at: https://aeronet.gsfc.nasa.gov/new_web/egusphere-2026-1506/ROLO_Bias_Correction_Vals.csv (last access: 29 August 2025).
The supplement related to this article is available online at https://doi.org/10.5194/amt-19-6487-2026-supplement.
The evaluation of the lunar AOD product was the result of joint effort of the members of AERONET team. Individual 415 contributions can be summarized as follows. Ilya Slutsker devised and implemented the solar/lunar Langley Vo bias correction algorithm. Mikhail Sorokin provided engineering and technical input. Joel Schafer performed data analysis and composed the manuscript. Thomas Eck, Pawan Gupta, Alexander Sinyuk and Alexander Smirnov contributed to discussions during AERONET team meetings.
At least one of the (co-)authors is a member of the editorial board of Atmospheric Measurement Techniques. The peer-review process was guided by an independent editor, and the authors also have no other competing interests to declare.
Publisher's note: Copernicus Publications remains neutral with regard to jurisdictional claims made in the text, published maps, institutional affiliations, or any other geographical representation in this paper. The authors bear the ultimate responsibility for providing appropriate place names. Views expressed in the text are those of the authors and do not necessarily reflect the views of the publisher.
The AERONET project at NASA GSFC is supported by NASA’s Earth System Science Research – Ground Networks and Calibration Labs at NASA headquarters. We'd like to thank NASA program managers Edward Nowottnick, and John Sullivan for continued support to AERONET. The authors thank the AERONET calibration facilities and their PIs in the USA (NASA GSFC, NOAA Mauna Loa Observatory, and NEON), France (PHOTONS), and Spain (RIMA and Izana), Taiwan (APAC). The authors heartily thank the PIs and site managers from the nearly 500 AERONET sites used in this paper. A study like this which relies on globally distributed observations over a time span of decades is only possible due the persistent institutional support, selfless efforts by a large cohort of scientists and collaborators who ensure high quality measurements from the CIMEL sun-sky-lunar photometers operated around the world. We particularly would like to thank ÁAfrica Barreto and the team at our partner calibration center at the Izaña Atmospheric Research Center in Santa Cruz de Tenerife, Spain. This prominent site was a key location for the collection of the solar and lunar Langleys that along with the observations at Mauna Loa Observatory were used to determine the empirical bias correction for the ROLO irradiance model described in this article.
AERONET project is supported by Earth Science Research Program under NASA’s Earth Science Division.
This paper was edited by Daniel Perez-Ramirez and reviewed by Lei Li and two anonymous referees.
Acton, C., Bachman, N., Semenov, B., and Wright, E.: A Look towards the Future in the Handling of Space Science Mission Geometry, Planet. Space Sc., 150, 9–12, https://doi.org/10.1016/j.pss.2017.02.013, 2018. a
Acton, C. H.: Ancillary Data Services of Nasa's Navigation and Ancillary Information Facility, Planet. Space Sci., 44, 65–70, https://doi.org/10.1016/0032-0633(95)00107-7, 1996. a
Barreto, A., Cuevas, E., Damiri, B., Guirado, C., Berkoff, T., Berjón, A. J., Hernández, Y., Almansa, F., and Gil, M.: A new method for nocturnal aerosol measurements with a lunar photometer prototype, Atmos. Meas. Tech., 6, 585–598, https://doi.org/10.5194/amt-6-585-2013, 2013. a
Barreto, Á., Cuevas, E., Granados-Muñoz, M.-J., Alados-Arboledas, L., Romero, P. M., Gröbner, J., Kouremeti, N., Almansa, A. F., Stone, T., Toledano, C., Román, R., Sorokin, M., Holben, B., Canini, M., and Yela, M.: The new sun-sky-lunar Cimel CE318-T multiband photometer – a comprehensive performance evaluation, Atmos. Meas. Tech., 9, 631–654, https://doi.org/10.5194/amt-9-631-2016, 2016. a
Barreto, Á., Román, R., Cuevas, E., Berjón, A. J., Almansa, A. F., Toledano, C., González, R., Hernández, Y., Blarel, L., Goloub, P., Guirado, C., and Yela, M.: Assessment of nocturnal aerosol optical depth from lunar photometry at the Izaña high mountain observatory, Atmos. Meas. Tech., 10, 3007–3019, https://doi.org/10.5194/amt-10-3007-2017, 2017. a, b
Barreto, A., Román, R., Cuevas, E., Pérez-Ramírez, D., Berjón, A., Kouremeti, N., Kazadzis, S., Gröbner, J., Mazzola, M., Toledano, C., Benavent-Oltra, J., Doppler, L., Juryšek, J., Almansa, A., Victori, S., Maupin, F., Guirado-Fuentes, C., González, R., Vitale, V., Goloub, P., Blarel, L., Alados-Arboledas, L., Woolliams, E., Taylor, S., Antuña, J., and Yela, M.: Evaluation of Night-Time Aerosols Measurements and Lunar Irradiance Models in the Frame of the First Multi-Instrument Nocturnal Intercomparison Campaign, Atmos. Environ., 202, 190–211, https://doi.org/10.1016/j.atmosenv.2019.01.006, 2019. a
Berkoff, T. A., Sorokin, M., Stone, T., Eck, T. F., Hoff, R., Welton, E., and Holben, B.: Nocturnal Aerosol Optical Depth Measurements with a Small-Aperture Automated Photometer Using the Moon as a Light Source, J. Atmos. Ocean. Technol., 28, 1297–1306, https://doi.org/10.1175/JTECH-D-10-05036.1, 2011. a
Bodhaine, B. A., Wood, N. B., Dutton, E. G., and Slusser, J. R.: On Rayleigh Optical Depth Calculations, J. Atmos. Ocean. Technol., 16, 1854–1861, https://doi.org/10.1175/1520-0426(1999)016<1854:ORODC>2.0.CO;2, 1999. a
Coddington, O. M., Richard, E. C., Harber, D., Pilewskie, P., Woods, T. N., Snow, M., Chance, K., Liu, X., and Sun, K.: Version 2 of the TSIS-1 Hybrid Solar Reference Spectrum and Extension to the Full Spectrum, Earth Space Sci., 10, e2022EA002637, https://doi.org/10.1029/2022EA002637, 2023. a
Eck, T. F.: Wavelength Dependence of the Optical Depth of Biomass Burning, Urban, and Desert Dust Aerosols, J. Geophys. Res.-Atmos., 104, 31333–31349, https://doi.org/10.1029/1999JD900923, 1999. a
Eck, T. F., Holben, B. N., Giles, D. M., Slutsker, I., Sinyuk, A., Schafer, J. S., Smirnov, A., Sorokin, M., Reid, J. S., Sayer, A. M., Hsu, N. C., Shi, Y. R., Levy, R. C., Lyapustin, A., Rahman, M. A., Liew, S.-C., Cortijo, S. V. S., Li, T., Kalbermatter, D., Keong, K. L., Yuggotomo, M. E., Aditya, F., Mohamad, M., Mahmud, M., Chong, T. K., Lim, H.-S., Choon, Y. E., Deranadyan, G., Kusumaningtyas, S. D. A., and Aldrian, E.: AERONET Remotely Sensed Measurements and Retrievals of Biomass Burning Aerosol Optical Properties During the 2015 Indonesian Burning Season, AGU Journals, https://doi.org/10.1029/2018JD030182, 2019. a
Giles, D. M., Sinyuk, A., Sorokin, M. G., Schafer, J. S., Smirnov, A., Slutsker, I., Eck, T. F., Holben, B. N., Lewis, J. R., Campbell, J. R., Welton, E. J., Korkin, S. V., and Lyapustin, A. I.: Advancements in the Aerosol Robotic Network (AERONET) Version 3 database – automated near-real-time quality control algorithm with improved cloud screening for Sun photometer aerosol optical depth (AOD) measurements, Atmos. Meas. Tech., 12, 169–209, https://doi.org/10.5194/amt-12-169-2019, 2019. a, b, c, d
Hapke, B., Nelson, R., and Smythe, W.: The Opposition Effect of the Moon: Coherent BackscatterandShadow Hiding, Icarus, 133, 89–97, https://doi.org/10.1006/icar.1998.5907, 1998. a
Ji, D., Palm, M., Buschmann, M., Ebell, K., Maturilli, M., Sun, X., and Notholt, J.: Hygroscopic aerosols amplify longwave downward radiation in the Arctic, Atmos. Chem. Phys., 25, 3889–3904, https://doi.org/10.5194/acp-25-3889-2025, 2025. a
Jiang, X., Wang, Y., Tao, M., Wang, J., Zhou, M., Bai, X., and Lu, G.: Characteristics of Daytime-And-Nighttime AOD Differences Over China: A Perspective From CALIOP Satellite Observations and GEOS-Chem Model Simulations, J. Geophys. Res.-Atmos., 129, https://doi.org/10.1029/2023JD039158, 2024. a
Kieffer, H. H.: Multiple-Instrument-Based Spectral Irradiance of the Moon, J. Appl. Remote Sens., 16, 038502, https://doi.org/10.1117/1.JRS.16.038502, 2022. a
Kieffer, H. H. and Stone, T. C.: The Spectral Irradiance of the Moon, The Astronom. J., 129, 2887–2901, https://doi.org/10.1086/430185, 2005. a
Kinne, S., Akerman, T. P., Shiobara, M., Uchiyama, A., Heymsfield, A. J., Miloshevich, L., Wendell, J., Eloranta, E., Purgold, C., and Bergstrom, R. W.: Cirrus Cloud Radiative and Microphysical Properties from Ground Observations and in Situ Measurements during FIRE 1991 and Their Application to Exhibit Problems in Cirrus Solar Radiative Transfer Modeling, J. Atmos. Sci., 54, 2320–2344, https://doi.org/10.1175/1520-0469(1997)054<2320:CCRAMP>2.0.CO;2, 1997. a
Li, J., Jin, J., Wong, M. S., Wang, J., Lee, K. H., Qin, K., and Chan, P.: Unraveling Urban Nighttime Aerosol Characteristics and Meteorological Factors on AOD-PM Relationships in East Asia, Atmos. Environ., 360, 121388, https://doi.org/10.1016/j.atmosenv.2025.121388, 2025a. a
Li, L., Li, M., Fan, X., Chen, Y., Lin, Z., Hou, A., Zhang, S., Zheng, R., and Chen, J.: Measurement report: The variation properties of aerosol hygroscopic growth related to chemical composition during new particle formation days in a coastal city of Southeast China, Atmos. Chem. Phys., 25, 3669–3685, https://doi.org/10.5194/acp-25-3669-2025, 2025b. a
Li, Z., Li, K., Li, D., Yang, J., Xu, H., Goloub, P., and Victori, S.: Simple Transfer Calibration Method for a Cimel Sun–Moon Photometer: Calculating Lunar Calibration Coefficients from Sun Calibration Constants, Appl. Opt., 55, 7624, https://doi.org/10.1364/AO.55.007624, 2016. a
O'Neill, N. T., Ignatov, A., Holben, B. N., and Eck, T. F.: The Lognormal Distribution as a Reference for Reporting Aerosol Optical Depth Statistics; Empirical Tests Using Multi-year, Multi-site AERONET Sunphotometer Data, AGU Journals, https://doi.org/10.1029/2000GL011581, 2000. a
O'Neill, N. T., Eck, T. F., Smirnov, A., Holben, B. N., and Thulasiraman, S.: Spectral Discrimination of Coarse and Fine Mode Optical Depth, J. Geophys. Res.-Atmos., 108, https://doi.org/10.1029/2002JD002975, 2003. a
Perrone, M. R., Lorusso, A., and Romano, S.: Diurnal and Nocturnal Aerosol Properties by AERONET Sun-Sky-Lunar Photometer Measurements along Four Years, Atmos. Res., 265, 105889, https://doi.org/10.1016/j.atmosres.2021.105889, 2022. a
Román, R., González, R., Toledano, C., Barreto, Á., Pérez-Ramírez, D., Benavent-Oltra, J. A., Olmo, F. J., Cachorro, V. E., Alados-Arboledas, L., and de Frutos, Á. M.: Correction of a lunar-irradiance model for aerosol optical depth retrieval and comparison with a star photometer, Atmos. Meas. Tech., 13, 6293–6310, https://doi.org/10.5194/amt-13-6293-2020, 2020. a
Schafer, J.: ROLO Bias Correction Values, NASA Goddard Space Flight Center [data], https://aeronet.gsfc.nasa.gov/new_web/egusphere-2026-1506/ROLO_Bias_Correction_Vals.csv, 2026.
Schlief, A. H., Marquis, J. W., Zhang, J., Reid, J. S., and Miller, S.: Intercomparison of nighttime aerosol optical depth retrievals from both reflectance-based and city light-based methods using VIIRS DNB data, EGUsphere [preprint], https://doi.org/10.5194/egusphere-2026-2225, 2026. a
Sinyuk, A., Holben, B. N., Smirnov, A., Eck, T. F., Slutsker, I., Schafer, J. S., Giles, D. M., and Sorokin, M.: Assessment of Error in Aerosol Optical Depth Measured by AERONET Due to Aerosol Forward Scattering, Geophys. Res. Lett., 39, https://doi.org/10.1029/2012GL053894, 2012. a
Song, J., Saathoff, H., Jiang, F., Gao, L., Zhang, H., and Leisner, T.: Sources of organic gases and aerosol particles and their roles in nighttime particle growth at a rural forested site in southwest Germany, Atmos. Chem. Phys., 24, 6699–6717, https://doi.org/10.5194/acp-24-6699-2024, 2024. a
Stone, T. C., Kieffer, H., Lukashin, C., and Turpie, K.: The Moon as a Climate-Quality Radiometric Calibration Reference, Remote Sens., 12, 1837, https://doi.org/10.3390/rs12111837, 2020. a
Toledano, C., González, R., Fuertes, D., Cuevas, E., Eck, T. F., Kazadzis, S., Kouremeti, N., Gröbner, J., Goloub, P., Blarel, L., Román, R., Barreto, Á., Berjón, A., Holben, B. N., and Cachorro, V. E.: Assessment of Sun photometer Langley calibration at the high-elevation sites Mauna Loa and Izaña, Atmos. Chem. Phys., 18, 14555–14567, https://doi.org/10.5194/acp-18-14555-2018, 2018. a
Toledano, C., Taylor, S., Barreto, Á., Adriaensen, S., Berjón, A., Bialek, A., González, R., Woolliams, E., and Bouvet, M.: LIME: Lunar Irradiance Model of ESA, a new tool for absolute radiometric calibration using the Moon, Atmos. Chem. Phys., 24, 3649–3671, https://doi.org/10.5194/acp-24-3649-2024, 2024. a
Wainwright, C., Chang, R. Y.-W., and Richter, D.: Aerosol Activation in Radiation Fog at the Atmospheric Radiation Program Southern Great Plains Site, AGU Journals, https://doi.org/10.1029/2021JD035358, 2021. a
Zhang, J., Reid, J. S., Sorenson, B. T., Miller, S. D., Román, M. O., Wang, Z., Spurr, R. J. D., Jaker, S., Eck, T. F., and Rubin, J. I.: Towards gridded nighttime aerosol optical thickness retrievals using VIIRS day–night band observations over regions with artificial light sources, Atmos. Meas. Tech., 18, 1787–1810, https://doi.org/10.5194/amt-18-1787-2025, 2025. a
Zhu, J., Zheng, Y., Xia, Z., Wang, Y., Bi, J., Gui, K., Li, L., Liu, S. , Zhang, H., Zhao, H., Peng, S., Ju, M., Liang, Y., Che, H., and Zhang, X.: Retrieving Nocturnal Aerosol Optical Depth Using Lunar Photometry: Algorithm Improvements and Evaluation, IEEE T. Geosci. Remote S., 64, 1–18, https://doi.org/10.1109/TGRS.2025.3642839, 2026. a, b