
the Creative Commons Attribution 4.0 License.
the Creative Commons Attribution 4.0 License.
 | 20 Oct 2026
Meteosat Third Generation Lightning Imager detection performances
Bartolomeo Viticchié

Sven-Erik Enno
David Navia
Janja Avbelj
Jochen Grandell
The EUMETSAT Meteosat Third Generation Lightning Imager (MTG-LI) is the European space-based geostationary lightning location system devoted to the diagnosis and characterization of lightning activity over hemispheric scale. In this publication, we present the assessment of MTG-LI detection performances against four different reference systems: the Vaisala Global Lightning Detection Network (GLD360), the European Cooperation for Lightning Detection (EUCLID), and Geostationary Lightning Mappers (GLMs) −16 and −19 aboard NOAA GOES satellites. The analysis period is eighteen months: from July 2024 to December 2025. MTG-LI absolute flash detection efficiency varies between 70 % (day) and 95 % (night), with an average value of 87.4 %. Its average flash false alarm rate is generally below 0.5 flash s−1, while the average fraction of false flashes is 0.16 % of the total flashes. Finally, both average timing and location accuracy are presented and discussed.
- Article
(10742 KB) - Full-text XML
- BibTeX
- EndNote


Lightning activity is known to be tightly related to the occurrence of severe weather events (MacGorman et al., 1989; Lyons and Keen, 1994; Williams et al., 1999; Schultz et al., 2009, 2011; Gatlin and Goodman, 2010). Since 2018, lightning is considered an Essential Climate Variable (ECV) by the Global Climate Observing System (GCOS; e.g., Price and Rind, 1994; Reeve and Toumi, 1999; Kaplan and Lau, 2021; Cecil et al., 2014; Finney et al., 2016; Aich et al., 2018). Lightning is also known to impact atmospheric chemistry, primarily with the production of NOx (Chameides, 1986; Schumann and Huntrieser, 2007; Pérez-Invernón et al., 2023) which can impact ozone concentrations in tropical regions (Liaskos et al., 2015; Murray, 2016). Finally, lightning poses threats to airplanes (Mitchard et al., 2016), infrastructure such as wind turbines (Djalel et al., 2014) or power plants (Grebović et al., 2025), and people (Ashley and Gilson, 2009).
In order to comprehensively monitor lightning, it is necessary to develop systems with global (or near-to-global) coverage, both good temporal and spatial resolution (or location accuracy) and the capability of continuously monitoring total lightning activity. Total lightning activity is defined by the combination of Cloud-to-Ground (hereafter CG) and Intra-Cloud (hereafter IC; e.g., MacGorman et al., 1989; MacGorman and Nielsen, 1991; Branick and Doswell, 1992; Shafer et al., 2000) lightning. Several studies have been dedicated to modeling and measuring the ratio between IC and CG lightning. Boccippio et al. (2001) report values of 2.64–2.94 with a standard deviation of 1.1–1.3 over continental United States.
Lightning Location Systems (hereafter LLSs), i.e., systems devoted to the diagnosis and characterization of lightning activity, can be grouped in two major families: (i) ground-based and (ii) space-based. Ground-based LLSs locate and characterize lightning by measuring radio waves (Rakov and Uman, 2003; Cummins and Murphy, 2009). In this group of systems one finds Very High Frequency (VHF; e.g., Rison et al., 1999), Low Frequency (LF; e.g., Cummins and Murphy, 2009) and Very Low Frequency (VLF; e.g., Said et al., 2013) systems, respectively. When transitioning from VHF to VLF technology, lightning detection and characterization capabilities change dramatically. VHF LLSs enable the 3D mapping of electric discharges within clouds over a range of about 100–200 km. The accuracy with which such systems describe lightning activity is close to ideal and it does not differ for IC and CG lightning (Rison et al., 1999). With LF and VLF LLSs one gains the capability of monitoring lightning over increasingly large regions. In fact, LF LLSs are employed from national up to continental scales while VLF LLSs can monitor lightning activity globally. However, with the increase of the antenna network baseline and coverage, the capability of monitoring IC lightning decreases (i.e., the dominant component of the total lightning activity, Cummins and Murphy, 2009). In the context of this paper, continental LLSs worth mentioning are the National Lightning Detection Network (NLDN; Said et al., 2013) over continental United States, the European Cooperation for LIghtning Detection (EUCLID; Schulz et al., 2016), Météorage (Erdmann et al., 2020) and the Nordic Lightning Information System (NORDLIS; Mäkelä et al., 2016) over continental Europe, while global LLSs are the Global Lightning Detection network (GLD360; Said and Murphy, 2016) and the Earth Networks Total Lightning Network (ENTLN; Zhu et al., 2022).
Space-based LLSs monitor and characterize lightning activity by imaging photons originating along lightning channels and emerging at could tops (or cloud sides at very high viewing angles) after scattering within clouds. Standard sensing frequencies are set around 777.4 nm wavelength because lightning excites neutral atomic oxygen triplet emission lines. An important point to stress here is that any lightning discharge emits photons and, as a consequence, space-based LLSs have the capability of monitoring total lightning activity without the possibility of distinguishing between CG and IC (Koshak and Solakiewicz, 2015). Pioneering missions demonstrating the feasibility and effectiveness of this lightning monitoring principle are the Optical Transient Detector (OTD; e.g., Boccippio et al., 2000b, 2002) and the Tropical Rainfall Measurement Mission Lightning Imaging Sensor (TRMM-LIS; e.g., Boccippio et al., 2000a; Cecil et al., 2005, 2026). OTD was operated on a 70° inclination orbit from 1995 to 2000 while TRMM-LIS observed lightning in the tropics on a 35° inclination orbit during 1998–2015. These two instruments were capable of monitoring lightning from space during day and night over large portions of the planet. However, both were limited by short viewing times of their low-Earth orbiting satellites, making continuous monitoring of storms impossible. Geostationary LLSs were developed for continuous monitoring of lightning over large (hemispheric) areas. The first Geostationary Lightning Mapper (GLM) was launched in November 2016 aboard the first Geostationary Operational Environmental Satellite (now GOES-16; e.g., Goodman et al., 2013; Rudlosky et al., 2019; Rudlosky and Virts, 2021; Virts and Koshak, 2025) of the GOES-R Series. Currently, four different GLM instruments are on GOES-16, -17, -18 and -19 satellites enabling the monitoring of total lightning activity from New Zealand to the western coast of Africa. This coverage is achieved by operating two GLM instruments on GOES-East (at 75.2° W) and GOES-West (at 137° W) satellites, respectively. GLMs have been delivering to users continuous total lightning detections over a very large portion of the globe for several years. GLM's launch was followed by the Lightning Mapping Imager on the Chinese Fengyun-4A in December 2016 (FY-4A-LMI; e.g., Cao et al., 2021; Chen et al., 2021). In December 2025, a second LMI instrument has been launched on the Fengyun-4C (FY-4C-LMI). Depending on the season, the field-of-view (hereafter FOV) of FY-4A-LMI encompasses China, southern Indian Ocean and the Western part of Australia. FY-4C-LMI delivers hemispheric coverage. Table 1 summarizes the publicly available design features of all geostationary lightning mappers currently in orbit.
Table 1Key instrument design features of MTG-LI compared to GOES-GLM, FY-4A-LMI and FY-4C-LMI.

MTG-LI is manufactured by Leonardo (Italy) under the industrial prime contractor Thales Alenia Space (France) as part of the Meteosat Third Generation space segment development lead by ESA. MTG-LI is the first geostationary lightning imager ever manufactured in Europe. a See Fig. 2. b 14 km close to the edges of the field-of-view. c The reported coverage applies to the period mid-March to mid-September, while in the period mid-September to mid-March LMI points at the Southern Hemisphere (Cao et al., 2021).
Space-based geostationary LLSs are superior to ground-based ones for monitoring total lightning activity globally: they offer consistent, uniform, and continuous coverage over hemispheric scales (encompassing land, oceans, and remote regions) and high detection efficiency during both day and night (e.g., Goodman et al., 2013; Rudlosky et al., 2019; Virts and Koshak, 2025).
The Lightning Imager (LI), operated by EUMETSAT, is a new space-borne optical lightning detector in geostationary orbit at 0° longitude. Launched on 13 December 2022, aboard the first Meteosat Third Generation Imaging satellite (MTG-I; Holmlund et al., 2021, 2025), MTG-LI continuously monitors lightning activity in Europe, Africa, and part of the Atlantic Ocean, South America, middle East and Indian Ocean (Fig. 1). Since July 2024 (i.e., beginning of pre-operational dissemination), MTG-LI has been delivering near real-time lightning data products. These are already widely used by national weather services for the operational monitoring and now-casting of the development, evolution, and severity of thunderstorms (e.g., Combarnous et al., 2025). A total of four MTG-LI instruments will be deployed between 2022 and 2042.
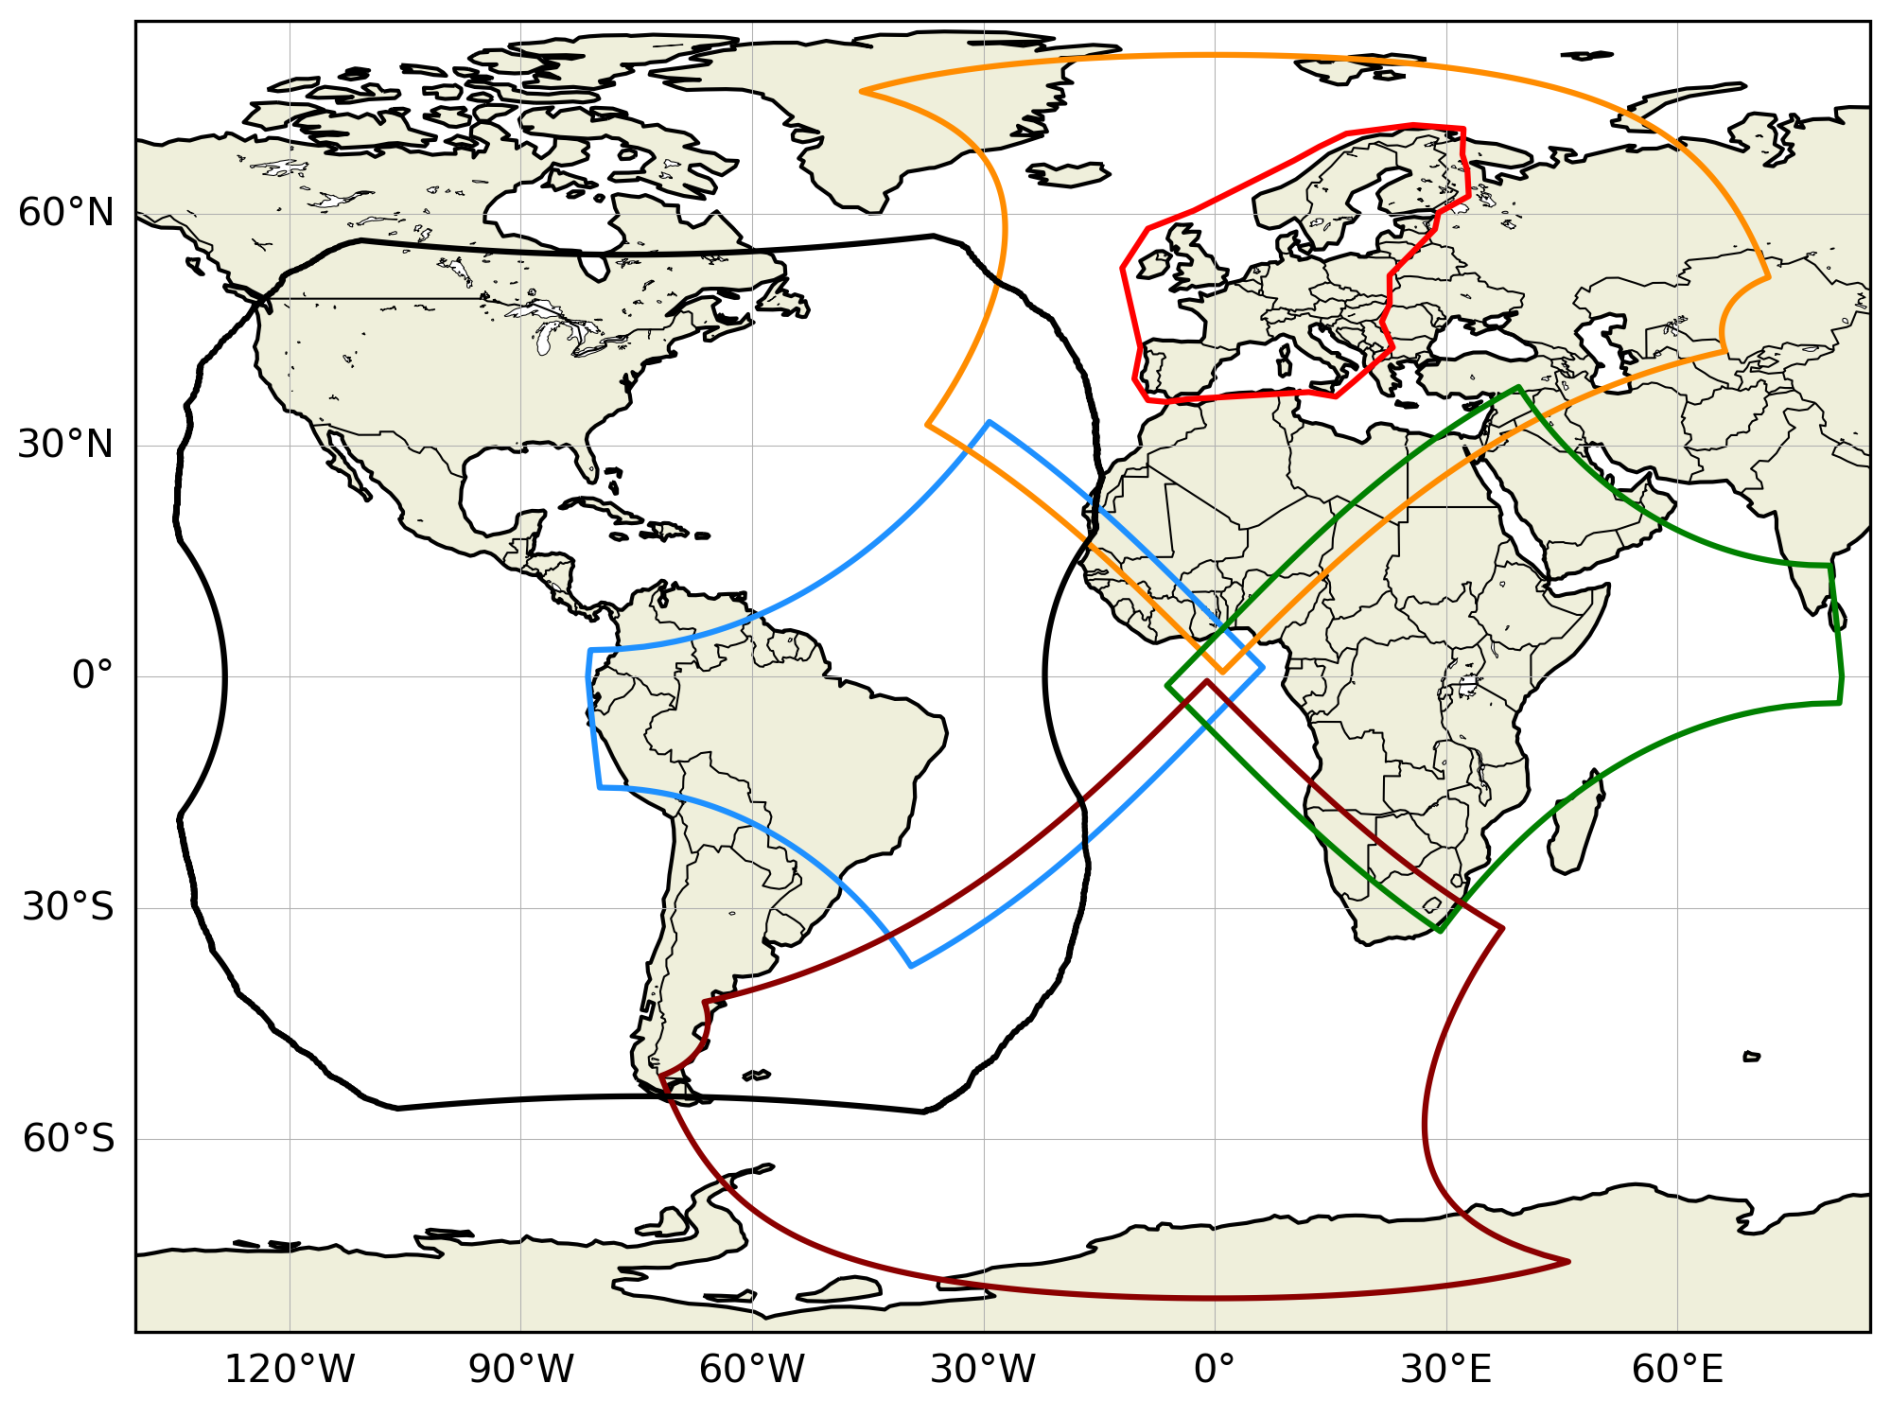
Figure 1FOV of GLM on GOES-East (black), EUCLID (red) and of the four Sectors covered by MTG-LI cameras (West in blue, North in orange, East in green, and South in brown, respectively). GLD360 data cover the entire domain of this figure.
The design and working principle of the MTG-LI instrument (Table 1) is largely inherited from previous space-borne optical lightning detectors from NOAA (Sect. 1). The MTG-LI uses four cameras for continuous observation of about 84 % of the Earth disk up to ±80° latitude, making its FOV considerably larger than GLM's (Fig. 1). The spatial coverage is defined by the geostationary orbital position of the MTG-I, its 0° longitude and the FOV of the instrument. The MTG-LI North Sector encompasses the whole of Europe and northern Africa. The West Sector encompasses the central Atlantic Ocean, eastern part of south America and western part of Africa. The East Sector encompasses central and eastern Africa, part of Middle East and western part of the Indian Ocean. Finally, the South Sector encompasses the South Atlantic Ocean and southern Africa.
Each MTG-LI camera is composed of a telescope lens coupled to a narrow-band (1.9 nm bandwidth) optical filter, centered around the 777.4 nm (Sect. 1). The Earth scene is projected onto four CMOS detectors composed of 1000×1170 px. This translates into a spatial sampling of 4.5 km at the sub-satellite point (i.e., [0° N, 0° E]) with a variation illustrated in Fig. 2. The acquisition rate of each sensor is one thousand images per second, corresponding to 1 ms exposure time. To detect optical emissions from lightning, MTG-LI continuously monitors the Earth scene (hereafter background) for sudden increases in pixel radiance. Such increases are defined relative to a reference background derived through a running average of previously acquired backgrounds. For each pixel, the detection threshold adjusts based on the background radiance: in simple words, the detection threshold used on a dark pixel (e.g., at night) is lower than the one used on a bright pixel (e.g., cloud at noon). At the locations of those pixels in which the increase of radiance in the last acquired frame exceeds the detection threshold, lightning candidates are detected. These are also called Detected Transients (hereafter DTs). Since one of the objectives of MTG-LI System is to provide users with lightning detections with a sensitivity as close as possible to the noise of the instrument, the vast majority of the DTs are False Transients (hereafter FTs) triggered by different noise sources (e.g., camera sensor noise, high energy particles, direct sunlight, or different types of Sun reflections in MTG-LI optics). However, most of the FTs are removed by the onboard filtering aimed at removing DTs originating from shot-noise before the data is sent to the ground. The MTG-LI on-board filtering logic is presented in Kokou et al. (2018). Depending on the time of day, the four MTG-LI cameras typically detect (0.25–1.25) ×106 DT s−1, while only a maximum of 8×10⁴ DT s−1 can be sent to the ground due to the limited bandwidth of the data down-link (Table 1). Together with DTs, also background images are down-linked once every minute. These are employed for navigation of MTG-LI measurements and for monitoring purposes.
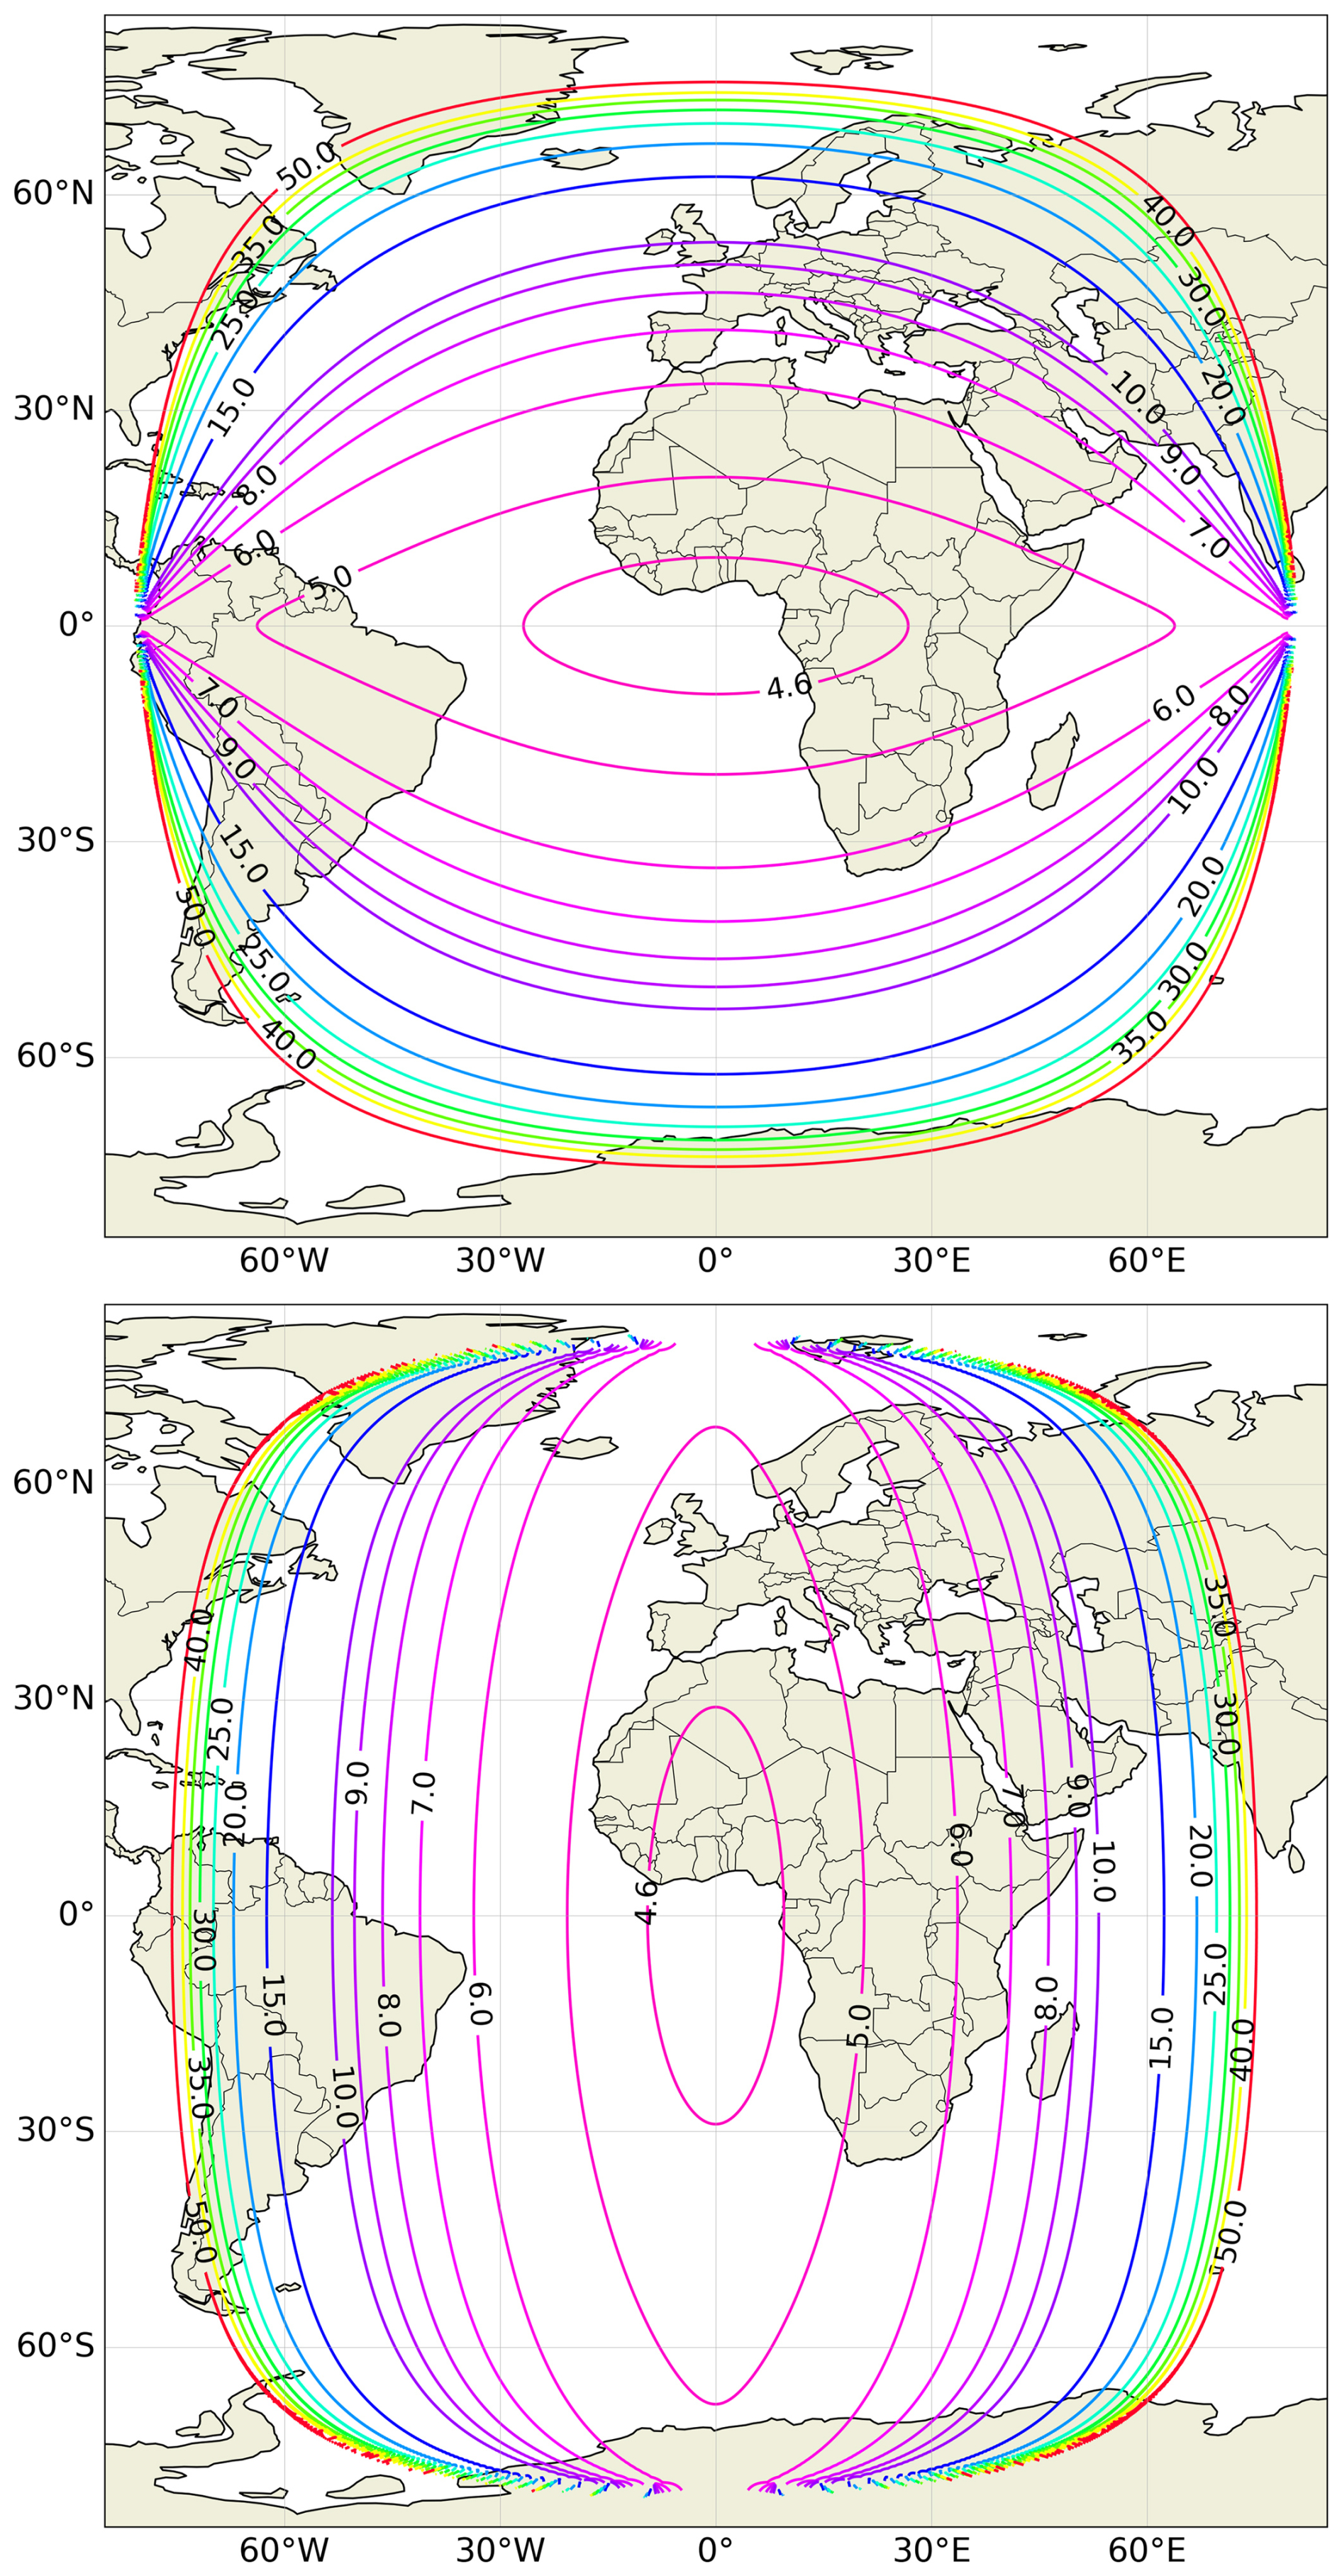
Figure 2MTG-LI spatial sampling in km along N–S (top panel) and E–W (bottom panel).
The on-ground processing is executed through the Instrument Data Processing Facility (IDPF-I) and the Level 2 Processing Facility (L2PF) of EUMETSAT. In the IDPF-I, background images and DTs are geolocated and calibrated radiometrically. In addition, more DT filtering is performed by a set of filters that greatly reduce the number of FTs. The output of IDPF-I is mostly composed by true DTs (or lightning events) that are then fed into the L2PF. Depending on the time of the day and the amount of lightning activity in the MTG-LI FOV, the number of DTs in output of IDPF-I varies between a few hundreds to a few thousands per second. The L2PF clusters DTs that are adjacent on the MTG-LI pixel grid and acquired on the same 1 ms integration frame into lightning groups. For each lighting group, geographical coordinates are computed as the radiance-weighted centroid of all the DTs in the group while the observation time is set by the UTC time of the acquisition frame. Lightning groups correlated in time and space within 330 ms and 16.5 km are then clustered into flashes. For each lighting flash, geographical coordinates are computed as the radiance-weighted centroid of all groups in the flash while the observation time is the UTC time of the first group in the flash. The MTG-LI flash clustering approach is generally in line with other space-borne optical lightning detectors (e.g., Mach, 2020). The L2PF also evaluates groups and flashes through a set of filters to further remove FTs that passed the IDPF-I filtering. As a small part of the MTG-LI FOV is covered by two or even three cameras (Fig. 1), a flash duplicate check is performed. If more than one observation of the same flash is found in multiple cameras, then only the richest flash (i.e., the one with the greatest number of lightning events) is preserved.
The MTG-LI System delivers a portfolio of products. A comprehensive user guide of all MTG-LI products is available at EUMETSAT (2026). These provide users with a comprehensive characterization of total lightning activity: from global/hemispheric scales down to single convective cells. In the context of this publication, the most relevant products are MTG-LI Level 2 lightning groups (LI-2-LGR) and flashes (LI-2-LFL), respectively.
The MTG-LI is an imaging Mission/System and it is characterized by the following key performances: (a) radiometric, (b) geometric and (c) lightning detection, respectively. At EUMETSAT, different methodologies are being employed to continuously monitor MTG-LI performances. These can be divided in two categories: (i) those analyzing background images (assessing a and b) and (ii) those analyzing lightning detections (assessing c). In this manuscript we focus on the second category of methodologies, and in particular on those providing one with MTG-LI detection performances.
Detection performances of an LLS are a matter of balance between detection efficiency and false alarm rate. The former quantifies the percentage of real lightning that is detected by the LLS and is made available to users in the disseminated products. The latter measures the rate per second of false measurements that are left in products after the filtering of FTs (Sect. 2). It is important to clarify that the false alarm rate of a LLS could be virtually reduced to zero. However, this would strongly impact the detection efficiency by removing from products those lightning measurements whose properties are similar to false ones (composed of FTs) due to noise. Since one of the goals of the MTG-LI System is to deliver lightning detections with a sensitivity as close as possible to the noise of the MTG-LI instrument, one should consider a false alarm rate larger than zero as a trade-off to achieve higher detection efficiency.
In the present paper, a two-system Bayesian absolute flash detection efficiency approach is adopted to compute the flash detection efficiency of the MTG-LI System (Bitzer et al., 2016; Virts and Koshak, 2025). The Bayesian approach can be applied to a generic combination of systems to derive an increasingly (with the number of systems) refined measurement of the absolute flash detection efficiency. In our analysis we opted for the following set of assessments: (i) MTG-LI against GLD360 for the computation of absolute flash detection efficiency and flash false alarm rate over the entire MTG-LI FOV, (ii) MTG-LI against EUCLID for a complementary absolute flash detection efficiency assessment over Europe and (iii) MTG-LI against GOES-GLM for a complementary absolute flash detection efficiency assessment in the overlap region between these two optical space-based systems (Fig. 1).
The computation of the Bayesian absolute flash detection efficiency is based on the computation of the conditional detection probability (P(test|ref)) of the two systems employed for the performance assessment: test and reference, respectively. This basis on a “matching exercise” between measurements delivered by the two systems. A test system flash matches with a reference system flash when it is found within the spatial matching radius during the matching time window from the reference system flash (as defined in Table 2). When that is the case, then it can be assumed that the reference system flash was detected also by the test system. A one-to-many matching schema is employed, allowing for matching one flash of the test system to multiple flashes of the reference system. This is the best choice for comparing flash products whose properties can vary due to specific design and/or processing features of the respective systems. Once the matching exercise is executed over the entire reference sample nref, the conditional probability is computed as:
where nmatches is the total number of test flashes matched to reference flashes. For each pair of systems (A and B, respectively) being compared, the conditional detection probability is computed “both ways” (i.e., P(A|B) and P(B|A)), by employing each system as test and reference, respectively. With both conditional detection probabilities, the upper limit of the absolute flash detection efficiency is:
Hereafter, the MTG-LI absolute flash detection efficiency will be FDE (expressed in %). This has been derived between LI-GLD360, LI-EUCLID and LI-GLM, respectively, with the six sets of configuration parameters under both “test” and “ref” columns of Table 2.
Table 2Configuration parameters used for the assessment of MTG-LI performances against external LLSs. For each LLS, both sets of parameters employed when MTG-LI is used as a test system and as a reference system are included, respectively. In addition, normal characters mark those parameters used in the flash-to-flash matching, while bold ones mark those used in the group-to-stroke matching. Cells without information mark comparisons outside the scope of this publication. In the group-to-stroke matching, a one-to-one schema is employed, while a one-to-many is employed for the flash-to-flash matching.
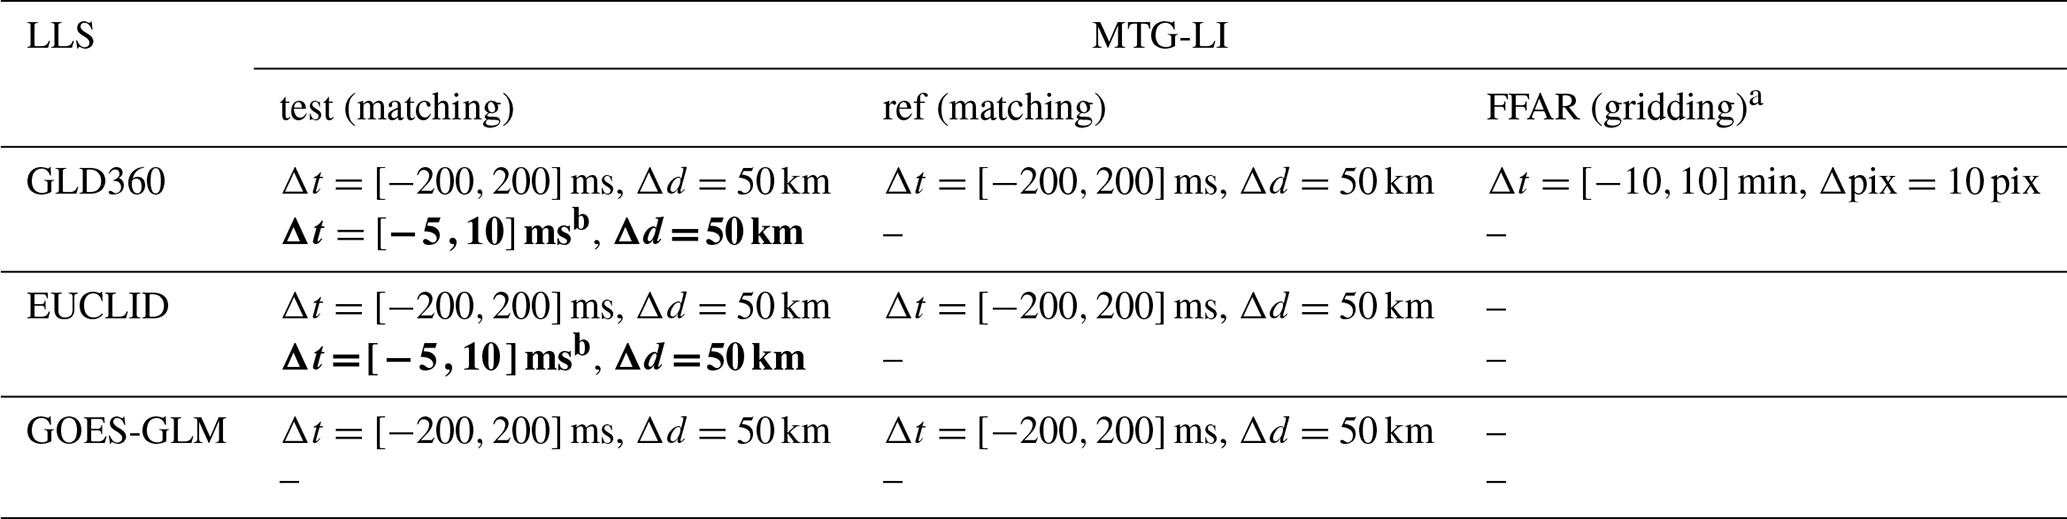
a The Δpix=10 px used on a 0.1° ×0.1° grid corresponds to 1° × 1°. b The negative part of the asymmetric matching window is meant to account for timing uncertainties and possible pre-stroke optical breakdown, while the positive part accounts for delays introduced by scattering of photons within clouds.
The matching exercise employed for the computation of conditional probabilities used in Eq. (2) offers one the possibility of deriving two additional performance indicators: (i) location accuracy (LA) and (ii) timing accuracy (TA), respectively. In this case, the measurements employed in the matching exercise are MTG-LI groups (test) and ground-based strokes (ref) from GLD360 and EUCLID, respectively, with the configuration parameters under the test column of Table 2. The reason for this choice is that groups, having considerably smaller spatial and temporal extent than flashes, reflect MTG-LI spatial and temporal accuracy better than flashes. LA is the mean of the distance between matched groups-strokes pairs (expressed in km), while TA is the mean of time differences between observation times of matched groups-strokes pairs (expressed in ms). Differently from the flash matching, a one-to-one matching schema is employed when matching between MTG-LI groups and ground-based strokes.
The Flash False Alarm Rate (FFAR) is computed by employing a gridded approach. The grid has 0.1° ×0.1° bins and GLD360 flashes are used as seeds to mark regions of lightning activity, called reference storm areas. In detail, reference storm areas are derived by: (i) marking those grid elements in which GLD360 flashes are found within the accumulation time (Δt) and (ii) expanding the marked elements using a buffer of pixels (Δpix; see both configuration parameters in the last column of Table 2). MTG-LI flashes during one minute, i.e., the central minute of GLD360 accumulation time, are classified at each step. A MTG-LI flash is false if it is outside the reference storm areas. The approach for computing the FFAR is very different from the one of the flash matching exercise for measuring the FDE, in which a match is found within very small margins around each reference measurement (Table 2). In fact, the FFAR is computed with a very conservative approach: a flash is false when it is very far from GLD360 flashes. The ground for this choice is that one expects MTG-LI to be more sensitive to IC lightning than GLD360. The latter system is known to favor the detection of CG flashes which are a small fraction of the total lightning activity. Nevertheless, GLD360 flashes can be used as tracers of regions of lightning activity in which true lightning detections from MTG-LI are expected to be found within certain margins. The extreme opposite of this approach would be flagging as false those MTG-LI flashes that are not matched to any reference GLD360 flash in the computation of the FDE. This approach would give one a very large (ill defined) FFAR stemming from the fact that many of the MTG-LI flashes capturing IC lightning activity have no counterpart in GLD360 flashes.
Prior to any comparison between MTG-LI and ground-based measurements, MTG-LI data must be corrected for parallax as well as light travel time. This is necessary since MTG-LI senses photons emerging from clouds while orbiting at about 3.6×10⁴ km above Earth surface, while ground networks locate lightning detections on ground. In detail, the parallax effect increases with increasing viewing angles of the instrument towards the edges of the visible Earth disk. As MTG-LI DTs are normally detected at cloud tops, i.e., about 10–15 km above ground, locations of MTG-LI measurements at large viewing angles appear to be further away from the sub-satellite point than they are. In addition, the light travel time between Earth clouds and the instrument is in the order of 120–150 ms, meaning that the correction is critical when matching MTG-LI and ground-based products (for direct comparison, see Table 2). In the present study, MTG-LI data were corrected for both effects. The parallax correction is computed from a thirteen-year-long cloud-top-height climatology of ice clouds derived from the Optimal Cloud Analysis product of EUMETSAT (Bozzo et al., 2024) and varies with the geolocation and with the month. The light travel time is modeled by taking into account the distance between the Earth surface and the MTG-I satellite orbit. The Jupyter notebook to derive both corrections can be found at the user guide link available in EUMETSAT (2026).
MTG-LI System performances FDE and FFAR are quantified relative to GLD360. This is the main reference defining the “lightning truth” against which MTG-LI System performances are measured: GLD360 is a widely used global LLS, it delivers lightning strokes and flashes continuously within the entire MTG-LI FOV (Fig. 1) and its performances have been extensively characterized. In addition, complementary performance assessments against two additional LLS are presented in this publication, i.e., EUCLID and GLMs on GOES-East, whose FOV overlaps with MTG-LI’s (Fig. 1). The characterization of the relative performances between MTG-LI and EUCLID is very relevant for characterizing the capability of the MTG-LI System of monitoring total lightning activity over a good portion of Europe (i.e., over several EUMETSAT member states; see Fig. 1). GLD360 detection capabilities are biased towards the detection of CG lightning (Cummins and Murphy, 2009), i.e., a small portion of the total lightning activity. The shorter baseline of EUCLID translates into better capabilities of monitoring total lightning activity than GLD360, i.e., EUCLID is a continental reference LLS which provides one with a more complete description of lightning activity than GLD360. In addition, EUCLID has very good location accuracy, of the order of a few hundred meters (Schulz et al., 2016). EUCLID can be regarded to be the European counterpart of the NLDN over continental United States. NLDN was employed to complement the GLM performance assessment done against GLD360 (Murphy and Said, 2020).
The characterization of the relative performances between MTG-LI and GLM is very relevant because of their design (Table 1). Their detection principle is the same as well as key elements of their processing/filtering chain. GLMs are being operated since 2016 and a total of four have been launched with progressively improved detection performances (Virts and Koshak, 2025). In addition, in the context of global lightning monitoring, GLMs and MTG-LI currently represent the state of the art of continuous space-based lightning monitoring from geostationary orbit whose combination of flash detections provides one with continuous monitoring of total lightning from New Zealand (west-most region covered by GOES-West) to the Arabian Peninsula (east-most region covered by MTG-LI; see Fig. 1). The knowledge of the relative performances in the overlap region of GLM on GOES-East and MTG-LI is critical to define a meaningful approach to merge/combine flashes from the two space-based LLSs into a single dataset (Enno et al., 2026).
Finally, MTG-LI, GLD360 and EUCLID are compared over a reference period of eighteen months: from July 2024, i.e., beginning of pre-operational dissemination of MTG-LI products, and end of year 2025. MTG-LI is compared against GOES-GLMs over two different periods: July 2024–March 2025 against GLM-16 and April–December 2025 against GLM-19, respectively. Results are derived as averages over these periods. In detail, such averages will be derived as a function of the geolocation to derive maps, or as a function of time (either local time or UTC) to derive temporal variations over 24 h. In maps, we disregard the results from those grid cells in which less than ten reference (ref) measurements are available and we exclude from the assessment those locations for which the parallax correction is not available. This is a 5–6° “ring” along the edges of the MTG-LI FOV. Finally, a total of about 14 d with MTG-LI data outages were excluded from the analysis.
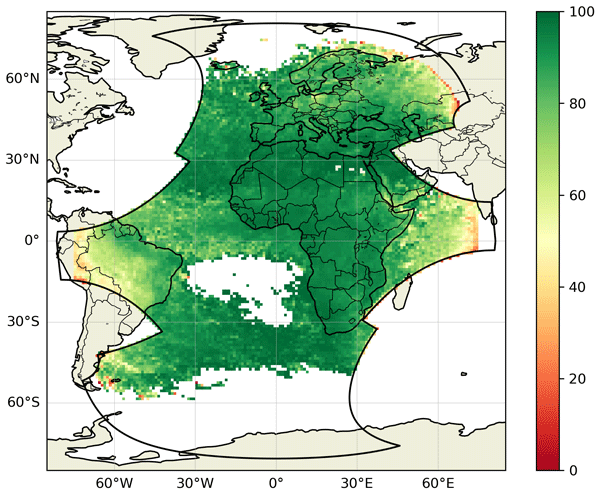
The average MTG-LI FDE over its full FOV during the reference period is 87.4 %. The FDE map (Fig. 3) indicates uniformly high FDE over most of the MTG-LI FOV, including FDE >90 % across Africa and 80 %–90 % over Europe. Over South America, Russia and Indian Ocean there is a sharp drop of FDE near the edge of the MTG-LI FOV.
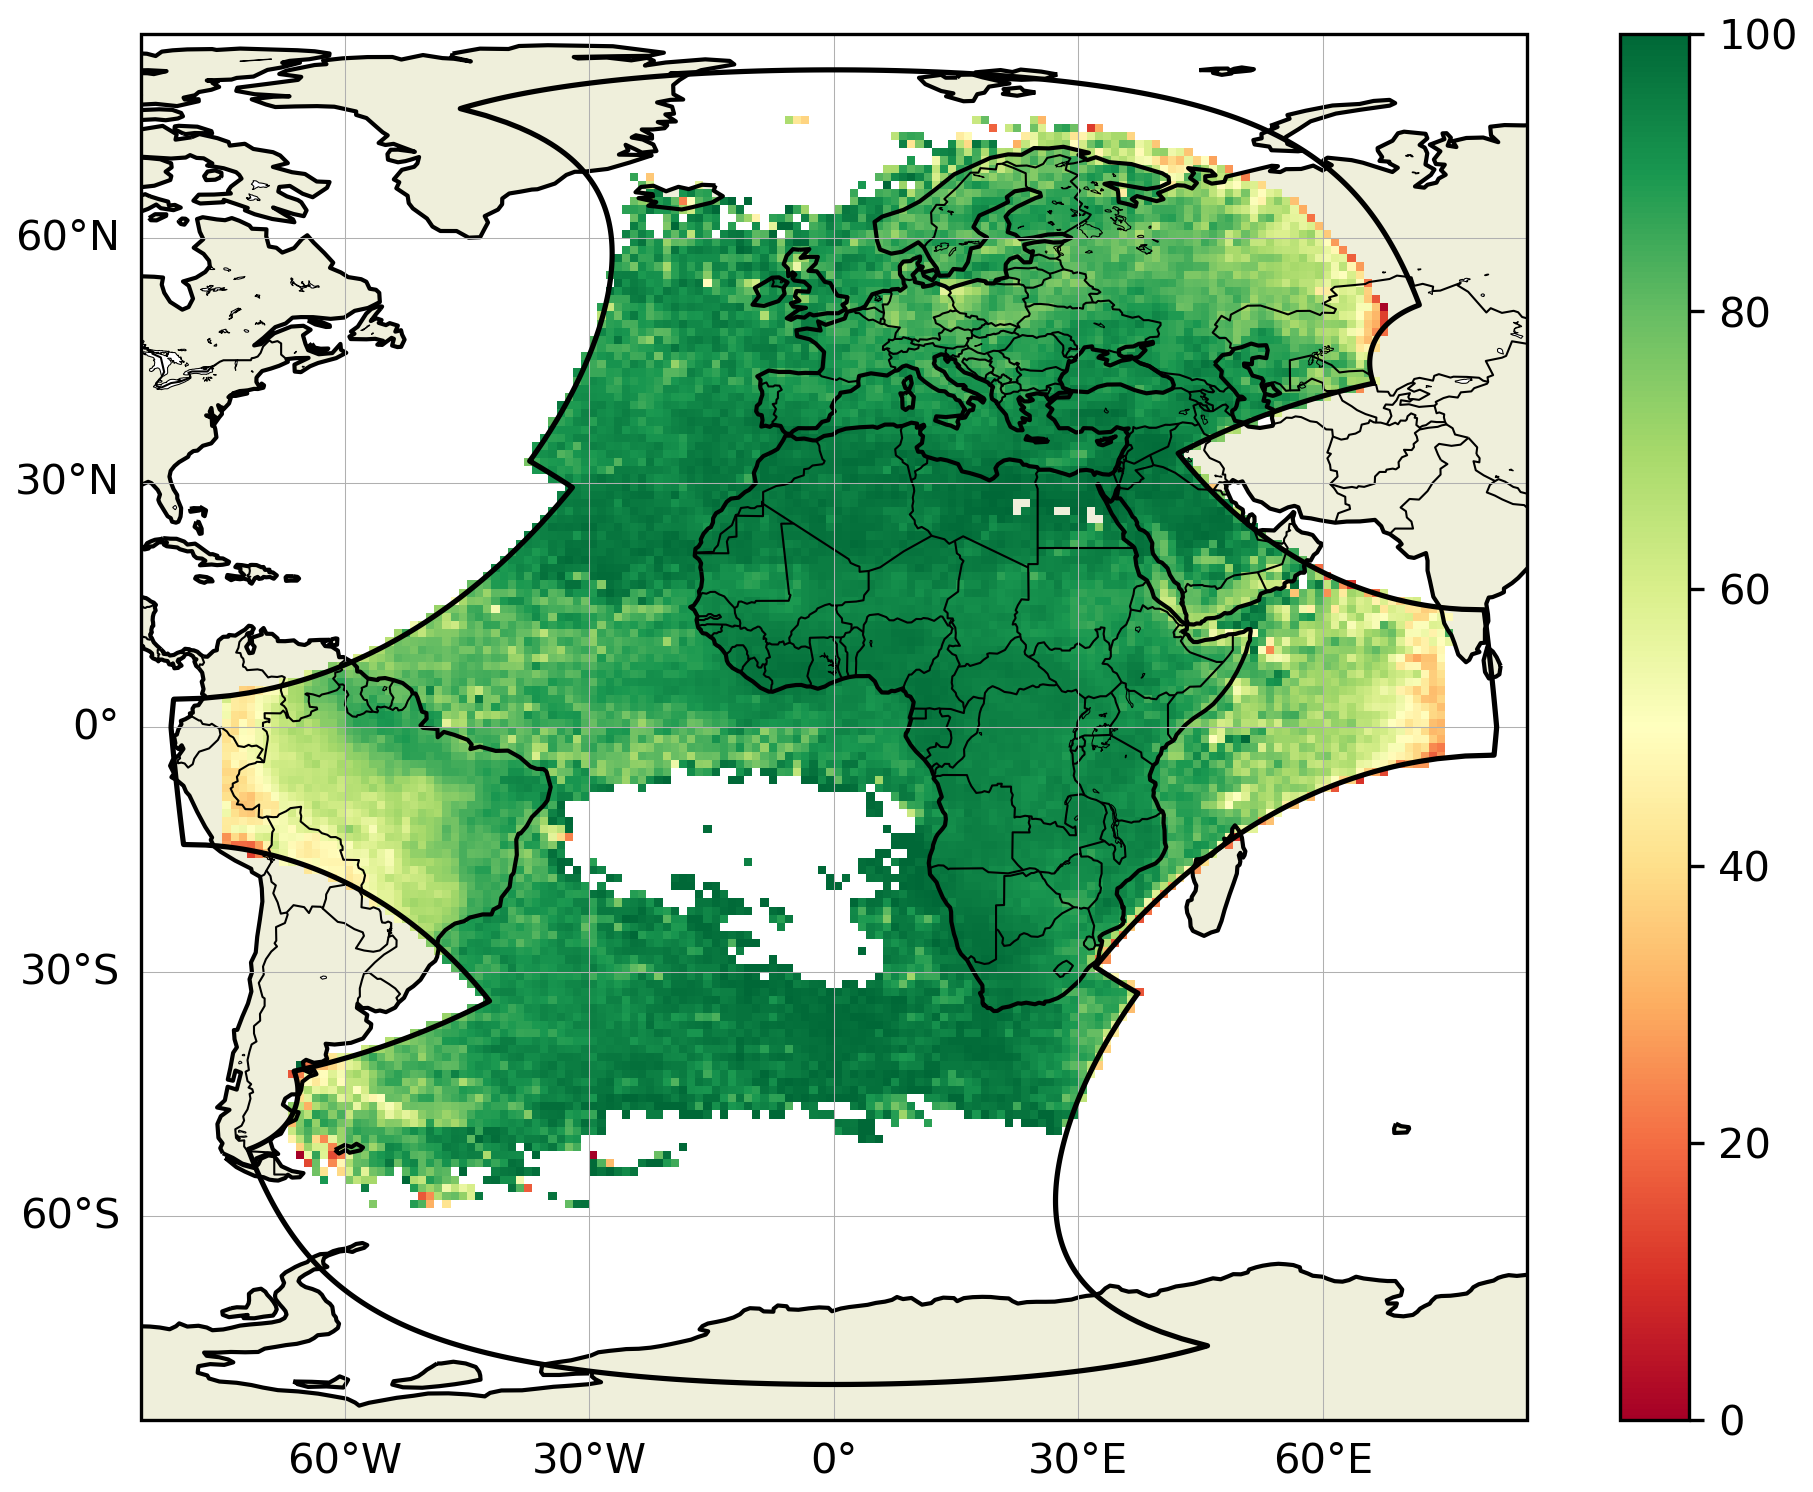
Figure 3MTG-LI absolute flash detection efficiency (FDE; see Eq. 2) in the MTG-LI FOV derived against GLD360 over the period July 2024–December 2025 and presented over a 1° ×1° grid.
The dependency of FDE with the distance from the sub-satellite point is further illustrated in Fig. 4. In detail, the top plot shows FDE as a function of the latitude along the north–south (hereafter N–S) axis of the region delimited by [0–75° N; 25° W–40° E]. FDE over Africa (i.e., 0–35° N) is always above 90 %. From the northern coast of Africa to northern Scandinavia (at about 70° N), FDE decreases down to about 73 %. The average FDE over the entire region is 93.6 %. The complementary MTG-LI flash distribution plot indicates that this number is strongly dominated by the very high amount of lightning in central Africa (i.e, 0–20° N) and somewhat contributed by lightning over southern and central Europe (i.e., 40–50° N). In contrast, very little lightning was observed around 30° N (over the Sahara Desert) and north of 60° N (over Scandinavia).
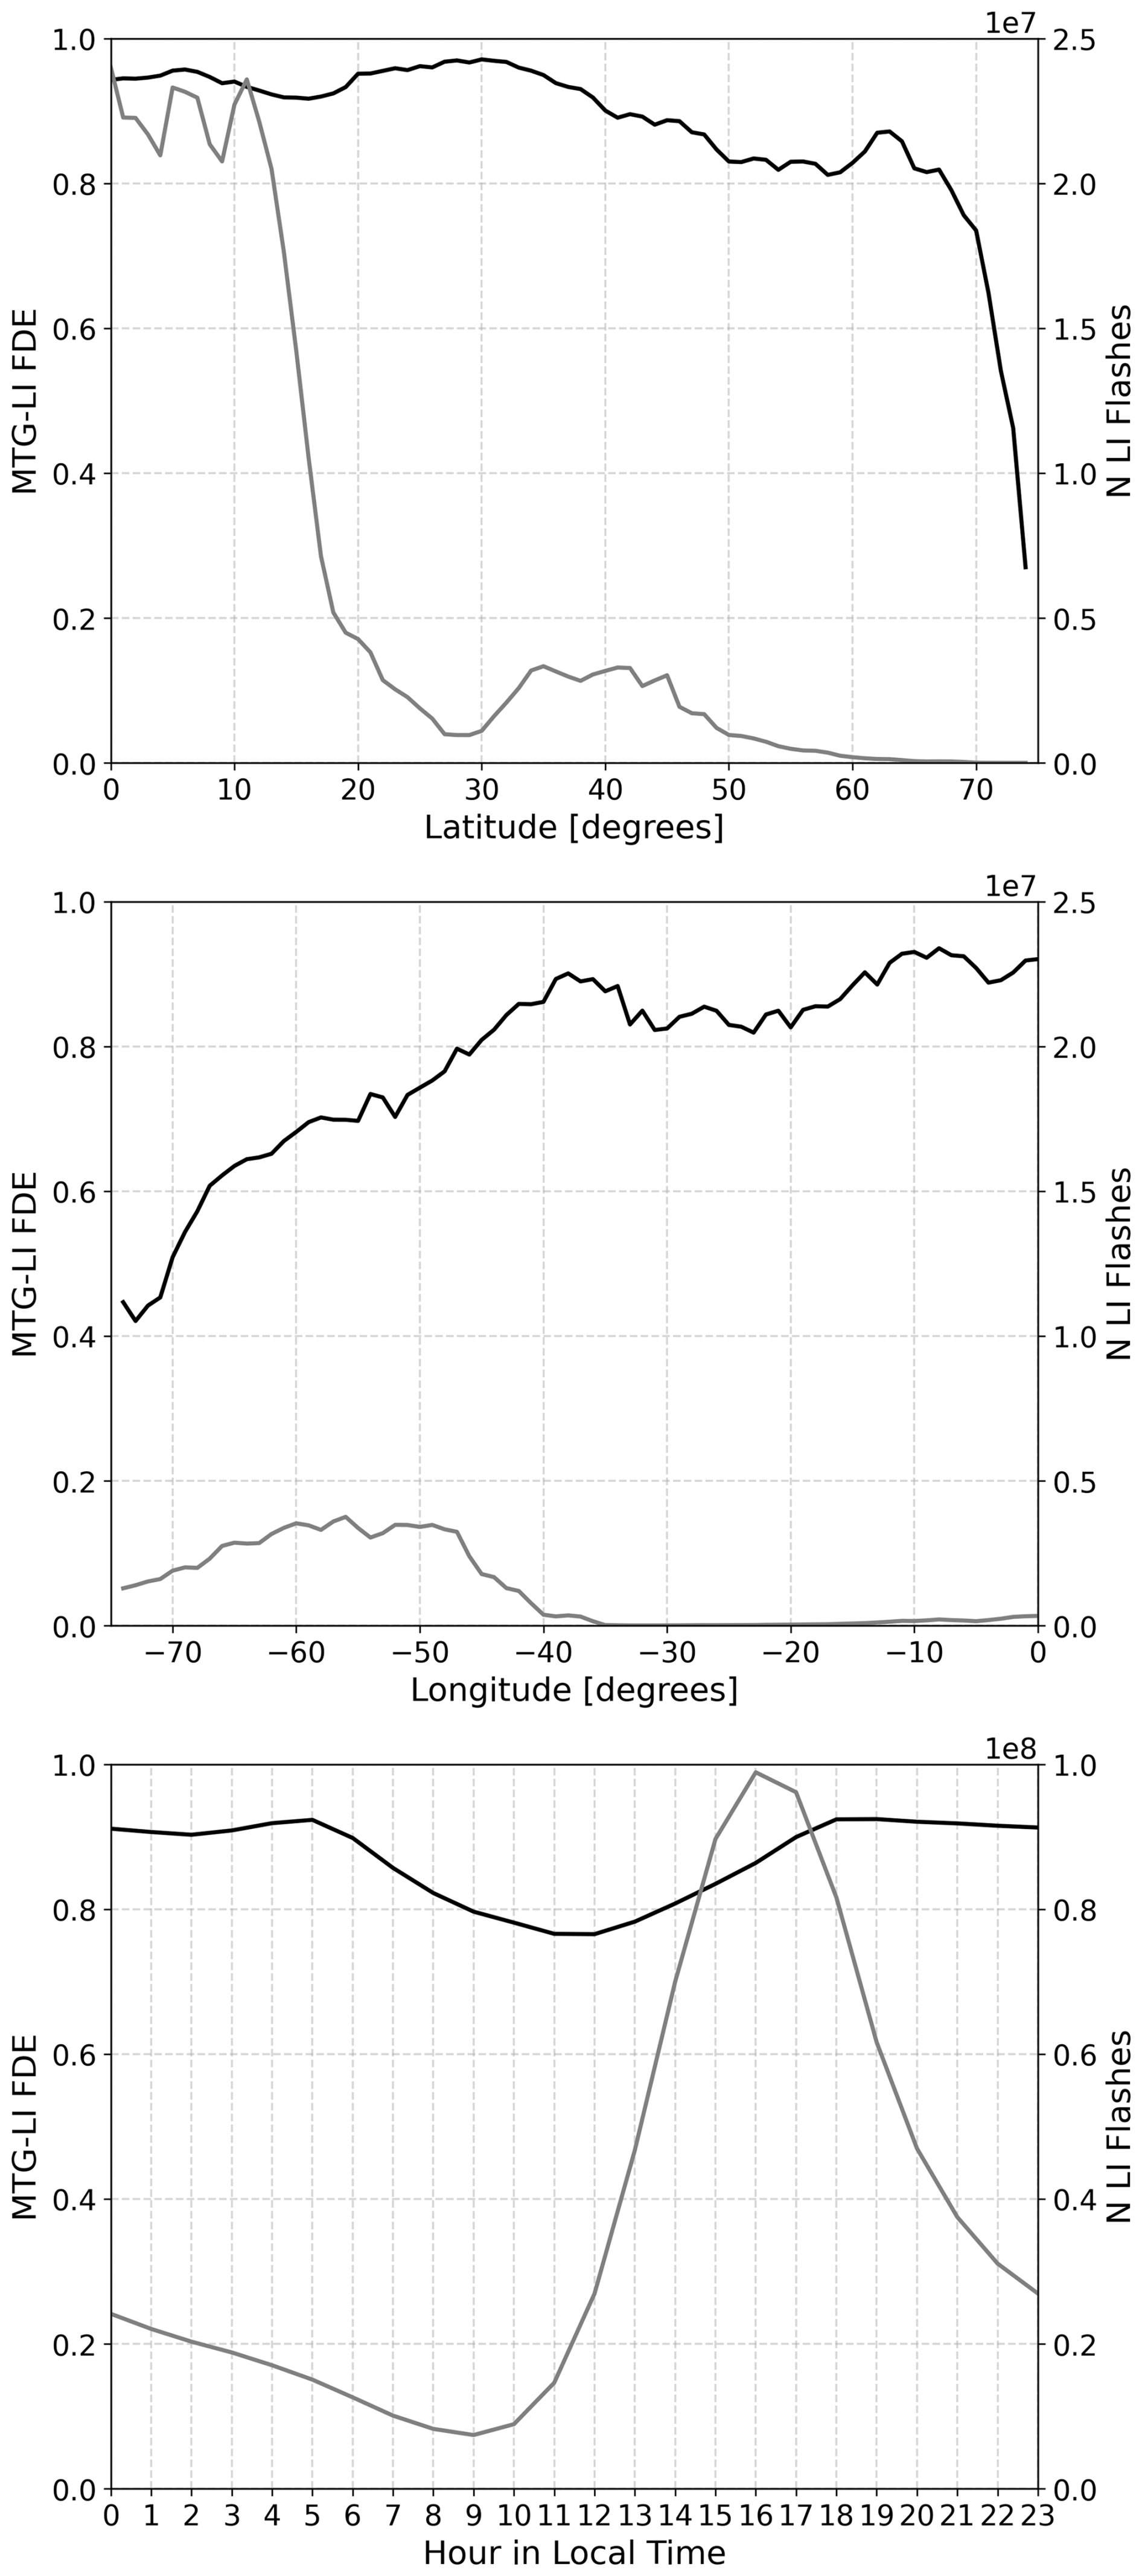
Figure 4Properties of the MTG-LI absolute flash detection efficiency (FDE; see Eq. 2) derived against GLD360 over the period July 2024–December 2025. Top plot: FDE as a function of the latitudes spanned in the region [0–75° N; 25° W–40° E] (black line) and total number of MTG-LI flashes as a function of latitudes spanned in the same region (gray line, referred to the right y-axis). Middle plot: same as top plot as a function of longitudes spanned in the region [3° N–14° S; 75° W–0° E]. Bottom plot: average FDE as a function of local time over the whole MTG-LI FOV (black line) and hourly totals of MTG-LI flashes as a function of local time over the whole MTG-LI FOV (gray line, referred to the right y-axis).
The middle plot of Fig. 4 is the same as the top plot, but this time the FDE is presented as a function of the longitude along the east–west (hereafter E–W) axis of the region delimited by [3° N–14° S; 75° W–0° E]. From east (at longitude of 0° E) to west (at longitude of 75° W), one finds a constant decrease of FDE from about 95 % down to about 40 %. The average FDE over the entire region is 67.6 %, much lower than in the region used to study the latitudinal variation (top plot). The complementary MTG-LI flash distribution plot shows that this result is strongly dominated by the lightning activity over South America (35–75° W), i.e., much further from the sub-satellite point than in the top plot. It can be also noticed that the totals of MTG-LI flashes in South America are about five times lower than in Africa. Here, it is important to consider that the used spatial area only covers a relatively small part of South America between 3° N and 14° S.
The bottom plot of Fig. 4 presents the variation of the FDE over the entire MTG-LI FOV as a function of the hour of day in local time. The impact of illumination conditions on the MTG-LI FDE is evident. During the hours in which the Sun illumination is low or absent, FDE is flat at about 90 %–95 %, while it has a minimum of around 75 % at noon. The transition from the minimum at noon to the maximum during low illumination hours is almost perfectly symmetric with respect to noon. The complementary MTG-LI hourly flash count plot indicates that the lowest FDE around local noon is characterized by relatively low lightning activity. By the time of the diurnal maximum in lightning activity, at 16–17 h local time, FDE has already increased to 80 %–85 %.
The map of the average MTG-LI absolute LA during the reference period shows values of the order of 10–15 km over most of the FOV (Fig. 5). The most obvious feature in Fig. 5 is a relatively sharp increase (i.e., worsening) near the edges of the FOV where the observation geometry is unfavorable (accompanied by low FDE; see Fig. 3). Over the seas and oceans, LA is generally worse than over land. Some regional variations are also visible over the continents. LA over Africa and Arabian Peninsula is always better than 15 km. Furthermore, there are extended regions with LA values below 10 km in Europe and Africa. The latter are those with the strongest lightning activity (i.e., the largest number of groups) in the MTG-LI FOV (Enno et al., 2026) and set the most frequent value of the LA histogram represented in Fig. 6. The diurnal cycle of the absolute LA over the entire MTG-LI FOV is presented in Fig. 7. Values vary from 8.7 km at 12:00 UTC to more than 13 km between 20:00 UTC and 05:00 h UTC, with the mean value of 11.7 km. MTG-LI TA<1 ms (y-axis in Fig. 6). In addition, this is found to be very stable over the entire reference period. TA is assessed exclusively against GLD360.
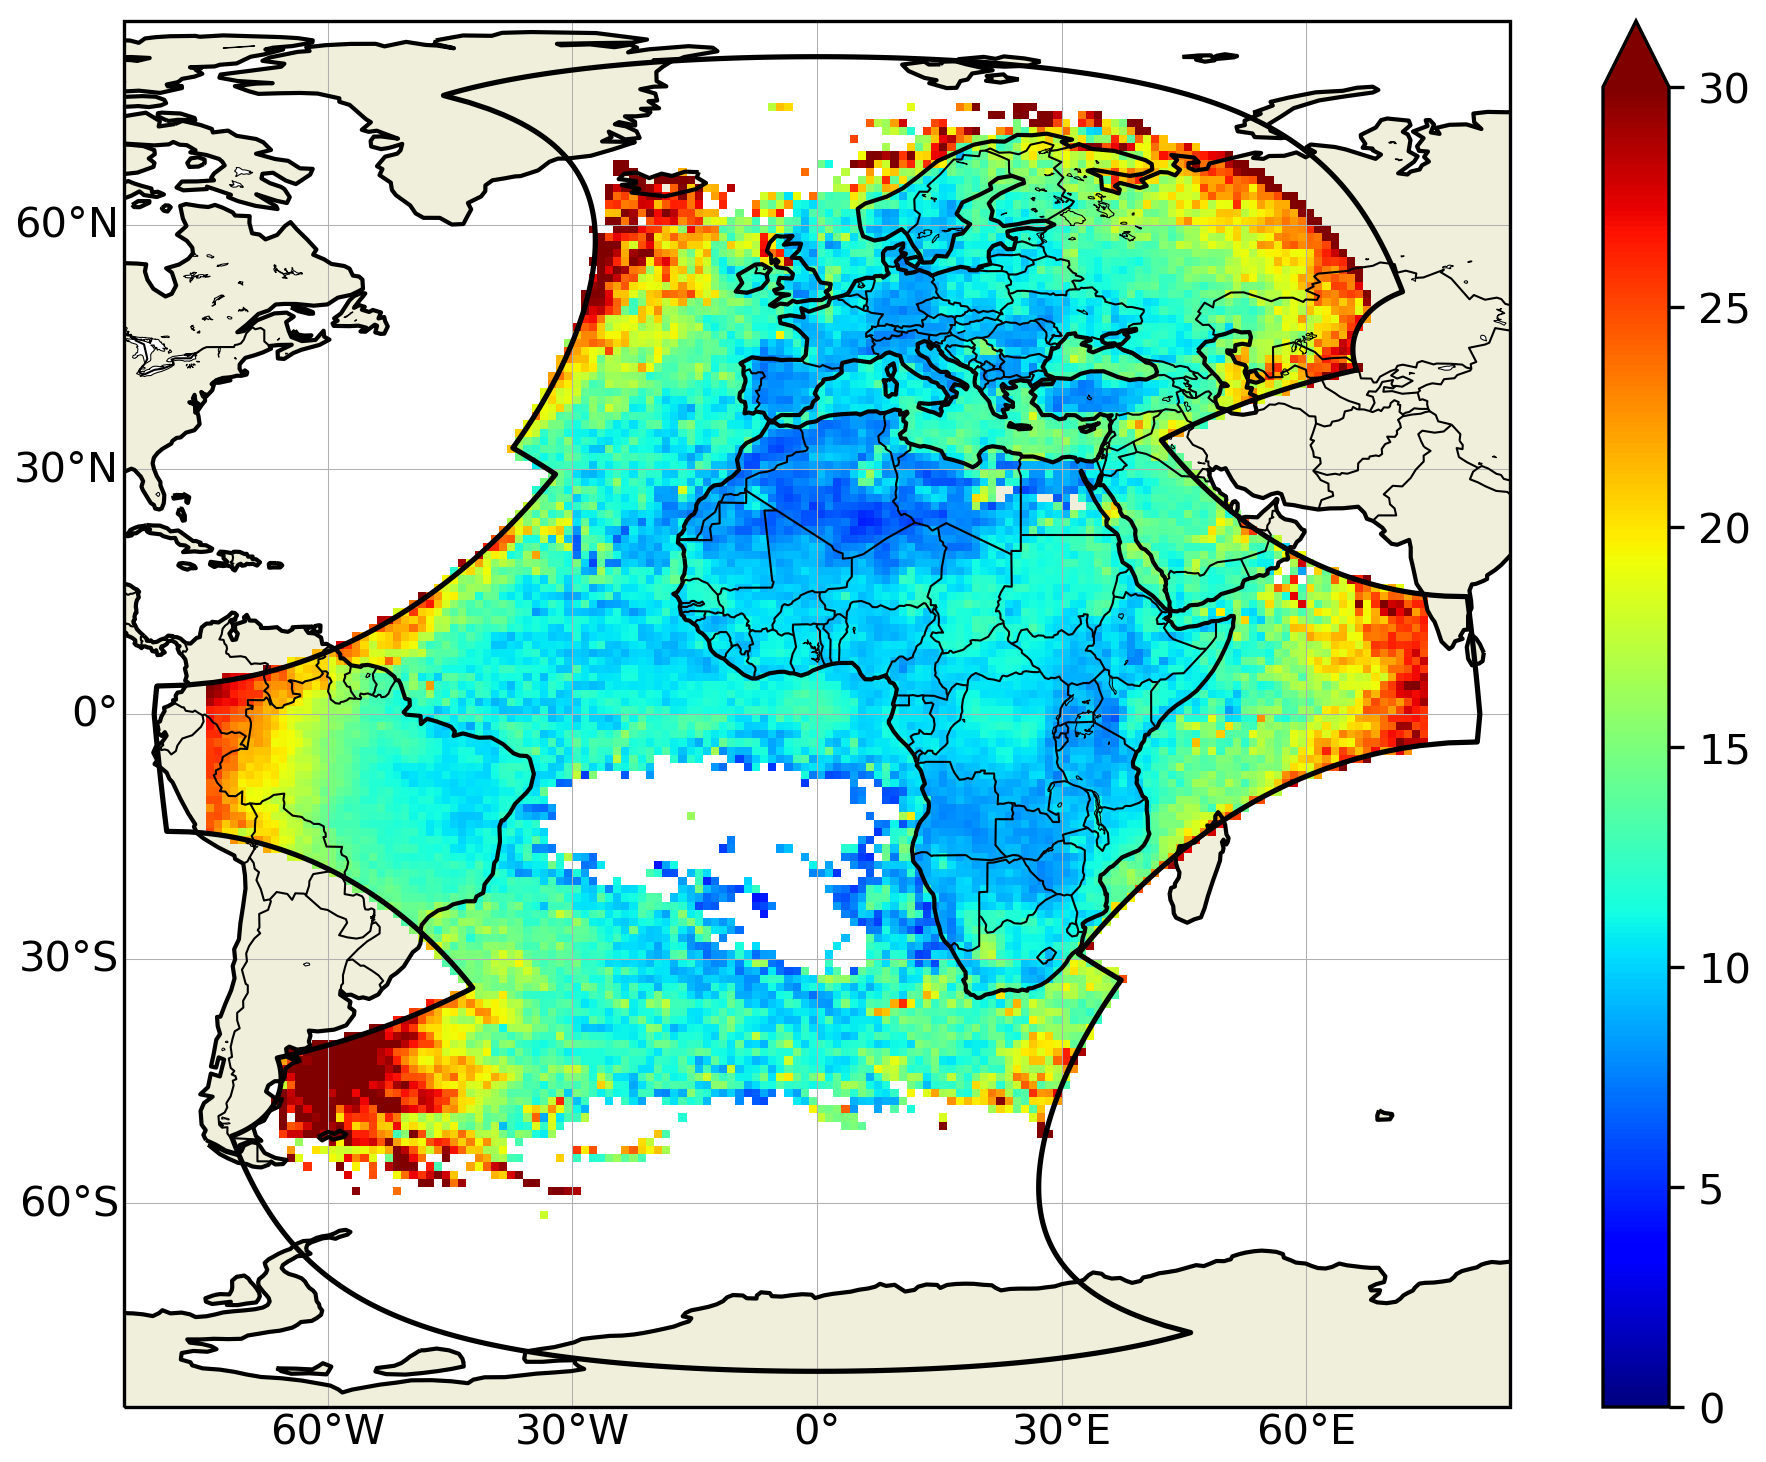
Figure 5MTG-LI average absolute location accuracy (LA in km; see Sect. 3) in the MTG-LI FOV derived against GLD360 over the period July 2024–December 2025 and presented over a 1° ×1° grid.
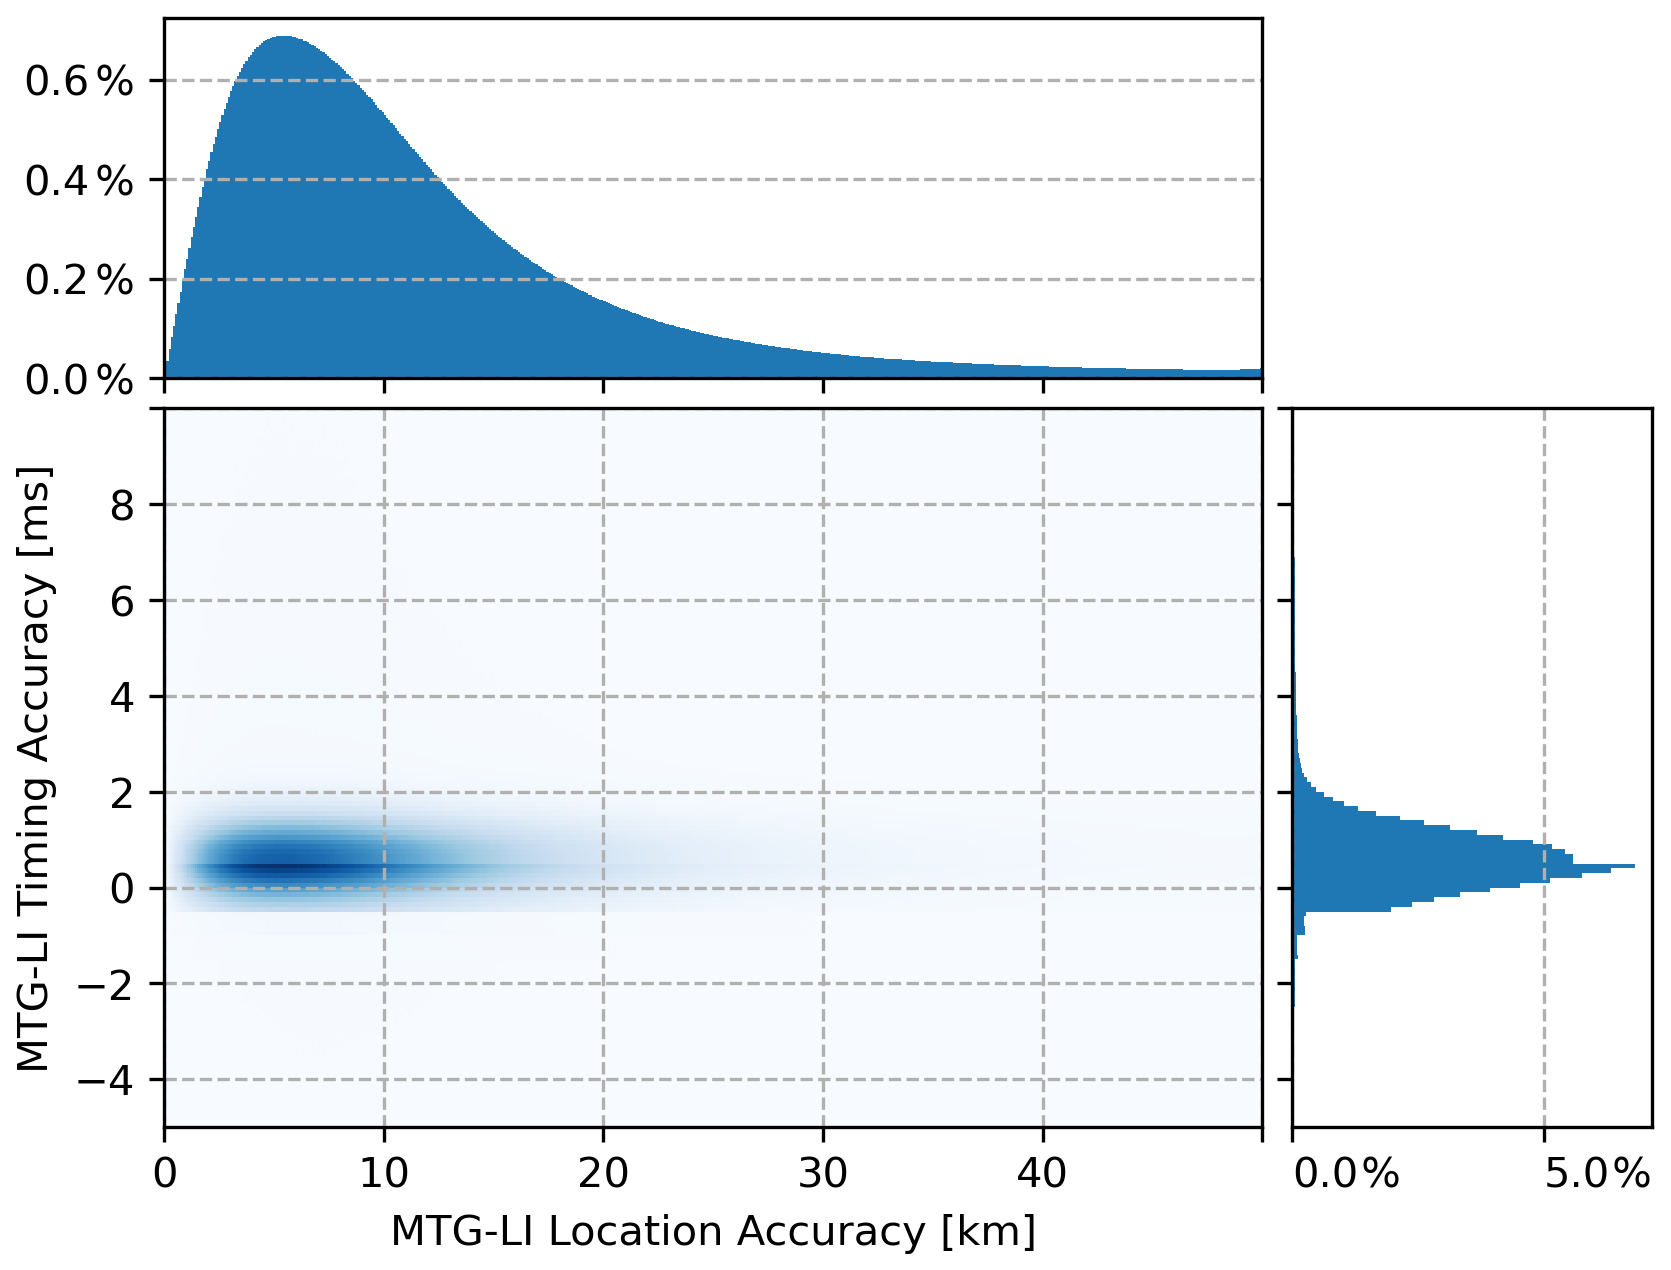
Figure 6MTG-LI average absolute location accuracy (LA in km; see Sect. 3) against timing accuracy (TA in ms; see Sect. 3) presented as histograms normalized to the total counts of groups employed in the matching exercise. The range of x and y axes are set according to the matching windows presented in Table 2. The bin size is 0.1 km on the x-axis and 0.1 ms on the y-axis, respectively.
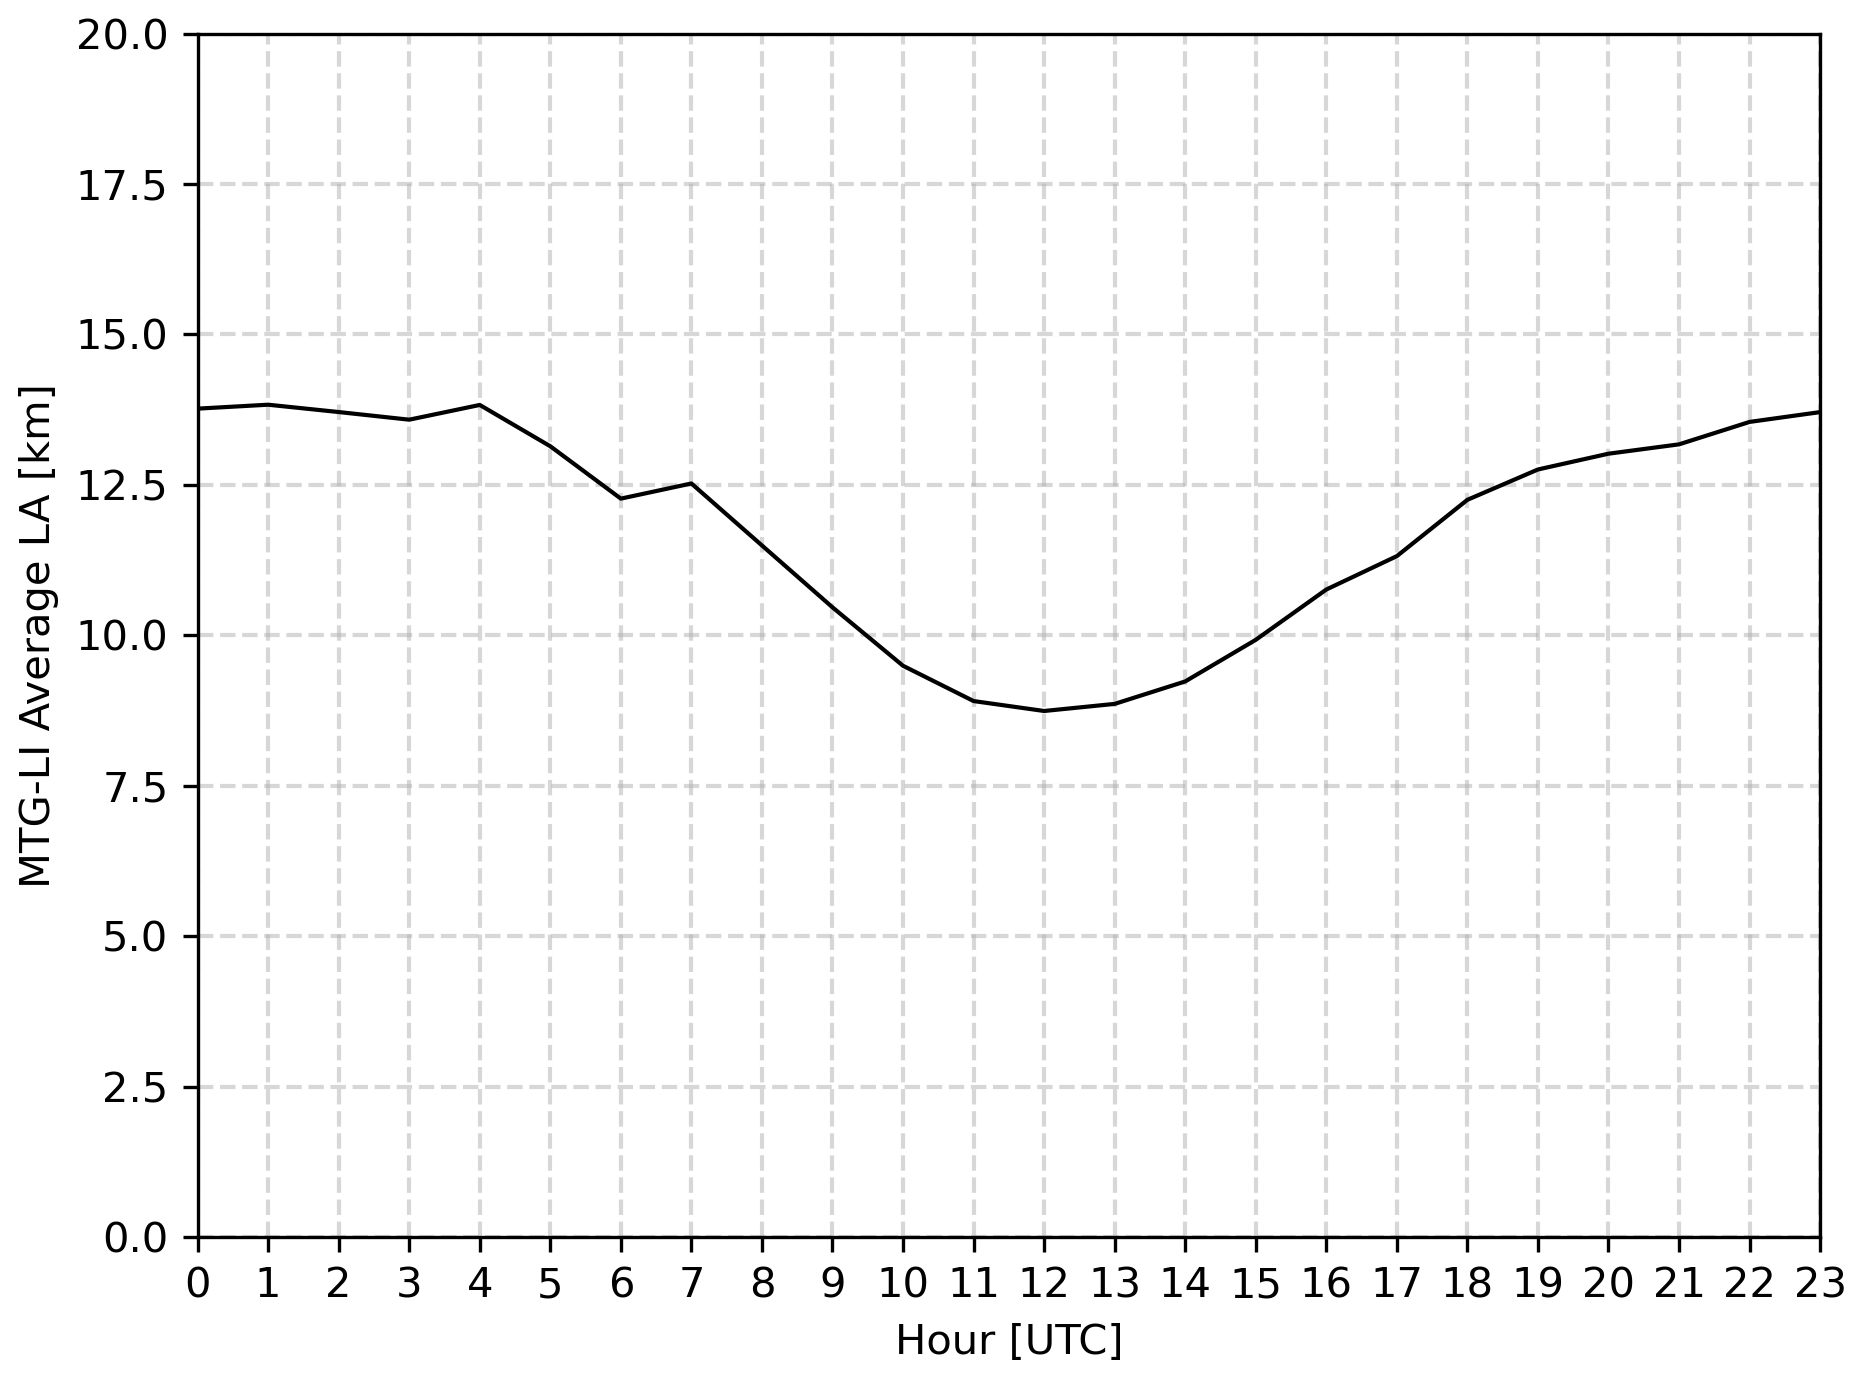
Figure 7MTG-LI average absolute location accuracy (LA in km; see Sect. 3) as a function of the UTC hour derived against GLD360 over the period July 2024–December 2025.
The average FFAR computed over the entire MTG-LI FOV is 0.03 flash s−1 and the value rarely exceeds 0.5 flash s−1. Out of the total of 902 716 484 flashes detected during the reference period, 1 427 759 are classified as false, i.e., 0.16 %. The spatial distribution of all MTG-LI false flashes and their corresponding percentage of the total number of flashes over the reference period is presented in Fig. 8. There is a clear trend towards lower FFAR at higher latitudes. For example, Europe has very low FFAR (i.e., less than 0.001 flash s−1) compared to Africa and the tropical Atlantic Ocean. In addition, it can be seen that East and West Sectors (contoured in green and blue, respectively) have a higher number of false flashes compared to both North and South Sectors (contoured in orange and red, respectively). This is very noticeable over the equatorial Atlantic Ocean. The spatial distribution of the false flashes is also much more diffuse than the patterns of true lightning. The number of false flashes is at least two orders of magnitude lower than the number of true lightning over most of the MTG-LI FOV. The only notable exception is the tropical South Atlantic Ocean where false flashes dominate due to the absence of lightning activity (i.e., ≈100 %; bottom plot of Fig. 8). Three additional features that clearly stand above the diffuse component of false flashes are: (i) a few parallel northwest to southeast oriented straight features in the tropics, (ii) a few elongated features with very different directions and intensities (e.g., the one in the south of South Sector) and (iii) several clusters over South America and Africa (visible in the upper plot of Fig. 8).
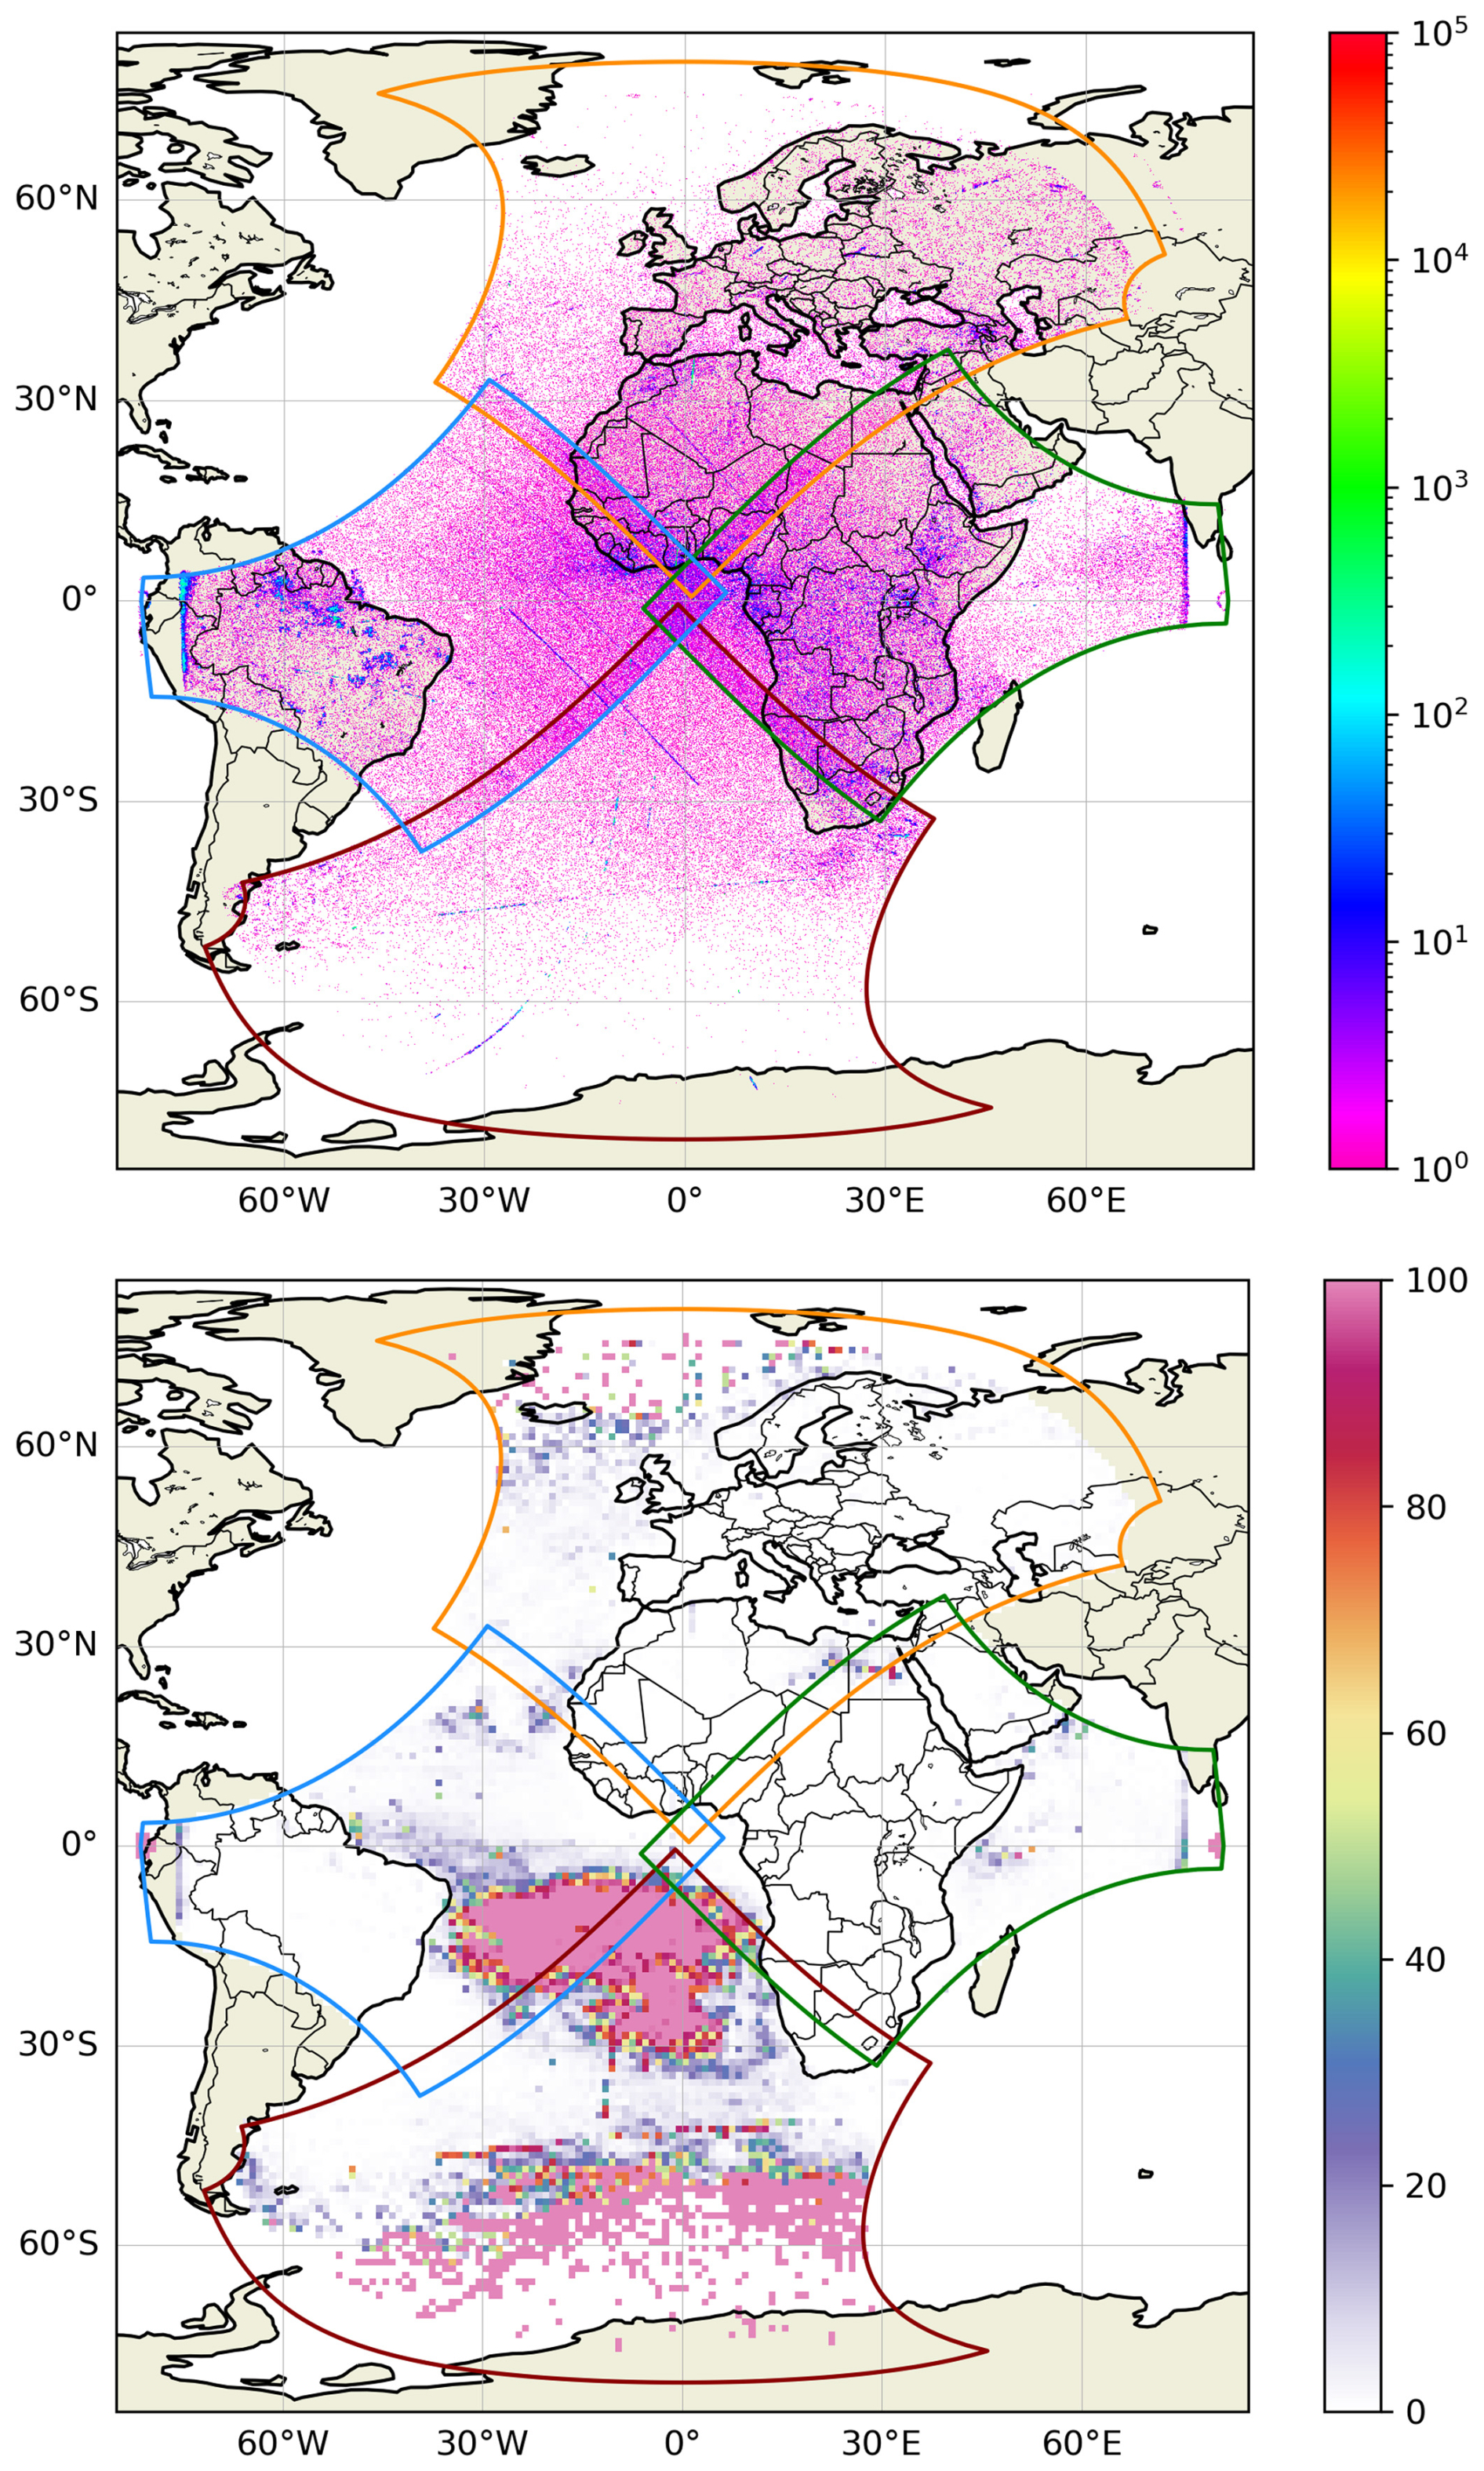
Figure 8MTG-LI false flash accumulation computed on a 0.1° ×0.1° grid (top plot) and percentage of false flashes with respect to the total number of flashes computed on a 1° ×1° grid (bottom plot) in the MTG-LI FOV over the period July 2024–December 2025. In both plots, MTG-LI Sectors are presented in line with Fig. 1. The bottom plot is represented with the same color table of Virts and Koshak (2025).
4.1 Complementary performance assessments against EUCLID and GLMs on GOES-East
The average MTG-LI FDE in Europe derived by using EUCLID as a reference is presented in Fig. 9. The result is generally in good agreement with the FDE map derived by using GLD360 as a reference (Fig. 3). The average MTG-LI FDE measured within the official EUCLID coverage area (the black polygon in Fig. 9) is 84.7 %. Somewhat lower FDE is observed in areas where EUCLID is known to perform the best (i.e., central Europe) and in the northernmost part of Scandinavia where the MTG-LI observation geometry is unfavorable. The diurnal variation of the FDE over the EUCLID coverage area as a function of the local hour is presented in Fig. 10. The main findings, i.e., higher FDE during dark night hours and lowest FDE around local noon, are well in line with the results obtained using GLD360 as a reference (bottom plot in Fig. 4).
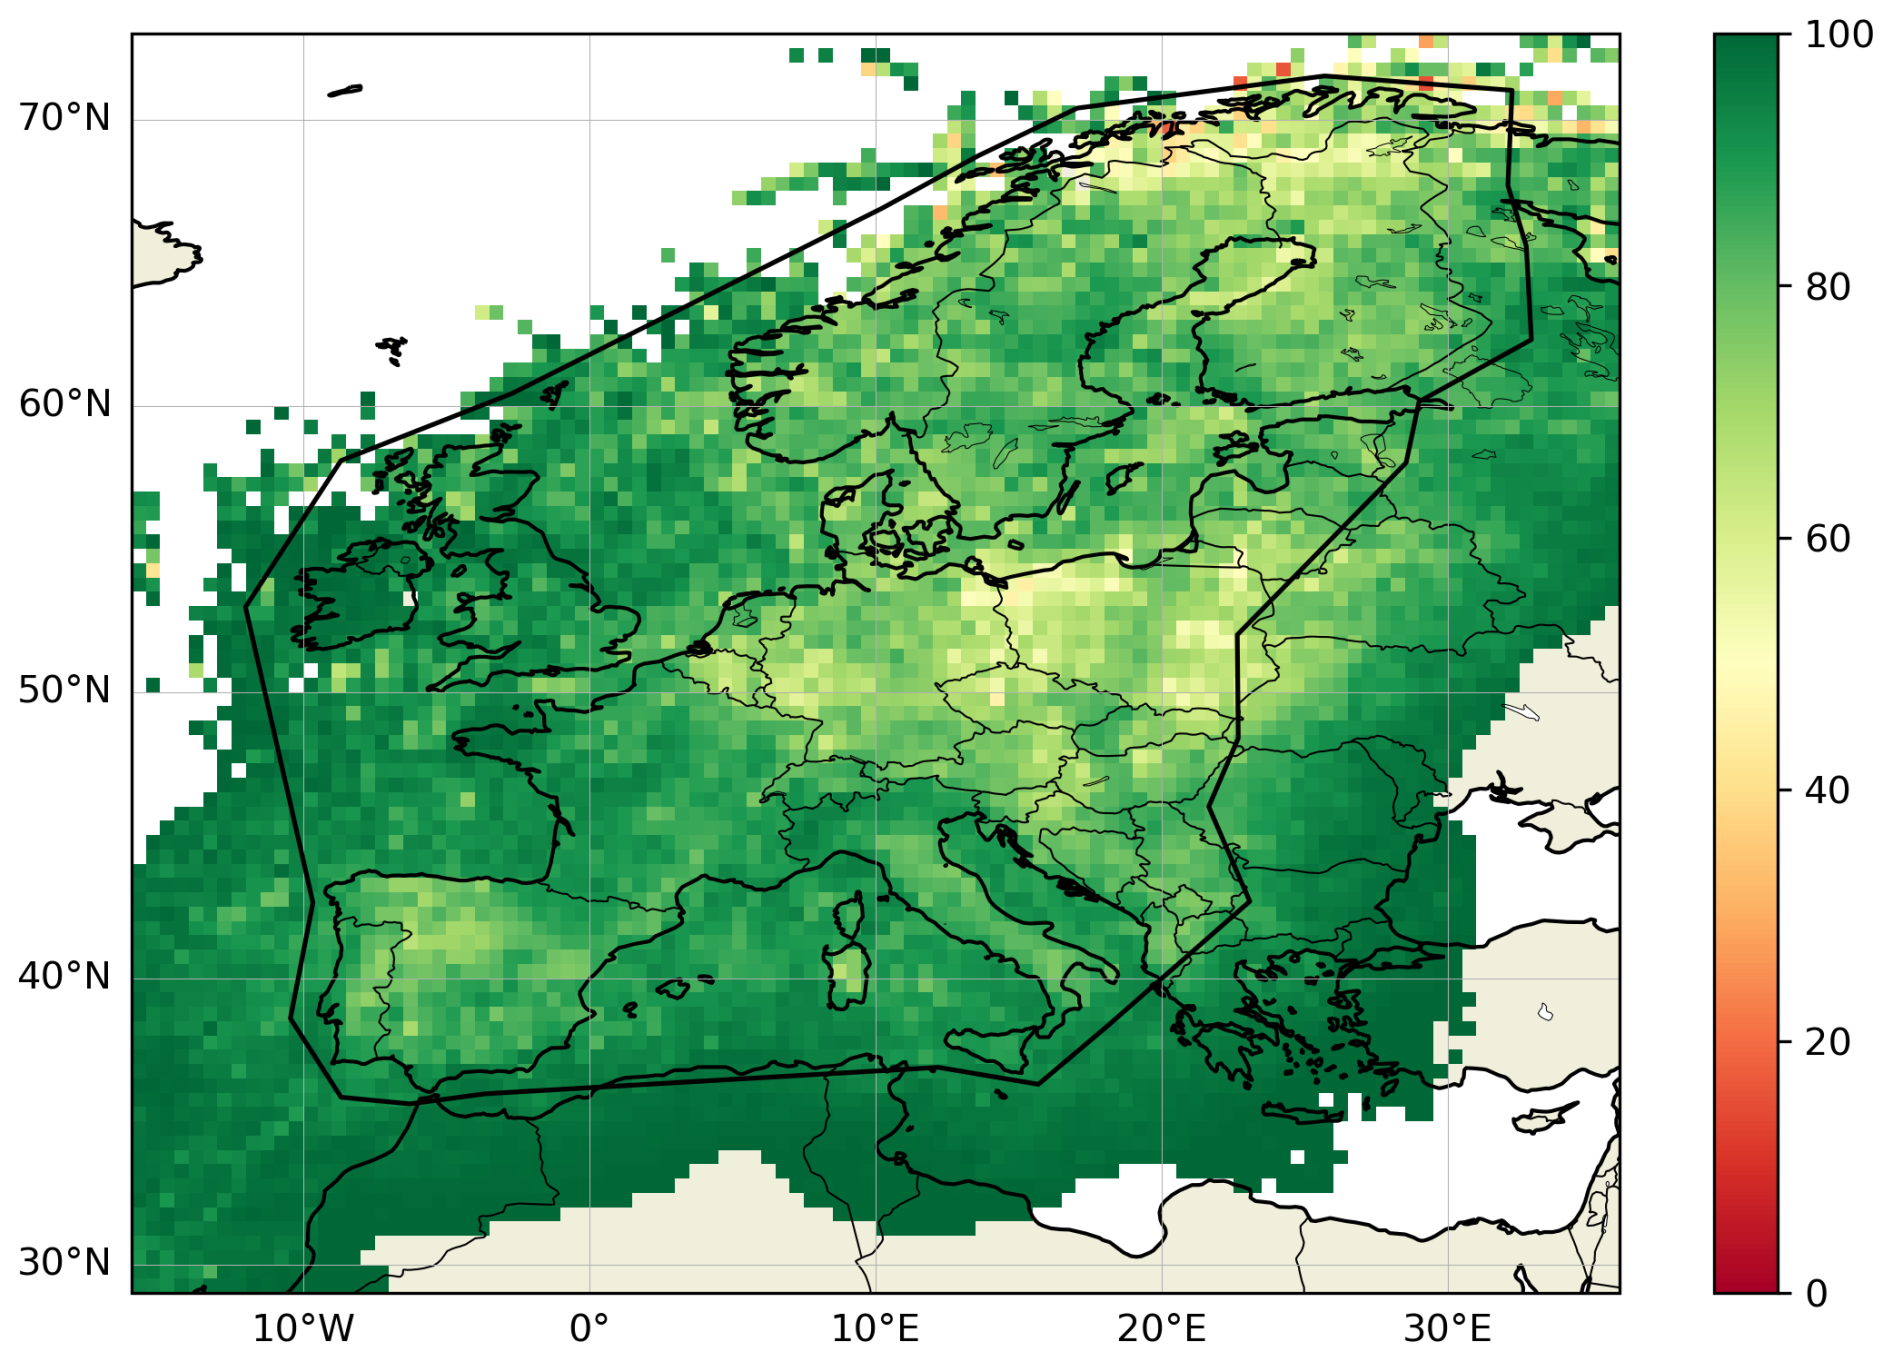
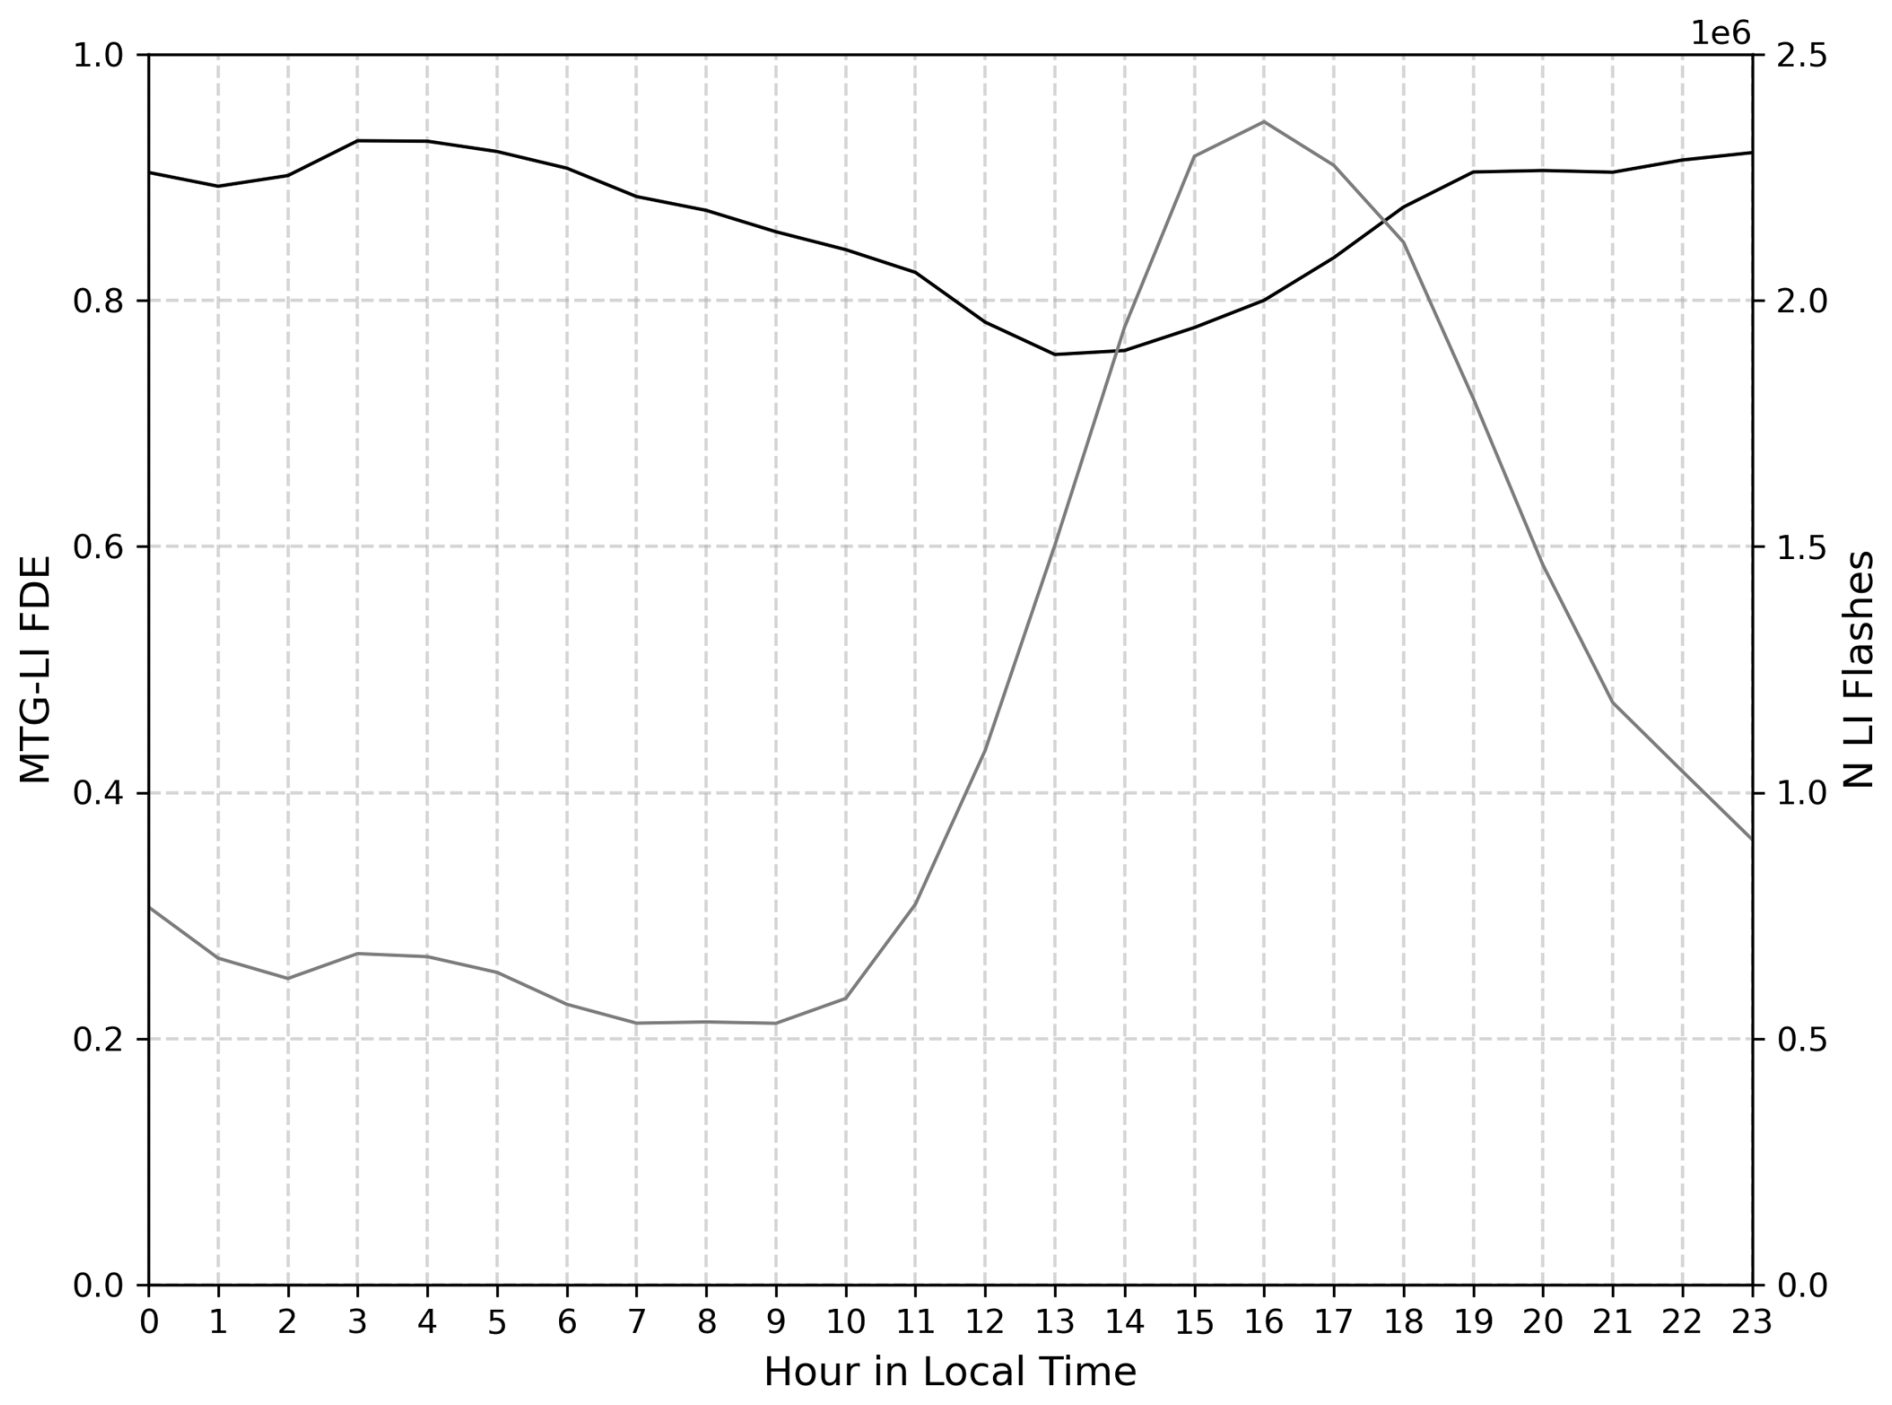
Figure 10MTG-LI absolute flash detection efficiency (FDE; see Eq. 2) as a function of local time derived against EUCLID within the EUCLID coverage (black contour in Fig. 9) over the period July 2024–December 2025 and hourly totals of MTG-LI flashes as a function of local time within the EUCLID FOV (gray line, referred to the right y-axis).
The MTG-LI average absolute LA in Europe derived by using EUCLID as a reference is presented in Fig. 11. LA over Europe derived against EUCLID is somewhat better than the one derived against GLD360 over the full MTG-LI FOV (Fig. 5). This result is further confirmed by comparing the diurnal variation of LA in Figs. 12 and 7: the hourly absolute LA over Europe varies between 7.1 and 11.6 km, while the same quantity measured against GLD360 over the entire MTG-LI FOV varies between 8.7 and 13.8 km. The three complementary curves in Fig. 12 represent the diurnal cycle of the absolute LA as a function of UTC time over Finland, Germany and Spain, respectively. From north to south one finds a considerable improvement of location accuracy: the hourly LA values vary between 11.7 and 20.0 km in Finland, and between 5.7 and 12.1 km in Spain.
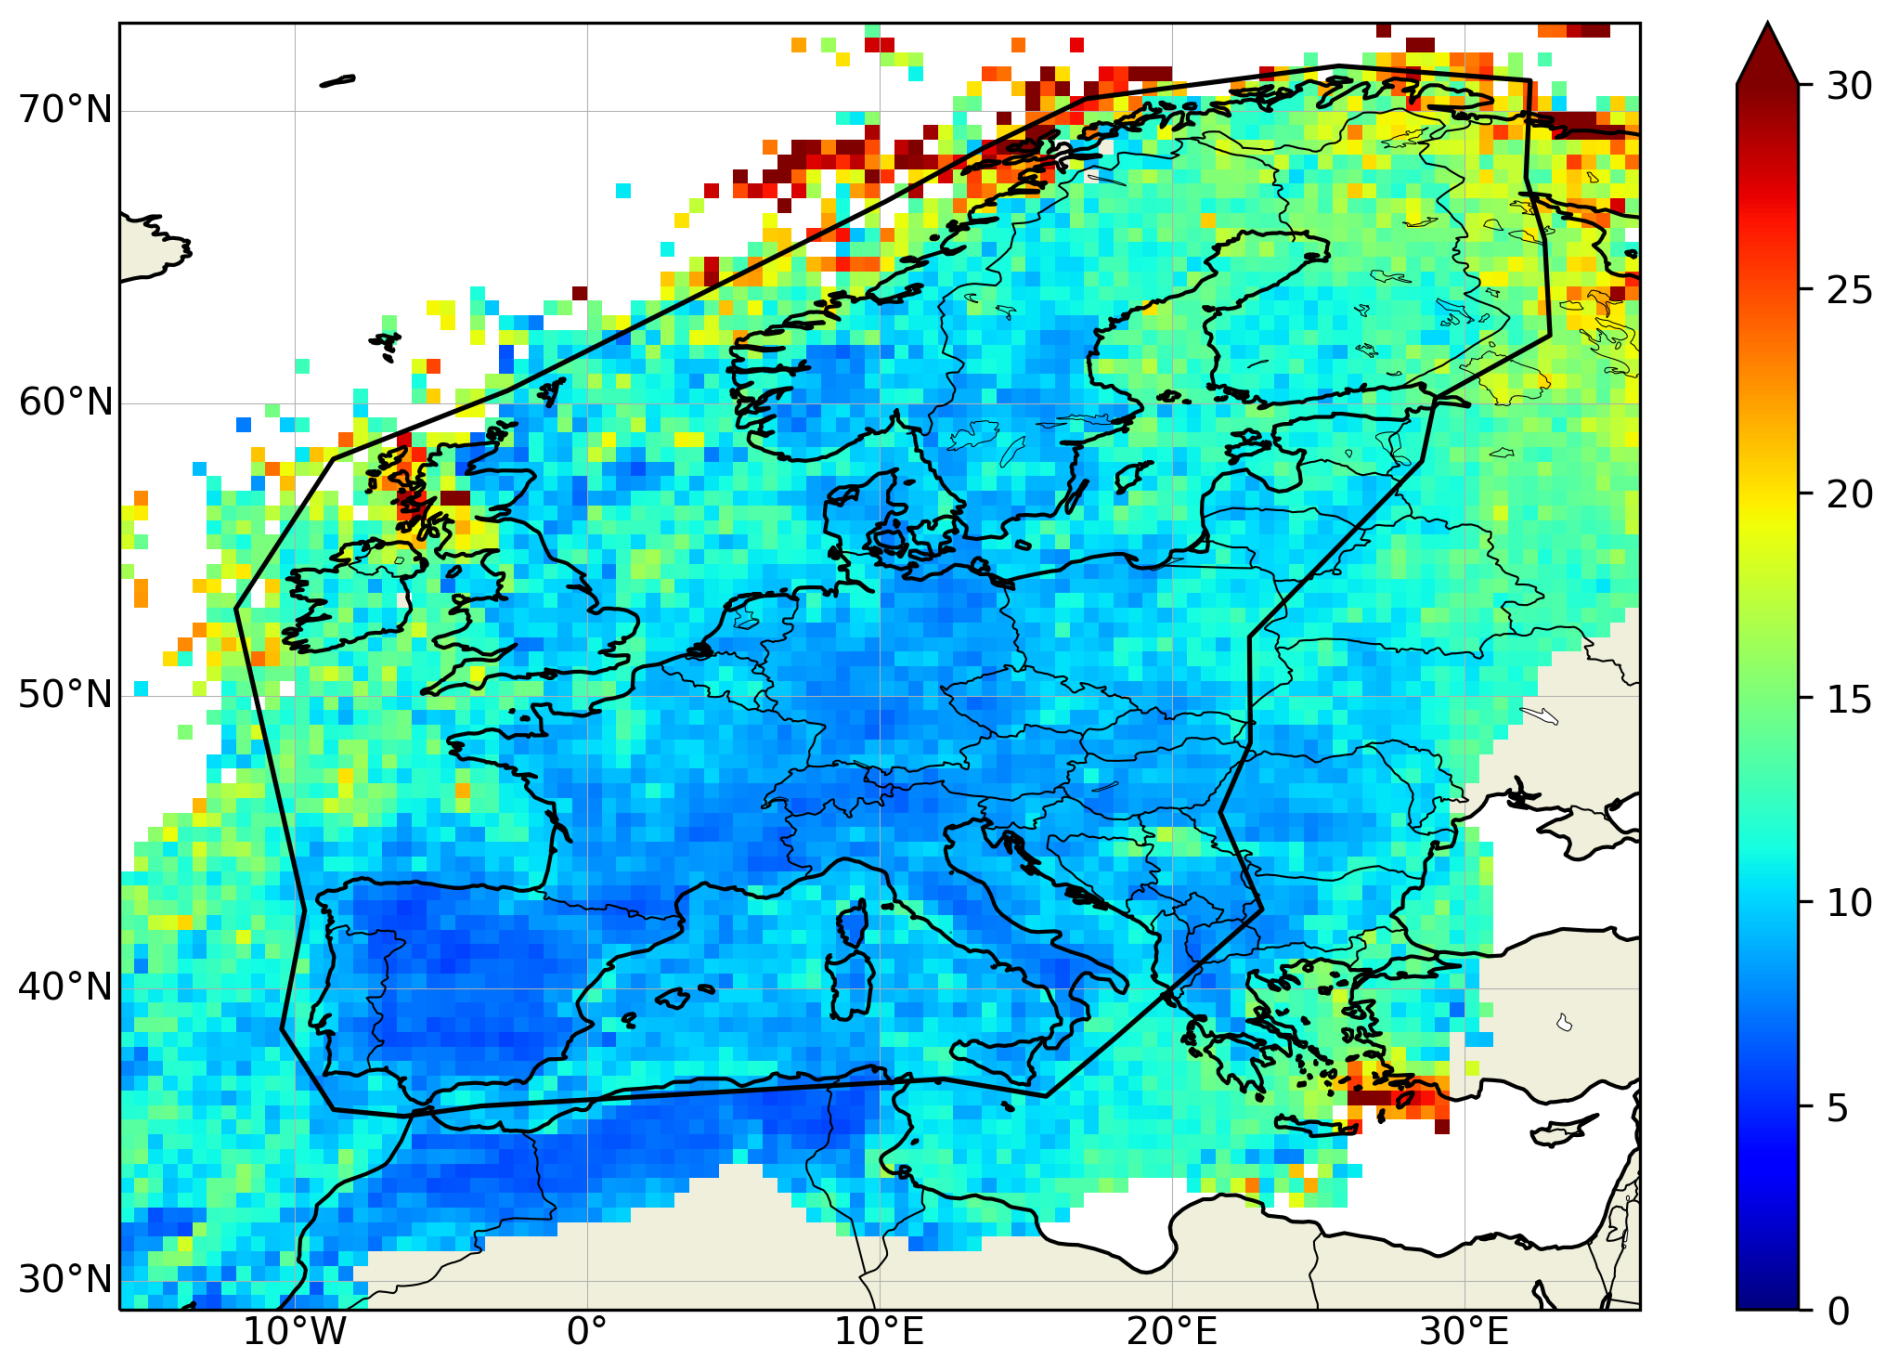
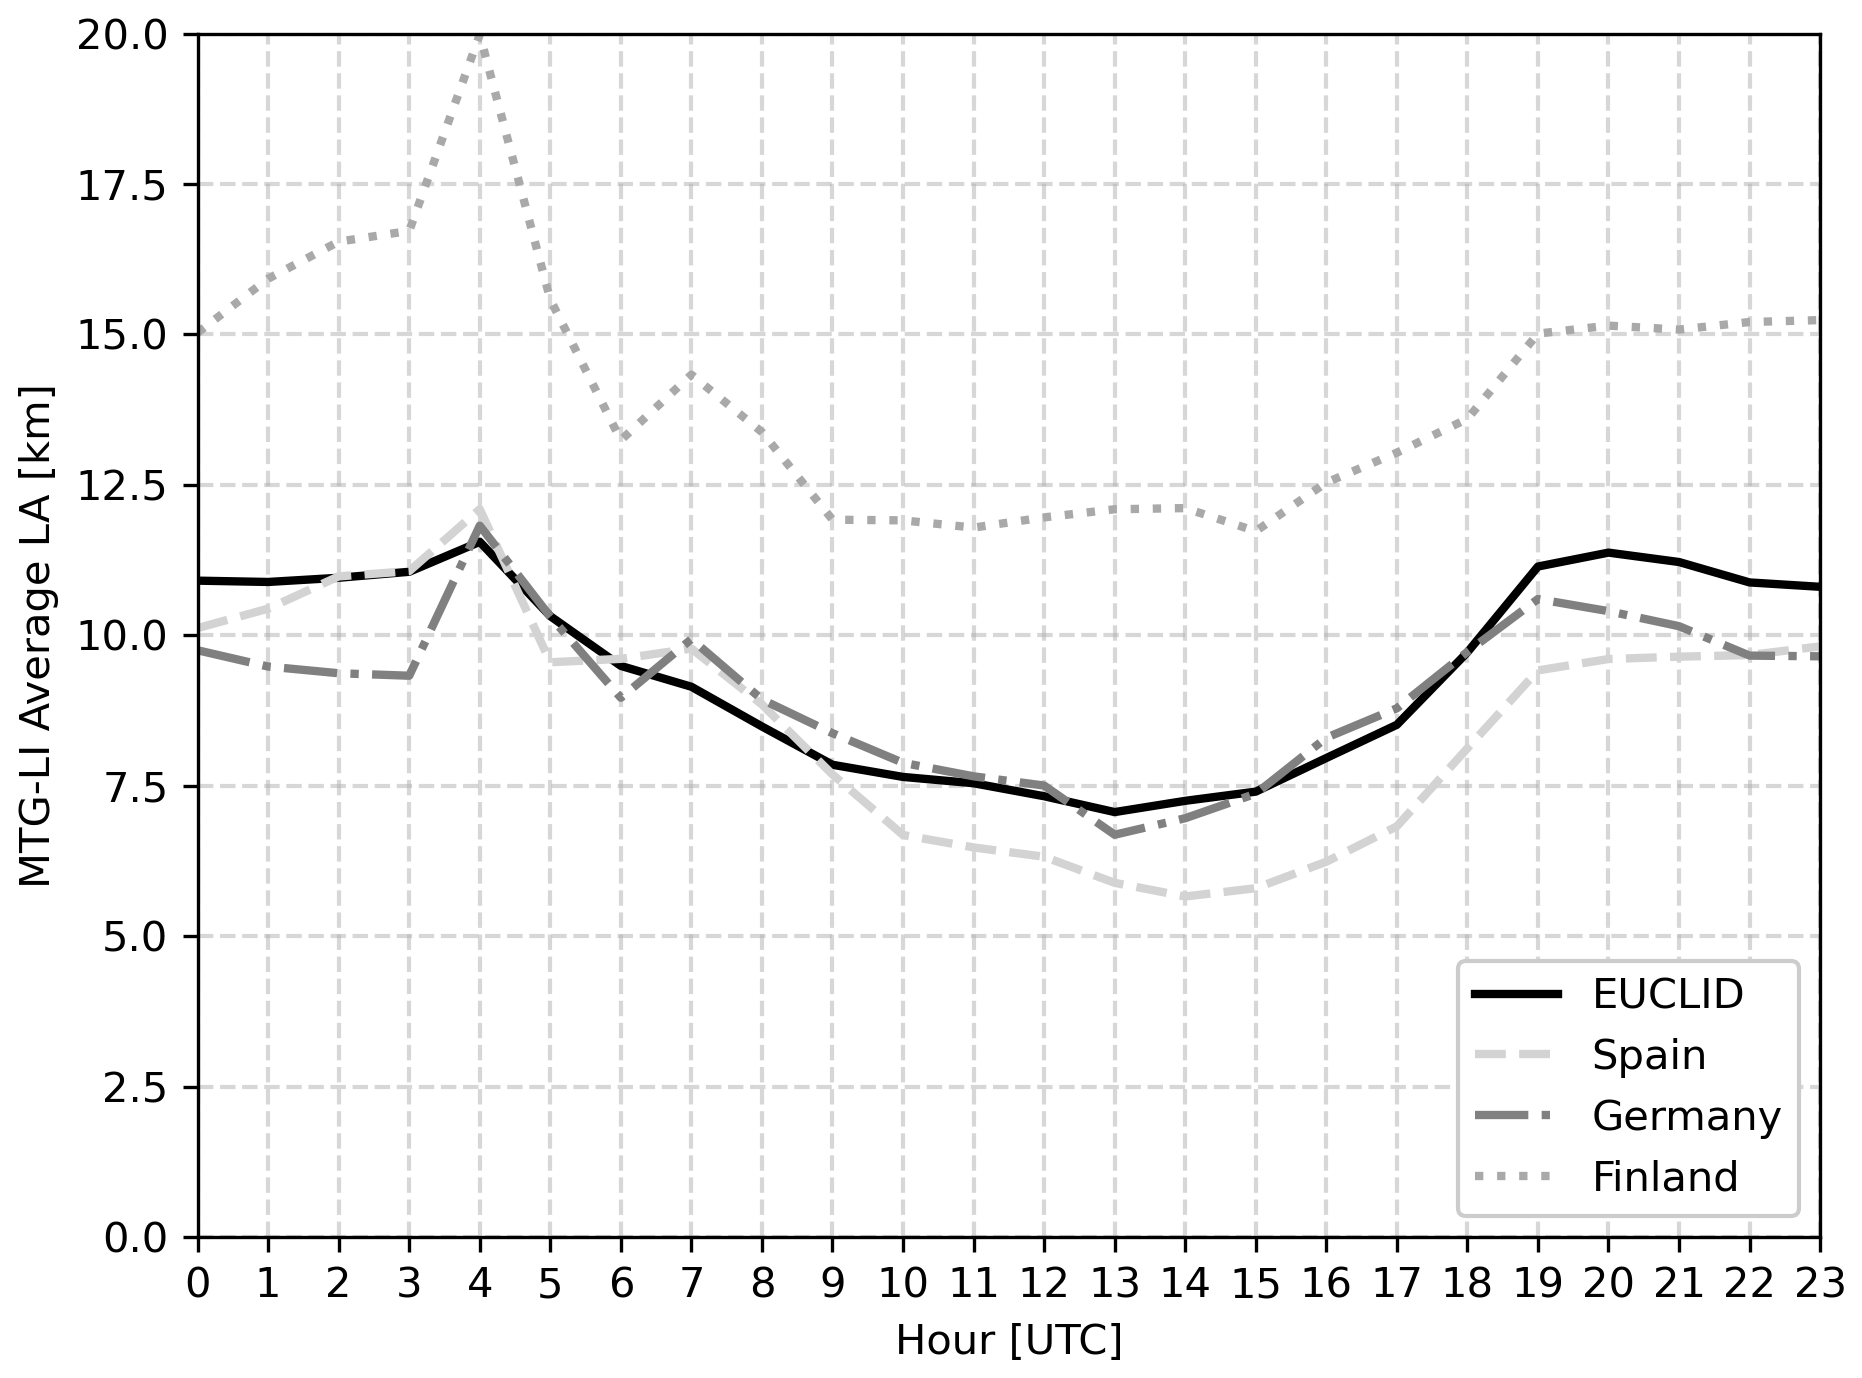
Figure 12MTG-LI average absolute location accuracy (LA in km; see Sect. 3) as a function of the UTC hour derived against EUCLID (within the EUCLID coverage; black contour in Fig. 11) over the period July 2024–December 2025. Within the same plot, three additional assessments are presented: over Finland, Germany and Spain, respectively. The reader can refer to the legend for the interpretation of the plot.
The MTG-LI FDE measured against two GLMs on GOES-East in the overlap region between the MTG-LI and GLM FOV is presented in Fig. 13. MTG-LI FDE is 67.4 % against GLM-16 during July 2024–March 2025 and 56.1 % against GLM-19 during April–December 2025. This results in a combined FDE of 61.8 % over the entire 18-month period. The decrease in FDE from east to west is in line with the result found against GLD360 (Fig. 3): both assessments show a considerable drop in FDE starting from 50° W. Some differences are found over the Atlantic Ocean where MTG-LI FDE against GLM is overall higher than the same quantity derived against GLD360. Finally, in both panels of Fig. 13 one finds specific features with lower-than-average FDE : (i) one extended feature at the east edge of the FOV (i.e., 20–30° S) and (ii) three N–S elongated features (at around 10° N over the Atlantic Ocean).
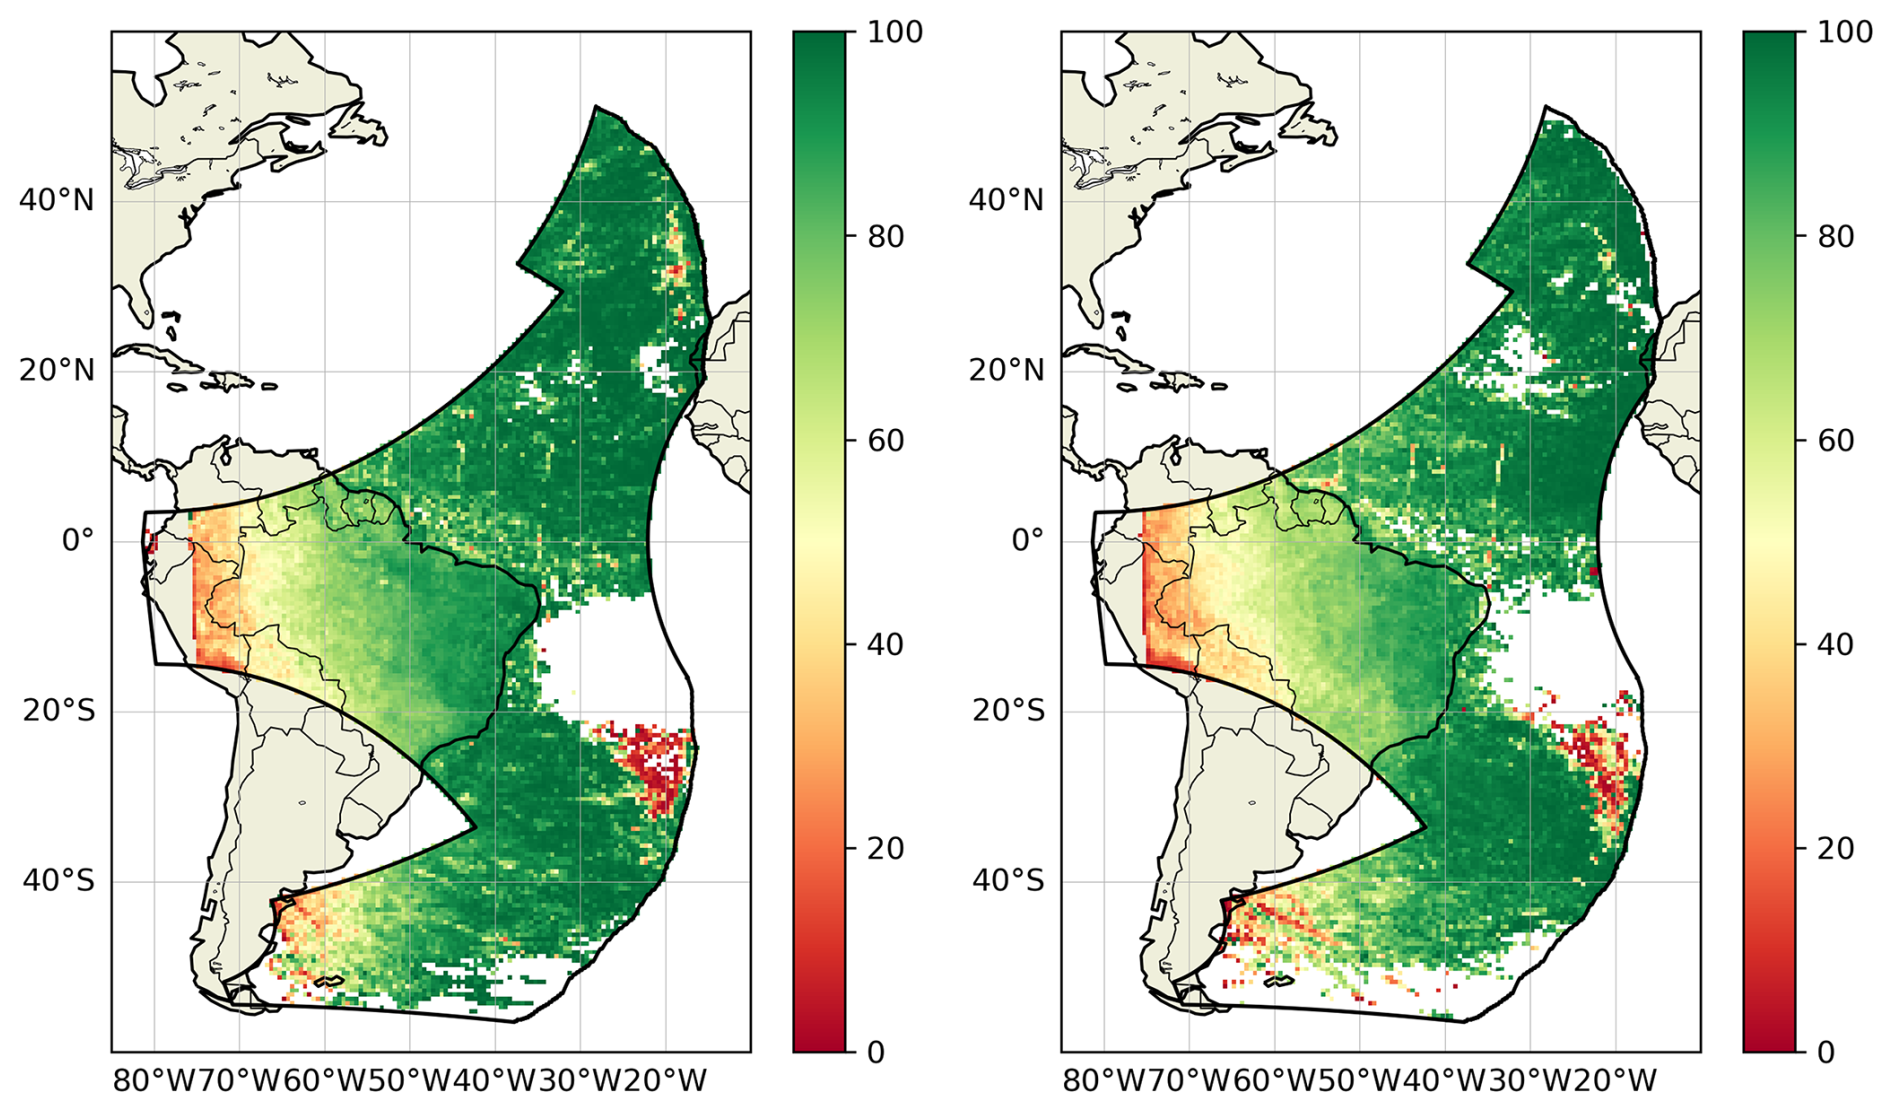
Figure 13MTG-LI absolute flash detection efficiency (FDE; see Eq. 2) derived over the period July 2024–March 2025 against GLM-16 (left panel) and Apri–December 2025 against GLM-19 (right panel), respectively. Results are presented over a 0.5° ×0.5° grid. The black contour marks the overlap of the FOV of GLM on GOES-East and MTG-LI (Fig. 1).
The results presented in Sect. 4 provide the most complete description of MTG-LI key performance indicators so far. In this context, GLD360 is regarded as the prime external reference system due to its geographical coverage and good overall detection performances. However, long-range (or VLF) LLS like GLD360 have certain limitations, e.g., relatively low sensitivity to IC lightning and larger location errors. Using a short-range (or LF) LLS like EUCLID in Europe and a geostationary optical detector like GOES-GLM in the west of the MTG-LI FOV as additional references is therefore meant to complement and refine the results in these areas.
MTG-LI detection performances are very good with an average FDE=87.4 % over the entire MTG-LI FOV during the reference period (Fig. 3). An additional important property of FDE is its spatial uniformity over most of the FOV. This is very relevant in the context of severe weather monitoring as ground-based LLSs and weather radars often suffer from non-uniform performances and/or limited coverage, especially over the spatial scales of the MTG-LI FOV. The achievement of both high and uniform FDE is one of the main drivers for operating the MTG-LI System. This result is confirmed by the complementary analysis against EUCLID. However, comparison against EUCLID also reveals an area of somewhat lower FDE in central Europe where EUCLID is known to perform best. This indicates that there is a population of flashes detected by EUCLID but missed by MTG-LI. These are most likely small flashes deep in optically thick clouds with very weak cloud-top optical emissions.
These findings indicate that MTG-LI data must be regarded as game changing for monitoring severe weather in Africa where the strongest lightning activity in the world is found (Albrecht et al., 2016). MTG-LI delivers outstanding detection performances throughout the entire continent and it is the only LLS delivering such performances in this region of the world. Lightning data could be used as an alternative to radar measurements (Hilburn et al., 2021) as weather radars are scarcely present in Africa (with exception made for Morocco and South Africa). Over continental Europe, where good ground-based LLS like EUCLID and Met Office Leela (Marlton et al., 2024) are already present, MTG-LI can be seen as a valuable complementary data source with high sensitivity to IC lightning (see Combarnous et al., 2025). A merged dataset could be developed with very good CG lightning location accuracy from systems like EUCLID combined with high IC lightning sensitivity from MTG-LI.
The decrease of FDE near the edges of MTG-LI FOV over South America, Russia and Indian Ocean (Fig. 3) is expected as MTG-LI observes the edges of the visible disk in those regions. Its viewing angle is therefore becoming unfavorable (i.e., almost horizontal), strongly reducing the sensitivity of the instrument to photons emerging from cloud tops. The white areas without FDE information along the very edges of the MTG-LI FOV in South America, Russia and near India are the areas where MTG-LI can still observe some cloud-side optical emissions, but the horizontal viewing angle does not allow for any meaningful parallax correction (Sect. 2). The relationship between FDE and distance from the sub-satellite point is further illustrated in Fig. 4 (both top and middle plots). It is especially important to note that MTG-LI, being the very first geostationary lightning imager performing lightning detection at latitudes above 50° N, delivers excellent performances with FDE≈73 %, even at 70° N in Scandinavia (top plot in Fig. 4). It is currently unclear why FDE decreases notably faster in the E–W direction (middle plot in Fig. 4) than in N–S. One explanation could be the different illumination conditions found over the equator with respect to Scandinavia. Clouds along the equator are expected to be, on average, brighter than those over Scandinavia, significantly reducing MTG-LI capability to detect weaker optical emissions (see the following paragraph). Tropical thunderstorms also grow larger and taller than high latitude storms and therefore less light can escape the clouds. It is also worth noting that our findings on MTG-LI FDE in South America are in line with Bližňák and Sokol (2026) who validated MTG-LI against ENTLN during October 2024.
The relationship between MTG-LI FDE and illumination conditions is illustrated by the very clear diurnal cycle of FDE, when plotted as a function of local time (bottom plot of Figs. 4 and 10). This stems from the increase of the minimum radiance threshold for lightning detection with increasing illumination as the local Sun Zenith Angle decreases. The variation of illumination conditions in the MTG-LI spectral band is particularly strong over clouds: from complete darkness at night to the brightest objects in the whole field of view around noon. The diurnal cycle of MTG-LI FDE is very similar to GLM-16 and GLM-18 (Virts and Koshak, 2025). It should be also noted that the impact of the noon minimum on the overall MTG-LI FDE is significantly reduced by the fact that most lightning happens during the late afternoon when the Sun Zenith Angle is already larger and the FDE is notably higher. In full agreement with our finding, Combarnous et al. (2025) reports about the diurnal cycle of the conditional detection probability of MTG-LI against Météorage.
The MTG-LI FDE measured against GOES-GLM (Fig. 13) is higher than the FDE measured against GLD360 (Fig. 3) over most of the Atlantic Ocean and in the east-most part of South America. This is expected and stems from the nature of the measurements: among the reference systems employed in this study, GOES-GLM has the closest design to MTG-LI. However, if the whole MTG-LI and GOES-GLM East overlap area is considered over the whole study period, one gets much lower mean MTG-LI FDE value, i.e., 61.8 %. This is the combined effect of the significant decrease in FDE to the west of 50° W (Fig. 3) and the fact that the overall lightning activity in South America is much stronger than over the Atlantic Ocean (middle plot in Fig. 4). The mean value is therefore strongly biased towards low MTG-LI FDE values in South America. The two red spots of very low MTG-LI FDE close to the east edge of the GLM field of view (Fig. 13) are known to be due to false GLM flashes resulting from blooming when the Sun is close to the edge of the GLM FOV (see description in Rudlosky and Virts, 2021). Such artifacts are also reported by Virts and Koshak (2025). The three N–S oriented elongated features over the equatorial Atlantic Ocean near South America are also found in Rudlosky et al. (2019) and Bateman et al. (2021). However, their origin is currently unclear. An interesting complementary observation of the LI-GLM comparison is that GLM-19 delivers considerably better performances than GLM-16. Firstly, MTG-LI FDE measured against GLM-16 is overall higher than against GLM-19. Secondly, one can easily reverse the FDE computation and conclude that GLM-19 FDE against MTG-LI is 93.8 % while GLM-16 FDE against MTG-LI is 85.8 %. This seems to stem from differences in the way these two systems are being operated/configured. The analysis also indicated that the higher FDE of GLM-19 might come at the cost of slightly higher FFAR, compared to GLM-16.
Finally, it is worth emphasizing that all the presented FDE values, as described in Eq. (2), shall be interpreted as the upper limit of the MTG-LI flash detection efficiency. This is because there is always a fraction of weak lightning flashes that neither LI, nor the reference LLSs (i.e., GLD360, EUCLID, GOES-GLM) can detect. The most accurate FDE values could be derived against a Lightning Mapping Array (LMA) that rarely misses a flash. Such a system is being operated around Barcelona (Spain) by the Polytechnic University of Catalonia (Van der Velde et al., 2011). The first MTG-LI performance assessments against this LMA can be found in Montanyà et al. (2026).
MTG-LI LA is assessed against GLD360 and EUCLID. The best LA is in the middle of the MTG-LI FOV as shown by the maximum of the distribution in Fig. 6. The sharp increase (i.e., worsening) towards the edges (Fig. 5) is very much in line with the GOES-GLM results by Virts and Koshak (2020). This large-scale distribution reflects the increasing viewing angle, and in case of MTG-LI, increasing pixel spatial sampling towards the edges of the FOV (see Fig. 2). The impact of increasing viewing angles is mitigated by parallax correction. Accurate parallax correction, however, requires precise optical emitter height. As pointed out by Virts and Koshak (2020), factors like geographic location, season and meteorological regime all have impact on the optimal emitter height. The EUMETSAT tool for parallax correction introduced in Sect. 3 was defined in line with this criterion. However, it does not account for factors like detection of cloud-side (rather than cloud-top) lightning and impact of more specific meteorological situations like unusually high or low storm tops. These factors can lead to large parallax correction errors near the edges of the MTG-LI FOV and therefore explain the overall worsening of the LA observed in these regions.
Some interesting local variations in MTG-LI LA appear along the edges of its FOV. Mäkelä et al. (2025) communicate that MTG-LI data are very much usable at very high latitudes (i.e., 60–70° N) in Finland. They reached this conclusion by comparing MTG-LI and NORDLIS. This seems to indicate that the EUMETSAT parallax correction is working at very high latitudes. In contrast, in a private communication with lightning experts studying storms over Iceland, it was reported that the parallax correction of MTG-LI data works poorly. This is in line with the result in Fig. 5 where the MTG-LI LA over Iceland is worse than 30 km. The difference might arise from the fact that thunderstorms are very rare over Iceland and therefore most of the ice clouds in the region are not thunderstorms. This can, in principle, lead to considerable differences in the mean ice cloud top height (used as the emitter height by the EUMETSAT parallax correction tool; EUMETSAT, 2026) and actual thunderstorm top heights. Over Finland, in contrast, thunderstorms are common during summer months and therefore the weight of real storm tops in the mean ice cloud height climatology is higher. As a result, better overall emitter height estimations and more accurate parallax correction can be expected. There is definitely room for improving parallax correction in the future by using in-situ cloud top heights in active storm areas (as provided by the MTG Flexible Combined Imager; Holmlund et al., 2021) instead of mean ice-cloud top heights. An additional step would be distinguishing cloud-side emissions from cloud-top emissions and applying a more appropriate correction in those cases.
The observed diurnal cycle of MTG-LI LA (Figs. 7 and 12) stems directly from the navigation of MTG-LI data. The image navigation of MTG-I measurements utilizes Kalman filter based on observables from MTG-LI background images (i.e., landmarks) and auxiliary information like orbit and attitude measurements. Landmarks are predefined locations of a background image with distinct coastal features. Due to the spectral band of MTG-LI, landmarks can only be detected in good illumination conditions, i.e., day-time and clear-sky conditions. As a result, the daily cycle of MTG-LI LA can be divided in two phases: (i) best location accuracy performances (minimum LA value) around those hours of the day in which landmarks employed by the image navigation are illuminated and (ii) progressive degradation (increase to a high value plateau of LA ) during those hours in which landmarks are either partially illuminated or completely in the dark. The latter phase terminates abruptly every day with a sudden recovery when landmarks get illuminated again in the morning (around 05:00 UTC with seasonal variations), and information is again available for navigating the data. To be noted, differently from the FDE that was presented as a function of the Local Time (Fig. 4), LA is presented as a function of the UTC time (Figs. 7 and 12) as the image navigation of MTG-LI employs landmarks that are distributed at very different locations within the MTG-LI FOV. This implies that local navigation performances are impacted by overall illumination conditions better described through the UTC time. The diurnal cycle in the MTG-LI LA helps to explain the overall worsening of the LA over the seas and oceans, including parts of the Atlantic and Indian Oceans and the Mediterranean, Black, and Red Seas (Fig. 5). The lightning activity over the seas and oceans tends to peak during night hours as opposed to the strong afternoon peak over land (Enno et al., 2026). Therefore, the LA statistics over the seas and oceans are biased towards night-time MTG-LI LA values (Fig. 7).
The regional variations in MTG-LI LA observed over land areas in the central part of the FOV are more difficult to explain. MTG-LI LA relative to GLD360 varies considerably over continental Africa and the Arabian Peninsula (Fig. 5). For example, over both Morocco and Algeria, LA<5 km, while over Sudan and Saudi Arabia one finds 10 km km. This result is partially in contrast with results in Europe where MTG-LI LA relative to EUCLID clearly improves from north to south, getting close to 5 km around the Mediterranean (both Figs. 11 and 12). The latter is in line with the spatial sampling over Europe (see Fig. 2) and the fact that the uncertainty of the method for deriving LA increases towards the edges of the MTG-LI FOV (see also Combarnous et al., 2025). The location accuracy over Africa should be even better than in southern Europe due to the reduced impact of parallax correction and the finer spatial sampling (see Fig. 2). Furthermore, the global nature of MTG-LI navigation procedure discussed above should prevent regional variations in LA as observed over Africa (Fig. 5). Therefore, it can be suspected that these variations are caused by the limitations of the reference lightning location system (GLD360; see also the discussion on the flash false alarm rate) and/or LA computation method. The LA assessment relies on two main assumptions: (i) the stroke locations of the reference network are the “truth” and (ii) the matched MTG-LI groups and GLD360 strokes relate to the same lightning event. On the first assumption, it is widely known that all lightning location systems have their location errors. Short-range (or LF) LLSs like EUCLID deliver good location accuracy below 500 m over continental Europe (Pohjola and Mäkelä, 2013; Schulz et al., 2016). Long-range (or VLF) LLSs like GLD360 tend to have poorer location accuracy than LF LLSs. The location accuracy of GLD360 has been assessed against the NLDN over continental United States (Said et al., 2013). NLDN delivers a location accuracy of hundreds of meters (Zhu et al., 2020), while for GLD360 the median (90th percentile) location accuracy is 2.5 km (17.5 km). It has been reported that GLD360 location accuracy was improved down to 1 km after the latest major central processor upgrade in 2020 over well-covered areas such as the United States (Said and Murphy, 2016). However, its location accuracy over the entire MTG-LI FOV is not known to EUMETSAT. It is therefore possible that the worsening of MTG-LI LA over remote parts of Africa stems from the larger location errors of GLD360 strokes in those regions. Interestingly, there are some areas of notable spatial gradients in MTG-LI LA in Africa (Fig. 5). Furthermore, such areas often overlap with significant gradients in lightning frequency, e.g., around 15° N in western Africa, along the east of the Congo Basin (Enno et al., 2026). In other words, increasing lightning activity seems to lead to worse MTG-LI location accuracy. One possible explanation is that the correct group-to-stroke matching assumption (ii) may not always apply in very intense African storms and this can introduce a bias towards higher MTG-LI LA. MTG-LI is expected to detect much more IC lightning than GLD360, especially in remote areas. In regions in which lightning activity is ubiquitous and virtually continuous, this imbalance could lead to “odd matches” within the 50 km matching radius used for LA computation (Table 2), i.e., between measurements that happen to be very close in time but quite far away in space, or at least further away than in regular matches. The population of such “odd matches” with artificially large MTG-LI location offsets can contribute to the worsening of MTG-LI LA in the most active lightning regions in Africa. Possible future steps include refining the matching method and limiting the spatial matching radius to reduce the probability of such “odd matches”. Ideally, a EUCLID-like short-range reference system or even a temporary deployment of a LMA would be needed to refine MTG-LI LA values in central Africa.
Finally, it is worth stressing that throughout the period considered for this analysis, there has been a progressive improvement in MTG-LI geometric performances. This has been achieved through the refinement of the configuration of the image navigation processing (part of IDPF-I; see Sect. 2). Based on this and the discussion above, one can expect MTG-LI location accuracy to be overall slightly better than what is found in Figs. 5 and 7. Nevertheless, both results provide one with a good first picture of MTG-LI LA performances over its entire FOV and over 24 h.
MTG-LI TA<1 ms throughout the reference period. This result is in line with expectations if one consider the design of the instrument (see Table 1). This condition fails only during brief intervals, typically caused by errors in converting On-Board Time (OBT) to UTC by IDPF-I (see Sect. 2).
The percentage of false flashes in MTG-LI data (bottom plot in Fig. 8) appears to be much lower than in GOES-GLM, i.e., 0.16 % compared to few percent found by Virts and Koshak (2025) and up to tens of percent found by Bateman et al. (2021). In the latter, the authors adopt a different definition from the one adopted in Virts and Koshak (2025) which aligns with our definition. However, an important difference must be highlighted with respect to the configuration of Virts and Koshak (2025): the spatial window to classify flashes used in our study is more than twice as broad as the one they employ. The final configuration for the FFAR classification (Table 2) was reached after several tuning attempts. The use of a much smaller spatial buffer (Δpix in Table 2; initially set at two pixels) would result in a large number of true flashes being misclassified as false at several locations in the MTG-LI FOV. In central Africa, MTG-LI false flashes would clearly resemble true ones when considering their spatial distribution, for example, with sharp count drop between land and ocean or with extended clusters of false flashes following seasonal patterns. The buffer had to be increased to ten pixels to counterbalance the limitations of GLD360 over Africa. The few storm clusters still visible over South America are misclassifications due to a few short episodes of particularly poor navigation performances of MTG-LI at the end of 2024. The overall very low number of MTG-LI false flashes makes these mislocated storms outstanding on the FFAR accumulation map even if they are negligible when considering the percentage of false flashes (top and bottom plot in Fig. 8, respectively).
The map of MTG-LI false flash accumulation (top plot in Fig. 8) reveals the spatial variations in the frequency of false flashes. Given the general stability of FFAR over time, the result in the bottom plot can be interpreted as a good approximation of the MTG-LI FFAR contribution in any place within the field of view at any time. Significant local deviations from this mean pattern occur only in a limited number of episodes with unusually high FFAR>0.5 flash s−1. These are often related to specific observational conditions, e.g., stray-light due to the Sun being either directly imaged or being very close to the edge of the MTG-LI FOV, occurrences of spurious flashes due to Sun glint, etc. The parallel northwest to southeast oriented straight features are due to heightened Read-Out Noise (RON) over columns of pixels in two of the MTG-LI detectors, namely, MTG-LI Optical Cameras 3 and 4 (hereafter OC3 and OC4). Such features are seen in all the four sectors (Fig. 8) because the MTG satellite undertakes a yaw-flip every six months (around equinoxes) and with each yaw-flip MTG-LI cameras alternate between opposite sectors. Hereafter, we discuss OC3 as the reference case as this camera is known to have the highest RON among the four cameras. OC3 alternates between the West Sector and the East Sector (blue and green polygons in Fig. 8). OC3’s enhanced noise level is particularly visible over the Atlantic Ocean around the equator. Unlike land, cloud-free water surfaces look very dark throughout the day in the MTG-LI spectral band, and OC3 is impacted by a higher RON compared to the other OCs. RON is the dominating noise component over dark scenes and for this reason one finds higher number of false flashes over the equatorial Atlantic Ocean compared to Europe. For direct comparison between the OCs, one can refer to the South Sector (imaged by OC1 and OC4, respectively). The number of false flashes over the southern Atlantic Ocean is lower than over the equatorial Atlantic Ocean. This stems from the fact that both OC1 and OC4 have lower RON than OC3. To be noted, the Atlantic Ocean is also the region where RON-related features mentioned above are very evident. These are also partially visible in the North Sector (e.g., over Algeria) but are much clearer over dark scenes, i.e., cloud-free oceans. For a complementary visualization of the spatial-temporal variability of the MTG-LI FFAR one can refer to Combarnous et al. (2025).
A few longer more randomly positioned elongated features are due to large collections of false flashes triggered by space debris transiting in the MTG-LI FOV. When transiting during day time, such objects create a temporary obscuration of the scene (artificial darkening), due to their position between the Earth and MTG-LI, followed by a sudden transition to the nominal scene (artificial brightening): this dark to bright transition, repeated over long trajectories, can generate large amounts of false detections (FTs) that can pass the end-to-end filtering and be eventually disseminated to users as MTG-LI flashes. For a high-level presentation of these events one can refer to https://www.eumetsat.int/lightning-data-detectives (last access: 12 October 2026). Two additional potential sources of false/spurious flashes have been identified so far: (i) Sun-glint-triggered flashes and (ii) memory-corruption-triggered flashes. These are not discussed further as their effect is not yet seen in Fig. 6 and therefore they should not be regarded as very important sources of MTG-LI false flashes. Finally, increased number of false flashes is observed in the four overlap regions between multiple OCs. The processing at Level 2 done by the L2PF (Sect. 2) removes duplicate flashes observed simultaneously by multiple OCs. The removal step assumes good space-time correlation between the flashes observed by different OCs. This is commonly found in case of real lightning. False flashes, in contrast, are OC-specific, i.e., they are found only in one OC and therefore not removed as duplicates. As a result, each OC brings its own noise component, and this adds up to the increased false flash number/frequency in overlap regions between OCs.
The MTG-LI System is the first European geostationary mission devoted to the diagnosis and characterization of lightning activity over hemispheric scales. Its FOV encompasses Europe, Africa, and part of the Atlantic Ocean, South America, middle East and Indian Ocean. EUMETSAT is the sole operator and responsible authority for the MTG-LI System. In this paper, EUMETSAT experts present MTG-LI detection performances over a reference period of eighteen months (i.e., from July 2024 to December 2025) and measured against four different reference systems: Vaisala GLD360, EUCLID and two GLMs on GOES-East. Of the four systems, GLD360 is considered the main reference, being the only one covering the entire MTG-LI FOV. Both EUCLID and GOES-GLMs are employed as complementary references.
MTG-LI delivers an average absolute flash detection efficiency of 87.4 % with a daily variation between 70 % during day and 95 % during night. Over Africa, this performance indicator is larger than 90 %, making MTG-LI the best system for monitoring total lightning activity over this continent, i.e., the region of the world with the most intense lightning activity. Over southern and central Europe, the absolute detection efficiency is above 70 % up to about 70° N. MTG-LI is the first geostationary lightning imager observing at angles larger than 56° from nadir. The flash false alarm rate of MTG-LI is normally below 0.5 flash s−1, and the fraction of false flashes measured over the reference period is 0.16 %. Lightning timing and location accuracy derived from group-to-stroke matching are below 1 ms and between 7.5 and 14 km, respectively. The independent monitoring of MTG-LI geometric performances undertaken at EUMETSAT and based exclusively on MTG-LI background images (see Sect. 2) shows very good overall MTG-LI image navigation. The method relies on landmarks in MTG-LI background images as ground truth. The location of such landmarks are known much more accurately than locations of most lightning strokes from ground-based LLSs. Results typically show a geometric error below half a pixel (i.e., ≈2.25 km around the MTG-LI sub-satellite point) in both E–W and N–S directions during day time. The notable difference between this value and the MTG-LI LA measured against external LLSs can be attributed to several combined factors: the spatial disparity between diffuse cloud-top signatures detected by MTG-LI and localized (point-like) ground-based measurements, parallax correction errors, specific matching techniques and configurations, and the inherent limitations of the reference LLSs.
Finally, in alternative to the performance assessment documented in this paper (presented over the reference period July 2024–December 2025), EUMETSAT grant visibility to MTG-LI detection performances updated every 24 h at the link https://matrics.eumetsat.int/li_status (last access: 12 October 2026). Note that the performance metrics available at this link are derived using the same methodologies presented in this paper, but are displayed as time sequences with a one-hour granularity.
MTG-LI data are openly available at https://data.eumetsat.int/search?query= (last access: 12 October 2026). GOES-GLM data are available at https://www.ncei.noaa.gov/access/metadata/landing-page/bin/iso?id=gov.noaa.ncdc:C01527 (last access: 12 October 2026). The GLD360 and EUCLID datasets analyzed in this study are proprietary and are not freely available. Data may be obtained directly from the respective providers, subject to their licensing terms and applicable fees: GLD360: https://www.vaisala.com/en/products/systems/lightning/gld360 (last access: 16 October 2026), EUCLID: https://www.euclid.org/services/ (last access: 16 October 2026).
BV wrote the manuscript; BV and JG supervised the work; SEE and DN conducted the formal analysis, developed the visualization of results and reviewed the manuscript; JA supervised the data navigation and reviewed the manuscript.
At least one of the (co-)authors serves as editor for the Unlocking the potential of MTG imager data in applications to which this paper belongs. The peer-review process was guided by an independent editor, and the authors also have no other competing interests to declare.
Publisher's note: Copernicus Publications remains neutral with regard to jurisdictional claims made in the text, published maps, institutional affiliations, or any other geographical representation in this paper. The authors bear the ultimate responsibility for providing appropriate place names. Views expressed in the text are those of the authors and do not necessarily reflect the views of the publisher.
This article is part of the special issue “Unlocking the potential of MTG imager data in applications”. It is not associated with a conference.
The Meteosat Third Generation (MTG) Programme is a cornerstone of European space cooperation, made possible through the combined expertise and dedication of key institutional and industrial partners: EUMETSAT, ESA, Thales Alenia Space (France), Leonardo (Italy) and OHB (Germany). Methodologies and tools for MTG-LI performance assessment and monitoring were developed and implemented at EUMETSAT through years of collaboration with lightning detection experts across Europe and the United States. The authors gratefully acknowledge the invaluable discussions and feedback received during both GLM Science Meetings and MTG-LI Mission Advisory Group Meetings. The authors thank Douglas Mach (Referee #1) and the anonymous Referee #2 for the insightful feedback that strengthened the manuscript.
This paper was edited by Stephan Bojinski and reviewed by Douglas Mach and one anonymous referee.
Aich, V., Holzworth, R., Goodman, S. J., Kuleshov, Y., Price, C., and Williams, E.: Lightning: A new essential climate variable, EOS, 99, https://doi.org/10.1029/2018EO104583, 2018. a
Albrecht, R. I., Goodman, S. J., Buechler, D. E., Blakeslee, R. J., and Christian, H. J.: Where Are the Lightning Hotspots on Earth?, B. Am. Meteorol. Soc., 97, 2051–2068, https://doi.org/10.1175/BAMS-D-14-00193.1, 2016. a
Ashley, W. S. and Gilson, C. W.: A reassessment of U.S. lightning mortality, B. Am. Meteorol. Soc., 90, 1501–1518, 2009. a
Bateman, M., Mach, D., and Stock, M.: Further Investigation Into Detection Efficiency and False Alarm Rate for the Geostationary Lightning Mappers Aboard GOES-16 and GOES-17, Earth Space Sci., 8, e2020EA001237, https://doi.org/10.1029/2020EA001237, 2021. a, b
Bitzer, P. M., Burchfield, J. C., and Christian, H. J.: A Bayesian approach to assess the performance of lightning detection systems, J. Atmos. Oceanic Technol., 33, 563–578, 2016. a
Bližňák, V. and Sokol, Z.: First validation of the Lightning Imager aboard Meteosat Third Generation satellite with Earth Networks Total Lightning Network, I. J. Appl. Earth Observ. Geoinfo., 147, 105205, https://doi.org/10.1016/j.jag.2026.105205, 2026. a
Boccippio, D. J., Goodman, S. J., and Heckman, S.: Regional Differences in Tropical Lightning Distributions, J. Appl. Meteorol., 39, 2231–2248, https://doi.org/10.1175/1520-0450(2001)040<2231:RDITLD>2.0.CO;2, 2000a. a
Boccippio, D. J., Koshak, W. J., Blakeslee, R. J., Christian, H. J., Goodman, S. J., and Hall, J. M.: Performance Assessment of the Optical Transient Detector and Lightning Imaging Sensor. Part I: Predicted Diurnal Variability, J. Atmos. Sci., 57, 3264–3275, https://doi.org/10.1175/1520-0426(2002)019<1318:PAOTOT>2.0.CO;2, 2000b. a
Boccippio, D. J., Cummins, K. L., Christian, H. J., and Goodman, S. J.: Combined satellite-and surface-based estimation of the intracloud–cloud-to-ground lightning ratio over the continental United States, Mon. Weather Rev., 129, 108–122, 2001. a
Boccippio, D. J., Koshak, W., Blakeslee, R., Boeck, W. L., Mach, D., Goodman, S., and Christian, H. J.: Performance assessment of the Optical Transient Detector and Lightning Imaging Sensor. Part I: Predicted diurnal variability, J. Atmos. Ocean. Tech., 19, 1318–1332, https://doi.org/10.1175/1520-0426(2002)019<1318:PAOTOT>2.0.CO;2, 2002. a
Bozzo, A., Doutriaux-Boucher, M., Jackson, J., Spezzi, L., Lattanzio, A., and Watts, P. D.: First Release of the Optimal Cloud Analysis Climate Data Record from the EUMETSAT SEVIRI Measurements 2004–2019, Remote Sens., 16, https://doi.org/10.3390/rs16162989, 2024. a
Branick, M. L. and Doswell, Charles A., I.: An Observation of the Relationship between Supercell Structure and Lightning Ground-Strike Polarity, Weather Forecast., 7, 143–149, https://doi.org/10.1175/1520-0434(1992)007<0143:AOOTRB>2.0.CO;2, 1992. a
Cao, L., Wang, Q., Wu, L., Lu, Q., and Zhang, P.: Fengyun meteorological satellite products for earth system science, Adv. Atmos. Sci., 38, https://doi.org/10.1007/s00376-021-0425-3, 2021. a, b
Cecil, D. J., Goodman, S. J., Boccippio, D. J., Zipser, E. J., and Nesbitt, S. W.: Three Years of TRMM Precipitation Features. Part I: Radar, Radiometric, and Lightning Characteristics, Mon. Weather Rev., 133, 543–566, https://doi.org/10.1175/MWR-2876.1, 2005. a
Cecil, D. J., Buechler, D. E., and Blakeslee, R. J.: Gridded lightning climatology from TRMM-LIS and OTD: Dataset description, Atmos. Res., 135–136, 404–414, https://doi.org/10.1016/j.atmosres.2012.06.028, 2014. a
Cecil, D. J., Buechler, D. E., Lang, T. J., Virts, K. S., and Mach, D. M.: Lightning Climatology Datasets from TRMM LIS, ISS LIS, and OTD, J. Appl. Meteorol. Climatol., 65, 51–72, https://doi.org/10.1175/JAMC-D-25-0110.1, 2026. a
Chameides, W. L.: The role of lightning in the chemistry of the atmosphere, in: The Earth's Electrical Environment, 70–77, National Academy Press, Washington, D.C., 1986. a
Chen, Z., Qie, X., Sun, J., Xiao, X., Zhang, Y., Cao, D., and Yang, J.: Evaluation of Fengyun-4A Lightning Mapping Imager (LMI) Performance during Multiple Convective Episodes over Beijing, Remote Sens., 13, 1746, https://doi.org/10.3390/rs13091746, 2021. a
Combarnous, P., Vernet, O., and Martet, M.: First-year observations from the Meteosat-12 Lightning Imager: flash properties and LI-FCI relationships, eSS Open Archive, https://doi.org/10.22541/essoar.176423548.85109006/v1, 2025. a, b, c, d, e
Cummins, K. L. and Murphy, M. J.: An overview of lightning locating systems: History, techniques, and data uses, with an in-depth look at the U.S. NLDN, IEEE T. Electromagn. C., 51, 499–518, https://doi.org/10.1109/TEMC.2009.2023450, 2009. a, b, c, d
Djalel, D., Meghni, B., and Labar, H.: Study of the lightning impact on the wind-turbine, Energy Res. J., 5, 17–25, https://doi.org/10.3844/erjsp.2014.17.25, 2014. a
Enno, S.-E., Viticchié, B., Navia, D., and Grandell, J.: First Year of Meteosat Third Generation Lightning Imager Observations, EGUsphere [preprint], https://doi.org/10.5194/egusphere-2026-3386, 2026. a, b, c, d
Erdmann, F., Defer, E., Caumont, O., Blakeslee, R. J., Pédeboy, S., and Coquillat, S.: Concurrent satellite and ground-based lightning observations from the Optical Lightning Imaging Sensor (ISS-LIS), the low-frequency network Meteorage and the SAETTA Lightning Mapping Array (LMA) in the northwestern Mediterranean region, Atmos. Meas. Tech., 13, 853–875, https://doi.org/10.5194/amt-13-853-2020, 2020. a
EUMETSAT: MTG LI Level 2 Data Guide, EUMETSAT User Portal, https://user.eumetsat.int/resources/user-guides/mtg-li-level-2-data-guide (last access: 20 March 2026), 2026. a, b, c
Finney, D. L., Doherty, R. M., Wild, O., and Abraham, N. L.: The impact of lightning on tropospheric ozone chemistry using a new global lightning parametrisation, Atmos. Chem. Phys., 16, 7507–7522, https://doi.org/10.5194/acp-16-7507-2016, 2016. a
Gatlin, P. N. and Goodman, S. J.: A Total Lightning Trending Algorithm to Identify Severe Thunderstorms, J. Atmos. Ocean. Tech., 27, 3–20, https://doi.org/10.1175/2009JTECHA1286.1, 2010. a
Goodman, S. J., Blakeslee, R. J., Koshak, W. J., Mach, D., Bailey, J., Buechler, D., Carey, L., Christian, H., Doswell, C., Fedor, J., McCaul, E., Peterson, W., Rudlosky, S., Squires, K., Kuhlman, K., and Mauzey, C.: The GOES-R Geostationary Lightning Mapper (GLM), Atmos. Res., 125, 34–49, https://doi.org/10.1016/j.atmosres.2013.01.006, 2013. a, b
Grebović, S., Akšamović, A., Filipović-Grčić, B., and Konjicija, S.: Investigation of lightning effects on solar power plants connected to transmission networks, Electr. Pow. Syst. Res., 238, 1108240, https://doi.org/10.1016/j.epsr.2025.112217, 2025. a
Hilburn, K. A., Kummerow, C. D., and de Graaf, I. A. M.: Development and Interpretation of a Neural-Network-Based Synthetic Radar Reflectivity Estimator Using GOES-R Satellite Observations, J. Appl. Meteorol. Climatol., 60, 3–17, https://doi.org/10.1175/JAMC-D-20-0084.1, 2021. a
Holmlund, K., Grandell, J., Schmetz, J., Stuhlmann, R., Bojkov, B., Munro, R., Lekouara, M., Coppens, D., Viticchie, B., August, T., Theodore, B., Watts, P., Dobber, M., Fowler, G., Bojinski, S., Schmid, A., Salonen, K., Tjemkes, S., Aminou, D., and Blythe, P.: Meteosat Third Generation (MTG): Continuation and Innovation of Observations from Geostationary Orbit, B. Am. Meteorol. Soc., 102, E990–E1015, https://doi.org/10.1175/BAMS-D-19-0304.1, 2021. a, b
Holmlund, K., Counet, P., Fadrique, F. M., Schmid, A., Bojkov, B., Munro, R., Grandell, J., and Obligis, E.: The EUMETSAT satellite programmes and data services, J. Eur. Meteorol. Soc., 2, 100005, https://doi.org/10.1016/j.jemets.2024.100005, 2025. a
Kaplan, J. O. and Lau, K. H.-K.: The WGLC global gridded lightning climatology and time series, Earth Syst. Sci. Data, 13, 3219–3237, https://doi.org/10.5194/essd-13-3219-2021, 2021. a
Kokou, P., Willemsen, P., Lekouara, M., Arioua, M., Mora, A., Van den Braembussche, P., Neri, E., and Aminou, D. M. A.: Algorithmic Chain for Lightning Detection and False Event Filtering Based on the MTG Lightning Imager, IEEE T. Geosci. Remote Sens., 56, 5115–5124, https://doi.org/10.1109/TGRS.2018.2808965, 2018. a
Koshak, W. J. and Solakiewicz, R. J.: A Method for Retrieving the Ground Flash Fraction and Flash Type from Satellite Lightning Mapper Observations, J. Atmos. Ocean. Tech., 32, 79–96, https://doi.org/10.1175/jtech-d-14-00085.1, 2015. a
Liaskos, C. et al.: Sensitivity of tropical tropospheric composition to lightning NOx, J. Geophys. Res.-Atmos., 120, 8512–8531, https://doi.org/10.1002/2014JD022987, 2015. a
Lyons, W. A. and Keen, C. S.: Observations of Lightning in Convective Supercells within Tropical Storms and Hurricanes, Mon. Weather Rev., 122, 1897–1916, https://doi.org/10.1175/1520-0493(1994)122<1897:OOLICS>2.0.CO;2, 1994. a
MacGorman, D. R. and Nielsen, K. E.: Cloud-to-ground lightning in a tornadic storm on 8 May 1986, Mon. Weather Rev., 119, 1557–1574, 1991. a
MacGorman, D. R., Burgess, D. W., Mazur, V., and Rust, W. D.: Lightning and severe weather: A comparison between total and cloud-to-ground lightning trends, in: Preprints, 12th Conference on Weather Analysis and Forecasting, 568–573, American Meteorological Society, 1989. a, b
Mach, D. M.: Geostationary Lightning Mapper Clustering Algorithm Stability, J. Geophys. Res.-Atmos., 125, e2019JD031900, https://doi.org/10.1029/2019JD031900, 2020. a
Mäkelä, A., Jääskeläinen, S., and Kotro, J.: MTG Lightning Imager usability from a high-latitude perspective, 12th European Conference on Severe Storms, ECSS2025-104, 17–21 November 2025, Utrecht, the Netherlands, https://doi.org/10.5194/ecss2025-104, 2025. a
Marlton, G., Hare, B., Scholten, O., Protts, M., Stone, E., Twelves, S., and Devoto, F.: Mapping out lightning processes in both the VHF and VLF using LOFAR and the Met Office’s lightning detection system, LEELA, EGU General Assembly 2024, Vienna, Austria, 14–19 Apr 2024, EGU24-11101, https://doi.org/10.5194/egusphere-egu24-11101, 2024. a
Mitchard, C., Smith, S., Edwards, A., and Mitchell, P.: Investigation of lightning direct effects on aircraft materials, Proceedings of the International Conference on Lightning and Static Electricity, https://orca.cardiff.ac.uk/id/eprint/102939/1/102939 - Investigation of lightning ...pdf (last access: 14 October 2026), 2016. a
Montanyà, J., Van der Velde, O., Pineda, N., López, J. A., Romero, D., Solà, G., Arcanjo, M., Defer, E., Vázquez, F. G., Viticchié, B., and Enno, S.-E.: METEOSAT-12 Lightning Imager detection efficiency assessment by means of the Lightning Mapping Array in its first year of dissemination, Atmos. Meas. Tech., in preparation, 2026. a
Murphy, M. J. and Said, R. K.: Comparisons of Lightning Rates and Properties From the U.S. National Lightning Detection Network (NLDN) and GLD360 With GOES-16 Geostationary Lightning Mapper and Advanced Baseline Imager Data, J. Geophys. Res.-Atmos., 125, e2019JD031172, https://doi.org/10.1029/2019JD031172, 2020. a
Murray, L. T.: Lightning NOx and Impacts on Air Quality, Curr. Pollut. Rep., 2, 115–133, https://doi.org/10.1007/s40726-016-0031-7, 2016. a
Mäkelä, A., Mäkelä, J., Haapalainen, J., and Porjo, N.: The verification of lightning location accuracy in Finland deduced from lightning strikes to trees, Atmos. Res., 172–173, 1–7, https://doi.org/10.1016/j.atmosres.2015.12.009, 2016. a
Pérez-Invernón, F. J., Gordillo-Vázquez, F. J., van der Velde, O., Montanyá, J., López Trujillo, J. A., Pineda, N., Huntrieser, H., Valks, P., Loyola, D., Seo, S., and Erbertseder, T.: Lightning-produced nitrogen oxides per flash length obtained by using TROPOMI observations and the Ebro Lightning Mapping Array, Geophys. Res. Lett., 50, e2023GL104699, https://doi.org/10.1029/2023GL104699, 2023. a
Pohjola, H. and Mäkelä, A.: The Comparison of GLD360 and EUCLID Lightning Location Systems in Europe, Atmos. Res., 123, 117–128, https://doi.org/10.1016/j.atmosres.2012.10.019, 2013. a
Price, C. and Rind, D.: Possible implications of global climate change on global lightning distributions and frequencies, J. Geophys. Res.-Atmos., 99, 10823–10831, https://doi.org/10.1029/94JD00019, 1994. a
Rakov, V. A. and Uman, M. A.: Electrical Structure of Lightning-Producing Clouds, in: Lightning: Physics and Effects, Cambridge University Press, Chap. 3, 67–107, https://doi.org/10.1017/CBO9781107340886.004, 2003. a
Reeve, N. and Toumi, R.: Lightning activity as an indicator of climate change, Q. J. Roy. Meteorol. Soc., 125, 893–903, 1999. a
Rison, W., Thomas, R. J., Krehbiel, P. R., Hamlin, T., and Harlin, J.: A GPS‐based three‐dimensional lightning mapping system: Initial observations in central New Mexico, Geophys. Res. Lett., 26, 3573–3576, https://doi.org/10.1029/1999GL010856, 1999. a, b
Rudlosky, S. D. and Virts, K. S.: Dual Geostationary Lightning Mapper Observations, Mon. Weather Rev., 149, 979–992, https://doi.org/10.1175/MWR-D-20-0242.1, 2021. a, b
Rudlosky, S. D., Virts, K. S., Kolek, M. J., Bruning, E. C., Lojewski, S. J., and Magsig, M. A.: Initial Geostationary Lightning Mapper Observations, Geophys. Res. Lett., 46, 1097–1104, https://doi.org/10.1029/2018GL081052, 2019. a, b, c
Said, R. K. and Murphy, M. J.: GLD360 Upgrade: Performance Analysis and Applications, in: 24th International Lightning Detection Conference/Sixth International Lightning Meteorology Conference, Vaisala, San Diego, CA, https://www.vaisala.com/sites/default/files/documents/Ryan Said and Martin Murphy. GLD360 Upgrade Performance Analysis and Applications.pdf (last access: 12 October 2026), 2016. a, b
Said, R. K., Cohen, M. B., and Inan, U. S.: Highly intense lightning over the oceans: Estimated peak currents from global GLD360 observations, J. Geophys. Res.-Atmos., 118, 6905–6915, https://doi.org/10.1002/jgrd.50508, 2013. a, b, c
Schultz, C. J., Petersen, W. A., and Carey, L. D.: Preliminary Development and Evaluation of Lightning Jump Algorithms for the Real-Time Detection of Severe Weather, J. Appl. Meteorol. Climatol., 48, 2543–2563, https://doi.org/10.1175/2009JAMC2237.1, 2009. a
Schultz, C. J., Petersen, W. A., and Carey, L. D.: Lightning and severe weather: A comparison between total and cloud-to-ground lightning trends, Weather Forecast., 26, 744–755, https://doi.org/10.1175/WAF-D-10-05026.1, 2011. a
Schulz, W., Diendorfer, G., Pedeboy, S., and Poelman, D. R.: The European lightning location system EUCLID – Part 1: Performance analysis and validation, Nat. Hazards Earth Syst. Sci., 16, 595–605, https://doi.org/10.5194/nhess-16-595-2016, 2016. a, b, c
Schumann, U. and Huntrieser, H.: The global lightning-induced nitrogen oxides source, Atmos. Chem. Phys., 7, 3823–3907, https://doi.org/10.5194/acp-7-3823-2007, 2007. a
Shafer, M. A., MacGorman, D. R., and Carr, F. H.: Cloud-to-Ground Lightning throughout the Lifetime of a Severe Storm System in Oklahoma, Mon. Weather Rev., 128, 1798–1815, https://doi.org/10.1175/1520-0493(2000)128<1798:CTGLTT>2.0.CO;2, 2000. a
Van der Velde, O., Montanya, J., Rison, W., Aulich, G., Pineda, N., Soula, S., Romero, D., Rico, R., and Reglero, V.: First results of the Ebro Delta Lightning Mapping Array, AGU Fall Meeting Abstracts, AE33A-0290, https://ui.adsabs.harvard.edu/abs/2011AGUFMAE33A0290V (last access: 12 October 2026), 2011. a
Virts, K. S. and Koshak, W. J.: Mitigation of Geostationary Lightning Mapper Geolocation Errors, J. Atmos. Ocean. Tech., 37, 1673–1686, https://doi.org/10.1175/JTECH-D-19-0100.1, 2020. a, b
Virts, K. S. and Koshak, W. J.: Bayesian analysis of the detection performance of the Geostationary Lightning Mapper, J. Atmos. Ocean. Tech., 42, https://doi.org/10.1175/JTECH-D-24-0130.1, 2025. a, b, c, d, e, f, g, h, i, j
Williams, E., Boldi, B., Matlin, A., Weber, M., Hodanish, S., Sharp, D., Goodman, S., Raghavan, R., and Buechler, D.: The behavior of total lightning activity in severe Florida thunderstorms, Atmos. Res., 51, 245–265, https://doi.org/10.1016/S0169-8095(99)00011-3, 1999. a
Zhu, Y., Lyu, W., Cramer, J., Rakov, V., Bitzer, P., and Ding, Z.: Analysis of Location Errors of the U.S. National Lightning Detection Network Using Lightning Strikes to Towers, J. Geophys. Res.-Atmos., 125, e2020JD032530, https://doi.org/10.1029/2020JD032530, 2020. a
Zhu, Y., Stock, M., Lapierre, J., and DiGangi, E.: Upgrades of the Earth Networks Total Lightning Network in 2021, Remote Sensing, 14, 2209, https://doi.org/10.3390/rs14092209 2022. a