
the Creative Commons Attribution 4.0 License.
the Creative Commons Attribution 4.0 License.
 | 28 Oct 2026
A blue-band surface residual correction method for land aerosol optical depth retrieval from DQ-1 WSI
Jingxuan Zhao
Yujing Wang
Hui Chen
Mengjie Zhang
Lili Wang
Xingchuan Yang
Shuo Dong
Wenji Zhao

Pengfei Ma
Surface reflectance prior uncertainty remains a major source of error in land aerosol optical depth (AOD) retrieval, particularly over complex surfaces and for newly launched satellite sensors lacking long-term observations for constructing stable surface priors. Here, we develop a hybrid AOD retrieval framework for the DQ-1 Wide Swath Imager (WSI) that integrates a static surface reflectance prior, machine-learning-based blue-band surface residual correction, and a physically based lookup-table (LUT) inversion. A multi-band static surface prior is first constructed from quality-controlled clear-sky observations under low-to-moderate aerosol loading. Rather than directly predicting AOD, a random forest model is used to estimate the residual between the static and reference surface terms at 0.443 µm using the static blue-band prior, top-of-atmosphere reflectance, normalized difference vegetation index (NDVI), viewing geometry, and elevation. The corrected blue-band surface term is then used in the conventional LUT retrieval, retaining the physical aerosol inversion while using machine learning only to correct surface-prior mismatch. MCD19A2 AOD is used as an external atmospheric constraint in the offline construction of LUT-derived reference surface terms and as a reference for regional spatial and hold-out-date consistency analyses, whereas AERONET observations provide independent ground-based validation. Relative to the static-prior LUT retrieval, the residual-corrected retrieval reduced the AERONET-based RMSE from 0.256 to 0.107 and the mean bias error from 0.187 to 0.059 in spring 2025 (March–May), while increasing the fraction within the expected-error envelope from 14.8 % to 55.6 %. Improvement was also observed for autumn–winter 2025 (October–December) using a season-specific static prior together with a seasonally adjusted LUT and RF model. When the spring-2025 configuration was applied to spring 2026 (March–May) without retraining or recalibration, the RMSE decreased from 0.330 to 0.153. In a held-out-scene evaluation, the blue-band surface-term MAE relative to the LUT-derived reference surface term decreased from 0.0088 to 0.0044, and hold-out-date comparisons showed regional consistency with MCD19A2. Together, these evaluations show that correcting blue-band surface-prior mismatch improves DQ-1 WSI land AOD retrieval while retaining the LUT-based physical inversion under the BTH conditions examined here.
- Article
(6242 KB) - Full-text XML
-
Supplement
(762 KB) - BibTeX
- EndNote


Aerosol optical depth (AOD) is an important parameter for characterizing atmospheric aerosol loading and its climatic and environmental effects (Zou et al., 2025; Luo et al., 2024a), and it has been widely used in air-quality monitoring and regional climate studies (Intergovernmental Panel on Climate Change (IPCC), 2023; Wei et al., 2021). Owing to their wide spatial coverage and continuous observation capability, satellite remote sensing techniques have become a primary means of obtaining AOD at large scales (Wei et al., 2020; Yan et al., 2023, 2026). However, over land surfaces, especially in urban and urban–rural transitional areas, strong spectral heterogeneity and spatial non-uniformity make it difficult to effectively separate surface signals from aerosol scattering signals, which remains one of the major challenges for high-accuracy AOD retrieval.
Although physically based retrieval algorithms represented by the MODIS Dark Target (DT) (Kaufman et al., 1997), Deep Blue (DB) (Hsu et al., 2013; Levy et al., 2013), and MAIAC (Lyapustin et al., 2018) products have become relatively mature, errors in surface reflectance estimation are still a key factor limiting retrieval accuracy over complex surfaces (Bilal et al., 2013). This is particularly true under low-AOD conditions, where even a small bias in the blue-band surface prior may propagate through the radiative transfer chain and be amplified into a substantial AOD retrieval error. In addition, bidirectional reflectance distribution function (BRDF) effects and seasonal phenological changes may further weaken the applicability of static surface priors (Lucht et al., 2000). Therefore, for new remote-sensing sensors with limited temporal accumulation, it remains challenging to construct surface background constraints that are well matched to actual observation conditions (Yan et al., 2025).
In recent years, machine-learning methods have been increasingly used for AOD retrieval and related error correction and have shown strong capability in fitting nonlinear relationships in complex scenes (Luo et al., 2024b; Tian et al., 2022; Wei et al., 2024). However, end-to-end data-driven methods that directly target AOD usually incorporate radiative transfer constraints only implicitly, and their physical interpretability and spatiotemporal generalizability still require further examination (Yan et al., 2024; Peng et al., 2026; Yang et al., 2025). In contrast, physics-guided hybrid methods use machine learning to correct selected parameters or error terms while retaining the physical retrieval framework, thereby improving retrieval accuracy while better preserving physical consistency (Dong et al., 2024; Lemmouchi et al., 2023; Man et al., 2024; Yan et al., 2022). Among these methods, tree-based models such as random forest (RF) are well suited to handling multi-source heterogeneous features and representing nonlinear relationships, and have been shown to be effective in various remote-sensing retrieval tasks (Liang et al., 2022). For new wide-swath sensors, constraining machine learning to surface-term error compensation, rather than using it to directly replace the physics-based AOD retrieval, provides a feasible way to improve retrieval stability over complex surfaces.
The DaQi-1 (DQ-1) atmospheric environment monitoring satellite carries the Wide Swath Imager (WSI), which provides relatively high spatial resolution and wide-swath coverage, offering new observational capability for regional aerosol monitoring (Dai et al., 2024; Wang et al., 2024a). Previous studies have shown that DQ-1 WSI has the potential for land AOD retrieval (Wang et al., 2024b). However, as a new sensor with still-limited temporal accumulation, WSI faces several challenges over complex land surfaces. First, long-term and stable surface reflectance priors are not yet sufficiently available, and surface assumptions developed for mature sensors cannot be directly transferred. Second, clouds, thin clouds, warm haze, water, snow, and mixed pixels over complex land surfaces may affect the quality of analysis-ready data. In addition, the Beijing–Tianjin–Hebei region is characterized by highly heterogeneous urban–cropland–bare-land mosaics, which further increases the difficulty of surface reflectance characterization and stable AOD retrieval (Zang et al., 2023). Therefore, it is important to develop a retrieval-oriented workflow for DQ-1 WSI that integrates quality control, surface-prior constraints, physical retrieval, and error correction.
To address these challenges, this study develops a hybrid land AOD retrieval framework for DQ-1 WSI that combines machine-learning-based surface correction with a physically based lookup-table (LUT) inversion. A static multi-band surface reflectance prior is first constructed from quality-controlled clear-sky observations under low-to-moderate aerosol loading. A random forest model is then used to correct the residual of the 0.443 µm surface term, with MCD19A2 AOD used only in the offline stage to constrain the LUT-derived reference surface term. The corrected blue-band surface term is subsequently introduced into the LUT retrieval to obtain AOD. Unlike direct machine-learning AOD retrieval, the proposed framework uses machine learning only to mitigate surface-prior mismatch while preserving the physical retrieval chain and its interpretability. The main contributions are threefold: (1) an integrated DQ-1 WSI land AOD retrieval workflow combining quality control, static surface-prior construction, surface residual correction, and LUT inversion; (2) a targeted correction of blue-band surface-prior errors to reduce retrieval bias over complex surfaces; and (3) a multi-level evaluation linking surface-term correction to final AOD performance using AERONET validation, held-out-scene tests, and cross-product consistency analyses with MCD19A2. Together, these analyses test whether the retrieval improvement can be traced to reduced surface-prior mismatch rather than direct empirical fitting of AOD.
2.1 Study Area
The Beijing–Tianjin–Hebei (BTH) region was selected as the study area in this work. This region contains a mixture of urban areas, croplands, and bare land, resulting in strong surface heterogeneity, and therefore provides a representative test bed for examining the impact of surface reflectance estimation errors on satellite AOD retrieval. In addition, under the combined influence of anthropogenic activities, topography, and meteorological conditions, aerosol pollution in the BTH region exhibits pronounced regional and episodic characteristics (Che et al., 2015; Tao et al., 2012). The wide range of AOD variability in this region provides representative scenes for evaluating the applicability of the DQ-1 WSI AOD retrieval algorithm under complex surface and different pollution conditions.
2.2 DQ-1 WSI Data
The DQ-1 atmospheric environment monitoring satellite was launched on 16 April 2022 and operates in a Sun-synchronous orbit at an altitude of approximately 700 km, with an overpass time of about 13:30 Beijing time over the study region (Wang et al., 2024b). The Wide Swath Imager (WSI) onboard DQ-1 provides wide-swath multispectral observations from the visible to the long-wave infrared region. The WSI has a swath width of approximately 2300 km and provides observations over approximately 0.415–12 µm, with nominal spatial resolutions of 75, 150, 300, and 600 m depending on the channel (Cao, 2023; Wang et al., 2024b). Pre-launch radiometric calibration showed uncertainties of approximately 3.2 % for the visible and near-infrared channels and 4.6 % for the shortwave-infrared channels, while the relative radiometric calibration accuracy of individual channels was better than 1.0 % (Wang et al., 2024a). At 30 % solar albedo, the signal-to-noise ratios are greater than 500 for the 0.443, 0.490, and 0.681 µm bands, greater than 200 for the 0.865 µm band, and greater than 110 for the 2.13 µm band (Wang et al., 2024a).
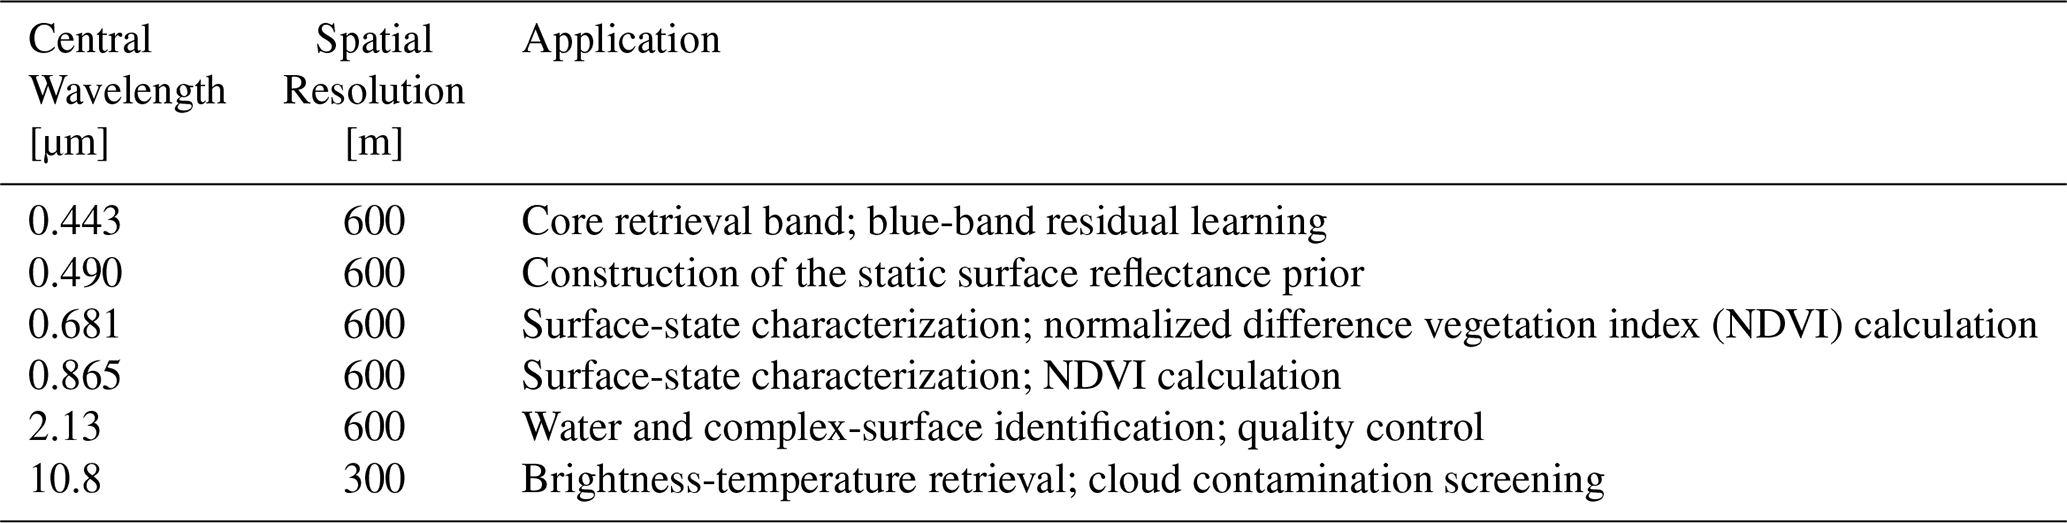
For the AOD retrieval developed in this study, the 0.443, 0.490, 0.681, 0.865, and 2.13 µm bands at 600 m spatial resolution were used to construct the main retrieval inputs. In addition, the 10.8 µm thermal infrared brightness temperature at 300 m resolution, together with solar/viewing geometry and elevation information from the navigation data, was used to support quality control and retrieval. The main bands used in this study and their applications are listed in Table 1.
Table 1Main DQ-1 WSI bands used in this study and their applications.
2.3 Ground-Based Validation and Satellite Reference Products
AERONET (Aerosol Robotic Network) sun-photometer observations were used as the independent ground-based reference for validating the DQ-1 WSI AOD retrievals. Observations from stations in the Beijing–Tianjin–Hebei region were collected for the DQ-1 WSI overpass dates using the Version 3 Level 1.5 instantaneous product (Giles et al., 2019; Holben et al., 1998). The AOD at 550 nm was interpolated from the 500 nm AOD and the 440–675 nm Ångström exponent. To ensure a direct comparison between the static-prior LUT retrieval and the residual-corrected retrieval, the AERONET matchup analysis was conducted using only station–date samples for which both DQ-1 WSI retrievals were valid. For the spring 2025 evaluation (March–May 2025), AERONET observations acquired between 02:00 and 06:00 UTC were averaged at each station to obtain the ground-based reference AOD. The nominal DQ-1 WSI overpass time over the study region is approximately 13:30 Beijing time (approximately 05:30 UTC). The 02:00–06:00 UTC window was used to retain sufficient AERONET observations for the available DQ-1 WSI overpass dates. Temporal aerosol variability within this window may introduce additional uncertainty into the validation statistics. For the autumn–winter 2025 evaluation (October–December 2025), AERONET observations within ±60 min of the nominal overpass time were used. The spring-2026 evaluation (March–May 2026) used the same temporal and spatial matchup definition as the spring-2025 evaluation.
The satellite matchup value was then extracted as the mean AOD within a 3 × 3 pixel window centered on the station location for both retrievals. A station–date pair was retained only when both DQ-1 WSI retrievals were valid. This strategy ensures consistent sampling between the two retrievals, although it also constrains the final number of matchups.
The MODIS MAIAC MCD19A2 AOD product (Lyapustin et al., 2018) was also used to support AOD-screened surface-prior construction and regional cross-product comparison. Previous studies have reported its good retrieval performance and spatial characterization over complex surfaces (Wei et al., 2019b). For dates corresponding to DQ-1 WSI observations, the Optical_Depth_055 layer was extracted, and high-quality pixels were selected according to the AOD_QA flag. The MCD19A2 data were then reprojected and clipped to the study domain to obtain same-day 550 nm AOD reference images. In this study, MCD19A2 was used mainly (1) to provide an external AOD constraint for static surface-prior construction under AOD-screened conditions, (2) to provide a reference for regional spatial-structure comparison, and (3) to conduct hold-out-date cross-product consistency analysis. The independent accuracy assessment of the proposed retrieval remains based on AERONET observations. Level 1.5 data were used because fully quality-assured Level 2.0 observations were not consistently available for all DQ-1 WSI overpass dates at the time of this analysis.
2.4 DQ-1 WSI Preprocessing and Quality Control
The WSI visible-to-shortwave-infrared channels were converted from digital numbers to top-of-atmosphere (TOA) reflectance using the official radiometric calibration coefficients released by the China Centre for Resources Satellite Data and Application (CRESDA). The 10.8 µm thermal infrared channel was converted to brightness temperature, while solar zenith angle, viewing zenith angle, and relative azimuth angle were obtained from the accompanying navigation data. TOA reflectance, observation geometry, elevation, and other continuous retrieval inputs were subsequently resampled to a common spatial resolution of 600 m.
A unified quality-control procedure was applied to reduce the influence of cloud contamination and anomalous surface targets on AOD retrieval. Water pixels were identified mainly using the modified normalized difference water index (MNDWI; Xu, 2006), the normalized difference vegetation index (NDVI), and related spectral constraints, while snow pixels were detected using the normalized difference snow index (NDSI). For cloud-contamination screening, thick clouds were identified using visible-band whiteness, while blue-band enhancement, 10.8 µm brightness temperature, and visible-band gradient and texture were combined to identify thin clouds, cloud edges, and semi-transparent cloud-like contamination. For QA purposes, “haze” refers to pixels showing cloud-like spectral, thermal, or spatial characteristics rather than aerosol-loaded clear-sky conditions. Because AOD itself is not used as a screening criterion, high-AOD observations are not explicitly excluded. However, aerosol-loaded pixels showing cloud-like spectral, thermal, or spatial characteristics may still be removed by the QA procedure. NDVI- and NDSI-based constraints were used to reduce false detections over bright vegetation and snow-like targets. The resulting mask was applied conservatively to reduce residual cloud contamination in surface estimation and AOD retrieval.
After the initial cloud-contamination mask was obtained, morphological operations, including dilation, hole filling, and removal of small patches, were applied following existing cloud-masking approaches for optical satellite imagery (Qiu et al., 2019; Zhang et al., 2024). These operations improved the spatial completeness and stability of the mask. A unified QA mask was then generated using the priority order of snow, water, and cloud, and only clear-sky valid pixels were retained for subsequent surface reflectance estimation and AOD retrieval. Through these preprocessing and quality-control steps, DQ-1 WSI analysis-ready data with consistent radiometric units, unified spatial registration, and rigorous screening were obtained, providing reliable inputs for the subsequent LUT-based physical retrieval and residual correction. The specific thresholds, spectral tests, thermal constraints, and morphological operations used in the unified QA mask are summarized in Table S1 in the Supplement. The QA mask was encoded as 0 for clear sky, 1 for cloud contamination, 2 for water, 3 for snow, and 255 for no data.
3.1 Overall Framework
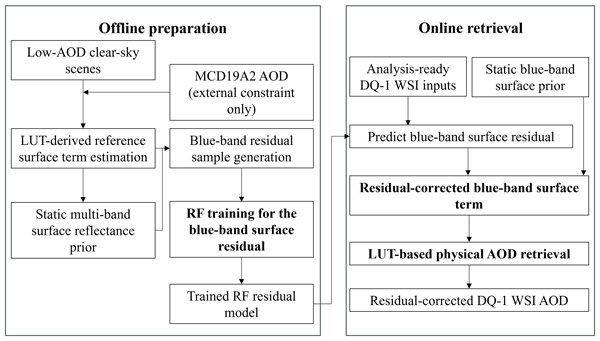
The proposed framework (Fig. 1) consists of an offline preparation stage and an online AOD retrieval stage. The offline stage is used to construct the static surface prior and train the blue-band residual model, whereas the online stage performs AOD retrieval without requiring any external AOD product.
In the offline preparation stage, clear-sky DQ-1 WSI reference scenes screened using MCD19A2 AOD are first selected after quality control. For these scenes, collocated MCD19A2 AOD is used only as an external atmospheric constraint in the LUT inversion, together with WSI TOA reflectance, observation geometry, and elevation, to derive LUT-based reference surface terms. These reference surface terms are then used to construct the static multi-band surface reflectance prior. The difference between the LUT-derived reference blue-band surface term and the corresponding static blue-band prior is defined as the residual-learning target, and an RF model is trained to predict this residual from the static blue-band prior, blue-band TOA reflectance, NDVI, observation geometry, and elevation.
In the online retrieval stage, no MCD19A2 or other external AOD product is required. For each valid WSI pixel, the trained RF model predicts the blue-band surface residual, which is added to the static blue-band prior to obtain the residual-corrected blue-band surface term. The corrected surface term is then reintroduced into the LUT-based physical retrieval to derive AOD. Thus, machine learning is restricted to the surface-term correction step and does not directly estimate AOD.
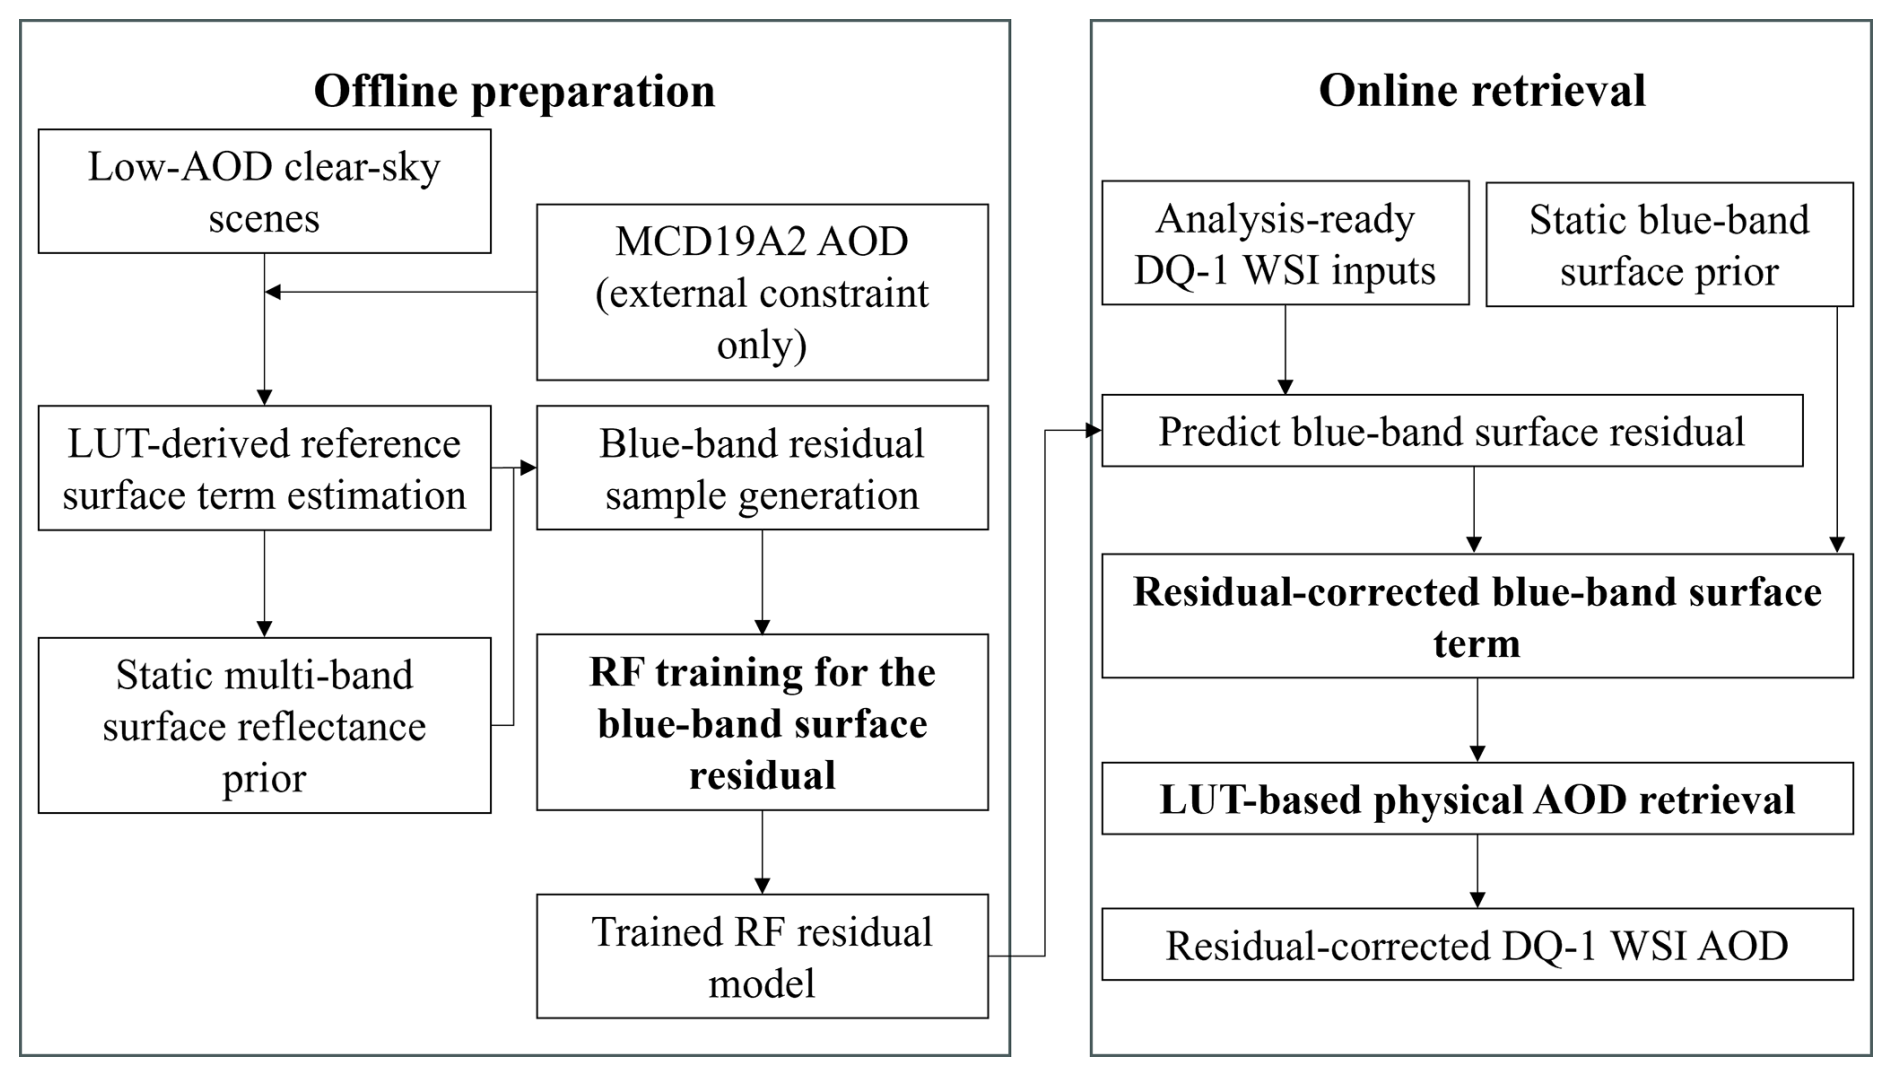
Figure 1Framework of the proposed blue-band residual-correction method for DQ-1 WSI AOD retrieval. The left panel shows the offline preparation stage, in which MCD19A2 AOD is used as an external constraint for LUT-derived reference surface-term estimation for the AOD-screened clear-sky reference scenes, followed by static multi-band surface-prior construction, blue-band residual-sample generation, and RF model training. The right panel shows the online retrieval stage, in which no external AOD product is required; the trained RF model predicts the blue-band surface residual, and the resulting residual-corrected blue-band surface term is used for LUT-based physical AOD retrieval.
3.2 LUT Construction
Under the Lambertian surface assumption, the 6S radiative transfer model (Kotchenova et al., 2006; Vermote et al., 1997) was used to simulate top-of-atmosphere (TOA) reflectance, with surface reflectance represented as a Lambertian-equivalent quantity in the LUT retrieval (Schaepman-Strub et al., 2006). AOD was retrieved by minimizing the residual between observed and simulated TOA reflectance. To improve the retrieval efficiency for large-area imagery, a lookup table (LUT) covering multidimensional observation geometry, elevation, and representative aerosol models was preconstructed. The key discretization settings of the LUT are listed in Table 2.
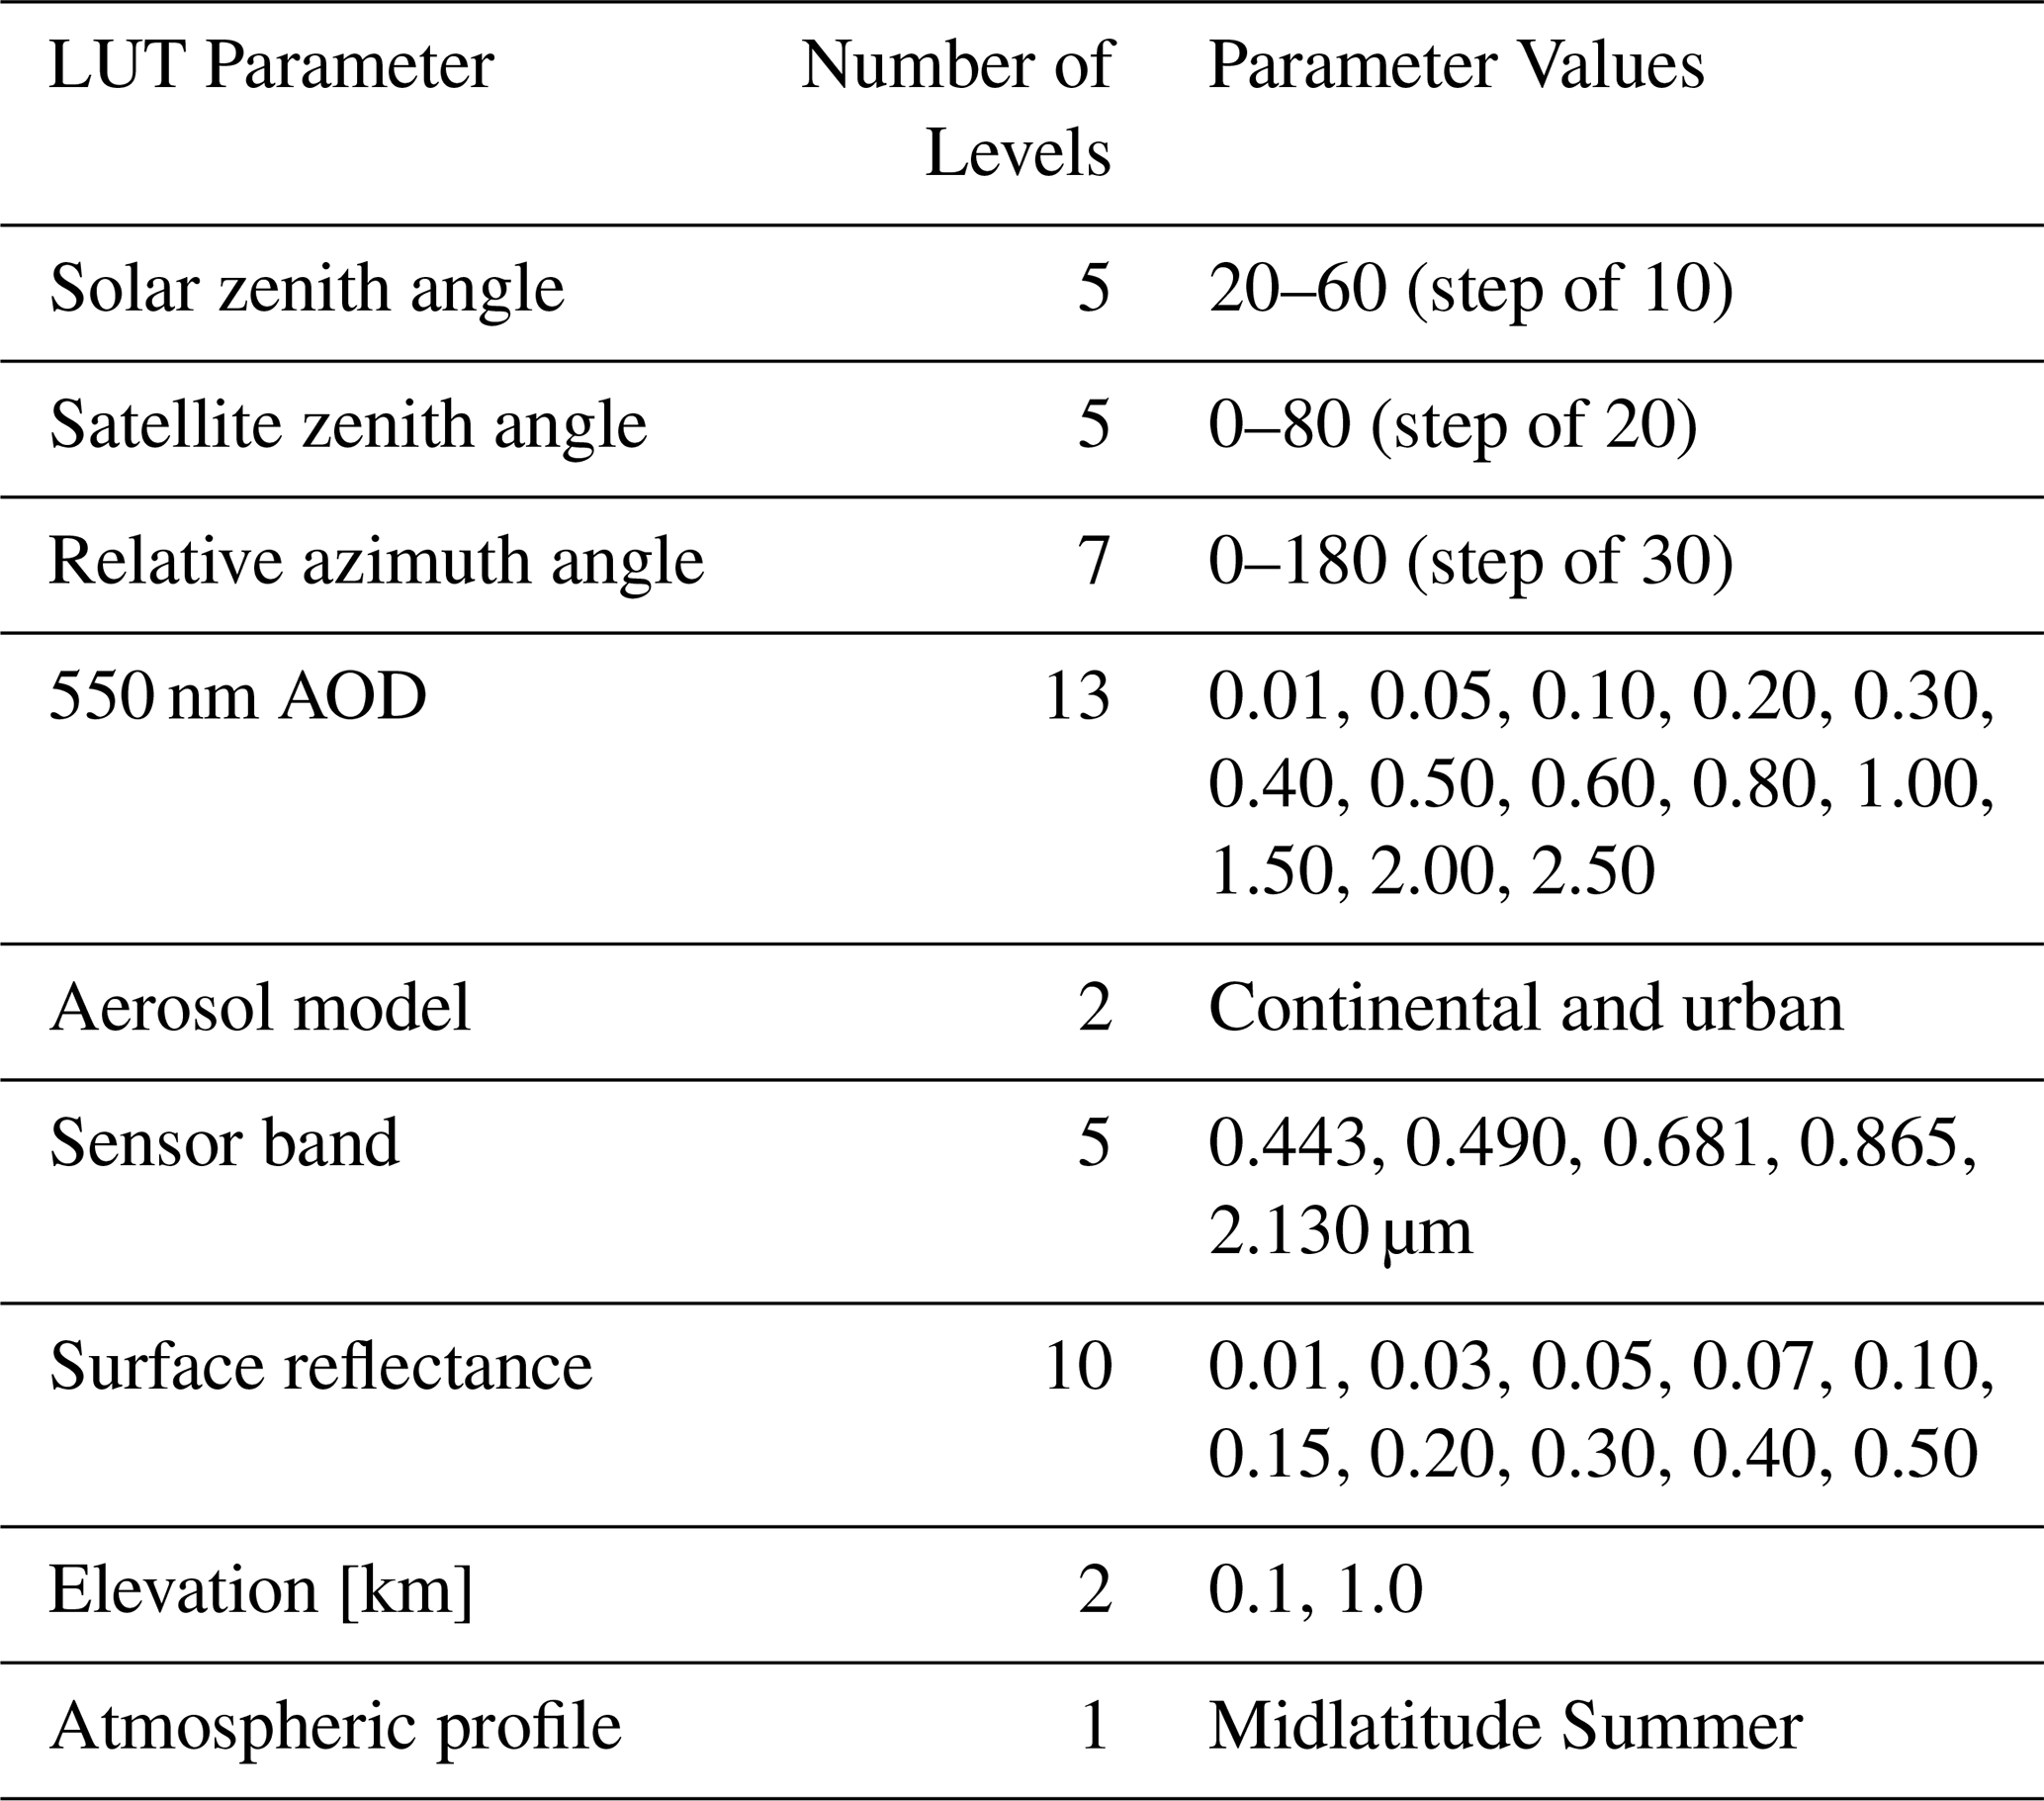
The continental and urban aerosol models used in this study are predefined aerosol types in 6S rather than aerosol properties retrieved from DQ-1 WSI observations. Both models were retained as candidate aerosol assumptions in the online retrieval and were evaluated separately at the scene scale. Representative values of single-scattering albedo and normalized spectral AOD for the two models are provided in Table S5.
The spectral AOD dependence prescribed by the two models was compared with AERONET observations from the BTH region. The comparison included 678 records from four sites spanning 34 observation dates and was used to characterize the regional spectral AOD range. Both models fell within the observed 5th–95th percentile range, with the continental model closer to the median spectral dependence and the urban model showing a steeper spectral dependence (Fig. S1 in the Supplement). The AERONET comparison evaluates the prescribed spectral AOD dependence only; the predefined SSA values were not independently evaluated in this study. The continental model was used for offline construction of the static surface prior and LUT-derived reference surface terms, whereas both models were retained for the final online retrieval.
The 6S simulations were performed at the nominal WSI central wavelengths listed in Table 2 without explicit convolution with the measured spectral response functions. The Midlatitude Summer atmospheric profile was used for the spring retrieval. Gaseous absorption was treated within 6S using the gaseous contents specified by this profile, without additional external gas-concentration data or absorption cross sections. The downward and upward scattering transmittances stored in the LUT were obtained from the total-scattering transmittances provided by 6S, and the corresponding directional global-gas transmittances were applied to obtain the transmittances used in the TOA reflectance calculation.
During online retrieval, the radiative parameters were interpolated according to pixel-wise observation geometry, elevation, and candidate AOD, and TOA reflectance was then simulated using the prescribed surface term. AOD was subsequently solved by minimizing the matching residual between observed and simulated reflectance. For the baseline spring LUT, the effect of angular discretization was evaluated by comparing direct 6S simulations with LUT-interpolated 0.443 µm TOA reflectance for 160 geometries located between the LUT nodes. The resulting bias and RMSE were 0.0052 and 0.0078, respectively, and the 95th percentile of the absolute difference was 0.0185. The interpolation error increased toward large viewing zenith angles (Fig. S2 and Table S6). Although the LUT was preconstructed for multiple spectral bands, the final AOD matching objective used the 0.443 µm band. This process constitutes the static-prior LUT retrieval used as the control case in this study, while the subsequent residual learning is used only to correct the surface term and does not alter the main LUT retrieval chain. A sensitivity test at 0.443 µm showed that the gas-transmittance correction produced a median absolute change of 6.5 × 10⁻⁵ in simulated TOA reflectance and 0.002 in retrieved AOD; 97.1 % of the test cases showed an AOD change within 0.02 (Table S7).
For the autumn–winter retrieval, the LUT was extended to cover the larger solar zenith angles. Additional solar zenith angle nodes of 65, 70, 75, and 80° were introduced, and the Midlatitude Winter atmospheric profile was used. The AOD, surface-reflectance, elevation, viewing-zenith-angle, and relative-azimuth grids were unchanged. Continental and urban remained the two candidate aerosol models in the final retrieval.
3.3 Construction of the Static Multi-Band Surface Reflectance Library
A static surface reflectance prior was constructed from clear-sky reference scenes screened to MCD19A2 AOD values of 0.01–0.50. This clear-sky compositing and surface-background inversion strategy has been widely used to obtain reliable surface reflectance estimates when multi-angle observations are unavailable (Knapp et al., 2005). For the spring configuration, the reference set comprised scenes acquired on 22 March, 22 April, and 19 May 2025; for autumn–winter 2025, the same procedure was applied using scenes acquired on 18 October, 22 October, 8 December, and 15 December 2025. For a target scene included in the corresponding reference set, that scene was omitted from the candidate set during compositing. After invalid pixels affected by clouds, water, and snow were removed, the collocated MCD19A2 AOD at 550 nm was used to constrain aerosol loading in the LUT inversion, while the spectral and angular aerosol optical properties were specified by the predefined 6S continental aerosol model. Together with DQ-1 WSI TOA reflectance, observation geometry, and elevation, these inputs were used to interpolate the LUT and inversely estimate the Lambertian-equivalent surface reflectance for the blue, green, red, and near-infrared bands on a pixel-by-pixel basis. Candidate pixels were restricted to MCD19A2 AOD values of 0.01–0.50 to limit the influence of heavier aerosol loading on surface-term estimation. The collocated MCD19A2 AOD was retained as an atmospheric constraint in the LUT inversion to account for aerosol effects within this range. Thus, aerosol effects at AOD ≤ 0.50 were not treated as negligible.
To maintain reasonable spectral consistency among bands in the static prior, reference dates were not selected independently for each band. Instead, a pixel-wise reference-date selection strategy was adopted. Among the candidate reference scenes, a given date was allowed to participate in the selection only when valid inversions were available for at least three bands. A composite score was then calculated for each candidate date, and the date with the highest score was selected as the final reference date for that pixel. This score was used only for reference-date selection.
Here, Brightness is defined as the mean candidate surface reflectance of the blue, green, red, and near-infrared bands on the candidate date:
where ρBlue, ρGreen, ρRed, and ρNIR denote the candidate surface reflectance values of the four bands on that date. Brightness represents the overall retrieved surface-reflectance level of a pixel on a candidate date and was used as an empirical term in reference-date selection. Within the quality-controlled candidate scenes, this term empirically favors relatively high retrieved surface-reflectance states and reduces the selection of anomalously low surface solutions. The multi-band mean reduces the influence of band-specific noise and outliers. Here, NDVI was calculated from the candidate red and near-infrared Lambertian-equivalent surface reflectances. The deviation between the NDVI of a candidate date and the median NDVI of all candidate dates for the same pixel was used to characterize vegetation-state consistency. The composite score was defined as
Here, α = 0.06 was adopted empirically to balance the brightness and vegetation-state consistency terms. A sensitivity analysis around this value is shown in Fig. 2. Increasing α reduced the NDVI deviation of the selected scenes, while the mean selected brightness changed little, indicating that α mainly controls the weight assigned to vegetation-state consistency. The reference-date switch ratio is defined relative to α = 0.06 and is therefore used only as a descriptive measure of changes in reference-date selection.
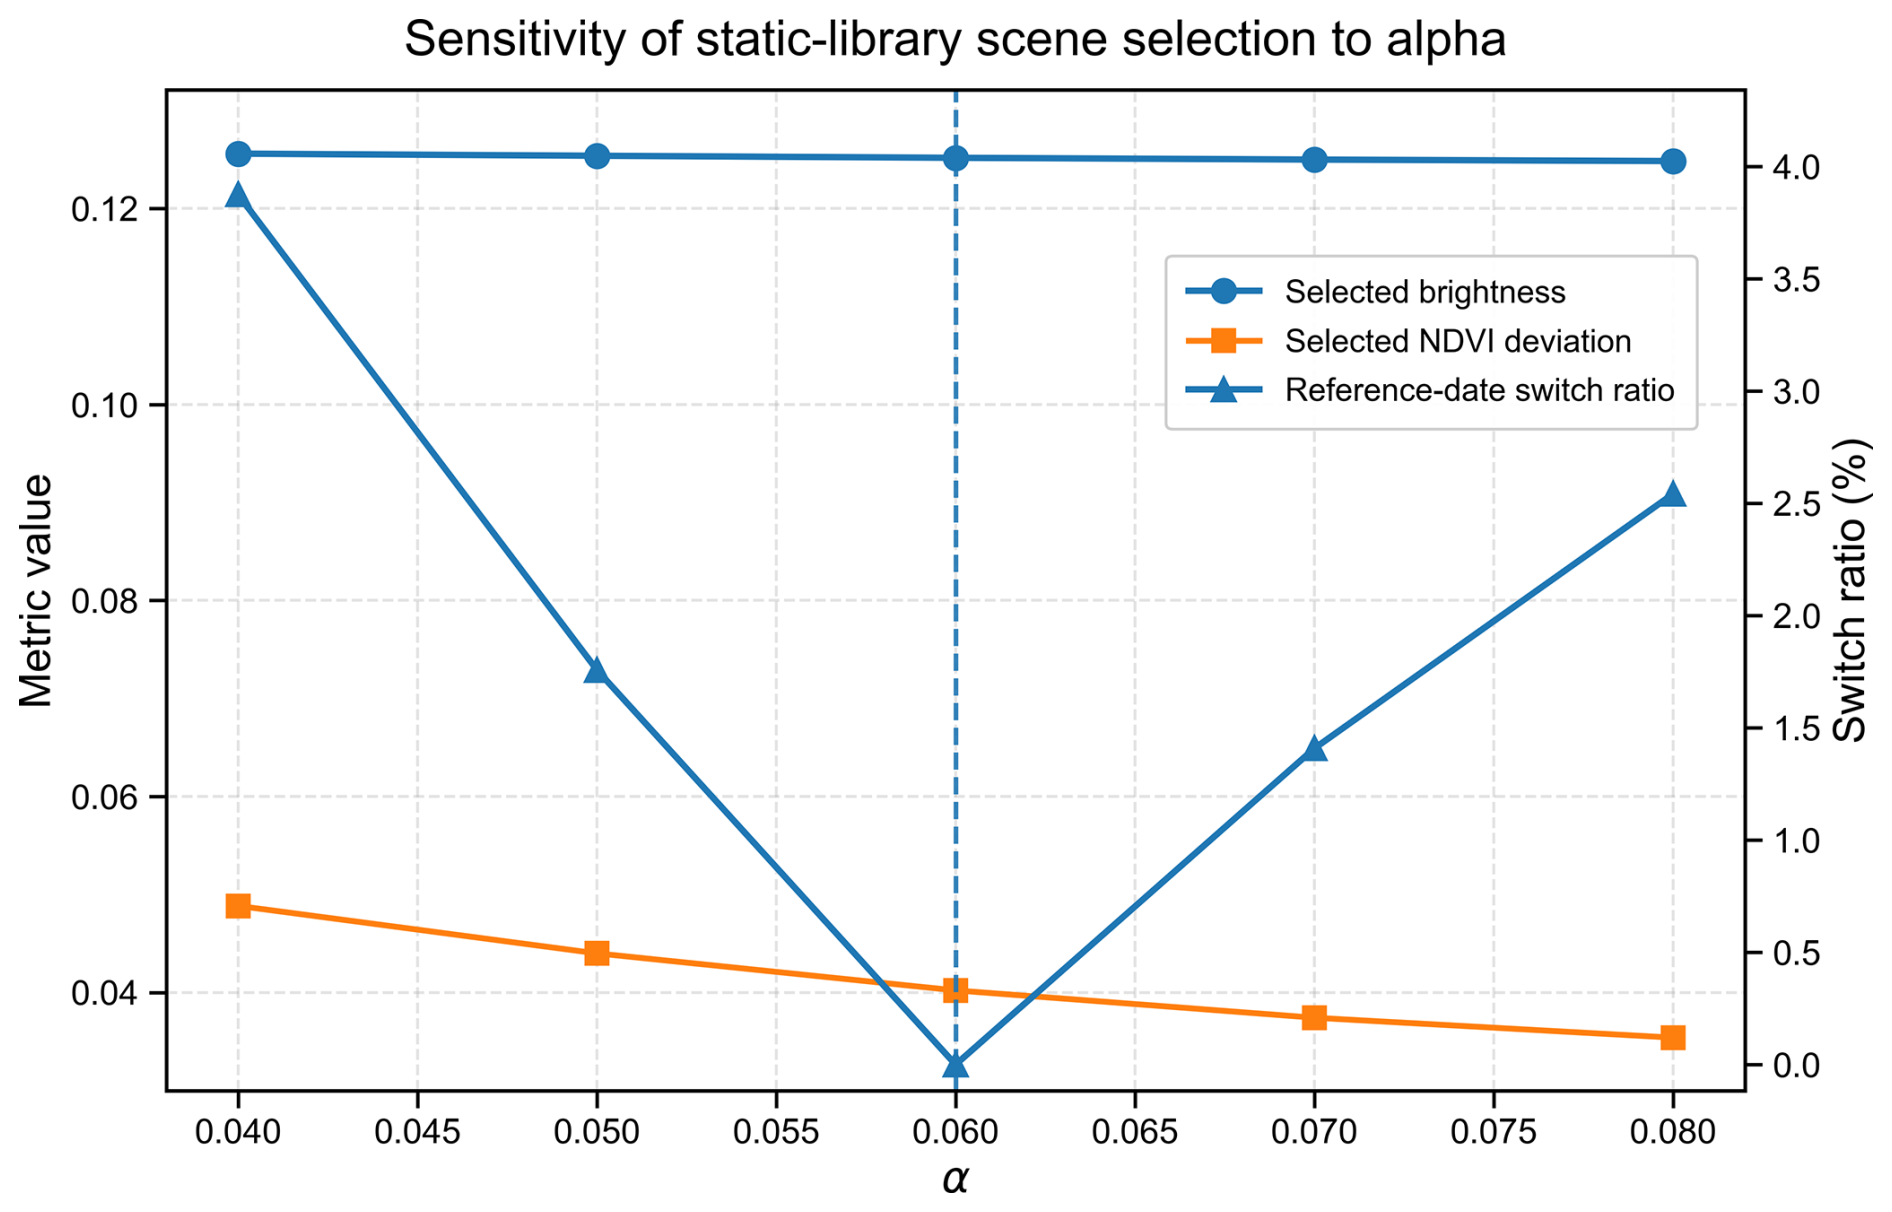
Figure 2Sensitivity analysis of the empirical parameter α used in the pixel-wise reference-date selection for the static surface reflectance prior. The x axis denotes the value of α. The left y axis shows the mean selected brightness and the mean selected NDVI deviation, and the right y axis shows the reference-date switch ratio relative to the default setting (α=0.06).
After the reference date was selected, the blue, green, red, and near-infrared surface reflectance values from that same date were extracted simultaneously as the static prior values. This avoided spectral inconsistency caused by using different reference dates for different bands. For pixels that still had missing values, spatial nearest-neighbor filling was further applied to improve the spatial completeness of the static prior.
3.4 Surface Correction and AOD Retrieval Coupled with Random-Forest Residual Learning
Based on the static multi-band surface reflectance prior, a residual-learning model was constructed for the 0.443 µm blue band to compensate for scene-dependent mismatch between the static blue-band prior and the LUT-derived reference surface term. The blue band was selected as the correction target because it serves as the primary aerosol-sensitive retrieval channel in the current framework and is particularly sensitive to errors in surface characterization over complex land surfaces. Surface-prior mismatch may also occur in the other spectral bands; the present study does not assume these bands to be error-free. Rather, the correction is deliberately focused on the blue band to evaluate whether targeted correction of the surface term in the primary AOD-sensitive channel can improve the subsequent LUT-based AOD retrieval.
Instead of directly fitting AOD with machine learning, this study restricts the learning target to the residual between the static surface prior and the LUT-derived reference blue-band surface term. For a given pixel, the blue-band surface residual is defined as
where denotes the reference blue-band surface reflectance inversely estimated for the AOD-screened reference scenes using the MCD19A2 AOD constraint and the continental-aerosol LUT, and denotes the blue-band surface reflectance from the static prior library.
To ensure the reliability of the residual samples, only pixels satisfying all of the following conditions were retained: valid quality-control flags, valid external AOD within the range 0.01–0.50, and reasonable blue-band TOA reflectance and static surface reflectance. In addition, the LUT-derived reference blue-band surface term was constrained to the range of 0–0.8, and samples with absolute residuals larger than 0.12 were excluded as outliers during residual-sample construction. The residual threshold was used only for offline sample screening to remove extreme discrepancies between the reference surface term and the static prior and does not directly enter the subsequent online AOD inversion.
A random forest (RF) model was used to learn the nonlinear mapping between the blue-band surface reflectance residual and the input features (Breiman, 2001; Wei et al., 2019a). The input features included blue-band surface reflectance from the static library, blue-band TOA reflectance, NDVI derived from red and near-infrared TOA reflectance, solar zenith angle, viewing zenith angle, relative azimuth angle, and elevation. The inclusion of solar and viewing geometry allows the RF to represent geometry-dependent variability in the surface residual empirically. No explicit physical BRDF model is included in the current framework. MCD19A2 AOD is used in the offline derivation of the LUT-derived reference surface term and therefore contributes indirectly to the RF training target. It is not included among the RF input features and is not required during online retrieval.
For the spring configuration, the three reference scenes used for static-prior construction in Sect. 3.3 were also used to generate RF residual-training samples. The scene acquired on 28 April 2025 was reserved for held-out internal validation and was not used for static-prior construction, RF training, feature selection, or hyperparameter tuning. Up to 80 000 pixels were randomly sampled from each training scene, and up to 60 000 pixels were sampled from the validation scene. Following previous studies on random-forest hyperparameters and tuning strategies (Probst et al., 2019), the main RF settings were as follows: 500 trees, maximum depth of 22, minimum leaf size of 40, minimum split size of 80, and maximum feature fraction of 0.7, while other parameters were kept at their default values.
For the autumn–winter configuration, the four reference scenes used to construct the season-specific static prior in Sect. 3.3 were likewise used for RF residual training, following the same leave-one-reference-scene-out strategy. The scene acquired on 21 November 2025 was reserved for held-out internal validation and was not used for static-prior construction or RF training. The residual-learning framework and RF settings were otherwise unchanged.
The detailed residual-sample screening criteria and RF training configuration are summarized in Table S2. Because neighboring pixels are not fully independent, the pixel-level sample size should not be interpreted as the number of independent atmospheric cases; therefore, the residual module was additionally evaluated using a held-out scene, and the final retrieval performance was assessed using independent AERONET station–date matchups.
In the online stage, the blue-band residual was predicted pixel by pixel from WSI observations, observation geometry, elevation, and the static surface prior, and the static prior was then corrected as
where is the RF-predicted blue-band residual and is the corrected blue-band surface reflectance. To prevent unusually large surface corrections from propagating into the subsequent LUT inversion, range constraints were imposed on both the predicted residual and the corrected surface term. Specifically, the RF-predicted residual was limited to as a safeguard against extreme model extrapolation, and the corrected blue-band surface term was constrained to [0,0.8], consistent with the admissible range used for the LUT-derived reference surface term.
The corrected blue-band surface reflectance was then reintroduced into the LUT retrieval framework described in Sect. 3.2, and AOD was retrieved by matching the observed and simulated TOA reflectance. The discrete AOD nodes were set to 0.01, 0.05, 0.10, 0.20, 0.30, 0.40, 0.50, 0.60, 0.80, 1.00, 1.50, 2.00, and 2.50. For each pixel i and aerosol model m, the matching cost was defined as
where A denotes the set of discrete AOD nodes, τ is the candidate AOD, and ρobs and ρsim denote the observed and LUT-simulated TOA reflectance, respectively. The matching cost was not normalized by measurement uncertainty. Retrieval was performed separately under the continental and urban aerosol models, and the model with the lower median Ji,m over all valid pixels was selected at the scene scale. For solutions falling between discrete AOD nodes, local parabolic interpolation was further applied to obtain continuous AOD estimates. A matching-cost threshold of 0.03 was used as a gross-mismatch screening criterion, and pixels satisfying this criterion were retained for subsequent analysis.
A sensitivity check showed that thresholds of 0.01, 0.03, and 0.05 retained 99.86 %, 99.89 %, and 99.94 % of valid inversion pixels, respectively, indicating that retrieval coverage is only weakly sensitive to this criterion. Small isolated patches of retained pixels were removed, and a 3 × 3 median filter was further applied as a spatial post-processing step to improve the stability of the final AOD product.
In this way, a DQ-1 WSI AOD retrieval workflow consisting of “static surface prior–blue-band residual correction–LUT-based physical retrieval” was established, with machine learning applied only to the surface-term correction while the final AOD retrieval remains LUT based.
To further illustrate how the residual-learning model uses the input information, the relative feature importance was calculated using the impurity-based feature importance (mean decrease in impurity, MDI) of the trained random forest model, as shown in Fig. 3. The static blue-band surface prior, solar zenith angle, and blue-band TOA reflectance had the largest relative importance values, accounting for 28.3 %, 24.4 %, and 19.5 %, respectively. Viewing zenith angle and NDVI also contributed to the prediction, whereas relative azimuth angle and elevation had lower importance values. Because correlated predictors may share or redistribute MDI importance, these values are interpreted as descriptive properties of the fitted model rather than as causal effects (Roscher et al., 2020). The effect of the surface-term correction on the intermediate surface term and final AOD retrieval is examined explicitly in Sect. 4.2 and 4.3.
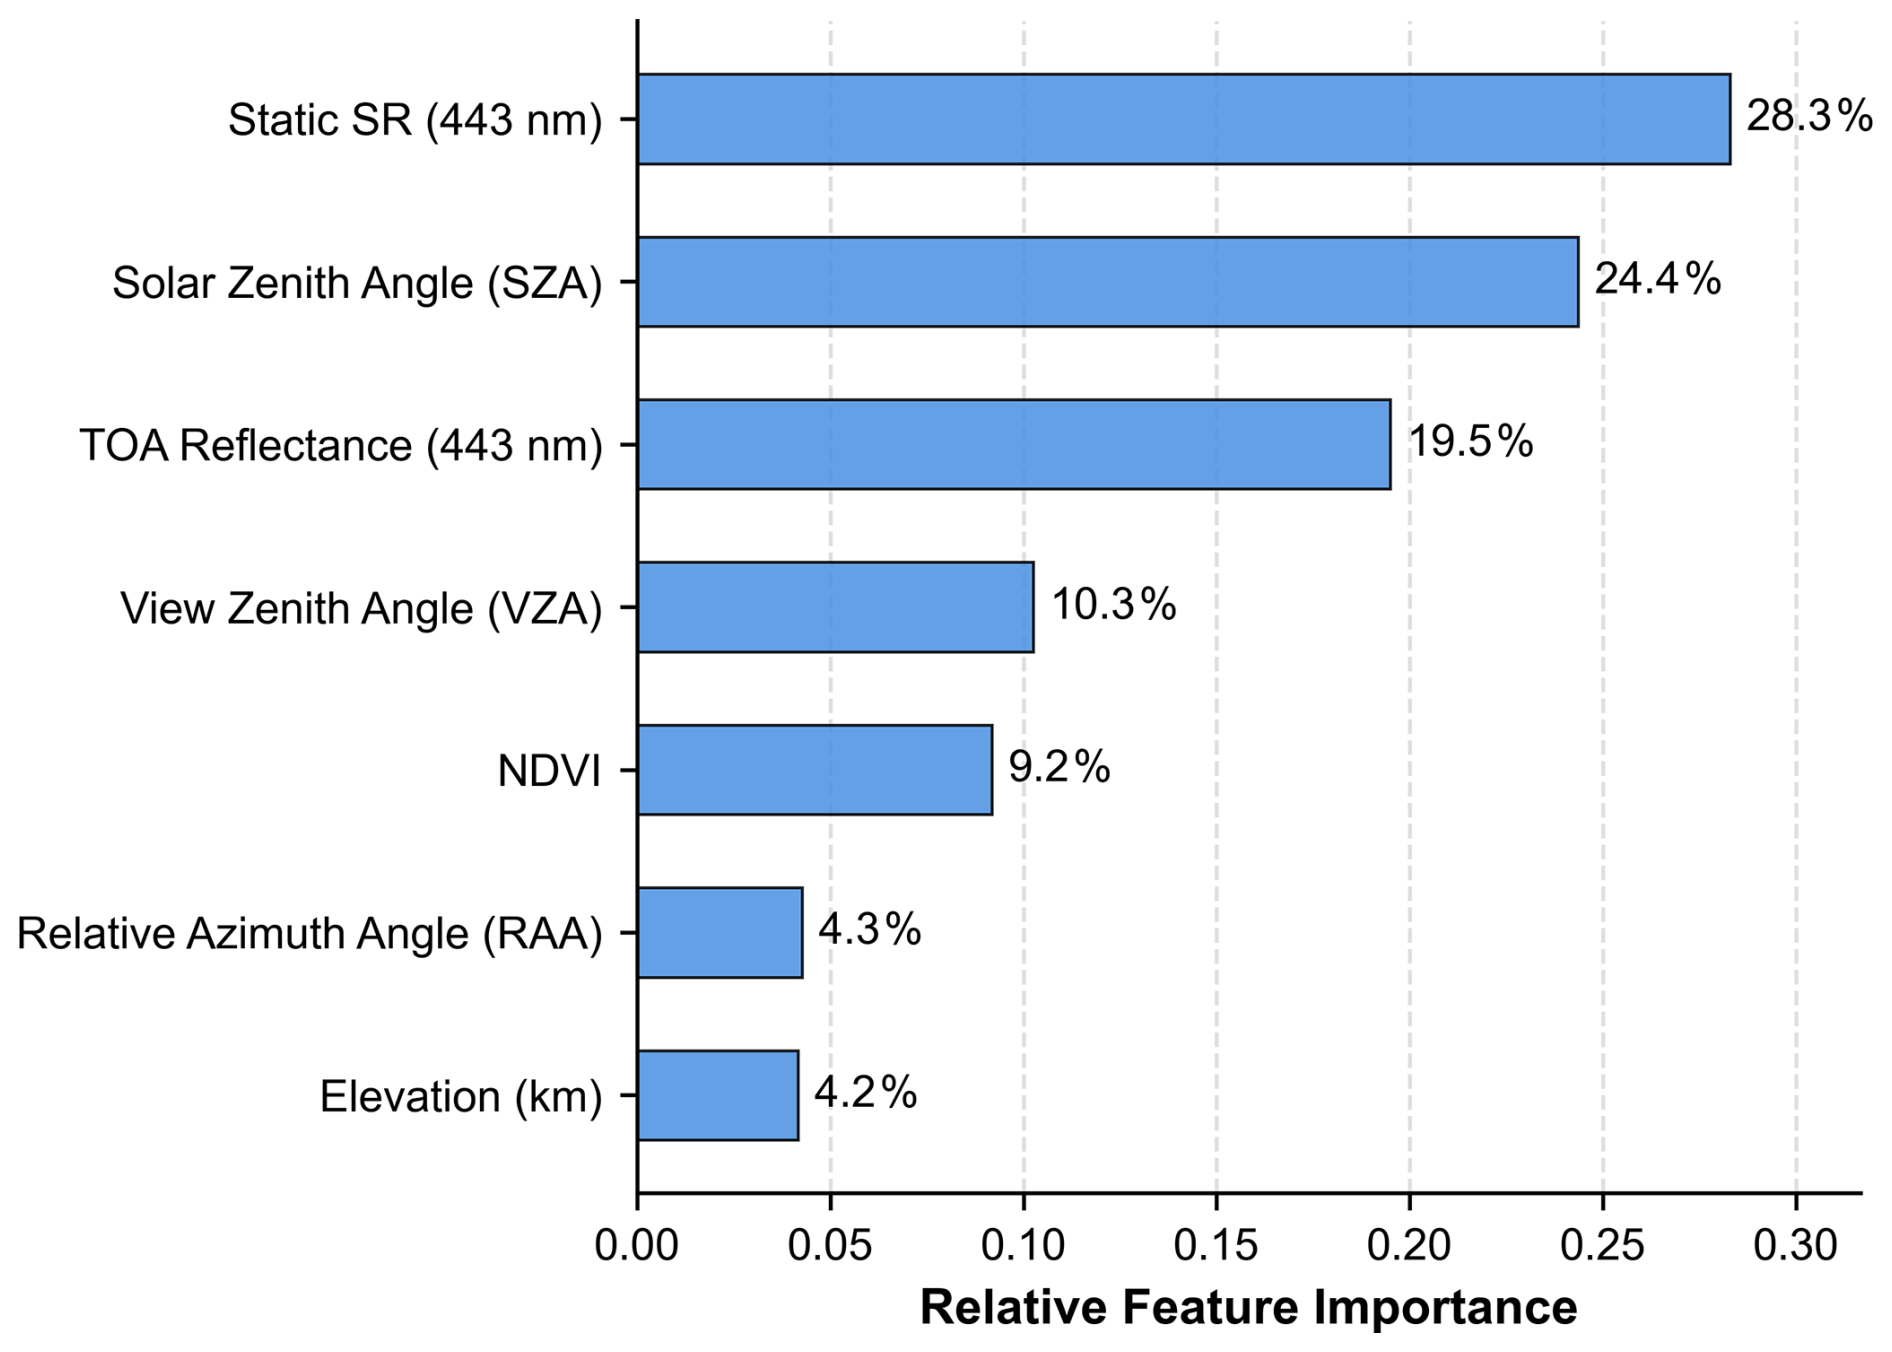
Figure 3Relative importance of the input features used in the blue-band surface-residual learning model. The x axis shows the relative feature importance in the random forest model, and the y axis lists the input variables. Static blue-band surface prior, solar zenith angle, and blue-band TOA reflectance show the largest relative importance values.
4.1 Validation against AERONET
The AERONET matchup strategy is described in Sect. 2.3 and was used to validate the DQ-1 WSI AOD retrievals.
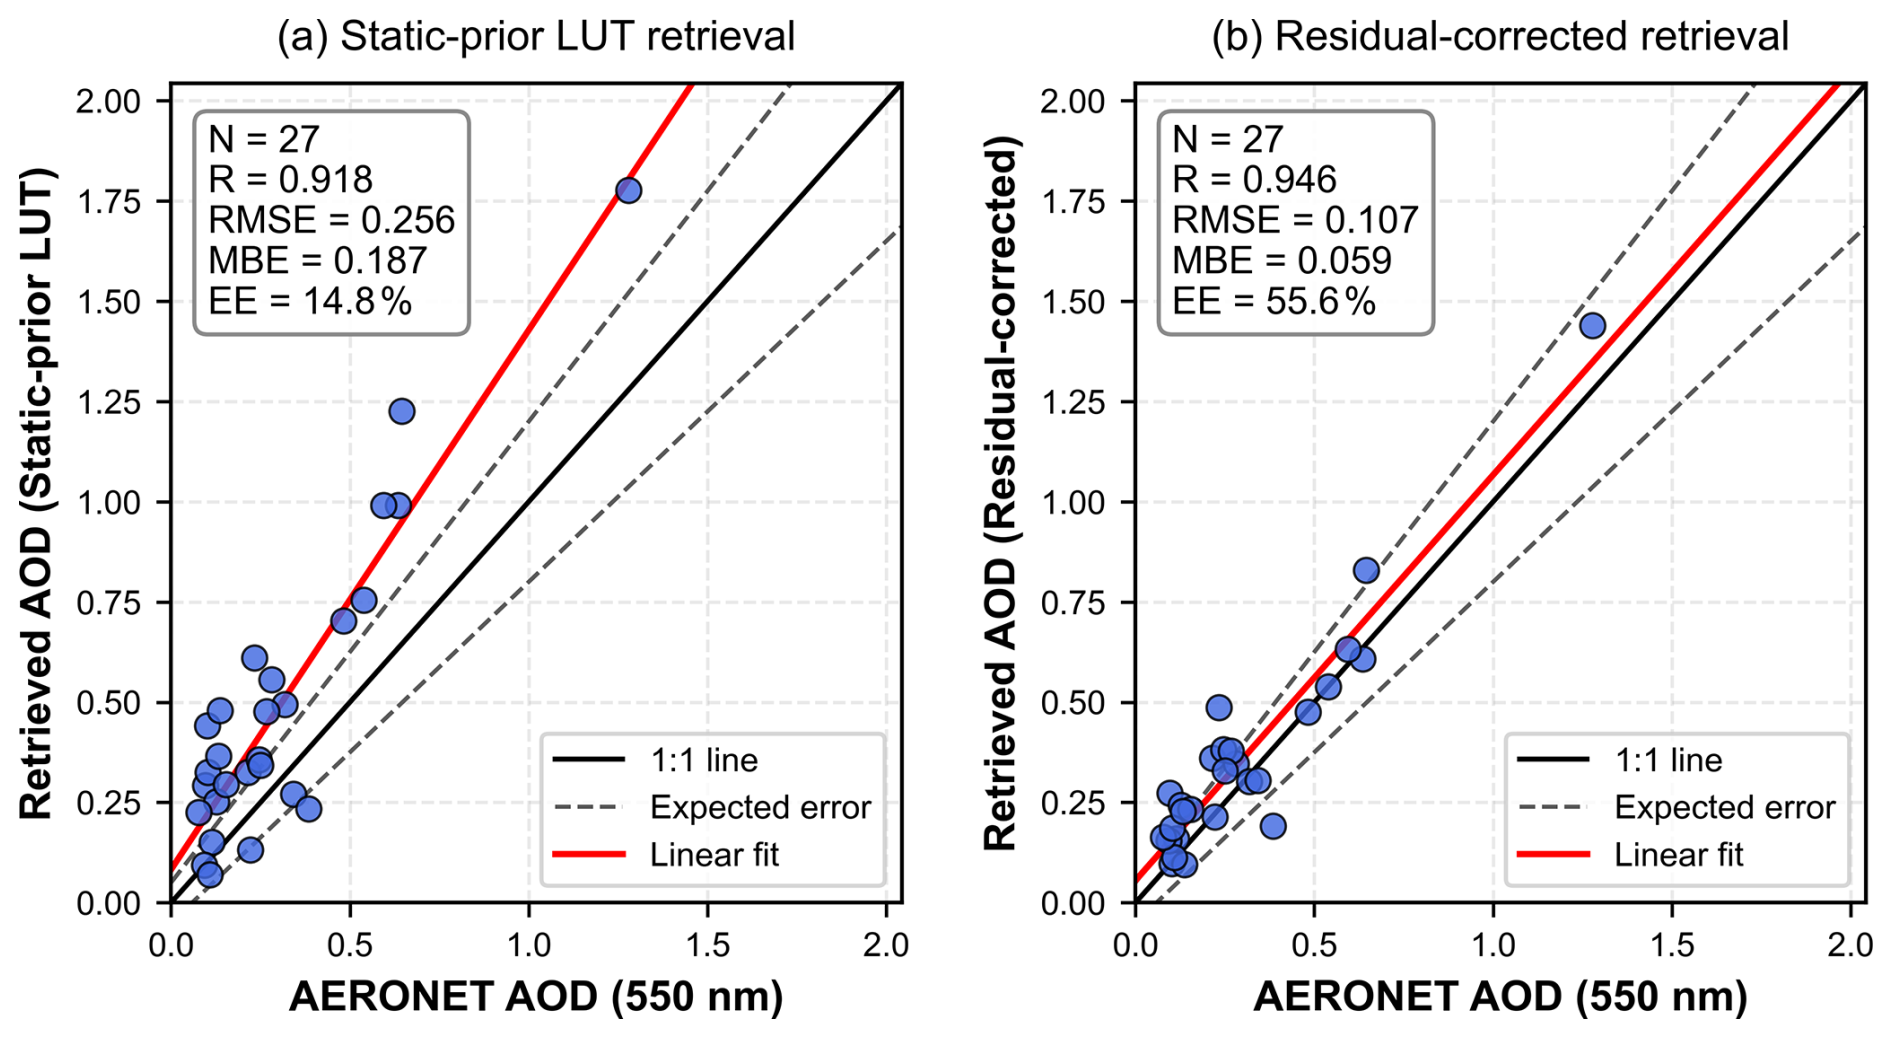
Figure 4AERONET validation of the static-prior LUT retrieval and the residual-corrected retrieval for spring 2025. (a) Static-prior LUT retrieval versus AERONET AOD; (b) residual-corrected retrieval versus AERONET AOD. The black solid line denotes the 1:1 line, the grey dashed lines denote the expected-error envelope, , and the red line denotes the linear fit.
Figure 4 shows the spring 2025 AERONET validation results for the static-prior LUT retrieval and the residual-corrected retrieval. To ensure direct comparability between the two retrievals, the statistics were calculated using only station–date matchups for which both retrievals were valid, resulting in 27 station–date matchups.
The static-prior LUT retrieval shows a relatively high correlation with AERONET, with R = 0.918, but it also exhibits a clear positive bias, with an RMSE of 0.256, an MBE of 0.187, and only 14.8 % of the samples falling within the expected-error envelope. Here, the expected-error (EE) envelope was defined as , following previous satellite AOD validation studies (Sayer et al., 2013), and was used as a common validation benchmark rather than as a DQ-1-specific uncertainty estimate. In contrast, the residual-corrected retrieval shows a scatter distribution closer to the 1:1 line, with R increasing to 0.946, RMSE decreasing to 0.107, MBE decreasing to 0.059, and the fraction within the expected-error envelope increasing to 55.6 %. These results indicate that introducing the blue-band surface residual correction substantially reduces the positive bias and overall retrieval error relative to the static-prior LUT retrieval.
Figure 5 shows the AERONET validation results for autumn–winter 2025. After excluding scenes used for RF training and held-out internal validation, 49 station–date matchups from two AERONET sites were retained, covering 26 independent observation dates. The static-prior LUT retrieval yielded R = 0.927, RMSE = 0.086, and MBE = −0.009, with 67.3 % of the matchups falling within the expected-error envelope. After residual correction, R increased to 0.932, RMSE decreased to 0.071, MBE was 0.009, and the fraction within the expected-error envelope increased to 85.7 %. These results show that the reduction in retrieval error was maintained using a season-specific static prior together with a seasonally adjusted LUT and RF model.
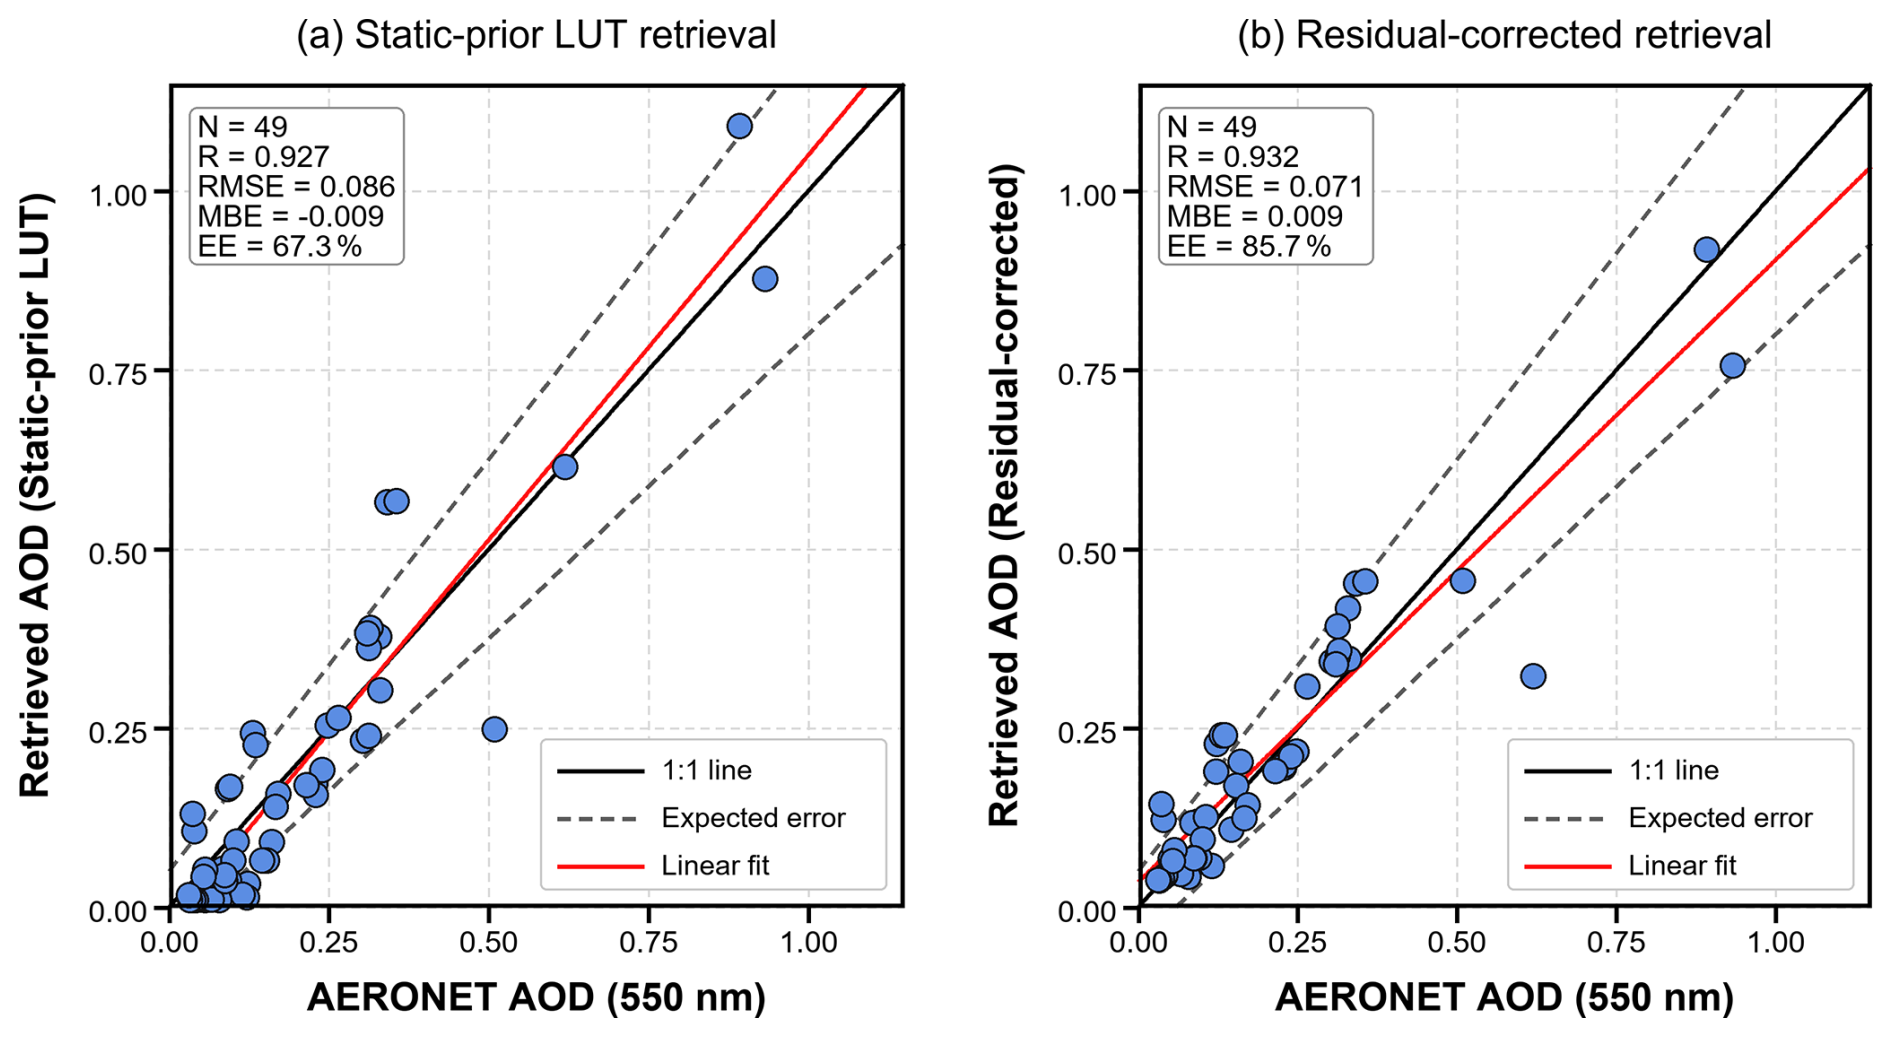
Figure 5AERONET validation of the static-prior LUT retrieval and the residual-corrected retrieval for autumn–winter 2025. (a) Static-prior LUT retrieval versus AERONET AOD; (b) residual-corrected retrieval versus AERONET AOD. The black solid line denotes the 1:1 line, the grey dashed lines denote the expected-error envelope, , and the red line denotes the linear fit.
To examine interannual performance, the spring-2025 retrieval configuration was applied to spring 2026 without using 2026 observations for retraining or recalibration (Fig. 6). The evaluation included 28 station–date matchups from three AERONET sites spanning 17 independent observation dates. The static-prior LUT retrieval yielded R = 0.919, RMSE = 0.330, MBE = 0.269, and 17.9 % of the matchups within the expected-error envelope. After residual correction, R increased to 0.950, RMSE decreased to 0.153, MBE decreased to 0.115, and the fraction within the expected-error envelope increased to 42.9 %. The spring-2025 residual model therefore continued to reduce retrieval error when applied to spring-2026 observations without retraining.
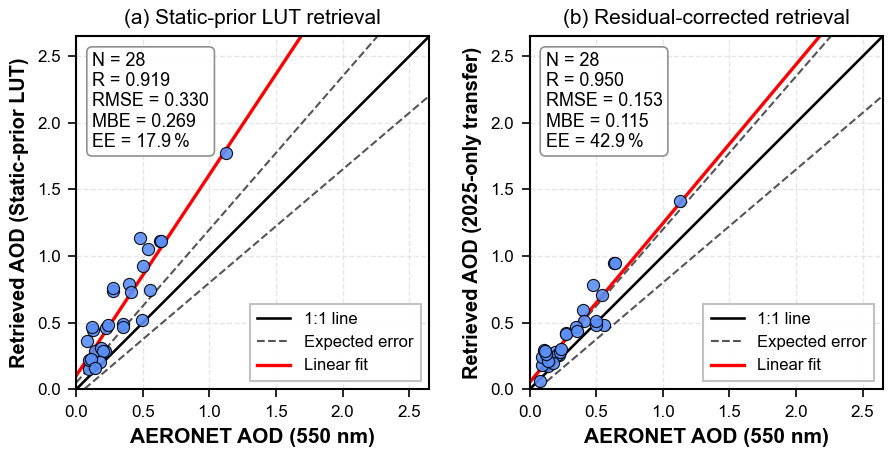
Figure 6AERONET validation of the spring-2026 interannual evaluation. (a) Static-prior LUT retrieval versus AERONET AOD; (b) residual-corrected retrieval using the 2025-only transfer configuration versus AERONET AOD. The black solid line denotes the 1:1 line, the grey dashed lines denote the expected-error envelope, , and the red line denotes the linear fit. No 2026 AERONET observations were used for model retraining or recalibration.
The effects of the surface-term correction on AOD response and regional spatial consistency are examined further in Sect. 4.3 and 4.4.
4.2 Held-out-scene evaluation of the blue-band surface residual correction module
To further examine the blue-band residual correction for the spring configuration, the residual module was evaluated using the held-out scene acquired on 28 April 2025. The LUT-derived reference blue-band surface term does not represent true surface reflectance; it was inversely estimated from DQ-1 WSI TOA reflectance using the MCD19A2-constrained LUT and is used here only to evaluate the mismatch between the static surface prior and the LUT-derived reference surface term.
As shown in Fig. 7, the RF-predicted residual agrees well with the LUT-derived residual, with a correlation coefficient of 0.917 and RMSE and MAE values of 0.0059 and 0.0044, respectively. This indicates that the model can capture both the direction and magnitude of the blue-band surface-term residual. Before correction, the static blue-band surface prior shows only moderate agreement with the reference surface term, with a correlation coefficient of 0.752 and an MAE of 0.0088. After residual correction, the agreement is substantially improved, with the correlation coefficient increasing to 0.951 and the MAE decreasing to 0.0044. The error distribution further shows that the mean absolute difference of the blue-band surface term is reduced by approximately 49.8 % after correction.
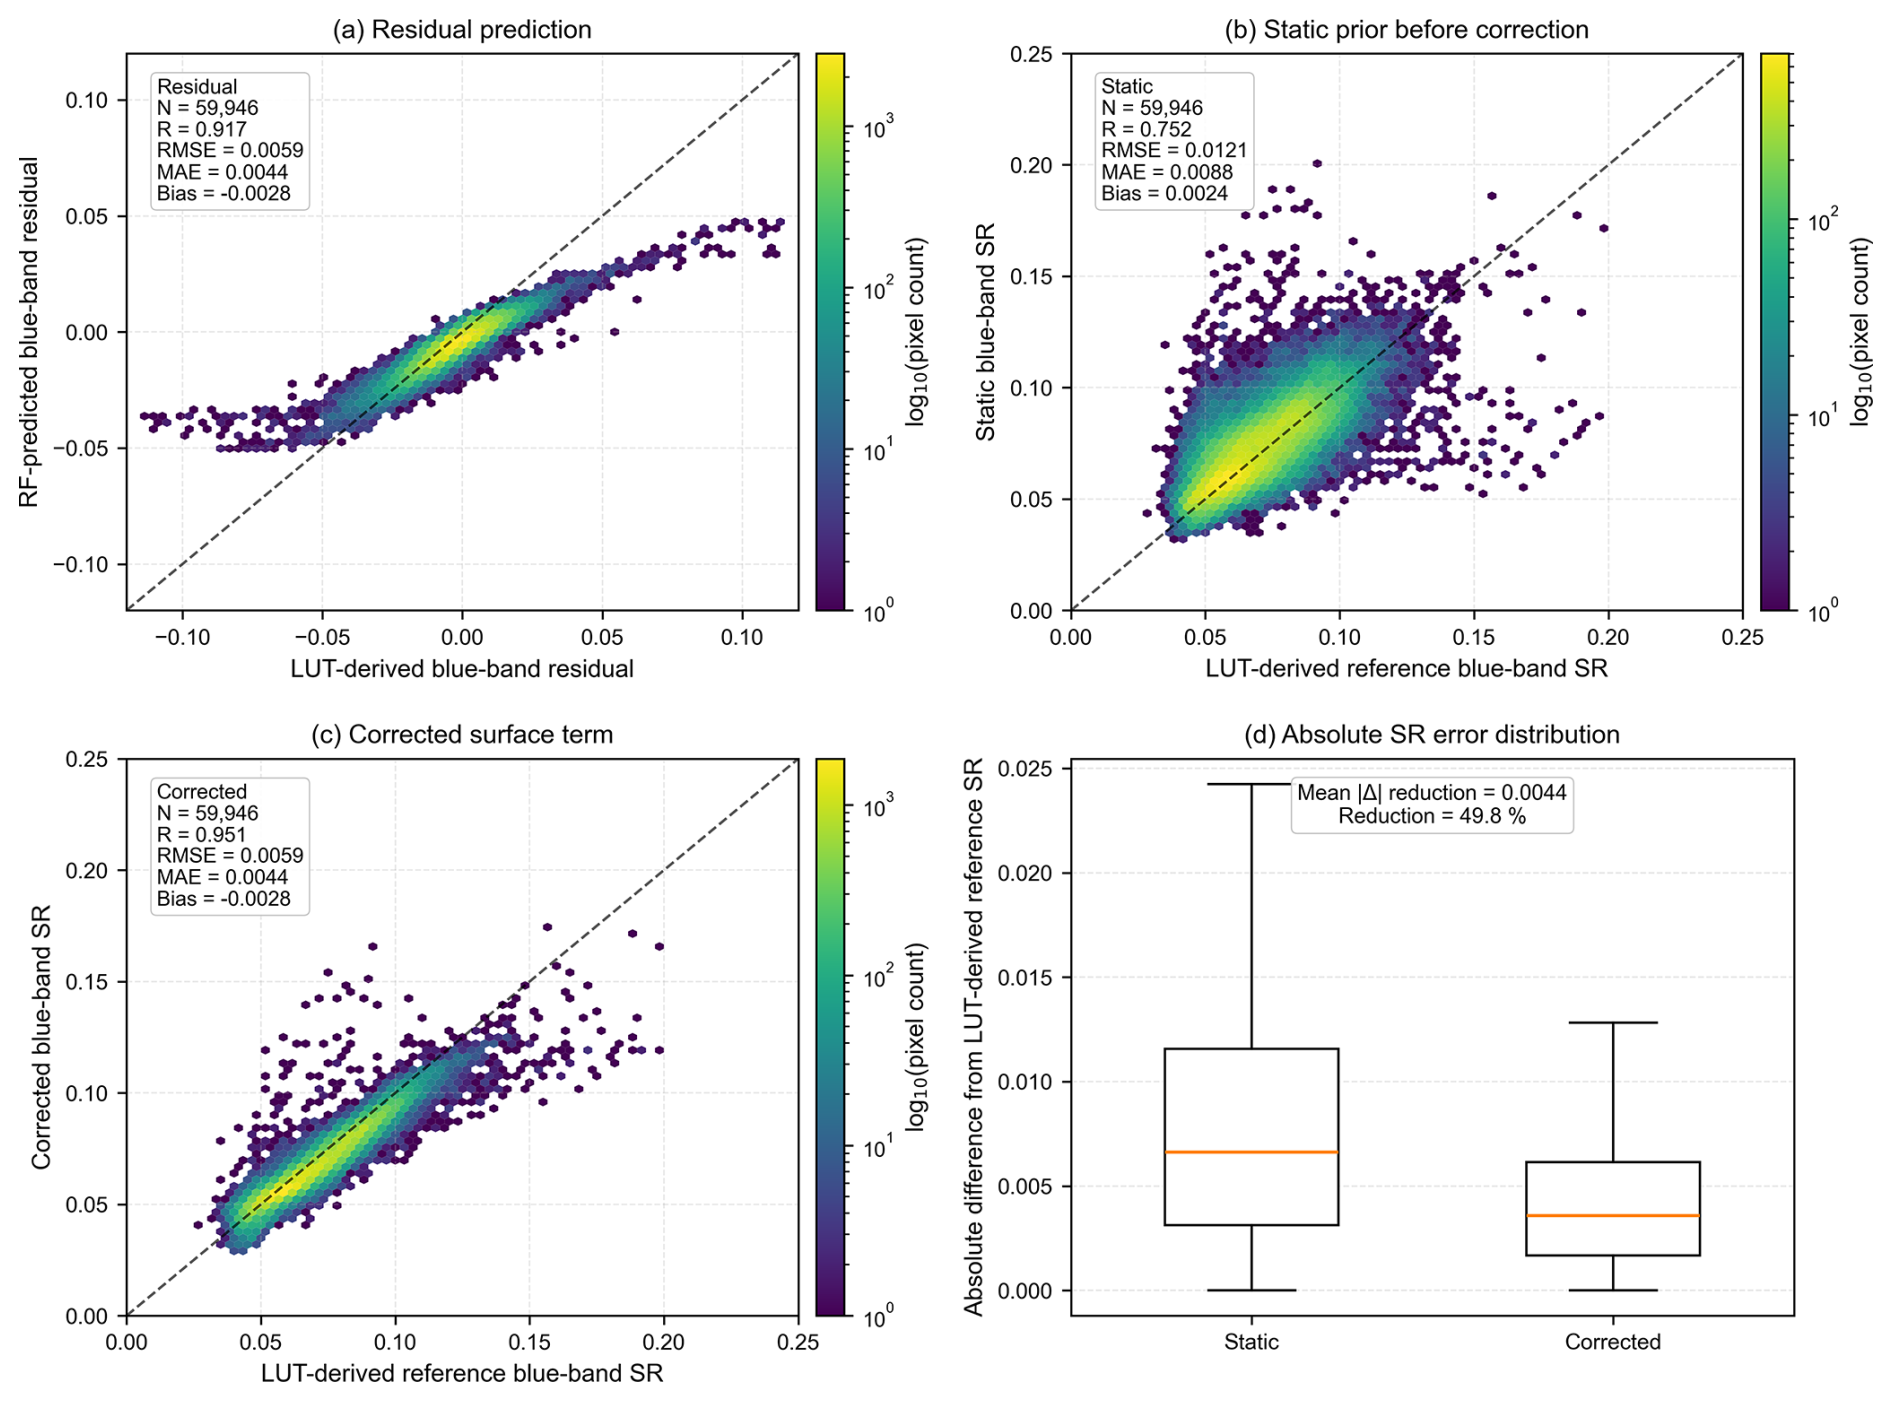
Figure 7Evaluation of the blue-band surface residual correction module on the spring 2025 held-out scene. (a) Relationship between the LUT-derived blue-band surface residual and the RF-predicted residual; (b) relationship between the LUT-derived reference blue-band surface term and the original static blue-band surface prior; (c) relationship between the LUT-derived reference blue-band surface term and the residual-corrected blue-band surface term; (d) distributions of the absolute differences before and after correction relative to the LUT-derived reference surface term. The LUT-derived reference surface term was obtained through LUT inversion constrained by MCD19A2 AOD and is used only to evaluate the correction of surface-prior mismatch; it should not be interpreted as true surface reflectance. The dashed lines denote the 1:1 line.
The correction is applied to the blue-band surface term before the final LUT inversion rather than directly to the retrieved AOD. The held-out-scene results therefore provide intermediate evidence that reducing surface-prior mismatch improves the surface input to the LUT retrieval. This behavior is consistent with the subsequent improvement in AOD accuracy and regional spatial continuity.
4.3 AOD response to blue-band surface-term correction and stratified analysis
Based on the evaluation of the blue-band surface residual correction module, we further examined how the surface-term correction propagates to the final AOD retrieval. For this purpose, the relationship between the change in blue-band surface reflectance and the change in AOD was analyzed by comparing the static-prior LUT retrieval with the residual-corrected retrieval. The surface reflectance change was defined as , and the AOD change was defined as . The results are shown in Fig. 8.
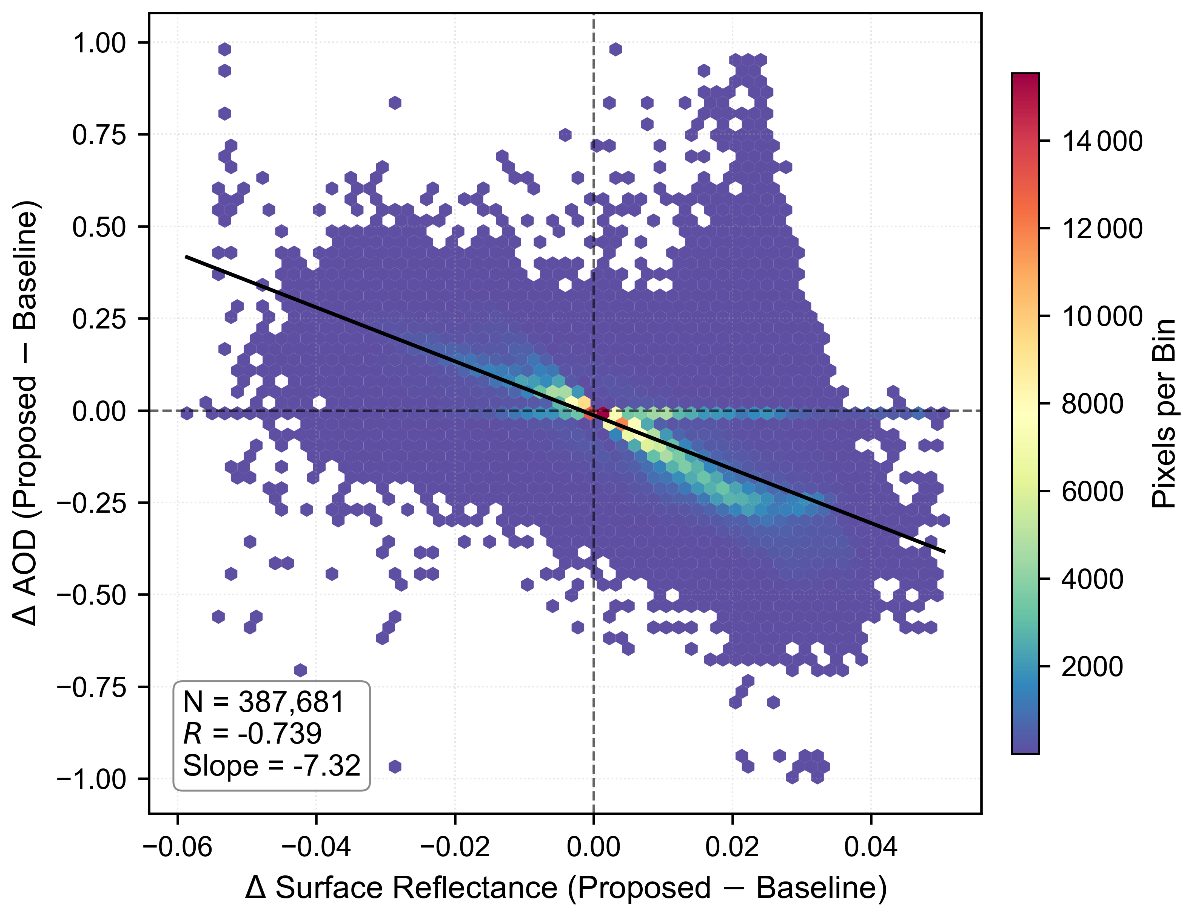
Figure 8Overall relationship between blue-band surface reflectance correction and AOD change. The x axis denotes the change in surface reflectance between the residual-corrected retrieval and the static-prior LUT retrieval, and the y axis denotes the corresponding change in AOD. The color indicates the number of pixels in each hexagonal bin, and the black line denotes the linear fit.
For the full sample, ΔSR and ΔAOD show a clear negative relationship. In other words, when the corrected surface reflectance increases, the retrieved AOD generally decreases; conversely, when the corrected surface reflectance decreases, the retrieved AOD tends to increase. This response direction is consistent with the trade-off between surface-reflected contribution and atmospheric scattering contribution in radiative-transfer-based retrievals. It indicates that correction of the blue-band surface term directly affects the partitioning of the TOA signal between the surface and aerosol components, thereby changing the final AOD estimate. This behavior is also consistent with the critical surface albedo theory, which suggests that surface reflectance errors can be amplified and propagated into aerosol retrievals under specific observational and surface conditions (Seidel and Popp, 2012). Therefore, rather than applying a uniform empirical shift to the AOD results, the residual correction produces AOD changes whose direction is consistent with radiative-transfer expectations. This response supports the interpretation that modifying the blue-band surface term changes the partitioning of the TOA signal between surface reflection and aerosol scattering before the final LUT solution.
The strength of the AOD response to blue-band surface-term correction varies with aerosol loading (Fig. 9). Under low-to-moderate AOD conditions, the negative relationship between ΔSR and ΔAOD is more pronounced. This suggests that, within this range, the TOA signal is still jointly affected by surface reflection and aerosol scattering, so errors in the static surface prior are more likely to propagate into AOD biases. As a result, surface residual correction has a stronger influence on the retrieval. In contrast, under high-AOD conditions, the atmospheric scattering contribution becomes more dominant, and the relative influence of surface-term error on the final solution decreases. Consequently, the response amplitude of ΔAOD to ΔSR is reduced.
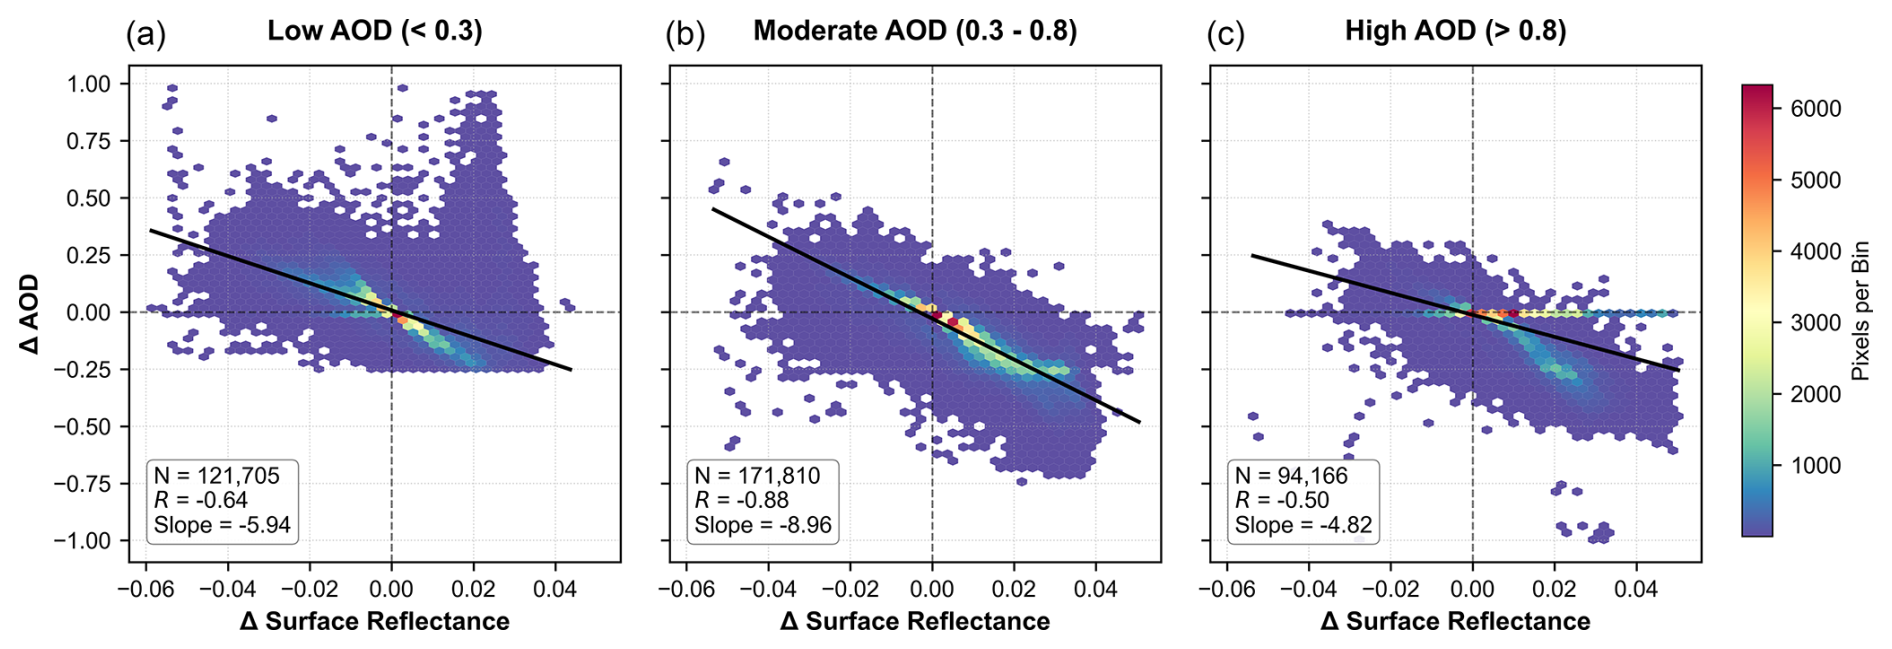
Figure 9Stratified relationship between blue-band surface reflectance correction and AOD change under different AOD loading levels. (a) Low AOD (< 0.3), (b) moderate AOD (0.3–0.8), and (c) high AOD (> 0.8). The x axis denotes the change in surface reflectance between the residual-corrected retrieval and the static-prior LUT retrieval, and the y axis denotes the corresponding change in AOD. The color indicates the number of pixels in each hexagonal bin, and the black line denotes the linear fit.
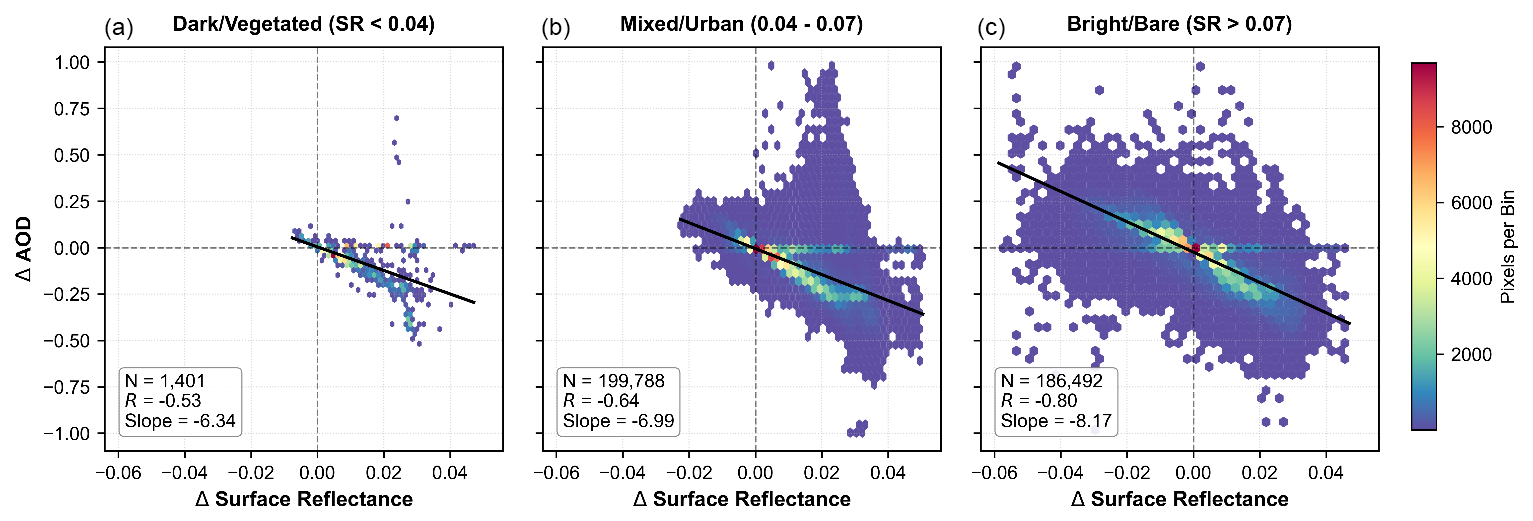
Figure 10Sensitivity of the AOD response to surface reflectance correction under different surface brightness conditions. (a) Dark or vegetated surfaces (SR < 0.04), (b) mixed or urban surfaces (0.04–0.07), and (c) bright or bare surfaces (SR > 0.07). The x axis denotes the change in surface reflectance between the residual-corrected retrieval and the static-prior LUT retrieval, and the y axis denotes the corresponding change in AOD. The color indicates the number of pixels in each hexagonal bin, and the black line denotes the linear fit.
The stratification by surface brightness (Fig. 10) shows that mixed or urban surfaces and bright surfaces exhibit a more pronounced AOD response. In these regions, surface reflectance varies rapidly in space and mixed pixels are more common, making the static surface prior more likely to be mismatched with the actual observation scene. This mismatch can introduce local anomalous high values or spatial speckle into the static-prior LUT retrieval. After blue-band residual correction, the estimated surface contribution changes, and the corresponding AOD estimate is adjusted accordingly. By comparison, over dark or vegetated surfaces, the surface reflectance is lower and the static-prior LUT retrieval is less affected by surface-term mismatch; therefore, the AOD response induced by residual correction is weaker. Previous studies have shown that aerosol retrievals over bright and highly reflective source regions are generally more sensitive to errors in surface reflectance assumptions, further highlighting the importance of accurate surface-term characterization under complex surface conditions (Hsu et al., 2004). The stratified analysis shows a larger AOD response over mixed/urban and bright surfaces, where mismatch in the static prior is more likely. Combined with the ΔSR–ΔAOD response, this pattern is consistent with correction of surface-prior mismatch rather than a uniform shift in retrieved AOD.
4.4 Regional spatial consistency and hold-out-date cross-product consistency with MCD19A2
To examine regional-scale spatial consistency while reducing the effects of resolution and grid differences, the DQ-1 WSI AOD retrievals and MCD19A2 were reprojected to a common grid and aggregated to an approximately 3 km spatial scale before comparison. Pixels with AOD values below 0.05 in either product were excluded; this screen removed 0.96 % of the collocated samples, and omitting it produced only minor changes in the comparison statistics (Table S8). Probable residual-cloud outliers were defined as pixels with DQ-1 AOD > 1.0 and DQ-1 AOD − MCD19A2 AOD > 0.8; this criterion removed 1621 samples (0.80 %).
To visually examine the regional spatial effect of the blue-band surface residual correction, the broader BTH region on 28 May 2025 was selected as a representative scene. Figure 11 presents the DQ-1 WSI true-color image, the static blue-band surface prior, the static-prior LUT AOD, the residual-corrected AOD, and MCD19A2 AOD over the same spatial extent. The scene shows a clear regional AOD gradient and heterogeneous surface conditions, providing a common spatial context for comparing the three AOD fields.
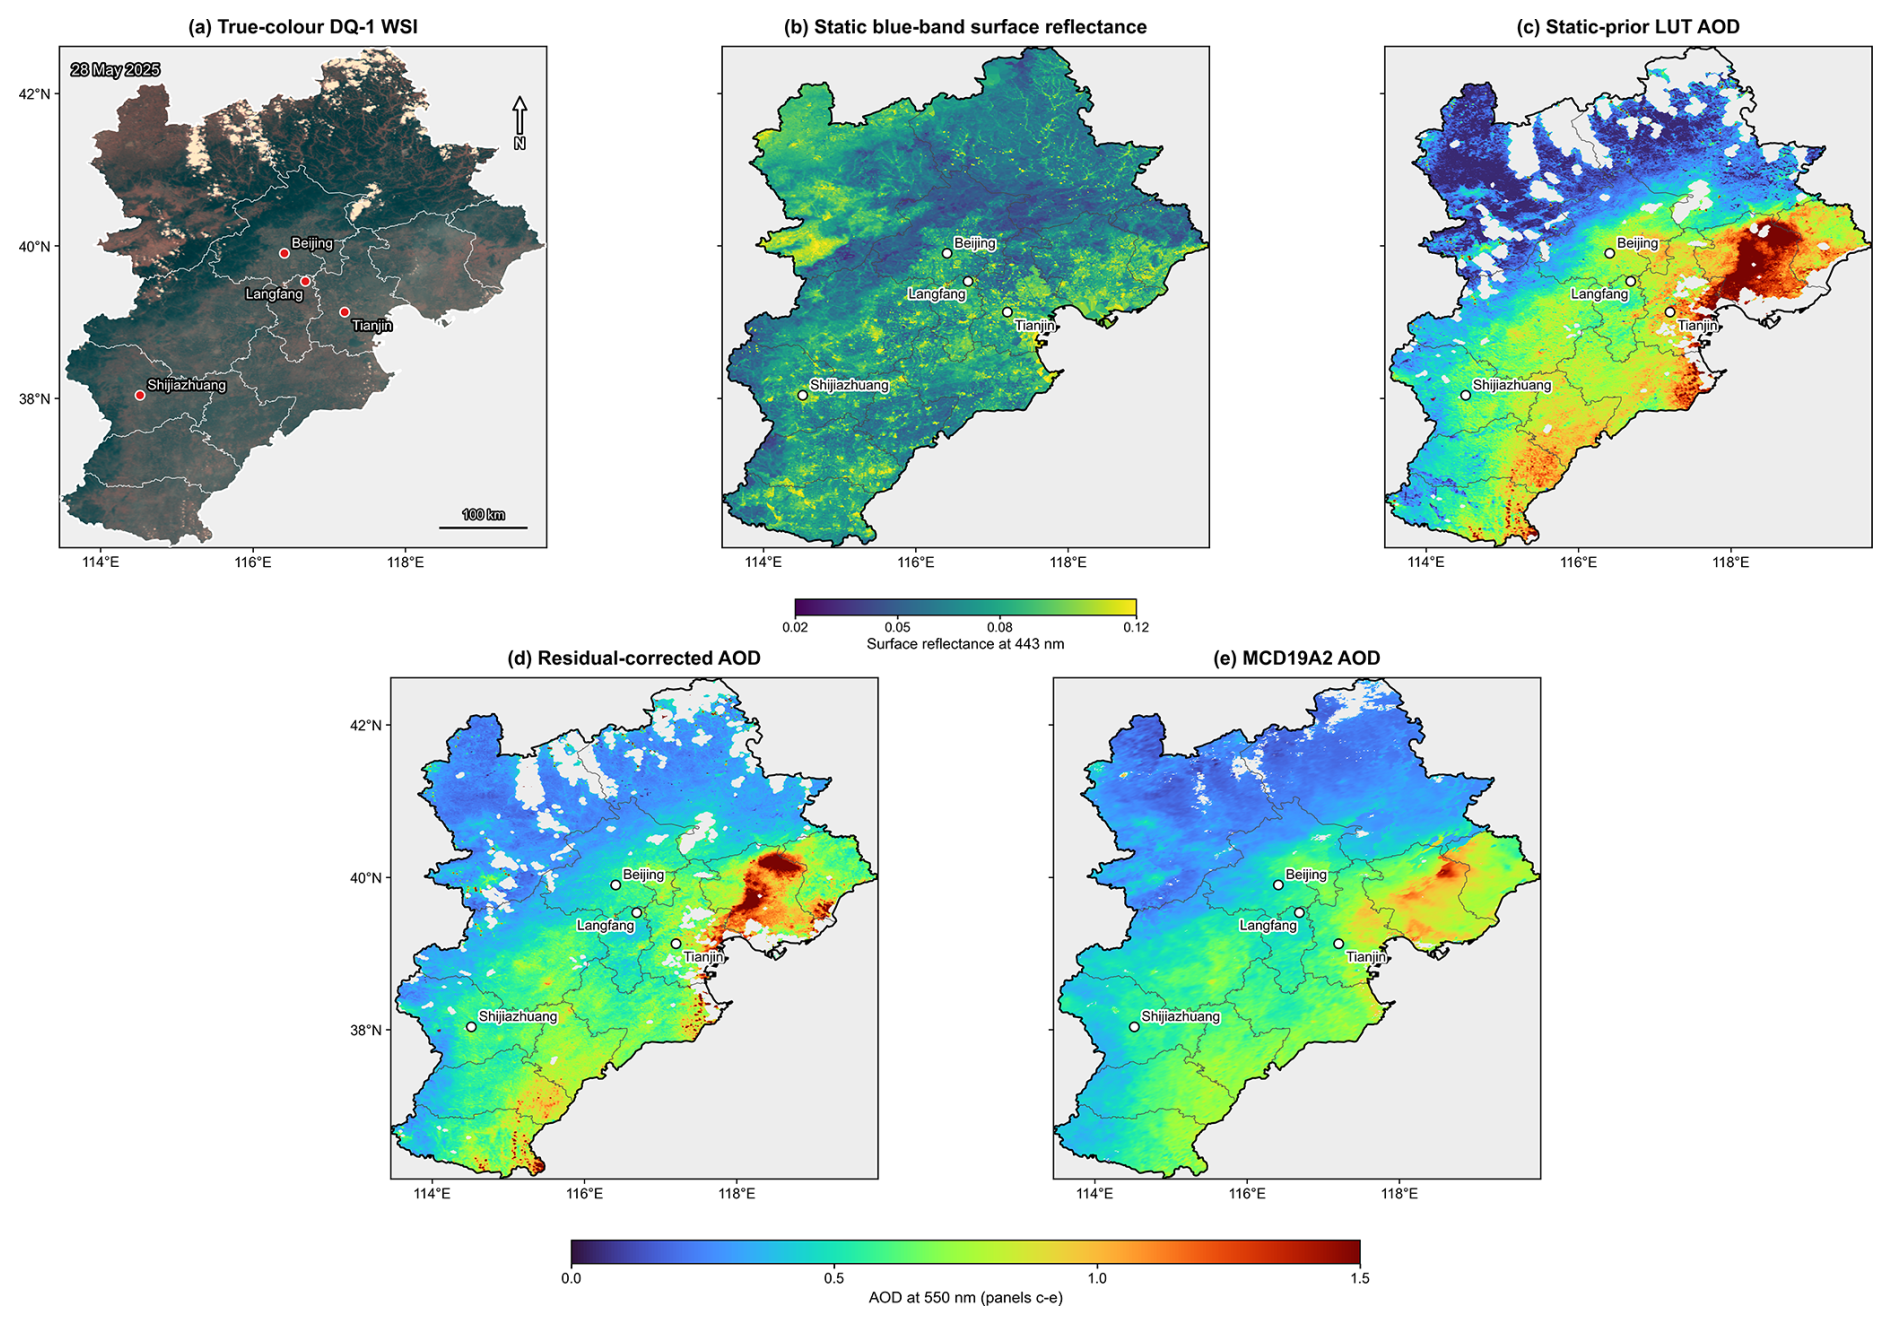
Figure 11Spatial comparison over the broader Beijing–Tianjin–Hebei (BTH) region on 28 May 2025. (a) DQ-1 WSI true-color image; (b) static blue-band surface reflectance used as the surface prior; (c) static-prior LUT AOD; (d) residual-corrected AOD; and (e) MCD19A2 AOD. Panels (c)–(e) use the same AOD color scale. White areas in the AOD panels indicate pixels without valid values after the corresponding quality-control and retrieval masks.
As shown in Fig. 11, the static-prior LUT retrieval contains localized high-AOD features and spatial speckle over parts of the eastern and southeastern BTH region. After residual correction, these features are reduced and the large-scale AOD distribution becomes more spatially continuous, with a regional gradient closer to that shown by MCD19A2. The true-color image also provides scene context for interpreting cloud-affected and masked areas in the DQ-1 WSI retrievals.
Because MCD19A2 and DQ-1 WSI differ in spatial resolution, viewing geometry, retrieval strategy, and quality-control procedure, the comparison is used to examine regional spatial consistency rather than pointwise agreement. Independent retrieval accuracy is evaluated against AERONET. Overall, the regional comparison shows that the residual correction reduces localized anomalous high values and improves the spatial continuity of the DQ-1 WSI AOD field.
A hold-out-date cross-product comparison was also performed using scenes not included in RF training or internal validation. A total of 200 507 collocated spatial samples from 31 independent observation dates were retained. Because neighboring pixels within the same scene are spatially correlated, the pixel count should not be interpreted as the number of statistically independent observations. As shown in Fig. 12, the residual-corrected retrieval showed regional-scale consistency with MCD19A2, with R = 0.863, RMSE = 0.131, MAE = 0.093, MBE = 0.012, and fitted slope and intercept values of 0.99 and 0.01, respectively. This comparison is used to assess cross-product spatial consistency, whereas independent retrieval accuracy is evaluated against AERONET.
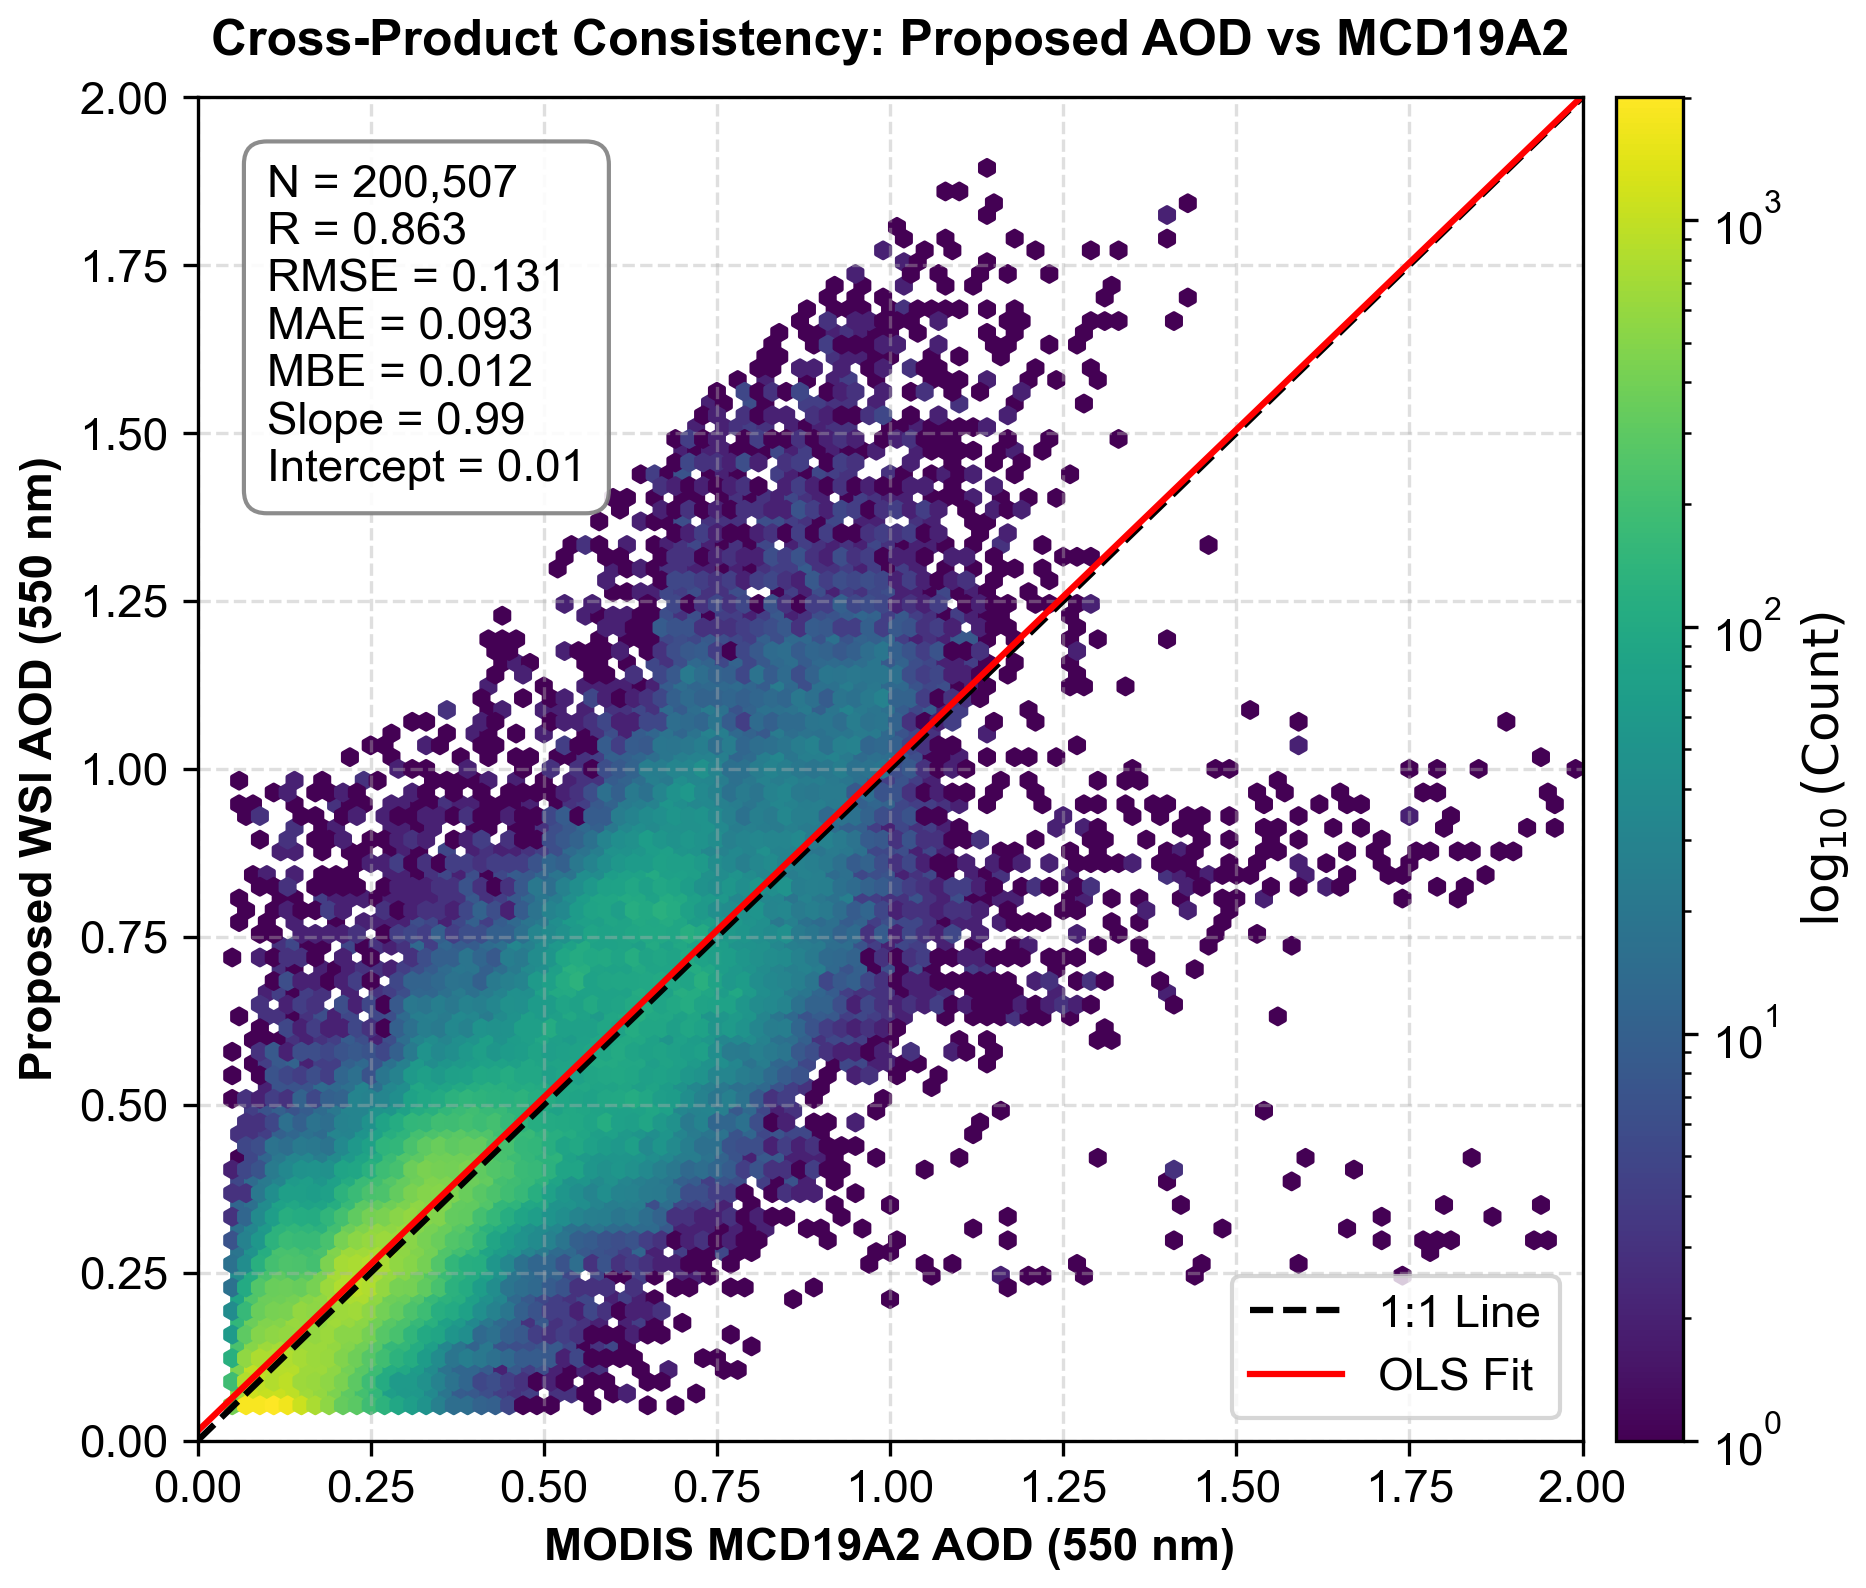
Figure 12Cross-product consistency between the residual-corrected DQ-1 WSI AOD and MCD19A2 after excluding the training and internal validation dates. Dates used for residual-model training and internal validation were excluded from the statistics. The x axis denotes MCD19A2 AOD, and the y axis denotes residual-corrected DQ-1 WSI AOD. The color indicates the logarithmic pixel count, the black dashed line denotes the 1:1 line, and the red line denotes the linear fit.
5.1 Methodological positioning of the DQ-1 WSI AOD retrieval workflow
The main objective of this study is not to replace physical retrieval with machine learning, but to compensate for key surface-term errors that affect the stability of DQ-1 WSI AOD retrieval over complex surfaces. For new sensors with limited temporal accumulation, long-term and stable surface reflectance priors are often not yet available, and clouds, haze, water, snow, and mixed pixels over complex land surfaces further increase the difficulty of generating analysis-ready data and characterizing the surface term. Accordingly, the retrieval workflow combines quality control, static surface-prior construction, blue-band residual correction, and LUT-based AOD inversion.
Within this framework, the unified quality-control procedure provides relatively reliable clear-sky inputs for static surface-prior construction and subsequent retrieval. The multi-band static surface prior inverted from the AOD-screened clear-sky reference scenes provides the basic surface constraint for LUT retrieval. The blue-band residual correction further compensates for the remaining mismatch between the static prior and the actual observation scene. In this way, machine learning is embedded only in the surface-term error correction step, rather than being used to directly fit AOD, thereby improving retrieval stability over complex scenes while preserving radiative-transfer interpretability.
The evaluation results are consistent with this design. AERONET comparisons show lower retrieval error and positive bias after residual correction, while the held-out scene shows closer agreement between the corrected surface term and the LUT-derived reference. The ΔSR–ΔAOD response follows the expected radiative-transfer trade-off, and the regional comparisons show fewer localized high-AOD artifacts and smoother spatial transitions than the static-prior retrieval.
In terms of retrieval response, the influence of the blue-band surface correction is more pronounced over mixed/urban and bright surfaces and under low-to-moderate AOD conditions. In these regions, the static surface prior is more likely to be mismatched with the actual observation scene, making the blue-band surface residual correction more effective. By contrast, over dark surfaces or relatively stable vegetated surfaces, the static-prior LUT retrieval is less affected by surface-term mismatch. Under high-AOD conditions, the atmospheric scattering contribution becomes more dominant, reducing the relative influence of surface-term errors on the final retrieval solution; consequently, the improvement is generally weaker than under low-to-moderate AOD conditions.
Overall, the “static surface prior–blue-band residual correction–LUT physical retrieval” framework provides an interpretable approach for regional DQ-1 WSI AOD retrieval over complex land surfaces in the BTH region. The spring-2025 evaluation establishes the baseline performance, while the autumn–winter 2025 and spring-2026 analyses examine seasonal and interannual performance, respectively. The present study focuses on establishing and evaluating the retrieval workflow rather than on assessing the realism of individual sub-kilometer pollution structures at the 600 m scale.
5.2 Applicability limits and uncertainties
Across the three evaluation periods, the AERONET analysis includes 104 station–date matchups: 27 in spring 2025, 49 from two sites spanning 26 independent observation dates in autumn–winter 2025, and 28 from three sites spanning 17 independent dates in spring 2026. The autumn–winter evaluation was performed using a season-specific static prior together with a seasonally adjusted LUT and RF model, whereas the spring-2026 evaluation used the spring-2025 configuration without retraining or recalibration. These additional evaluations substantially extend the temporal coverage of the original analysis, although validation remains confined to the BTH region and does not constitute a systematic year-round or cross-regional assessment.
MCD19A2 is not treated as an independent accuracy reference because its AOD is used in the offline construction of the LUT-derived reference surface terms and may therefore influence the residual-learning target. AERONET is used for independent accuracy assessment, whereas MCD19A2 is used for regional spatial and hold-out-date consistency analyses.
The autumn–winter 2025 evaluation used a LUT extended to larger solar zenith angles and an RF model retrained with representative autumn–winter scenes. It therefore evaluates performance after seasonal adjustment rather than unchanged cross-season transfer. In contrast, the spring-2026 evaluation used the spring-2025 configuration without retraining or recalibration and examines interannual performance within a similar seasonal regime. Dense summer vegetation, snow-dominated surfaces, and regions outside the BTH domain were not systematically evaluated.
Very thin clouds, semi-transparent cloud edges, and strongly heterogeneous surfaces may still affect blue-band AOD retrieval. Residual cloud contamination may introduce additional blue-band reflectance and affect both surface residual estimation and AOD retrieval (Christensen et al., 2017; Norgren et al., 2022). The current framework also assumes a Lambertian surface. BRDF effects may therefore introduce additional uncertainty under large viewing angles and over high-contrast urban or bare surfaces.
5.3 Future improvements and extension potential
Future work should first extend the seasonal surface-prior and residual-model framework as longer DQ-1 WSI records become available, particularly for dense summer vegetation where phenology and BRDF may differ substantially from the present reference scenes (Shi et al., 2023).
The residual-correction concept could also be extended from the 0.443 µm band to additional visible bands if band-dependent aerosol sensitivity and cross-band error characteristics are explicitly considered (Litvinov et al., 2025).
Explicit BRDF treatment is another priority for wide-swath observations with large viewing-angle variations (Zhou et al., 2024). Broader aerosol-type constraints and more systematic validation over additional regions, seasons, and independent ground-based sites will also be needed before the framework can be evaluated for broader operational application.
This study developed a land AOD retrieval framework for DQ-1 WSI over complex land surfaces in the BTH region by combining a static surface reflectance prior, blue-band surface residual correction, and LUT-based physical inversion. For spring 2025, the residual-corrected retrieval reduced the AERONET-based RMSE from 0.256 to 0.107 and the MBE from 0.187 to 0.059, while increasing the fraction within the expected-error envelope from 14.8 % to 55.6 %. The held-out-scene evaluation further reduced the blue-band surface-term MAE relative to the LUT-derived reference surface term from 0.0088 to 0.0044, supporting the use of residual learning to correct surface-prior mismatch before the physical AOD inversion.
The additional evaluations extend the assessment beyond the initial spring-2025 dataset. For autumn–winter 2025, using a season-specific static prior together with a seasonally adjusted LUT and RF model, the RMSE decreased from 0.086 to 0.071 and the fraction within the expected-error envelope increased from 67.3 % to 85.7 %. When the spring-2025 configuration was applied to spring 2026 without retraining or recalibration, the RMSE decreased from 0.330 to 0.153 and the MBE from 0.269 to 0.115. At the regional scale, the hold-out-date comparison with MCD19A2 included 200 507 spatial samples from 31 independent observation dates and yielded R = 0.863, RMSE = 0.131, and a fitted slope of 0.99.
Taken together, the three AERONET evaluations show that residual correction reduced retrieval error under the BTH conditions examined here. The autumn–winter evaluation required seasonal adjustment of the LUT and RF model, whereas the spring-2026 experiment retained the spring-2025 configuration and still reduced RMSE and positive bias. These results do not establish year-round or cross-regional transferability. Further evaluation should therefore target additional surface and aerosol regimes, BRDF effects, and longer independent observational records outside BTH.
The code used for QA-mask generation, blue-band surface-residual learning, and LUT-based AOD retrieval is available from the corresponding author upon reasonable request. AERONET Version 3 observations are publicly available from the NASA AERONET data portal (https://aeronet.gsfc.nasa.gov/, last access: 26 October 2026). The MODIS MAIAC MCD19A2 Version 6.1 aerosol product is publicly available from NASA Earthdata under DOI https://doi.org/10.5067/MODIS/MCD19A2.061 (Lyapustin and Wang, 2022). DQ-1 WSI data used in this study were obtained from the China Centre for Resources Satellite Data and Application (CRESDA) data portal (https://data.cresda.cn/, last access: 26 October 2026) and remain subject to its data-access policy. The official DQ-1 radiometric calibration coefficients and spectral response information are available from the CRESDA calibration-data webpage (https://www.cresda.cn/zgzywxyyzx/zlxz/0107/20250107110105361912927_pc.html, last access: 26 October 2026). The processed matchup data, validation statistics, and figure data generated in this study are available from the corresponding author upon reasonable request.
The supplement related to this article is available online at https://doi.org/10.5194/amt-19-6805-2026-supplement.
JXZ designed the study, developed the retrieval algorithm, processed the DQ-1 WSI, AERONET, and MCD19A2 data, performed the experiments, analyzed the results, prepared the figures, and wrote the original manuscript. YJW contributed to manuscript formatting, editorial checking, and discussion of the research direction. MJZ contributed to data preprocessing and validation. LLW contributed to the organization of satellite and ground-based reference data. SD contributed to figure preparation and statistical analysis. XCY contributed to manuscript revision, formatting, and editorial checking. PFM supervised the study, contributed to the interpretation of the results, and revised the manuscript. HC contributed to methodological discussion and validation design, provided funding support, and revised the manuscript. WJZ supervised the study, contributed to project administration, and critically revised the manuscript. All authors reviewed and approved the final manuscript.
The contact author has declared that none of the authors has any competing interests.
Publisher's note: Copernicus Publications remains neutral with regard to jurisdictional claims made in the text, published maps, institutional affiliations, or any other geographical representation in this paper. The authors bear the ultimate responsibility for providing appropriate place names. Views expressed in the text are those of the authors and do not necessarily reflect the views of the publisher.
The authors thank the AERONET team and site principal investigators for providing the ground-based aerosol observations. The authors also acknowledge the MODIS MAIAC team for providing the MCD19A2 aerosol product. The authors thank the China Centre for Resources Satellite Data and Application (CRESDA) for providing the DQ-1 WSI data and associated radiometric calibration information.
This research has been supported by the Natural Science Foundation of Beijing Municipality (grant no. L241082).
This paper was edited by Luca Lelli and reviewed by two anonymous referees.
Bilal, M., Qiu, Z., and Lu, X.: A simplified high resolution MODIS Aerosol Retrieval Algorithm (SARA) for use over mixed surfaces, Remote Sens. Environ., 136, 135–145, https://doi.org/10.1016/j.rse.2013.04.014, 2013.
Breiman, L.: Random forests, Mach. Learn., 45, 5–32, https://doi.org/10.1023/A:1010933404324, 2001.
Cao, J.: Geometric calibration of the whiskbroom DaQi-1 WSI based on an equivalent linear-array CCD, IEEE T. Geosci. Remote, 61, 5616713, https://doi.org/10.1109/TGRS.2023.3300013, 2023.
Che, H., Xia, X., Zhu, J., Wang, H., Wang, Y., Sun, J., Zhang, X., and Shi, G.: Aerosol optical properties under the condition of heavy haze over an urban site of Beijing, China, Environ. Sci. Pollut. R., 22, 1043–1053, https://doi.org/10.1007/s11356-014-3415-5, 2015.
Christensen, M. W., Neubauer, D., Poulsen, C. A., Thomas, G. E., McGarragh, G. R., Povey, A. C., Proud, S. R., and Grainger, R. G.: Unveiling aerosol–cloud interactions – Part 1: Cloud contamination in satellite products enhances the aerosol indirect forcing estimate, Atmos. Chem. Phys., 17, 13151–13164, https://doi.org/10.5194/acp-17-13151-2017, 2017.
Dai, G., Wu, S., Long, W., Liu, J., Xie, Y., Sun, K., Meng, F., Song, X., Huang, Z., and Chen, W.: Aerosol and cloud data processing and optical property retrieval algorithms for the spaceborne ACDL/DQ-1, Atmos. Meas. Tech., 17, 1879–1890, https://doi.org/10.5194/amt-17-1879-2024, 2024.
Dong, Y., Li, J., Zhang, Z., Zheng, Y., Zhang, C., and Li, Z.: Machine learning-based retrieval of aerosol and surface properties over land from the Gaofen-5 Directional Polarimetric Camera measurements, IEEE T. Geosci. Remote, 62, 1–14, https://doi.org/10.1109/TGRS.2024.3419169, 2024.
Giles, D. M., Sinyuk, A., Sorokin, M. G., Schafer, J. S., Smirnov, A., Slutsker, I., Eck, T. F., Holben, B. N., Lewis, J. R., Campbell, J. R., Welton, E. J., Korkin, S. V., and Lyapustin, A. I.: Advancements in the Aerosol Robotic Network (AERONET) Version 3 database – automated near-real-time quality control algorithm with improved cloud screening for Sun photometer aerosol optical depth (AOD) measurements, Atmos. Meas. Tech., 12, 169–209, https://doi.org/10.5194/amt-12-169-2019, 2019.
Holben, B. N., Eck, T. F., Slutsker, I., Tanré, D., Buis, J. P., Setzer, A., Vermote, E., Reagan, J. A., Kaufman, Y. J., Nakajima, T., Lavenu, F., Jankowiak, I., and Smirnov, A.: AERONET – A federated instrument network and data archive for aerosol characterization, Remote Sens. Environ., 66, 1–16, https://doi.org/10.1016/S0034-4257(98)00031-5, 1998.
Hsu, N. C., Tsay, S. C., King, M. D., and Herman, J. R.: Aerosol properties over bright-reflecting source regions, IEEE T. Geosci. Remote, 42, 557–569, https://doi.org/10.1109/TGRS.2004.824067, 2004.
Hsu, N. C., Jeong, M. J., Bettenhausen, C., Sayer, A. M., Hansell, R., Seftor, C. S., Huang, J., and Tsay, S. C.: Enhanced Deep Blue aerosol retrieval algorithm: the second generation, J. Geophys. Res.-Atmos., 118, 9296–9315, https://doi.org/10.1002/jgrd.50712, 2013.
Intergovernmental Panel on Climate Change (IPCC): Short-lived climate forcers, in: Climate Change 2021 – The Physical Science Basis: Working Group I Contribution to the Sixth Assessment Report of the Intergovernmental Panel on Climate Change, Cambridge University Press, 817–922, https://doi.org/10.1017/9781009157896.008, 2023.
Kaufman, Y. J., Wald, A. E., Remer, L. A., Gao, B. C., Li, R. R., and Flynn, L. E.: The MODIS 2.1 µm channel – correlation with visible reflectance for use in remote sensing of aerosol, IEEE T. Geosci. Remote, 35, 1286–1298, https://doi.org/10.1109/36.628795, 1997.
Knapp, K. R., Frouin, R., Kondragunta, S., and Prados, A.: Toward aerosol optical depth retrievals over land from GOES visible radiances: determining surface reflectance, Int. J. Remote Sens., 26, 4097–4116, https://doi.org/10.1080/01431160500099329, 2005.
Kotchenova, S. Y., Vermote, E. F., Matarrese, R., and Klemm, F. J.: Validation of a vector version of the 6S radiative transfer code for atmospheric correction of satellite data. Part I: Path radiance, Appl. Optics, 45, 6762–6774, https://doi.org/10.1364/AO.45.006762, 2006.
Lemmouchi, F., Cuesta, J., Lachatre, M., Brajard, J., Coman, A., Beekmann, M., and Derognat, C.: Machine learning-based improvement of aerosol optical depth from CHIMERE simulations using MODIS satellite observations, Remote Sens., 15, 1510, https://doi.org/10.3390/rs15061510, 2023.
Levy, R. C., Mattoo, S., Munchak, L. A., Remer, L. A., Sayer, A. M., Patadia, F., and Hsu, N. C.: The Collection 6 MODIS aerosol products over land and ocean, Atmos. Meas. Tech., 6, 2989–3034, https://doi.org/10.5194/amt-6-2989-2013, 2013.
Liang, T., Liang, S., Zou, L., Sun, L., Li, B., Lin, H., He, T., and Tian, F.: Estimation of aerosol optical depth at 30 m resolution using Landsat imagery and machine learning, Remote Sens., 14, 1053, https://doi.org/10.3390/rs14051053, 2022.
Litvinov, P., Chen, C., Dubovik, O., Zhai, S., Matar, C., Li, C., Lopatin, A., Fuertes, D., Lapyonok, T., Bindreiter, L., Dornacher, M., Lehner, A., Dandocsi, A., Gasbarra, D., and Retscher, C.: Synergetic retrieval from multi-mission spaceborne measurements for enhanced aerosol and surface characterization, Atmos. Meas. Tech., 18, 7679–7716, https://doi.org/10.5194/amt-18-7679-2025, 2025.
Lucht, W., Schaaf, C. B., and Strahler, A. H.: An algorithm for the retrieval of albedo from space using semiempirical BRDF models, IEEE T. Geosci. Remote, 38, 977–998, https://doi.org/10.1109/36.841980, 2000.
Luo, N., Zhang, Y., Jiang, Y., Zuo, C., Chen, J., Zhao, W., Shi, W., and Yan, X.: Unveiling global land fine- and coarse-mode aerosol dynamics from 2005 to 2020 using enhanced satellite-based monthly inversion data, Environ. Pollut., 348, 123838, https://doi.org/10.1016/j.envpol.2024.123838, 2024a.
Luo, N., Zou, J., Zhang, Z., Chen, T., and Yan, X.: Wide and deep learning model for satellite-based real-time aerosol retrievals in China, Atmosphere, 15, 564, https://doi.org/10.3390/atmos15050564, 2024b.
Lyapustin, A. and Wang, Y.: MODIS/Terra+Aqua Land Aerosol Optical Depth Daily L2G Global 1km SIN Grid V061, NASA Land Processes Distributed Active Archive Center [data set], https://doi.org/10.5067/MODIS/MCD19A2.061, 2022.
Lyapustin, A., Wang, Y., Korkin, S., and Huang, D.: MODIS Collection 6 MAIAC algorithm, Atmos. Meas. Tech., 11, 5741–5765, https://doi.org/10.5194/amt-11-5741-2018, 2018.
Man, W., Tao, M., Xu, L., Xu, X., Jiang, J., Wang, J., Wang, L., Wang, Y., Fan, M., and Chen, L.: Improving aerosol retrieval from MISR with a physics-informed deep learning method, IEEE T. Geosci. Remote, 62, 1–11, https://doi.org/10.1109/TGRS.2024.3376598, 2024.
Norgren, M. S., Wood, J., Schmidt, K. S., van Diedenhoven, B., Stamnes, S. A., Ziemba, L. D., Crosbie, E. C., Shook, M. A., Kittelman, A. S., LeBlanc, S. E., Broccardo, S., Freitag, S., and Reid, J. S.: Above-aircraft cirrus cloud and aerosol optical depth from hyperspectral irradiances measured by a total-diffuse radiometer, Atmos. Meas. Tech., 15, 1373–1394, https://doi.org/10.5194/amt-15-1373-2022, 2022.
Peng, R., Wang, Q., Jia, K., Cao, B., Dong, W., Chen, Z., Chen, J., and Yan, X.: Satellite On-Orbit Chip-Level Deep Learning Model for Real-Time Dust Storm Monitoring, Environ. Sci. Technol., 60, 12280–12291, https://doi.org/10.1021/acs.est.5c14697, 2026.
Probst, P., Wright, M. N., and Boulesteix, A. L.: Hyperparameters and tuning strategies for random forest, WIREs Data Mining Knowl. Discov., 9, e1301, https://doi.org/10.1002/widm.1301, 2019.
Qiu, S., Zhu, Z., and He, B.: Fmask 4.0: Improved cloud and cloud shadow detection in Landsats 4–8 and Sentinel-2 imagery, Remote Sens. Environ., 231, 111205, https://doi.org/10.1016/j.rse.2019.05.024, 2019.
Roscher, R., Bohn, B., Duarte, M. F., and Garcke, J.: Explainable machine learning for scientific insights and discoveries, IEEE Access, 8, 42200–42216, https://doi.org/10.1109/ACCESS.2020.2976199, 2020.
Sayer, A. M., Hsu, N. C., Bettenhausen, C., and Jeong, M. J.: Validation and uncertainty estimates for MODIS Collection 6 “Deep Blue” aerosol data, J. Geophys. Res.-Atmos., 118, 7864–7872, https://doi.org/10.1002/jgrd.50600, 2013.
Schaepman-Strub, G., Schaepman, M. E., Painter, T. H., Dangel, S., and Martonchik, J. V.: Reflectance quantities in optical remote sensing–definitions and case studies, Remote Sens. Environ., 103, 27–42, https://doi.org/10.1016/j.rse.2006.03.002, 2006.
Seidel, F. C. and Popp, C.: Critical surface albedo and its implications to aerosol remote sensing, Atmos. Meas. Tech., 5, 1653–1665, https://doi.org/10.5194/amt-5-1653-2012, 2012.
Shi, Z., Xie, Y., Li, Z., Zhang, Y., Chen, C., Mei, L., Xu, H., Wang, H., Zheng, Y., Liu, Z., Hong, J., Zhu, M., Qie, L., Zhang, L., Fan, C., and Guang, J.: A generalized land surface reflectance reconstruction method for aerosol retrieval: application to the Particulate Observing Scanning Polarimeter (POSP) onboard GaoFen-5 (02) satellite, Remote Sens. Environ., 295, 113683, https://doi.org/10.1016/j.rse.2023.113683, 2023.
Tao, M., Chen, L., Su, L., and Tao, J.: Satellite observation of regional haze pollution over the North China Plain, J. Geophys. Res.-Atmos., 117, D12203, https://doi.org/10.1029/2012JD017915, 2012.
Tian, X., Gao, L., Li, J., Chen, L., Ren, J., and Li, C.: Retrieval of atmospheric aerosol optical depth from AVHRR over land with global coverage using machine learning method, IEEE T. Geosci. Remote, 60, 1–13, https://doi.org/10.1109/TGRS.2021.3129853, 2022.
Vermote, E. F., Tanré, D., Deuzé, J. L., Herman, M., and Morcrette, J. J.: Second simulation of the satellite signal in the solar spectrum, 6S: an overview, IEEE T. Geosci. Remote, 35, 675–686, https://doi.org/10.1109/36.581987, 1997.
Wang, Y., Zhang, D., Zhang, E., Xiong, Q., Niu, X., and Chen, S.: Pre-launch calibration technology of DQ-1 Wide-Field Imaging Spectrometer, Aerospace Shanghai (Chinese and English), 41, 137–145, https://doi.org/10.19328/j.cnki.2096-8655.2024.01.018, 2024a (in Chinese).
Wang, Z., Zhang, R., Chen, R., and Chen, H.: The aerosol optical depth retrieval from Wide-Swath Imaging of DaQi-1 over Beijing, Atmosphere, 15, 1476, https://doi.org/10.3390/atmos15121476, 2024b.
Wei, J., Huang, W., Li, Z., Xue, W., Peng, Y., Sun, L., and Cribb, M.: Estimating 1 km resolution PM2.5 concentrations across China using the space-time random forest approach, Remote Sens. Environ., 231, 111221, https://doi.org/10.1016/j.rse.2019.111221, 2019a.
Wei, J., Li, Z., Lyapustin, A., Sun, L., Peng, Y., Xue, W., Su, T., and Cribb, M.: Reconstructing 1 km resolution high-quality PM2.5 data records from 2000 to 2018 in China: spatiotemporal variations and policy implications, Remote Sens. Environ., 252, 112136, https://doi.org/10.1016/j.rse.2020.112136, 2021.
Wei, J., Peng, Y., Mahmood, R., Sun, L., and Guo, J.: Intercomparison in spatial distributions and temporal trends derived from multi-source satellite aerosol products, Atmos. Chem. Phys., 19, 7183–7207, https://doi.org/10.5194/acp-19-7183-2019, 2019b.
Wei, J., Wang, Z., Li, Z., Li, Z., Pang, S., Xi, X., Cribb, M., and Sun, L.: Global aerosol retrieval over land from Landsat imagery integrating Transformer and Google Earth Engine, Remote Sens. Environ., 315, 114404, https://doi.org/10.1016/j.rse.2024.114404, 2024.
Wei, X., Chang, N.-B., Bai, K., and Gao, W.: Satellite remote sensing of aerosol optical depth: advances, challenges, and perspectives, Crit. Rev. Env. Sci. Tec., 50, 1640–1725, https://doi.org/10.1080/10643389.2019.1665944, 2020.
Xu, H.: Modification of normalised difference water index (NDWI) to enhance open water features in remotely sensed imagery, Int. J. Remote Sens., 27, 3025–3033, https://doi.org/10.1080/01431160600589179, 2006.
Yan, X., Chen, J., Chen, H. W., Zhang, Y., Jiang, Y., Wang, Q., Wang, G., Jia, K., Chen, Z., Dong, W., Fan, J., and Zhao, C.: Exploring Global Aerosol Size Dynamics from 2001 to 2024 Using the Pretrained Remote sensing pIxel-based Spatial-teMporal Deep Neural Network, Environ. Sci. Technol., 60, 7146–7158, https://doi.org/10.1021/acs.est.5c13469, 2026.
Yan, X., Chen, J., Zuo, C., Jiang, Y., and He, B.: Spectral deconvolution algorithm for global fine-mode aerosol retrieval in the 1990s using dual-angle satellite aerosol data, IEEE T. Geosci. Remote, 61, 4107811, https://doi.org/10.1109/TGRS.2023.3332316, 2023.
Yan, X., Lyu, H., Chen, Z., Peng, R., Chen, J., Zou, J., Dong, W., and Wang, Q.: Real-Time Remote sensing for Sudden surface Anomalies: A Review of principles and challenges, Space Science & Technology, 5, https://doi.org/10.34133/space.0362, 2025.
Yan, X., Zang, Z., Li, Z., Chen, H. W., Chen, J., Jiang, Y., Chen, Y., He, B., Zuo, C., Nakajima, T., and Kim, J.: Deep Learning with Pretrained Framework Unleashes the Power of Satellite-Based Global Fine-Mode Aerosol Retrieval, Environ. Sci. Technol., 58, 14260–14270, https://doi.org/10.1021/acs.est.4c02701, 2024.
Yan, X., Zang, Z., Li, Z., Luo, N., Zuo, C., Jiang, Y., Li, D., Guo, Y., Zhao, W., Shi, W., and Cribb, M.: A global land aerosol fine-mode fraction dataset (2001–2020) retrieved from MODIS using hybrid physical and deep learning approaches, Earth Syst. Sci. Data, 14, 1193–1213, https://doi.org/10.5194/essd-14-1193-2022, 2022.
Yang, Y., Li, Z., Guo, J., Wang, Y., Wu, H., Shang, Y., Wang, Y., Zhu, L., and Yan, X.: Revolutionizing Clear-Sky Humidity Profile Retrieval with Multi-Angle-Aware Networks for Ground-Based Microwave Radiometers, J. Remote Sensing, 5, https://doi.org/10.34133/remotesensing.0736, 2025.
Zang, Z., Zhang, Y., Zuo, C., Chen, J., He, B., Luo, N., Zou, J., Zhao, W., Shi, W., and Yan, X.: Exploring Global Land Coarse-Mode Aerosol Changes from 2001-2021 Using a New Spatiotemporal Coaction Deep-Learning Model, Environ. Sci. Technol., 57, 19881–19890, https://doi.org/10.1021/acs.est.3c07982, 2023.
Zhang, H. K., Luo, D., and Roy, D. P.: Improved Landsat Operational Land Imager (OLI) cloud and shadow detection with the Learning Attention Network Algorithm (LANA), Remote Sens., 16, 1321, https://doi.org/10.3390/rs16081321, 2024.
Zhou, D., Wang, Q., Li, S., and Yang, J.: Preliminary retrieval and validation of aerosol optical depths from FY-4B Advanced Geostationary Radiation Imager images, Remote Sens., 16, 372, https://doi.org/10.3390/rs16020372, 2024.
Zou, J., Chen, H. W., Li, H., Wang, Q., Wang, G., Jia, K., Chen, Z., Zhao, C., Shi, W., Yang, Y., Tang, Y., Chen, J., Zhang, Y., Xu, T., Wang, Y., Liu, G., and Yan, X.: Amplified urban heat island effect in southern China's old towns following atmospheric regulation policies, Sustain. Cities Soc., 131, 106675, https://doi.org/10.1016/j.scs.2025.106675, 2025.