
the Creative Commons Attribution 4.0 License.
the Creative Commons Attribution 4.0 License.
 | 02 Nov 2026
Assessing greenhouse gas measurement consistency and traceability in the UK and Ireland atmospheric monitoring network using whole and synthetic air reference materials
Emmal Safi

Grant Forster
Christopher Rennick
Simon O'Doherty
Dickon Young
Kanokrat Charoenpornpukdee
Nick Garrard
Dafina Kikaj
Andrew C. Manning
Gerard Spain
Damien Martin
Morgan Lopez
Michel Ramonet
Kieran Stanley
Atmospheric measurements of greenhouse gases (GHG), including carbon dioxide (CO2), methane (CH4) and nitrous oxide (N2O) are essential for assessing climate change and verifying national emission inventories. As global networks rely on high-precision observations of GHGs, ensuring accuracy between observation stations is essential. Maintaining accuracy within a network requires the use of whole air reference materials (RMs) with well-defined calibration scales, such as those maintained by the National Oceanic and Atmospheric Administration (NOAA) for the World Meteorological Organisation (WMO). With the global expansion of atmospheric monitoring networks there is a growing need for readily available RMs, stimulating the development of complementary alternatives such as synthetic air RMs traceable to the International System of Units (SI).
In the United Kingdom (UK) and Ireland, the atmospheric GHG monitoring network, comprising long-term atmospheric monitoring stations, is equipped with high precision in situ GHG analysers. These observations are used to verify bottom-up assessments of national emissions. Here, a case study is presented which provides the first direct, network-wide evaluation of whole air versus synthetic air RMs under routine field conditions, allowing an assessment of the implications of SI-traceable RMs within an active national atmospheric monitoring system. We assess the UK and Ireland's network consistency and performance using WMO-NOAA scale-traceable whole air RMs and SI-traceable synthetic air RMs, through a blind multi-site round-robin intercomparison. Between 2021 and 2022, measurements were made of CO2, CH4 and N2O in whole and synthetic air RMs at six sites using a range of instruments and the results were used to assess consistency between sites. The measured mole fractions for each cylinder, at each site were then compared with the assigned value on the WMO-NOAA scale and the SI-traceable values for the whole air and synthetic air RMs, respectively. Weighted residual analysis reveals that whole air RMs generally meet the WMO/Global Atmosphere Watch (GAW) compatibility goals for CO2 and CH4, while N2O remains more difficult as its relatively small atmospheric variability requires measurement biases to be minimised to resolve meaningful atmospheric differences. Synthetic SI-traceable RMs have associated absolute uncertainties on their assigned values for CH4 that are comparable to the extended WMO compatibility goals. However, absolute uncertainties for CO2 and N2O remain significantly larger than both the compatibility and extended compatibility goals, which is consistent with previous studies. Overall, these results indicate that while scale-traceable whole air RMs remain essential for achieving the highest level of network compatibility required for atmospheric monitoring, SI-traceable synthetic RMs could play a valuable complementary role, particularly for CH4. However, it is first critical that improved characterisation and compensation of matrix effects arising from instrument-specific responses to differences in RM composition, non-linear instrument response across the relevant mole fraction range, and long-term stability, are achieved for them to become suitable for use in high-precision atmospheric monitoring.
- Article
(1833 KB) - Full-text XML
-
Supplement
(423 KB) - BibTeX
- EndNote


Atmospheric greenhouse gas (GHG) measurements are crucial for understanding climate change (Petit et al., 1999; Ramanathan and Feng, 2009; IPCC, 2023), therefore, the World Meteorological Organisation (WMO) has identified them as critical for global monitoring. As of 2023, mean global surface temperatures over land are 1.6 °C warmer compared to the pre-industrial era (IPCC, 2023), with climate projections indicating an increase of over 2 °C by 2100 (IPCC, 2023). Global warming is driven by the rise in GHG mole fractions, primarily due to human activities (IPCC, 2023), with carbon dioxide (CO2), methane (CH4) and nitrous oxide (N2O) being the most significant contributors due to their strong radiative forcing and long atmospheric lifetimes. Atmospheric CO2, CH4 and N2O mole fractions are at levels higher than any point in the last 800 000 years (https://gml.noaa.gov/ccgg/data/index.html, last access: January 2026; IPCC, 2023).
As a consequence, individual nations and governments took initiatives to monitor and regulate their emissions to aid in the global efforts. National GHG emissions inventories are reported annually to the United Nations Framework Convention on Climate Change (UNFCCC) and are estimated in compliance with Intergovernmental Panel on Climate Change (IPCC) methodological guidance. This methodology uses activity data, emission factors and facility-level measurements, known as bottom-up methods (Ciais et al., 2014; Gurney et al., 2016; Nisbet and Weiss, 2010). However, for some sources, the outputs from these calculations are very uncertain; therefore, verification of inventories is recommended (IPCC, 2023). Some of the most common verification methods are inverse techniques, which use atmospheric measurements complemented with atmospheric transport modelling tools (Ganesan et al., 2014; Manning et al., 2011, 2021; WMO, 2025), known as a top-down approach. The IPCC has set out the best practices for the use of top-down emissions estimates to verify inventories (IPCC, 2023). Expanding the atmospheric measurement network would improve top-down sensitivity to emissions and reduce the associated uncertainty. As a result, many national and regional GHG monitoring networks are currently expanding.
Within these networks, measurements can only be combined reliably when network compatibility is maintained, meaning that biases between the same measurements across a network remain below levels that would affect their scientific interpretation. These biases are set out by the WMO/Global Atmosphere Watch (GAW) programme and are referred to as “compatibility goals” (WMO, 2026). These goals represent the scientifically desirable level of network compatibility for measurements of well-mixed background air and define the maximum measurement bias that can generally be tolerated when observations are used in global models to infer regional fluxes. They therefore provide a measurement requirement against which the consistency of observations across atmospheric monitoring networks can be assessed (WMO, 2026). Combining GHG measurement results from different monitoring sites to gain both a global and regional understanding of the atmospheric distribution is challenging, particularly when attempting to work towards the WMO/GAW compatibility goals. A variety of factors can introduce differences between measurements made at different monitoring sites, including sampling artefacts, local environmental interferences, and difference in calibration procedures (Hall et al., 2014; Worthy et al., 2023). Assessing network compatibility, therefore, requires comparing measurements of the same air, ideally under identical conditions, and must consider the entire sampling system and analysis chain (e.g. two laboratories measuring the same discrete air sample).
One of the most significant factors contributing to measurement differences is the calibration scale which they are reported against (Hall et al., 2014). Greenhouse gas mole fractions are typically reported relative to internationally maintained calibration scales, which are realised through carefully prepared reference standards stored in compressed gas cylinders. These scales consist of well-characterised reference artefacts spanning the relevant mole-fraction range. To minimise potential biases or interferences, the composition (matrix) of these reference materials (RMs) are designed to closely match that of ambient atmospheric air; for this reason, natural (whole) air collected under background conditions is commonly used (Hall et al., 2014). The most effective manner in which to meet the WMO/GAW network compatibility goals is for all laboratories to use calibration RMs that are traceable to the same primary scale. The WMO has assigned the National Oceanic and Atmospheric Administration (NOAA) as the Central Calibration Laboratory (CCL) of the GAW programme, making it responsible for the preparation, maintenance, and dissemination of network standards for CO2, CH4, N2O, carbon monoxide (CO) and sulphur hexafluoride (SF6) measurements. In addition, several independently maintained calibration scales exist: for example, Scripps Institution of Oceanography (SIO), USA (CO2, N2O, SF6, and many other trace species), Tohoku University, Japan (CO2, CH4, CO, N2O, and SF6), National Institute for Environmental Studies, Japan (CO2, CH4, CO, N2O, and SF6) and the University of Heidelberg, Germany (SF6) (WMO, 2026). These independent scales play an important role in understanding long-term trends and in evaluating uncertainties associated with calibration systems. In addition, it remains essential to quantify the relationship among these scales to ensure that differences between them do not introduce bias into atmospheric measurements.
When laboratories adopt a single reference scale, it is important to consider both the robustness of this approach and the demands it places on the supporting infrastructure. As monitoring networks grow and measurement techniques advance, there is increasing need for larger quantities of calibration standards.
International System of Units (SI) traceable RMs are produced gravimetrically under controlled laboratory conditions using individual high purity target and matrix gases. The contributions to the absolute uncertainty include the mass and purity of the component gases, and a full uncertainty budget is associated with the mole-fraction assignment (Brewer et al., 2018). However, SI traceability also means that all contributors to uncertainty propagate into the final measurement, which can limit the achievable uncertainty. The calibration scale approach, in contrast, uses a high-precision instrument as a comparator to measure the composition of RMs relative to the established calibration scale, such as the WMO-NOAA scales. This comparison typically provides a smaller relative uncertainty than gravimetric assignment as measurement of all RMs are made relative to a single, well-maintained scale and so the comparison is not impacted by any uncertainty associated with preparation (Brewer et al., 2018). At present, traceability to established calibration scales represents the most effective and reliable means to achieving the WMO/GAW compatibility goals across a network, with no alternative approach yet demonstrating equivalent performance. However, the use of a scale ultimately relies on the continuous maintenance of a central artefact that is depleted with use. This makes the use of laboratory-prepared (synthetic air) GHG RMs increasingly valuable for meeting the growing demand, despite their higher mole fraction uncertainty.
To support the development and evaluation of SI-traceable RMs, the International Bureau of Weights and Measures (BIPM) coordinates key comparison exercises. This provides a means to verify the consistency of RMs prepared by independent National Measurement Institutes (NMIs) within the range of their SI-traceable uncertainties. Over the past decade, there has been a decrease in the uncertainty in the reference values reported from key comparisons of several GHGs (Flores et al., 2015, 2019; Lee et al., 2017; Viallon et al., 2023). The absolute mole fraction uncertainty of the SI-traceable RMs, however, still need to be reduced by a factor of three to four to match the relative uncertainty achievable with the scale-based approach. Despite this, independent realisations provide an important means of evaluating established calibration scales, identifying potential biases or inconsistencies, and maintaining continuity when scales are revised (Dlugokencky et al., 2005; Hall et al., 2019, 2021). The current levels of uncertainty have enabled several key developments. They have supported the update to the WMO-CO2-X2019 scale (Flores et al., 2019; Hall et al., 2019, 2021), identified minor biases in the WMO-NOAA CH4 scale and initiated corrective measures (Dlugokencky et al., 2005; Flores et al., 2015). They also demonstrated internal consistency between standards traceable to independent N2O scales (Viallon et al., 2023) and confirmed consistency between CO in air RMs while highlighting challenges with stability (Lee et al., 2017).
This study presents a coordinated round-robin intercomparison designed to assess atmospheric GHG measurement consistency within the UK and Ireland monitoring network. First, a suite of whole air and synthetic air RMs containing CO2, CH4 and N2O mole fractions that span typical atmospheric ranges were circulated sequentially between multiple atmospheric monitoring sites between 2021 and 2022. These RMs were measured using routine instrumentation, calibration procedures and sampling configurations in place at each site, allowing direct assessment of site-to-site and instrument-to-instrument agreement under field conditions. Using the whole and synthetic air RMs on the instrumentation at six sites allowed the identification of systematic offsets and the evaluation of network consistency independent of assigned reference values. Second, the measurements of the whole air RMs (traceable to the WMO-NOAA scales) and the synthetic air RMs (traceable to the SI) and their uncertainties were compared to their assigned values and associated uncertainties to assess any biases. Together, these analyses provide insight into the extent to which SI-traceable RMs can complement established calibration scales, while maintaining the levels of compatibility required for atmospheric GHG monitoring networks.
2.1 The UK Deriving Emissions linked to Climate Change (UK DECC network)
The UK DECC network became operational in 2012 (Adcock et al., 2023; Kikaj et al., 2025; Stanley et al., 2018; Stavert et al., 2019). It currently consists of four tall tower measurement stations in England (Bilsdale (BSD), Ridgehill (RGL), Tacolneston (TAC), and Heathfield (HFD)) and a background site at Mace Head (MHD) in Ireland, (see Fig. 1). There are also affiliated sites at Weybourne Atmospheric Observatory (WAO) and Jodrell Bank Observatory (JBO) in England, as well as Invergowrie (IVG) in Scotland. The aim of the network is to provide high precision and high frequency in-situ mole fraction measurements of GHGs to improve UK emissions estimates.
2.2 Integrated Carbon Observation System (ICOS)
The Integrated Carbon Observation System (ICOS) is a European wide research infrastructure (https://www.icos-ri.eu, last access: 15 January 2026, Heiskanen et al., 2022) which provides harmonised and high-precision data on the carbon cycle and GHG emissions (https://www.icos-ri.eu, last access: 15 January 2026). From the sites within the UK and Ireland monitoring network, there are currently two ICOS sites within the UK (WAO and RGL, see Fig. 1) and one within Ireland (MHD). The ICOS monitoring stations are standardised, using similar instruments, sampling set-ups and calibration methods (Yver Kwok et al., 2015, 2021). Data are routinely quality checked by station PI's and assessed by the Atmospheric Monitoring Station Assembly (MSA) twice a year (Yver-Kwok et al., 2021). The ICOS protocols relating to physical measurement infrastructure are compatible with DECC network protocols. All WAO and MHD measurements using cavity ring down spectroscopy (CRDS; see Sect. 3) are processed via the ICOS data processing chain. At RGL CO2 and CH4 measurements made using a single CRDS analyser are processed in parallel via the ICOS and DECC network processing chains, while gas chromatography (GC; see Sect. 3) measurements of N2O are not ICOS compliant and are only processed via the DECC processing chain. All RGL data presented here was processed via the DECC network processing chain.
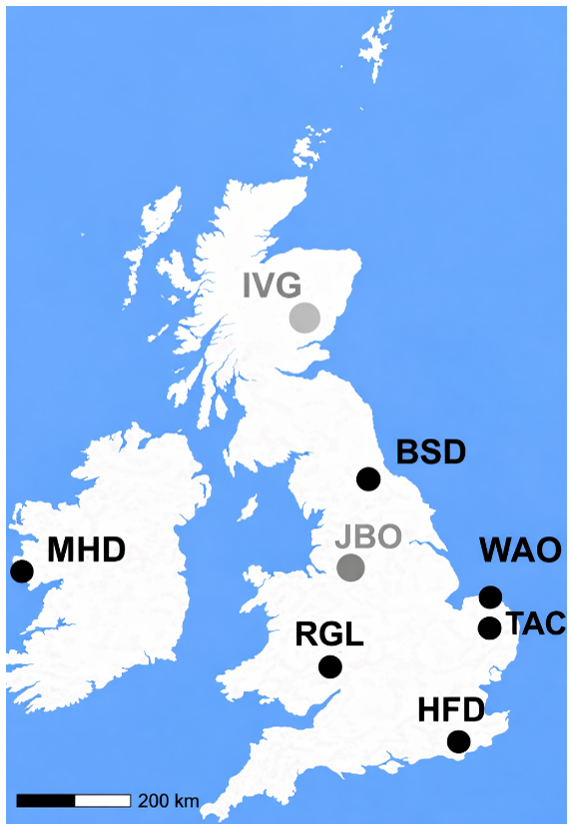
Figure 1The UK and Ireland atmospheric monitoring network. The network includes atmospheric monitoring sites at Bilsdale (BSD), Jodrell Bank Observatory (JBO), Weybourne Atmospheric Observatory (WAO), Tacolneston (TAC), Ridgehill (RGL), and Heathfield (HFD) in England, Invergowrie (IVG) in Scotland and Mace Head (MHD) in Ireland. Sites labelled in black took part in the round robin intercomparison. The sites labelled in grey did not take part in the round robin intercomparison. The figure is modified from (Kikaj et al., 2025).
3.1 Instrumentation
3.1.1 Cavity ring down spectrometer
The use of advanced optical instrumentation for atmospheric GHG monitoring has grown rapidly over the last decade. This is due primarily to the precision and stability of these instruments and their straightforward deployment requirements in terms of maintenance and expertise. They do not require a carrier gas, can provide continuous measurements, and have an improved response linearity for N2O mole fraction relative to commonly used methods based on gas chromatography (GC).
The cavity ring-down spectroscopy (CRDS) instruments (Picarro, Inc., Santa Clara, CA, USA) measure mole fractions of CO2, CH4 and N2O at intervals of approximately 3 s (Stanley et al., 2018; Winderlich et al., 2010). The shape of the spectral lines are sensitive to temperature and pressure changes and so the instruments control the temperature and pressure of the sample.
The CRDS measurements are also sensitive to water vapour interference through dilution and pressure broadening effects, so the sample must either be dried prior to measurement, or these effects must be corrected for. Within the UK and Ireland atmospheric monitoring network, these corrections are derived individually for each CRDS analyser. This is done by measuring compressed air from a cylinder both dry and over a range of typical atmospheric water vapour levels (see Stavert et al., 2019, for details) alongside the use Nafion membrane dryers to reduce the water vapour levels within the sampled air.
3.1.2 Off-axis integrated cavity output spectroscopy
At TAC, N2O is measured using off-axis integrated cavity output spectroscopy (OA-ICOS; model EP30/913 0015-810; Los Gatos Research (LGR), USA, (Lebegue et al., 2016). This technique is similar to CRDS in that it involves passing a laser through an optical cavity containing the sample and measuring absorption as a function of wavelength while sweeping the laser across the relevant spectral lines. Lebegue et al. (2016) provide details on the differences between CRDS and OA-ICOS techniques. At TAC an Earth Networks sample selection system, including a Nafion dryer, was used to dry the sample (Welp et al., 2013). Water vapour tests (as described in Sect. 3.1.1) showed that for this analyser the correction performed by the internal software for water inference resulted in errors much smaller than those associated with instrument drift and nonlinearity. From this point on we will abbreviate the OA-ICOS instrument name to “LGR”.
3.1.3 Gas chromatography
Within the UK and Ireland atmospheric monitoring network, GC systems are used to measure several species, using an electron capture detector (ECD) for N2O and SF6, a flame ionisation detector (FID) for CH4, and a pulsed discharge detector (PDD) or reduction gas analyser (RGA) for hydrogen (H2), where the latter can also measure CO. These instruments incorporate automated sample and standard selection, as well as Nafion drying systems. The focus here is on the GC-ECD system used to measure N2O.
In a GC-ECD system, the sample is transported by an inert carrier gas (a 5 % CH4 in Argon (Ar) mix is used in the UK and Ireland atmospheric monitoring network) through chromatographic columns to separate target compounds. The eluate then enters a detector cell containing a weak radioactive β-emitter (usually Ni-63), which produces free electrons collected as a steady current. Analytes with a high electron affinity (e.g., halogenated or nitro compounds) capture the electrons, decreasing the current in proportion to their abundance. Because the response in an ECD is based on electron capture kinetics and recombination processes, certain nonidealities need to be corrected or accounted for such as nonlinearity, detector saturation effects and carrier gas purity (Stanley et al., 2018).
3.1.4 Fourier transform infra-red spectroscopy
The Fourier Transform Infrared (FTIR) spectrometer (Ecotech Spectronus) at WAO is a high precision instrument capable of simultaneously measuring mole fractions of CO2, CH4, N2O, and CO. The FTIR operates by passing a broadband infrared light source through an air sample at low pressure in the spectrometer cell, where individual gas species absorb characteristic wavelengths of infrared radiation. The transmitted light is recorded as an interferogram, which is subsequently transformed into a high-resolution spectrum using Fourier Transform techniques. Mole fractions of each gas are then derived from the specific absorption features corresponding to their molecular signatures. Detailed descriptions of the Spectronus FTIR can be found in Griffith et al. (2012) and Hammer et al. (2013).
3.1.5 Calibration
The full calibration procedure for the UK and Ireland atmospheric monitoring network instruments, excluding WAO and the CRDS systems at MHD, can be found in Stanley et al. (2018), however it is described briefly here. The CRDS/LGR measurements taken during the round robin intercomparison were subjected to a multi-point calibration using a suite of three or four calibration gases that ranged atmospheric mole fractions for CO2, CH4 and N2O. A working standard is also used of approximately ambient mole fractions to perform regular drift corrections (a drift-corrected sensitivity is then calculated, which is a function of the measured dry mole fraction divided by its assigned value. This is then divided by the measured standard dry mole fraction divided by the assigned/adjusted standard value (Stanley et al., 2018)). Connections of all working standards, and calibration gases are made using 1/16 in. O.D., 0.03 in. I.D. 304 stainless steel tubing (Supelco, Sigma-Aldrich, UK) to minimise dead volumes and wasted gas. Whole air (see Sect. 3.2.1. for a description of whole air) is used along with high pressure aluminium cylinders to ensure the stability of CO2 within the gas mixtures (Luxfer Gas Cylinders, UK). These cylinders are filled either at the Mace Head atmospheric research station, the University of Bristol or the University of East Anglia (UEA) Cylinder Filling Facility (CFF). Since 2021 RGL has gradually transitioned to receiving working standards/calibration gases filled at the ICOS Flask and Calibration Laboratory (FCL). The FCL is an entity of the Central Analytical Laboratory (CAL), located at the Max Plank Institute for Biogeochemistry (MPI-BGC), Jena, and provides whole air mixtures for stations within the ICOS network (Jordan and Damak, 2025; Yver Kwok et al., 2015, 2021). The FCL also assigns mole fractions on the relevant WMO-NOAA scales for the RGL working standards/calibration gases. At non-ICOS sites the WMO-NOAA traceable mole fractions for the CRDS/LGR working standards/calibration gases are assigned at the Swiss Federal Laboratories for Materials Science and Technology (Empa; see Sect. 3.2.2 for more details).
A full calibration procedure of GC-ECD N2O measurements is also described by Stanley et al. (2018) but is described here briefly. Mole fractions for the ambient air samples are derived from either the peak height or peak area on the chromatogram, relative to the height/area of the peak measured in a working standard whose mole fraction is known. The working standards are prepared in 34 L electropolished stainless steel cylinders (Essex Cryogenics, Missouri, USA). They are generally filled at MHD, except for the cylinders used on the MHD GC-ECD itself which are filled at the SIO in California. The working standards used at MHD are assigned values on the SIO-16 scale in the SIO central calibration laboratory. The working standards for other sites are then measured on the MHD ECD against these SIO-assigned standards (and in addition each working standard is measured against the previous working standard when it arrives on site). Hence all GC-ECD measurements of N2O presented here are fundamentally traceable to the SIO-16 scale. For consistency with the other analysers in this study, these GC-ECD data have been converted to the WMO-N2O-X2006A scale by subtracting a constant offset of 0.41 nmol mol−1. This offset is calculated as the mean difference between measurements of the SIO-filled working standards at SIO and at Empa. It is important to note that this factor is appropriate for this network and this time period and should not be considered as a universal conversion factor between the two scales (Corazza et al., 2011). Nonlinearity corrections for the GC-ECD analysers are applied based either on measurements of scale-traceable RMs spanning the typical atmospheric range or dynamic dilution experiments (Stanley et al., 2018).
The Spectronous FTIR at WAO is calibrated using whole air standards prepared and calibrated by the ICOS FCL. These calibration standards contain CO2, CH4, N2O and CO traceable to WMO-NOAA calibration scales. In addition, the δ13C and δ18O isotopic signatures of each gas mixture are known to enable the accurate determination of CO2 mole fraction using its three most abundant isotopologues (Griffith et al., 2012). Every 14 d a response factor is determined for the analyser for each species, including the CO2 isotopologues, by introducing the calibration gases to the analyser. The MHD CRDS is also calibrated using whole air standards prepared and calibrated by the ICOS FCL, with the response factor characterised every 29 d. For both sites, this raw data is then sent to the ICOS Atmospheric Thematic Centre (ATC) for processing. Analyser performance is routinely assessed in between calibrations by introducing a target tank; a whole air cylinder with mole fractions of CO2, CH4, N2O and CO2 assigned by the ICOS FCL.
3.2 Preparation of whole air reference materials
3.2.1 Production of whole air reference materials
The term “whole air” refers to ambient atmospheric air retaining the naturally occurring proportions of its major constituent gases and trace species except water vapour, thereby providing a gas matrix representative of atmospheric samples. The whole air RMs used in this study were filled at the UEA CFF, a specialised facility for filling high-pressure gas cylinders with whole air. The facility is primarily used to routinely produce RMs containing CO2, CH4, N2O, CO and O2 and supports a wide range of research projects and monitoring programmes; however, the facility can make whole air mixtures of many trace gas species, if the species is stable (e.g., ethane (C2H6), H2, SF6).
The first step in the procedure is to condition the gas cylinder prior to filling. This is achieved by evacuating the cylinders to 0.5 mbar, which removes ambient air and water vapour. The conditioned cylinder can then be filled to a maximum of 300 bar with a heavy-duty, 3-stage, oil-free “RIX Industries” compressor. During this phase, the mole fractions in the gas can be “tailored” to add or remove species of interest. For whole air mixtures requiring mole fractions at ambient levels or below, the gas can be passed through various chemical scrubbers. For example, a portion of the gas can be passed through a molecular sieve 13X trap to remove CO2, or through a Zero Air Generator to remove CH4. For cylinders requiring higher than ambient mole fractions, a precisely calibrated volume of the “target” species is introduced to the conditioned gas cylinder prior to filling. During filling, the gas is passed through a coalescent filter, a 3A molecular sieve trap and a magnesium perchlorate trap to dry the air to reduce the water content to less than 1 µmol mol−1. This is essential to ensure the long-term stability of the mole fractions of the gases within the ambient air sample in the cylinder. The dew point of the cylinders is routinely measured with an Accupoint moisture meter. In addition to filling, the CFF is equipped with state-of-the-art equipment to analyse the mole fractions of CO2, CH4, N2O and CO in gas mixtures, traceable to WMO-NOAA calibration scales.
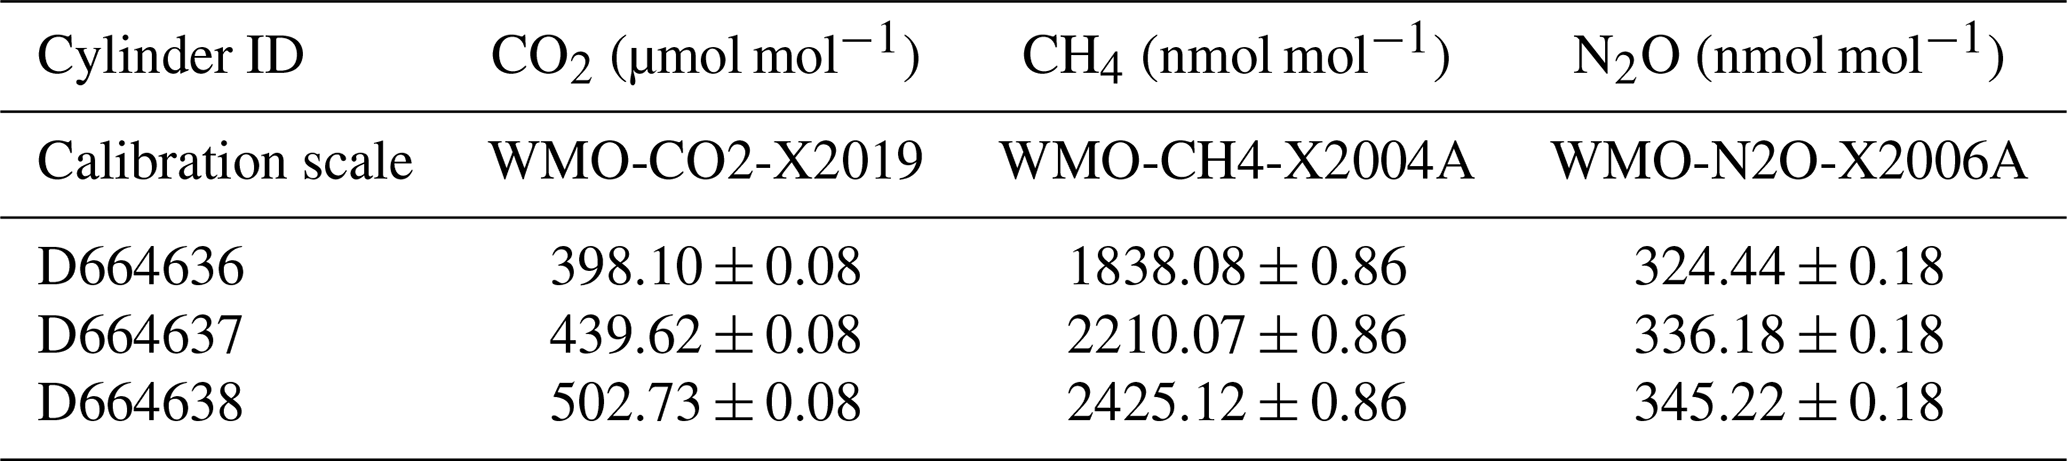
Table 1The mole fraction of CH4, CO2, and N2O assigned to each of three whole air RMs (given to 1 decimal place), traceable to the WMO-NOAA scales (WMO-CO2-X2019 for CO2, WMO-CH4-X2004A for CH4, and WMO-N2O-X2006A for N2O). The uncertainty of the assigned values is composed of the uncertainty of the analytical instrumentation used to assign the values and the propagation uncertainty. The reported expanded uncertainty of the measurement is stated as the standard uncertainty of the measurement multiplied by the coverage factor k=2, which for a normal distribution corresponds to a coverage probability of approximately 95 %.
3.2.2 Value assignment of whole air reference materials
Three 20 L Luxfer cylinders were filled, scrubbed/spiked and their water contents were checked at the UEA CFF following the methods in Sect. 3.2.1. The cylinders were then measured at Empa, who maintain strong links to the WMO-NOAA scales through their role as a WMO World Calibration Centre (WCC) for CO2 and CH4 (in addition to surface ozone and CO). World Calibration Centres are tasked with ensuring data quality and the traceability of network observations across GAW stations through regular intercomparison exercises (Buchmann et al., 2009; Zellweger et al., 2016, 2019). Filled cylinders are analysed at Empa over a 15 min period where only the last three minutes of measurements are used for CO2 and CH4 and the last ten minutes for N2O to ensure measurement stability. The value assignments on the WMO-NOAA scales are derived from multiple measurement sequences which include NOAA reference and working standards. The uncertainties are derived from the square root of the variance of all known sources of uncertainty excluding the WMO-NOAA scale uncertainties themselves, however typically the distribution of the variance is not well known so standard uncertainty is multiplied by a coverage factor. This coverage factor provides expanded uncertainties that encompass confidence limits which likely cover the “true” value. For a normal distribution, a coverage factor k=2 yields confidence limits of about 95 %. The combined uncertainties take into account uncertainties arising the propagation of the WMO-NOAA scale onto the calibrated RMs and the uncertainties of the analytical instrumentation. Table 1 lists the assigned values of the whole air RMs.
3.3 Preparation of synthetic air reference materials
The term “synthetic air” refers to a mixture of gases that is artificially created to mimic the composition of natural, ambient air. The matrix gas in this study contains N2, O2 and Ar (see Table 2 for the matrix gas mole fractions).
All synthetic air RMs were prepared at the National Physical Laboratory (NPL) by gravimetry, in accordance with ISO 6142-1:2015 (ISO 6142-1, 2015) in 10 L Luxfer aluminium cylinders. This was done by addition of CO2, CH4, and N2O via intermediate mole fraction mixtures in a N2 matrix. The cylinders were treated internally with Spectraseal (BOC specialty gases) proprietary passivation processes to inhibit adsorption of target components to the internal cylinder surfaces. Cylinders were evacuated overnight using an oil-free pump (Scrollvac SC15D, Leybold Vacuum) and turbo molecular pump with magnetic bearing (Turbovac 340M, Leybold Vacuum) to a pressure of mbar.
To prepare the intermediate mole fraction mixtures, each component was added via either a direct addition to the cylinder, through purged in. tubing (Swagelok, electropolished stainless steel) or through using a transfer vessel and then diluting with synthetic air by the direct addition of Ar (BIP, Air Products), O2 (N6.0, BOC) and N2 (BIP+, Air Products) to blend to nominally atmospheric ratios. Argon was added to the cylinder from a 30 cmol mol−1 Ar-in-N2 intermediate mixture for more precise targeting. The transfer vessel was weighed against a tare vessel matched for size and shape before and after addition into the evacuated cylinder (Mettler-Toledo XP2004S, ± 0.3 mg weighing uncertainty). The mass added via direct addition was determined by weighing the cylinder before and after addition against a tare cylinder on an automatic weighing facility, developed by the Korean Research Institute for Standards and Science (KRISS) (Mettler-Toledo XP26003L, ± 20 mg weighing uncertainty) (Lim et al., 2017). Table 2 lists the certified values of the gases within the synthetic air RMs.
Table 2The gravimetrically assigned mole fractions of CH4, CO2 and N2O for each of the four synthetic air RMs produced at NPL (given to 1 decimal place), traceable to the mole. The reported expanded uncertainties are based on standard uncertainties multiplied by a coverage factor k=2, providing a coverage probability of approximately 95 %. The gravimetrically assigned mole fractions for the matrix gas components (Ar, O2 and N2) are also included. The reported uncertainties for these quantities are the k=1 uncertainties associated only with the gravimetric preparation of the mixtures and do not include any other sources of uncertainty.

3.4 Measurement procedure
The CRDS instruments used in the UK and Ireland atmospheric monitoring network measure mole fractions of CO2, CH4 and N2O at approximately 3 s intervals, while the LGR measurements at TAC are made at 1 Hz. Both the CRDS and LGR data were averaged into 1 min periods for analysis. The GC-ECDs used within the network measured discrete air samples injected every 10 min, except for MHD where a sample was measured every 20 min. For these GC-ECD measurements a whole air working standard was sampled at least every 60 min during the intercomparison to correct for potential drift of the instrument (every 40 min at MHD). The FTIR at WAO produces only one data point every minute.
Both the whole air and synthetic air RMs were measured at BSD, RGL, TAC, WAO, HFD and MHD using a procedure designed to ensure that the instrument response had stabilised. All measurements were conducted for sufficient durations to allow the sample stream to reach equilibrium within the analysers and only data collected after equilibration were retained for analysis and comparison purposes. During the periods the intercomparison cylinders were measured, for both whole air and synthetic air, the variability is taken to be the standard deviation of the measurements over the period they were measured.
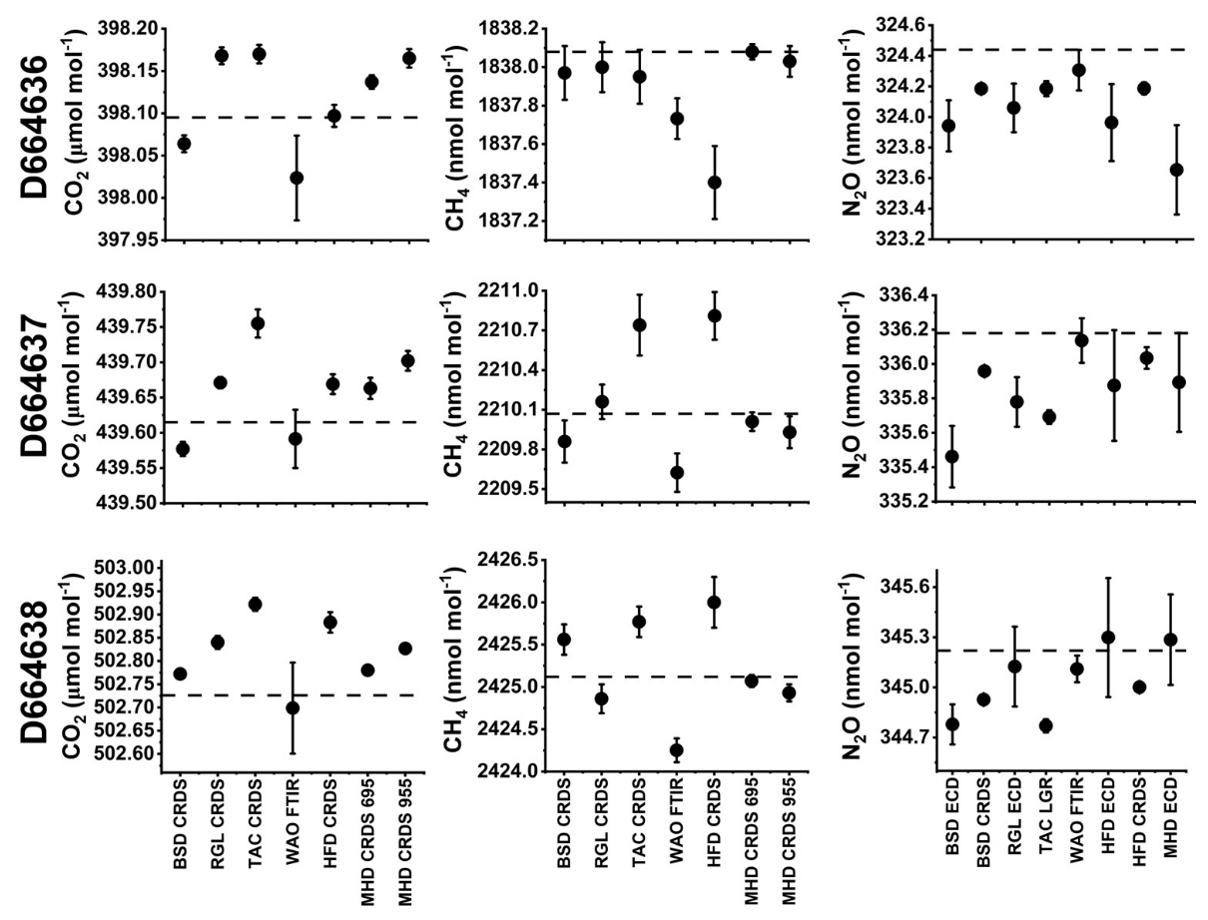
Figure 2Mean CO2 (left), CH4 (middle), and N2O (right) mole fractions measured for the three whole air RMs at the participating monitoring sites and instruments. The panels show results for D664636 (top), D664637 (middle) and D664638 (bottom). Sites are identified as Bilsdale (BSD), Ridgehill (RGL), Tacolneston (TAC), Weybourne (WAO), Heathfield (HFD) and Mace Head (MHD). Instrument types include cavity-down spectroscopy (CRDS), off-axis integrated cavity output spectroscopy (LGR), Fourier-transform infrared spectroscopy (FTIR) and gas chromatography (GC) with electron capture detection (ECD). The MHD CRDS instruments are distinguished by identifiers 695 and 955. Dashed lines indicate the assigned WMO-NOAA scale traceable mole fractions assigned to each RM (see Table 1). Error bars represent the standard deviation of measurements over the measurement period, and where not visible are smaller than the plotted points.
4.1 Site-to-site measurement consistency using whole air reference materials
This section examines the differences between measurements of the whole air RMs made at each of the atmospheric monitoring sites, where each site may use a different type of instrument. These results provide an assessment of network consistency and allow identification of offsets associated with individual sites or instruments when using whole air.
Figure 2 shows the mole fraction of three whole air RMs measured by the various instruments at each of the atmospheric monitoring sites that took part in the intercomparison exercise. The results are shown for CO2 (left), CH4 (middle) and N2O (right).
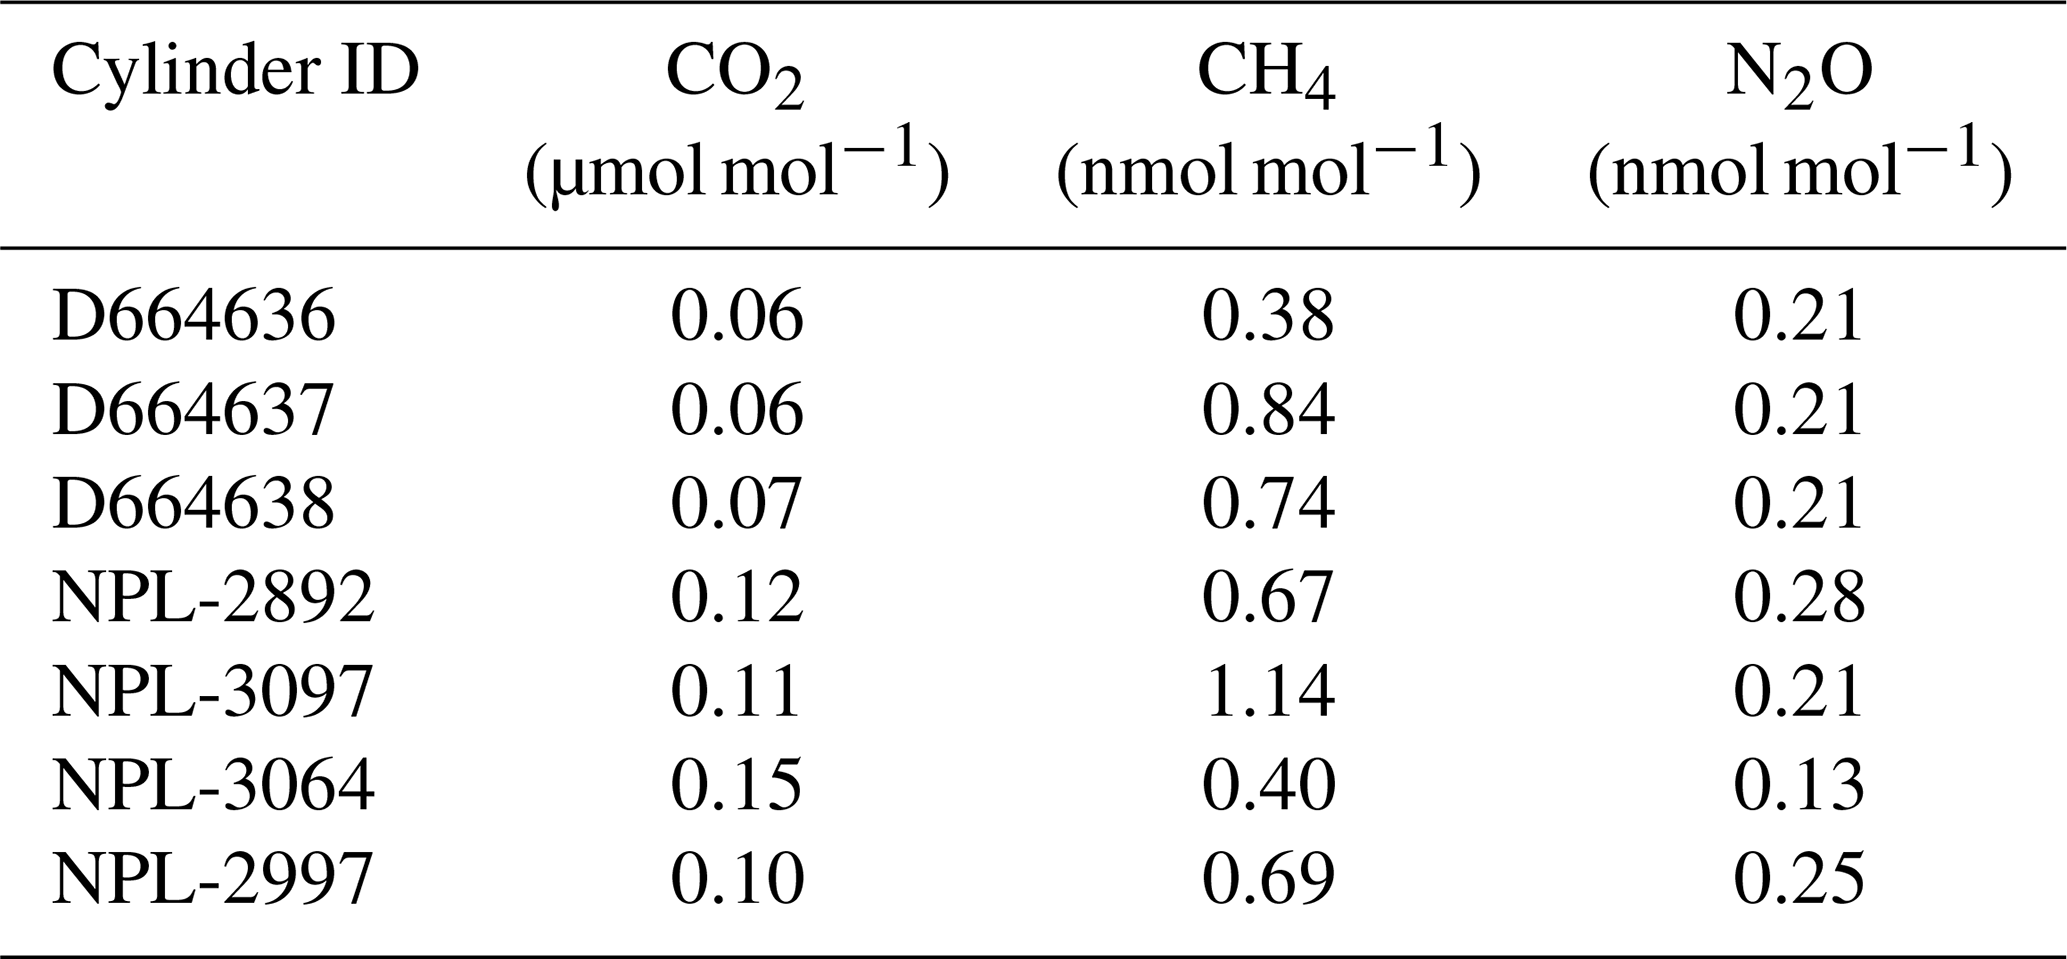
Across the three whole air RMs, site-to-site agreement varied by species, showing instrumental differences, the inherent measurement precision of each species and potential scale offsets. To quantify the standard deviation of measurements between instruments and sites, the coefficient of variation (standard deviation of measurement divided by mean measurement result) for each RM for each gas is shown in Table 3 and the standard deviation of each RM across all sites and instruments in Table 4. For CO2, the average standard deviation across all sites is 0.07 µmol mol−1 (i.e. the mean of the standard deviations for the three cylinders listed in Table 4), with a maximum offset from the assigned cylinder values of 0.20 µmol mol−1 (TAC CRDS, D664638). For CH4, the average standard deviation is 0.66 nmol mol−1 with a maximum offset of 0.88 nmol mol−1 (HFD CRDS, D664638) and for N2O the average standard deviation is 0.21 nmol mol−1 with a maximum offset of −0.79 nmol mol−1 (MHD ECD, D664636). These results show that for CH4 the WMO compatibility goal of 2 nmol mol−1 is met in all cases and the standard deviation across the network is also within the compatibility goal, while for CO2 some results lie outside the (northern hemisphere) compatibility goal of 0.1 µmol mol−1, but all are within the extended compatibility goal of 0.2 µmol mol−1, with the standard deviation of results across the network being within the northern hemispheric compatibility goal. For N2O the standard deviation across the network is significantly larger than the compatibility goal of 0.1 nmol mol−1 but lies within the extended goal of 0.3 nmol mol−1 and shows that, some results lie outside both the compatibility and extended compatibility goal. Additionally, compared to the CO2 and CH4 measurements the coefficient of variation for N2O is an order of magnitude larger. This reflects the challenges posed in reaching these goals for N2O given the limitations imposed by the performance of currently available instrumentation, which impacts both the uncertainty from the measurements and the scale propagation uncertainty.
Table 3Coefficient of variation for each RM that took part in the intercomparison exercise. The values are calculated using the standard deviation of the measurements over the measurement period (taken to be the uncertainty of the result) divided by the average measurement result over the measurement period.
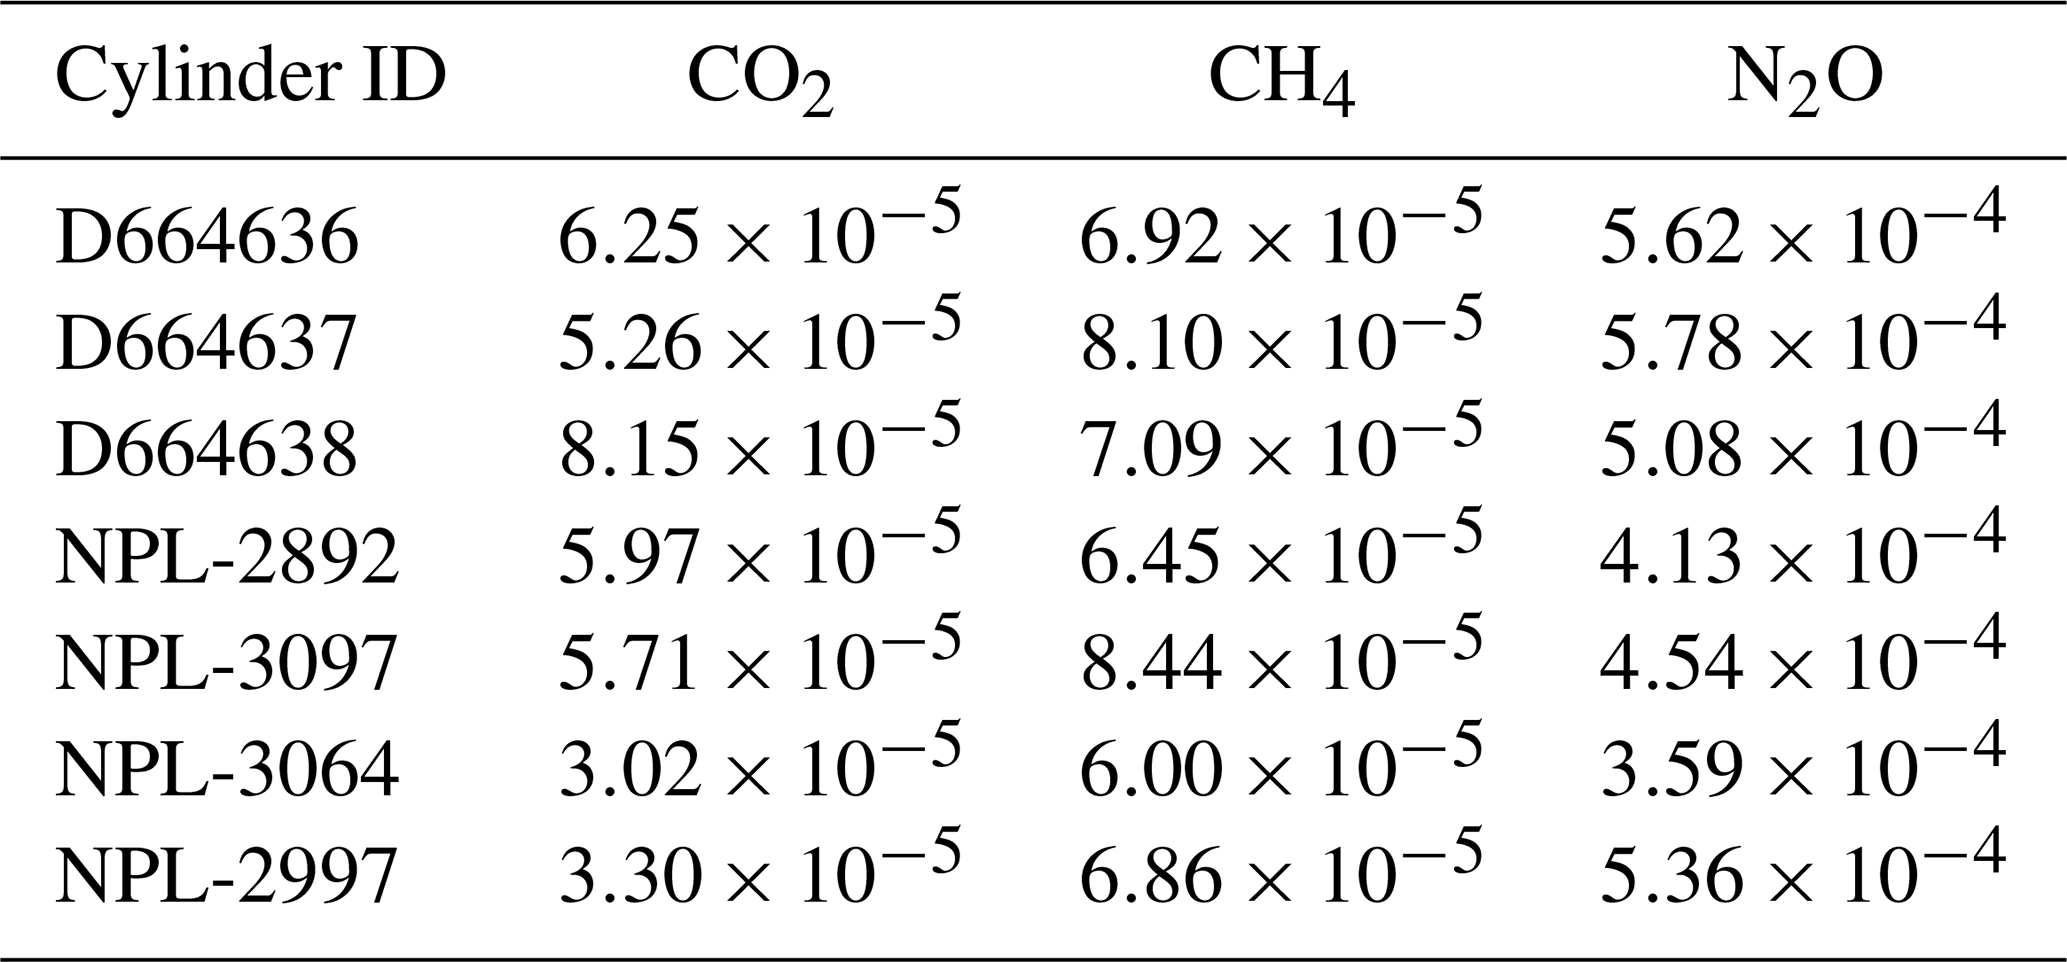
Table 4The standard deviation of each RM across all sites and instruments that took part in the intercomparison exercise.
4.2 Assessing results from the whole air reference materials and implications for traceability
In this section, the mean of the measurement results for the whole air RMs from all instruments and sites presented in Sect. 4.1 are compared with the assigned values of each whole air RM. This comparison is used to quantify the network-average biases from the assigned (scale-traceable) values. The assigned values of each RM are traceable to the WMO-NOAA calibration scales, and each assigned value has an associated uncertainty. Below shows step-by-step calculations on how the measurement values from each site were brought together, along with their uncertainties and compared to their scale-traceable assigned values and associated uncertainties.
Weighted mean mole fractions were calculated for each RM using the measurements at each site and from each instrument (Montgomery and Runger, 2014):
where xi represents the measured value from an instrument and wi represents its weight. The weight is expressed as (Montgomery and Runger, 2014):
where uinstrument is the measurement variability from a particular instrument from a particular site, taken to be the standard deviation of the measurements over the measurement period. The standard error of the weighted mean is expressed as (Montgomery and Runger, 2014):
using the weighted mean ensures that measurements with smaller variabilities contribute more strongly to the RM average, providing a better estimate of the estimate of each site's performance (as the poor estimates are down-weighted). The residual is calculated by subtracting the assigned value from this weighted mean:
The assigned value uncertainty is given including the coverage factor of k=2 to ensure the “true value” is encompassed at a confidence level of 95 %. Therefore, the k=2 value of the uncertainty of the weighted mean is also used to calculate the combined uncertainty. Then, the combined uncertainty on the residual is:
where u (RM assigned value) is the uncertainty on the assigned value of the RM (which for the whole air RMs does not include the calibration scale uncertainty itself, it is composed of the uncertainty of the analytical instrumentation used to assign the values and the propagation uncertainty, see Table 1). The u(weighted mean) and combined uncertainty on the residual values are given in Table 5.
Table 5The standard error of the weighted mean (u(weighted mean)) from all instruments at all sites for each RM that took part in the intercomparison exercise and the combined uncertainty on the residual (U(x)). These are calculated using Eqs. (3) and (5) respectively.
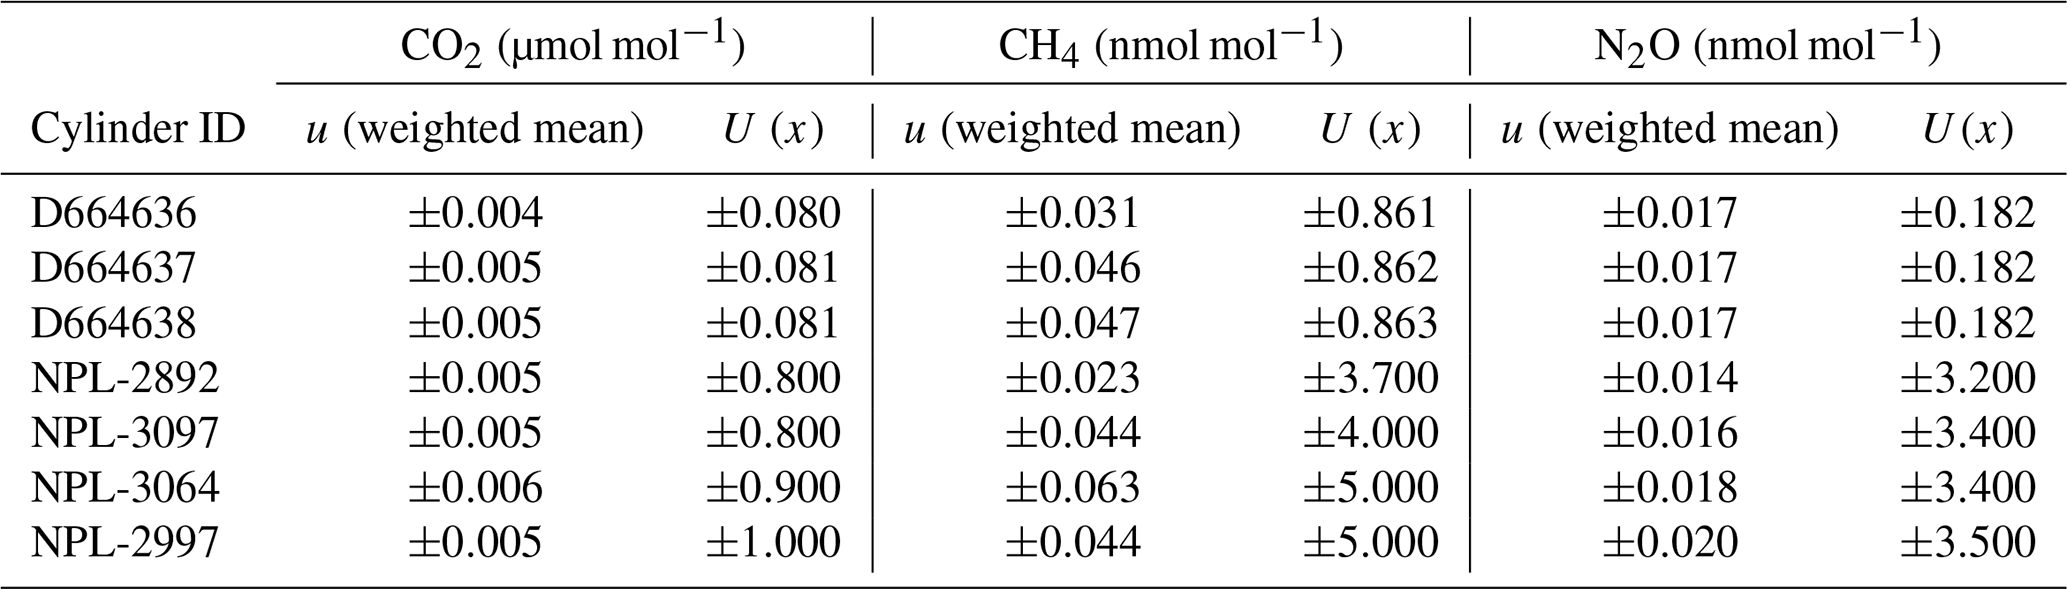
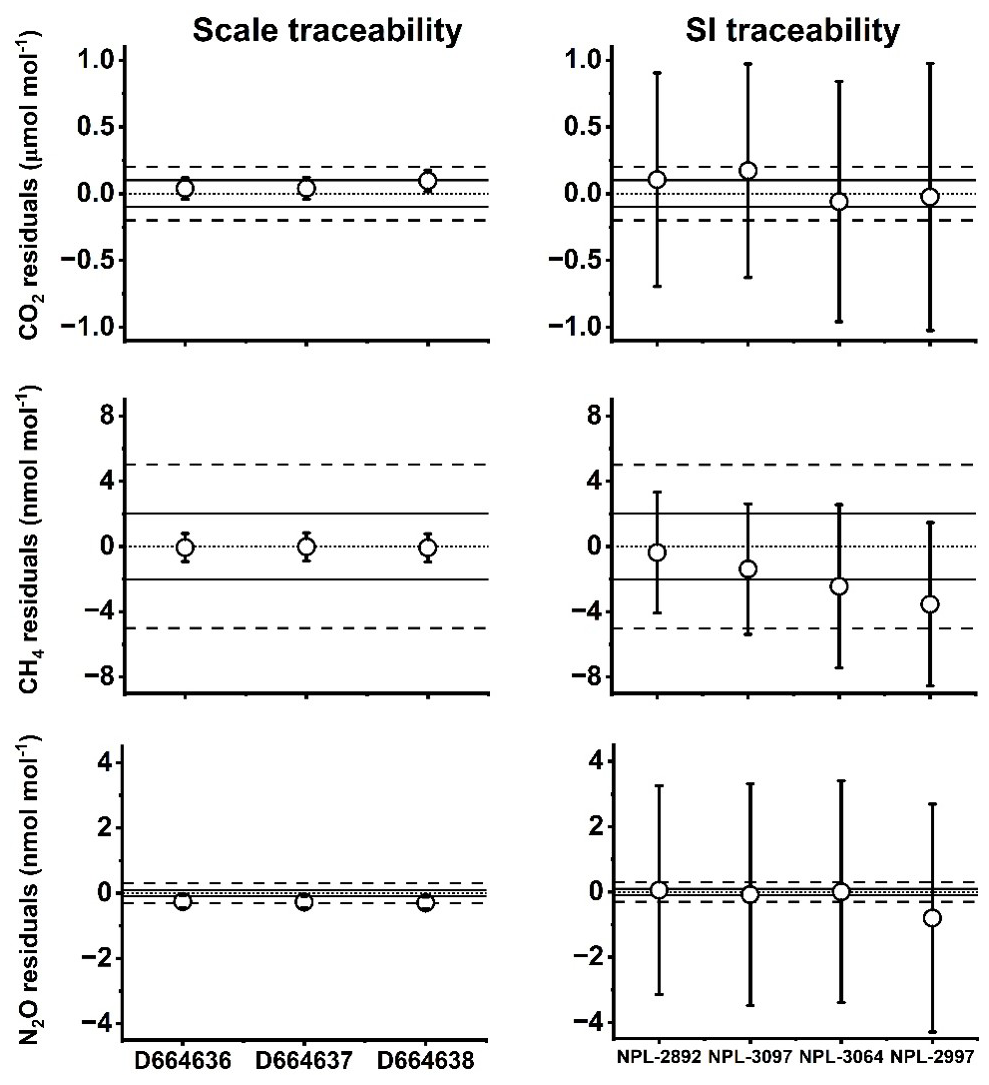
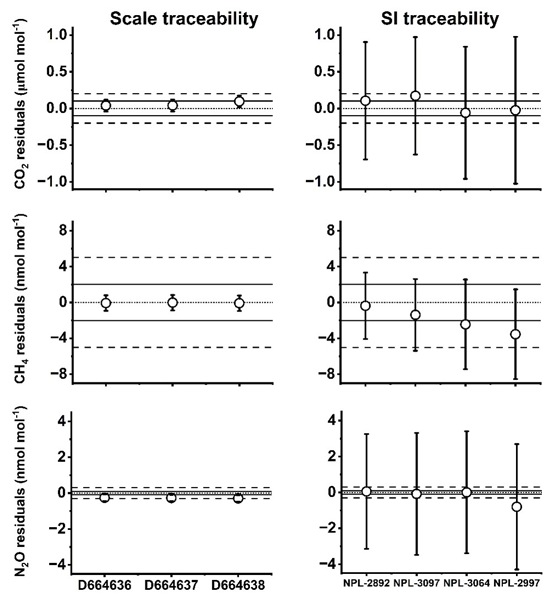
Figure 3Residuals between network weighted mean mole fractions and assigned values for CO2 (top), CH4 (middle), and N2O (bottom), for the whole air (left) and synthetic air (right) RMs. Residuals are calculated as the network weighted mean minus the assigned value. Solid black lines indicate the WMO compatibility goals, while dashed black lines indicate the extended WMO compatibility goals. The dotted line indicates zero residual. Error bars represent the combined uncertainty of the residuals (for whole air (left) this excludes the common calibration scale uncertainty).
In Fig. 3, residuals for the whole air RMs (traceable to WMO-NOAA scales) are plotted on the left-hand side (LHS), titled “scale traceability”. The complete uncertainty on the assigned mole fraction should include a contribution from the calibration scale itself, which is the largest contributor to the total uncertainty. However, as this calibration scale uncertainty is common to all whole air RMs (depending on the species in question this is the uncertainty in either the WMO-CO2-X2019, WMO-CH4-X2004A or WMO-N2O-X2006A scale) it represents a systematic component and is correlated across all the whole air RMs. Due to this, the calibration scale uncertainty is not included in the error bars on the LHS of Fig. 3, therefore the error bars represent the uncertainty from the measurements, the uncertainties of the analytical instrumentation used to assign values and the scale propagation uncertainty. The solid black line represents the WMO network compatibility goals (0.1 µmol mol−1 for CO2, 2 nmol mol−1 for CH4 and 0.1 nmol mol−1 for N2O) and the dashed lines represent the WMO extended network compatibility goal for each gas (0.2 µmol mol−1 for CO2, 5 nmol mol−1 for CH4 and 0.3 nmol mol−1 for N2O). The dotted line denotes zero residual. The WMO/GAW network compatibility goal is intended for studies that include well-mixed background air, where the smallest possible bias between datasets is needed, and the WMO/GAW extended network compatibility goal was established for studies where larger biases are acceptable (e.g. in more heavily polluted air masses). This includes measurements in urban areas, where anthropogenic emissions are more frequent.
The values assigned to the whole air RMs arise from using the scale method (see Sect. 3.2.2). As mentioned in Sect. 1, the scale is a set of primary standards with agreed stable reference values. This method allows for unrivalled precision as the measurements are compared to a single point of reference so that the scale accuracy has a limited impact on the compatibility of the measurements (Brewer et al., 2018). The scale approach is adopted within the GHG monitoring community as it can achieve precisions (defined in this context as how measurements change relative to a single set of primaries) that are more suited to atmospheric monitoring requirements than the uncertainties associated with SI traceable, gravimetrically prepared mixtures.
The LHS of Fig. 3 evaluates the agreement between the network-average measurements and the assigned values of the whole air RMs, providing an indication of any network-wide bias relative to the scale (i.e. the WMO-NOAA scales). This assessment is distinct from the assessment of network consistency presented in Fig. 2, which is determined solely from the standard deviation of measurements between instruments and sites. Figure 3 (LHS) examines whether the network, as a whole, is offset from the scale to which the whole air RMs are traceable. For CO2 and CH4, the weighted mean residuals are close to zero, indicating no significant network-wide bias relative to the scale. For CO2, the error bars are slightly larger than the compatibility goal but lie well within the extended compatibility goal, whilst for CH4, the error bars lie well within the compatibility goal. For N2O, the weighted mean residuals are proportionally larger compared to those of CO2 and CH4 (i.e. further from zero) indicating the agreement between the network average measurements and the assigned values is weaker compared to CO2 and CH4. Additionally, the uncertainties associated with the residuals are large relative to the stringent WMO/GAW compatibility goals for N2O. Achieving the WMO/GAW extended network compatibility goal for N2O is considerably more challenging than CO2 or CH4. Trends in atmospheric N2O vary only weakly in space and time, so even sub-ppb calibration or instrumental biases can obscure atmospheric signals and jeopardise their use in global models for inferring regional fluxes.
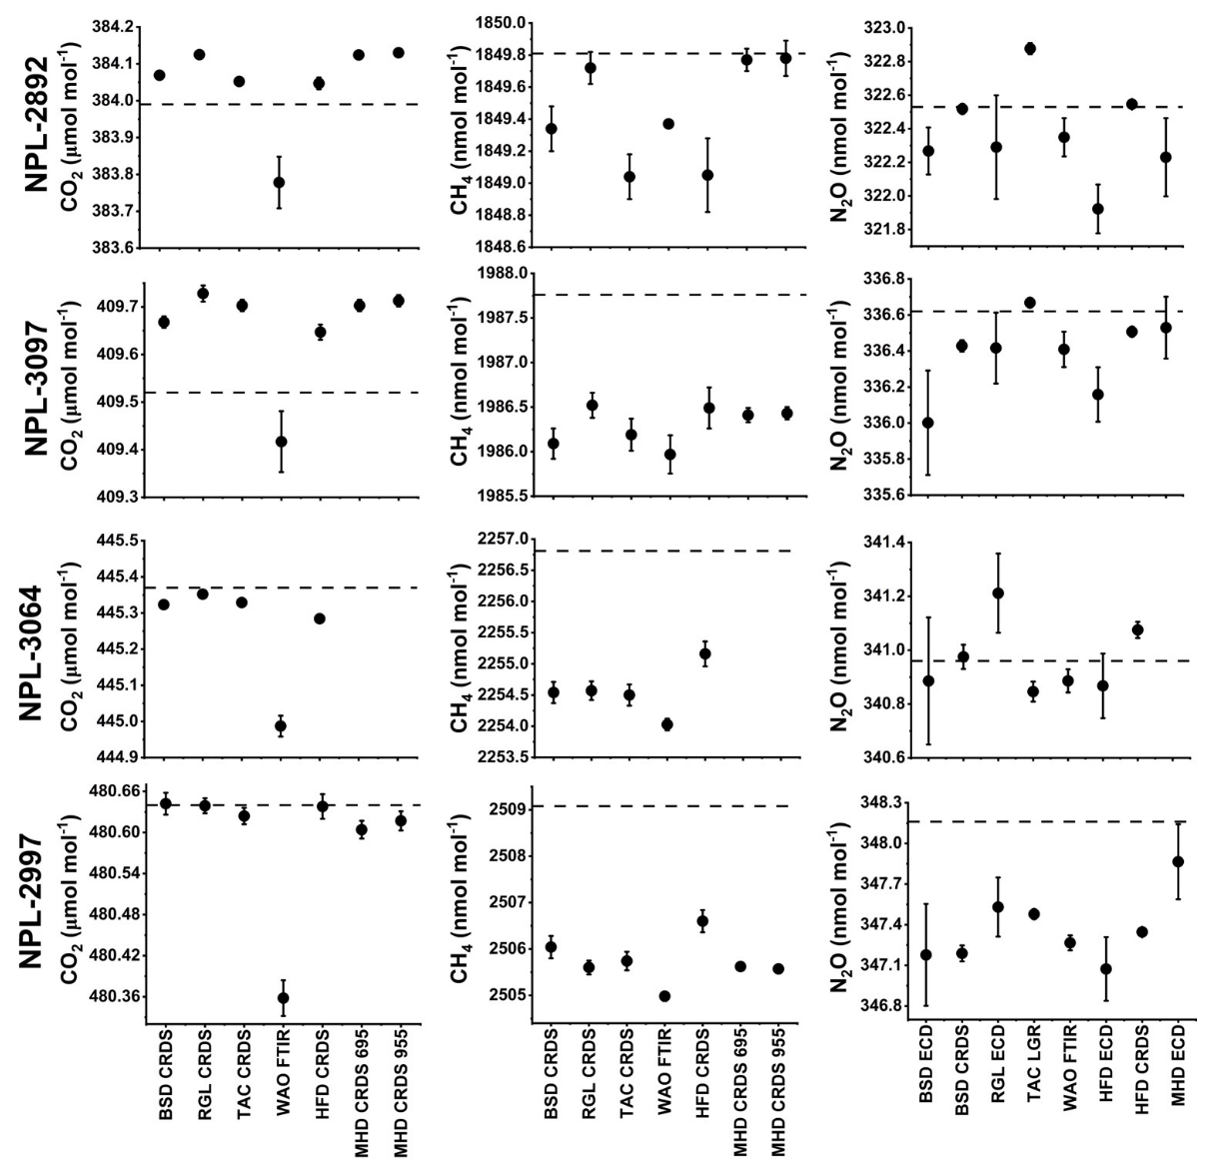
Figure 4Mean CO2 (left), CH4 (middle), and N2O (right) mole fractions measured for the four synthetic air RMs at the participating monitoring sites and instruments. The panels show results for NPL-2892, NPL-3097, NPL-3064 and NPL-2997 (top to bottom). Sites are identified as Bilsdale (BSD), Ridgehill (RGL), Tacolneston (TAC), Weybourne (WAO), Heathfield (HFD) and Mace Head (MHD). Instrument types include cavity-down spectroscopy (CRDS), off-axis integrated cavity output spectroscopy (LGR), Fourier-transform infrared spectroscopy (FTIR) and gas chromatography with electron capture detection (ECD). The MHD CRDS instruments are distinguished by identifiers 695 and 955. Dashed lines indicate the SI-traceable assigned mole fractions (see Table 2). Error bars represent the standard deviation of measurements over the measurement period, and where not visible are smaller than the plotted points.
4.3 Site-to-site measurement consistency using synthetic air reference materials
This section examines the differences between measurements of the synthetic air RMs made at each of the atmospheric monitoring sites. These results provide an assessment of network consistency and allow identification of offsets associated with individual sites or instruments when using synthetic air.
Figure 4 shows the results from the measurements of four synthetic air RMs at each of the atmospheric monitoring sites for the instruments that took part in the intercomparison exercise. The top panel (NPL-2892) shows the results for the lowest mole fraction RM measured for CO2 (left), CH4 (middle) and N2O (right). The second and third panels (NPL-3097 and NPL-3064) show results for the two intermediate mole fraction RMs used and the bottom panel (NPL-2997) for the highest mole fraction RM used.
Across the four synthetic air RMs, the degree of site-to-site consistency varies by species. To quantify the consistency of measurements across sites, the coefficient of variation (standard deviation of measurement divided by mean measurement result) for each RM for each gas is shown in Table 3. For CO2, we observe a large offset for the WAO FTIR from the assigned values. The potential contribution of matrix effects to this offset is discussed in Sect. 4.4.1. Excluding WAO FTIR CO2, the average standard deviation across sites is 0.07 µmol mol−1 for CO2, 0.73 nmol mol−1 for CH4 and 0.22 nmol mol−1 for N2O. The maximum offset from the RM certified values are 0.21 µmol mol−1 for CO2 (RGL CRDS, NPL-3097), −3.51 nmol mol−1 for CH4 (MHD CRDS 955, NPL-2997) and −1.09 nmol mol−1 for N2O (HFD ECD). The average standard deviation (spread) of values are slightly larger compared to the equivalent values calculated using the whole air RMs, indicating that, with the notable exception of the WAO FTIR CO2 measurement, the synthetic air matrix is not significantly impacting the intra-network compatibility for other species and analysers. The maximum offset (excluding the WAO FTIR) for CO2 is only very slightly larger than that for the whole air, however for CH4 there appears to be a systematic dependence of the offsets on mole fraction, this is discussed further in Sect. 4.4. For N2O, the maximum offset is significantly larger than that for whole air although, all measurement results are within the uncertainty of the assigned values of the cylinders. Note, that for NPL-3064, it was not measured on either of the MHD CRDS instruments due to issues with regulator stem. Table 5 shows that for CH4 the standard error of the weighted mean for NPL-3064 is largest whilst for the other RMs it appears to approximately scale with mole fraction, with lower mole fractions corresponding to lower standard errors of the weighted mean. This may partly reflect the smaller number of measurements available, with CH4 in NPL-3064 measured at only five of the seven participating sites/instruments as the regulator stem was damaged during the intercomparison. When only considering the same five sites/instruments across the other synthetic air RMs, no clear relationship between standard error of the weighted mean and CH4 mole fraction was observed.
4.4 Assessment of results from the synthetic air reference materials and implications for traceability
The synthetic air RMs were prepared gravimetrically, allowing uncertainties associated with the preparation process, including potential loss of material to the cylinder walls and validation of the prepared mixtures, to be quantified and incorporated into the uncertainty budget (Brewer et al., 2018). The values and associated uncertainty assigned to RMs prepared this way provide SI traceability of the mole fractions. These uncertainties are evaluated through key comparison exercises involving independent SI-traceable realisations (see Sect. 4.4.2. for details on key comparisons) (Flores et al., 2015, 2019; Viallon et al., 2023). The measurements of the synthetic air RMs were made following the standard calibration procedures at each site, i.e. instruments are calibrated using whole air standards, which are themselves traceable to WMO-NOAA scales. As a result, the measured values obtained for the synthetic air RMs are traceable to the scale-defined values rather than an independent, SI-traceable realisation. In other words, the calibration chain effectively links the synthetic air measurements back to the WMO-NOAA scale through the whole air standards used for instrument calibration. Consequently, while the measurements generally demonstrate good internal consistency amongst the RMs, they do not provide a direct assessment of the absolute accuracy of the synthetic air standards themselves but rather provide a comparison between the SI and WMO-NOAA traceability routes. None of the RMs show a large systematic residual for the SI-traceable RMs, in line with the results of the CIPM key comparisons (see Sect. 4.4.2).
Figure 4 shows an offset between the SI-assigned value of the CH4 RMs and the measured value. This offset lies within the uncertainty of the SI-assigned values (see Table 2), suggesting that, over the mole fraction range investigated here, measurements traceable to the WMO-CH4-X2004A scale are consistent with the SI-traceable assigned values within their stated uncertainties. This provides evidence of consistency between the WMO-NOAA and SI traceability routes for CH4 within the scope of this study. However, the monotonic increase in the magnitude of the offset with increasing mole fraction (see CH4 on the right-hand side (RHS) of Fig. 3) could indicate the presence of a systematic difference between the two approaches. Comparison against a larger suite of SI-traceable RMs would be required to begin to confirm the existence of this effect. For CO2 and N2O, Fig. 3 (RHS) shows the uncertainties on the SI-traceable RMs are significantly larger compared to the compatibility goals, demonstrating that these SI-traceable RMs would not be suitable for use as calibration gases or working standards within an atmospheric monitoring network. It is interesting to note that the actual agreement between the network-average weighted means and the SI-traceable assigned values is much better than would be expected based on these uncertainties and the mean coefficient of variation for the synthetic RMs is smaller compared to the whole air RMs (see Table 3). Again, further measurement of a larger suite of SI-traceable RMs is needed to begin to establish whether this is reflective of overestimation of the SI-traceable uncertainties.
Taken together, these results provide insight into where SI-traceable synthetic air RMs may have value within atmospheric monitoring networks and where further development is required. For CH4, the uncertainties achieved are approaching those required for atmospheric monitoring, suggesting that synthetic air RMs could potentially support applications where the highest level of network compatibility is not required. However, their use as multi-species calibration standards for high-precision monitoring is currently limited by the larger uncertainties associated with CO2 and N2O. This is particularly relevant for monitoring stations where a single RM may be used to calibrate multiple GHG species. At present, scale-traceable whole air RMs therefore remain necessary where the highest levels of network compatibility is required.
4.4.1 Unquantified matrix effects
In this study, the compositions of the major components of the synthetic air RMs were chosen to closely match atmospheric levels, thereby minimising the potential for matrix-induced effects (see Table 2 for mole fractions of Ar, O2 and N2 in the synthetic air RMs used in this study). There is a large potential for offsets between assigned and measured values due to matrix effects that arise from differences in the proportions of the major constituents that make up the synthetic air for synthetic RMs. The absence of a particular inert constituent (e.g., Ar) can lead to pressure broadening for spectroscopic analysers as the analyte of interest interacts with surrounding molecules, thus broadening the spectral line (Griffith, 1982, 1996; Griffith et al., 1982). The strength of this effect will depend on the measurement technique and how the spectrum is being analysed. For example, an analyser that uses peak height (e.g., CRDS) will not be affected in the same way as an analyser that fits the whole peak shape (e.g., FTIR). For this reason, it has long been the practice and recommendation of atmospheric measurement networks to prepare calibration material using whole air to best match the makeup composition between the calibration gas/working standard and the sample air being measured (WMO, 1982). It seems evident from Figs. 2 and 4 that assessing the network using synthetic standards can lead to increased variability between sites for certain species and that it is likely that matrix effects contribute to this. The matrix effects appear to be most apparent for CO2, where the CRDS instruments are in close agreement with each other, but are significantly different from the FTIR. Therefore, it is essential that any matrix effects on the network are fully understood and that the potential for these is minimised during the production of the synthetic air RMs; this could include adding other trace species (e.g., helium or neon) to better match the composition of whole air.
It should be noted that differences in isotopic composition between synthetic and whole air RMs may provide an additional source of measurement bias. This effect may vary between measurement techniques depending on their spectral sensitivity and the isotopologues used to determine the mole fractions. As isotopic composition of the synthetic air RMs was not characterised in this study, the magnitude of any such effect cannot be assessed here.
4.4.2 Key Comparisons
Key comparisons, conducted under the framework of the CIPM (International Committee for Weights and Measures) Mutual Recognition Arrangement (MRA), are designed to assess the equivalence of measurement standards maintained by NMIs. Although NOAA is not an NMI, it participates in the CIPM MRA framework as a designated institute of the WMO, reflecting its role as the WMO/GAW CCL for CO2, CH4, N2O, CO and SF6. Their purpose is to demonstrate global comparability of RMs and calibration capabilities, ensuring that measurements made across different countries remain consistent and traceable to the SI within stated uncertainties. The results establish the best-case performance achievable by the RMs, independent of field-specific influences such as instrument drift, site-to-site and instrument-to-instrument agreement, or calibration-chain differences. In contrast, the results from this intercomparison exercise reflect the applied performance of those RMs when deployed to atmospheric monitoring sites. Evaluating how applied performance of the RMs compare to the best-case performance allows the assessment of how uncertainties arising from the RMs translate into uncertainties observed under operational conditions.
The three comparisons, CCQM-K120 for CO2 (Flores et al., 2019), CCQM-K82 for CH4 (Flores et al., 2015), and CCQM-K68 for N2O (Viallon et al., 2023), all show good consistency between NMIs, but the degree of agreement varies depending on the gas. While the primary purpose of these key comparisons is to assess agreement between independently realised standards from participating laboratories, the submission of multiple standards by individual participants also provides information on within-laboratory consistency. This provides an indication of the consistency achievable from a common laboratory realisation. For CO2 (K120), the degrees of equivalence for standards submitted by the same participant were generally more consistent than the overall standard deviation between participants, although differences were still on a similar order to the WMO/GAW compatibility goals. This suggests that for CO2, where atmospheric measurement networks require very high precision, maintaining a common calibration scale such as the WMO-NOAA scale remains essential to ensure inter-comparability across laboratories and long-term stability. In contrast, the results for CH4 (K82) showed somewhat larger variability between participants compared to K120, although the overall between-laboratory variability was within the WMO/GAW compatibility goals. The K82 results also showed relatively low within-laboratory variability for the majority of participants. This indicates that, while a scale approach provides improved precision, the current level of agreement between independent realisations is sufficient for CH4 monitoring needs with respect to the WMO/GAW goals. For N2O (K68), the degree of within-laboratory consistency was notably high, and below the standard deviation observed from the between-laboratory comparison. This strong within-laboratory agreement was identified in the K68 report as supporting a scale-based approach. Such an approach is particularly advantageous for N2O, where the required WMO/GAW compatibility goals are the most stringent.
Figure 3 (RHS) shows that for CO2 in synthetic air the WMO extended network compatibility goals are not met due to the associated uncertainties being too large (where the main contributing uncertainty is from the SI-traceable assigned value, as is the case with CH4 and N2O, see Tables 2 and 4 for measurement value and SI-traceable value uncertainties). For CH4, Fig. 3 (RHS) shows that the uncertainties are on the same order of magnitude as the extended WMO/GAW compatibility goal, which aligns with K82 in that it is the gas with SI-traceable uncertainties closest to meeting WMO/GAW compatibility goals. These results are again consistent with the key comparison results, in that we are unable to achieve WMO/GAW extended network compatibility goals, and a scale-based approach would be able to provide higher levels of precision for monitoring requirements. While the key comparison results show agreement between NMIs on the same order of magnitude as the WMO/GAW network compatibility goals, it is important to recognise that these results represent a best-case performance. To ensure negligible offsets and maintain comparability at the level achieved by a scale-based approach, measurement uncertainties in key comparisons would need to be reduced by a further factor of three to four to account for the additional sources of variability encountered in field conditions.
Further development of synthetic air RMs should therefore focus not only on reducing SI-traceable assigned value uncertainties, but also on ensuring that these values can be reliably transferred to atmospheric measurements on the order of magnitude required for high precision monitoring. This will require improved characterisation of matrix and instrument dependent responses, response to non-linearity across relevant mole fraction ranges, isotopic composition and long-term stability. Addressing these factors will help establish the extent to which synthetic air RMs could provide a scalable complement to whole air, scale-traceable RMs as atmospheric monitoring networks continue to expand.
This intercomparison, for the first time, used both scale-traceable whole air and SI-traceable synthetic air RMs to provide insight into the performance and internal consistency of GHG measurements within the UK and Ireland atmospheric monitoring network. By evaluating measurements of CO2, CH4 and N2O across multiple sites and instruments, the study offers an assessment of site-to-site and instrument-to-instrument agreement under field conditions. The measured mole fractions for each cylinder, at each site were then compared with the assigned value on the WMO-NOAA scale and the SI-traceable values for the whole air and synthetic air RMs, respectively. This allowed a comparison of the traceability routes within the monitoring network.
Whole air RMs, which are traceable to the WMO-NOAA calibration scales, showed minimal network-average biases for CO2 and CH4 that are within or very close to the WMO/GAW compatibility goals. This reflects the stability and linearity of the measurement techniques for these gases, the stability of whole air mixtures, and the robustness of scale-traceable calibration procedures. However, it is important to note that instrument-specific effects, including drift, non-linearity, and differences in calibration implementation, also contribute to differences between sites and should be considered when interpreting network compatibility. In contrast, N2O shows network-average biases that were outside the compatibility goals and also exhibited larger standard deviation across sites relative to these goals. This is consistent with known challenges associated with the relatively poorer measurement precision for this species.
For the synthetic RMs used in this study, the certified SI-traceable assigned values had associated uncertainties that were comparable to the extended compatibility goal for CH4, whereas the corresponding assigned value uncertainties for CO2 and N2O were larger than both the compatibility and extended compatibility goals. Despite this, the standard deviation of the synthetic RMs are in closer agreement to that of the whole RMs than what would be expected from the SI-traceable uncertainties. These results suggest that synthetic air RMs have potential to support atmospheric monitoring as their performance continues to improve, particularly for CH4. However, their use as multi-species calibration standards for high precision monitoring is currently constrained by larger uncertainties associated with CO2 and N2O. Taken together, the results show that whole air RMs remain essential for high-precision calibration and achieving WMO/GAW compatibility goals. Continued reductions in synthetic RM uncertainties, along with improved characterisation of matrix effects, mole fraction dependant instrument responses, isotopic effects, and long-term stability, are critical in order for synthetic, SI-traceable air to become suitable for high-precision atmospheric monitoring. Addressing these limitations will help establish the extent to which synthetic air RMs could provide a complementary and scalable source of RMs for expanding atmospheric monitoring networks.
Data used in this paper are available in the Supplement.
The supplement related to this article is available online at https://doi.org/10.5194/amt-19-6921-2026-supplement.
ES led the research, performed all data visualizations, and developed the concepts and results. Round robin measurements at HFD were conducted by CR, ES and DK, at WAO by GF, at BSD, RGL and TAC by JP, SOD, DY, KC and KS and at MHD by GS. ACM and NG ran the UEA CFF and filled the whole air reference materials respectively. DM, ML and MR provided the instrumentation used at the MHD site. ES wrote the original draft of the paper, with JP, GF, CR, DK and KS contributing to the editing and review process.
The contact author has declared that none of the authors has any competing interests.
Publisher's note: Copernicus Publications remains neutral with regard to jurisdictional claims made in the text, published maps, institutional affiliations, or any other geographical representation in this paper. The authors bear the ultimate responsibility for providing appropriate place names. Views expressed in the text are those of the authors and do not necessarily reflect the views of the publisher.
We thank Christoph Zellweger and Andrew Crotwell for useful discussions regarding the WMO scales and contributions to assessing calibration scale uncertainty. We thank Aimee Hillier for preparing the synthetic air reference materials.
This work was supported by funding from the National Measurement System by the UK Department for Science, Innovation and Technology, and the NERC – Building a Green Future: GEMMA Greenhouse Gas Emissions Measurement and Modelling Advancement project (grant no. NE/Y001788/1). We thank the Department for Energy Security and Net Zero (DESNZ) (contract no. TRN5488/11/2021) for supporting the UK DECC network.
This paper was edited by Andreas Zahn and reviewed by two anonymous referees.
Adcock, K. E., Pickers, P. A., Manning, A. C., Forster, G. L., Fleming, L. S., Barningham, T., Wilson, P. A., Kozlova, E. A., Hewitt, M., Etchells, A. J., and Macdonald, A. J.: 12 years of continuous atmospheric O2, CO2 and APO data from Weybourne Atmospheric Observatory in the United Kingdom, Earth Syst. Sci. Data, 15, 5183–5206, https://doi.org/10.5194/essd-15-5183-2023, 2023.
Brewer, P. J., Brown, R. J. C., Tarasova, O. A., Hall, B., Rhoderick, G. C., and Wielgosz, R. I.: SI traceability and scales for underpinning atmospheric monitoring of greenhouse gases, Metrologia, 55, S174, https://doi.org/10.1088/1681-7575/aad830, 2018.
Buchmann, B., Klausen, J., and Zellweger, C.: Traceability of Long-Term Atmospheric Composition Observations across Global Monitoring Networks: Chemical Metrology Applied to the Measurements of Constituents in Air, Water, and Soil, Chimia, 63, 657–657, https://doi.org/10.2533/chimia.2009.657, 2009.
Carbon Cycle Greenhouse Gases – NOAA Global Monitoring Laboratory: GGGRN Data, https://gml.noaa.gov/ccgg/data/index.html, last access: 2 March 2026.
Ciais, P., Dolman, A. J., Bombelli, A., Duren, R., Peregon, A., Rayner, P. J., Miller, C., Gobron, N., Kinderman, G., Marland, G., Gruber, N., Chevallier, F., Andres, R. J., Balsamo, G., Bopp, L., Bréon, F.-M., Broquet, G., Dargaville, R., Battin, T. J., Borges, A., Bovensmann, H., Buchwitz, M., Butler, J., Canadell, J. G., Cook, R. B., DeFries, R., Engelen, R., Gurney, K. R., Heinze, C., Heimann, M., Held, A., Henry, M., Law, B., Luyssaert, S., Miller, J., Moriyama, T., Moulin, C., Myneni, R. B., Nussli, C., Obersteiner, M., Ojima, D., Pan, Y., Paris, J.-D., Piao, S. L., Poulter, B., Plummer, S., Quegan, S., Raymond, P., Reichstein, M., Rivier, L., Sabine, C., Schimel, D., Tarasova, O., Valentini, R., Wang, R., van der Werf, G., Wickland, D., Williams, M., and Zehner, C.: Current systematic carbon-cycle observations and the need for implementing a policy-relevant carbon observing system, Biogeosciences, 11, 3547–3602, https://doi.org/10.5194/bg-11-3547-2014, 2014.
Corazza, M., Bergamaschi, P., Vermeulen, A. T., Aalto, T., Haszpra, L., Meinhardt, F., O'Doherty, S., Thompson, R., Moncrieff, J., Popa, E., Steinbacher, M., Jordan, A., Dlugokencky, E., Brühl, C., Krol, M., and Dentener, F.: Inverse modelling of European N2O emissions: assimilating observations from different networks, Atmos. Chem. Phys., 11, 2381–2398, https://doi.org/10.5194/acp-11-2381-2011, 2011.
Dlugokencky, E. J., Myers, R. C., Lang, P. M., Masarie, K. A., Crotwell, A. M., Thoning, K. W., Hall, B. D., Elkins, J. W., and Steele, L. P.: Conversion of NOAA atmospheric dry air CH4 mole fractions to a gravimetrically prepared standard scale, J. Geophys. Res.-Atmos., 110, D18, https://doi.org/10.1029/2005JD006035, 2005.
Flores, E., Viallon, J., Choteau, T., Moussay, P., Wielgosz, R. I., Kang, N., Kim, B. M., Zalewska, E., van der Veen, A., Konopelko, L., Wu, H., Han, Q., Rhoderick, G., Guenther, F. R., Watanabe, T., Shimosaka, T., Kato, K., Hall, B., and Brewer, P.: International comparison CCQM-K82: methane in air at ambient level (1800 to 2200) nmol/mol, Metrologia, 52, 08001, https://doi.org/10.1088/0026-1394/52/1A/08001, 2015.
Flores, E., Viallon, J., Choteau, T., Moussay, P., Idrees, F., Wielgosz, R. I., Lee, J., Zalewska, E., Nieuwenkamp, G., Veen, A. van der, Konopelko, L. A., Kustikov, Y. A., Kolobova, A. V., Chubchenko, Y. K., Efremova, O. V., Zhe, B. I., Zhou, Z., Zhou, Z., Jr, W. R. M., Rhoderick, G. C., Hodge, J. T., Shimosaka, T., Aoki, N., Hall, B., Brewer, P., Cieciora, D., Sega, M., Macé, T., Fükő, J., Szilágyi, Z. N., Büki, T., Jozela, M. I., Ntsasa, N. G., Leshabane, N., Tshilongo, J., Johri, P., and Tarhan, T.: CCQM-K120 (Carbon dioxide at background and urban level), Metrologia, 56, 08001, https://doi.org/10.1088/0026-1394/56/1A/08001, 2019.
Ganesan, A. L., Rigby, M., Zammit-Mangion, A., Manning, A. J., Prinn, R. G., Fraser, P. J., Harth, C. M., Kim, K.-R., Krummel, P. B., Li, S., Mühle, J., O'Doherty, S. J., Park, S., Salameh, P. K., Steele, L. P., and Weiss, R. F.: Characterization of uncertainties in atmospheric trace gas inversions using hierarchical Bayesian methods, Atmos. Chem. Phys., 14, 3855–3864, https://doi.org/10.5194/acp-14-3855-2014, 2014.
Griffith, D. W. T.: Synthetic Calibration and Quantitative Analysis of Gas-Phase FT-IR Spectra, Appl. Spectrosc., 50, 59–70, https://doi.org/10.1366/0003702963906627, 1996.
Griffith, D. W. T.: Calculations of carrier gas effects in non-dispersive infrared analyzers I. Theory, Tellus, 34, 376–384, https://doi.org/10.3402/tellusa.v34i4.10824, 1982.
Griffith, D. W. T., Keeling, C. D., Adams, J. A., Guenther, P. R., and Bacastow, R. B.: Calculations of carrier gas effects in non-dispersive infrared analyzers. II. Comparisons with experiment, Tellus, 34, 385–397, https://doi.org/10.1111/j.2153-3490.1982.tb01828.x, 1982.
Griffith, D. W. T., Deutscher, N. M., Caldow, C., Kettlewell, G., Riggenbach, M., and Hammer, S.: A Fourier transform infrared trace gas and isotope analyser for atmospheric applications, Atmos. Meas. Tech., 5, 2481–2498, https://doi.org/10.5194/amt-5-2481-2012, 2012.
Gurney, K. R., Huang, J., and Coltin, K.: Bias present in US federal agency power plant CO2 emissions data and implications for the US clean power plan, Environ. Res. Lett, 11, 064005, https://doi.org/10.1088/1748-9326/11/6/064005, 2016.
Hall, B. D., Engel, A., Mühle, J., Elkins, J. W., Artuso, F., Atlas, E., Aydin, M., Blake, D., Brunke, E.-G., Chiavarini, S., Fraser, P. J., Happell, J., Krummel, P. B., Levin, I., Loewenstein, M., Maione, M., Montzka, S. A., O'Doherty, S., Reimann, S., Rhoderick, G., Saltzman, E. S., Scheel, H. E., Steele, L. P., Vollmer, M. K., Weiss, R. F., Worthy, D., and Yokouchi, Y.: Results from the International Halocarbons in Air Comparison Experiment (IHALACE), Atmos. Meas. Tech., 7, 469–490, https://doi.org/10.5194/amt-7-469-2014, 2014.
Hall, B. D., Crotwell, A. M., Miller, B. R., Schibig, M., and Elkins, J. W.: Gravimetrically prepared carbon dioxide standards in support of atmospheric research, Atmos. Meas. Tech., 12, 517–524, https://doi.org/10.5194/amt-12-517-2019, 2019.
Hall, B. D., Crotwell, A. M., Kitzis, D. R., Mefford, T., Miller, B. R., Schibig, M. F., and Tans, P. P.: Revision of the World Meteorological Organization Global Atmosphere Watch (WMO/GAW) CO2 calibration scale, Atmos. Meas. Tech., 14, 3015–3032, https://doi.org/10.5194/amt-14-3015-2021, 2021.
Hammer, S., Griffith, D. W. T., Konrad, G., Vardag, S., Caldow, C., and Levin, I.: Assessment of a multi-species in situ FTIR for precise atmospheric greenhouse gas observations, Atmos. Meas. Tech., 6, 1153–1170, https://doi.org/10.5194/amt-6-1153-2013, 2013.
Heiskanen, J., Brümmer, C., Buchmann, N., Calfapietra, C., Chen, H., Gielen, B., Gkritzalis, T., Hammer, S., Hartman, S., Herbst, M., Janssens, I. A., Jordan, A., Juurola, E., Karstens, U., Kasurinen, V., Kruijt, B., Lankreijer, H., Levin, I., Linderson, M.-L., Loustau, D., Merbold, Myhre, C. L., Papale, D., Pavelka, M., Pilegaard, K., Ramonet, M., Rebmann, C., Rinne, J., Rivier, L., Saltikoff, E., Sanders, R., Steinbacher, M., Steinhoff, T., Watson, A., Vermeulen, A. T., Vesala, T., Vítková, G., and Kutsch, W.: The Integrated Carbon Observation System in Europe, B. Am. Meteor. Soc., 103, E855–E872, https://doi.org/10.1175/BAMS-D-19-0364.1, 2022.
Integrated Carbon Observation System (ICOS): Integrated Carbon Observation System (ICOS), https://www.icos-ri.eu, last access: 15 January 2026.
Intergovernmental Panel on Climate Change (IPCC): AR6 Synthesis Report: Climate Change: https://www.ipcc.ch/report/sixth-assessment-report-cycle/ (last access 8 July 2025), 2023.
ISO 6142-1:2015 Gas analysis – Preparation of calibration gas mixtures, Part 1: Gravimetric method for Class I mixtures; International Organization for Standardization (ISO), Geneva, Switzerland, https://www.iso.org/standard/59631.html (last access: 20 October 2026), 2015.
Jordan, A. and Damak, F.: ICOS CAL – Quality Control Report 2024, ICOS Carbon Portal, https://doi.org/10.18160/V2NS-9WXH, 2025.
Kikaj, D., Chung, E., Griffiths, A. D., Chambers, S. D., Forster, G., Wenger, A., Pickers, P., Rennick, C., O'Doherty, S., Pitt, J., Stanley, K., Young, D., Fleming, L. S., Adcock, K., Safi, E., and Arnold, T.: Direct high-precision radon quantification for interpreting high-frequency greenhouse gas measurements, Atmos. Meas. Tech., 18, 151–175, https://doi.org/10.5194/amt-18-151-2025, 2025.
Lebegue, B., Schmidt, M., Ramonet, M., Wastine, B., Yver Kwok, C., Laurent, O., Belviso, S., Guemri, A., Philippon, C., Smith, J., and Conil, S.: Comparison of nitrous oxide (N2O) analyzers for high-precision measurements of atmospheric mole fractions, Atmos. Meas. Tech., 9, 1221–1238, https://doi.org/10.5194/amt-9-1221-2016, 2016.
Lee, J., Moon, D., Lee, J., Lim, J., Hall, B., Novelli, P., Brewer, P. J., Miller, M., Murugun, A., Minarro, M. D., Qiao, H., Shuguo, H., Konopelko, L. A., Kustikov, Y. A., Kolobova, A. V., Pankratov, V. V., Wasserman, I. I., Zav'yalov, S. V., Efremova, O. V., Pavlov, M. V., Mitchell, G., Guenther, F., Walden, J., Aoki, N., Shimosaka, T., Tatiana, M., Lagler, F., and Borowiak, A.: International comparison CCQM-K84 – carbon monoxide in synthetic air at ambient level, Metrologia, 54, 08016, https://doi.org/10.1088/0026-1394/54/1A/08016, 2017.
Lim, J. S., Park, M., Lee, J., and Lee, J.: Validation of spectroscopic gas analyzer accuracy using gravimetric standard gas mixtures: impact of background gas composition on CO2 quantitation by cavity ring-down spectroscopy, Atmos. Meas. Tech., 10, 4613–4621, https://doi.org/10.5194/amt-10-4613-2017, 2017.
Manning, A. J., O'Doherty, S., Jones, A. R., Simmonds, P. G., and Derwent, R. G.: Estimating UK methane and nitrous oxide emissions from 1990 to 2007 using an inversion modeling approach, J. Geophys. Res.-Atmos., 116, D02305, https://doi.org/10.1029/2010JD014763, 2011.
Manning, A. J., Redington, A. L., Say, D., O'Doherty, S., Young, D., Simmonds, P. G., Vollmer, M. K., Mühle, J., Arduini, J., Spain, G., Wisher, A., Maione, M., Schuck, T. J., Stanley, K., Reimann, S., Engel, A., Krummel, P. B., Fraser, P. J., Harth, C. M., Salameh, P. K., Weiss, R. F., Gluckman, R., Brown, P. N., Watterson, J. D., and Arnold, T.: Evidence of a recent decline in UK emissions of hydrofluorocarbons determined by the InTEM inverse model and atmospheric measurements, Atmos. Chem. Phys., 21, 12739–12755, https://doi.org/10.5194/acp-21-12739-2021, 2021.
Montgomery, D. C. and Runger, G. C.: Applied Statistics and Probability for Engineers, 7th Edition, Wiley, 244–280, ISBN 978-1-119-40036-3, https://www.wiley.com/en-us/applied-statistics-and-probability-for-engineers-7th-edition-p-9781119400363 (last access: 20 October 2026), 2014.
Nisbet, E. and Weiss, R.: Top-Down Versus Bottom-Up, Science, 328, 1241–1243, https://doi.org/10.1126/science.1189936. 2010.
Petit, J. R., Jouzel, J., Raynaud, D., Barkov, N. I., Barnola, J.-M., Basile, I., Bender, M., Chappellaz, J., Davis, M., Delaygue, G., Delmotte, M., Kotlyakov, V. M., Legrand, M., Lipenkov, V. Y., Lorius, C., Pépin, L., Ritz, C., Saltzman, E., and Stievenard, M.: Climate and atmospheric history of the past 420,000 years from the Vostok ice core, Antarctica, Nature, 399, 429–436, https://doi.org/10.1038/20859, 1999.
Ramanathan, V. and Feng, Y.: Air pollution, greenhouse gases and climate change: Global and regional perspectives, Atmos. Environ., 43, 37–50, https://doi.org/10.1016/j.atmosenv.2008.09.063, 2009.
Stanley, K. M., Grant, A., O'Doherty, S., Young, D., Manning, A. J., Stavert, A. R., Spain, T. G., Salameh, P. K., Harth, C. M., Simmonds, P. G., Sturges, W. T., Oram, D. E., and Derwent, R. G.: Greenhouse gas measurements from a UK network of tall towers: technical description and first results, Atmos. Meas. Tech., 11, 1437–1458, https://doi.org/10.5194/amt-11-1437-2018, 2018.
Stavert, A. R., O'Doherty, S., Stanley, K., Young, D., Manning, A. J., Lunt, M. F., Rennick, C., and Arnold, T.: UK greenhouse gas measurements at two new tall towers for aiding emissions verification, Atmos. Meas. Tech., 12, 4495–4518, https://doi.org/10.5194/amt-12-4495-2019, 2019.
Viallon, J., Choteau, T., Flores, E., Idrees, F., Moussay, P., Wielgosz, R. I., Lim, J. S., Lee, J., Lee, J., Moon, D., Wijk, J. I. T. van, Persijn, S., Veen, A. M. H. van der, Efremova, O. V., Konopelko, L., Kustikov, Y., Kolobova, A., Klimov, A., Bi, Z., Cecelski, C., Carney, J., Toman, B., Possolo, A., Hall, B., Brewer, P., Worton, D., Saarnio, K., Aaltonen, H., Tshilongo, J., Mogale, D. M., Mphaphuli, G., and Marebane, P. M.: CCQM-K68.2019, nitrous oxide (N2O) in air, ambient level, final report, Metrologia, 60, 08011, https://doi.org/10.1088/0026-1394/60/1A/08011, 2023.
Welp, L. R., Keeling, R. F., Weiss, R. F., Paplawsky, W., and Heckman, S.: Design and performance of a Nafion dryer for continuous operation at CO2 and CH4 air monitoring sites, Atmos. Meas. Tech., 6, 1217–1226, https://doi.org/10.5194/amt-6-1217-2013, 2013.
Winderlich, J., Chen, H., Gerbig, C., Seifert, T., Kolle, O., Lavrič, J. V., Kaiser, C., Höfer, A., and Heimann, M.: Continuous low-maintenance measurements at the Zotino Tall Tower Observatory (ZOTTO) in Central Siberia, Atmos. Meas. Tech., 3, 1113–1128, https://doi.org/10.5194/amt-3-1113-2010, 2010.
WMO: Report of the meeting of experts on potential climate effects of ozone and other minor trace gases, 13-17 September 1982, Boulder Colorado, Rep. No. 14, https://library.wmo.int/idurl/4/501571982 (last access: 20 October 2026), 1982.
WMO: Integrated Global Greenhouse Gas Information System Good Practice Guidance for Estimating National-scale Greenhouse Gas Emissions using Atmospheric Observations, GAW Rep. No. 319, Geneva, Switzerland, https://library.wmo.int/idurl/4/69714 (last access: 20 October 2026), 2025.
WMO: Twenty Second WMO/IAEA Meeting on Carbon Dioxide, Other Greenhouse Gases and Related Tracer Measurement Techniques (GGMT 2024), 5–8 August 2024, Sao Josè Campos, Brazil, GAW Rep. No. 317, Geneva, Switzerland, https://library.wmo.int/idurl/4/69756 (last access: 20 October 2026), 2026.
Worthy, D. E. J., Rauh, M. K., Huang, L., Vogel, F. R., Chivulescu, A., Masarie, K. A., Langenfelds, R. L., Krummel, P. B., Allison, C. E., Crotwell, A. M., Madronich, M., Pétron, G., Levin, I., Hammer, S., Michel, S., Ramonet, M., Schmidt, M., Jordan, A., Moossen, H., Rothe, M., Keeling, R., and Morgan, E. J.: Results of a long-term international comparison of greenhouse gas and isotope measurements at the Global Atmosphere Watch (GAW) Observatory in Alert, Nunavut, Canada, Atmos. Meas. Tech., 16, 5909–5935, https://doi.org/10.5194/amt-16-5909-2023, 2023.
Yver Kwok, C., Laurent, O., Guemri, A., Philippon, C., Wastine, B., Rella, C. W., Vuillemin, C., Truong, F., Delmotte, M., Kazan, V., Darding, M., Lebègue, B., Kaiser, C., Xueref-Rémy, I., and Ramonet, M.: Comprehensive laboratory and field testing of cavity ring-down spectroscopy analyzers measuring H2O, CO2, CH4 and CO, Atmos. Meas. Tech., 8, 3867–3892, https://doi.org/10.5194/amt-8-3867-2015, 2015.
Yver-Kwok, C., Philippon, C., Bergamaschi, P., Biermann, T., Calzolari, F., Chen, H., Conil, S., Cristofanelli, P., Delmotte, M., Hatakka, J., Heliasz, M., Hermansen, O., Komínková, K., Kubistin, D., Kumps, N., Laurent, O., Laurila, T., Lehner, I., Levula, J., Lindauer, M., Lopez, M., Mammarella, I., Manca, G., Marklund, P., Metzger, J.-M., Mölder, M., Platt, S. M., Ramonet, M., Rivier, L., Scheeren, B., Sha, M. K., Smith, P., Steinbacher, M., Vítková, G., and Wyss, S.: Evaluation and optimization of ICOS atmosphere station data as part of the labeling process, Atmos. Meas. Tech., 14, 89–116, https://doi.org/10.5194/amt-14-89-2021, 2021.
Zellweger, C., Emmenegger, L., Firdaus, M., Hatakka, J., Heimann, M., Kozlova, E., Spain, T. G., Steinbacher, M., van der Schoot, M. V., and Buchmann, B.: Assessment of recent advances in measurement techniques for atmospheric carbon dioxide and methane observations, Atmos. Meas. Tech., 9, 4737–4757, https://doi.org/10.5194/amt-9-4737-2016, 2016.
Zellweger, C., Steinbrecher, R., Laurent, O., Lee, H., Kim, S., Emmenegger, L., Steinbacher, M., and Buchmann, B.: Recent advances in measurement techniques for atmospheric carbon monoxide and nitrous oxide observations, Atmos. Meas. Tech., 12, 5863–5878, https://doi.org/10.5194/amt-12-5863-2019, 2019.