
the Creative Commons Attribution 4.0 License.
the Creative Commons Attribution 4.0 License.
 | 02 Nov 2026
Validation of ATLID stratospheric aerosol retrievals using SAGE III/ISS and ground-based lidar observations
Eddy Poncet
Sergey Khaykin

Sophie Godin-Beekmann
Thierry Leblanc
We present a systematic validation of EarthCARE ATLID stratospheric aerosol retrievals against SAGE III/ISS and ground-based lidars at the Table Mountain Facility (TMF) and the Observatoire de Haute-Provence (OHP), using 895 SAGE III/ISS, 55 TMF, and 26 OHP collocations over August 2024 to April 2026 and spanning background, volcanic, and wildfire smoke conditions. We evaluate a Level-1-based extinction product, derived directly from the ATLID L1 scattering ratio. Against SAGE III/ISS, this L1 product yields a regression slope of 1.04 for the stratospheric aerosol optical depth (sAOD) and an overall median relative extinction difference of −2.2 %; across all matchups, the relative sAOD bias has a global mean of −3.2 % with a standard deviation of 65.7 %. As a function of altitude above the local tropopause, the median relative difference is negative in the first ∼ 3 km above the tropopause (about −10 % to −15 %), close to zero between about 5 and 15 km above the tropopause, and negative again further up; the sAOD comparison also shows a systematic negative bias in the Northern Hemisphere extratropics that increases with latitude. Independent backscatter comparisons against TMF and OHP also show a negative bias just above the tropopause (overall median differences of −5.5 % and −10.6 %, respectively), indicating that this feature originates in the Level-1 scattering-ratio retrieval itself rather than in the extinction-conversion step. Daytime collocations are markedly noisier than nighttime ones (relative-difference standard deviation of ∼ 32 % versus ∼ 17 %), although the median bias remains close to zero in both cases. In contrast, the native L2 product achieves a regression slope of only 0.64 against SAGE III/ISS sAOD, largely driven by frequent null retrievals under low-aerosol conditions. Even when excluding these missed detections, the correlation remains weak (R = 0.26), and the L2 product systematically overestimates peak extinction in dense plumes, making it unreliable for stratospheric monitoring in its current processing baseline.
- Article
(4857 KB) - Full-text XML
- BibTeX
- EndNote


The EarthCARE satellite mission, launched on 28 May 2024 as part of a collaboration between ESA (European Space Agency) and JAXA (Japan Aerospace Exploration Agency), carries four co-aligned instruments designed to characterize clouds, aerosols, and radiation from space (Wehr et al., 2023). Among these, the Atmospheric Lidar (ATLID) operates at 355 nm and provides vertically resolved profiles of aerosol backscatter, extinction, and depolarization ratio with an unprecedented combination of sensitivity and global coverage (ESA Earth Online, 2026). ATLID's high-spectral-resolution lidar (HSRL) capability allows the independent retrieval of the backscatter and extinction coefficients without prior assumptions on the lidar ratio, representing a significant advancement over conventional elastic-backscatter lidars (Fiocco and DeWolf, 1968; Shipley et al., 1983; Eisinger et al., 2024).
Stratospheric aerosols play a well-recognized role in climate variability and ozone chemistry, modulating the Earth's radiative budget and providing surfaces for heterogeneous chemical reactions (Kremser et al., 2016). Long-term monitoring of the stratospheric aerosol layer requires accurate, well-characterized observations from multiple platforms. Ground-based lidar networks such as NDACC (Network for the Detection of Atmospheric Composition Changes) provide continuous vertically resolved measurements at fixed locations (NDACC, 2026), while solar occultation instruments aboard satellites, most notably the Stratospheric Aerosol and Gas Experiment (SAGE) series, have historically provided the backbone of global stratospheric aerosol climatologies (Thomason and Knepp, 2023). The SAGE III instrument aboard the International Space Station (SAGE III/ISS), operational since 2017, continues this legacy by delivering high-quality extinction profiles at multiple wavelengths, from which 355 nm extinction can be derived.
The validation of ATLID stratospheric aerosol retrievals is a critical step before the data can be used for scientific applications. Complementary case-study validations of the operational ATLID Level-2 aerosol profiling products against ground-based lidars have recently been reported in the troposphere (Baars et al., 2026), whereas a systematic assessment in the stratosphere (the focus of the present study) is still lacking. This is particularly challenging in background conditions, where the aerosol signal is weak compared to molecular scattering. To address these challenges and thoroughly assess the official Level-2 (L2) performance, an alternative approach based on Level-1 backscatter signals and Rayleigh backscatter from meteorological data, described in Khaykin et al. (2026), is utilized to allow robust extinction retrieval even under low-aerosol conditions.
The study period (August 2024–April 2026) encompasses a diverse range of atmospheric conditions in the stratosphere, including background aerosol, the volcanic plume from the eruption of Ruang volcano (Indonesia) in April–May 2024 (Khaykin et al., 2026), and intense wildfire smoke injections into the lower stratosphere during the boreal summer of 2025 (Haarig et al., 2026). This variety offers a unique opportunity to assess ATLID's performance across contrasting aerosol regimes and to identify potential sources of systematic discrepancy between ATLID and independent observations.
In this paper, we present a systematic comparison of ATLID-derived stratospheric aerosol extinction and scattering ratio profiles with collocated SAGE III/ISS observations and ground-based lidar measurements from the Table Mountain Facility (TMF, California) and the Observatoire de Haute-Provence (OHP, France). We characterize the absolute and relative bias between ATLID and the reference instruments as a function of altitude, latitude, time, and aerosol loading, and we discuss the potential origins of observed discrepancies. The paper is organized as follows. Section 2 describes the instruments and data used in this study, the collocation methodology, and the comparison metrics. Section 3 presents the comparison results. Section 4 discusses the sources of the observed bias. Section 5 provides the conclusions.
2.1 The EarthCARE mission and ATLID instrument
Detailed descriptions of the EarthCARE mission and the ATLID instrument are provided by Wehr et al. (2023) and ESA Earth Online (2026); here we summarise only the characteristics relevant to the present study. EarthCARE orbits at approximately 393 km altitude in a sun-synchronous orbit with a 25 d repeat cycle. ATLID provides vertically resolved profiles of aerosol scattering ratio, backscatter, extinction, and linear depolarisation ratio with a vertical resolution of approximately 100 m below 20 km and 500 m above, and a nominal along-track horizontal resolution of approximately 285 m for single shots. For all ATLID products used in this study, we relied on the EarthCARE processing baselines BA, BB and BC, i.e. successive versions of the ESA ground-processing chain. Baselines are identified by two letters: the first denotes a major processing/reprocessing generation, and changes in the second indicate incremental updates. BA corresponds to the first homogeneous reprocessing of the EarthCARE data record with the B-generation processors, while BB and BC contain subsequent updates (Baars et al., 2026).
2.2 ATLID Level-1 extinction retrieval
The official ATLID Level-2 (L2) product provides aerosol extinction profiles derived from the HSRL (Donovan et al., 2024). However, as suggested by Khaykin et al. (2026) (hereafter K26) and confirmed in this study, the L2 processor frequently returns zero extinction under low-aerosol background conditions, in the absence of a sufficiently strong aerosol signal. For optically thicker layers such as volcanic plumes, the L2 algorithm does return non-zero extinction, but it overestimates the peak extinction (Sect. 3.2.2), and the resulting sAOD is only weakly correlated with the reference measurements (Sect. 3.6). To overcome this limitation and enable a systematic comparison across all aerosol regimes, we derive ATLID aerosol extinction directly from the Level-1 scattering ratio (SR) using the K26 method. This method retrieves the unattenuated particulate backscatter coefficient βaer from the molecular reference profile in three steps. First, the HSRL design of ATLID separates the particulate (Mie) and molecular (Rayleigh) contributions to the backscattered signal; since both are attenuated by the same two-way transmission, the ratio of the particulate attenuated backscatter (sum of the co-polar and cross-polar Mie signals of the L1 product) to the Rayleigh attenuated backscatter is free of attenuation and equals the ratio of the unattenuated particulate and molecular backscatter coefficients. Second, the molecular backscatter coefficient βmol is computed for Rayleigh scattering at 355 nm from the ECMWF pressure and temperature profiles provided with the Level-2 data, interpolated onto the ATLID vertical grid. Third, βaer is obtained by multiplying the attenuation-free ratio by βmol, i.e. βaer = . The aerosol extinction coefficient αaer is then obtained as:
where Saer is the lidar ratio. Because this derivation relies entirely on non-attenuated inputs derived from the molecular signal, the resulting extinction profiles are free from cumulative attenuation errors inherent to elastic-backscatter lidar inversions, though they remain sensitive to the lidar ratio.
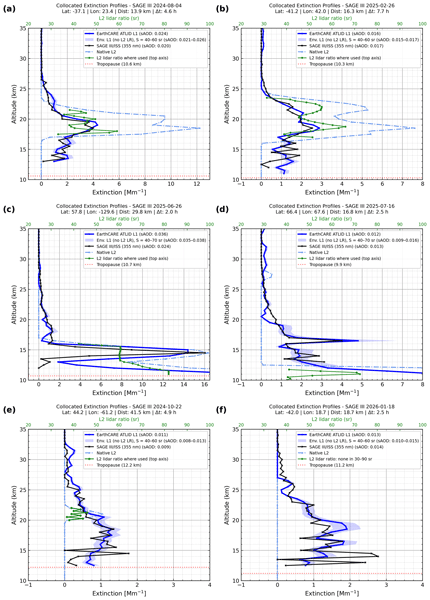
The aerosol extinction coefficient is derived from the ATLID L1 particulate backscatter coefficient using Eq. (1). Wherever the ATLID L2 lidar ratio is available and falls within physically realistic bounds (30–90 sr), it is used directly in the retrieval. In all other cases, including levels where the L2 processor returns zero extinction (no aerosol detected) or unphysical lidar ratios, a constant fallback value of 50 sr is applied, consistent with values reported in the literature for aged stratospheric sulfate aerosols (Kremser et al., 2016) (see Sect. 4.2 for the 355 nm case). The L2 lidar ratio therefore enters the L1-derived extinction only at the levels where it is available and lies between 30 and 90 sr, so issues affecting the L2 retrieval can affect the L1-derived product only at these levels, and only through the lidar ratio, not through the L2 extinction itself. Since the extinction is proportional to the lidar ratio, a relative error on the lidar ratio gives the same relative error on the extinction; with the 30–90 sr bounds, an erroneous L2 value can change the extinction by −40 % to +80 % relative to the 50 sr value at the levels concerned. The backscatter comparison with the ground-based lidars (Sect. 3.5) does not involve any lidar ratio and shows the same negative bias just above the tropopause, which indicates that the main features of the comparison are not driven by the L2 lidar ratio. The sensitivity of the retrieved extinction to the lidar ratio is illustrated for the case studies of Fig. 3 and discussed in Sect. 4.2.
Individual ATLID Level-1 profiles within each collocation window (see Sect. 2.5) are averaged to reduce random noise, and a 3-point boxcar smoothing is applied in the vertical dimension to the resulting mean profile. This smoothing improves the signal-to-noise ratio at stratospheric altitudes without significantly degrading the vertical resolution relevant to the features of interest.
2.3 SAGE III/ISS
The Stratospheric Aerosol and Gas Experiment III aboard the International Space Station (SAGE III/ISS) has been operational since June 2017 (Cisewski et al., 2014). It measures solar and lunar occultation spectra to retrieve vertically resolved profiles of aerosol extinction, ozone, water vapour, and other trace gases (Thomason and Knepp, 2023). The solar occultation technique provides self-calibrating, high-accuracy measurements with a vertical resolution of approximately 0.5 km. SAGE III/ISS delivers approximately 30–40 solar occultation profiles per day, distributed across two latitude bands that precess over time due to the ISS orbital inclination.
In this study, we use SAGE III/ISS Version 6 aerosol extinction profiles at 355 nm, derived from the 384 nm channel and converted to 355 nm using the Ångström exponent computed from the 384–521 nm wavelength pair, for the period August 2024–April 2026. Prior to use, profiles were screened following the quality-control (QC) recommendations provided with the Level-2 product. Occultations affected by event-level anomalies, including pointing, blockage, timing, thermal-control, or ephemeris issues, were excluded, as were altitude bins flagged for signal disturbance or interpolation artefacts. For the aerosol comparisons, only measurements classified as background, perturbed, or enhanced aerosol by the SAGE aerosol classification flag were retained; profiles flagged as transmission anomalies, aerosol–cloud mixtures, or polar stratospheric clouds were discarded. Finally, only positive extinction values with a relative uncertainty below 50 % were retained in the point-by-point comparison with ATLID. SAGE III/ISS constitutes the primary reference instrument for this validation study owing to its high measurement accuracy, self-calibrating nature, and the large number of collocations achievable with ATLID over the study period.
2.4 Ground-based lidar instruments
2.4.1 Table Mountain Facility (TMF)
The JPL (Jet Propulsion Laboratory) Table Mountain Facility (TMF; Leblanc et al., 2012; 34.38° N, 117.68° W, 2285 m a.s.l.) in California hosts the TMSOL (Table Mountain Stratospheric Ozone Lidar), operated by NASA's Jet Propulsion Laboratory within the NDACC network. Aerosol profiles are derived from nighttime-only, high-intensity UV Rayleigh (355 nm) and Raman (387 nm) lidar returns measured two to five times per week. The data are processed using the NDACC-compliant Global Lidar Analysis Software Suite (GLASS) v1 algorithm (Leblanc et al., 2016a, b), yielding aerosol backscatter and scattering ratio profiles at 355 nm normalised in an aerosol-free reference region between 32 and 36 km. The total uncertainty on the retrieved profiles is approximately 10 % throughout most of the stratosphere, with a vertical resolution ranging from a few tens of metres in the lowermost stratosphere to about 2.5 km in the upper stratosphere (Khaykin et al., 2026).
In this study, we use the standard NDACC aerosol backscatter coefficient product at 355 nm, screened according to the associated quality flags and averaged onto 2 km altitude layers. For the sAOD comparison (Sect. 3.3), TMF backscatter profiles are converted to extinction with a lidar ratio of 50 sr, while for the backscatter-based analysis (Sect. 3.5) we retain the native backscatter units and perform a direct comparison with ATLID L1 βaer.
2.4.2 Observatoire de Haute-Provence (OHP)
The Observatoire de Haute-Provence (OHP; 43.94° N, 5.71° E, 683 m a.s.l.), located in southern France and operated by LATMOS/IPSL within the NDACC network, has provided continuous stratospheric aerosol observations since the early 1990s using two independent lidar systems: LiO3S, operating at 355 nm, and LTA operating at 532 nm (Khaykin et al., 2017). In this study we use the LiO3S aerosol measurements at 355 nm, acquired at a mean rate of 10–12 nights per month (Godin-Beekmann et al., 2003; Khaykin et al., 2017). Vertical profiles of stratospheric aerosols are retrieved using the Sasano-Fernald inversion method, providing aerosol backscatter and extinction coefficients; the scattering ratio is computed as the ratio of total (molecular plus aerosol) to molecular backscatter, where the molecular contribution is derived from ECMWF meteorological analyses. The resulting profiles are reported at 150 m vertical resolution. A more detailed description of the instrument, retrieval methodology, and uncertainty budget is provided by Khaykin et al. (2017) and references therein.
OHP lidar data have previously been used for the validation of SAGE III/ISS aerosol extinction profiles (Knepp et al., 2020), demonstrating the suitability of this dataset as an independent stratospheric reference. In the present study, LiO3S backscatter profiles at 355 nm are treated identically to the TMF dataset and serve as an independent, ground-based validation reference at a Northern Hemisphere mid-latitude site in a different longitude sector. For the sAOD comparison (Sect. 3.3), the thermal tropopause altitude is obtained from the ECMWF meteorological data provided with the L2A product, and backscatter profiles are converted to extinction using a lidar ratio of 50 sr; for the backscatter-based analysis (Sect. 3.5), we retain the native backscatter units and perform a direct comparison with ATLID L1 βaer.
2.5 Collocation methodology
ATLID and SAGE III/ISS profiles are collocated using the following criteria: a maximum spatial separation of 50 km, computed using the haversine formula between the SAGE III occultation tangent point and each individual ATLID footprint, and a maximum temporal difference of 12 h between the SAGE III occultation time and the ATLID overpass. For each SAGE III occultation satisfying these criteria, all ATLID Level-1 profiles falling within the collocation window are averaged together, and the resulting mean profile is interpolated onto the SAGE III vertical grid with 500 m step. In the individual comparison figures, the distance (Dist) is the great-circle distance between the SAGE III/ISS tangent point and the closest of the averaged ATLID profiles, all of which lie within 50 km of the tangent point, and the time difference (Δt) is computed between the SAGE III/ISS event and each collocated ATLID overpass.
For ground-based lidar collocations, the same temporal criterion of 12 h is applied, with the spatial criterion adapted to the fixed station geometry: all ATLID overpasses occurring within a great-circle distance of 100 km from each lidar station are considered.
2.6 Comparison metrics
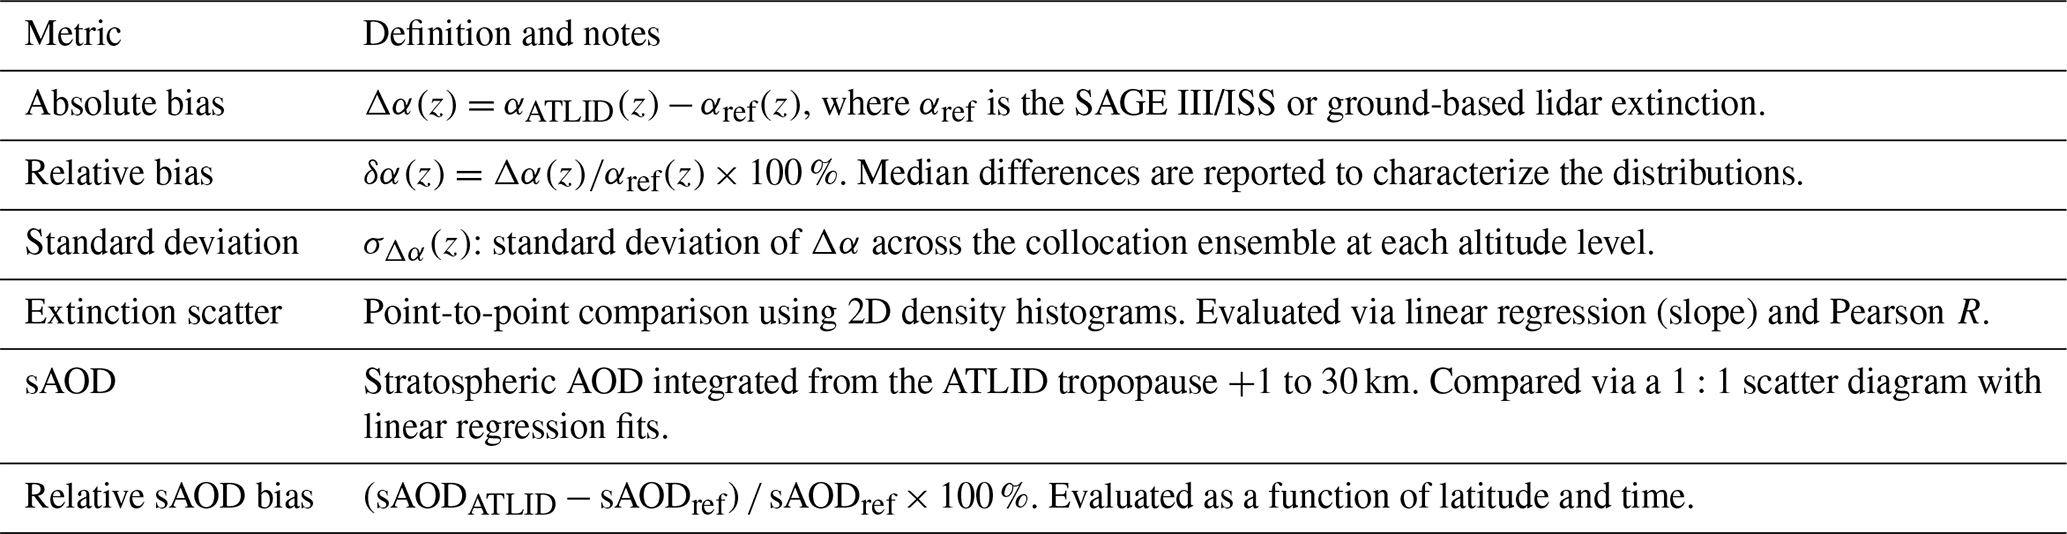
The agreement between ATLID and reference instruments is quantified using the metrics in Table 1, computed for the full collocation dataset.
Table 1Comparison metrics used in this study to evaluate ATLID L1 and L2 extinction products against SAGE III/ISS and ground-based lidar.
The following subsections present the validation results in a logical sequence. We first establish the dataset characteristics (Sect. 3.1) and quantify the agreement between ATLID L1 and SAGE III/ISS at the profile level (Sect. 3.2) and in terms of integrated stratospheric AOD (Sect. 3.3). We then examine the spatio-temporal distribution of the relative sAOD bias (Sect. 3.4) and test the consistency of these findings against an independent comparison with ground-based backscatter observations at OHP and TMF (Sect. 3.5). Finally, we place the L1 results in context by demonstrating the limitations of the native Level-2 product across all aerosol regimes (Sect. 3.6).
Before presenting these results, we briefly summarise the limitations of the native ATLID L2 aerosol product in the stratosphere, which motivate the use of the L1-based extinction throughout this study. The L2 processor frequently returns zero extinction under background conditions; when it does return non-zero extinction in optically thicker layers, it overestimates the peak extinction (Sect. 3.2.2), and the resulting sAOD is only weakly correlated with the reference measurements (Sect. 3.6).
3.1 Overview of the collocation dataset
Over the study period from August 2024 to April 2026, the ATLID-SAGE III/ISS collocation procedure described in Sect. 2.5 produced a total of 895 co-located profile pairs, providing a statistically robust sample for the evaluation of ATLID performance across diverse atmospheric conditions. The number of co-located overpasses with the ground-based lidar stations is considerably smaller, reflecting the fixed-station geometry and the 25 d repeat cycle of EarthCARE: 55 events at TMF and 26 at OHP.
3.2 Altitude-resolved extinction comparison with SAGE III/ISS
The comparison between ATLID L1 and SAGE III/ISS extinction coefficients is presented in Fig. 1. Figure 1a displays all collocated altitude-level pairs as a 2D density histogram, in which the colour scale encodes the local sample count on a logarithmic scale. The bulk of the distribution is concentrated in the range 0–2 Mm−1, consistent with the dominance of near-background aerosol conditions in the dataset (Sect. 3.1). A linear regression through the full sample yields a slope of 0.97 and a correlation coefficient of R = 0.79, indicating a reasonably strong point-to-point correlation with a slight systematic underestimation of SAGE III/ISS extinction by ATLID L1 (∼ 3 %). The scatter is substantial: a significant population of points lies well above the 1:1 line at low extinction (SAGE III/ISS < 2 Mm−1). This is expected from the random noise of the ATLID L1 extinction, which comes from the detection noise of the ATLID channels (in particular the Mie channels, whose signal is weak in the stratosphere) and whose absolute magnitude does not depend on the aerosol loading: a random error of roughly constant absolute magnitude produces a relative scatter that increases as the extinction decreases.
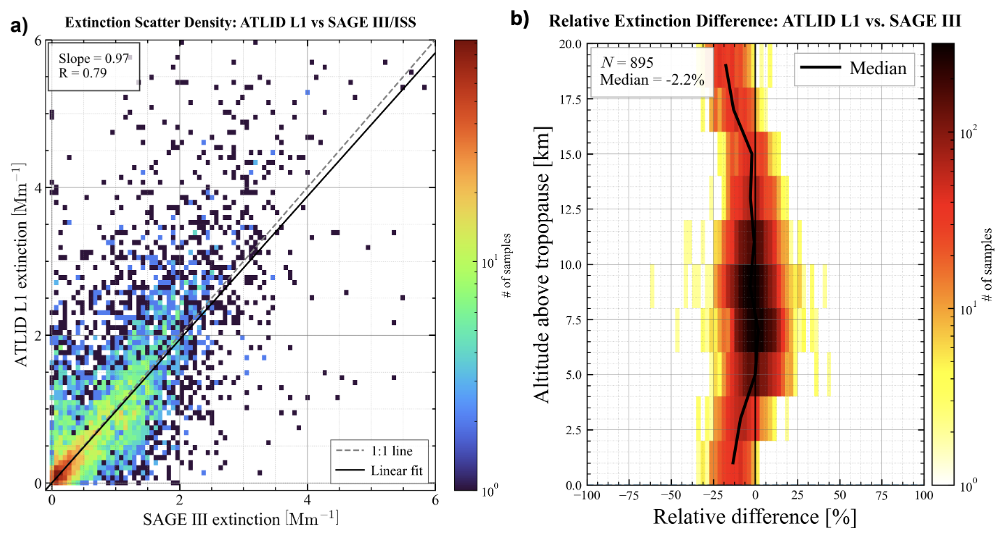
Figure 1Comparison between ATLID L1 and SAGE III/ISS extinction coefficients. (a) 2D density histogram for all collocated altitude-level pairs. The grey dashed line is the 1:1 reference; the solid black line is the ordinary least-squares linear regression (slope = 0.97, R = 0.79). (b) Distribution of the relative difference as a function of altitude relative to the local tropopause, z−ztrop (N = 895 collocated profiles; see Sect. 2.5 for the definition of the collocation criteria); only levels at least 1 km above the local tropopause are included. The solid black line shows the median relative difference in each altitude bin; the thin vertical line marks zero relative difference. The overall median is −2.2 %. For both panels, the colour scale gives the number of samples per bin on a logarithmic scale.
Figure 1b presents the distribution of the relative difference as a function of altitude relative to the local tropopause, z−ztrop (ATLID tropopause height; only levels at least 1 km above the tropopause are retained, consistent with the sAOD integration), for the full set of N = 895 collocated profiles (see Sect. 2.5). The overall median relative difference is −2.2 %, confirming the near-zero systematic bias suggested by the regression slope in Fig. 1a and consistent with the near-unity sAOD regression reported in Sect. 3.3. The spread is large at all altitudes, with the distribution spanning approximately ±25 % between the 10th and 90th percentiles, reflecting the dominant contribution of retrieval noise to individual altitude-level comparisons under background conditions.
The profile of the median bias (solid black line in Fig. 1b) reveals a distinct vertical structure. In the first ∼ 3 km above the tropopause, the median is negative (about −10 % to −15 %). Between about 5 and 15 km above the tropopause, it is close to zero, and it becomes negative again further up. Expressing the altitude relative to the local tropopause avoids mixing profiles with different tropopause heights; in geometric altitude, a small number of profiles with a low tropopause produced an apparent positive bias at 10–13 km. The small overall median of −2.2 % therefore hides an altitude-dependent structure, discussed further in Sect. 4.1, which is more physically meaningful than the single-number summary statistic.
3.2.1 Day-night dependence of the altitude-resolved bias
To assess whether the altitude-dependent bias structure identified above is affected by solar illumination, we separated the collocation ensemble according to the illumination conditions of the ATLID overpass, using the solar elevation angle (SEA) of the collocated EarthCARE overpass: SEA > 0° is classified as daytime and SEA ≤ 0° as nighttime. This classification refers only to the ATLID observations; it does not separate sunrise and sunset SAGE III/ISS occultations, which are made under the same measurement geometry. The relative difference profiles were recomputed for each subset (Fig. 2). Both panels show 2D histograms of the relative difference as a function of altitude above the local tropopause.
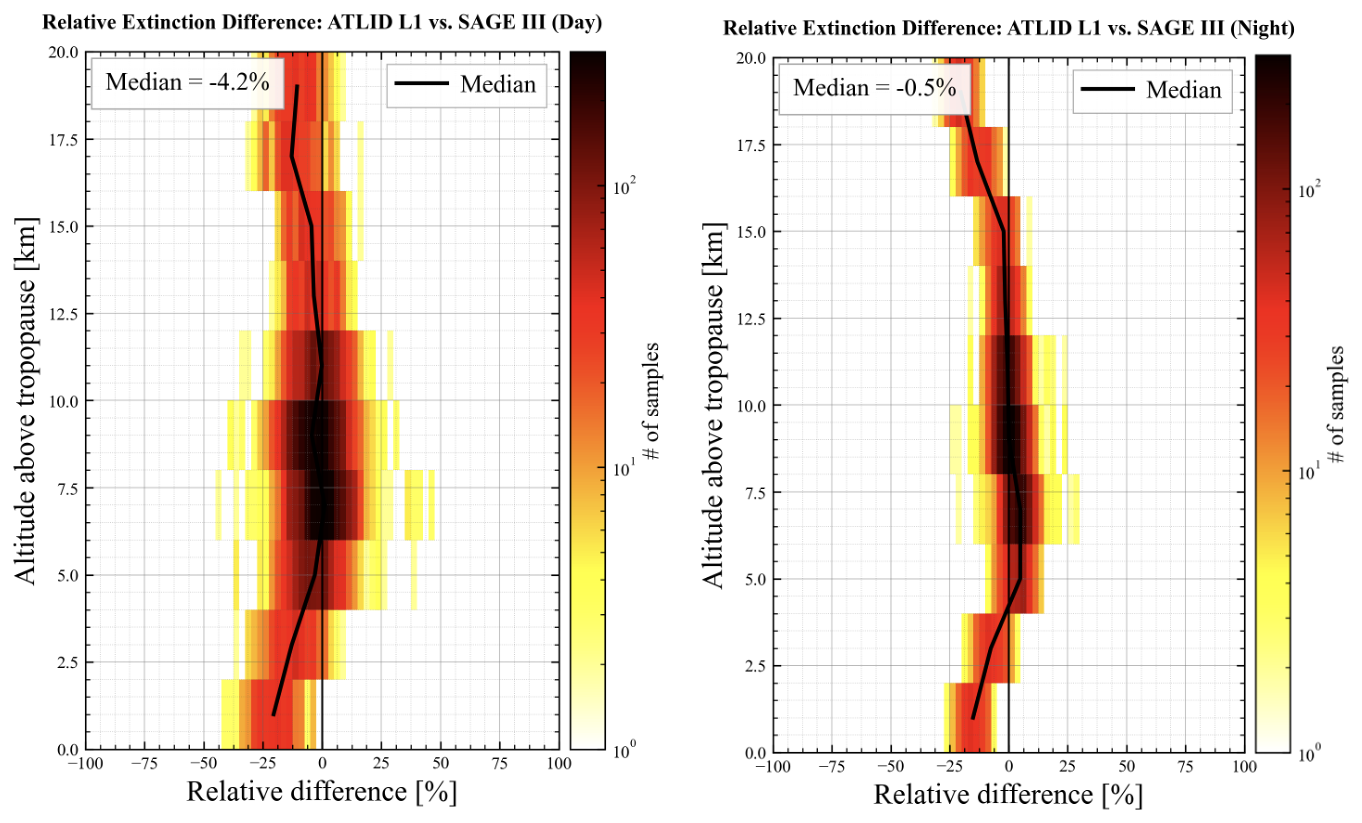
Figure 2Relative extinction difference between ATLID L1 and SAGE III/ISS as a function of altitude above the local tropopause, shown separately for (a) daytime ATLID overpasses (SEA > 0°) and (b) nighttime ATLID overpasses (SEA ≤ 0°). The colour scale gives the number of samples per bin on a logarithmic scale. The solid black line shows the altitude-resolved median; the inset in each panel reports the overall median relative difference over the displayed altitude range (−4.2 % for daytime and −0.5 % for nighttime).
The day and night subsets exhibit similar vertical structures, as expected since this structure is mainly governed by factors common to both subsets, such as the vertical distribution of the aerosol loading and the altitude relative to the tropopause. In both cases, the median relative difference follows the structure of the combined ensemble (Fig. 1b), while the spread of the distribution remains larger for the daytime subset at all altitudes.
Quantitatively, the overall median bias differs only slightly between the two subsets, with values of −4.2 % for day and −0.5 % for night. A more striking difference concerns the spread of the distribution: the collocations with nighttime ATLID overpasses exhibit a substantially narrower dispersion at all altitudes than those with daytime overpasses, as is clearly visible in Fig. 2. Quantitatively, the mean standard deviation of the relative differences, averaged over all altitude bins, amounts to ∼ 32 % for the daytime subset and ∼ 17 % for the nighttime subset.
The small day-night offset in median bias is well within the altitude-to-altitude variability of the median profiles of the relative difference (black lines in Fig. 2) and considerably smaller than the typical percentile spread at a given height, indicating that the ATLID L1 vs SAGE III/ISS extinction bias is, to first order, insensitive to the illumination conditions at the time of the ATLID overpass. The larger dispersion of the collocations with daytime ATLID overpasses cannot be explained by the type of SAGE III/ISS occultation: our day/night split does not separate sunrise and sunset events, and analyses by the SAGE III/ISS validation team show no appreciable difference between sunrise and sunset retrievals, either in comparisons with OHP or in zonal statistics over the period of this study (Anonymous Referee #1, 2026). We therefore do not attribute this difference to either instrument. Comparing daily zonal statistics of daytime and nighttime ATLID observations would be an appropriate way to quantify a possible illumination dependence of the ATLID L1 retrieval and is left for future work.
3.2.2 Representative profile case studies
Figure 3 presents six representative collocation case studies selected to illustrate the three distinct stratospheric aerosol regimes sampled in this study: volcanic plumes, wildfire smoke, and low aerosol background conditions. In each panel, the ATLID L1 profile (solid blue line) and the native ATLID L2 retrieval (dash-dotted light blue line) are compared against the SAGE III/ISS reference (solid black line); the local tropopause altitude is indicated by a horizontal dotted pink line. The green curve (top axis) shows the L2 lidar ratio used in the L1 calculation, at the levels where it lies within 30–90 sr, and the blue envelope shows the L1 extinction obtained with lidar ratios of 40–60 sr (40–70 sr for the smoke cases) at the levels where the 50 sr fallback is used. Comparing these diverse scenes highlights the contrasting behaviour of the ATLID L1 and native L2 extinction products under varying aerosol loadings.
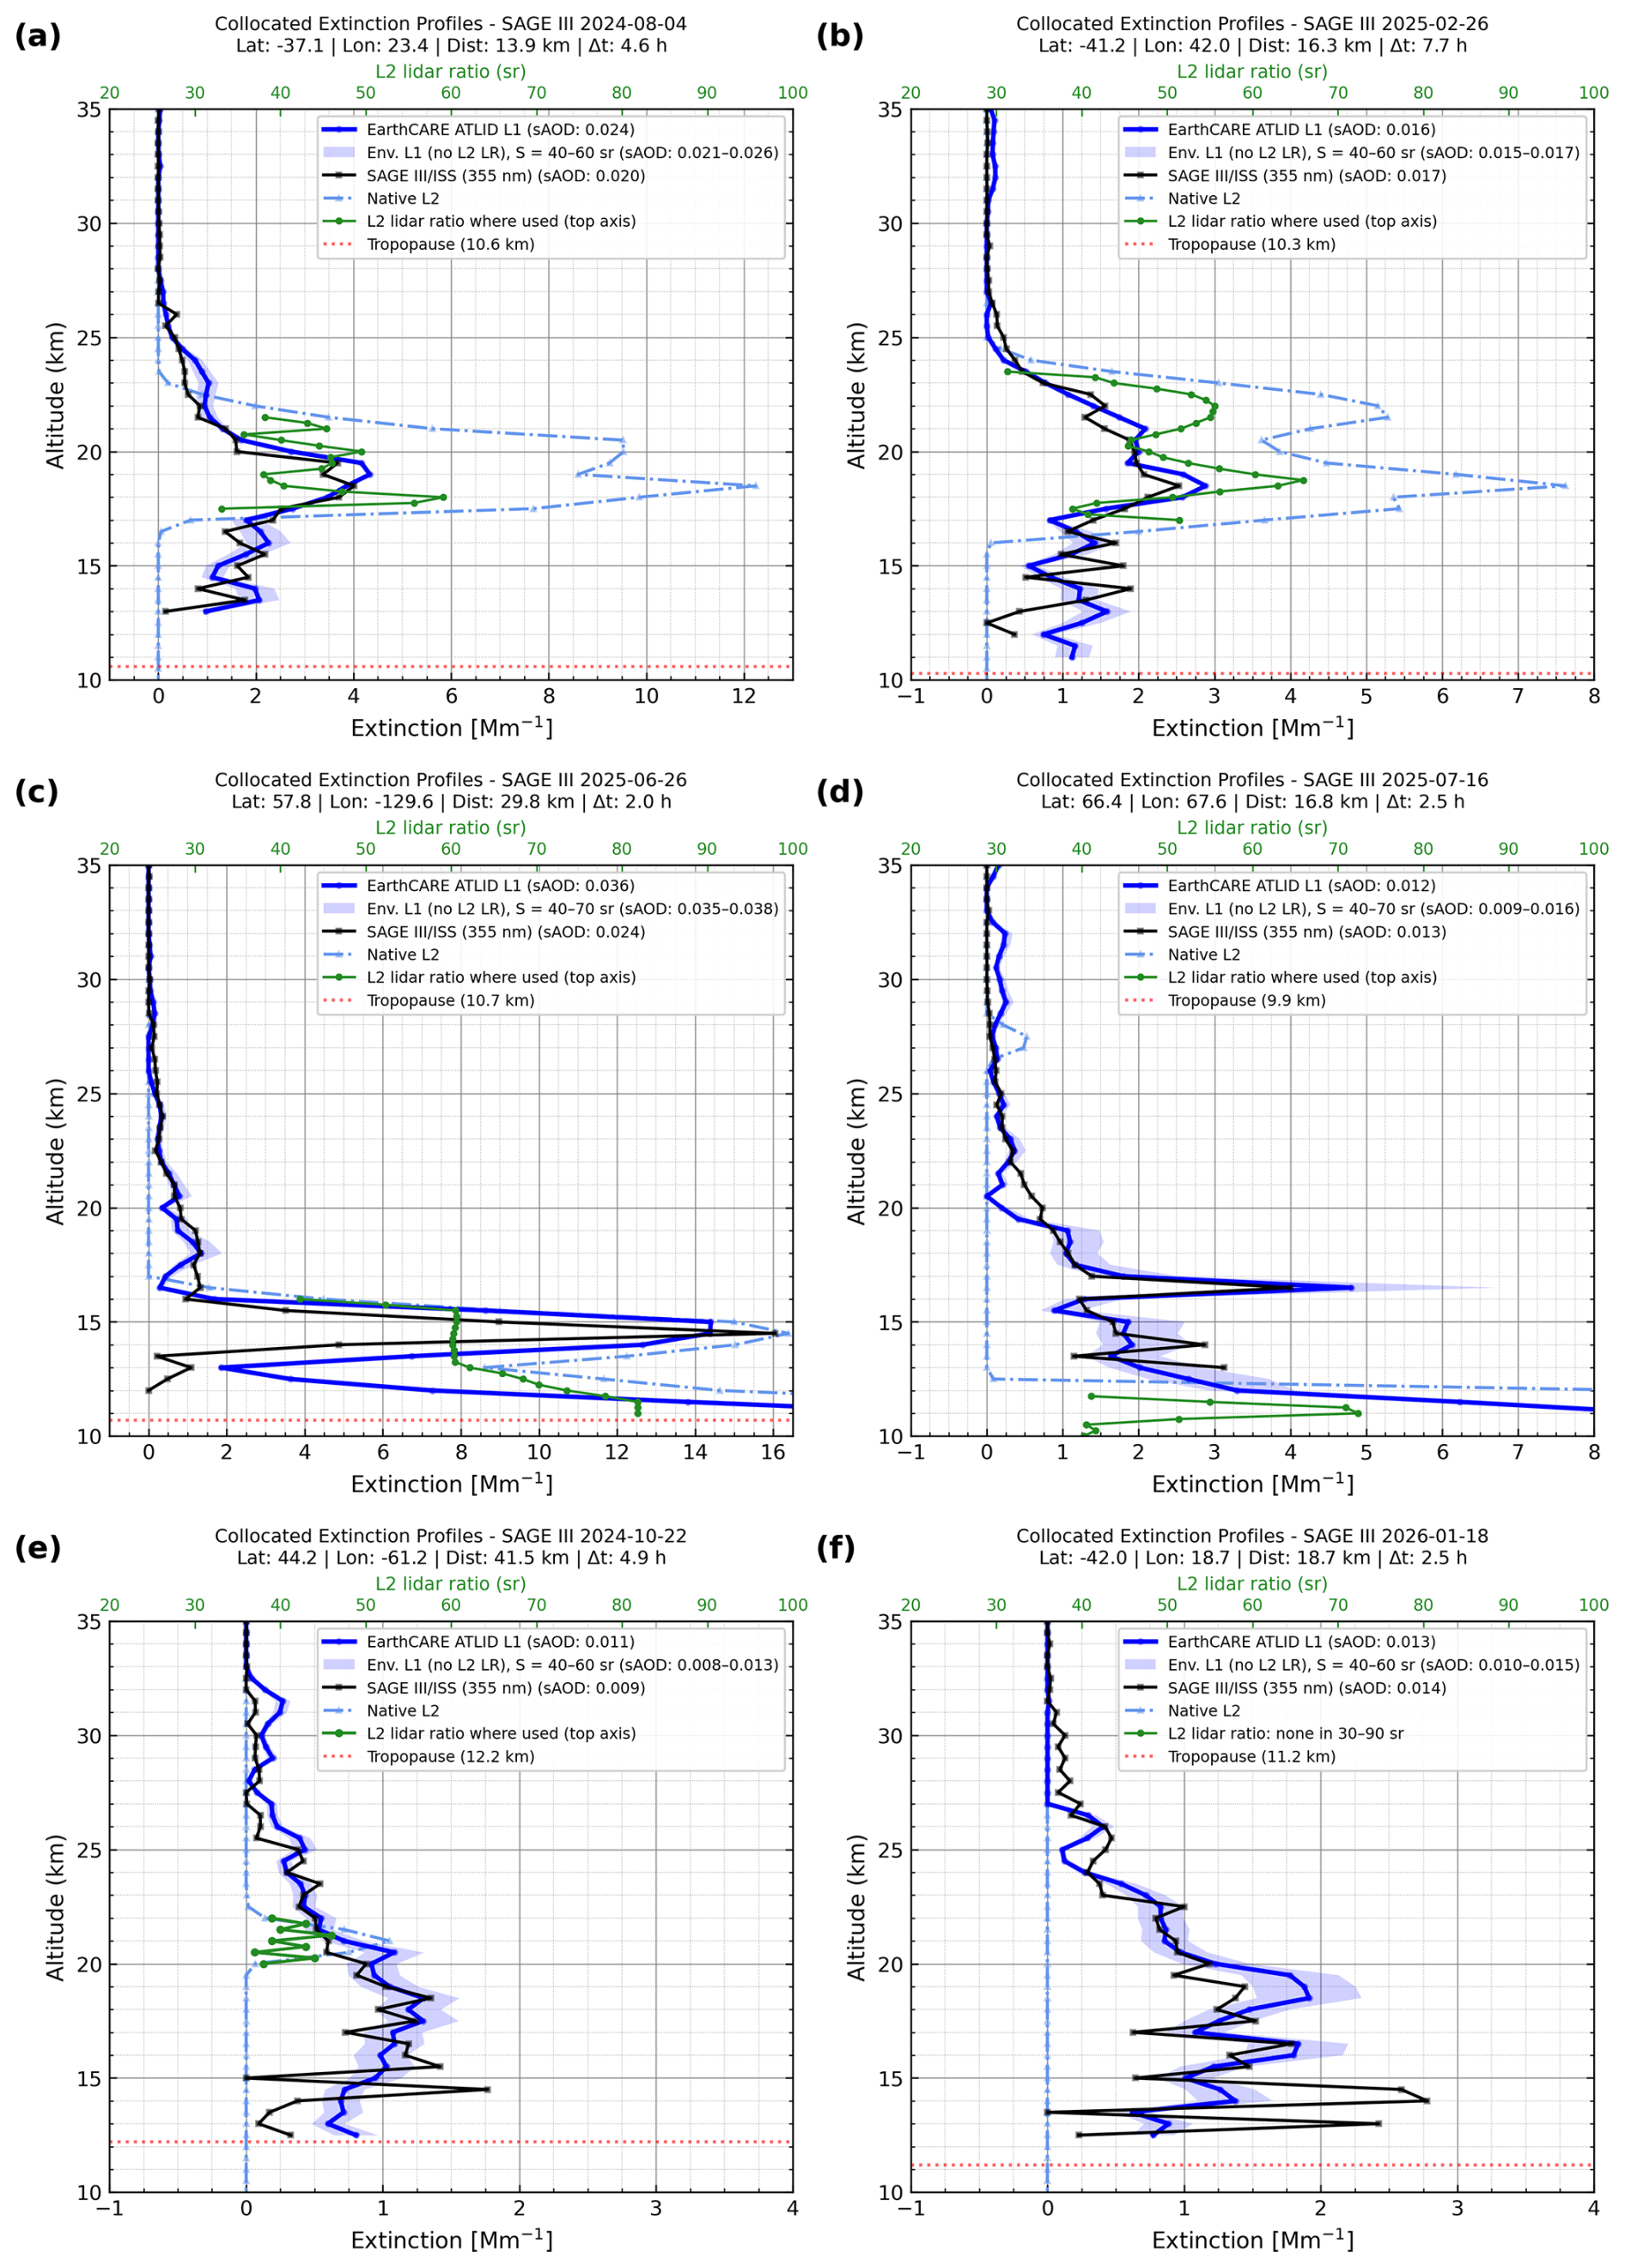
Figure 3Collocated extinction profiles from SAGE III/ISS, ATLID L1 and native ATLID L2: (a, b) Ruang volcanic plume, (c, d) boreal wildfire smoke, (e, f) background conditions. Green curve (top axis): L2 lidar ratio used in the L1 calculation (30–90 sr). Blue envelopes: L1 extinction for lidar ratios of 40–60 sr (40–70 sr in panels c and d), shown only where no valid L2 lidar ratio is available. Dotted pink line: local tropopause. Dist: distance between the SAGE III/ISS tangent point and the closest averaged ATLID profile; Δt: time difference between the SAGE III/ISS event and each ATLID overpass.
Panels (a) and (b) correspond to Southern Hemisphere collocations affected by the Ruang volcanic plume, acquired on 4 August 2024 (lat = −37.1°, Δt = 4.6 h) and 26 February 2025 (lat = −41.2°, Δt = 7.7 h), respectively. In both cases, ATLID L1 and SAGE III/ISS reproduce a coherent vertical structure with a pronounced extinction peak in the 16–22 km range, consistent with the known altitude of the volcanic injection layer after its poleward transport (K26). The native L2 product systematically overestimates the peak extinction in both panels, yielding values up to a factor of ∼ 2–3 above the SAGE III/ISS reference.
Panels (c) and (d) show collocations within boreal wildfire smoke layers, acquired on 26 June 2025 (lat = 57.8°, Δt = 2.0 h) and 16 July 2025 (lat = 66.4°, Δt = 2.5 h), respectively. The stronger layer in panel (c) (ATLID L1 sAOD = 0.036) is well captured by both ATLID L1 and SAGE III/ISS, with a sharp extinction peak near 12–16 km reaching approximately 8–16 Mm−1; residual differences between L1 and SAGE III/ISS at the peak are likely attributable to the spatial heterogeneity of the smoke plume given the ∼ 30 km collocation distance, rather than to a systematic retrieval error. The L2 product again overestimates the peak extinction in panel (c). In this case, the L2 provides a lidar ratio of about 60 sr within the smoke layer, which is used in the L1-derived extinction; the L1 sAOD (0.036) is then higher than the SAGE III/ISS sAOD (0.024). In the weaker companion layer of panel (d) (SAGE III/ISS sAOD = 0.013), ATLID L1 and SAGE III/ISS remain in reasonable agreement across the stratospheric column (L1 sAOD = 0.012, or 0.009–0.016 for lidar ratios of 40–70 sr), while the native L2 product fails to detect the layer, returning near-zero extinction throughout the smoke layer (13–20 km); no valid L2 lidar ratio is available there, and the 50 sr fallback is used.
Panels (e) and (f) represent background conditions with stratospheric aerosol optical depths below approximately 0.015, acquired on 22 October 2024 (lat = 44.2°, Δt = 4.9 h) and 18 January 2026 (lat = −42.0°, Δt = 2.5 h), respectively. Under these low-loading conditions, ATLID L1 and SAGE III/ISS consistently show a diffuse, weakly structured extinction profile with values below ∼ 2 Mm−1 throughout the stratospheric column. The L2 retrieval fails in qualitatively different ways in each case: in panel (e), it detects only a thin layer near 20–22 km within the diffuse layer seen by ATLID L1 and SAGE III/ISS, and returns zero extinction elsewhere; in panel (f), it returns strictly zero extinction across the entire stratospheric column, representing a complete retrieval failure. Consequently, a valid L2 lidar ratio (about 35–45 sr) is available in panel (e) only around 20–22 km, and the 50 sr fallback is used elsewhere, whereas in panel (f) no valid L2 lidar ratio is available and the fallback is used throughout the profile. Together, these six case studies demonstrate that the skill of the native ATLID L2 stratospheric aerosol retrieval degrades markedly with decreasing aerosol loading, while the L1-based K26 product maintains consistent agreement with SAGE III/ISS across all regimes, providing a clear rationale for its use as the primary extinction estimate throughout the remainder of this study.
3.3 Stratospheric AOD comparison
Figure 4 compares the ATLID L1 sAOD with the reference sAOD from SAGE III/ISS and the available ground-based lidar stations (TMF, OHP), integrated from the ATLID tropopause +1 to 30 km. For SAGE III/ISS, the sAOD is computed by integrating the extinction profiles over the same altitude range; the stratospheric_aerosol_optical_depth parameter of the SAGE III/ISS Level-2 product is not used. Reference sAOD values span approximately 0–0.030 for the SAGE III/ISS matchups, covering background conditions, the volcanic perturbation associated with the Ruang eruption (April–May 2024), and the wildfire smoke events of boreal summer 2025.
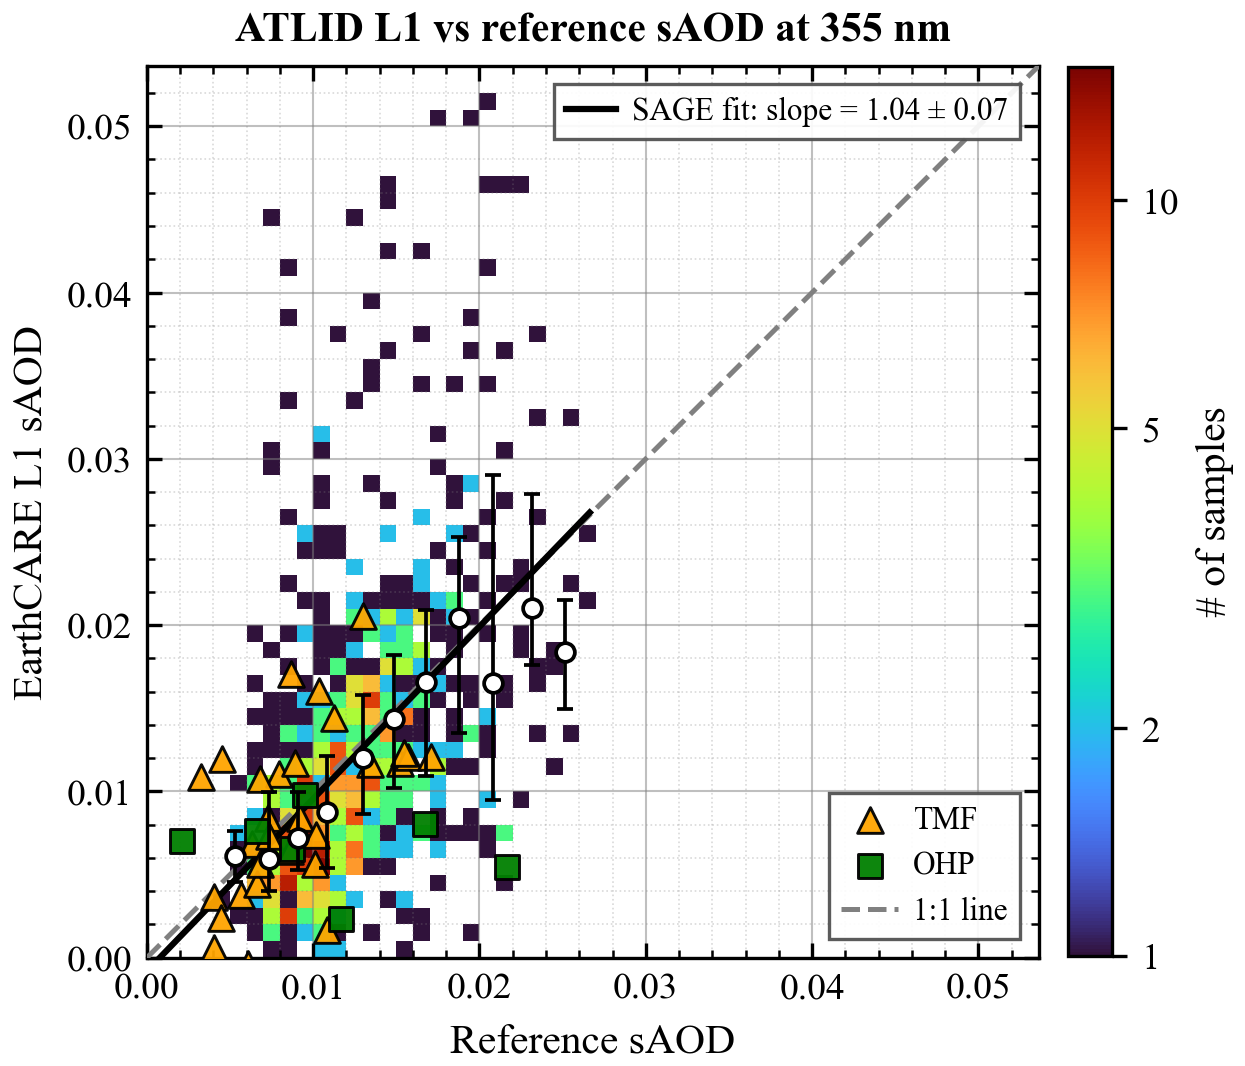
Figure 4ATLID L1 sAOD versus reference sAOD, integrated from the ATLID-derived tropopause +1 to 30 km. SAGE III/ISS matchups are shown as a 2D histogram (number of matchups per 0.001 × 0.001 bin, logarithmic colour scale); TMF (triangles) and OHP (squares) matchups are shown individually. White circles give the median ATLID sAOD in 0.002-wide classes of SAGE III/ISS sAOD (classes with at least five matchups), with the interquartile range as error bars. The dashed grey line is the 1:1 reference. The solid black line shows the linear regression fit to the SAGE III/ISS matchups: slope = 1.04 ± 0.07 (±1 standard error), intercept = (−0.8 ± 0.9) × 10−3, R = 0.67; the slope is also given in the upper-right corner.
A linear regression applied to the SAGE III/ISS matchups yields a slope of 1.04 ± 0.07, an intercept of (R = 0.67), indicating that the ATLID L1 product is, on average, essentially unbiased with respect to SAGE III/ISS integrated sAOD. However, the scatter around the regression line is not uniform across the dynamic range and reveals contrasting behaviour between the low- and high-aerosol-loading regimes. While the dense core of the data remains broadly consistent with the 1:1 line, the high-loading regime (reference sAOD > 0.010) exhibits an asymmetric dispersion. Specifically, there is a prominent subset of ATLID L1 retrievals that yield significantly higher values than the SAGE III/ISS reference, creating a pronounced positive tail in the distribution.
The class medians of Fig. 4 (white circles) show how the agreement varies with the aerosol loading. Above about 0.02, few matchups remain and the interquartile range widens.
Two factors may contribute to the positive tail at high aerosol loading. (i) Coverage of the lowermost stratosphere: both sAODs are integrated from the tropopause +1 to 30 km, but in dense layers the lowest SAGE III/ISS levels are more likely to be removed by the quality screening (e.g. aerosol-cloud mixture flag) or not retrieved at all, as the transmission along the line of sight decreases, whereas the ATLID L1 profile retains these levels. When a dense layer lies just above the tropopause, as in Fig. 3c, where ATLID shows large extinction values between the tropopause and 12.5 km that are absent from the SAGE III/ISS profile, the ATLID sAOD therefore includes a contribution that is missing from the SAGE III/ISS sAOD. (ii) Sampling geometry: SAGE III/ISS integrates along a limb path of a few hundred kilometres, whereas the ATLID extinction is an average of nadir profiles within 50 km. For compact plumes, ATLID can sample the core of the plume while SAGE III/ISS sees it diluted along its line of sight, which produces large positive differences; in the opposite case, the negative difference is limited by this dilution. This favours a positive tail at high aerosol loading.
Among the ground-based reference instruments, the TMF matchups (orange triangles) scatter on both sides of the 1:1 line without a clear directional offset, broadly mirroring the noise-dominated behaviour of the SAGE III/ISS ensemble at comparable sAOD levels. The OHP matchups (green squares) follow the same qualitative low-/high-loading pattern, with a tendency for points to fall below the 1:1 line as the reference sAOD increases; more matchups lie below than above the regression line overall, foreshadowing the systematic negative offset identified independently for this station from the point-to-point backscatter comparison in Sect. 3.5. For these sAOD comparisons, the ground-based backscatter profiles are converted to extinction with a lidar ratio of 50 sr (Sect. 2.4), while the ATLID L2 lidar ratio is used only where it lies within 30–90 sr and 50 sr is used elsewhere, so the two conversions differ only at these levels. The backscatter comparison of Sect. 3.5 is independent of the lidar ratio.
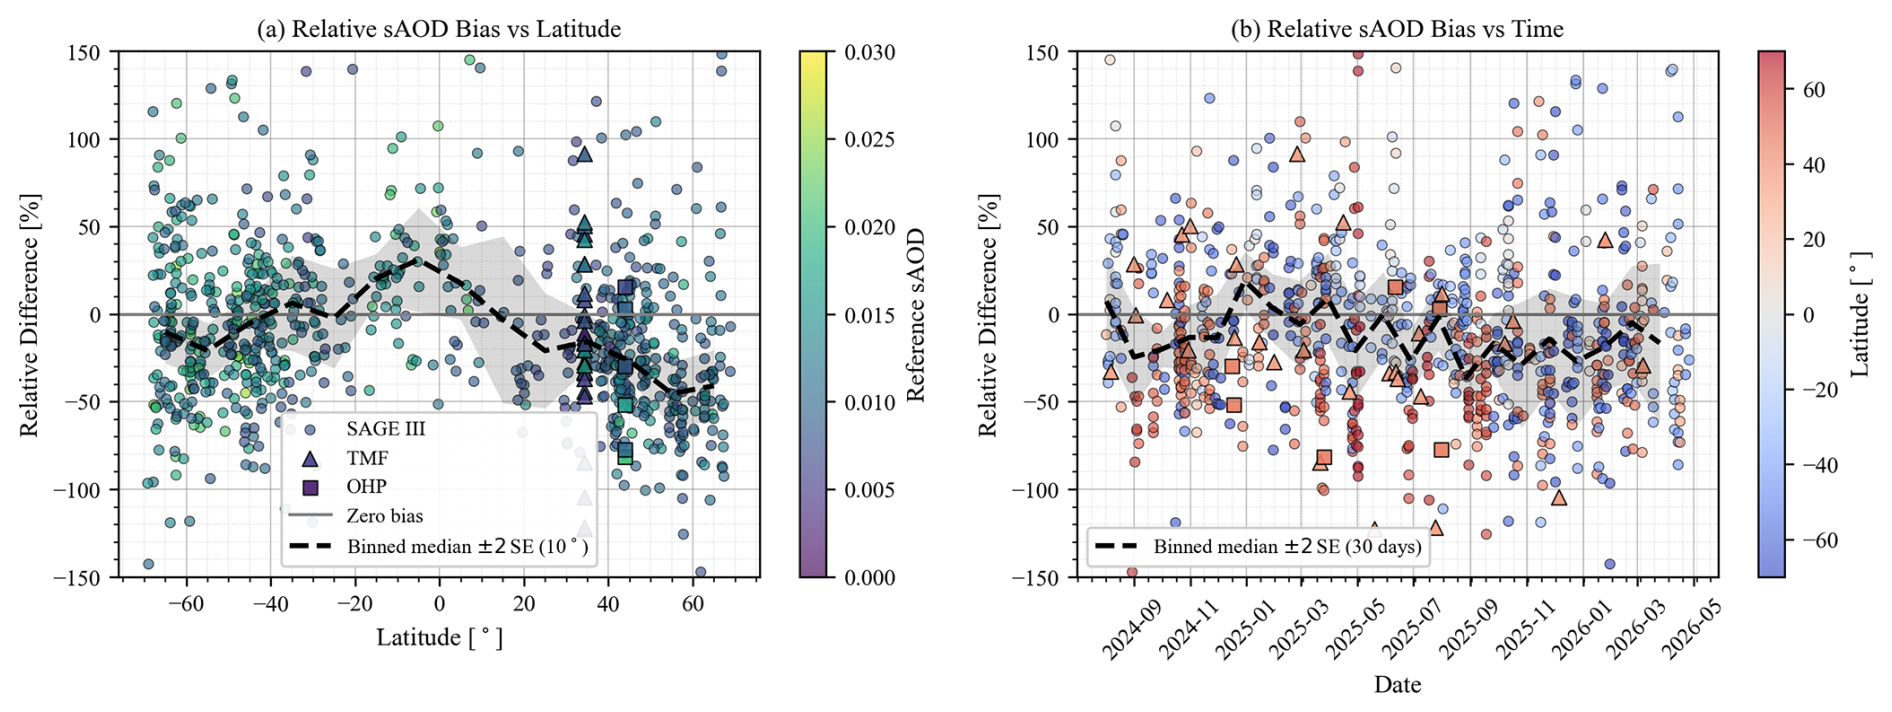
Figure 5Relative sAOD bias of ATLID L1 with respect to SAGE III/ISS (circles), TMF (triangles), and OHP (squares) as a function of (a) latitude and (b) time. Symbol colours encode the reference sAOD in panel (a) and the collocation latitude in panel (b). The solid grey line marks zero bias; the dashed black line is the binned median relative difference (10° latitude bins in panel a, 30 d windows in panel b), and the surrounding grey shaded envelope shows its ±2 standard-error (±2 SE) interval, i.e. an approximate 95 % confidence range on the median in each bin.
3.4 Latitudinal and temporal distribution of the relative sAOD bias
Figure 5 presents the relative sAOD difference as a function of latitude (panel a) and time (panel b) for the SAGE III/ISS, TMF, and OHP matchups. Across all matchups, the relative sAOD bias has a global mean of −3.2 % with a standard deviation of 65.7 %, indicating a near-zero systematic offset combined with a large point-to-point scatter.
The latitudinal distribution (Fig. 5a) reveals a clear meridional gradient in the SAGE III/ISS-based comparisons, with ATLID L1 exhibiting a systematic negative bias in the Northern Hemisphere extratropics that increases with latitude. The grey shaded envelope around the dashed line represents the ±2 standard-error (±2 SE) interval of the binned median, i.e. an approximate 95 % confidence range in each bin; it is narrowest where collocations are dense (mid-latitudes) and broadest where they are sparse, in particular in the Northern Hemisphere tropics and subtropics (10–30° N), providing a visual guide to which median excursions are statistically robust rather than an artefact of limited sampling. The scatter is large at all latitudes, with individual relative differences frequently exceeding ±50 %, consistent with the standard deviation reported above. Among the ground-based stations, the TMF matchups (triangles, 34° N) span a wide range of both positive and negative relative biases, while the OHP matchups (squares, 44° N), though limited in number, are predominantly negative, consistent with the tendency noted in Sect. 3.3 and confirmed independently in Sect. 3.5.
The temporal distribution (Fig. 5b) shows no obvious secular drift over the 20-month record, indicating broad stability of the ATLID L1 calibration throughout the study period. The apparent see-saw pattern of the 30 d binned median likely reflects the changing latitudinal sampling of SAGE III/ISS, with intervals dominated by Northern Hemisphere extratropical matchups showing a more negative bias, consistent with the low bias identified for NH mid- to high-latitude comparisons in Fig. 5a, rather than any systematic temporal drift of the ATLID L1 product. The ±2 SE envelope on the median widens during intervals with fewer collocations, and no monotonic trend emerges beyond this envelope, reinforcing the absence of a significant temporal drift and the broad stability of the ATLID L1 calibration.
3.5 Point-to-point backscatter coefficient comparison: OHP and TMF
The comparisons presented above rely, to varying degrees, on the conversion from ATLID L1 backscatter to extinction via a lidar ratio (Eq. 1). This lidar ratio is taken from the ATLID L2 product when it is available and lies within 30–90 sr, and set to a fixed value of 50 sr otherwise (see Sect. 2.2). To isolate the contribution of this conversion step from that of the underlying scattering-ratio retrieval, we additionally compare ATLID L1 particulate backscatter coefficients directly against collocated ground-based lidar backscatter profiles at OHP and TMF, applying the same point-to-point relative-difference metric defined in Sect. 2.6 but evaluated on βaer rather than on extinction.
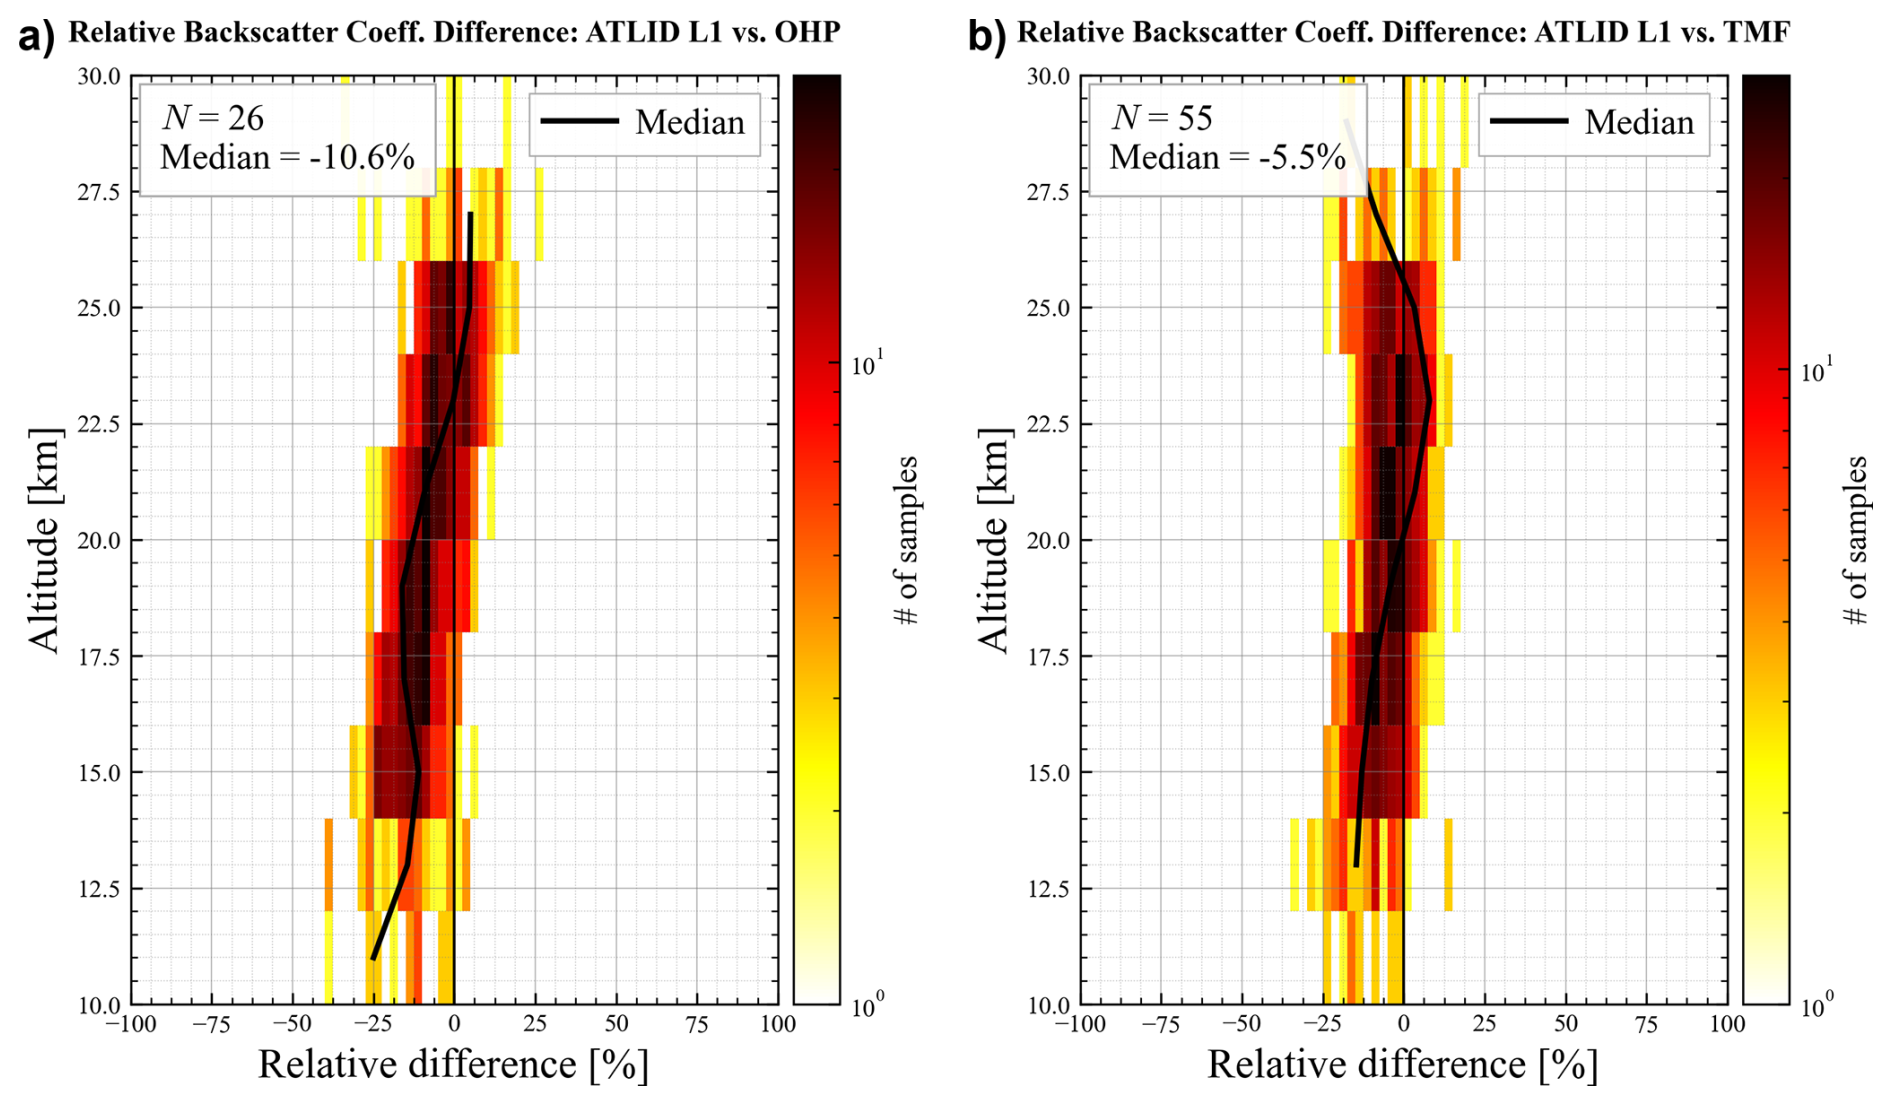
Figure 6Distribution of the relative difference between ATLID L1 and ground-based lidar particulate backscatter coefficients as a function of altitude for (a) OHP (N = 26 collocated overpasses) and (b) TMF (N = 55 collocated overpasses). In each panel, the colour scale gives the number of samples per bin on a logarithmic scale. The solid black line shows the altitude-resolved median profile; the thin vertical line marks zero relative difference. The overall median relative differences are −10.6 % (OHP) and −5.5 % (TMF).
Figure 6 shows the resulting distributions of the relative backscatter difference as a function of altitude for the N = 26 OHP overpasses (panel a) and the N = 55 TMF overpasses (panel b). At OHP, the overall median relative difference is −10.6 %, while at TMF it amounts to −5.5 %. Both values are negative, confirming a systematic tendency for ATLID L1 to underestimate ground-based backscatter, consistent with the underestimation identified in the SAGE III/ISS extinction comparison (Sect. 3.2). The difference in magnitude between the two stations (OHP exhibiting a roughly twice as large negative offset as TMF) may reflect the smaller OHP sample size, differences in the altitude ranges effectively sampled by each lidar, or a genuine site-dependent component.
Interestingly, both lidar stations confirm a slight negative bias in the lower stratosphere just above the tropopause, consistent with the behaviour found in the SAGE III/ISS comparison in tropopause-relative altitude (Fig. 1b). The scatter of the differences is also similar to that observed for the collocations with nighttime ATLID overpasses (Sect. 3.2.1). The OHP profile displays a similar structure, with the negative bias concentrated between 11 and 23 km and a clearer positive excursion near 23–27 km. Because both comparisons are, by construction, independent of the lidar ratio, this three-instrument consistency strongly indicates that the altitude-dependent bias structure identified throughout Sect. 3.2 originates predominantly in the Level-1 scattering-ratio retrieval itself, rather than in the extinction-conversion step (Sect. 2.2).
3.6 Rationale for the Level-1-based retrieval: comparison with native Level-2 products
Having established the robustness of the Level-1-based (K26) extinction product across diverse stratospheric conditions, we now evaluate the added value of this approach relative to the native ATLID Level-2 (L2) aerosol retrieval. Figure 7a compares the L2 stratospheric AOD with the reference sAOD from SAGE III/ISS, TMF, and OHP. A linear regression to the SAGE III/ISS matchups yields a slope of only 0.64 and an intercept of 0.1 × 10⁻³, well below the near-unity slope obtained for the L1 product (slope = 1.04 ± 0.07, intercept = ; Sect. 3.3, Fig. 4). In about half of the matchups (321 of 652), the L2 extinction is zero at all levels of the integration range (sAODL2 = 0, bottom row of Fig. 7a), reflecting the frequent absence of aerosol detection by the L2 processor noted in Sect. 2.2. These zeros are reported by the L2 product itself and are used as such in the sAOD integration, while true fill values are discarded. The L2 comparison also includes fewer matchups than the L1 comparison (652 versus 895) because the daily L2 files contain fewer profiles than the L1 files (about 6400 d−1 versus 22 750 d−1).
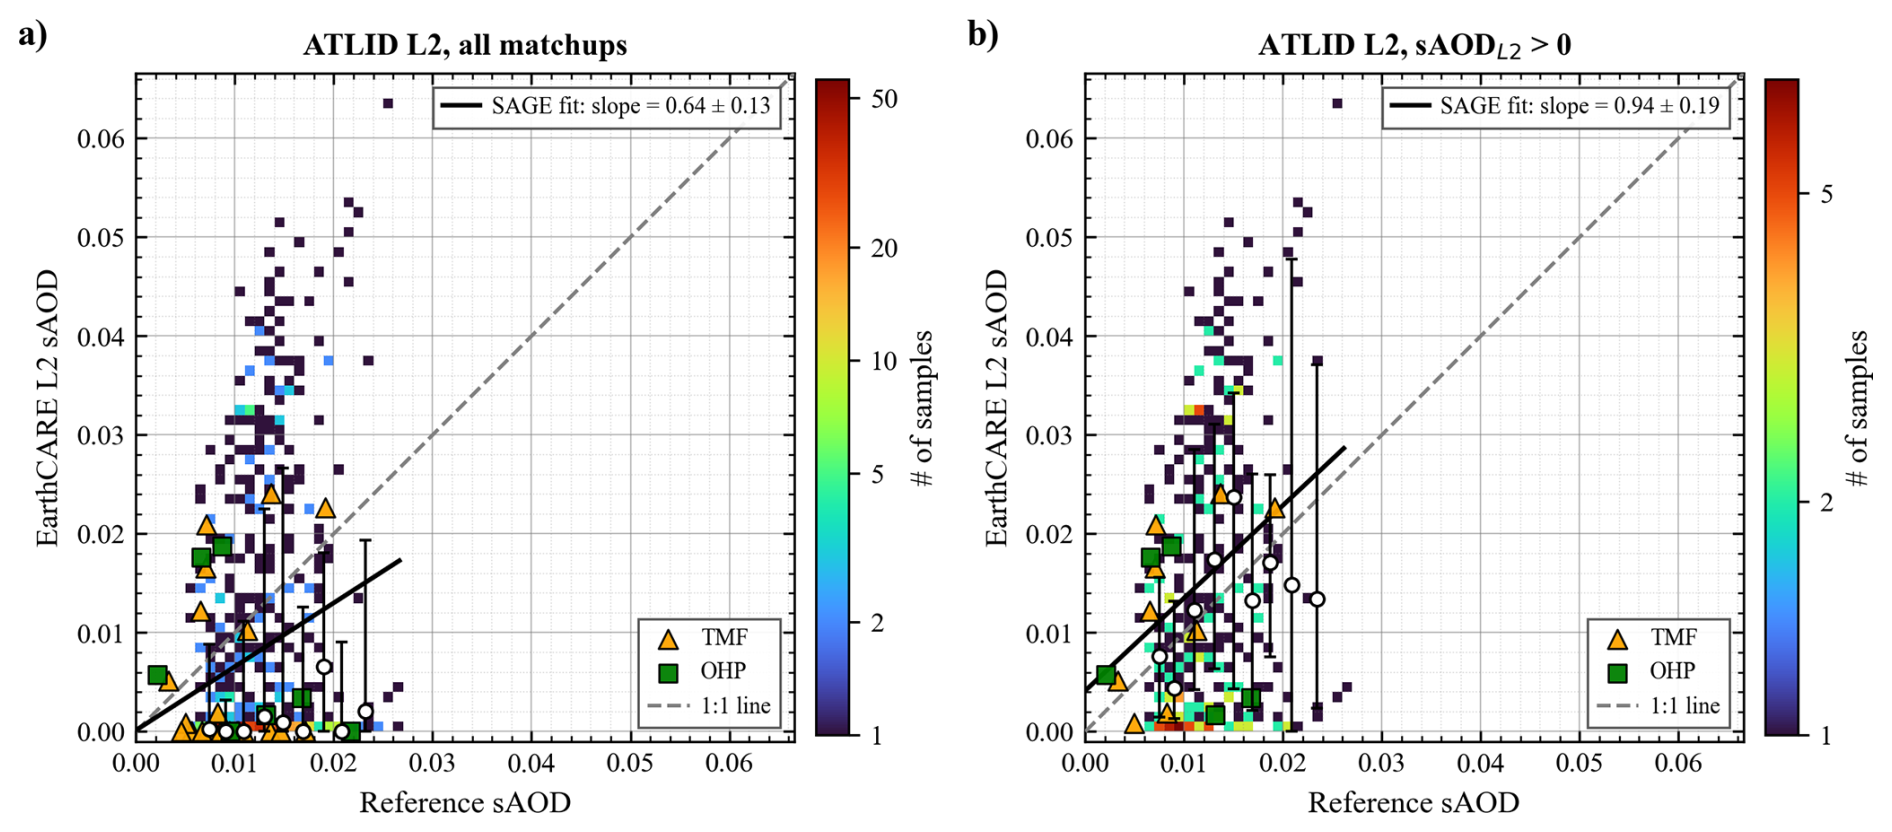
Figure 7Same as Fig. 4, but for the native ATLID L2 sAOD. (a) All matchups, including those with zero L2 extinction at all levels (sAODL2 = 0, bottom row). Fit to the SAGE III/ISS matchups (N = 652): slope = 0.64 ± 0.13, intercept = (0.1 ± 1.7) × 10−3, R = 0.19. (b) Only matchups with sAODL2 > 0 (N = 331): slope = 0.94 ± 0.19, intercept = (4.1 ± 2.6) × 10−3, R = 0.26. There are fewer matchups than in Fig. 4 because the daily L2 files contain fewer profiles than the L1 files (about 6400 versus 22 750 d−1).
Restricting the comparison to profiles for which the L2 processor returns an actual stratospheric retrieval (sAODL2 > 0; Fig. 7b) partially compensates for the systematic underestimation seen in panel (a): the SAGE III/ISS regression slope rises from 0.64 ± 0.13 to 0.94 ± 0.19, formally consistent with unity. This improvement is, however, largely artificial. It results from the removal of the numerous null retrievals (sAODL2 = 0) that pull the full-sample slope downward, rather than from any genuine skill of the L2 product. Indeed, the correlation remains very weak (R = 0.26) and the fit acquires a significantly positive intercept of (4.1 ± 2.6) , indicating that the retained L2 retrievals scatter almost independently of the true aerosol loading and, on average, overestimate the low-sAOD background. Even when the L2 processor does converge to a non-zero solution, the resulting sAOD is therefore only loosely tied to the reference value, and the apparent near-unity slope in panel (b) should not be interpreted as evidence of reliable quantitative agreement. The class medians confirm this picture: because about half of the matchups have sAODL2 = 0, they stay close to zero over most of the sAOD range in Fig. 7a, and when these cases are excluded (Fig. 7b), they fall on both sides of the 1:1 line with wide interquartile ranges, so that no sAOD range of consistent agreement emerges.
At low reference sAOD (≲ 0.02), where the bulk of the dataset lies, L2 retrievals show essentially no relationship with the reference values: some matchups return spuriously high sAOD (up to 0.05–0.06) while others return values close to zero, regardless of the true aerosol loading. This behaviour is illustrated at the profile level by the selected case studies shown in Fig. 3, spanning the three aerosol regimes sampled in this study. Taken together, the aggregate sAOD comparison and the case-level profiles demonstrate that the skill of the native L2 retrieval degrades sharply as the aerosol loading decreases, and justify the systematic use of the L1-based K26 product as the primary ATLID extinction estimate throughout the remainder of this study.
We now discuss the possible physical origins of the bias patterns identified in Sect. 3, the practical implications of the L1/L2 contrast for ATLID data users, and the main limitations of the present analysis.
4.1 Altitude/Latitude-dependent structure of the ATLID bias
The altitude-dependent bias identified independently in the SAGE III/ISS extinction comparison (Sect. 3.2) and in the OHP and TMF backscatter comparisons (Sect. 3.5) is consistent across the three instruments near the tropopause: when expressed as a function of altitude above the local tropopause, the SAGE III/ISS comparison shows a negative bias just above the tropopause, as do the two ground-based lidars.
This consistency between the lidar-ratio-dependent extinction comparison and the lidar-ratio-independent backscatter comparisons argues against the conversion step being the dominant driver and instead points to an origin within the Level-1 scattering-ratio retrieval itself; the exact physical mechanisms driving this vertical bias structure require further investigation.
This behaviour is broadly consistent with the lessons learned from the CALIOP stratospheric aerosol product. Kar et al. (2019) showed that the improved Version 4 calibration of CALIOP enabled a reliable retrieval of stratospheric aerosol extinction, but also that agreement with SAGE III/ISS remains strongly latitude- and altitude-dependent: comparatively good in the tropical stratosphere between about 20 and 30 km, and substantially poorer at higher latitudes and near the tropopause, where differences can exceed 100 %. Those results are particularly relevant here because they show that, even for a mature elastic lidar product, the stratospheric regime remains challenging when the aerosol loading is weak and the signal-to-noise ratio is low.
ATLID itself exhibits an analogous latitudinal signature: the sAOD bias distribution (Sect. 3.4, Fig. 5a) shows a systematic negative bias in the Northern Hemisphere extratropics that increases with latitude. Part of this gradient may be linked to aerosol type rather than to latitude per se: the boreal wildfire smoke events sampled during this study are concentrated at Northern Hemisphere mid-to-high latitudes, and the lidar ratio of smoke particles may differ from the 50 sr fallback used in the absence of a valid L2 value (Sect. 2.2). The case studies of Fig. 3 show, however, that this effect alone cannot explain the negative bias: in the smoke case of Fig. 3c, the L2 provides a lidar ratio of about 60 sr within the layer and the L1 sAOD exceeds the SAGE III/ISS value, while in Fig. 3d the L1 sAOD obtained with the 50 sr fallback is close to the SAGE III/ISS value. The lidar ratio of smoke is therefore only one possible contribution, and a dedicated analysis comparing the summer 2025 smoke period with the rest of the record is left for future work.
To further contextualize the degree of agreement observed between ATLID L1 and SAGE III/ISS, it is instructive to compare our results with other satellite intercomparison studies. For instance, Kovilakam et al. (2023) evaluated the consistency between SAGE III/ISS extinction and CALIOP backscatter-derived extinction (see their Fig. 13). They demonstrated that direct comparisons using a constant lidar ratio for CALIOP yielded regional biases frequently exceeding 50 % in the lower stratosphere and at higher latitudes. It was only after applying an empirical, altitude- and latitude-dependent scale factor to the CALIOP data that the differences relative to SAGE III/ISS were reduced to within ±20 %. In this context, the agreement found in our study without relying on any empirical post-scaling highlights the robust performance of the ATLID L1-based retrieval and the distinct advantage of its HSRL measurement capabilities in the stratosphere.
4.2 Implications of the Level-1/Level-2 contrast for data users
The clear contrast between the regression slopes obtained for the L1 (1.04) and native L2 (0.64) sAOD products against SAGE III/ISS (Sect. 3.6) has direct practical implications. The native L2 stratospheric aerosol product, in its current processing baseline, should not be relied upon for quantitative assessments of background or weakly perturbed stratospheric aerosol, the regime that dominates the EarthCARE record outside of the Ruang eruption and the 2025 boreal wildfire season, since it exhibits essentially no skill in this regime and frequently defaults to either spuriously elevated or null retrievals. The L1-based K26 product evaluated throughout this study provides a substantially more faithful representation of the true aerosol loading across the full dynamic range sampled here, and we recommend its use, at least in the interim, for stratospheric aerosol monitoring and trend studies based on ATLID, pending future refinement of the operational L2 algorithm.
The quality of the SAGE III/ISS reference data is also important in interpreting these comparisons. The extinction profiles used here are derived from the 384 nm channel and converted to 355 nm using the 384–521 nm Ångström exponent, with profiles affected by transmission anomalies, cloud contamination, or large fractional uncertainty excluded following established quality-control recommendations (Knepp et al., 2020). Using the 384/449 nm pair instead (mean Ångström exponent of 0.704 over the ATLID observation period, compared with 0.866 for the 384/521 nm pair) would change the 384-to-355 nm conversion factor from 1.070 to 1.057, i.e. the converted 355 nm extinction by only about 1.3 %, which is small compared with the variability and uncertainties of the ATLID-SAGE III/ISS comparison. SAGE III/ISS is therefore a robust and well-characterized reference, but not a noise-free one; some of the residual scatter in the ATLID comparison likely reflects the combined uncertainties of both instruments.
Beyond the reference dataset itself, the extinction retrieval relies on a lidar ratio that is either taken from the ATLID L2 product, where it lies within 30–90 sr, or fixed at 50 sr otherwise (Sect. 2.2). For aged plumes and near-background stratospheric conditions, where the L2 product reports zero extinction, the 50 sr value is an assumption. Typical lidar ratios of stratospheric sulfate are about 45–50 sr at 532 nm (Kremser et al., 2016), but direct estimates at 355 nm are scarce: Vaughan et al. (2021) used 40–50 sr at 355 nm for the 2019 Raikoke and Ulawun sulfate layer, checked against Raman measurements, and a constant 50 sr is used for sulfate aerosol with the 355 nm LiO3S lidar at Maïdo (K26). The 50 sr value thus lies at the upper end of the values used at 355 nm. Since the L1-derived extinction scales linearly with the lidar ratio, a ±10 sr departure from 50 sr changes the extinction by ±20 %; this sensitivity is shown as an envelope in Fig. 3 at the levels where the 50 sr fallback is used. A targeted test of the smoke-related, high-latitude hypothesis raised in Sect. 4.1 is left for future work. We note, however, that the qualitative consistency between the lidar-ratio-dependent SAGE III/ISS extinction comparison and the lidar-ratio-independent OHP and TMF backscatter comparisons (Sect. 3.5) suggests that the dominant altitude-dependent bias pattern identified in this study is not primarily a lidar-ratio artefact.
We have presented a systematic validation of the ATLID stratospheric aerosol retrieval using 895 collocated SAGE III/ISS extinction profiles and ground-based backscatter measurements from OHP and TMF, covering the period August 2024–April 2026 and spanning background, volcanic, and wildfire aerosol conditions.
The Level-1-based (K26) extinction product, derived from the ATLID scattering ratio with the Level-2 lidar ratio where it lies within 30–90 sr and 50 sr otherwise, shows near-zero overall bias with respect to SAGE III/ISS, with a linear regression slope of 1.04 and an overall median relative extinction difference of −2.2 % across all altitudes. At the integrated column level, ATLID L1 sAOD is essentially unbiased with respect to the reference, with a global mean relative sAOD bias of −3.2 % across all matchups; the associated standard deviation of 65.7 %, however, reflects a large point-to-point scatter dominated by retrieval noise under near-background aerosol loading. However, the comparison as a function of altitude above the local tropopause reveals a consistent vertical structure: a negative bias in the first ∼3 km above the tropopause (about −10 % to −15 %), a near-zero bias between about 5 and 15 km above the tropopause, and a negative bias again further up. The negative bias just above the tropopause is independently reproduced by the backscatter comparisons against OHP (−10.6 % overall median) and TMF (−5.5 % overall median), suggesting that it is an intrinsic feature of the ATLID L1 scattering-ratio retrieval rather than an artefact of the lidar-ratio conversion.
The collocations with daytime ATLID overpasses show a larger dispersion than those with nighttime overpasses, with a relative-difference standard deviation of ∼ 32 % versus ∼ 17 %, while the median bias remains close to zero in both cases (−4.2 % and −0.5 %). We do not attribute this difference to either instrument: SAGE III/ISS sunrise and sunset occultations are made under the same measurement geometry, and the HSRL design of ATLID improves its daytime performance compared with elastic lidars such as CALIOP (Feofilov et al., 2023) without making it immune to daylight noise. Comparing daily zonal statistics of daytime and nighttime ATLID observations would allow a possible illumination dependence of the ATLID L1 retrieval to be quantified.
In contrast, the native ATLID Level-2 stratospheric aerosol product exhibits severe limitations across most of the dynamic range sampled in this study. Against SAGE III/ISS, the full L2 sAOD ensemble yields a regression slope of only 0.64, an artificial negative bias driven by the frequent occurrence of null retrievals (zero extinction) under low-aerosol conditions. While restricting the analysis to successful L2 retrievals artificially raises the slope to near unity, the correlation remains very weak (R = 0.26) because the algorithm tends to overestimate the low-sAOD background and produces spurious narrow peaks. Furthermore, the L2 product systematically overestimates peak extinction in dense volcanic and wildfire plumes. Consequently, the L1-based K26 approach introduced in Khaykin et al. (2026) provides a substantially more faithful representation of stratospheric aerosol loading across all regimes and is recommended for ATLID-based stratospheric aerosol monitoring pending future refinements of the operational L2 algorithm.
The study demonstrates that EarthCARE ATLID is capable of consistently resolving stratospheric aerosol extinction across a wide range of conditions with an accuracy of a few percent on the mean extinction profile, making it a valuable addition to the existing observing system for stratospheric aerosol. Future work should extend the validation record, incorporate additional ground-based stations at a broader range of latitudes, and undertake a dedicated lidar-ratio sensitivity study to further constrain the residual altitude-dependent bias identified here.
The ATLID L1B data processing code is available at https://doi.org/10.5281/zenodo.18155346 (Kadygrov and Khaykin, 2026). The collocation and statistical analysis code used to produce the results and figures presented in this paper is available at https://doi.org/10.5281/zenodo.21282211 (Poncet, 2026).
EarthCARE ATLID data are available at https://earth.esa.int/eogateway/catalog/earthcare-l1-products (last access: 5 June 2026); SAGE III data are available at https://doi.org/10.5067/ISS/SAGEIII/SOLAR_HDF5_L2-V6.0 (NASA/LARC/SD/ASDC, 2024); NDACC lidar data are available at https://ndacc.larc.nasa.gov (last access: 5 January 2026).
SK conceived the study, EP performed the analysis and wrote the manuscript, TL provided TMF lidar data. SK and SGB provided OHP lidar data. All authors contributed to the final manuscript.
The contact author has declared that none of the authors has any competing interests.
Publisher's note: Copernicus Publications remains neutral with regard to jurisdictional claims made in the text, published maps, institutional affiliations, or any other geographical representation in this paper. The authors bear the ultimate responsibility for providing appropriate place names. Views expressed in the text are those of the authors and do not necessarily reflect the views of the publisher.
This article is part of the special issue “Early results from EarthCARE (AMT/ACP/GMD inter-journal SI)”. It is not associated with a conference.
We thank the personnel of lidar stations (OHP and TMF) for conducting lidar measurements. The French lidar stations operate under support of French Institut National des Sciences de l'Univers (INSU) of the Centre National de la Recherche Scientifique (CNRS) and of Centre National d'Études Spatiales (CNES). Part of this research was carried out at the Jet Propulsion Laboratory, California Institute of Technology, under a contract with the National Aeronautics and Space Administration (NASA) (80NM0018D0004).
This research has been supported by the Agence Nationale de la Recherche (ANR) (grant no. PyroStrat 21-CE01-0028-01), the Centre National d'Études Spatiales (EARTHCARE) and the National Aeronautics and Space Administration (NASA) (grant no. 80NM0018D0004).
This paper was edited by Lars Hoffmann and reviewed by three anonymous referees.
Anonymous Referee #1: Referee Comment 1, Comment on egusphere-2026-4358, https://doi.org/10.5194/egusphere-2026-4358-RC1, 2026. a
Baars, H., Haarig, M., König, L., Floutsi, A. A., Basharova, E., Hofer, J., Gebauer, H., Engelmann, R., Althausen, D., Skupin, A., Gast, B., Fritzsch, F., Ohneiser, K., Jimenez, C., Gaudek, T., Radenz, M., Buholdt, H., Heese, B., Klamt, A., Seifert, P., Donovan, D. P., van Zadelhoff, G.-J., Abdullaev, S. F., Khalifaeva, S. K., Nozirov, D. F., and Wandinger, U.: Validation of EarthCARE/ATLID aerosol profiling products with ground-based PollyNET lidars – case studies, Atmos. Meas. Tech., 19, 3831–3864, https://doi.org/10.5194/amt-19-3831-2026, 2026. a, b
Cisewski, M., Zawodny, J., Gasbarre, J., Eckman, R., Topiwala, N., Rodriguez-Alvarez, O., Cheek, D., and Hall, S.: The Stratospheric Aerosol and Gas Experiment (SAGE III) on the International Space Station (ISS) Mission, Proc. SPIE 9241, Sensors, Systems, and Next-Generation Satellites XVIII, 924107, https://doi.org/10.1117/12.2073131, 2014. a
Donovan, D. P., van Zadelhoff, G.-J., and Wang, P.: The EarthCARE lidar cloud and aerosol profile processor (A-PRO): the A-AER, A-EBD, A-TC, and A-ICE products, Atmos. Meas. Tech., 17, 5301–5340, https://doi.org/10.5194/amt-17-5301-2024, 2024. a
Eisinger, M., Marnas, F., Wallace, K., Kubota, T., Tomiyama, N., Ohno, Y., Tanaka, T., Tomita, E., Wehr, T., and Bernaerts, D.: The EarthCARE mission: science data processing chain overview, Atmos. Meas. Tech., 17, 839–862, https://doi.org/10.5194/amt-17-839-2024, 2024. a
ESA Earth Online: ATLID Overview – Atmospheric Lidar, https://earth.esa.int/eogateway/instruments/atlid, last access: 27 October 2026. a, b
Feofilov, A. G., Chepfer, H., Noël, V., and Szczap, F.: Incorporating EarthCARE observations into a multi-lidar cloud climate record: the ATLID (Atmospheric Lidar) cloud climate product, Atmos. Meas. Tech., 16, 3363–3390, https://doi.org/10.5194/amt-16-3363-2023, 2023. a
Fiocco, G. and DeWolf, J. B.: Frequency spectrum of laser echoes from atmospheric constituents and determination of the aerosol content of air, J. Atmos. Sci., 25, 488–496, https://doi.org/10.1175/1520-0469(1968)025<0488:FSOLEF>2.0.CO;2, 1968. a
Godin-Beekmann, S., Porteneuve, J., and Garnier, A.: Systematic DIAL lidar monitoring of the stratospheric ozone vertical distribution at Observatoire de Haute-Provence (43.92° N, 5.71° E), J. Environ. Monitor., 5, 57–67, https://doi.org/10.1039/b205880d, 2003. a
Haarig, M., Baars, H., König, L., Donovan, D., Ansmann, A., Khaykin, S., Ceolato, R., Cole, J., Gast, B., Floutsi, A. A., Heckmann, V. J., Hogan, R., Chantry, A., Marnas, F., van Zadelhoff, G.-J., and Wandinger, U.: The life cycle of a stratospheric smoke plume as seen from EarthCARE – tracking a plume from Canada to Europe, Geophys. Res. Lett., 53, e2025GL119977, https://doi.org/10.1029/2025GL119977, 2026. a
Kadygrov, N. and Khaykin, S.: Python code for reading and processing EarthCARE ATLID L1B data, Version v1, Zenodo [code], https://doi.org/10.5281/zenodo.18155346, 2026. a
Kar, J., Lee, K.-P., Vaughan, M. A., Tackett, J. L., Trepte, C. R., Winker, D. M., Lucker, P. L., and Getzewich, B. J.: CALIPSO level 3 stratospheric aerosol profile product: version 1.00 algorithm description and initial assessment, Atmos. Meas. Tech., 12, 6173–6191, https://doi.org/10.5194/amt-12-6173-2019, 2019. a
Khaykin, S. M., Godin-Beekmann, S., Keckhut, P., Hauchecorne, A., Jumelet, J., Vernier, J.-P., Bourassa, A., Degenstein, D. A., Rieger, L. A., Bingen, C., Vanhellemont, F., Robert, C., DeLand, M., and Bhartia, P. K.: Variability and evolution of the midlatitude stratospheric aerosol budget from 22 years of ground-based lidar and satellite observations, Atmos. Chem. Phys., 17, 1829–1845, https://doi.org/10.5194/acp-17-1829-2017, 2017. a, b, c
Khaykin, S., Sicard, M., Leblanc, T., Sakai, T., Balugin, N., Berthet, G., Chevrier, S., Chouza, F., Feofilov, A., Gantois, D., Godin-Beekmann, S., Haddouche, A., Jin, Y., Morino, I., Kadygrov, N., Lecas, T., Liley, B., Querel, R., Taha, G., and Yushkov, V.: Global transport of stratospheric aerosol produced by Ruang eruption from EarthCARE ATLID, limb-viewing satellites and ground-based lidar observations, Atmos. Chem. Phys., 26, 607–622, https://doi.org/10.5194/acp-26-607-2026, 2026. a, b, c, d, e
Knepp, T. N., Thomason, L., Roell, M., Damadeo, R., Leavor, K., Leblanc, T., Chouza, F., Khaykin, S., Godin-Beekmann, S., and Flittner, D.: Evaluation of a method for converting Stratospheric Aerosol and Gas Experiment (SAGE) extinction coefficients to backscatter coefficients for intercomparison with lidar observations, Atmos. Meas. Tech., 13, 4261–4276, https://doi.org/10.5194/amt-13-4261-2020, 2020. a, b
Kovilakam, M., Thomason, L., and Knepp, T.: SAGE III/ISS aerosol/cloud categorization and its impact on GloSSAC, Atmos. Meas. Tech., 16, 2709–2731, https://doi.org/10.5194/amt-16-2709-2023, 2023. a
Kremser, S., Thomason, L. W., von Hobe, M., et al.: Stratospheric aerosol – Observations, processes, and impact on climate, Rev. Geophys., 54, 278–335, https://doi.org/10.1002/2015RG000511, 2016. a, b, c
Leblanc, T., McDermid, I. S., and Walsh, T. D.: Ground-based water vapor raman lidar measurements up to the upper troposphere and lower stratosphere for long-term monitoring, Atmos. Meas. Tech., 5, 17–36, https://doi.org/10.5194/amt-5-17-2012, 2012. a
Leblanc, T., Sica, R. J., van Gijsel, J. A. E., Godin-Beekmann, S., Haefele, A., Trickl, T., Payen, G., and Gabarrot, F.: Proposed standardized definitions for vertical resolution and uncertainty in the NDACC lidar ozone and temperature algorithms – Part 1: Vertical resolution, Atmos. Meas. Tech., 9, 4029–4049, https://doi.org/10.5194/amt-9-4029-2016, 2016a. a
Leblanc, T., Sica, R. J., van Gijsel, J. A. E., Godin-Beekmann, S., Haefele, A., Trickl, T., Payen, G., and Liberti, G.: Proposed standardized definitions for vertical resolution and uncertainty in the NDACC lidar ozone and temperature algorithms – Part 2: Ozone DIAL uncertainty budget, Atmos. Meas. Tech., 9, 4051–4078, https://doi.org/10.5194/amt-9-4051-2016, 2016b. a
NASA/LARC/SD/ASDC: SAGE III/ISS L2 Solar Event Species Profiles (HDF5) V006, NASA Langley Atmospheric Science Data Center (ASDC) Distributed Active Archive Center [data set], https://doi.org/10.5067/ISS/SAGEIII/SOLAR_HDF5_L2-V6.0, 2024. a
NDACC: Lidar Instruments – Network for the Detection of Atmospheric Composition Change, https://ndacc.larc.nasa.gov/instruments/lidar, last access: 27 October 2026. a
Poncet, E.: Validation of ATLID stratospheric aerosol retrievals using SAGE III/ISS and ground-based lidar observations, Version 1.0.0, Zenodo [code], https://doi.org/10.5281/zenodo.21282211, 2026. a
Shipley, S. T., Tracy, D. H., Eloranta, E. W., Trauger, J. T., Sroga, J. T., Roesler, F. L., and Weinman, J. A.: High spectral resolution lidar to measure optical scattering properties of atmospheric aerosols. 1: Theory and instrumentation, Appl. Optics, 22, 3716–3724, https://doi.org/10.1364/AO.22.003716, 1983. a
Thomason, L. W. and Knepp, T.: Quantifying SAGE II (1984–2005) and SAGE III/ISS (2017–2022) observations of smoke in the stratosphere, Atmos. Chem. Phys., 23, 10361–10381, https://doi.org/10.5194/acp-23-10361-2023, 2023. a, b
Vaughan, G., Wareing, D., and Ricketts, H.: Measurement Report: Lidar measurements of stratospheric aerosol following the 2019 Raikoke and Ulawun volcanic eruptions, Atmos. Chem. Phys., 21, 5597–5604, https://doi.org/10.5194/acp-21-5597-2021, 2021. a
Wehr, T., Kubota, T., Tzeremes, G., Wallace, K., Nakatsuka, H., Ohno, Y., Koopman, R., Rusli, S., Kikuchi, M., Eisinger, M., Tanaka, T., Taga, M., Deghaye, P., Tomita, E., and Bernaerts, D.: The EarthCARE mission – science and system overview, Atmos. Meas. Tech., 16, 3581–3608, https://doi.org/10.5194/amt-16-3581-2023, 2023. a, b