
the Creative Commons Attribution 4.0 License.
the Creative Commons Attribution 4.0 License.
 | 12 Nov 2026
Two decades of kilometer-scale daily PM2.5 from satellite observations and machine learning reveal geographically diverging exposure in Ghana
Abhishek Anand

Joe A. Amooli
Selina Amoah
Esi Nerquaye Tetteh
Nana Ama Browne Klutse
Clement Mensah Ackaah
Benjamin Essien
Kingsley Mawuli Amegah
Daniel M. Westervelt
Exposure to fine particulate matter (PM2.5) is a major contributor to the global burden of disease, yet air quality data remain sparse in many low- and middle-income countries, limiting nationwide monitoring and effective policy development. We address this gap by developing a high-resolution (1 km×1 km) gridded dataset of daily surface PM2.5 concentrations across Ghana from 2005 to 2025 by training multiple machine learning (ML) models built on ground-based monitoring, satellite observations, and reanalysis products of atmospheric composition and meteorology. Estimates from these models were evaluated with measurements from reference-grade monitors and a large network of calibrated low-cost sensors deployed across Ghana. XGBoost showed the strongest performance among all ML algorithms and best captured spatial and temporal variability in PM2.5 levels. SHapley Additive exPlanations (SHAP) analysis identifies meteorological variables and aerosol optical properties among the important drivers of model-estimated PM2.5. The long-term gridded PM2.5 dataset suggests a pronounced north-south exposure disparity in Ghana, with northern regions of the country experiencing substantially higher PM2.5 concentrations compared to the South, and this difference may be widening at a rate of around 0.15 µg m−3 annually over the 21-year period. This study provides the first long-term high-resolution PM2.5 exposure estimates for Ghana and presents a scalable framework for generating air quality information in data-sparse regions to support air pollution relevant health impact assessments and evidence-based mitigation policies.
- Article
(8740 KB) - Full-text XML
-
Supplement
(3597 KB) - BibTeX
- EndNote


Air pollution is the second leading risk factor for death globally after high blood pressure (Health Effects Institute, 2024). In 2021, exposure to air pollution was associated with around 1.1 million premature annual deaths in Africa (Amooli et al., 2025; Fisher et al., 2021). This risk is dominated by exposure to fine particulate matter (PM2.5), which is associated with ischemic heart disease, stroke, respiratory and neurodegenerative diseases (Hayes et al., 2020; Shi et al., 2020). This burden is particularly severe in low- and middle-income countries, including many African nations, where ambient PM2.5 concentrations frequently exceed World Health Organization (WHO) guidelines. However, long-term air quality observations in these regions remain sparse, constraining accurate exposure assessment, epidemiological analysis, and consequently, evidence-based mitigation policies.
The high capital cost and technical skills needed for establishing and operating a network of regulatory instruments present a significant barrier for continuous air quality monitoring. African countries contain an average of only ∼3 sensors per 100 million people compared with 379 in Europe (Gualtieri et al., 2024). Beta attenuation monitors (BAMs) deployed by the US Department of State at the US Embassies have been one of the major sources of reliable open access PM2.5 measurements around the world. Multi-year hourly PM2.5 levels from these monitors have provided important insights into PM2.5 trends across the African continent, including the first long-term observations in some countries (Anand et al., 2024; Li et al., 2024). However, these deployments are typically limited to just one to two monitors per country capital and hence are unable to capture spatial variability of PM2.5 even within the cities. Recent efforts to address these monitoring gaps include using networks of consumer-grade air sensors for city-scale monitoring of particulate matter through fixed-duration campaigns (Owusu-Tawiah et al., 2025; Raheja et al., 2022; Westervelt et al., 2023). However, these sensors are primarily suited for point-location measurements, requiring dense networks for monitoring over large geographic regions, which remains prohibitively expensive and limits their use for long-term nationwide air quality monitoring.
Satellite-based air quality products have emerged as a promising solution for long-term spatiotemporal monitoring in data-sparse regions. These products often provide near-global spatial coverage, with several satellite instruments offering multi-decadal records of daily observations for air pollution parameters extending back to the early 2000s. Aerosol optical depth (AOD) retrieved from satellites has been widely used for estimating ground-level PM2.5. Liu et al. (2004) used a scaling factor calculated as the ratio of surface PM2.5 mass concentration to satellite-measured column-integrated AOD to estimate spatial PM2.5 concentrations across the United States (Liu et al., 2004). Other studies derived PM2.5-to-AOD ratios simulated by the GEOS-Chem chemical transport model and applied to satellite-based AOD to generate global maps of annual (van Donkelaar et al., 2016; Hammer et al., 2020) and monthly (van Donkelaar et al., 2021) PM2.5 concentrations. However, the relationship between PM2.5 and AOD varies substantially across the globe, largely due to geographical differences in the vertical distribution of aerosol loading (van Donkelaar et al., 2006). As a result, the accuracy of these estimates heavily relies on the availability of reliable ground-based measurements for constraining model estimates and capturing these regional variations between columnar AOD and surface PM2.5. Several studies have therefore emphasized the urgent need for expanding surface monitoring infrastructure in the Global South, particularly in Africa, to improve satellite-based PM2.5 estimates (Anand et al., 2024; Bachwenkizi et al., 2021; Di et al., 2016; van Donkelaar et al., 2016; Hammer et al., 2020; Philip et al., 2014; Vohra et al., 2021; Weagle et al., 2018). Furthermore, existing global PM2.5 products derived solely using Modern-Era Retrospective analysis for Research and Applications Version 2 (MERRA-2) reanalysis parameters provide continuous spatiotemporal coverage, but the spatial resolution remains too coarse (>50 km) to capture intra-city PM2.5 variations across most cities in Africa (Sayeed et al., 2022).
Recent advances in African air quality monitoring provide an opportunity for regionally-refined satellite-based surface PM2.5 datasets trained and tested on local measurements. Zhang et al. (2021) used satellite AOD, meteorological features, land use variables and socioeconomic parameters to develop daily 1 km×1 km PM2.5 concentration maps for 2014–2018 in South Africa, validated by measurements from a network of 20 surface monitors in South Africa. Amooli et al. (2024) developed an AOD to PM2.5 conversion framework to generate 1 km×1 km spatial PM2.5 for Ouagadougou, the capital of Burkina Faso, using surface measurements at the US Embassy in the capital.
Gaseous pollutants, such as nitrogen dioxide (NO2), sulfur dioxide (SO2) and volatile organic compounds, act as precursors to PM2.5 formation (Pye et al., 2022) and can help improve the accuracy of surface-level PM2.5 estimates (Zheng et al., 2023). In Ghana, exposure to air pollution was estimated to contribute to around 32 500 deaths in 2023, with nearly all of these deaths (32 400) attributed to particulate matter pollution, underscoring the substantial health burden associated with air pollution in the country (Institute for Health Metrics and Evaluation, 2025). In this study, we propose a multi-model machine learning approach to estimate 21 years (2005–2025) of daily PM2.5 concentrations for Ghana at 1 km×1 km spatial resolution. In addition to AOD, this modeling approach incorporates satellite-derived information on gaseous precursors to PM2.5 formation and other aerosol indicators. We also include meteorological parameters to account for weather-induced variability in PM2.5 concentrations. A large network of 98 well-calibrated surface PM2.5 monitors, providing a monitor density of ∼275 monitors per 100 million people, was deployed across Ghana, and the measurements were used to capture the geographic distribution of PM2.5 concentrations in Ghana. These additions collectively help reduce large uncertainties in satellite-derived surface PM2.5, typically observed due to a limited representation of input variables and scarcity of surface PM2.5 measurements in regions such as sub-Saharan Africa. We further augment missing PM2.5 information due to occasional unavailability of satellite-derived predictors by developing a MERRA-2-based PM2.5 model. To our knowledge, this is among the first efforts to generate long-term gap-filled PM2.5 estimates at 1 km×1 km grid resolution trained and evaluated using robust local observations in Africa, while also providing insights into spatiotemporal trends of PM2.5 across Ghana.
2.1 Study area
Ghana is located in West Africa and lies between latitudes ∼4.5 and 11.5° N and longitudes 3.5° W and 1.5° E, encompassing an area of about 238 535 km2. The country is characterized by diverse geographic features, including coastal plains along the Gulf of Guinea, forested regions in the south, and savanna landscapes in the north. Major urban centers include Accra, Kumasi, Tamale, Sekondi-Takoradi, Cape Coast, Sunyani and the industrial port of Tema, representing important population and economic hubs with diverse emission characteristics.
Ghana has a typical tropical climate with distinct wet and dry seasons. Southern Ghana typically exhibits bimodal rainfall patterns due to its proximity to the Gulf of Guinea and the progression of the Intertropical Convergence Zone (ITCZ) (Nicholson, 2018), with major and minor wet seasons occurring between April–June and September–October, respectively. In contrast, northern Ghana has a unimodal wet season between April and October, peaking during August–September. Ghana experiences a meteorological phenomenon, known as the Harmattan, during mid-November to mid-March, which overlaps with the dry season. During this period, dry northeasterly winds transport large amounts of mineral dust from the Sahara Desert across West African countries, including Ghana (Alli et al., 2021). This results in extremely high concentrations of particulate matter across the country, leading to severely degraded air quality and reduced visibility, with impacts more pronounced in northern Ghana than in the south.
2.2 Surface PM2.5 measurements
Ground-level measurements for PM2.5 were collected from a network of 98 sensors spread across Ghana. The network consisted of 96 low-cost sensors, including 10 Airnote v2.0 (Blues Inc., Boston, MA), 21 Clarity Node-S Generation II (Clarity Movement Co., Berkeley, CA), 15 PurpleAir PA-II SD monitors (PurpleAir Inc., Draper, UT), 6 MODULAIR™ (QuantAQ Inc., Somerville, MA), and 44 MODULAIR™-PM monitors (QuantAQ Inc., Somerville, MA). PM2.5 measurements from two BAMs (BAM-1020, Met One Instruments Inc., Grants Pass, Oregon) were also obtained, with one deployed in Techiman and another located at the U.S. Embassy in Accra, Ghana. The BAM-1020 uses a U.S. EPA-designated Federal Equivalent Method for measuring PM2.5 and therefore was used as a reference monitor for calibrating raw PM2.5 measurements from the low-cost sensors in the network. Table S1 in the Supplement details technical specifications of each monitor type, while Figs. S1 and S2 in the Supplement respectively illustrate the deployment locations and instrument-specific measurement periods for all sensors used in this study. PM2.5 measurements collected from this sensor network between August 2018 and October 2024 were used as ground truth for model development. Since in situ measurements are available only from August 2018, PM2.5 estimates for 2005–May 2018 were generated using models trained on the available surface observations and therefore cannot be directly validated against surface measurements from that period.
These sensors were strategically deployed across Ghana, with a significantly higher density in urban areas where population is largely concentrated, to capture high spatial variability in PM2.5 concentrations arising from diverse sources, including vehicular emissions, open burning, cooking activities and industrial emissions (Kwarteng et al., 2020; Zhou et al., 2014). Air quality monitors were also deployed in suburban and rural regions of Ghana, where local air quality is strongly influenced by emissions from solid biomass fuel use for cooking, agricultural residue burning and dust from unpaved roads (Ofosu et al., 2013). This network architecture helps inform the model about PM2.5 variability across northern, middle and southern belts of Ghana. The monitoring network had broader coverage across central and southern Ghana, with 35 sensors in the Kintampo area, 16 at Techiman, 20 at Accra, and 13 at Kumasi, while northern Ghana was represented by three sensors in Tamale (Table S2 and Fig. S1 in the Supplement). The sensors associated with Kintampo were distributed across the broader area surrounding Kintampo rather than being concentrated solely within the Kintampo town. Figure S1 depicts the locations of every monitor against a population count map retrieved from the LandScan project at Oak Ridge National Laboratory (Lebakula et al., 2025). Additional deployment details are available in Tables S2 and S3 in the Supplement.
Raw PM2.5 measurements from each low-cost sensor, available at sub-hourly time resolution, were aggregated to hourly concentrations and subjected to custom-designed calibration models unique to each sensor type to derive quality assurance/quality control (QA/QC)-corrected exposure levels. The calibration procedures are further explained in Sect. S1 in the Supplement. These sensor-specific corrections were applied prior to model development to improve the consistency of PM2.5 measurements across the different sensor types.
2.3 Satellite and reanalysis datasets
2.3.1 MODIS Level 2 aerosol optical depth
Moderate Resolution Imaging Spectroradiometer (MODIS) is an optical sensor aboard NASA's Terra (launched in 1999) and Aqua (launched in 2002) sun-synchronous low-Earth orbit satellites, passing over the equator at 10:30 am and 01:30 pm LT, respectively. In this study, we used MODIS AOD at 550 nm derived through the Multi-Angle Implementation of Atmospheric Correction (MAIAC) algorithm (Lyapustin et al., 2018), specifically from the MCD19A2 product. It is a Level 2 product generated by combining measurements from MODIS instruments aboard both Aqua and Terra satellites, providing daily global coverage in multiple spectral bands and has been widely used for monitoring land and atmospheric parameters for over two decades. The MAIAC algorithm combines time series analysis and multi-angle radiative transfer modeling to produce atmospherically corrected surface reflectance and high-quality AOD retrievals at a 1 km×1 km spatial resolution beginning in February 2000. The enhanced spatial resolution, improved cloud screening, and robust performance over complex surfaces make MCD19A2 particularly valuable for estimating ground-level PM2.5 in data-sparse regions, such as Ghana.
The AOD from the MCD19A2 product is available in sinusoidal projection tiles. Tiles h17v07, h17v08, h18v07, and h18v08 were combined to gather AOD information for Ghana. For each day, the Optical_Depth_055 product and corresponding AOD_QA layers were extracted and used for further analysis. The AOD_QA layer contains 16-bit unsigned integers, with bits 8–11 embedding the QA information. QA-based filtering was applied to retain Optical_Depth_055 retrievals with QA flags {0000, 0011, 1011}, classified as best-quality observations over land for research applications, while excluding pixels affected by cloud contamination, snow, sun glint, coastline artifacts, or missing retrieval conditions. The AOD values were then transformed into physically meaningful retrievals using the scale factor and offset from the product attributes. All valid orbit-level retrievals within each day were aggregated for each cell, and measurements for duplicate grid cells were averaged to generate daily mean AOD values.
2.3.2 OMI Level 2 air quality products
The Ozone Monitoring Instrument (OMI) has been continuously measuring air quality parameters onboard NASA's Aura spacecraft since July 2004. Similar to Terra and Aqua, Aura is a sun-synchronous LEO satellite and crosses the equator at 01:45 PM LT. We used OMI Level 2 Collection 3 measurements for ultraviolet aerosol index (UVAI) and column number density for ozone (O3), tropospheric NO2, SO2 and formaldehyde (HCHO). These air quality features have a nadir footprint of 13 km×24 km. UVAI is a unitless quantity derived from top-of-atmosphere radiances at 354 and 388 nm, which allows distinction between UV-absorbing aerosols (e.g., dust, biomass burning smoke, etc.), non-absorbing aerosols and clouds (Torres et al., 2020). HCHO and NO2 are measured in molecules cm−2, whereas O3 and SO2 are expressed in Dobson Unit (DU), where molecules cm−2. The Level 2 OMI data occasionally contain multiple retrievals for a given grid cell within a single day due to multiple orbital overpasses. These intra-day measurements were aggregated to generate a single daily-averaged retrieval for each grid cell.
Quality control was applied individually to each OMI product to account for differences in retrieval sensitivity, signal strength, and known instrumental artifacts. For the UV Aerosol Index, pixels were retained only when CloudFraction≤0.3, SolarZenithAngle≤75°, and XTrackQualityFlags=0. The XTrackQualityFlags filter is particularly useful in excluding cross-track (row) anomalies and geometries associated with increased radiative transfer uncertainty. HCHO is more sensitive to cloud contamination and retrieval noise, and hence strict filtering criteria were applied by requiring AMFCloudFraction≤0.3, SolarZenithAngle≤75°, XTrackQualityFlags=0, and MainDataQualityFlag=0 to ensure successful spectral fitting and reliable air mass factor calculations. Total column ozone, a comparatively high signal-to-noise product, was screened using RadiativeCloudFraction≤0.3, SolarZenithAngle≤85°, and QualityFlags≤1, thereby retaining only good or glint-corrected retrievals. For tropospheric NO2, pixels were restricted to CloudFraction≤0.3, SolarZenithAngle≤75°, and VcdQualityFlags=0 to remove cloud-affected scenes and retrievals with known fitting or cross-track issues. SO2 retrievals, which are particularly sensitive to instrumental artifacts and weak signal conditions, were subjected to the most stringent screening: CloudRadiationFraction≤0.3, SolarZenithAngle≤65°, Flag_RowAnomaly≠1, Flag_SAA≠1, and AlgorithmFlag_SnowIce≠2, excluding scenes affected by the OMI row anomaly, South Atlantic Anomaly interference, or uncertain cloud detection over snow and ice. The ColumnAmountSO2_PBL dataset from the OMI Level 2 SO2 product was specifically selected because it represents SO2 VCD within the planetary boundary layer and is commonly used as an indicator of anthropogenic SO2 emissions (Li et al., 2013). These species-specific filtering criteria follow OMI Collection 3 product documentation to ensure that only physically meaningful and robust retrievals were included in the analysis. More details on quality screening of OMI and other satellite-derived products are summarized in Table S4 in the Supplement.
2.3.3 TROPOMI Level 2 air quality features
The TROPOspheric Monitoring Instrument (TROPOMI) is onboard the Copernicus Sentinel-5 Precursor (S5P), a sun-synchronous LEO satellite that was launched in October 2017 and passes over the equator at 01:30 PM LT. We used Level 2 Version 2 UVAI (unitless) and column number density measurements (in mol m−2) for O3, tropospheric NO2, SO2, and tropospheric HCHO, which are similar to the parameters used from OMI and are consistently available from 7 May 2018. In addition, carbon monoxide (CO) retrievals from TROPOMI were also used because CO is a primary combustion product and hence a strong tracer for combustion-related emission sources in Ghana (Griffin et al., 2024). The spatial resolution for O3, NO2, SO2, HCHO and UVAI products was 7 km×3.5 km (across × along track) until 5 August 2019 and improved to 5.5 km×3.5 km from 6 August 2019 onward due to reduced across-track detector binning. This corresponds to approximately a 13- to 16-fold improvement in spatial resolution compared to OMI. In contrast, CO retrievals from the short wavelength infrared channel were provided at 7 km×7 km (across × along track) prior to 6 August 2019 and at 7 km×5.5 km thereafter. TROPOMI provides tropospheric column density for HCHO, which differs from Level 2 total column HCHO density retrievals from OMI. In most cases, particularly over polluted areas, the amount of HCHO in the stratosphere is negligible and almost all HCHO resides in the troposphere due to its short lifetime (Ayazpour et al., 2025; De Smedt et al., 2008). Therefore, tropospheric HCHO is typically approximated as total column HCHO. The reprocessed dataset (RPRO) covers 30 April 2018 until 25 July 2022 and is fully compatible with the current offline dataset (OFFL), which covers 26 July 2022 onwards. TROPOMI provides UVAI at three wavelength pairs: 335/367 nm, 340/380 nm, and 354/388 nm but only UVAI calculated using the 354/388 nm wavelength pair was used, as it is an indicator of dust and biomass burning smoke (Torres et al., 2020). Following the quality screening criteria provided in the official product documentation, only pixels with qa_value≥0.5 were retained for each TROPOMI product to ensure high-quality retrievals and exclude observations affected by clouds or snow/ice (Van Geffen et al., 2022).
2.3.4 ERA5-Land reanalysis hourly dataset
ERA5-Land is a fifth-generation global climate reanalysis dataset from the European Centre for Medium-Range Weather Forecasts (ECMWF), covering the period 1940–present at hourly temporal resolution (Muñoz-Sabater et al., 2021). The dataset is available at 0.1°×0.1° grid resolution for dewpoint temperature at 2 m above Earth's surface (Td), surface temperature at 2 m above surface (T), total precipitation (TP), and wind velocities at 10 m above the ground in east-west direction (U) and north-south direction (V). These variables have proven to be important meteorological drivers of ambient pollution dynamics (Westervelt et al., 2025). Dewpoint and surface temperatures are derived at 2 m whereas wind speeds provided at 10 m above ground, following the guidelines from World Meteorological Organization for surface measurements of meteorological variables (World Meteorological Organization, 2008). Relative humidity (RH, in %) is not inherently available from the ERA5-Land dataset and hence was calculated using the Magnus-Tetens equation (Amooli et al., 2024) as:
where RH is the relative humidity (in %) at 2 m above ground, Td and T2m are 2 m dewpoint and ambient temperatures (in °C) from ERA5-Land dataset.
2.3.5 MERRA-2 reanalysis product
MERRA-2 is a global atmospheric reanalysis developed by NASA's Global Modeling and Assimilation Office that integrates the GEOS-5 Earth system model with a three-dimensional variational data assimilation system (Gelaro et al., 2017). MERRA-2 assimilates a comprehensive suite of meteorological observations, including satellite radiances, radiosondes, aircraft, and surface measurements, and was the first long-term global reanalysis to incorporate space-based AOD observations, enabling improved representation of aerosol variability and aerosol–radiation interactions. The reanalysis is produced at a horizontal resolution of 0.5°×0.625° with 72 vertical levels extending to 0.01 hPa and provides hourly to monthly-averaged meteorological and aerosol diagnostics from 1980 to the present. In this study, we used MERRA-2 aerosol mass and optical properties from the aerosol diagnostics product M2T1NXAER as predictors in the model development framework (Global Modeling and Assimilation Office, 2015). The features include hourly total extinction aerosol optical thickness at 550 nm (TOTEXTTAU) and surface concentrations of black carbon (BCSMASS), organic carbon (OCSMASS), sulfate (SO4SMASS), sulfur dioxide (SO2SMASS), fine-mode dust (DUSMASS25) and fine-mode sea salt (SSSMASS25). These variables collectively represent major anthropogenic and natural aerosol components and provide physically consistent, spatially complete information on aerosol loading and composition.
2.4 Data preprocessing
2.4.1 Regridding input features
The ERA5-Land and MERRA-2 datasets are available in Coordinated Universal Time (UTC), which aligns with the local time in Ghana. Hourly datasets were aggregated to daily resolution as 24 h averages for each feature retrieved from ERA5-Land and MERRA-2, except the ERA5 total precipitation product, which reports cumulative hourly values since the start of the day. The 00:00 UTC precipitation value was used as the total precipitation for the previous day (Muñoz Sabater, 2019).
The ERA5-Land dataset can often contain missing parameter retrievals for coastal grid cells due to the treatment of mixed land–ocean cells in the land–sea mask (Muñoz Sabater, 2019). This presents a limitation in deriving PM2.5 for coastal locations, particularly for Ghana, where major urban centers, such as Accra, Tema, and Sekondi, are located along the coastline. Missing feature values in these coastal grid cells were imputed using nearest-neighbor spatial interpolation from adjacent land grid cells.
The QA-corrected daily AOD from the MCD19A2 product was transformed from the sinusoidal to the World Geodetic System 1984 (WGS84; EPSG:4326) projection using the tile-specific projection information embedded in each file. The daily AOD fields were further regridded to a spatial resolution of 0.01°×0.01° over Ghana, covering a rectangular domain bounded by 4.5 to 11.5° N and 3.5° W to 1.5° E, using area-weighted averaging.
To harmonize the spatial resolution of all input datasets with the 1 km MODIS MAIAC grid, the coarser-resolution input features were regridded to the common 0.01° grid. The ERA5 meteorological variables (0.1°×0.1° resolution) and MERRA-2 features (0.5°×0.625° resolution) were regridded using bilinear interpolation, which provides a smooth transition between grid points. Satellite-derived atmospheric composition variables from OMI and TROPOMI were regridded to a spatial resolution of 0.01°×0.01° using area-weighted averaging. This method accounts for the varying overlap between original satellite pixels and the target 1 km grid cells, ensuring that spatial integrity is maintained during the resampling process. These approaches enable the integration of diverse atmospheric and environmental data at a common high-resolution scale, suitable for fine-scale air pollution modeling.
The 1 km prediction grid allows the model to retain the fine-scale spatial variability represented by the MAIAC AOD, such that adjacent grid cells can have different PM2.5 estimates, while the coarser-resolution predictors provide complementary information on regional atmospheric composition and meteorological conditions. Thus, the resulting 1 km PM2.5 estimates integrate information across multiple spatial scales, with MAIAC AOD providing fine-scale spatial information and the other predictors characterizing broader-scale atmospheric conditions.
2.4.2 Data preparation
Since surface monitors provide PM2.5 measurements at discrete geographic locations, the training dataset was constructed by spatially matching PM2.5 observations from each monitor with predictor values from the 0.01°×0.01° grid cells containing the monitor. For each sensor-day observation, the corresponding daily values of MODIS AOD, OMI/TROPOMI gas-phase retrievals, ERA5-Land meteorological parameters, and MERRA-2 aerosol diagnostics were extracted from respective grid cells. This colocation was performed for each observation date across the full sensor deployment period (August 2018–October 2024), yielding a tabular dataset with each row representing a unique sensor-day pair and containing the measured PM2.5 concentration alongside the corresponding values of all predictor variables. Sensor-day records for which any satellite-derived predictor was unavailable (e.g., due to cloud cover or instrument downtime) were excluded from the training set for the respective model. Collinearity among predictors was not explicitly removed, as the machine learning algorithms used in this study are generally robust to correlated inputs. Retaining correlated variables allows the models to capture potentially informative relationships among atmospheric and satellite-derived features, while avoiding the removal of predictors based solely on predefined Pearson correlation thresholds.
2.4.3 Cyclic features
PM2.5 concentrations in Ghana exhibit pronounced seasonal variability, particularly during the Harmattan period, when long-range transport of Saharan dust substantially elevates particulate levels. To account for this cyclical behavior and enable the model to capture recurring seasonal patterns in PM2.5 variability, the cosine and sine transformations of the day of year (DOY) for a year of N days were computed as follows and included as predictor variables.
2.4.4 Standardization
Prior to model training, all continuous predictor variables were standardized using z-score normalization by subtracting the training set mean (μ) and dividing by the standard deviation (σ) as . Standardization was applied to ensure that differences in feature scales did not disproportionately influence scale-sensitive algorithms, including multi-layer perceptron (MLP), least absolute shrinkage and selection operator (LASSO), and support vector machine (SVM). Tree-based models, including random forest (RF) and XGBoost, are invariant to monotonic feature transformations and thus did not require scaling, but the same standardized dataset was used for all algorithms to maintain a consistent preprocessing workflow. Fill values and physically implausible retrievals were replaced with NaN and excluded from training prior to standardization.
2.5 Development of a spatiotemporal PM2.5 model
We developed a multi-model framework by integrating satellite retrievals, reanalysis products, and ground-based measurements to ensure complete coverage of PM2.5 for the entire geographical region of Ghana and all days from 2005 to 2025 (Fig. 1). The framework consists of three complementary machine learning models with varying input features: the TROPOMI model, OMI model, and MERRA-2 model. All three models were trained using ground-level PM2.5 measurements and incorporated meteorological variables from the ERA5-Land reanalysis dataset. The TROPOMI model derives PM2.5 beginning 7 May 2018 by integrating AOD from MODIS and air quality parameters (UVAI, CO, HCHO, NO2, O3, and SO2) from the TROPOMI instrument. The OMI model also uses MODIS AOD but utilizes only UVAI, HCHO, NO2, O3, and SO2 retrievals from OMI to estimate PM2.5 from 1 January 2005 to 6 May 2018, before TROPOMI measurements became available.
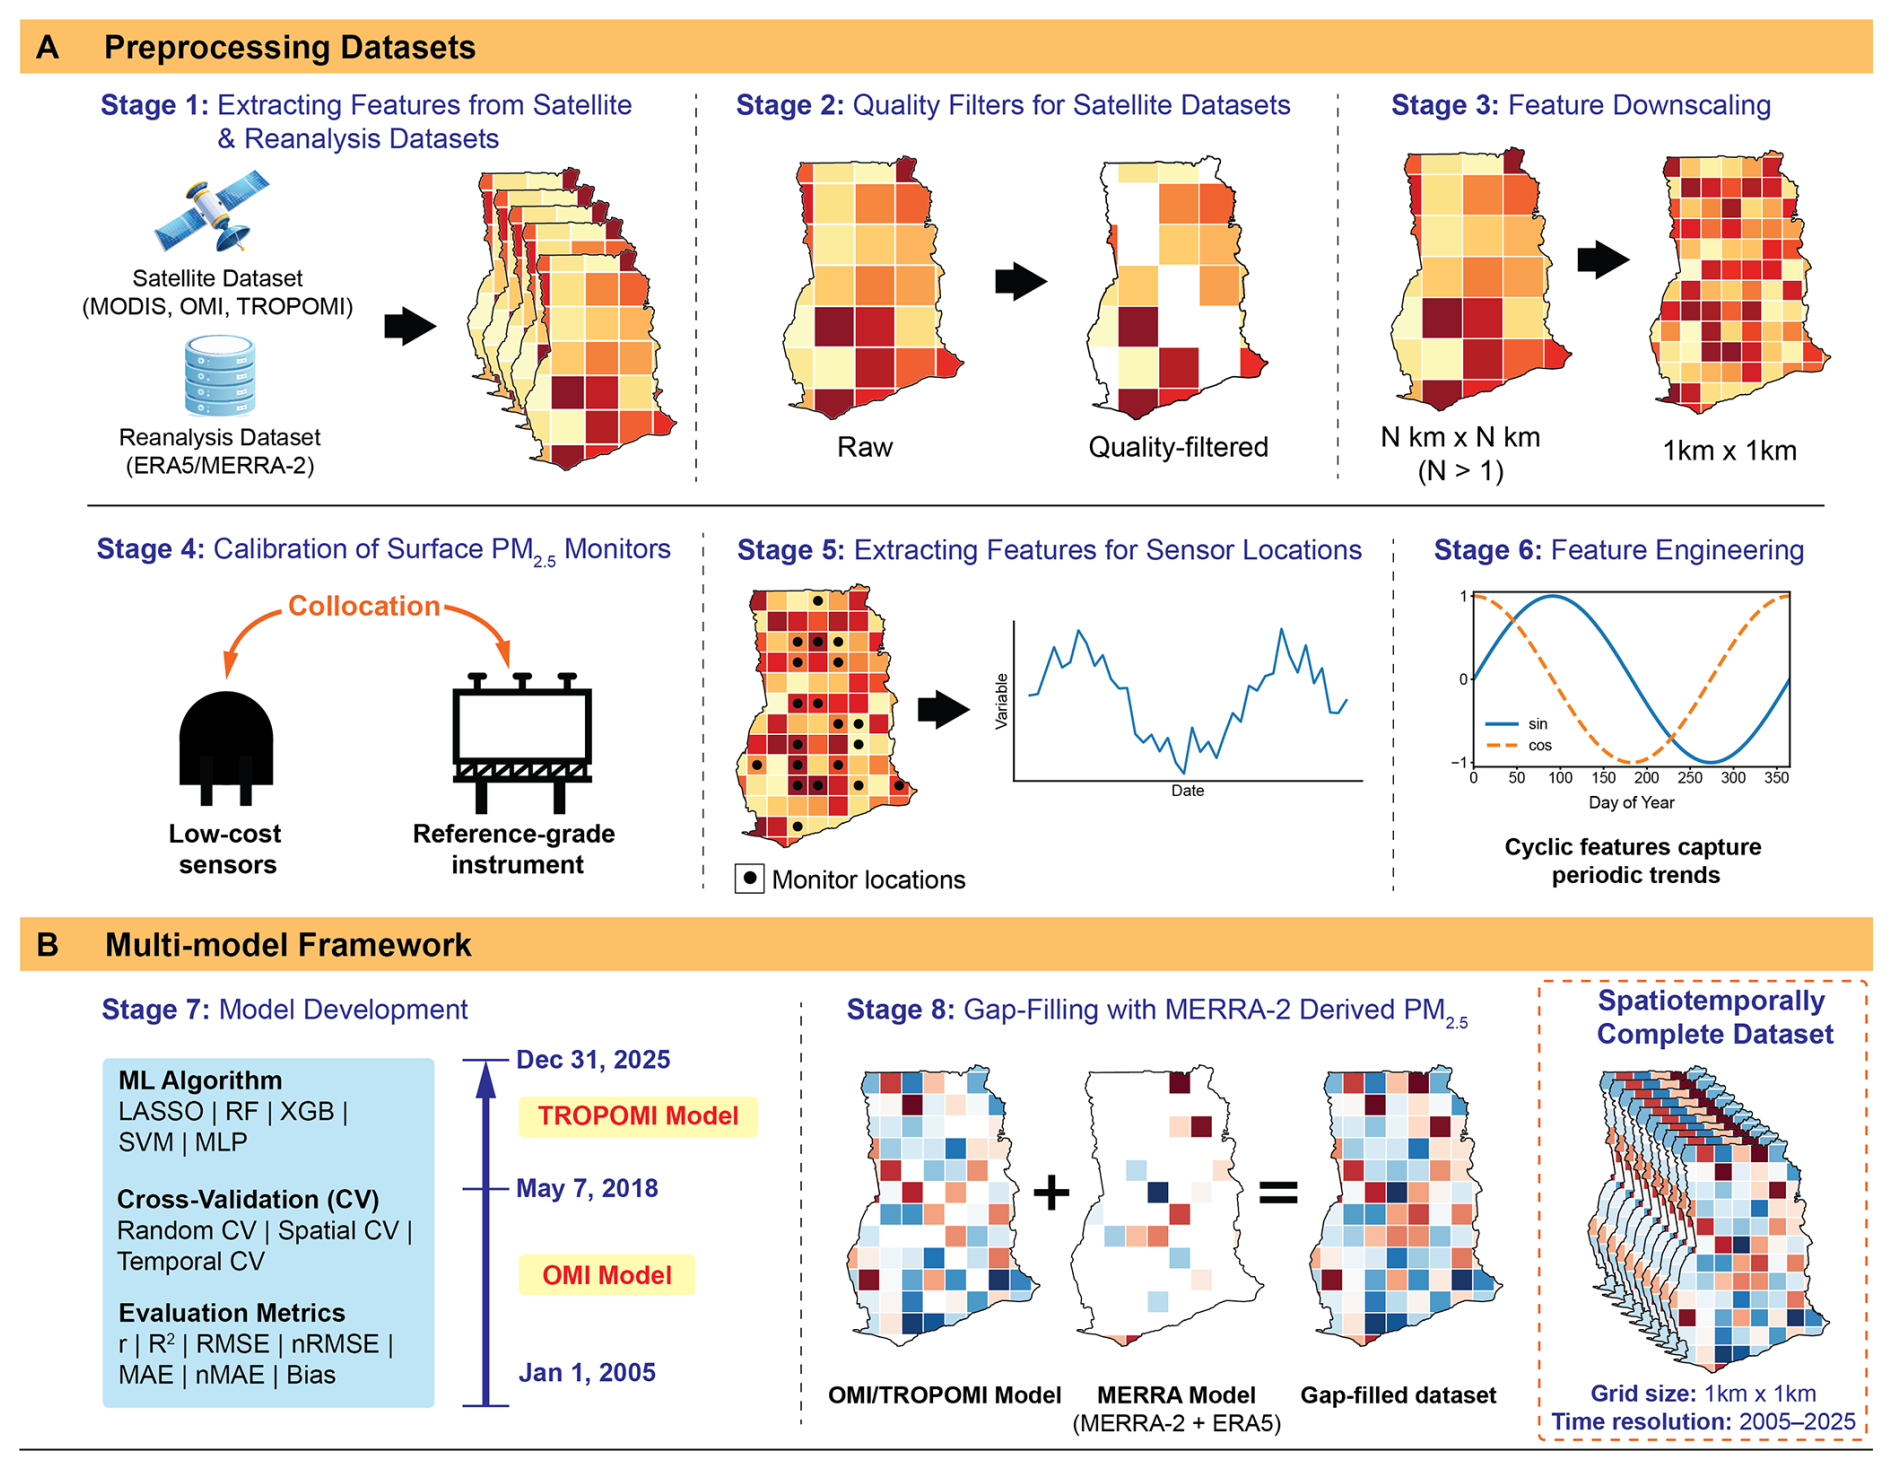
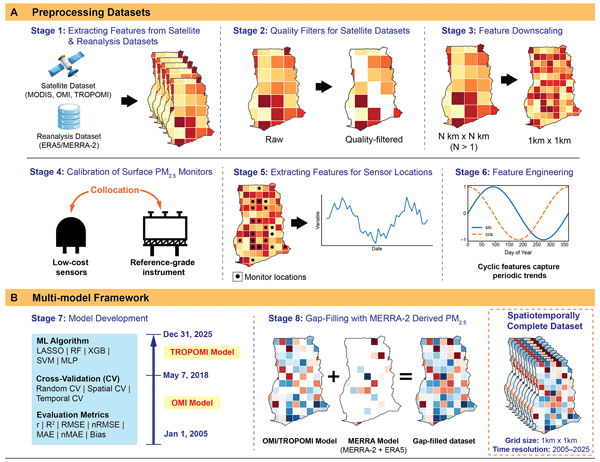
Figure 1Overview of the modeling framework for generating high-resolution PM2.5 estimates. The workflow demonstrates a three-model framework which developed machine learning algorithms by integrating satellite and reanalysis products with ground-based PM2.5 measurements through preprocessing, feature engineering, and model training to produce continuous spatiotemporal PM2.5 concentrations at 1 km×1 km spatial resolution from 2005–2025. Air quality input predictors were obtained from satellite instruments, along with meteorological variables from ERA5. Satellite observations were quality screened and spatially harmonized prior to model development. Ground-based PM2.5 measurements from reference monitors and calibrated low-cost sensors were used for training and validation of multiple machine learning algorithms under random, spatial, and temporal cross-validation schemes. Two satellite-based models were developed using predictors derived from OMI (OMI Model; 1 January 2005–6 May 2018) and TROPOMI (TROPOMI Model; 7 May 2018–31 December 2025). Missing satellite retrievals were supplemented using a gap-filling model (MERRA-2 Model) developed using the aerosol diagnostics dataset from MERRA-2 and meteorological variables from ERA5-Land to produce a spatiotemporally complete daily PM2.5 dataset between 2005–2025 across Ghana.
Since OMI and TROPOMI models rely heavily on satellite-derived observations, occasional cloud cover and instrument-specific limitations, including row anomalies in OMI (Torres et al., 2018) and retrieval uncertainties in TROPOMI (Veefkind et al., 2012), can result in missing or invalid satellite retrievals, preventing PM2.5 estimates from both models for certain regions and time periods. The MERRA-2-based model was developed to mitigate these PM2.5 gaps. It utilizes air quality features from MERRA-2 reanalysis dataset, including BCSMASS, OCSMASS, SO4SMASS, SO2SMASS, DUSMASS25, SSSMASS25, and TOTEXTTAU. Although MERRA-2 also contains meteorological variables, those features were instead obtained from the ERA5-Land reanalysis dataset due to availability of hourly variables at approximately 31 times finer grid sizes (0.1°×0.1°) which is more suitable for developing a high spatial resolution PM2.5 model. The MERRA-2-based model therefore serves as a fallback framework for periods or locations where satellite retrievals from OMI or TROPOMI are unavailable, ensuring continuous spatiotemporal PM2.5 coverage across Ghana from 2005–2025.
For each day and 1 km grid cell, the corresponding satellite-based model (TROPOMI or OMI) was used when the required satellite predictors were available. Grid cells where a satellite-based prediction could not be generated were then filled using the MERRA-2-based model. Thus, the final PM2.5 product was constructed through a hierarchical prediction and gap-filling procedure. The OMI model was used from 1 January 2005 to 6 May 2018, and the TROPOMI model from 7 May 2018 onward, with the MERRA-2 model providing predictions only for remaining spatial or temporal gaps.
For each model type, geospatial machine learning algorithms, including LASSO, SVM, RF, XGBoost and MLP, were developed and evaluated to determine the optimal modeling approach for estimating daily PM2.5 concentrations. Model performance was evaluated using cross-validation to ensure robust assessment and reduce the risk of overfitting. The probability distribution of PM2.5 measurements from surface monitors exhibits a right-skewed distribution with a long tail towards higher concentrations (Fig. S6 in the Supplement). Therefore, the dataset was first divided into training (80 %) and testing (20 %) subsets using stratified sampling based on PM2.5 concentration ranges. PM2.5 values were grouped into discrete bins using thresholds of 35, 60, 100, 150, and 200 µg m−3, to ensure that low, moderate, and high pollution conditions were proportionally represented in both subsets. This stratification was aimed to improve model robustness by ensuring representation of episodic high-PM events, which is particularly important in geographical regions such as Ghana where the Harmattan season periodically leads to elevated particulate matter levels. Model hyperparameters were optimized using repeated five-fold cross-validation (5 folds repeated 5 times) applied to the training dataset, with the mean root mean square error (RMSE) across validation folds used as the loss function to identify the best-performing model configuration with minimal risk of overfitting. Model performance was assessed using r, R2, RMSE, MAE and mean bias. Mean-normalized RMSE (nRMSE) and MAE (nMAE) were computed by dividing the errors by the mean observed PM2.5 concentrations, enabling comparison of model performance across environments with varying pollution levels. After determining the optimal hyperparameters, the model configuration was fixed and further evaluated using structured cross-validation to assess its ability to generalize across Ghana and time. Spatial and temporal cross-validation were used to reduce the influence of spatial and temporal autocorrelation and provide a more realistic estimate of model generalization.
Spatial cross-validation was conducted using a leave-one-location-out cross-validation approach, where data from one monitoring location were withheld as the test set while the model was trained using data from all remaining locations. This procedure was repeated until each location had served once as the test set. Locations with limited data coverage (Somanya and Sekondi) were excluded from the spatial cross-validation analysis because the sparse observations at these sites were insufficient for robust evaluation of model performance. This approach evaluates the model's ability to generalize to locations in Ghana where surface measurements are not available.
Temporal cross-validation was performed using the leave-one-year-out cross-validation approach, where observations from a single year were excluded from training and used exclusively for testing for each year from 2018 to 2024 of the surface measurement campaign. In each fold, the model was retrained using the fixed hyperparameters and evaluated on the held-out subset. This approach assesses the ability of the model to generalize across interannual variability in meteorology, emissions, and episodic pollution events, increasing confidence in the temporal robustness of PM2.5 estimates for periods outside the training data. This step is particularly important because model training is based on observations from 2018–2024, while PM2.5 concentrations are estimated retrospectively back to 2005, extending the application of the model beyond the period represented by the ground observations.
The optimized model from each predictor framework (TROPOMI, OMI, and MERRA) was subsequently applied to the complete gridded predictor dataset to generate spatially continuous daily PM2.5 estimates across the spatiotemporal study domain. For each grid cell s and day t, predicted concentrations were obtained as , where Xs,t denotes the vector of satellite, meteorological, and cyclic predictors. The final output consisted of daily PM2.5 maps at 0.01°×0.01° spatial resolution ranging from 2005 to 2025, enabling high-resolution spatiotemporal exposure assessment for subsequent analyses.
2.6 City-level aggregated PM2.5
Daily PM2.5 concentrations were estimated for 20 locations across Ghana by spatially aggregating selected 1 km gridded PM2.5 estimates. The study locations included the regional capitals: Bolgatanga (Upper East), Nalerigu (North East), Wa (Upper West), Tamale (Northern), Damongo (Savannah), Dambai (Oti), Techiman (Bono East), Sunyani (Bono), Goaso (Ahafo), Kumasi (Ashanti), Ho (Volta), Sefwi Wiawso (Western North), Koforidua (Eastern), Cape Coast (Central), Sekondi-Takoradi (Western), and Accra (Greater Accra). Additional non-capital locations of interest consisted of Navrongo (Upper East), Kintampo (Bono East), Somanya (Eastern), and Tema (Greater Accra). For each location, a set of 1 km grid cells was selected based on the spatial extent and morphology of the surrounding built-up area, using Global Human Settlement Layer Urban Centre Database (GHS-UCDB) (Melchiorri et al., 2024) boundaries as the primary spatial reference where available and evaluating adjacent cells based on continuity of built-up development and surrounding spatial context (Sect. S2 and Fig. S7 in the Supplement). The selected cells were averaged to generate a representative daily PM2.5 time series for each location.
2.7 Long-term PM2.5 trend analysis
To quantify the direction, magnitude, and statistical significance of long-term changes in surface PM2.5 across Ghana, we applied the Seasonal Mann–Kendall (SMK) test and Sen's slope estimator to monthly mean PM2.5 concentrations derived from the multi-model output for 2005–2025. Monthly means were calculated from daily 1 km gridded PM2.5 concentrations, yielding 252 monthly observations per grid cell. The SMK test was used to account for the strong recurring seasonal cycle in PM2.5 concentrations, particularly during the Harmattan season (Hirsch and Slack, 1984). Sen's slope estimator was used to quantify the magnitude of the monotonic trend in (Sen, 1968). For city-level trend analysis, the daily PM2.5 concentrations aggregated over the selected 1 km grid cells for each location were first averaged to monthly concentrations. The SMK test and Seasonal Sen's slope estimator were then applied to the resulting monthly city-level time series to estimate the overall trend across the study period. The same approach was applied individually to the Harmattan (15 November–15 March) and non-Harmattan periods (16 March–14 November), with daily PM2.5 concentrations first classified according to these date ranges and then aggregated to monthly mean concentrations.
Since the pixel-wise trend analysis involves spatially contiguous grid cells, we also evaluated spatial autocorrelation in the gridded PM2.5 fields using Global Moran's I with a first-order rook neighborhood (Moran, 1950). Global Moran's I was calculated annually for the 0.01°×0.01° PM2.5 fields for 2005–2025 and compared with that of the V6_GL_03 gridded PM2.5 product from Shen et al. (2024) at 0.01 and 0.1° resolutions. Additional details are presented in Sect. S3 in the Supplement.
For the pixel-wise trend analysis, the Benjamini–Hochberg false discovery rate (FDR) procedure was applied to the SMK p-values across all valid grid cells. The resulting FDR-adjusted p-values (q-values) were used to identify statistically significant trends, with q<0.05 considered statistically significant (Benjamini and Hochberg, 1995). The SMK test and Sen's slope were applied independently to the monthly mean PM2.5 time series at each 1 km grid cell across Ghana to produce spatially resolved maps of trend magnitude and significance. Additionally, spatially averaged time series were computed for the national domain and for distinct sub-regions of Ghana (northern, middle, and southern belts) to characterize large-scale changes in PM2.5 burden over the 21-year study period. Further details of the pixel-wise trend analysis and FDR correction are provided in Sect. S4 in the Supplement.
3.1 Surface PM2.5 measurements
The daily PM2.5 concentrations collected by surface monitors during the measurement campaign (2018–2024) exhibited a mean concentration of 31.4 µg m−3, indicating consistently elevated pollution levels. The distribution of observed daily PM2.5 concentrations is strongly right skewed, characterized by a long tail toward higher concentration values, as shown in Fig. S6. The 95th percentile PM2.5 levels reached 80.0 µg m−3, 2.6 times the mean concentration which highlights the frequent occurrence of episodic high-pollution events. The large proportion of Harmattan-season observations at higher PM2.5 concentrations suggests that these extreme values are strongly associated with Harmattan dust transport during the dry season. The skewed distribution indicates that while most observations fall within moderate concentration ranges, a smaller proportion of high-concentration events contributes disproportionately to the overall PM2.5 distribution.
Figure S8 in the Supplement shows violin distributions of measured daily PM2.5 concentrations across all cities with surface monitoring locations, revealing pronounced spatial heterogeneity in mean daily PM2.5. The embedded box plots indicate that median concentrations at all locations range between 15–40 µg m−3, consistently exceeding the WHO 24 h guideline of 15 µg m−3 (World Health Organization, 2021).
3.2 Model performance
Model performance was rigorously evaluated across five machine learning algorithms, LASSO, RF, SVM, XGBoost and MLP, for three model configurations TROPOMI model, OMI model, and MERRA model, under random, temporal and spatial cross-validation (CV) schemes. These algorithms represent different modeling approaches, including linear and kernel-based regression (LASSO and SVM), tree-based ensemble methods (RF and XGBoost), and neural networks (MLP). The MLP is a fully connected neural network, and its architecture used in this study is illustrated in Fig. S9 in the Supplement. Optimized hyperparameter information for each ML algorithm and model configuration is summarized in Tables S5–S7 in the Supplement. Model performance metrics, including Pearson correlation coefficient (r), coefficient of determination (R2), root-mean square error (RMSE) and mean-normalized RMSE (nRMSE), for all machine learning algorithms evaluated for the three model configurations are summarized in Table 1. Mean absolute error (MAE), and mean-normalized MAE (nMAE) are presented in Tables S8–S10 in the Supplement as additional error metrics.
Table 1Performance comparison of machine learning algorithms TROPOMI, OMI, and MERRA-2 models. Model performance is evaluated under random, temporal, and spatial cross-validation using the coefficient of determination (R2), Pearson correlation coefficient (r), bias, root mean squared error (RMSE), and normalized RMSE (nRMSE). Error metrics (RMSE and bias) are reported in µg m−3. Additional error metrics are listed in Tables S8–S10. Models selected for generating PM2.5 concentration maps are indicated with an asterisk (*).
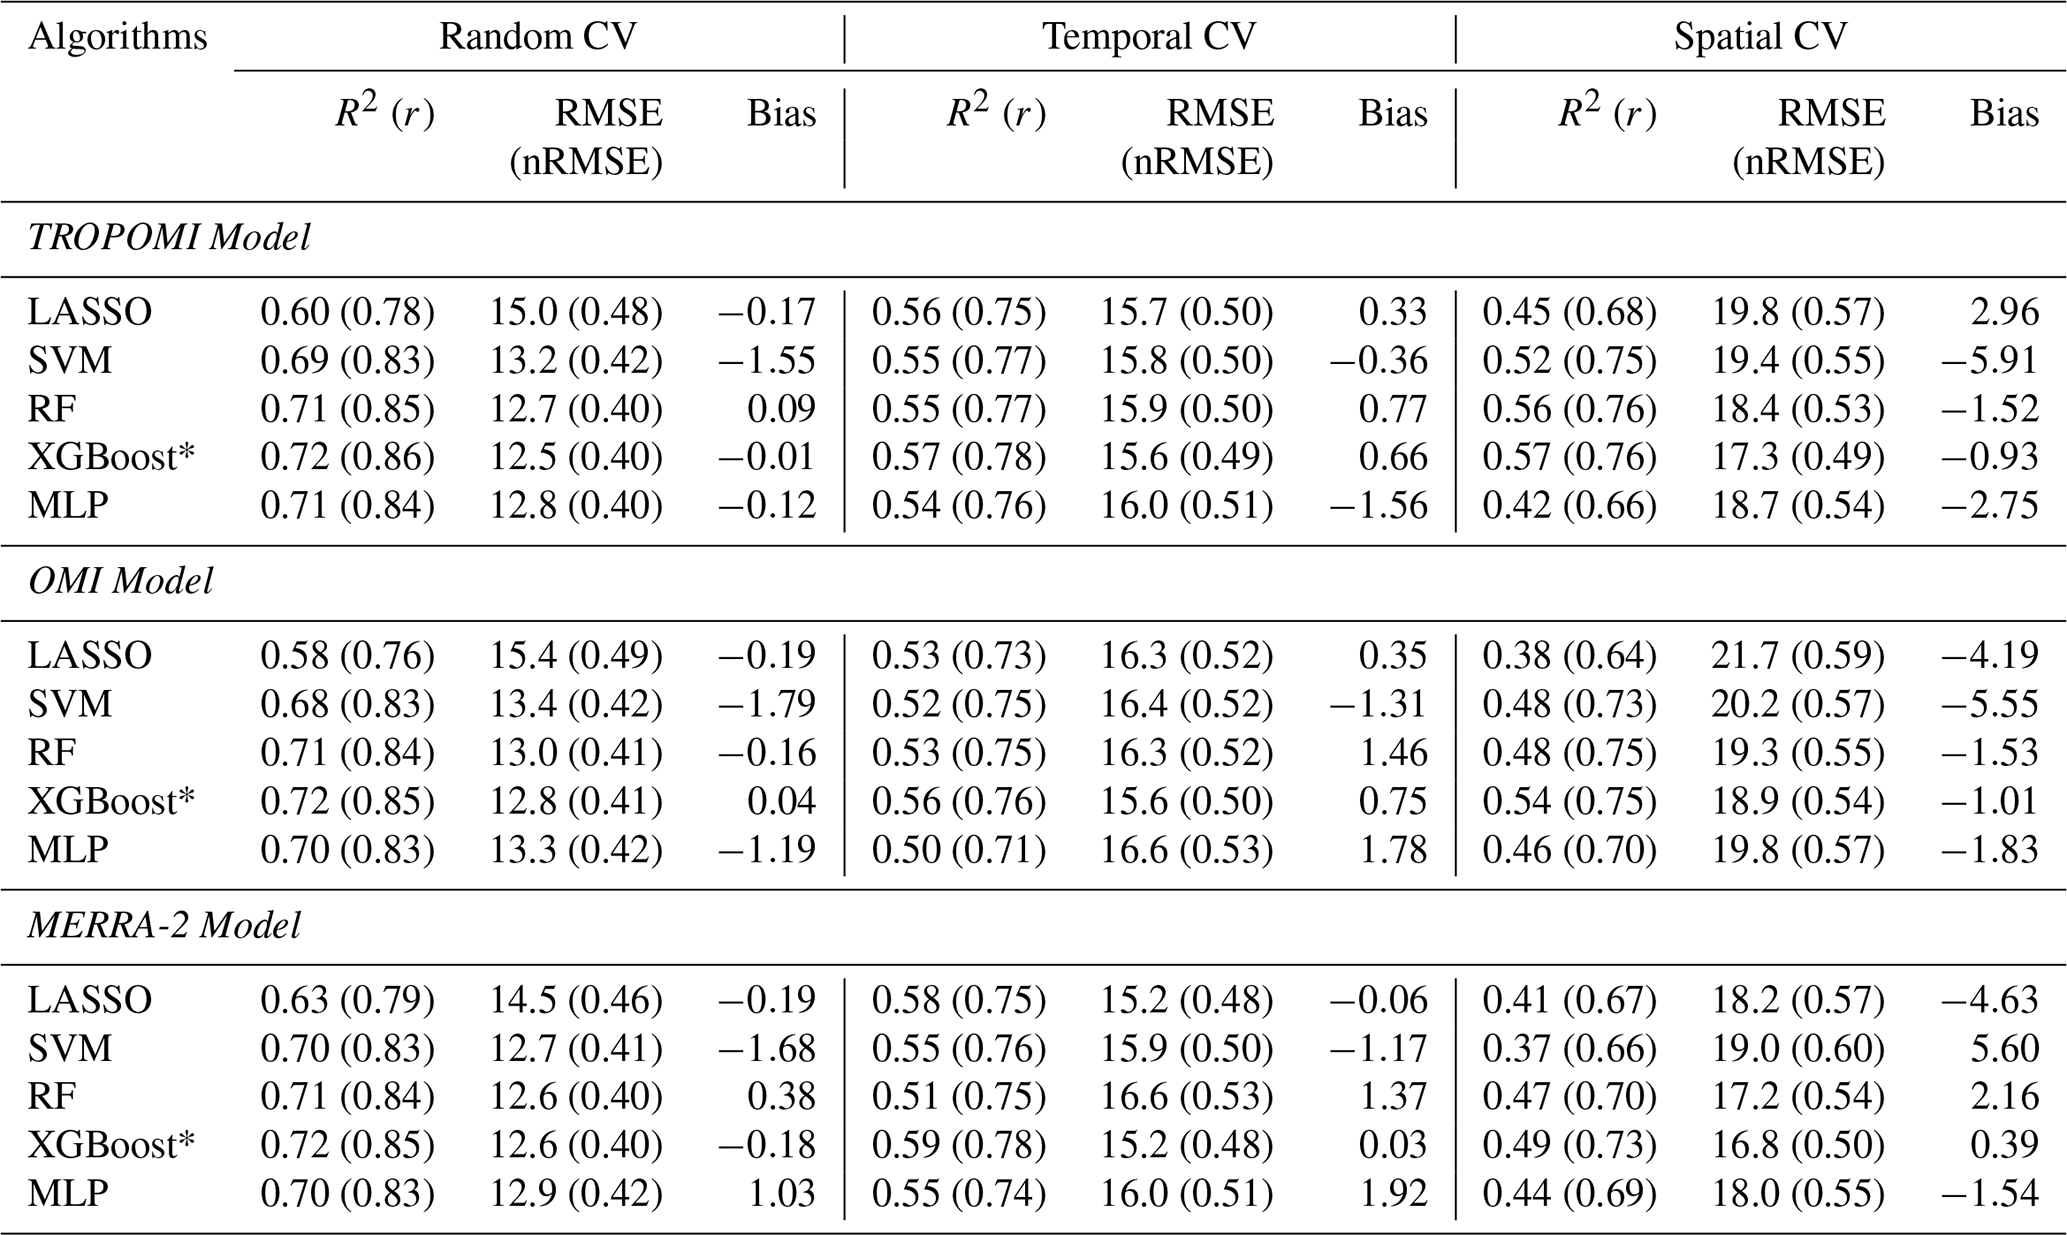
Under random cross-validation, XGBoost achieved the strongest and most consistent performance across all three model configurations, with R2 of 0.72 for TROPOMI, OMI, and MERRA-2 models and RMSE values of 12.5, 12.8, and 12.6 µg m−3, respectively. Linear models (LASSO) consistently showed the weakest performance, with R2 approximately 0.09–0.12 lower than XGBoost and substantially higher RMSE across all cross-validation schemes, reflecting its limited ability to capture the non-linear relationships of surface PM2.5 with meteorological and satellite-derived aerosol predictors in the heterogeneous emission environments in Ghana. Support vector machines (SVM) showed competitive random-CV performance but degraded substantially under spatial and temporal cross-validation. Among the non-linear approaches, tree-based ensemble methods RF and XGBoost performed comparably under random cross-validation, but XGBoost exhibited consistently lower bias (−0.01, 0.04, and −0.18 µg m−3 for TROPOMI, OMI and MERRA-2 models, respectively) and comparable or lower normalized errors across all CV schemes. The regression slopes in Fig. 2A–C (0.72–0.73) further indicate that XGBoost predictions closely track observed variability in PM2.5 but tend to underestimate higher concentrations.
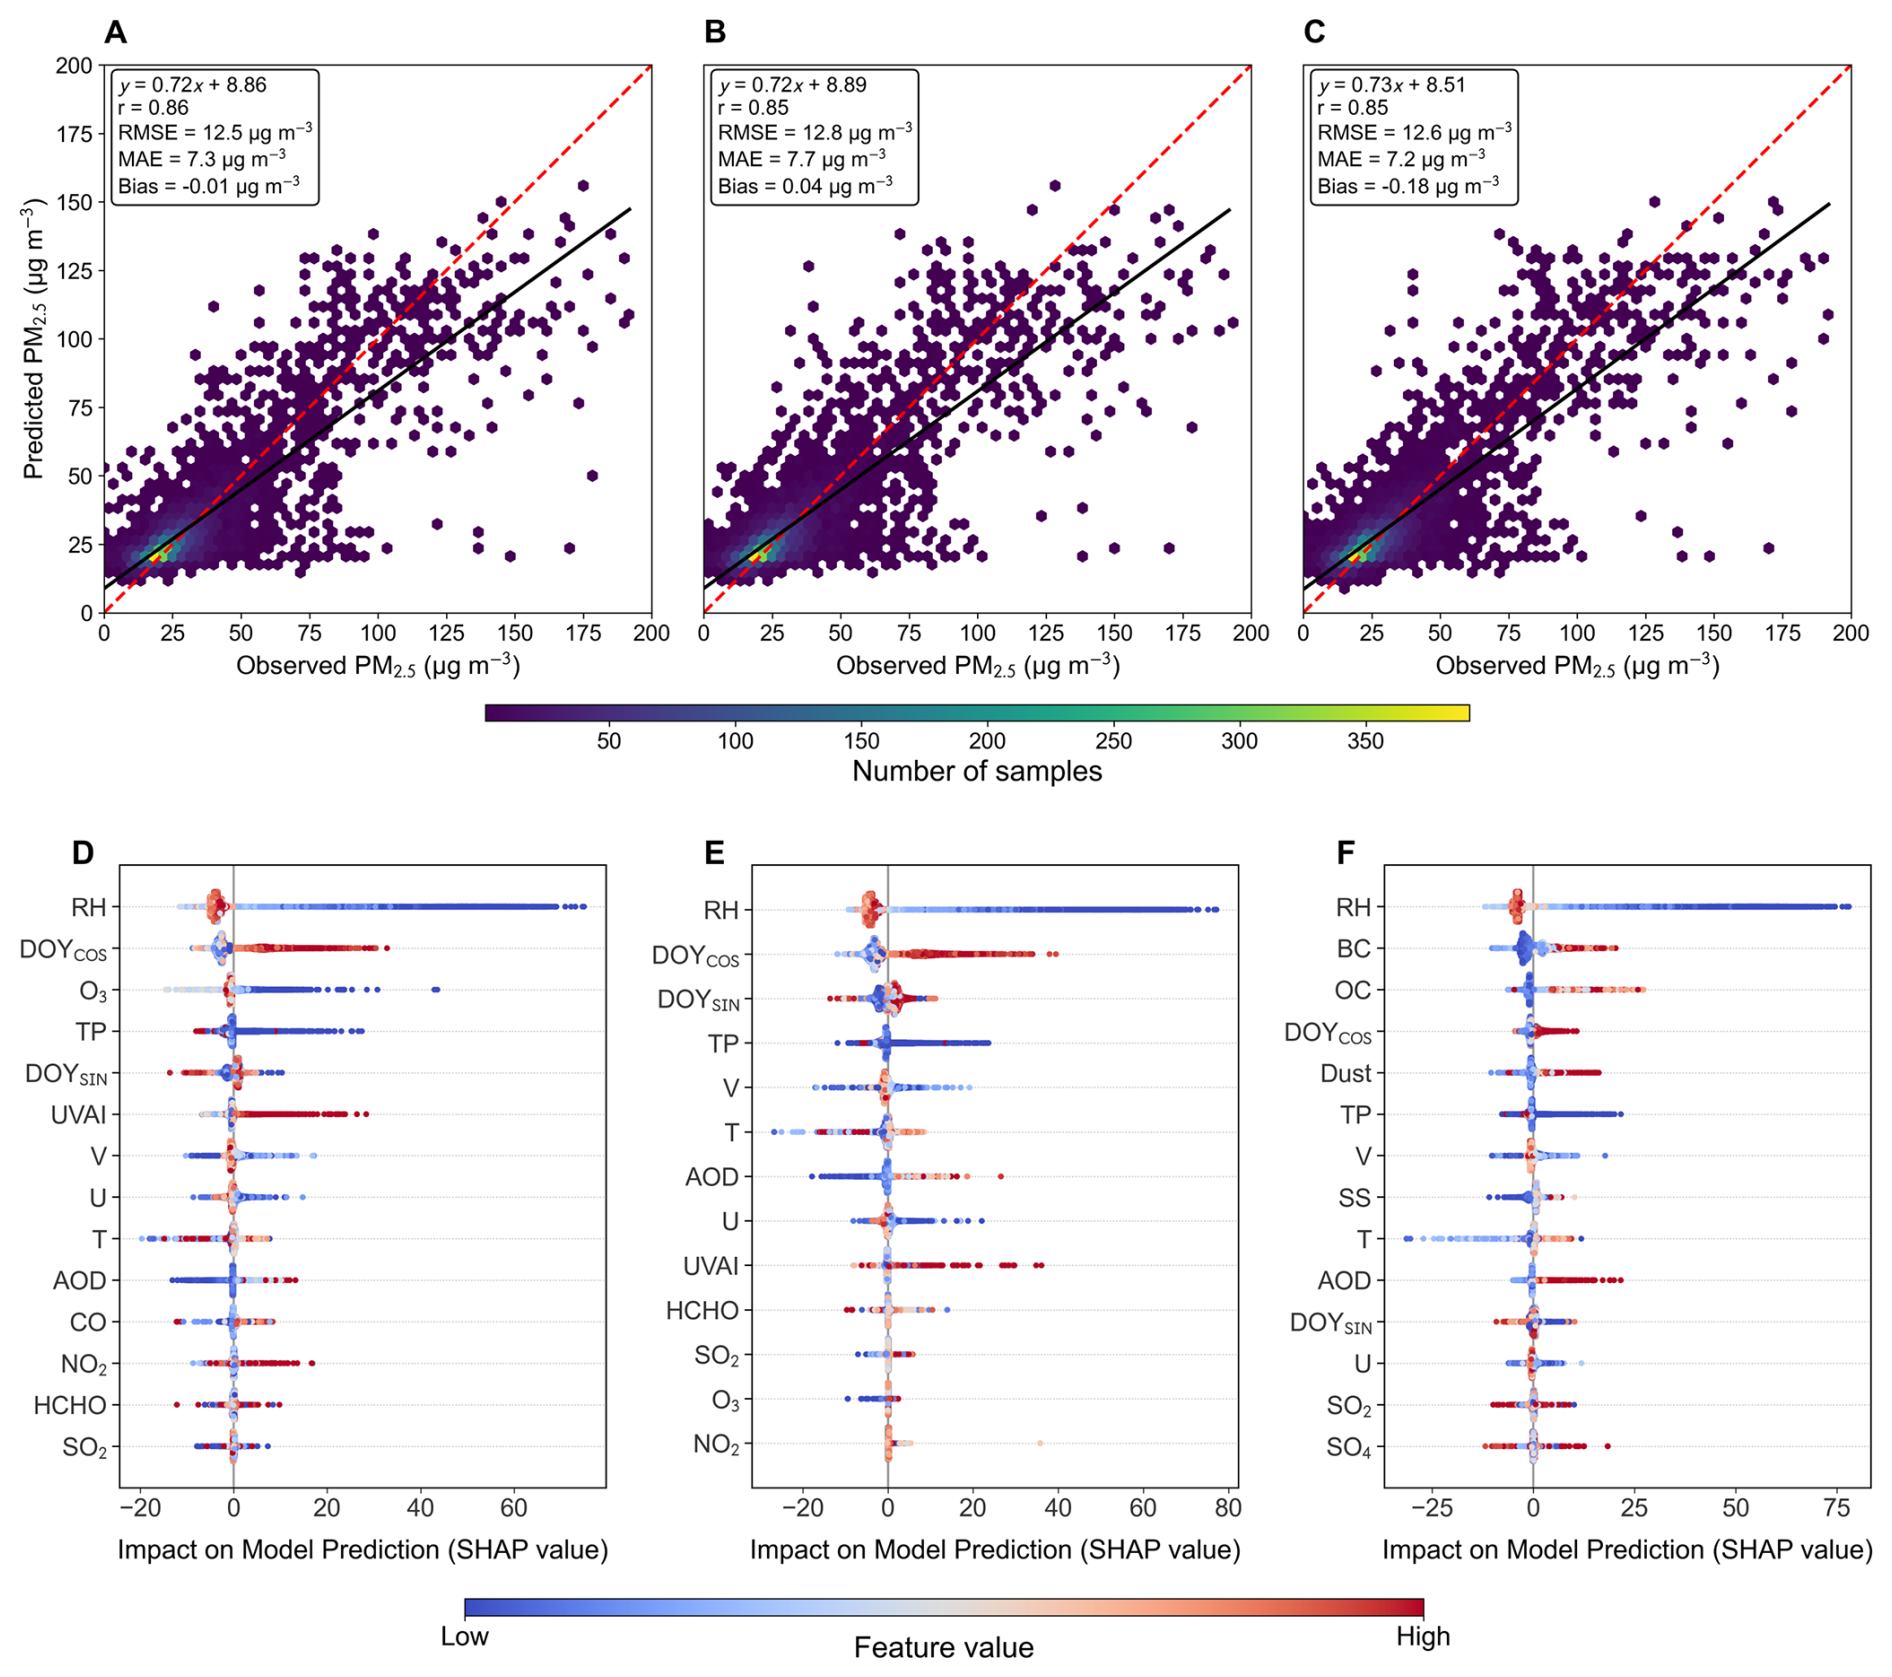
Figure 2Model performance and interpretability of XGBoost PM2.5 prediction models. (A–C) Scatterplots show the relationship between daily observed PM2.5 concentrations from surface monitors and corresponding model estimates for TROPOMI, OMI, and MERRA-2 models. Each point represents paired daily observations from surface monitors and corresponding model estimates. The red dashed line denotes the 1:1 reference line, while the solid black line represents the fitted linear regression. Color shading indicates the density of samples. (D–F) SHAP summary plots show the relative importance and direction of feature contributions to PM2.5 predictions for TROPOMI, OMI, and MERRA-2 models. Each point represents an individual sample, colored according to the feature value (blue = low, red = high). The horizontal spread of points indicates the magnitude and direction of each feature's influence on model output, with features ordered by overall importance.
Consistent with the performances of spatiotemporal models in other studies, the models retained substantial predictive skill under temporal and spatial cross-validation despite a slight decrease in performance relative to random cross-validation (Chi et al., 2022). Under temporal cross-validation, XGBoost achieved R2 values of 0.57, 0.56, and 0.59 for the TROPOMI, OMI, and MERRA-2 models, with RMSE of 15.6, 15.6, and 15.2 µg m−3, respectively. The leave-one-year-out validation results show that the model maintained consistent predictive performance across different years, indicating that the learned predictor–PM2.5 relationships are not strongly dependent on the meteorological and pollution characteristics of any single year. Under spatial cross-validation, which directly evaluates model performance at monitoring locations excluded from training, XGBoost R2 values were 0.57, 0.54, and 0.49 for TROPOMI, OMI, and MERRA models. The MLP model showed the largest degradation under spatial cross-validation, with R2 decreasing to 0.42, 0.46, and 0.44 for TROPOMI, OMI, and MERRA models, indicating poorer spatial generalization. In addition to its robust spatial and temporal generalization, XGBoost provides better interpretability through SHAP-based analysis, offering insights into the relative contributions of meteorological and aerosol predictors and further supporting its suitability for generating spatially continuous daily PM2.5 maps across unmonitored regions and time periods in Ghana. Therefore, XGBoost was selected as the final model for further analysis. Figure 2A–C further illustrate the agreement between observed and predicted PM2.5 concentrations for the best-performing model (XGBoost) under random CV, showing strong clustering along the 1:1 line and limited systematic bias across the concentration range.
Among the three model schemes, the MERRA model achieved the lowest temporal and spatial cross-validation RMSE values of 15.2 and 16.8 µg m−3, respectively. However, spatially cross-validated R2 for the MERRA model (0.49) is slightly lower than that of the other models (0.54–0.57), suggesting that the lower absolute RMSE is partly attributable to the reduced PM2.5 dynamic range in this gap-filling dataset due to inherently larger grid sizes of MERRA-2 dataset. The higher temporally cross-validated R2 of 0.59 suggests that MERRA-2 provides useful information on diel variability of aerosol-related predictors through hourly estimates compared to only once-a-day measurements from TROPOMI and OMI. Nonetheless, the MERRA model provides PM2.5 estimates during periods of satellite data unavailability, enabling complete spatiotemporal coverage.
To quantify the contribution of the MERRA-2 fallback to the final product, we assessed satellite data availability across the 1 km grid for each day from 2005–2025. During the OMI period (2005–6 May 2018), satellite predictors were available for an average of 58.3 % of grid cells, with the remaining 41.7 % requiring the MERRA-2 fallback. Following the introduction of TROPOMI on 7 May 2018, satellite availability increased substantially to 99.1 %, reducing the average MERRA-2 fallback to 0.9 %. Monthly satellite availability also exhibited seasonal variability, with greater reliance on the MERRA-2 fallback during periods of lower satellite coverage (Fig. S10 in the Supplement). Annual satellite availability and MERRA-2 fallback are summarized in Table S11 in the Supplement.
SHAP analysis plots in Fig. 2D–F provide insights into the influence of predictor variables on PM2.5 concentrations. The results indicate that meteorological and seasonal predictors dominate PM2.5 variability in Ghana. Relative humidity exhibited the strongest influence on model predictions, with low-humidity conditions strongly associated with elevated PM2.5 concentrations. This asymmetric and wide range of SHAP responses under dry conditions suggests that low-RH acts as a strong indicator of Harmattan season and is associated with high ambient PM2.5 concentrations, consistent with enhanced dust transport and low rainfall during the dry season. In contrast, high-humidity conditions during the wet seasons correspond predominantly to negative SHAP values, consistent with efficient wet scavenging and reduced aerosol loading under increased precipitation and enhanced aerosol removal.
The seasonal cyclic features represented by the sine and cosine transformations of DOY exhibited large absolute SHAP values distributed across both positive and negative directions, indicating that the model successfully captured the strong annual periodicity of PM2.5 concentrations in Ghana. Wind speeds (U and V) and precipitation variables from ERA5-Land also showed important contributions, consistent with the roles of winds in dust transport and precipitation in wet deposition of aerosols. These results are broadly consistent with findings from a recent satellite-based PM2.5 study in West Africa by Westervelt et al. (2025), which identified meteorological drivers and dust transport as major determinants of surface aerosol loading.
Satellite-derived aerosol indicators, particularly the ultraviolet aerosol index (UVAI), showed consistently positive SHAP contributions in both the TROPOMI and OMI models, indicating higher predicted PM2.5 concentrations under elevated absorbing aerosol conditions. These conditions are commonly associated with mineral dust transport during the Harmattan season and episodic biomass burning, highlighting the importance of absorbing aerosol loading in shaping surface PM2.5 variability. For the MERRA-2-based model, PM composition variables, particularly BC, OC, and dust, exhibited substantial importance alongside meteorological predictors. The strong contributions from dust-related variables are consistent with the influence of Harmattan-driven mineral dust transport, while BC and OC likely reflect contributions from combustion-related aerosol sources, including biomass burning and other anthropogenic emissions. SHAP values for AOD suggest that the column-integrated aerosol loading represented by AOD in the MERRA-2 reanalysis provides valuable predictive information, particularly during high-PM2.5 episodes, similar to the role of UVAI in OMI- and TROPOMI-based models. Despite differences in predictor types among the three model configurations, the overall consistency in dominant drivers provides confidence that the modeling framework captures physically meaningful controls on PM2.5 variability across seasons and regions.
3.3 Daily PM2.5 distribution and long-term spatiotemporal trends
The daily PM2.5 concentrations derived at 1 km×1 km resolution for 2005–2025 were used for assessing spatial and long-term patterns. Daily PM2.5 concentration distributions for Harmattan and non-Harmattan periods are illustrated in Fig. 3A. During the non-Harmattan season, the distribution is relatively narrow, with a mode around 20 µg m−3 and limited probability mass extending beyond 60 µg m−3, reflecting more consistent and moderate pollution conditions, which may be driven primarily by local and regional anthropogenic sources. In contrast, the Harmattan season distribution is characteristically broader, with a mode ∼69 µg m−3 and a pronounced long tail extending to around 150 µg m−3, strongly indicating episodic high-concentration events associated with large amounts of mineral dust transport from the Sahara and Sahel to the West African regions during this season. Notably, both distributions are almost entirely (>99 %) situated above the WHO 24 h air quality guideline of 15 µg m−3 (dashed red line), underscoring that PM2.5 exceedances in Ghana are not confined to the dust season but represent a year-round public health concern due to high exposure to ambient particulate matter. The wider spread and heavier tail of the Harmattan-season distribution imply that PM2.5 exposure among the Ghanaian population during this period is not only substantially more variable, but also consistently higher, with extreme pollution episodes frequently reaching concentrations 2–10 times higher than the WHO 24 h guideline.
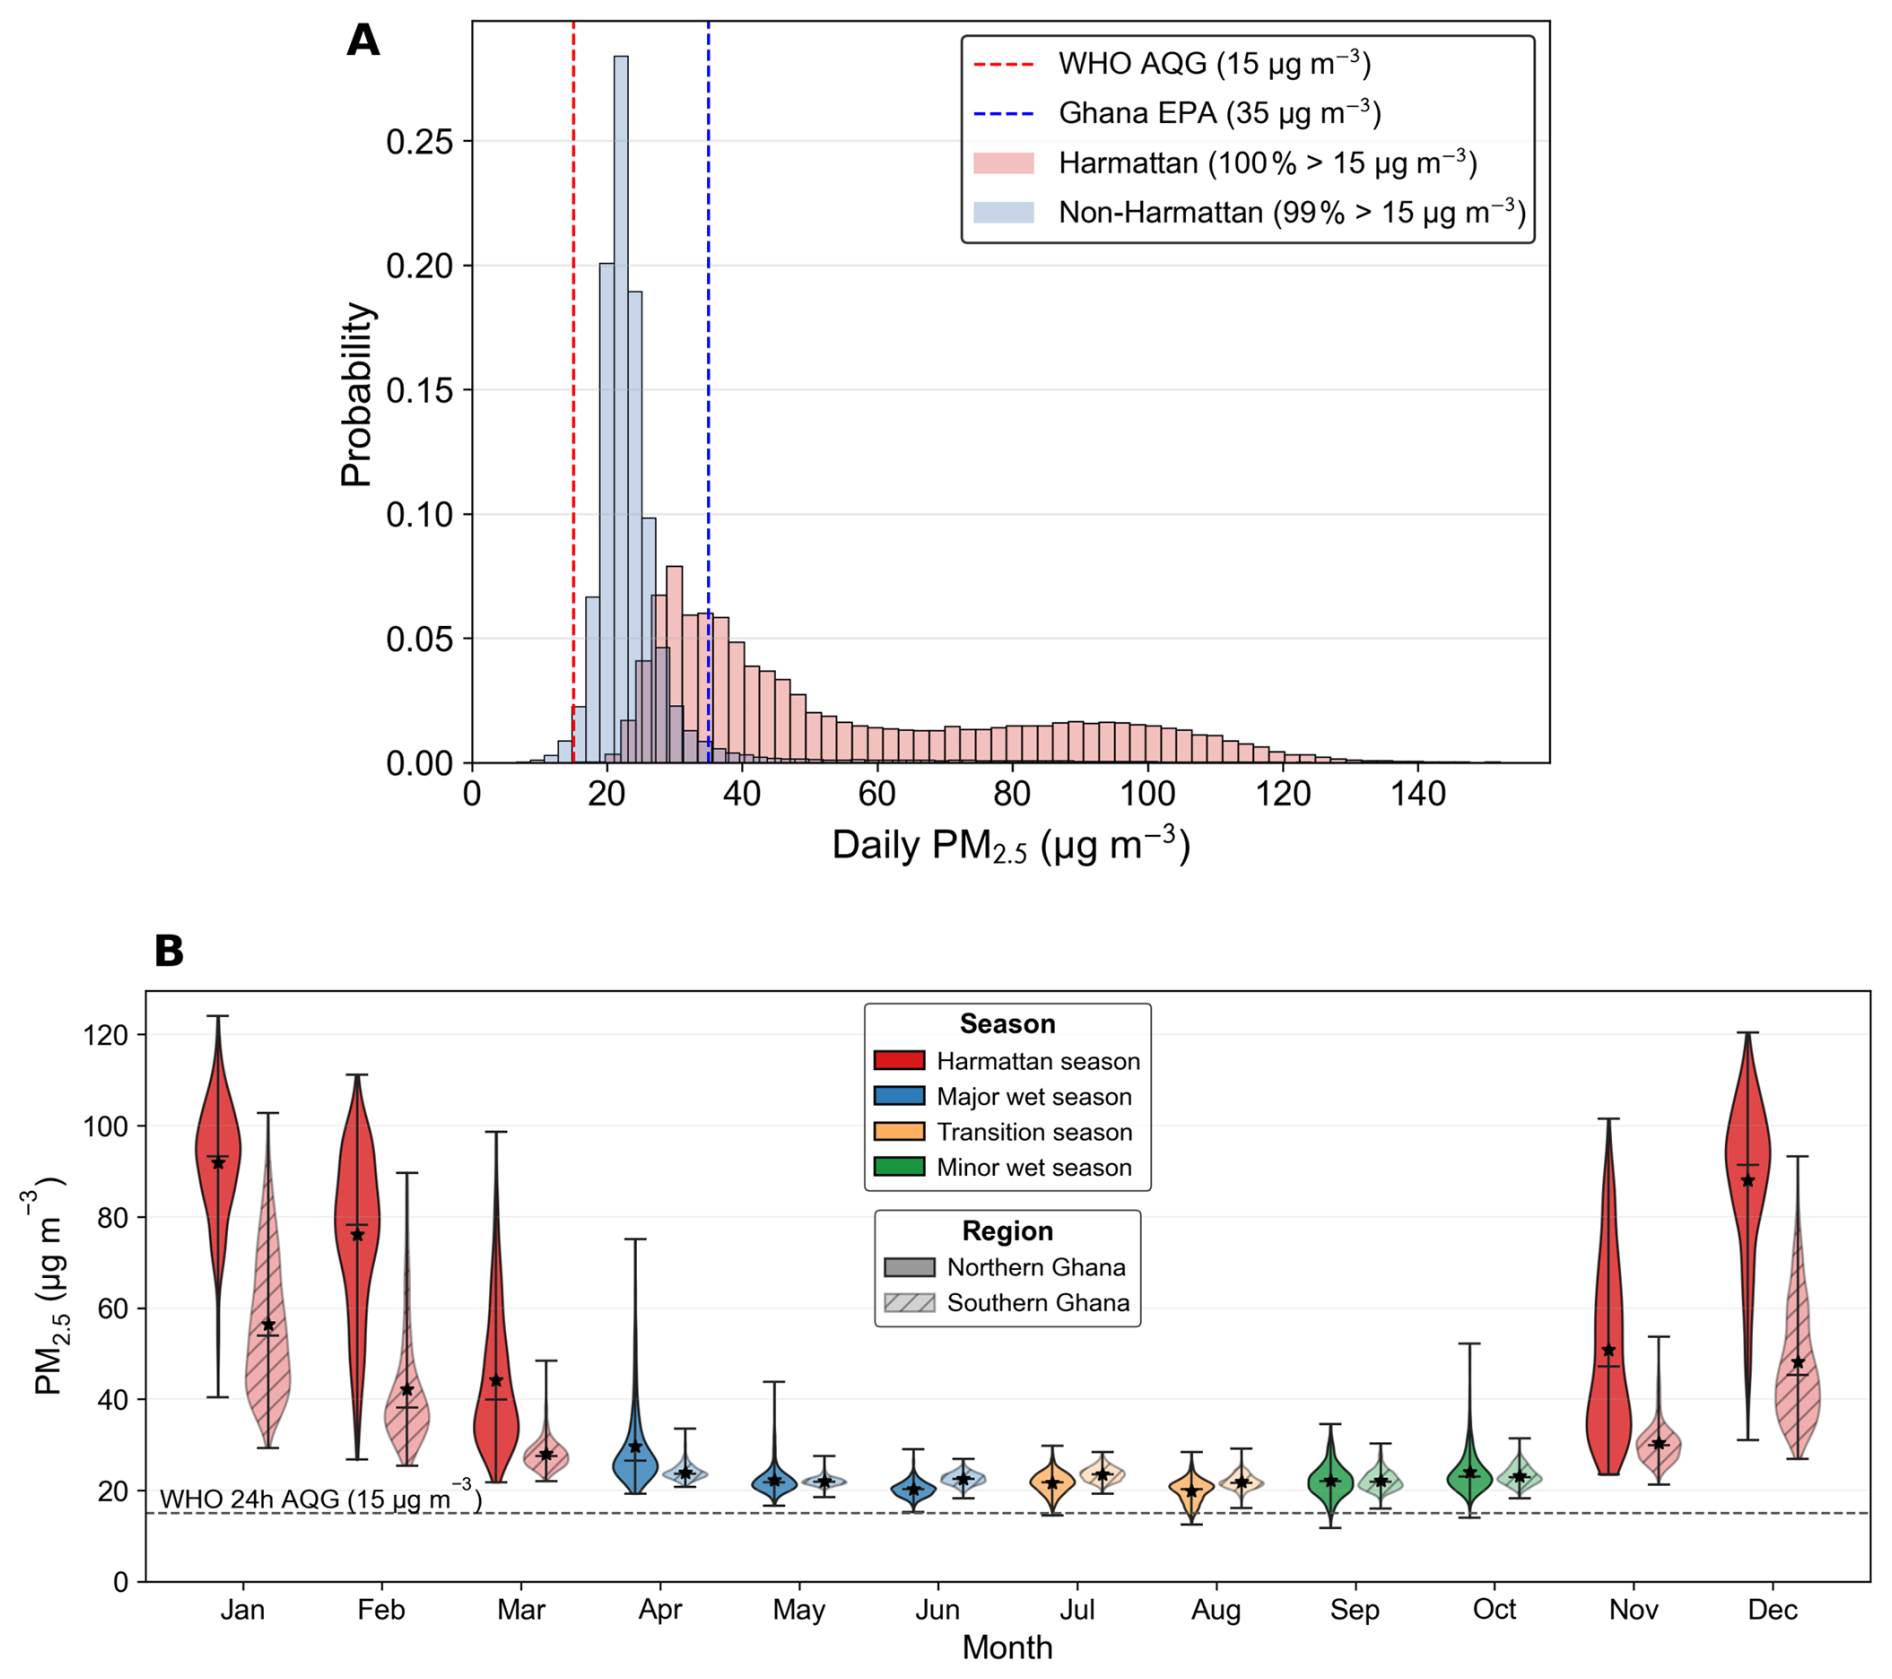
Figure 3Seasonal distribution and monthly variability of daily PM2.5 concentrations across Ghana (2005–2025). (A) Probability distributions of daily PM2.5 concentrations during Harmattan (red) and non-Harmattan (blue) periods. The red and blue dashed vertical lines indicate the 24 h air quality guidelines from WHO (15 µg m−3) and Ghana EPA (35 µg m−3), respectively. (B) Monthly climatology of daily PM2.5 concentrations for Harmattan, major wet, and minor wet seasons across Northern and Southern Ghana. Violin plots illustrate the distribution of daily values for each month, with solid and hatched violins representing Northern and Southern Ghana, respectively. The central horizontal line within each violin denotes the median, and the star marker indicates the monthly mean concentration. The dashed horizontal line represents the WHO 24 h air quality guideline (15 µg m−3).
These distributions for 20 locations, including regional capitals, in Ghana are shown in Fig. S11 in the Supplement. The northern region shows a broader PM2.5 distribution during the Harmattan period compared with a narrower distribution and much lower mean in southern Ghana. Major cities of Ghana, such as Accra, Cape Coast, Sekondi–Takoradi and Kumasi, are mostly located in the South, and show a much narrower PM2.5 distribution with less pronounced seasonal variability during this period. On the other hand, rural or suburban locations exhibit relatively broader PM2.5 distribution, potentially reflecting greater variability in emission sources, including episodic agricultural burning and savanna fires during the dry season (Ofosu et al., 2013).
Fire activity is an additional important contributor to seasonal PM2.5 variability in Ghana, particularly across northern and transitional ecological zones dominated by savanna land cover (Fig. S12 in the Supplement). The MODIS MCD12Q1 Version 6.1 Land Cover Type product (Friedl and Sulla-Menashe, 2022) for 2024 shows that grasslands (42 %), savannas (27 %), and woody savannas (10 %) together account for nearly 80 % of Ghana's land area, with these ecosystems concentrated primarily in northern Ghana and the forest–savanna transition belt (Fig. S13 in the Supplement). Fire detections from the MODIS MCD14ML active-fire product (Giglio et al., 2016) during 2005–2025, retaining observations with confidence ≥30 %, show that fire occurrence is spatially concentrated in these savanna-dominated regions, consistent with widespread seasonal biomass burning associated with agricultural land management, pasture renewal, and accidental wildfires. Annual mean fire frequency and fire radiative power (FRP), a proxy for combustion intensity, both show pronounced seasonal dependence, with substantially higher activity and FRP during the dry Harmattan months relative to the wetter non-Harmattan months. The elevated frequency and intensity of fires during the Harmattan season likely enhance regional aerosol loading through increased emissions of carbonaceous particulate matter, contributing to the broader and more right-skewed PM2.5 distribution observed during this period. Frequent fire occurrences, concentrated predominantly within the savanna regions of Ghana (Fig. S12), further suggest an important role of biomass burning in seasonal aerosol loading and PM2.5 variability in Ghana, complementing the dominant influence of long-range Saharan dust transport during Harmattan conditions (Ofosu et al., 2013).
This north-south difference in PM2.5 exposure levels is even more evident from monthly PM2.5 climatology averaged over the 21-year study period (2005–2025), disaggregated by northern and southern regions of Ghana, as shown in Fig. 3B. Ghana is classified into northern and southern subregions, defined as regions above and below 8° N latitude, respectively (Klutse et al., 2020). A pronounced seasonal cycle can be observed for monthly mean PM2.5 in Ghana, with peak concentrations occurring from November through March, coinciding with the Harmattan season. Typically, the North experienced 1.6–1.8 times higher PM2.5 exposure than those in the South. PM2.5 concentrations decline sharply with the onset of the major wet season in April–June, driven by enhanced wet removal of atmospheric particles and suppressed dust transport. A secondary minimum occurs during the minor wet season (September–October), separated from the major wet season by a brief mid-season dry period in July–August during which PM2.5 concentrations exhibit a modest secondary peak. This bimodal wet season structure is more pronounced in southern Ghana, consistent with the bimodal rainfall regime associated with the seasonal northward and southward migration of the ITCZ over the coastal and forested zones of West Africa (Nicholson, 2018). In contrast, northern Ghana exhibits a unimodal rainfall pattern peaking in August and September (Fig. S14 in the Supplement), during which monthly mean PM2.5 concentrations (19.9 µg m−3) are lower than those observed in the south (21.0 µg m−3).
Figure 4A shows the seasonal and annual evolution of PM2.5 in Ghana over the 21-year period. Annual mean PM2.5 has remained relatively stable over the study period with the Sen's slope estimate indicating an average annual increase of only 0.01 µg m−3 and seasonal slopes varying between 0.005–0.165 . The Seasonal Mann–Kendall test suggests that these seasonal and yearly trends observed in Ghana are not statistically significant (p≥0.05). However, the spatial map of Sen's slope estimates at 1 km×1 km grid resolution in Fig. 4B indicates that a large proportion of Ghana exhibits statistically significant trends. Because the pixel-wise trends are spatially dependent, we evaluated spatial autocorrelation using Global Moran's I. The PM2.5 fields exhibited strong positive spatial autocorrelation, with annual Global Moran's I values averaging approximately 0.995 (range: 0.992–0.997) across 2005–2025. Similar strong spatial autocorrelation was observed in the PM2.5 product from Shen et al. (2024) at both 0.01 and 0.1° resolutions with Global Moran's I values of 0.999 and 0.989, respectively (Table S12 in the Supplement), indicating that strong spatial dependence is also characteristic of established gridded PM2.5 products. To account for multiple comparisons across the spatial domain, the Benjamini–Hochberg FDR test was applied to the pixel-wise Mann–Kendall p-values. Following FDR correction, 66.93 % of valid grid cells exhibited statistically significant trends (q<0.05), compared with 70.14 % based on the uncorrected p<0.05 criterion (Table S13 in the Supplement). The Sen's slope estimates and p values calculated from the Seasonal Mann–Kendall analysis for the 20 study locations are summarized in Table S14 in the Supplement.
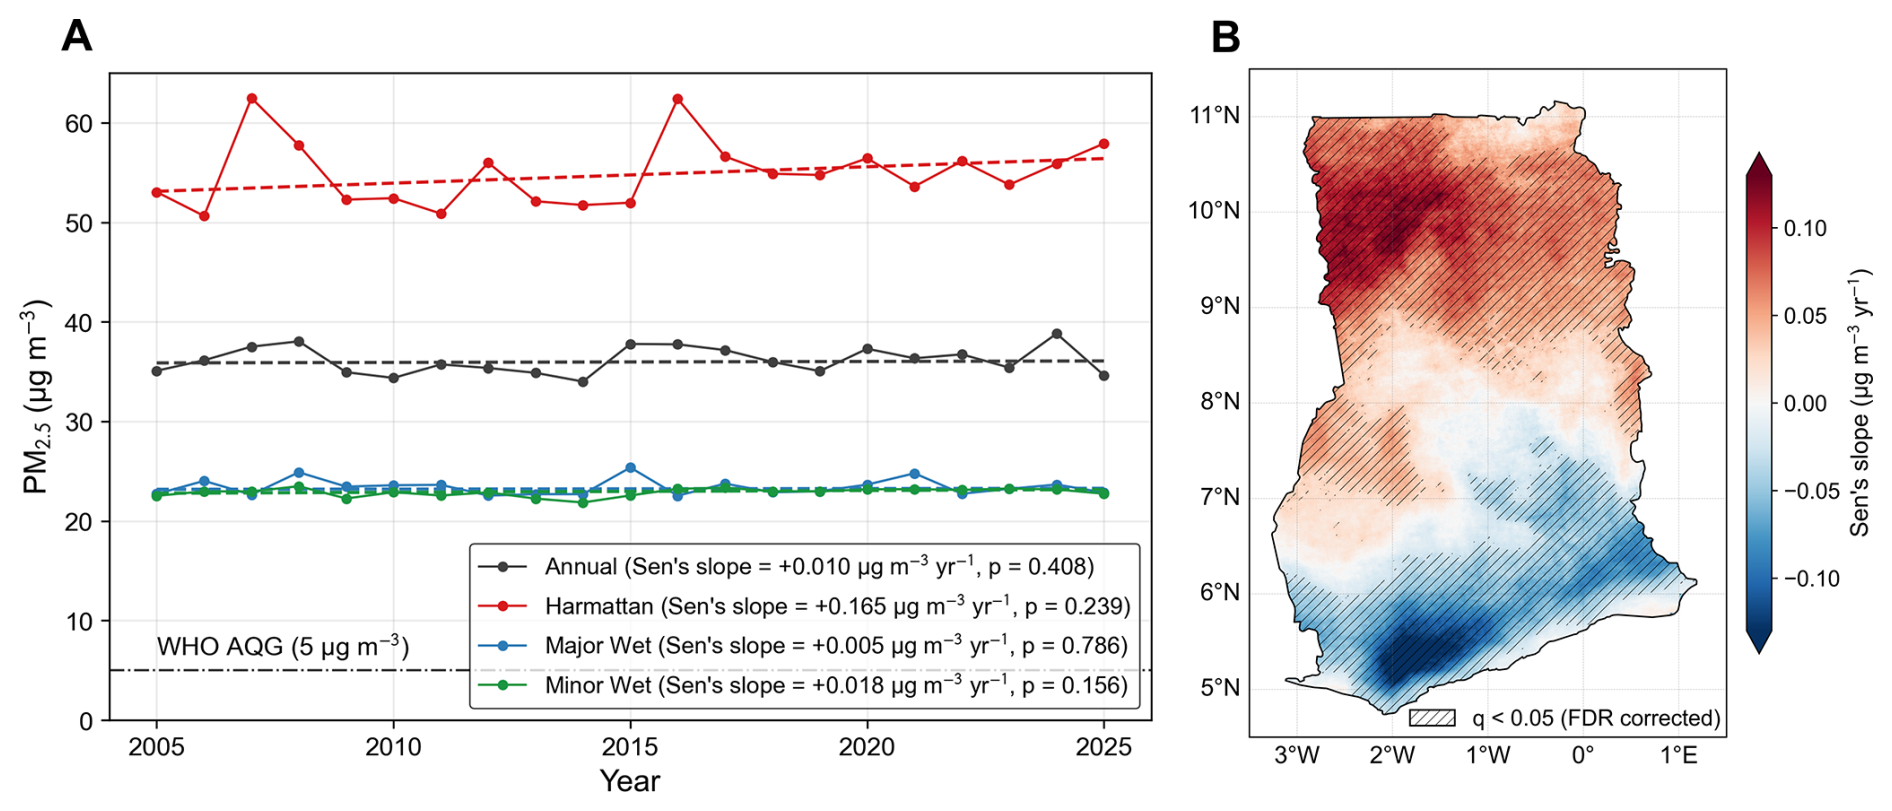
Figure 4Long-term spatiotemporal trends in ambient PM2.5 concentrations across Ghana from 2005 to 2025. (A) Ghana-wide annual and seasonal mean PM2.5 concentrations, including Harmattan, Major Wet, and Minor Wet seasons. Dashed lines represent trends estimated using the Sen's slope estimator, with corresponding slope magnitudes and Seasonal Mann–Kendall test p-values reported in the legend. The horizontal dash–dotted line indicates the WHO annual air quality guideline (AQG) of 5 µg m−3 (World Health Organization, 2021). (B) Spatial distribution of pixel-wise PM2.5 trends estimated using the Sen's slope estimator. Stippling denotes statistically significant trends after applying the Benjamini–Hochberg FDR correction (q<0.05). Positive values indicate increasing PM2.5 concentrations over time, while negative values indicate decreasing trends.
City scale trend plots in Fig. 5 show increasing PM2.5 trends (0.05–0.11 ) over the 21-year study period in some suburban and rural regions such as Nalerigu, Wa, and Damongo in northern Ghana. Other regions exhibiting increasing PM2.5 trends are Bono and Bono East, where cities such as Sunyani and Techiman may reflect increasing emissions associated with anthropogenic activities in these rapidly developing urban centers, in addition to contributions from Harmattan-related PM2.5 episodes. In contrast, several southern cities exhibit statistically significant declining trends, with the strongest decreases observed in Somanya (−0.086 ), Ho (−0.072 ), and Koforidua (−0.069 ), followed by Cape Coast (−0.036 ), Sekondi-Takoradi (−0.030 ), and Tema (−0.023 ), which may be associated with improvements in vehicular fuel quality (Ayetor et al., 2025) and gradual adoption of cleaner household energy sources, potentially reflecting more effective policy implementation in the urbanized southern coastal regions of Ghana. Although these trends are statistically significant, their cumulative magnitudes over the 21-year period (approximately 0.5–1.7 µg m−3) are modest relative to the model's daily spatial prediction uncertainty, which ranges from approximately 7–21 µg m−3 RMSE across southern monitoring sites (Fig. S15 in the Supplement). Since the trend analysis is based on monthly rather than daily PM2.5 concentrations, temporal averaging reduces the influence of unsystematic day-to-day prediction errors on the estimated long-term trends. To further assess temporal robustness, we evaluated model performance using leave-one-year-out cross-validation for 2018–2024, testing model generalization across interannual variability in meteorology, emissions, and episodic pollution events. A map of leave-one-location-out cross-validation RMSE at the monitoring locations is provided in Fig. S15 to contextualize model uncertainty in estimating daily PM2.5 across Ghana. Changes in the characteristics of valid satellite retrievals or in their relationship with surface PM2.5 over the longer record could introduce systematic differences in the retrospective estimates that cannot be directly evaluated in the absence of pre-2018 surface observations. Such differences could also influence the magnitude of estimated long-term trends and should therefore be considered when interpreting the retrospective record.
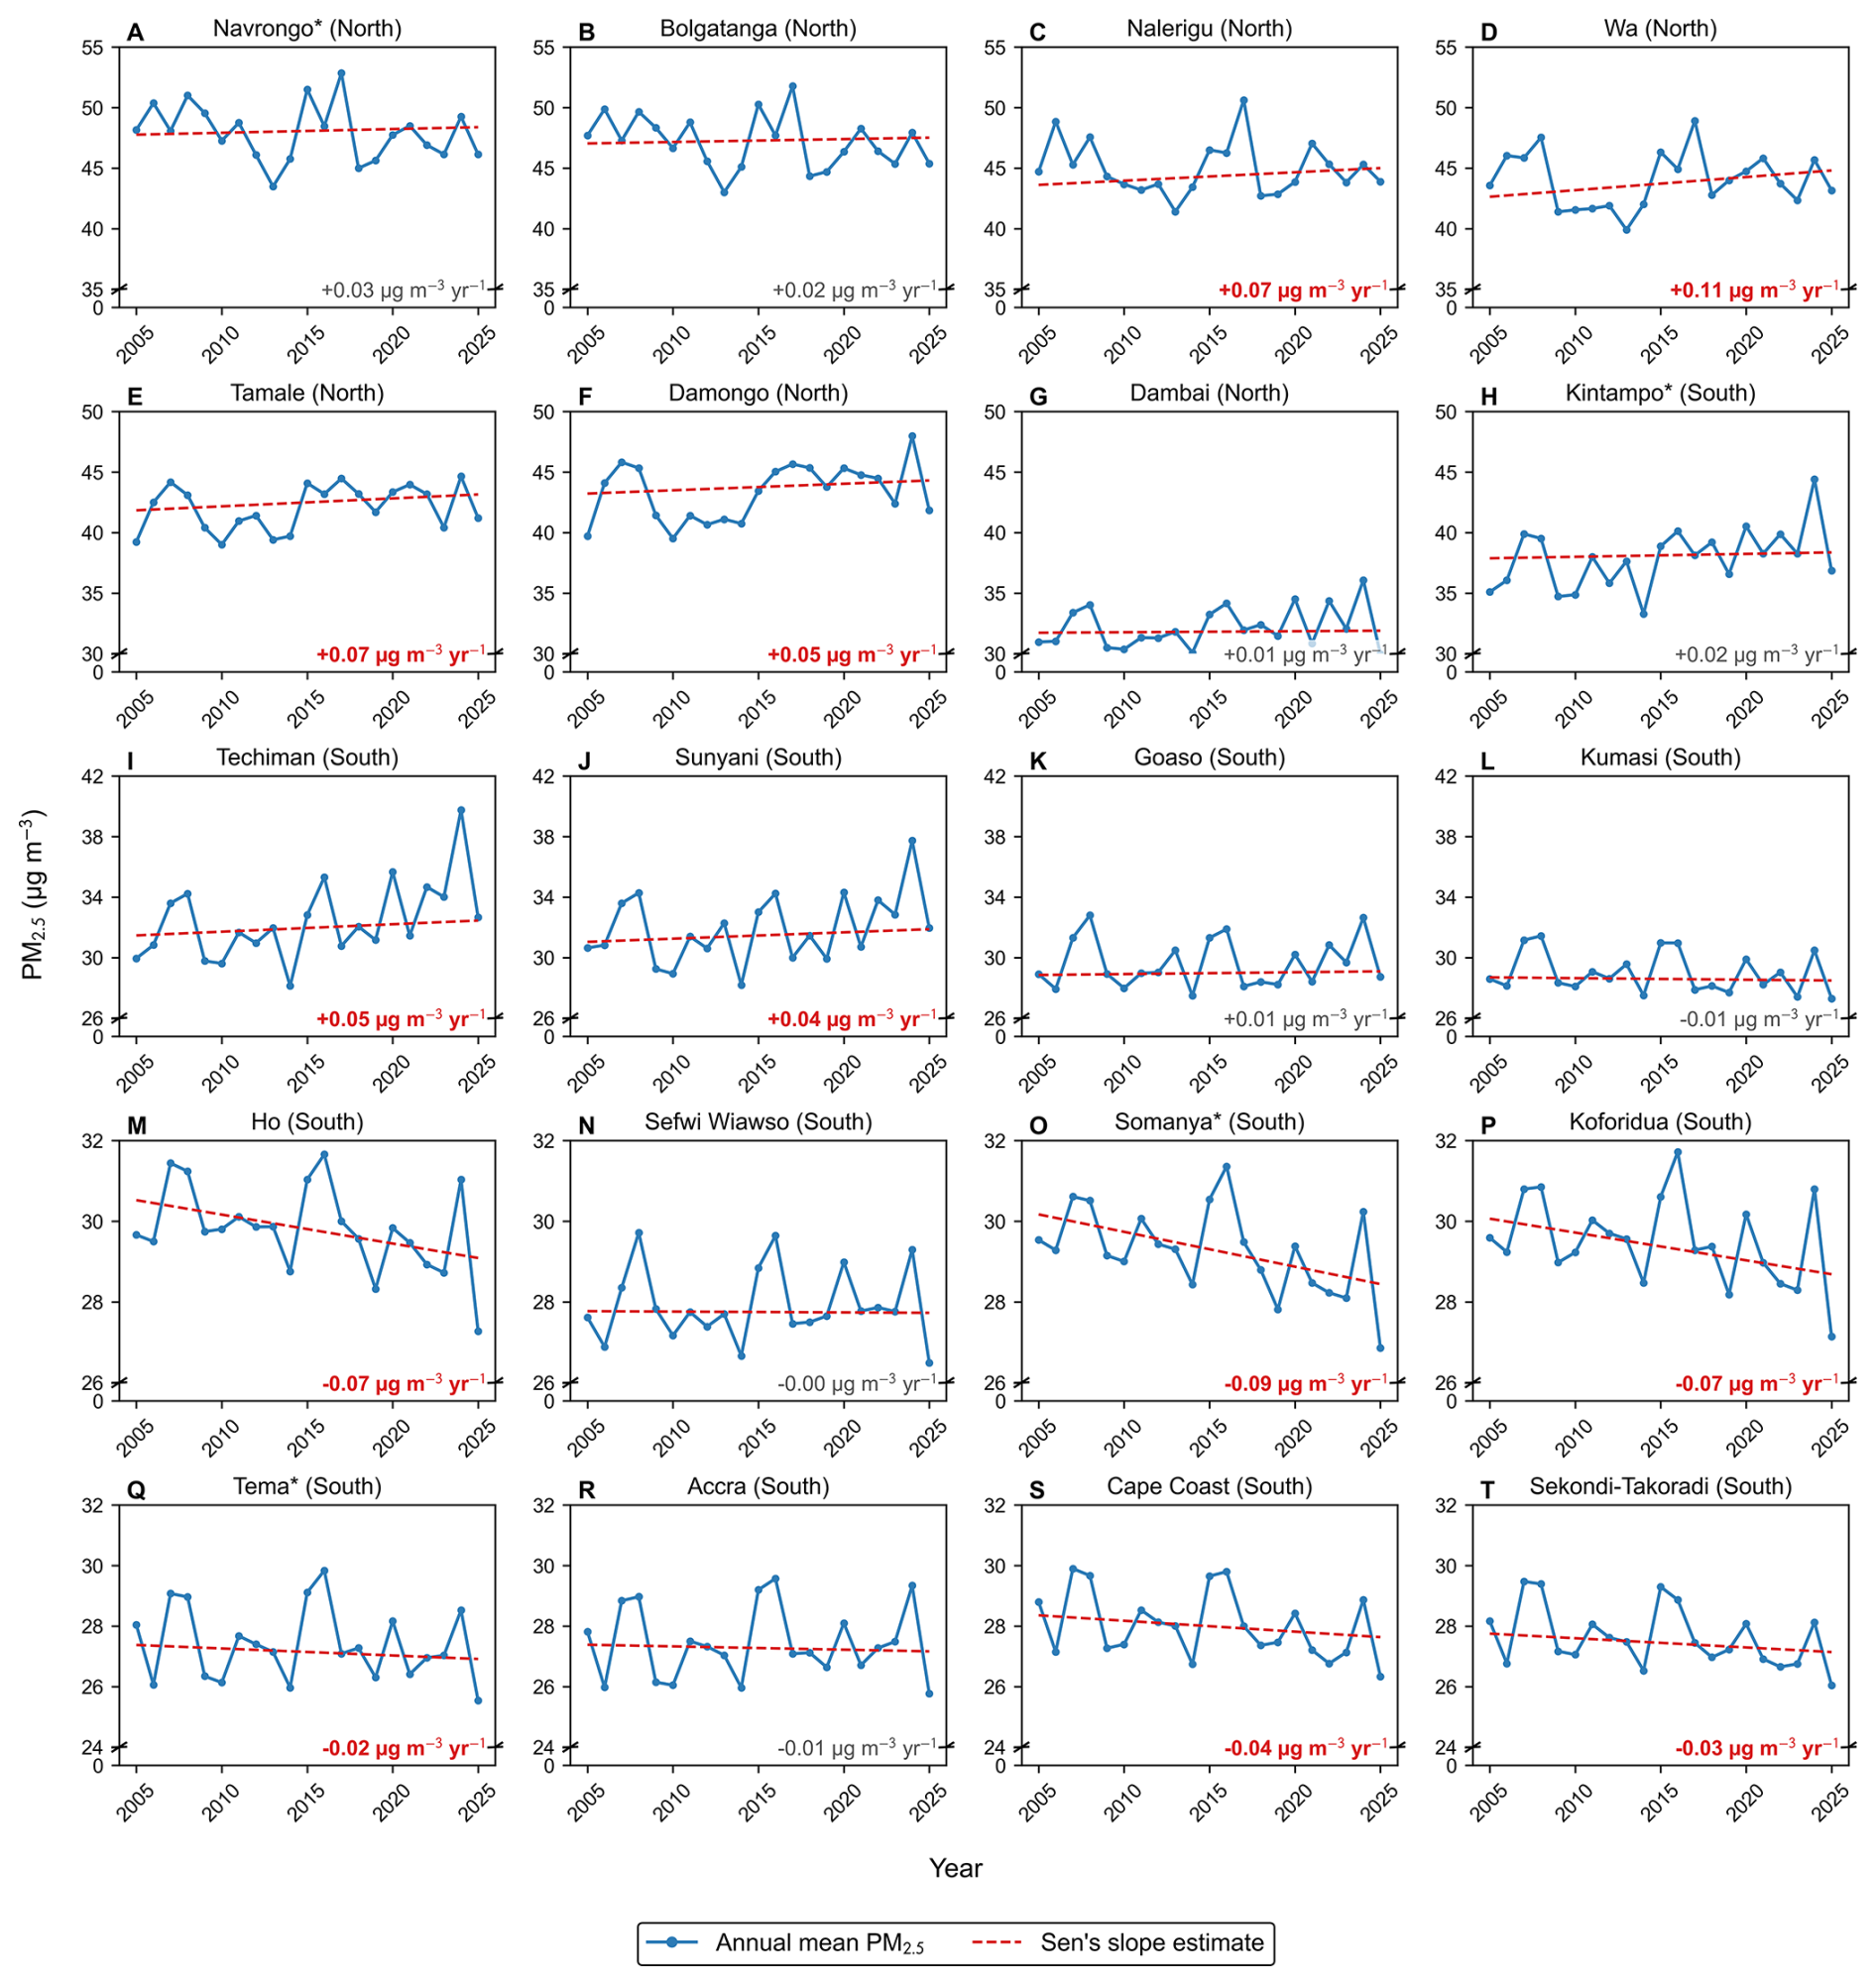
Figure 5Temporal trends in annual mean PM2.5 concentrations across 20 selected Ghanaian locations from 2005–2025. (A–T) Each panel shows the yearly average PM2.5 concentration (blue line with markers) and Sen's slope trend (red dashed line) for regional capitals and non-regional capitals (*). The red dashed line represents the overall seasonal Sen's slope estimate derived from the monthly city-level PM2.5 time series. Slope values with statistically significant trends (p≤0.05), assessed using the Seasonal Mann–Kendall test, are indicated in bold red.
Overall, long-term changes in PM2.5 across Ghana typically ranged between −0.16 and 0.14 (Fig. 4B). These trends suggest a persistent north–south gradient in PM2.5 exposure over the 21-year period, with geographically divergent long-term trends superimposed on substantial interannual and multi-year variability. Positive trends in northern Ghana contrast with stable or declining trends in the south, suggesting regional differences in the factors influencing long-term PM2.5 variability. This north–south pattern should be interpreted in the context of the spatial distribution of monitoring sites, particularly the lower monitoring density in northern Ghana. In northern Ghana, increases are consistent with the continued influence of Harmattan dust, regionally transported aerosols, and savanna fires, whereas several southern urban centers show stable or declining concentrations indicative of gradual changes in local emission patterns. At the national scale, the strong influence of interannual variability in Harmattan dust loading limits the detectability of statistically significant Ghana-wide trends, making it challenging to isolate long-term emission-driven changes from meteorological variability.
Trends during the non-Harmattan season are broadly consistent with the Seasonal Mann–Kendall results (Table S14) and provide additional insight into long-term PM2.5 variability after accounting for the dominant seasonal dust cycle. Several southern cities, including Somanya, Ho, Koforidua, Tema, Cape Coast, and Sekondi-Takoradi, exhibit statistically significant declines in non-Harmattan PM2.5 concentrations, indicating gradual declines in PM2.5 concentrations outside the dust season. In contrast, northern cities such as Wa and Tamale show persistent positive non-Harmattan trends, indicating that factors beyond long-range dust transport, including local emissions and biomass burning, contribute to sustained PM2.5 exposure levels throughout the year. The stronger declines observed in several southern urban centers may reflect, in part, the greater degree and spatial extent of urbanization in southern Ghana, where changes in urban-related emissions and household energy use may have a more pronounced influence on ambient PM2.5. Additionally, although national initiatives have promoted the adoption of cleaner household fuels such as LPG, access to and adoption of LPG have historically been more limited in northern and rural areas, partly due to differences in fuel availability and distribution infrastructure (Dalaba et al., 2018). In northern Ghana, the influence of biomass burning and other regional sources may partially offset or obscure reductions in urban-related emissions. The spatial heterogeneity in non-Harmattan trends reinforces the north-south divergence observed in annual trends and highlights the combined influence of regional atmospheric processes and evolving local emission sources on long-term PM2.5 variability across Ghana.
3.4 Exceedances for air quality guidelines
The spatial distribution of exceedance frequency relative to the Ghana EPA 24 h guideline of 35 µg m−3 (Ghana Standards Authority, 2019) is shown in Fig. 6. During 2005–2025, exceedances occur on approximately 15 %–20 % of days across southern Ghana and 35 %–42 % of days in northern regions (Fig. 6A). Restricting the analysis to non-Harmattan periods (Fig. 6B) substantially lowers exceedance frequency, with little to no exceedance in the south and fewer than 10 % of days exceeding the guideline in northern Ghana. In contrast, exceedance frequencies relative to the WHO 24 h guideline (15 µg m−3), shown in Fig. S16 in the Supplement, remain above 90 % across Ghana, including the southern coastal zone, reflecting the widespread and year-round burden of ambient PM2.5 across Ghana in both Harmattan and non-Harmattan periods. Persistently high exceedance frequencies in major urban centers such as Accra, Kumasi, and Tema indicate that anthropogenic emissions contribute to sustained PM2.5 exposure beyond the Harmattan season, highlighting the burden of ambient air pollution throughout the year across Ghana.
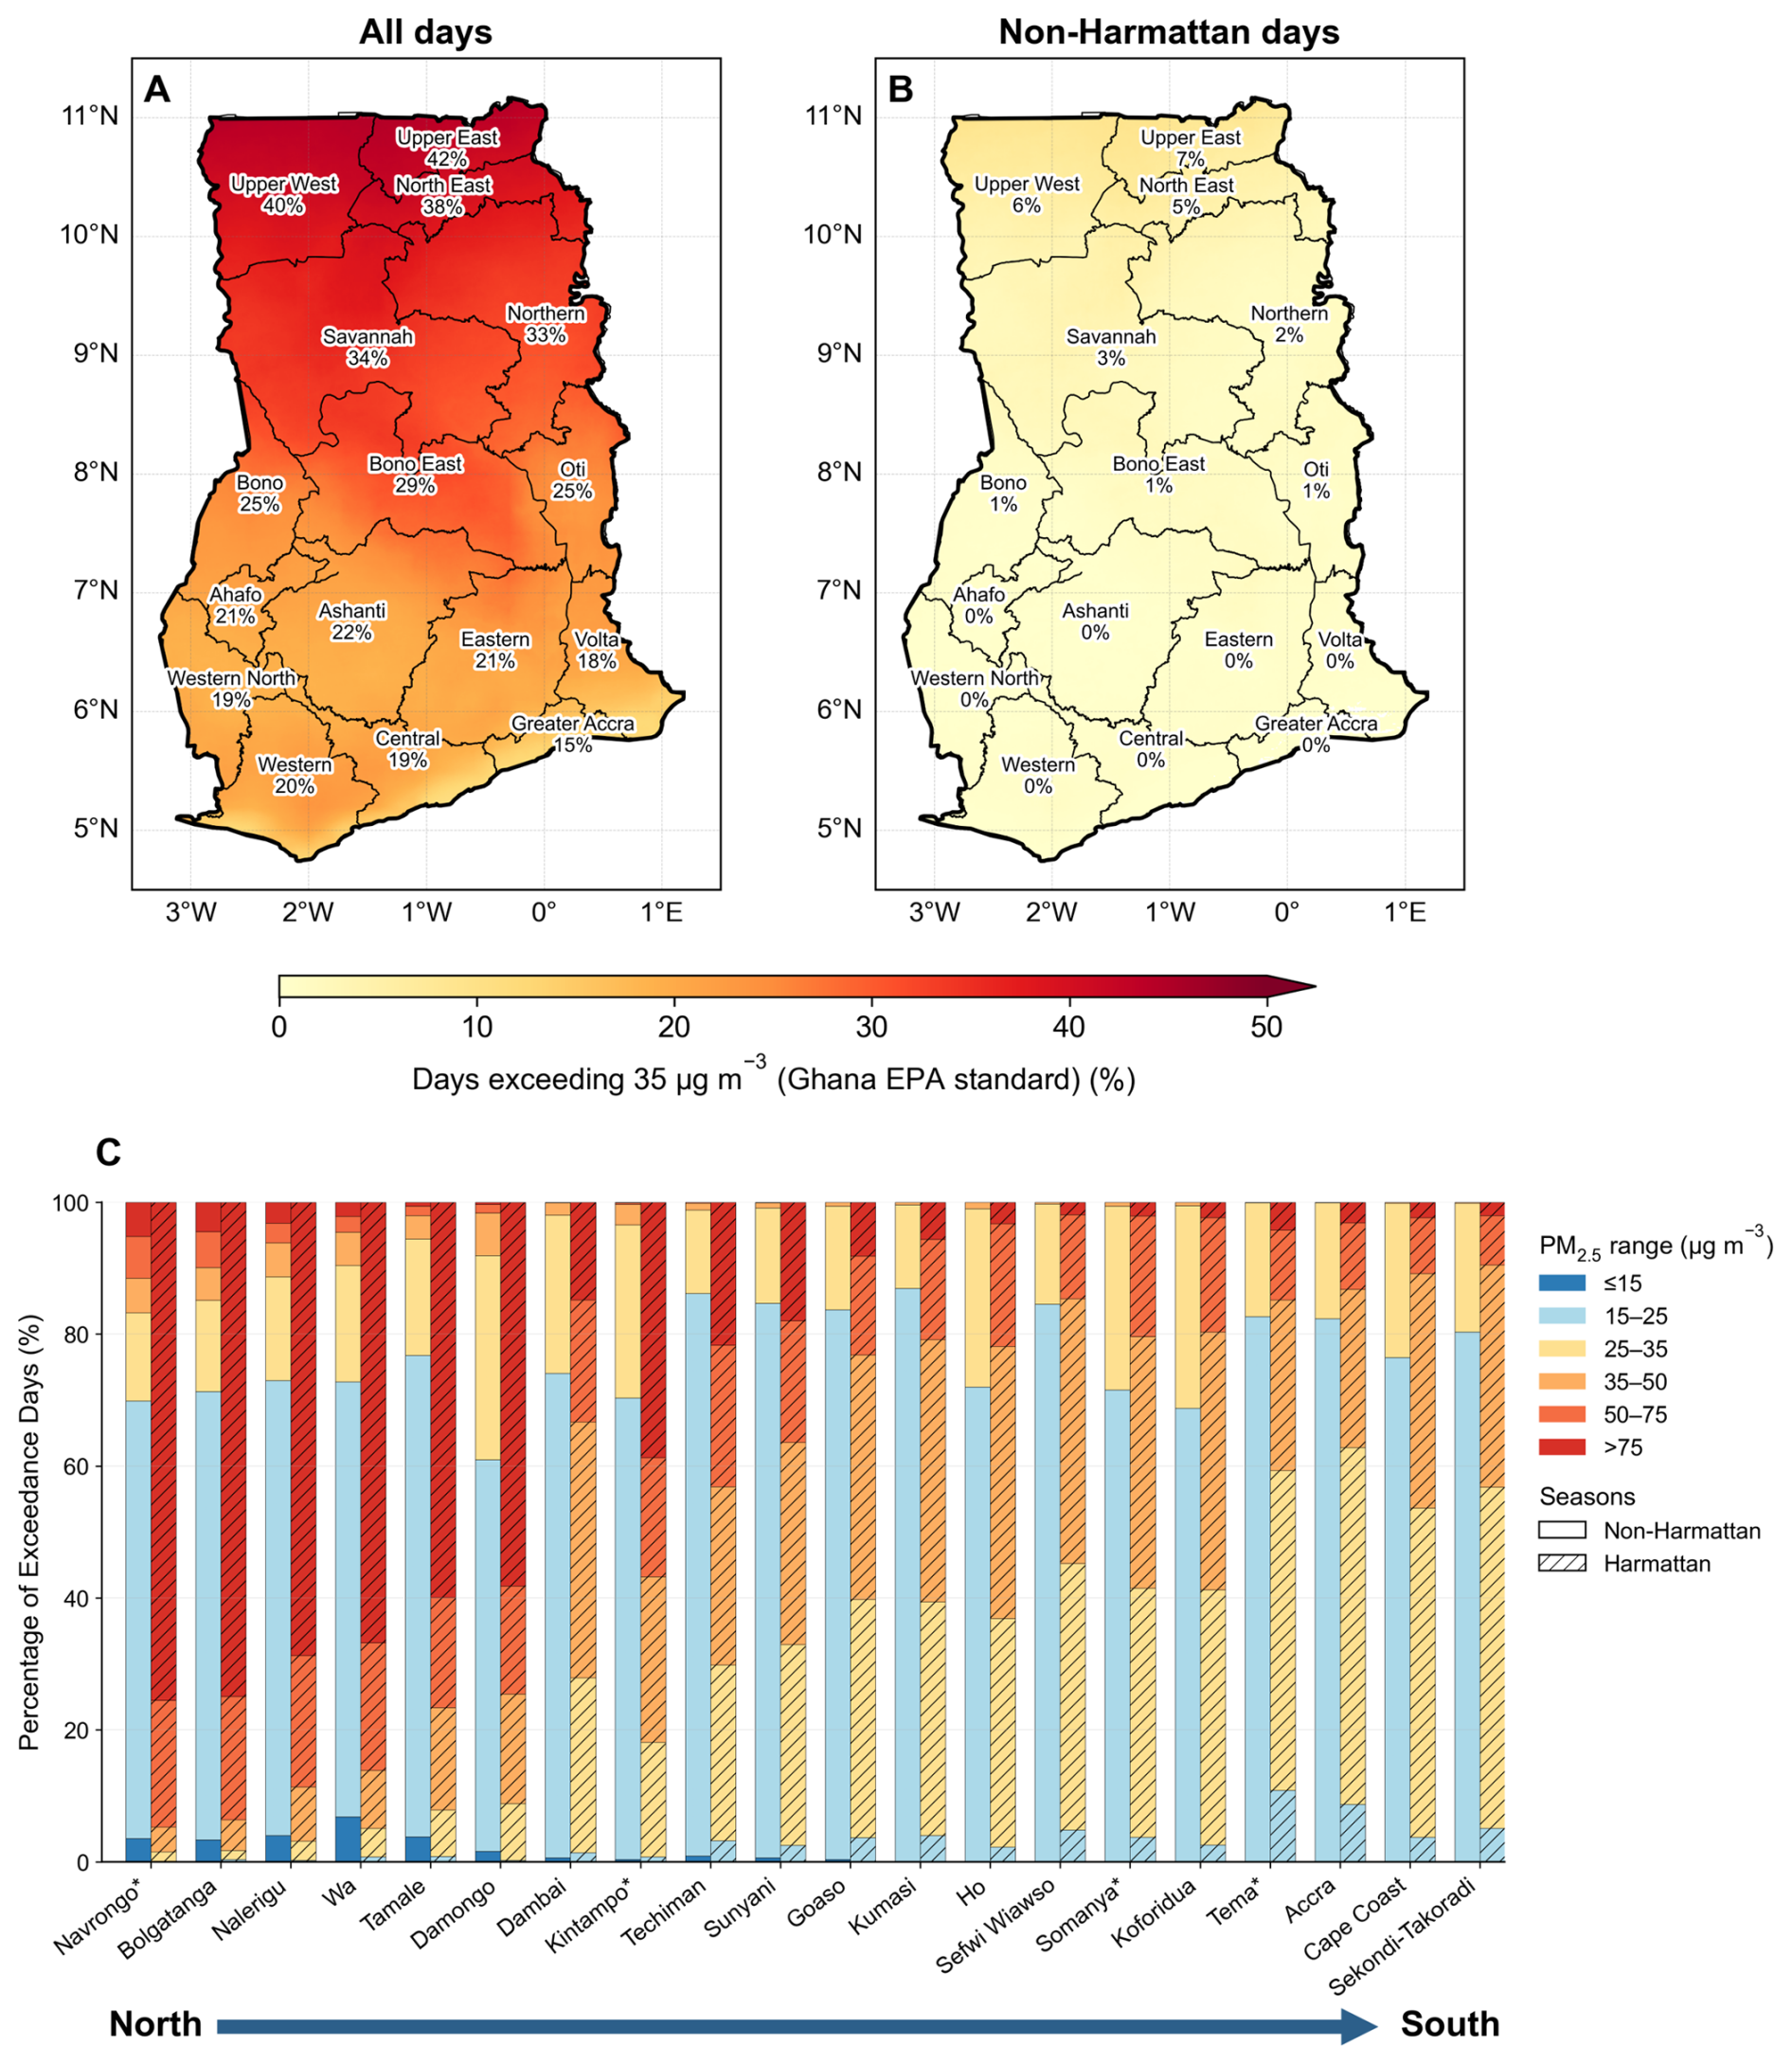
Figure 6Ghana-wide exceedance frequency of daily PM2.5 air quality guidelines. Spatial distribution of the percentage of days exceeding the Ghana EPA PM2.5 guideline (35 µg m−3) across Ghana during 2005–2025. Panels show exceedance frequency calculated using (A) all available days and (B) non-Harmattan days. Values represent the proportion of days (%) at each grid cell where daily PM2.5 concentrations exceeded 35 µg m−3. Plot C shows the percentage of days falling within each PM2.5 concentration range (≤15, 15–25, 25–35, 35–50, 50–75, and >75 µg m−3) across the WHO and Ghana EPA air quality guideline concentration ranges during non-Harmattan and Harmattan seasons for locations across Ghana (2005–2025). Cities are ordered geographically from north (left) to south (right) with non-regional capitals indicated by an asterisk (*).
The city-level frequency distribution of daily PM2.5 concentration ranges, shown in the bar plot in Fig. 6C, further quantifies the north-south contrast. The concentration ranges are defined using 24 h thresholds of the WHO Air Quality Guideline (15 µg m−3), WHO Interim Target 4 (25 µg m−3), Ghana EPA standard (35 µg m−3), WHO Interim Target 2 (50 µg m−3), and WHO Interim Target 1 (75 µg m−3) (Ghana Standards Authority, 2019; World Health Organization, 2021). During the Harmattan season, northern cities record substantially higher proportions of days exceeding 50 and 75 µg m−3 compared to southern cities, while even during non-Harmattan conditions, fewer than 10 % of days in any Ghanaian city fall below the WHO 24 h guideline of 15 µg m−3. The annual frequency corresponding to each concentration range for these cities is shown in Fig. S17 in the Supplement. Collectively, these exceedance patterns demonstrate that ambient PM2.5 in Ghana constitutes a pervasive and chronic public health threat that cannot be attributed solely to episodic Harmattan dust events, underscoring the need for sustained emission reduction efforts across all seasons.
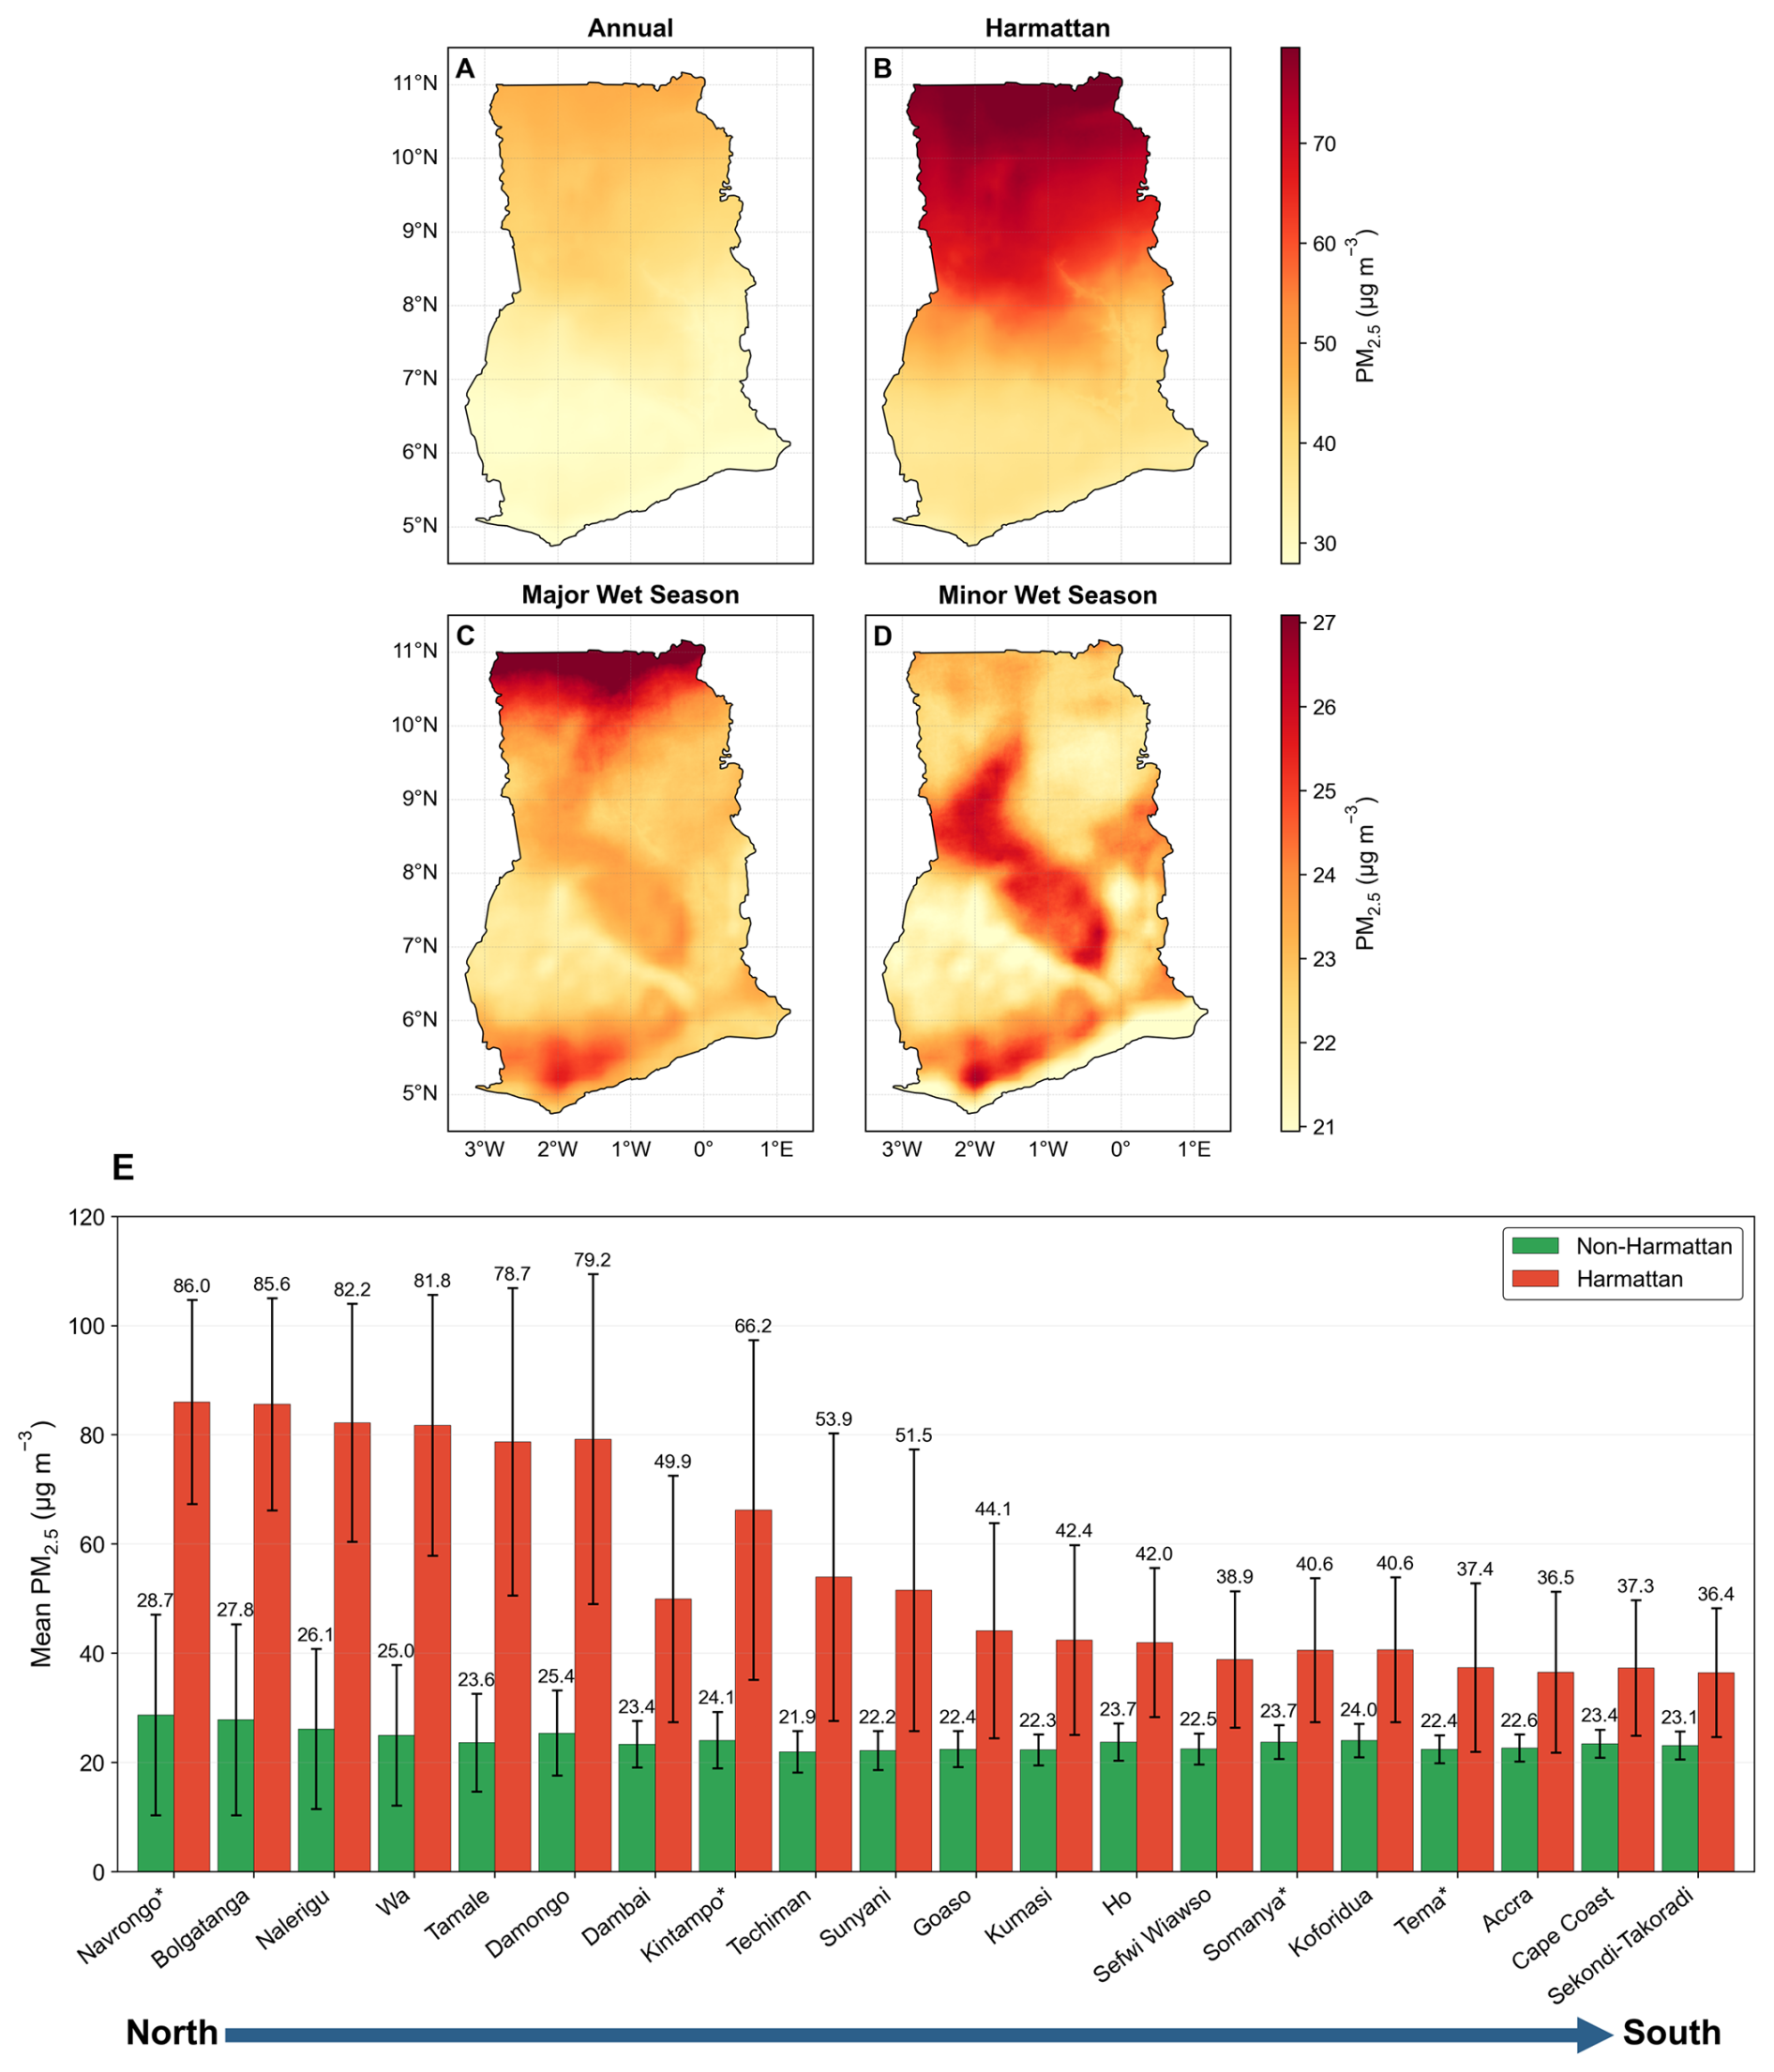
Figure 7Spatial distribution of long-term mean PM2.5 concentrations across Ghana. (A–D) Maps show average PM2.5 concentrations during 2005–2025 for annual conditions, Harmattan season, major wet season, and minor wet season, respectively. Color scales are adjusted separately for each row to highlight spatial variability under higher-PM2.5 (annual and Harmattan) and lower-PM2.5 (wet seasons) conditions. (E) Mean daily PM2.5 for regional capitals and additional locations (indicated with *) in Ghana during the non-Harmattan and Harmattan seasons from 2005–2025. Error bars represent the standard deviation of daily PM2.5 concentrations. The mean PM2.5 concentrations (in µg m−3) are shown above the error bars.
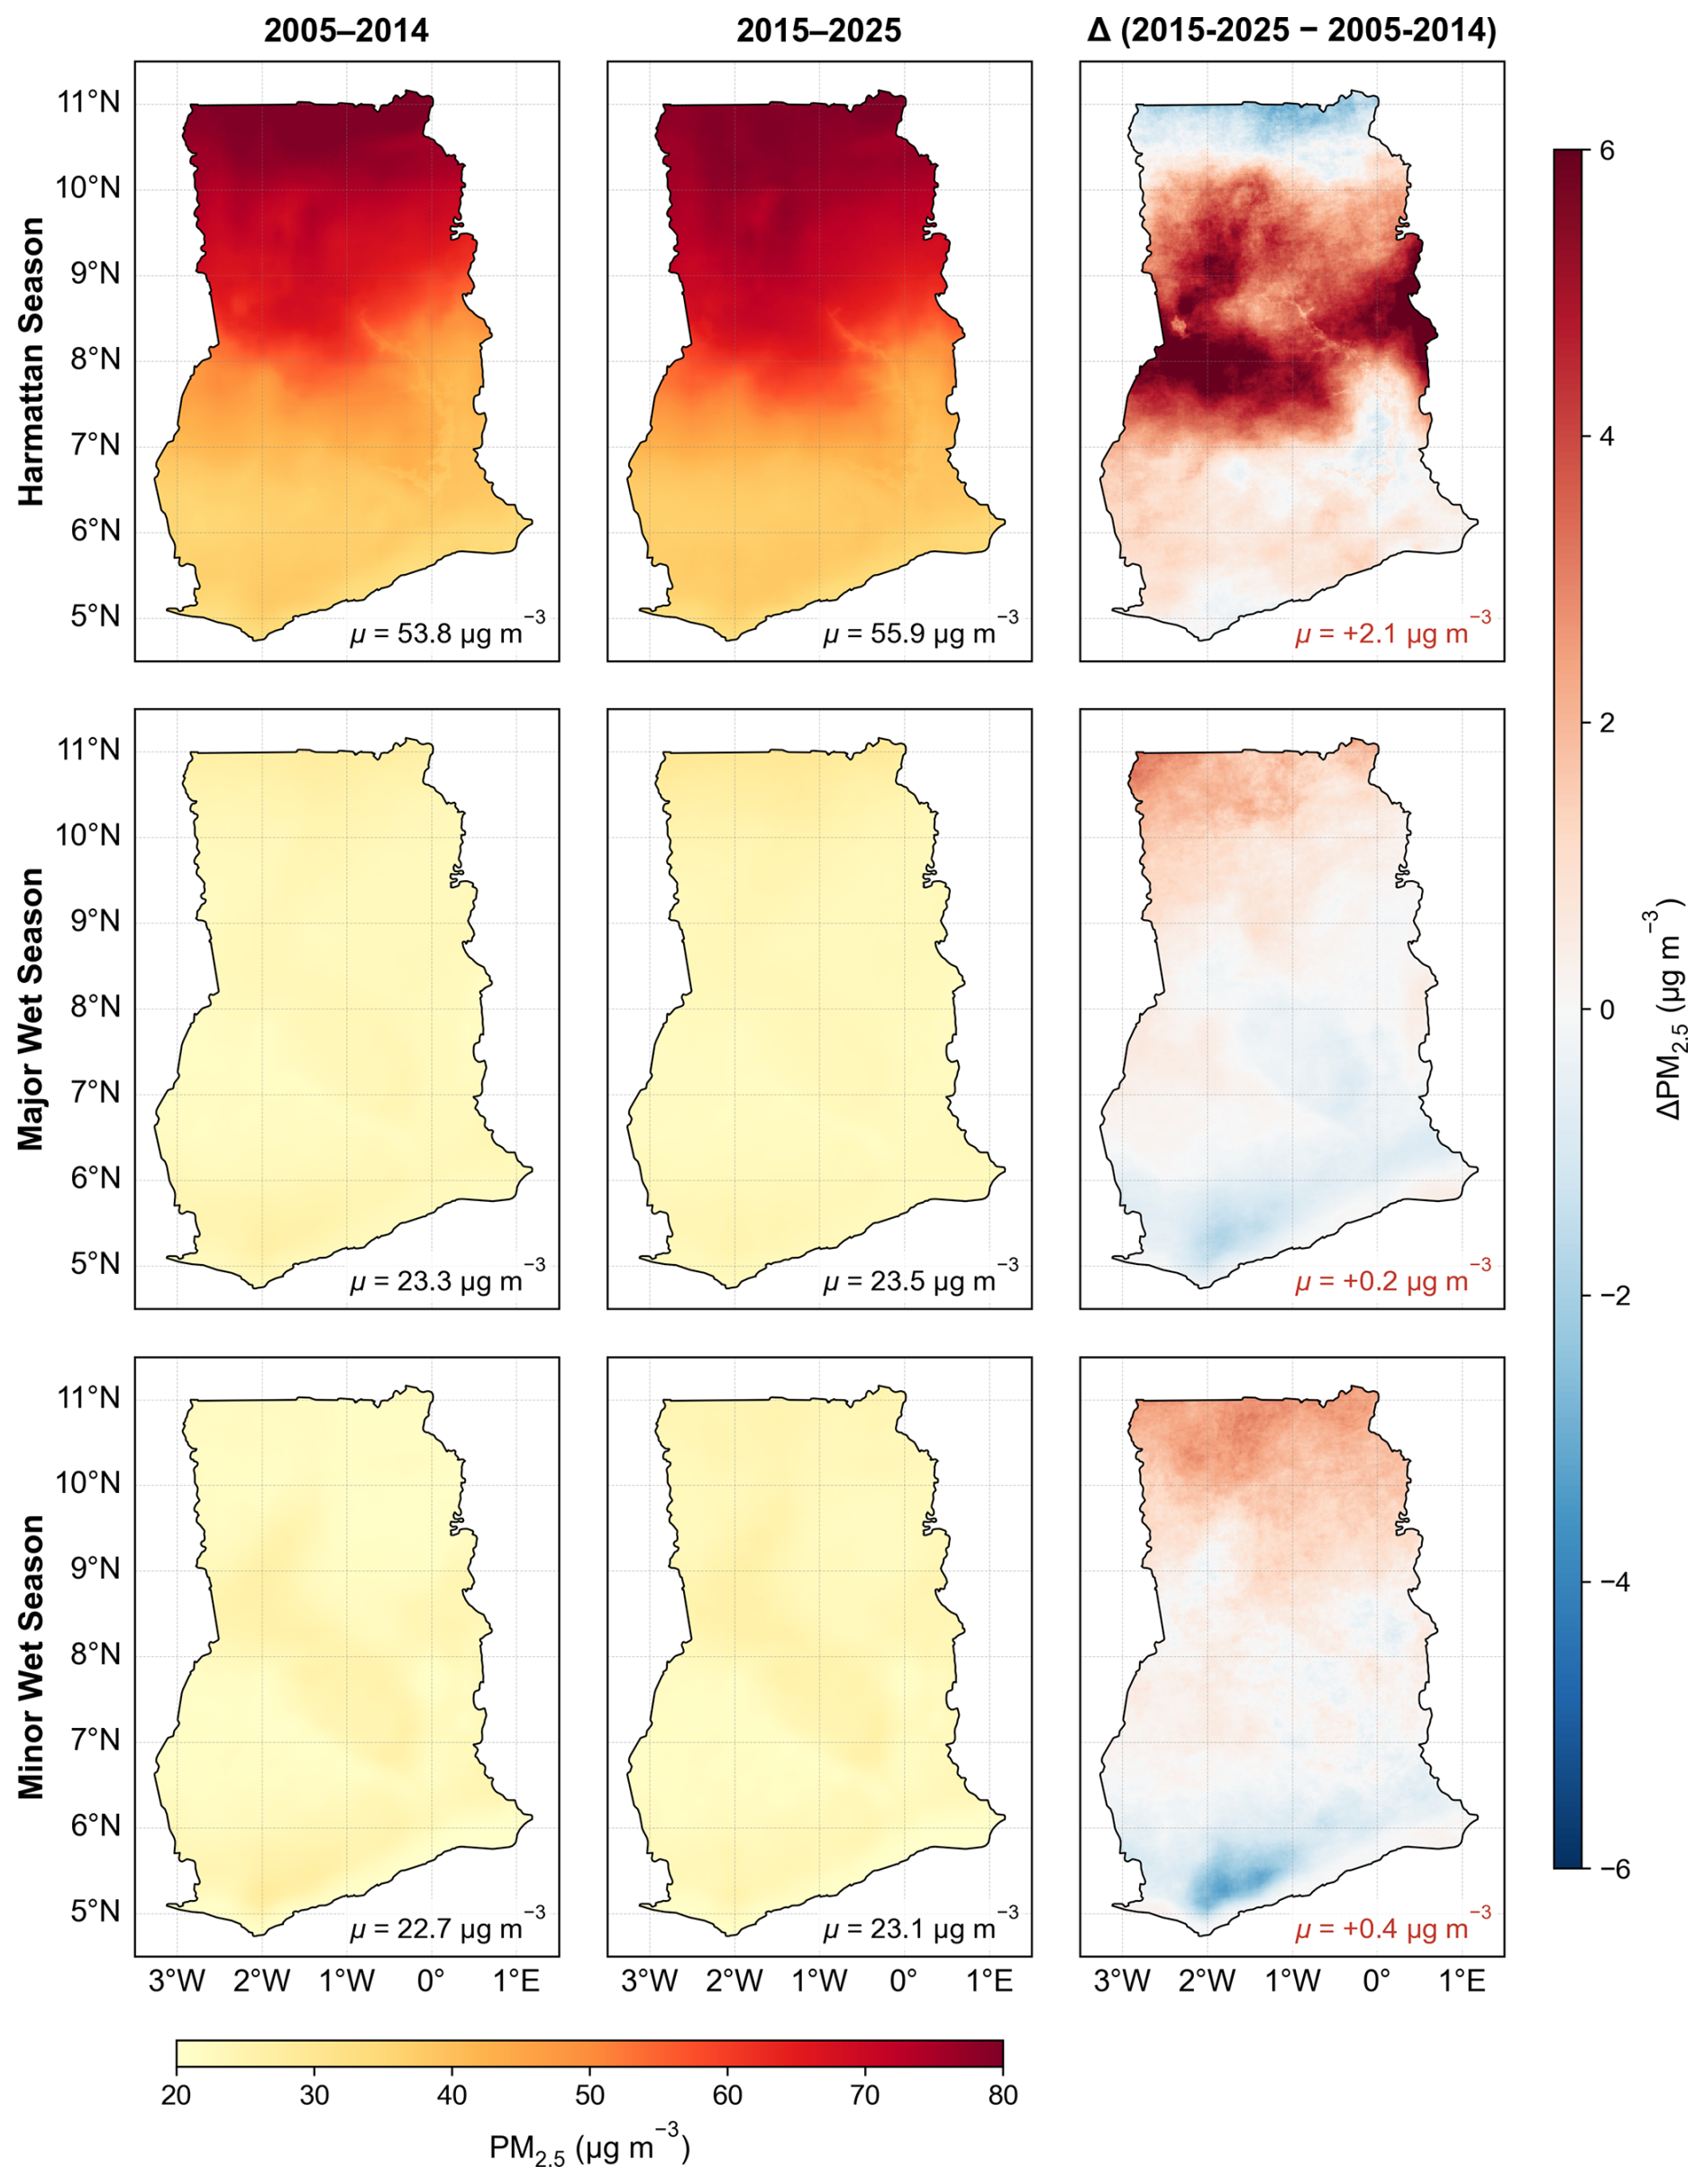
Figure 8Multi-year changes in seasonal mean PM2.5 concentrations across Ghana. Maps show spatial patterns of mean PM2.5 concentrations for the Harmattan, major wet, and minor wet seasons for two multi-year periods (2005–2014 and 2015–2025), along with the corresponding differences (Δ=2015–2025 minus 2005–2014). μ denotes the spatial mean concentration for each panel. The color scale for the mean concentration levels is shown at the bottom, while the diverging color scale on the right highlights the magnitude of change.
3.5 Long-term mean PM2.5 in Ghana
The 21-year mean spatial distribution of PM2.5 across Ghana (Fig. 7) reveals a pronounced north–south gradient that is most extreme during the Harmattan season (Fig. 7B) and attenuates substantially during the wet seasons (Fig. 7C and D). The 21-year annual mean (Fig. 7A) shows consistently elevated concentrations in the Upper East, Upper West, Northern, and Savannah regions compared to the forested south, reflecting the dominant influence of Harmattan-transported mineral dust from Saharan and Sahelian regions that disproportionately affects northern Ghana due to its open savanna landscape and exposure to dry northeasterly winds. During the major wet season (Fig. 7C), PM2.5 concentrations drop significantly throughout the country, and the north-south gradient weakens considerably, driven by enhanced wet deposition and suppressed dust transport, while southern coastal cities retain discernible PM2.5 elevations relative to the rural background, reflecting persistent contributions from traffic, open waste burning, and industrial activity. During the minor wet season (Fig. 7D), PM2.5 remains relatively low but exhibits a more heterogeneous spatial pattern, with elevated concentrations extending across parts of central and southern Ghana. The city-level seasonal comparison (Fig. 7E) directly quantifies these contrasts: northern and central cities consistently experience substantially higher Harmattan-season PM2.5 than their non-Harmattan levels, while southern coastal cities show comparatively muted seasonality, consistent with the dominance of year-round anthropogenic rather than dust-driven sources at those locations.
Decadal-scale changes in seasonal PM2.5 concentrations between the two multi-year periods, 2005–2014 and 2015–2025, are shown in Fig. 8. During the Harmattan season, difference maps reveal a net increase in PM2.5 across much of northern Ghana in the later period, consistent with the upward Sen's slope estimates for Wa, Tamale, Nalerigu, and Damongo (Table S14) and potentially reflecting intensified dust mobilization from Sahelian source regions under changing land use and climate conditions. In contrast, wet season PM2.5 shows modest decreases in parts of southern Ghana between the two periods, particularly in and around major urban centers, corroborating the declining trends observed in Fig. 5 and Table S14 for cities such as Somanya, Ho, and Koforidua. In this inter-decadal comparison (Fig. 8), the most notable increases are concentrated along the northern belt, while decreases are evident in the southeastern coastal zone. Period-by-period comparisons at finer temporal resolution, comparing 2005–2009 with 2010–2014, 2010–2014 with 2015–2019, and 2015–2019 with 2020–2025, are provided in Figs. S18–S20 in the Supplement. Together, these analyses document persistent north–south differences in PM2.5 exposure over the 21-year record, with contrasting long-term trends between a dust-burdened north and a south showing modest but measurable improvements, superimposed on substantial interannual and multi-year variability.
In this study, we developed three complementary XGBoost models to achieve complete spatiotemporal coverage, with OMI-based (2005–6 May 2018) and TROPOMI-based (7 May 2018 to 2025) models as the primary sources of PM2.5 estimates, while a MERRA-2-based XGBoost model fills gaps observed in TROPOMI- and OMI-based models arising from unavailability of satellite-derived predictors due to low-quality retrievals. Spatial cross-validation performance (r≈0.73–0.76) indicates that the XGBoost models capture dominant spatial patterns across Ghana, though prediction uncertainty may be higher in areas far from monitoring sites or emission environments not well represented by the monitoring network, particularly in the sparsely monitored northern regions of Ghana (Fig. S15). SHAP analysis revealed that meteorological features (primarily relative humidity), seasonal cyclic encoding, and aerosol optical indicators (UVAI and AOD) are the dominant predictors of PM2.5 in Ghana, consistent with its PM2.5 climatology being strongly influenced by Harmattan dust transport and wet-season aerosol scavenging.
The 21-year model-derived PM2.5 record suggests a persistent north–south exposure disparity, with Northern Ghana consistently experiencing substantially higher PM2.5 concentrations than the south, where mean exposure levels are typically 1.6–1.8 times greater during peak Harmattan months. This disparity is further reinforced by contrasting long-term trends. Several northern cities, including Wa, Tamale, and Nalerigu, exhibit statistically significant increases in PM2.5 ranging from 0.05 to 0.11 , while multiple southern urban centers, such as Somanya, Ho, and Koforidua, show declines between −0.023 and −0.086 . These opposing trajectories highlight that national averages obtained using measurements from a few point monitors obscure important regional dynamics, with air quality improving modestly in parts of the south while deteriorating in the north.
These findings carry direct implications for public-health and air-quality policy in Ghana. The WHO 24 h guideline recommends that the mean daily PM2.5 concentrations should not exceed 15 µg m−3 for more than 3–4 d in a year. With a mean concentration of 31.4 µg m−3 during the ground monitoring period (2018–2024) and more than 99 % of days during the 21-year period consistently exceeding the WHO guideline, ambient PM2.5 in Ghana represents a persistent exposure burden that extends well beyond the Harmattan season. Even during non-Harmattan months, major urban centers such as Accra, Kumasi, and Tema exceed the WHO 24 h guideline on virtually all days during 2005–2025, indicating that combustion-driven sources contribute substantially to year-round high PM2.5 exposure in these urban areas. The observed declines in several southern urban centers may be consistent with improvements in vehicle fuel standards, industrial emission controls, and incremental adoption of cleaner household energy. These factors may also contribute to urban PM2.5 trends in other parts of Ghana, but their influence may be more pronounced in southern Ghana because of the greater degree and spatial extent of urbanization and concentration of urban activities in this region. However, these observed changes remain modest, suggesting the need for more effective policy implementation. In contrast, rising concentrations across parts of northern Ghana, where long-range mineral dust interacts with expanding biomass burning, agricultural activity, and urbanization, highlight the limits of locally focused mitigation when transboundary and regional drivers dominate, and underscore the need for coordinated West African strategies and adaptive measures to reduce dry-season exposure.
Although the multi-model framework provides the most spatially and temporally complete high-resolution daily PM2.5 dataset currently available for Ghana, characterization of diel variability is constrained by the scarcity of sub-daily observations needed to better constrain emission sources. Current satellite retrievals over Africa rely primarily on polar-orbiting instruments with once-daily overpasses. Unlike North America, Europe, and East Asia, where geostationary atmospheric composition observations are available from TEMPO, Sentinel-4, and GEMS, respectively, Africa currently lacks comparable satellite observations, limiting the ability to capture short-term pollution dynamics and separate anthropogenic signals from meteorological variability across the continent.
Translating this dataset into public-health and environmental-management outcomes will require several further steps. Linking the 1 km×1 km daily PM2.5 fields with Ghanaian health surveillance, hospitalization, and demographic and health survey data can quantify the mortality and morbidity burden attributable to long- and short-term exposures to PM2.5, and support policy evaluation for more effective implementation and monitoring. Extending the modeling framework from Ghana to other African countries, where calibrated low-cost sensor networks are increasingly available, could generate a continental-scale high-resolution PM2.5 record to address the data gaps currently constraining African representation in global air-quality and climate–health assessments. Together, these steps would transform the retrospective dataset presented here into a sustained decision-support resource for air-quality governance across data-sparse regions.
The daily PM2.5 gridded dataset generated from this study is publicly available on the Zenodo repository at: https://doi.org/10.5281/zenodo.19636051 (Anand et al., 2026). Additional data produced and used during analysis can be found in the main text and the Supplement.
The supplement related to this article is available online at https://doi.org/10.5194/amt-19-7231-2026-supplement.
Conceptualization: AA, DMW. Investigation: AA, DMW. Methodology: AA, JAA, DMW. Software: DMW. Formal analysis: AA. Data curation: AA, DMW. Validation: AA, DMW. Visualization: AA. Supervision: AA, DMW. Project administration: AA, DMW. Funding acquisition: DMW. Writing – original draft: AA. Writing – review and editing: AA, JAA, SA, ENT, NABK, CMA, BE, KMA, DMW.
The contact author has declared that none of the authors has any competing interests.
Publisher's note: Copernicus Publications remains neutral with regard to jurisdictional claims made in the text, published maps, institutional affiliations, or any other geographical representation in this paper. The authors bear the ultimate responsibility for providing appropriate place names. Views expressed in the text are those of the authors and do not necessarily reflect the views of the publisher.
We thank the Clean Air Fund team in Ghana for their helpful discussions and suggestions during the course of this study.
This research has been supported by the Clean Air Fund (grant no. PG013625).
This paper was edited by Andrew Sayer and reviewed by Gaige Kerr and one anonymous referee.
Alli, A. S., Clark, S. N., Hughes, A., Nimo, J., Bedford-Moses, J., Baah, S., Wang, J., Vallarino, J., Agyemang, E., Barratt, B., Beddows, A., Kelly, F., Owusu, G., Baumgartner, J., Brauer, M., Ezzati, M., Agyei-Mensah, S., and Arku, R. E.: Spatial-temporal patterns of ambient fine particulate matter (PM2.5) and black carbon (BC) pollution in Accra, Environ. Res. Lett., 16, 074013, https://doi.org/10.1088/1748-9326/AC074A, 2021.
Amooli, J. A., Hackman, K. O., Nana, B., and Westervelt, D. M.: Fine particulate air pollution estimation in Ouagadougou using satellite aerosol optical depth and meteorological parameters, Environmental Science: Atmospheres, 4, 1012–1025, https://doi.org/10.1039/D4EA00057A, 2024.
Amooli, J. A., Lund, M. T., Chowdhury, S., Myhre, G., Johansen, A. N., Samset, B. H., and Westervelt, D. M.: An uncertain future for the climate and health impacts of anthropogenic aerosols in Africa, Atmos. Chem. Phys., 25, 11611–11632, https://doi.org/10.5194/acp-25-11611-2025, 2025.
Anand, A., Touré, N. E., Bahino, J., Gnamien, S., Hughes, A. F., Arku, R. E., Tawiah, V. O., Asfaw, A., Mamo, T., Hasheminassab, S., Bililign, S., Moschos, V., Westervelt, D. M., and Presto, A. A.: Low-Cost Hourly Ambient Black Carbon Measurements at Multiple Cities in Africa, Environ. Sci. Technol., 58, 12575–12584, https://doi.org/10.1021/ACS.EST.4C02297, 2024.
Anand, A., Amooli, J. A., and Westervelt, D.: Gridded Daily PM2.5 at 1 km × 1 km Resolution from 2005–2025: Ghana (Version v2.0), Zenodo [data set], https://doi.org/10.5281/zenodo.19636051, 2026.
Ayazpour, Z., González Abad, G., Nowlan, C. R., Sun, K., Kwon, H. A., Chan Miller, C., Chong, H., Wang, H., Liu, X., Chance, K., O'Sullivan, E., Zhu, L., Vigouroux, C., De Smedt, I., Stremme, W., Hannigan, J. W., Notholt, J., Sun, X., Palm, M., Petri, C., Strong, K., Röhling, A. N., Mahieu, E., Smale, D., Yao, T., Morino, I., Murata, I., Nagahama, T., Kivi, R., Makarova, M., Jones, N., Sussmann, R., and Zhou, M.: Aura Ozone Monitoring Instrument (OMI) Collection 4 Formaldehyde Products, Earth and Space Science, 12, e2024EA003792, https://doi.org/10.1029/2024EA003792, 2025.
Ayetor, G. K., Dugbenu, J., Duah, A. A., Adewe, C., Agyei, E. A., Affenyi, E., Peasah, G. M., and Nartey, T. T.: Assessing fuel economy and tailpipe emissions of road vehicles in Ghana, African Transport Studies, 3, 100040, https://doi.org/10.1016/J.AFTRAN.2025.100040, 2025.
Bachwenkizi, J., Liu, C., Meng, X., Zhang, L., Wang, W., van Donkelaar, A., Martin, R. V., Hammer, M. S., Chen, R., and Kan, H.: Fine particulate matter constituents and infant mortality in Africa: A multicountry study, Environ. Int., 156, 106739, https://doi.org/10.1016/J.ENVINT.2021.106739, 2021.
Benjamini, Y. and Hochberg, Y.: Controlling the False Discovery Rate: A Practical and Powerful Approach to Multiple Testing, J. Roy. Stat. Soc. B Met., 57, 289–300, https://doi.org/10.1111/J.2517-6161.1995.TB02031.X, 1995.
Chi, G., Fang, H., Chatterjee, S., and Blumenstock, J. E.: Microestimates of wealth for all low- and middle-income countries, P. Natl. Acad. Sci. USA, 119, https://doi.org/10.1073/PNAS.2113658119, 2022.
Dalaba, M., Alirigia, R., Mesenbring, E., Coffey, E., Brown, Z., Hannigan, M., Wiedinmyer, C., Oduro, A., and Dickinson, K. L.: Liquified Petroleum Gas (LPG) Supply and Demand for Cooking in Northern Ghana, Ecohealth, 15, 716–728, https://doi.org/10.1007/S10393-018-1351-4, 2018.
De Smedt, I., Müller, J.-F., Stavrakou, T., van der A, R., Eskes, H., and Van Roozendael, M.: Twelve years of global observations of formaldehyde in the troposphere using GOME and SCIAMACHY sensors, Atmos. Chem. Phys., 8, 4947–4963, https://doi.org/10.5194/acp-8-4947-2008, 2008.
Di, Q., Koutrakis, P., and Schwartz, J.: A hybrid prediction model for PM2.5 mass and components using a chemical transport model and land use regression, Atmos. Environ., 131, 390–399, https://doi.org/10.1016/J.ATMOSENV.2016.02.002, 2016.
Fisher, S., Bellinger, D. C., Cropper, M. L., Kumar, P., Binagwaho, A., Koudenoukpo, J. B., Park, Y., Taghian, G., and Landrigan, P. J.: Air pollution and development in Africa: impacts on health, the economy, and human capital, Lancet Planet. Health, 5, e681–e688, https://doi.org/10.1016/S2542-5196(21)00201-1, 2021.
Friedl, M. and Sulla-Menashe, D.: MODIS/Terra+Aqua Land Cover Type Yearly L3 Global 500m SIN Grid V061, NASA Land Processes Distributed Active Archive Center, https://doi.org/10.5067/MODIS/MCD12Q1.061, 2022.
Gelaro, R., McCarty, W., Suárez, M. J., Todling, R., Molod, A., Takacs, L., Randles, C. A., Darmenov, A., Bosilovich, M. G., Reichle, R., Wargan, K., Coy, L., Cullather, R., Draper, C., Akella, S., Buchard, V., Conaty, A., da Silva, A. M., Gu, W., Kim, G. K., Koster, R., Lucchesi, R., Merkova, D., Nielsen, J. E., Partyka, G., Pawson, S., Putman, W., Rienecker, M., Schubert, S. D., Sienkiewicz, M., and Zhao, B.: The Modern-Era Retrospective Analysis for Research and Applications, Version 2 (MERRA-2), J. Climate, 30, 5419–5454, https://doi.org/10.1175/JCLI-D-16-0758.1, 2017.
Ghana Standards Authority: Environment and Health Protection – Requirements for Ambient Air Quality and Point Source/Stack Emissions. GS 1236:2019, Accra, https://leap.unep.org/en/countries/gh/national-legislation/environment-and-health-protection-requirements-ambient-air (last access: 1 September 2026), 2019.
Giglio, L., Schroeder, W., and Justice, C. O.: The collection 6 MODIS active fire detection algorithm and fire products, Remote Sens. Environ., 178, 31–41, https://doi.org/10.1016/J.RSE.2016.02.054, 2016.
Global Modeling and Assimilation Office (GMAO): MERRA-2 tavg1_2d_aer_Nx: 2d, 1-Hourly, Time-averaged, Single-Level, Assimilation, Aerosol Diagnostics V5.12.4 (M2T1NXAER), Goddard Earth Sciences Data and Information Services Center (GES DISC), https://doi.org/10.5067/KLICLTZ8EM9D, 2015.
Griffin, D., Chen, J., Anderson, K., Makar, P., McLinden, C. A., Dammers, E., and Fogal, A.: Biomass burning CO emissions: exploring insights through TROPOMI-derived emissions and emission coefficients, Atmos. Chem. Phys., 24, 10159–10186, https://doi.org/10.5194/acp-24-10159-2024, 2024.
Gualtieri, G., Ahbil, K., Brilli, L., Carotenuto, F., Cavaliere, A., Gioli, B., Giordano, T., Katiellou, G. L., Mouhaimini, M., Tarchiani, V., Vagnoli, C., Zaldei, A., and Bacci, M.: Potential of low-cost PM monitoring sensors to fill monitoring gaps in areas of Sub-Saharan Africa, Atmos. Pollut. Res., 15, 102158, https://doi.org/10.1016/J.APR.2024.102158, 2024.
Hammer, M. S., Van Donkelaar, A., Li, C., Lyapustin, A., Sayer, A. M., Hsu, N. C., Levy, R. C., Garay, M. J., Kalashnikova, O. V., Kahn, R. A., Brauer, M., Apte, J. S., Henze, D. K., Zhang, L., Zhang, Q., Ford, B., Pierce, J. R., and Martin, R. V.: Global Estimates and Long-Term Trends of Fine Particulate Matter Concentrations (1998–2018), Environ. Sci. Technol., 54, 7879–7890, https://doi.org/10.1021/ACS.EST.0C01764, 2020.
Hayes, R. B., Lim, C., Zhang, Y., Cromar, K., Shao, Y., Reynolds, H. R., Silverman, D. T., Jones, R. R., Park, Y., Jerrett, M., Ahn, J., and Thurston, G. D.: PM2.5 air pollution and cause-specific cardiovascular disease mortality, Int. J. Epidemiol., 49, 25–35, https://doi.org/10.1093/IJE/DYZ114, 2020.
Health Effects Institute: State of Global Air Report 2024, https://www.stateofglobalair.org/resources/report/state-global-air-report-2024 (last access: 29 June 2025), 2024.
Hirsch, R. M. and Slack, J. R.: A Nonparametric Trend Test for Seasonal Data With Serial Dependence, Water Resour. Res., 20, 727–732, https://doi.org/10.1029/WR020I006P00727, 1984.
Institute for Health Metrics and Evaluation (IHME): GBD Results, https://vizhub.healthdata.org/gbd-results/ (last access: 18 February 2026), 2025.
Klutse, N. A. B., Owusu, K., and Boafo, Y. A.: Projected temperature increases over northern Ghana, SN Appl. Sci., 2, 1339, https://doi.org/10.1007/S42452-020-3095-3, 2020.
Kwarteng, L., Baiden, E. A., Fobil, J., Arko-Mensah, J., Robins, T., and Batterman, S.: Air Quality Impacts at an E-Waste Site in Ghana Using Flexible, Moderate-Cost and Quality-Assured Measurements, Geohealth, 4, e2020GH000247, https://doi.org/10.1029/2020GH000247, 2020.
Lebakula, V., Sims, K., Reith, A., Rose, A., McKee, J., Coleman, P., Kaufman, J., Urban, M., Jochem, C., Whitlock, C., Ogden, M., Pyle, J., Roddy, D., Epting, J., and Bright, E.: LandScan Global 30 Arcsecond Annual Global Gridded Population Datasets from 2000 to 2022, Sci. Data, 12, 495, https://doi.org/10.1038/s41597-025-04817-z, 2025.
Li, C., Joiner, J., Krotkov, N. A., and Bhartia, P. K.: A fast and sensitive new satellite SO2 retrieval algorithm based on principal component analysis: Application to the ozone monitoring instrument, Geophys. Res. Lett., 40, 6314–6318, https://doi.org/10.1002/2013GL058134, 2013.
Li, C., Wang, J., Zhang, H., Diner, D. J., Hasheminassab, S., and Janechek, N.: Improvement of Surface PM2.5 Diurnal Variation Simulations in East Africa for the MAIA Satellite Mission, ACS ES&T Air, 1, 223–233, https://doi.org/10.1021/ACSESTAIR.3C00008, 2024.
Liu, Y., Park, R. J., Jacob, D. J., Li, Q., Kilaru, V., and Sarnat, J. A.: Mapping annual mean ground-level PM2.5 concentrations using Multiangle Imaging Spectroradiometer aerosol optical thickness over the contiguous United States, J. Geophys. Res.-Atmos., 109, 1–10, https://doi.org/10.1029/2004JD005025, 2004.
Lyapustin, A., Wang, Y., Korkin, S., and Huang, D.: MODIS Collection 6 MAIAC algorithm, Atmos. Meas. Tech., 11, 5741–5765, https://doi.org/10.5194/amt-11-5741-2018, 2018.
Melchiorri, M., Mari, R. I., Florio, P., Schiavina, M., Krasnodebska, K., Politis, P., Uhl, J., Pesaresi, M., Maffenini, L., Sulis, P., Crippa, M., Guizzardi, D., Pisoni, E., Belis, C., Oom, D., Branco, A., Mwaniki, D., Githira, D., Kochulem, E., Tommasi, P., Carioli, A., Ehrlich, D., Kemper, T., and Dijkstra, L.: Stats in the City – the GHSL Urban Centre Database 2025, European Commission, Joint Research Centre (JRC), https://doi.org/10.2760/3046391, 2024.
Moran, P. A.: Notes on Continuous Stochastic Phenomena, Biometrika, 37, 17–23, https://doi.org/10.1093/BIOMET/37.1-2.17, 1950.
Muñoz Sabater, J.: ERA5-Land hourly data from 1950 to present, Copernicus Climate Change Service (C3S) Climate Data Store (CDS), https://doi.org/10.24381/cds.e2161bac, 2019.
Muñoz-Sabater, J., Dutra, E., Agustí-Panareda, A., Albergel, C., Arduini, G., Balsamo, G., Boussetta, S., Choulga, M., Harrigan, S., Hersbach, H., Martens, B., Miralles, D. G., Piles, M., Rodríguez-Fernández, N. J., Zsoter, E., Buontempo, C., and Thépaut, J.-N.: ERA5-Land: a state-of-the-art global reanalysis dataset for land applications, Earth Syst. Sci. Data, 13, 4349–4383, https://doi.org/10.5194/essd-13-4349-2021, 2021.
Nicholson, S. E.: The ITCZ and the Seasonal Cycle over Equatorial Africa, B. Am. Meteorol. Soc., 99, 337–348, https://doi.org/10.1175/BAMS-D-16-0287.1, 2018.
Ofosu, F. G., Hopke, P. K., Aboh, I. J. K., and Bamford, S. A.: Biomass burning contribution to ambient air particulate levels at Navrongo in the Savannah zone of Ghana, J. Air Waste Manage., 63, 1036–1045, https://doi.org/10.1080/10962247.2013.783888, 2013.
Owusu-Tawiah, V., Annor, T., Yamba, E. I., Nimo, J., Wemegah, C. S., Hodoli, C. G., Osei-Tutu, D., Amponsah, D., Hughes, A. F., and Westervelt, D. M.: Spatiotemporal Assessment of PM2.5 in Senior High Schools in Kumasi, Ghana using Low-Cost Sensors, Aerosol Air Qual. Res., 25, 66-, https://doi.org/10.1007/S44408-025-00066-2, 2025.
Philip, S., Martin, R. V., Van Donkelaar, A., Lo, J. W. H., Wang, Y., Chen, D., Zhang, L., Kasibhatla, P. S., Wang, S., Zhang, Q., Lu, Z., Streets, D. G., Bittman, S., and Macdonald, D. J.: Global chemical composition of ambient fine particulate matter for exposure assessment, Environ. Sci. Technol., 48, 13060–13068, https://doi.org/10.1021/ES502965B, 2014.
Pye, H. O. T., Appel, K. W., Seltzer, K. M., Ward-Caviness, C. K., and Murphy, B. N.: Human-Health Impacts of Controlling Secondary Air Pollution Precursors, Environ. Sci. Tech. Let., 9, 96–101, https://doi.org/10.1021/ACS.ESTLETT.1C00798, 2022.
Raheja, G., Sabi, K., Sonla, H., Gbedjangni, E. K., McFarlane, C. M., Hodoli, C. G., and Westervelt, D. M.: A Network of Field-Calibrated Low-Cost Sensor Measurements of PM2.5 in Lomé, Togo, Over One to Two Years, ACS Earth Space Chem., 6, 1011–1021, https://doi.org/10.1021/ACSEARTHSPACECHEM.1C00391, 2022.
Sayeed, A., Lin, P., Gupta, P., Tran, N. N. M., Buchard, V., and Christopher, S.: Hourly and Daily PM2.5 Estimations Using MERRA-2: A Machine Learning Approach, Earth and Space Science, 9, e2022EA002375, https://doi.org/10.1029/2022EA002375, 2022.
Sen, P. K.: Estimates of the Regression Coefficient Based on Kendall's Tau, J. Am. Stat. Assoc., 63, 1379–1389, https://doi.org/10.1080/01621459.1968.10480934, 1968.
Shen, S., Li, C., van Donkelaar, A., Jacobs, N., Wang, C., and Martin, R. V.: Enhancing Global Estimation of Fine Particulate Matter Concentrations by Including Geophysical a Priori Information in Deep Learning, ACS ES&T Air, 1, 332–345, https://doi.org/10.1021/ACSESTAIR.3C00054, 2024.
Shi, L., Wu, X., Danesh Yazdi, M., Braun, D., Abu Awad, Y., Wei, Y., Liu, P., Di, Q., Wang, Y., Schwartz, J., Dominici, F., Kioumourtzoglou, M. A., and Zanobetti, A.: Long-term effects of PM2.5 on neurological disorders in the American Medicare population: a longitudinal cohort study, Lancet Planet. Health, 4, e557–e565, https://doi.org/10.1016/S2542-5196(20)30227-8, 2020.
Torres, O., Bhartia, P. K., Jethva, H., and Ahn, C.: Impact of the ozone monitoring instrument row anomaly on the long-term record of aerosol products, Atmos. Meas. Tech., 11, 2701–2715, https://doi.org/10.5194/amt-11-2701-2018, 2018.
Torres, O., Jethva, H., Ahn, C., Jaross, G., and Loyola, D. G.: TROPOMI aerosol products: evaluation and observations of synoptic-scale carbonaceous aerosol plumes during 2018–2020, Atmos. Meas. Tech., 13, 6789–6806, https://doi.org/10.5194/amt-13-6789-2020, 2020.
van Donkelaar, A., Martin, R. V., and Park, R. J.: Estimating ground-level PM2.5 using aerosol optical depth determined from satellite remote sensing, J. Geophys. Res.-Atmos., 111, 21201, https://doi.org/10.1029/2005JD006996, 2006.
van Donkelaar, A., Martin, R. V, Brauer, M., Hsu, N. C., Kahn, R. A., Levy, R. C., Lyapustin, A., Sayer, A. M., and Winker, D. M.: Global Estimates of Fine Particulate Matter using a Combined Geophysical-Statistical Method with Information from Satellites, Models, and Monitors, Environ. Sci. Technol., https://doi.org/10.1021/acs.est.5b05833, 2016.
van Donkelaar, A., Hammer, M. S., Bindle, L., Brauer, M., Brook, J. R., Garay, M. J., Hsu, N. C., Kalashnikova, O. V., Kahn, R. A., Lee, C., Levy, R. C., Lyapustin, A., Sayer, A. M., and Martin, R. V.: Monthly Global Estimates of Fine Particulate Matter and Their Uncertainty, Environ. Sci. Technol., 55, 15287–15300, https://doi.org/10.1021/ACS.EST.1C05309, 2021.
van Geffen, J., Eskes, H., Compernolle, S., Pinardi, G., Verhoelst, T., Lambert, J.-C., Sneep, M., ter Linden, M., Ludewig, A., Boersma, K. F., and Veefkind, J. P.: Sentinel-5P TROPOMI NO2 retrieval: impact of version v2.2 improvements and comparisons with OMI and ground-based data, Atmos. Meas. Tech., 15, 2037–2060, https://doi.org/10.5194/amt-15-2037-2022, 2022.
Veefkind, J. P., Aben, I., McMullan, K., Förster, H., de Vries, J., Otter, G., Claas, J., Eskes, H. J., de Haan, J. F., Kleipool, Q., van Weele, M., Hasekamp, O., Hoogeveen, R., Landgraf, J., Snel, R., Tol, P., Ingmann, P., Voors, R., Kruizinga, B., Vink, R., Visser, H., and Levelt, P. F.: TROPOMI on the ESA Sentinel-5 Precursor: A GMES mission for global observations of the atmospheric composition for climate, air quality and ozone layer applications, Remote Sens. Environ., 120, 70–83, https://doi.org/10.1016/J.RSE.2011.09.027, 2012.
Vohra, K., Vodonos, A., Schwartz, J., Marais, E. A., Sulprizio, M. P., and Mickley, L. J.: Global mortality from outdoor fine particle pollution generated by fossil fuel combustion: Results from GEOS-Chem, Environ. Res., 195, 110754, https://doi.org/10.1016/J.ENVRES.2021.110754, 2021.
Weagle, C. L., Snider, G., Li, C., Van Donkelaar, A., Philip, S., Bissonnette, P., Burke, J., Jackson, J., Latimer, R., Stone, E., Abboud, I., Akoshile, C., Anh, N. X., Brook, J. R., Cohen, A., Dong, J., Gibson, M. D., Griffith, D., He, K. B., Holben, B. N., Kahn, R., Keller, C. A., Kim, J. S., Lagrosas, N., Lestari, P., Khian, Y. L., Liu, Y., Marais, E. A., Martins, J. V., Misra, A., Muliane, U., Pratiwi, R., Quel, E. J., Salam, A., Segev, L., Tripathi, S. N., Wang, C., Zhang, Q., Brauer, M., Rudich, Y., and Martin, R. V.: Global Sources of Fine Particulate Matter: Interpretation of PM2.5 Chemical Composition Observed by SPARTAN using a Global Chemical Transport Model, Environ. Sci. Technol., 52, 11670–11681, https://doi.org/10.1021/ACS.EST.8B01658, 2018.
Westervelt, D. M., Isevulambire, P. K., Phaka, R. Y., Yang, L. H., Raheja, G., Milly, G., Selenge, J.-L. B., Mulumba, J. P. M., Bousiotis, D., Djibi, B. L., McNeill, V. F., Ng, N. L., Pope, F., Mbela, G. K., and Konde, J. N.: Low-Cost Investigation into Sources of PM2.5 in Kinshasa, Democratic Republic of the Congo, ACS ES&T Air, 1, 43–51, https://doi.org/10.1021/ACSESTAIR.3C00024, 2023.
Westervelt, D. M., Amooli, J. A., and Anand, A.: Twenty Years of High Spatiotemporal Resolution Estimates of Daily PM2.5 in West Africa Using Satellite Data, Surface Monitors, and Machine Learning, ACS ES&T Air, 2, 1468–1477, https://doi.org/10.1021/ACSESTAIR.4C00366, 2025.
World Health Organization: WHO global air quality guidelines: particulate matter (PM2.5 and PM10), ozone, nitrogen dioxide, sulfur dioxide and carbon monoxide, https://www.who.int/publications/i/item/9789240034228 (last access: 21 July 2026), 2021.
World Meteorological Organization (WMO): Guide to Instruments and Methods of Observation (WMO-No. 8), https://community.wmo.int/site/knowledge-hub/programmes-and-initiatives/instruments-and-methods-of-observation-programme-imop/guide-instruments-and-methods-of-observation-wmo-no-8 (last access: 19 February 2026), 2008.
Zhang, D., Du, L., Wang, W., Zhu, Q., Bi, J., Scovronick, N., Naidoo, M., Garland, R. M., and Liu, Y.: A machine learning model to estimate ambient PM2.5 concentrations in industrialized highveld region of South Africa, Remote Sens. Environ., 266, 112713, https://doi.org/10.1016/J.RSE.2021.112713, 2021.
Zheng, Z., Fiore, A. M., Westervelt, D. M., Milly, G. P., Goldsmith, J., Karambelas, A., Curci, G., Randles, C. A., Paiva, A. R., Wang, C., Wu, Q., and Dey, S.: Automated Machine Learning to Evaluate the Information Content of Tropospheric Trace Gas Columns for Fine Particle Estimates Over India: A Modeling Testbed, J. Adv. Model. Earth Sy., 15, e2022MS003099, https://doi.org/10.1029/2022MS003099, 2023.
Zhou, Z., Dionisio, K. L., Verissimo, T. G., Kerr, A. S., Coull, B., Howie, S., Arku, R. E., Koutrakis, P., Spengler, J. D., Fornace, K., Hughes, A. F., Vallarino, J., Agyei-Mensah, S., and Ezzati, M.: Chemical Characterization and Source Apportionment of Household Fine Particulate Matter in Rural, Peri-urban, and Urban West Africa, Environ. Sci. Technol., 48, 1343–1351, https://doi.org/10.1021/ES404185M, 2014.