
the Creative Commons Attribution 4.0 License.
the Creative Commons Attribution 4.0 License.
 | 19 Nov 2026
Harmonizing measurements of oxidative potential of PM: an interlaboratory comparison of the ascorbic acid assay
Anouk Marsal

Fabrizia Cavalli
Elise Di Antonio
Stephan Houdier
Pamela Dominutti
Sophie Darfeuil
Jean-Luc Jaffrezo
Stéphane Sauvage
Jean-Philippe Putaud
Ian Mudway
Athanasios Nenes
Aikaterini Bougiatioti
Nikolaos Mihalopoulos
André S. H. Prévôt
Despina Paraskevopoulou
Ana Cvitešić Kušan
Sanja Frka
Ana Kroflič
Ajda Delić
Blanka Tariba Lovaković
Andreja Jurič
Carolina Molina
Daniele Contini
Maria Rachele Guascito
Mathilde Lintz
Davy Rousset
Hartmut Herrmann
Eduardo J. d. S. Souza
Frédéric Ledoux
Marc Fadel
Haoran Yu
Jianzhen Yu
Maria Teresa Baeza Romero
Maria Cerrato-Alvarez
Marloes van Os
Mathilde N. Delaval
Yamaris Mercedes Mena Cabrera
Nicole Trieu
Greg Evans
Nuria Galindo
Noelia Gómez-Sanchez
Hana Hlaváčková
Pavel Mikuška
Shrutika Kadam
Pourya Shahpoury
Purificación López-Mahía
Jorge Moreda-Piñeiro
Rico K. Y. Cheung
Markus Kalberer
Micol Introna
Sarah S. Steimer
Zhuoying Lin
Suzanne E. Paulson
Saima Iram
Svetlana Stevanovic
Thomas Audoux
Laurent Y. Alleman
Jianing Liu
Ting Fang
P. S. Ganesh Subramanian
Vishal Verma
Tuukka Petäjä
Xavier Querol
Gerard Hoek
Roy M. Harrison
Oxidative potential (OP) of atmospheric particulate matter (PM) is a metric of increasing scientific interest because it potentially links chemical particle properties to particle health effects. OP has been recently introduced as a recommended monitoring metric in the European Air Quality Directive. However, inconsistent protocols in the existing literature make it difficult to compare results across studies. Following a 2023 inter-laboratory comparison that focused on PM OP measured using the dithiothreitol (DTT) assay, this paper presents the findings and lessons learnt from a second inter-laboratory study focused on the ascorbic acid assay (OP-AA). In this study, twenty-six laboratories worldwide quantified OP of four PM filter samples and of one chemical compound to evaluate the entire analytical chain, including the extraction step, using a simplified OP-AA protocol. While most laboratories produced repeatable internal results when applying the simplified protocol, significant discrepancies between participants highlight the need for each laboratory to carefully evaluate deviations from the simplified OP-AA protocol. Over half of the 26 participants achieved satisfactory results, suggesting that the protocol is suitable for large-scale implementation. Beyond assessing performance, this work investigates technical, analytical, and mathematical refinements to measurement protocols. Building on the first DTT assay study, this second inter-laboratory comparison represents a significant step toward harmonizing OP assays, and provides specific recommendations to ensure consistent future measurements, ready to be applied in the new air quality directive EU 2024/2881.
- Article
(5331 KB) - Full-text XML
-
Supplement
(1333 KB) - BibTeX
- EndNote


The deleterious effects of atmospheric particulate matter (PM) exposure on human health are well-established, even at low PM concentrations (Health Effects Institute, 2020). Mechanistically, the capacity of inhaled PM to promote damaging oxidation reactions, altering cellular redox balance and causing potential oxidative stress has been proposed to link the acute hazard of PM to the observed health effects reported in the epidemiological literature (Mudway et al., 2020). Recent studies have emphasized the plausibility of this pathway at very low biologically relevant PM mass concentrations (Boogaard et al., 2024). The oxidative potential (OP) of PM was precisely developed to characterize the “intrinsic” capacity of varying PM constituents to drive damaging oxidation reactions in the lungs. Over the past decade, OP has been increasingly studied as a toxicologically informative parameter for improving the causal understanding of the link between PM exposure and downstream health effects (He and Zhang, 2023; Liu and Schauer, 2026). At the interface between biology, chemistry and toxicology, OP aims to provide a quantifiable measure of the magnitude of oxidative stress, occurring due to PM-associated pro-oxidants, via reactive oxygen or nitrogen species (ROS or RNS, respectively).
In-vitro and in-vivo tests have been developed for this purpose, with acellular assays being more widely used over cellular assays, because they are less time-consuming, cheaper, simpler and suitable for automation (Ayres et al., 2008; Gupta et al., 2020). Acellular tests with PM aim at simulating physiological reactions in the lungs, and therefore rely on the measurement of PM's ability to either deplete antioxidants (indirect OP, Cho et al., 2005; Mudway et al., 2004) or to carry or produce oxidants (direct OP, Gao et al., 2020; He and Zhang, 2023; Hellack et al., 2014). Direct OP is commonly assessed either by electron paramagnetic resonance (EPR/ESR) with spin trapping for short-lived radical species (Hellack et al., 2014; Shi et al., 2003), or measuring fluorescent adducts such as the 2,7-dichlorofluorescin (OP-DCFH) (Xu et al., 2024), or the hydroxyterephtalic acid (OP-OH) (Shen et al., 2022). Indirect OP measurements most commonly rely on the depletion of an antioxidant, such as ascorbic acid (OP-AA) (Fang et al., 2016; Visentin et al., 2016), or thiol-based probes, such as glutathione (OP-GSH) (Ayres et al., 2008) and dithiothreitol (OP-DTT) (Cho et al., 2005; Li et al., 2009). Critically, this means that these assays do not capture the additional PM-associated oxidative burden, or “latent” OP, arising from xenobiotic metabolism, or the induction of downstream inflammatory responses, driven by PM constituents that have no intrinsic oxidative potential, such as polycyclic aromatic hydrocarbons (Calas et al., 2017; Pietrogrande et al., 2022) and bacterial cell wall components. Therefore, it has been proposed that PM has both “intrinsic” and “latent” OP, with the acellular assays informing the former but not the latter (Kelly et al., 2011a, b).
Based on the assumption that PM associated pro-oxidants and radicals are important hazard and health determinants, the most oxidizing sources of PM have been investigated in different environments (Hopke et al., 2020; Tassel et al., 2025). Further, an increasing number of epidemiological studies has examined the relevance of this indicator for predicting the effects on various short- and long-term health outcomes (Borlaza-Lacoste et al., 2024; Weichenthal et al., 2016). Finally, mechanistic studies have begun to evaluate the associations between intrinsic OP and downstream biological parameters linked to inflammation or cellular metabolism (Guascito et al., 2023; Janssen et al., 2015; Marsal et al., 2024). Given the growing evidence on OP's relevance for hazard ranking and, as an alternative PM metric for assessing health effects, the recent European air quality regulation recommended monitoring OP at the newly established air quality supersites (Article 10, Annex VII, Directive 2024/2881/CE). A common challenge across these different research fields and in implementing the directive is the lack of standardized OP measurement protocols. Significant differences exist in the current literature at every stage of analysis, from liquid-phase extraction of the PM filter samples to the composition of the solution in which a given probe (the target antioxidant or reactive oxygen species (ROS)-sensitive probe used in the assay) is prepared. The mathematical determination of OP also differs, with some groups relying on a calibration curve (Gao et al., 2017; Kramer et al., 2016), and others calculating it with respect to the initial probe concentration (Calas et al., 2018; Fang et al., 2016). While all studies use a metric called OP, the absence of harmonized protocols for measuring this indicator impedes direct comparisons between studies, weakening the conclusions that can be drawn from pooled studies (Liu and Schauer, 2026).
In 2023, the RI-URBANS European project conducted the first large scale study for the OP-DTT assay (Dominutti et al., 2025). This initial inter-laboratory comparison (ILC) revealed that, although some discrepancies persisted across samples within each laboratory, nine out of eighteen global participants produced results in close accordance with the expert-defined values. The study identified participant training and the specific type of spectrophotometer used (cuvette-based, plate reader or liquid waveguide capillary cell) as the primary sources of variation. As a foundational step toward protocol standardisation, the study offered several recommendations for future research. The most significant recommendation was to evaluate the whole analytical process, by including the liquid phase extraction of PM filters rather than providing an identical aqueous extract to all participants. This approach evaluates the critical extraction stage while minimizing the effects of extract aging. Furthermore, Dominutti et al. (2025) recommended using a common chemical reference material to facilitate future evaluations. Finally, as no single probe has been established as the most toxicologically- or health-informative, the authors called for the harmonization of protocols beyond DTT.
Like the OP-DTT assay, the OP-AA assay indirectly measures OP and is sensitive to several ROS and transition metals (Fang et al., 2016; Maikawa et al., 2016). Its relative simplicity and reliance on direct absorbance-based kinetic monitoring have led to its widespread adoption within the scientific community (Bates et al., 2019; He and Zhang, 2023; Liu and Schauer, 2026). However, studies using this assay have reported contrasting and inconsistent results regarding health outcomes compared to those using OP-DTT (Liu and Schauer, 2026). Differences in the chemical species and redox pathways captured by each assay, as well as significant variability in experimental protocols may partly explain these discrepancies. Consequently, and in the absence of epidemiological evidence for a more health-relevant metric, the use of complementary assays is recommended, and the harmonization of protocols is urgently needed.
As part of a joint effort between ACTRIS-EU and RI-URBANS, this ILC study introduces a proposition for a harmonized OP-AA standard operating procedure. The ILC evaluates the capacity of the scientific OP community to implement the protocol and identifies the key parameters that must be strictly controlled to improve reproducibility and comparability. By assessing both intra- and inter-laboratory variability, using a common protocol on identical samples, this work provides valuable insights for the global standardization of OP measurements.
2.1 Inter-laboratory comparison organization
From 6 December 2024 to 17 January 2025, a call for participation was shared via email with the members of the ACTRIS NF Forum, ACTRIS Community, RI-URBANS task members, and participants to the OP-DTT ILC by the Institute of Environmental Geosciences (IGE, CNRS/University Grenoble Alpes/IRD, France, organizer of the present ILC). The call outlined the primary goal of the exercise, i.e. comparing OP-AA results from a simplified protocol applied by each group. A secondary objective was proposed to compare results from the simplified protocol with the “home” protocols of each participant. Finally, participants could optionally perform the RI-URBANS' OP-DTT SOP (Standardized Operation Procedure) (Dominutti et al., 2025) on identical samples. Each interested group had the opportunity to provide information regarding: (i) their available laboratory conditions, in order to tailor the protocol as closely as possible to the available technical capacities of each group; (ii) when applicable, their “home” OP-AA protocol details, in order to test the different parameters prior to defining the simplified protocol.
2.2 OP-AA SOP
OP-AA assay relies on the kinetic measurement of the depletion (oxidation) rate of AA by the sample to be tested (following its absorbance at 265 nm) when a solution containing AA is reacting with a PM extract, or a reference solution. The reaction can take place in a cuvette or a 96-well plate, containing a known volume of sample, with measurements being made at regular intervals from “time zero”, i.e. when the AA solution is introduced in the PM extract solution. The slope of the AA depletion over time is then used to determine OP-AA, with varying calculation approaches being reported, such as calibration-curve or concentration-based approaches (Souza et al., 2025). The literature and the ILC participants reported technical differences at various stages of this general analytical protocol. The three following aspects were tested since they were considered the most important by the participants: (i) the choice of the combination of extraction fluid for the PM sample and solvent for AA solution, (ii) the impact of AA to PM concentrations ratios () in the reaction medium, (iii) the impact of the filtration of the PM extract. A brief description of each test and the associated results is provided in the supplements (Sect. S1 – Figs. S1–S4 in the Supplement). After comparing these different parameters, the protocol was harmonized and simplified into a final “Simplified AA-Protocol” called hereafter the SOP. The detailed protocols were adapted for cuvette-based spectrometers and for plate-readers. It was then updated for publication to provide a harmonized version that includes participants feedbacks (Marsal et al., 2026). Briefly, the extraction was performed in a potassium phosphate buffer (K-PO4) solution at 37 °C, during 75 min. AA was prepared in ultra-pure water, and the PM extracts were not filtered prior to their analysis. If possible, each filter sample had to be extracted three times, and each extraction had to be measured in triplicate. For each analytical batch, a 6-point calibration curve had to be performed by diluting an AA solution (240 µM in water) with K-PO4 buffer to maintain pH 7.4 and minimize pH-dependent drifts in AA absorbance. Triplicate analyses of the K-PO4 buffer were also used as negative controls (or reagent blank) for AA background oxidation in the extraction matrix.
Participants were provided with an Excel spreadsheet to document the technical conditions used for both the SOP and their “home” protocol, as well as the time and absorbance values for each sample. OP values were then calculated based on the calibration curve using Eq. (1).
Where V is the total solution volume (AA + extract), At is the absorbance at each time point, Amat is the absorbance of the matrix (before introducing AA), and a and b are the slope and the intercept of the calibration curve, respectively. OPslope was then corrected for background oxidation, subtracting the average OPslope of the negative controls, and divided by the mass of PM in the well (µg, OPm in ). OP can also be expressed per unit of volume of air sampled (OPv, ), by multiplying OPm with the PM mass concentration (µg m−3). OPm was used for performance evaluation.
2.3 Samples and reagents
For OP of PM, punches (tempered steel, 0.5 cm in diameter) of impacted or blank quartz fiber filters were provided to the participants in labeled Petri dishes protected from light with aluminum foil (4 samples, named A, B, C, D). Based on participants' declaration regarding their instrument (i.e. plate-reader or cuvette-based spectrometer) and the protocols they intended to follow (i.e. whether they were to apply their “home” protocols), the organizer provided enough filter punches to be able to perform the declared number of extractions (final number of punches in each Petri dish ranging from 3 to 36). Samples A–D were from quartz fiber filters (Tissuquartz PALL QAT-UP 2500, 150 mm diameter) selected to cover a wide range of OP-AA and to be representative of different environments. Namely, sample A was a 72 h ambient PM10 filter collected on the roof of the organizer's laboratory from 14 to 17 February 2025 (Digitel DA80, 30 m3 h−1), representing an urban background typology potentially influenced by biomass burning. Sample B was a calcined filter (500 °C for 8 h) placed in the close proximity of sample A during the entire sampling period. It represents a field blank. Sample C was a 24 h filter sampled from 9 to 10 November 2024 in an urban-background site in Lyon, France, and sample D was a 24 h filter sampled from 4 to 5 September 2024, at a traffic site in Grenoble, France. Samples A, C, D were calcined prior to sampling. Both samples C and D were sampled using a Digitel DA-80, and provided by Atmo-AURA, the local regional air quality monitoring association. OP was also determined with a commercially available transition metal solution made of copper sulfate (CuSO4, sample EF2). With the exception of the field blank (sample B) and sample EF2, participants had not been informed of the samples' characteristics.
Sample EF2 (CuSO4. 5 H2O, ≥ 99 %, CAS: 7758-99-8, Roth) and AA (≥ 99 %, CAS: 50-81-7, Roth) were provided in 15 mL conical polypropylene black tubes (Heathrow Scientific), with each tube containing about 1 g of powder. Finally, 3.13 g of KH2PO4 (≥ 99 %, CAS: 7778-77-0, Roth) and 13.41 g of K2HPO4 (≥ 99 %, CAS: 7758-11-4, Roth) were provided in 50 mL transparent polypropylene tubes (Rotilabo®), to prepare the extracting solution.
2.4 Transport of samples
Samples and reagents were sent to the participants in polyfoam boxes with three ice-packs and a temperature tracker (EL-CC-1-002, Lascar). The initial mean temperature among all shipments was −1.5 °C. The packages were sent on 24 March 2025, and reached the participants within an average of 2.4 ± 2.5 d (from 0.8 to 10.6 d). Participants had until 16 May 2025, to report their results. The temperature of the packages during the transport did not exceed 20 °C for more than 5 h, with the exception of two cases that also had longer transit times due to customs formalities (laboratories 8 and 13, respectively 9.8 d of transit and 3.0 d above 20 °C and 10.6 d of transit and 3.8 d above 20 °C). Analyses were performed within 1–45 d after package reception, with 54 % performed in less than 15 d.
2.5 Data evaluation
Participants reported for each sample data (i.e. three replicates from three extracts) from: (i) OP-AA SOP and AA “home” protocols if available, in units of OP , , and %-decay of AA, (ii) OP-DTT SOP (ILC1), if applicable, and (iii) the temperature record during the shipment. However, the high variability in the OP-DTT results hindered the evaluation of the OP-DTT SOP results, and the comparison of both OP methodologies. The data evaluation – encompassing the assessment of sample homogeneity and stability, and laboratory performance, and analysis of the variance (ANOVA) – was conducted by the European Commission Joint Research Center (JRC), for an independent evaluation, in accordance with the ISO 13528:2022 requirements (investigated in Sect. 3.2).
The laboratory performance was assessed using z-scores which measured the laboratory bias compared to an assigned value associated with its standard deviation. As ambient PM collected on filters was used as ILC samples, and in the absence of a suitable certified reference material for atmospheric PM OP, the true values of OP were not known. Among the available methods for determining the assigned value, the approach of the consensus value from participants to this ILC was chosen. With this approach, the assigned value X for each sample is the robust average calculated, using the Q/Hampel method, from all results reported by each participant (ISO 13528:2015 (E) par. C.5.4). The standard deviation for proficiency assessment was fixed at 20 % of the assigned value. This value is in accordance with literature estimations of uncertainties for OP-DTT analysis (Molina et al., 2020) and OP-AA variations (Fang et al., 2016). For each participant and sample extract, the z-score was calculated following Eq. (2).
Where xi is the average of the three replicates of a single extraction (i.e. three z-scores per filter sample and one z-score for sample EF2), and X is the assigned value of the sample.
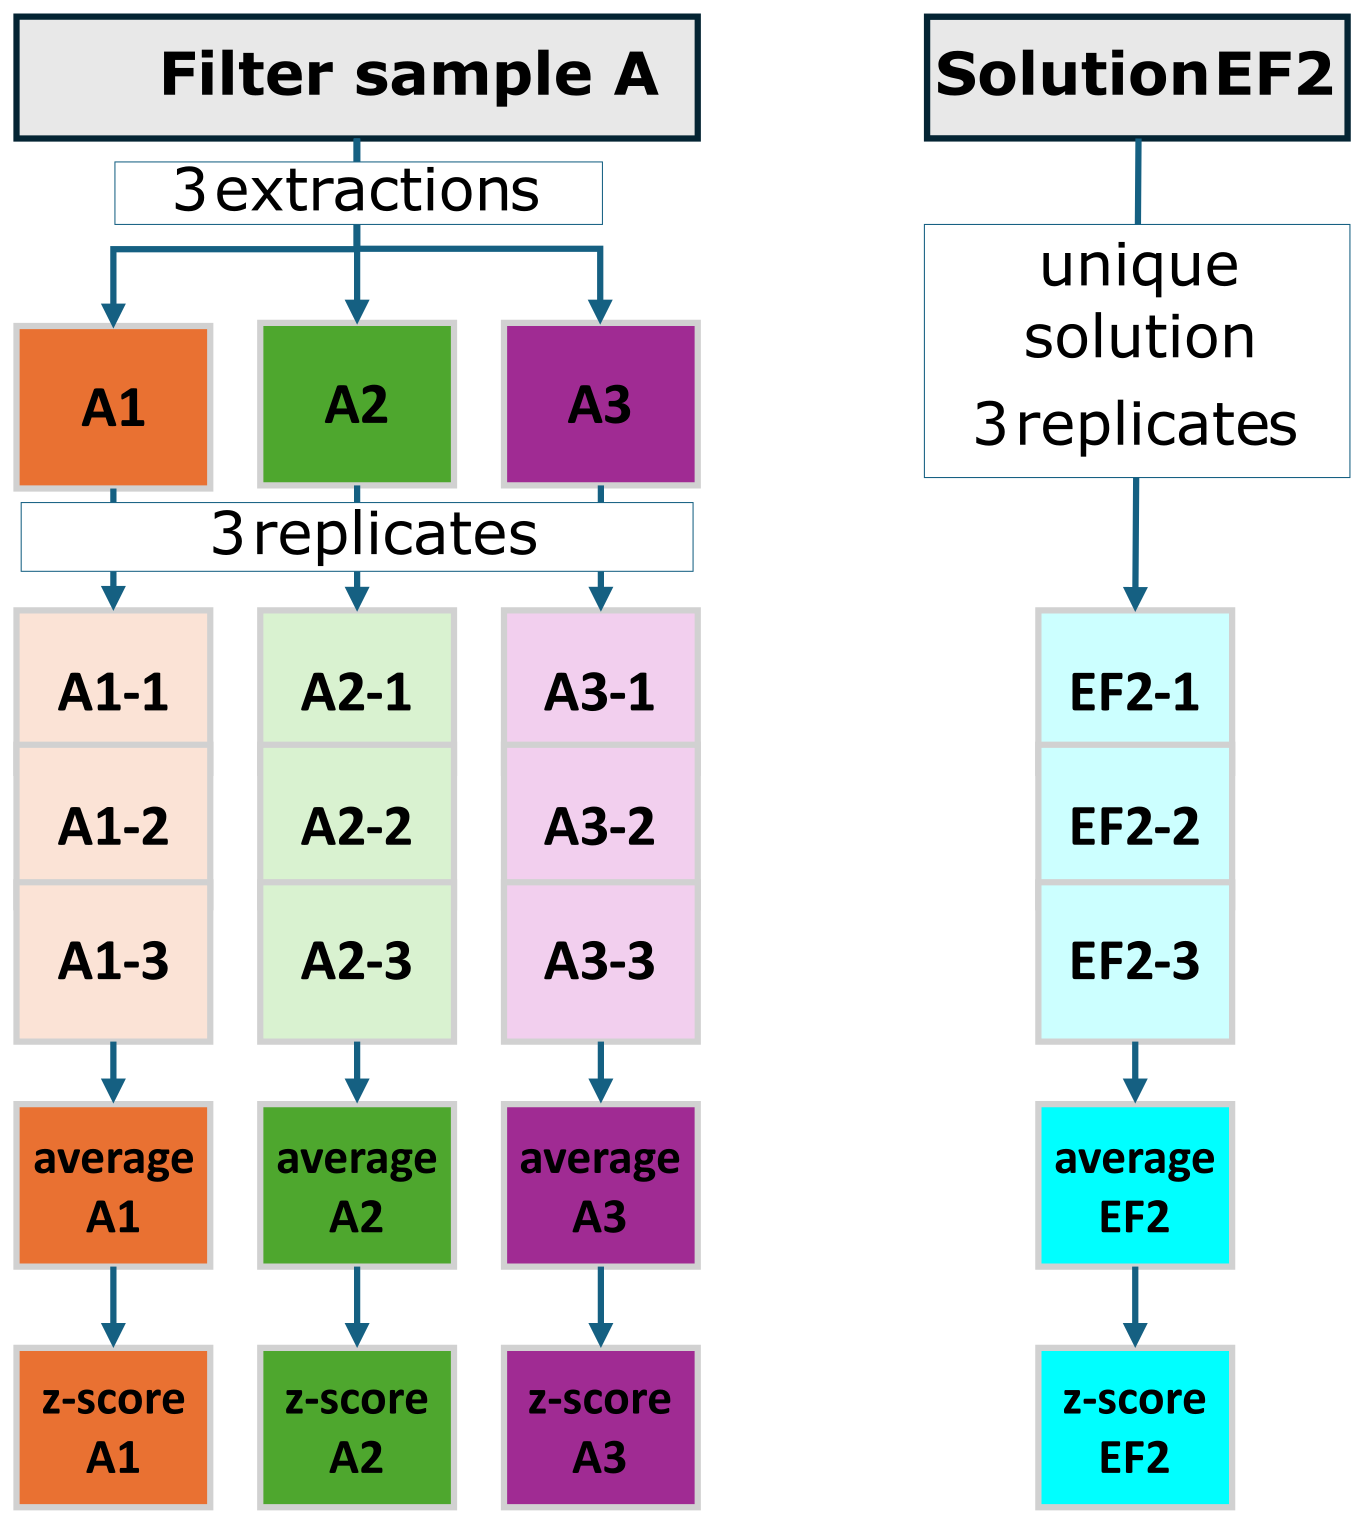
Figure 1Detail of the analytical procedure and z-score calculation for filter samples (exemplified with sample A) and for the solution sample EF2.
Additionally, a three-level nested analysis of variance (ANOVA) was performed to decompose the total variance of OPm into three components: repeatability (the variability between the three replicates of the same extract), extraction (the variability between the three extracts of the same sample produced within the same laboratory), and the inter-laboratory variance (systematic differences between the laboratories). Only laboratories that provided a complete set of replicates and extracts were included in the ANOVA. Finally, the blank sample (sample B), was excluded from the z-score calculation and variance decomposition analysis due to the absence of meaningful assigned value or standard deviation. This sample was instead considered separately as a diagnostic sample to assess procedural variability near detection limits.
Finally, a sensitivity analysis was conducted on a subgroup of participants, determining their performances after recalculating OP using a concentration-based approach (Eq. 3).
Where V is the solution volume, [AA]0 is the initial AA concentration (nmol L−1), A0 is the absorbance values for samples at time zero, Amat is the absorbance of the matrix (before introducing AA), and At is the absorbance value measured at time t. The subgroup was defined based on the difference between the theoretical ([AA]th) and the calibration-derived AA concentration at time zero in the negative controls ([AA]0). [AA]th was fixed at 133 µM from the protocol, and recalculated using the exact masses and volumes of AA used by each participant. [AA]0 was calculated using the absorbance read at time zero and using the calibration curve of the day, and was then corrected for matrix absorbance. Participants were categorized based on a 10 % range around [AA]th, “outside of range” laboratories defined as those that calculated [AA]0 with the calibration curve below 120 µM or above 146 µM (n=11).
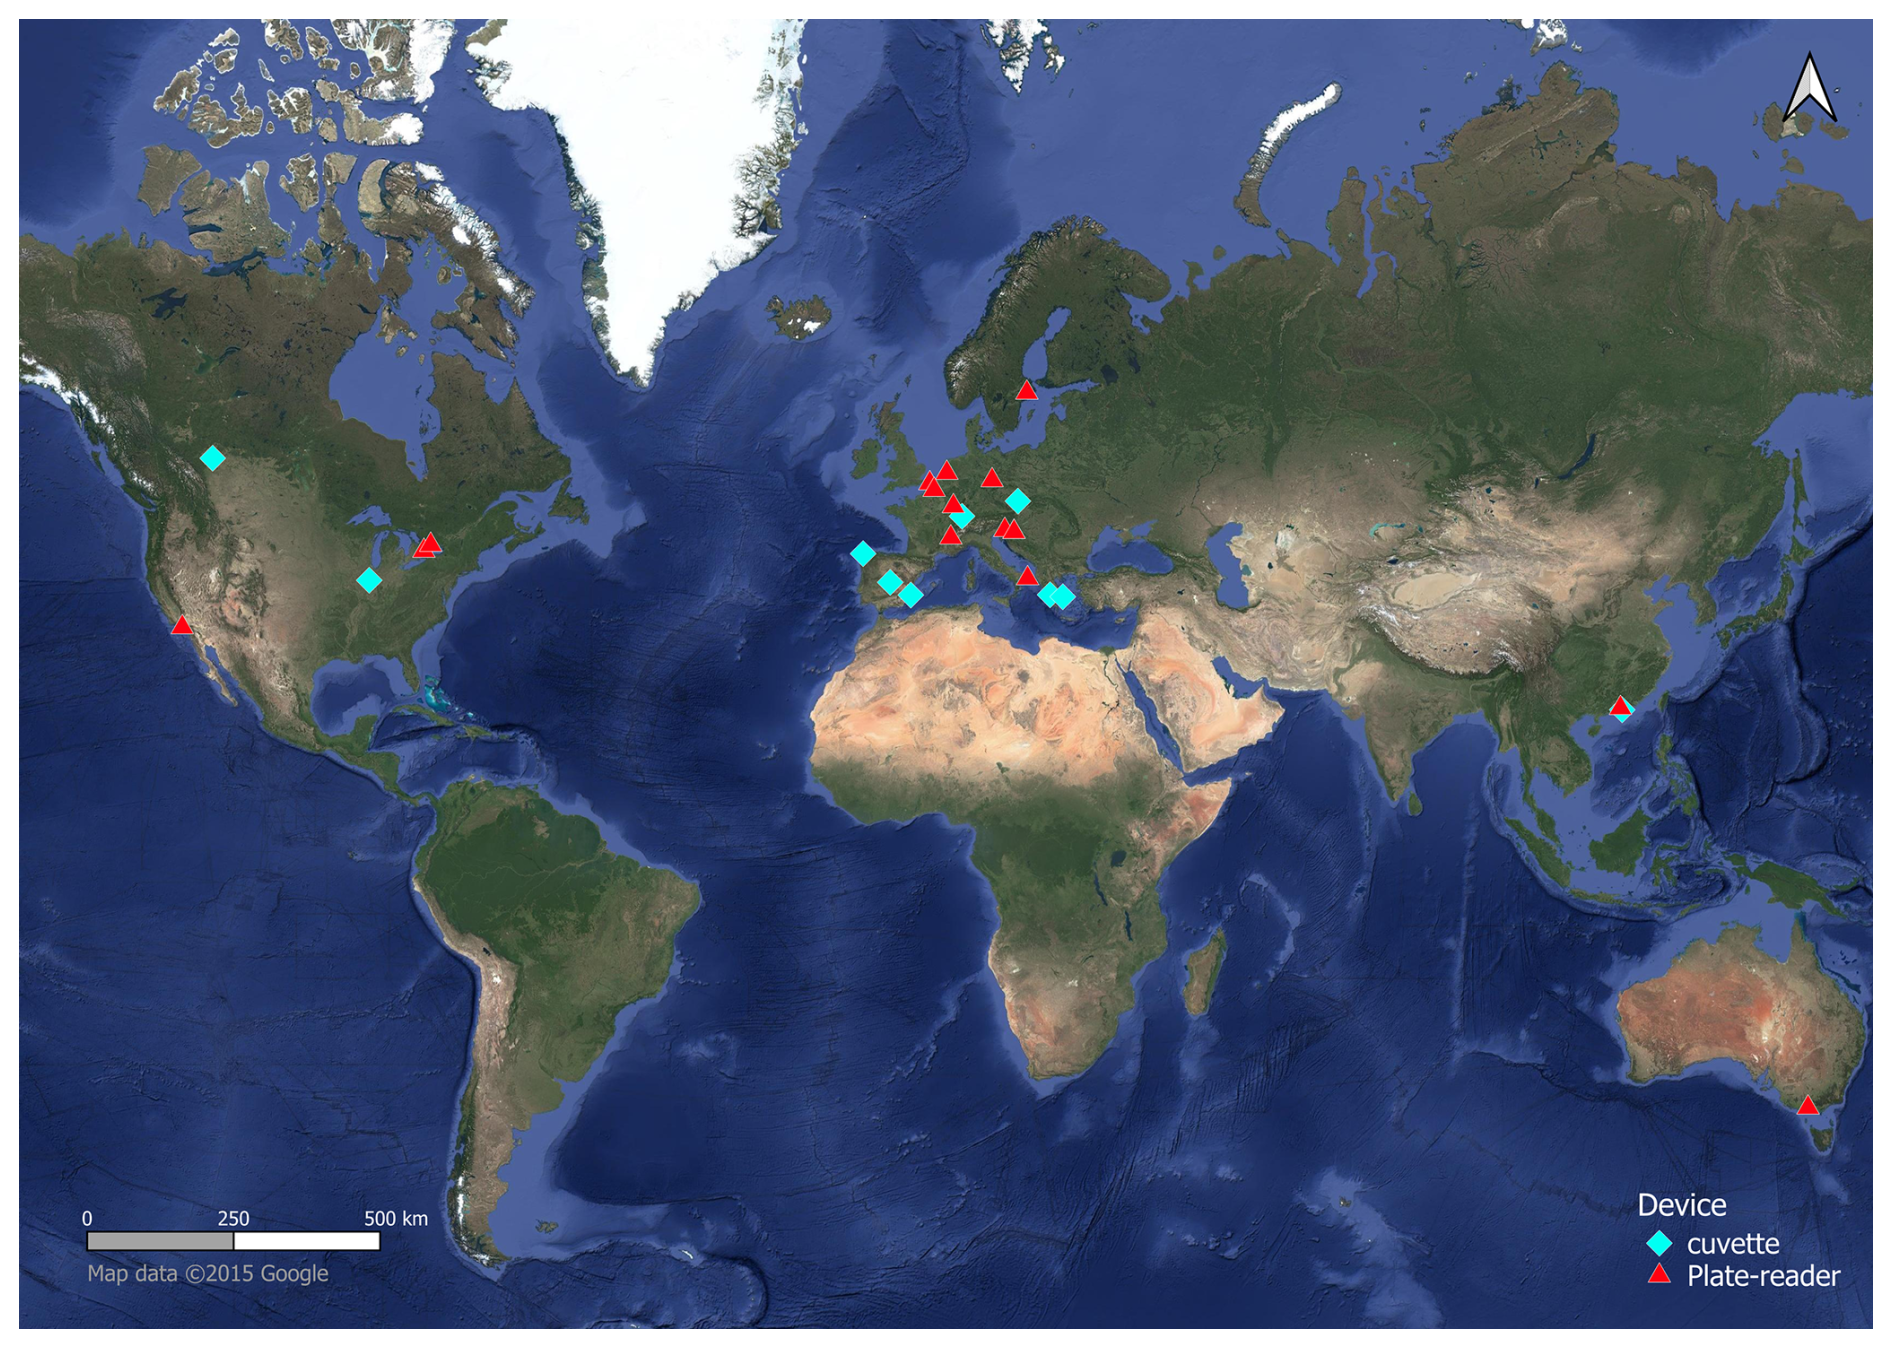
Figure 2Global distribution of participants. Blue stars represent participants using cuvette-based spectrophotometers and red stars the participants using plate-readers.
3.1 Exercise description
A total of thirty groups expressed interest in taking part in the inter-laboratory exercise in the initial questionnaire, out of which twenty-six finally reported results for the OP-AA SOP. Participants originated mostly from the European region (eighteen) and from North America (two from the United States of America, and three from Canada). The other groups were from Australia, China, and Hong Kong (Fig. 2). Sixteen participants used a plate-reader spectrometer, and ten used cuvette-based spectrometry.
3.2 Filter homogeneity, stability, and conservation assessment
Each participant received punches from the PM filters. Consequently, it was essential to verify surface homogeneity of filters sampled under the same conditions to evaluate possible impacts on OP values. The assessment was conducted by the organizing laboratory and prior to the circulation of the samples by randomly punching a dedicated filter sample in order to perform 18 different extractions, and running the organizer's “home” protocol with triplicate analysis for each extraction solution (Fig. S5A in the Supplement). The homogeneity was calculated as the estimate of the between-sample standard deviation, calculated using the analysis of variance, according to ISO 13528:2022 (E) Annex B, par. B.3. Results indicated a homogeneity better than 4 %.
The stability of the samples was assessed to evaluate possible impacts of temperature conditions over the duration of the transportation. Prior to sample transportation, shipment conditions were simulated to estimate the chemical stability of PM filters to be sent to participants. Punches of the same filter, sampled under similar conditions to the PM filters used for the ILC were placed in two different Petri dishes. One dish was stored in the fridge and the other was kept in a polyfoam box with ice packs. The organizer's “home” protocol was then performed at days 0, 3, 6, 10, and 15. Stability was then assessed using a paired t-test (with a 99 % threshold), comparing the mean difference between the OP-AA results on each day with the initial day. This experiment showed no statistically significant difference in OP-AA levels across all the tested days as compared to the initial day with a 99 % confidence level (Fig. S5B in the Supplement). This finding underscores the stability of PM OP-AA under these specific conditions and duration.
The storage stability of the samples throughout the ILC period was further evaluated by performing the OP-AA SOP weekly for eight weeks (3 replicates per sample and per week). Again, this procedure was performed on actual punches from the samples A to D, yielding coefficients of variation ranging from 3.6 % to 6.5 %, with a maximum reached for sample A. This result demonstrated that the time elapsed between receiving the shipment and conducting the analysis results in only negligible variations between the participating laboratories, as long as the instructions of keeping the samples under refrigerated conditions are followed. Following the guidelines outlined in ISO 13528:2022, the homogeneity, stability, and conservation of the samples were assessed. These evaluations demonstrated that sample heterogeneities and aging had only a negligible impact on sample OP values over the course of the ILC.
3.3 OP-AA SOP: sources of variance
All laboratories followed the OP-AA SOP. Each participant reported nine results per filter sample, and three values for sample EF2. This was the case for all, except three laboratories: one was only able to perform one extraction for samples C and D, one was not able to analyze sample D, and another laboratory had one missing extract replicate for sample A. Sample B was only included in the investigation of the method's sensitivity. All laboratories were considered in the performance assessment and statistical analyses, even when some data were missing.
Table 1Variance decomposition into repeatability variance, extraction variance, and between-laboratory variance.
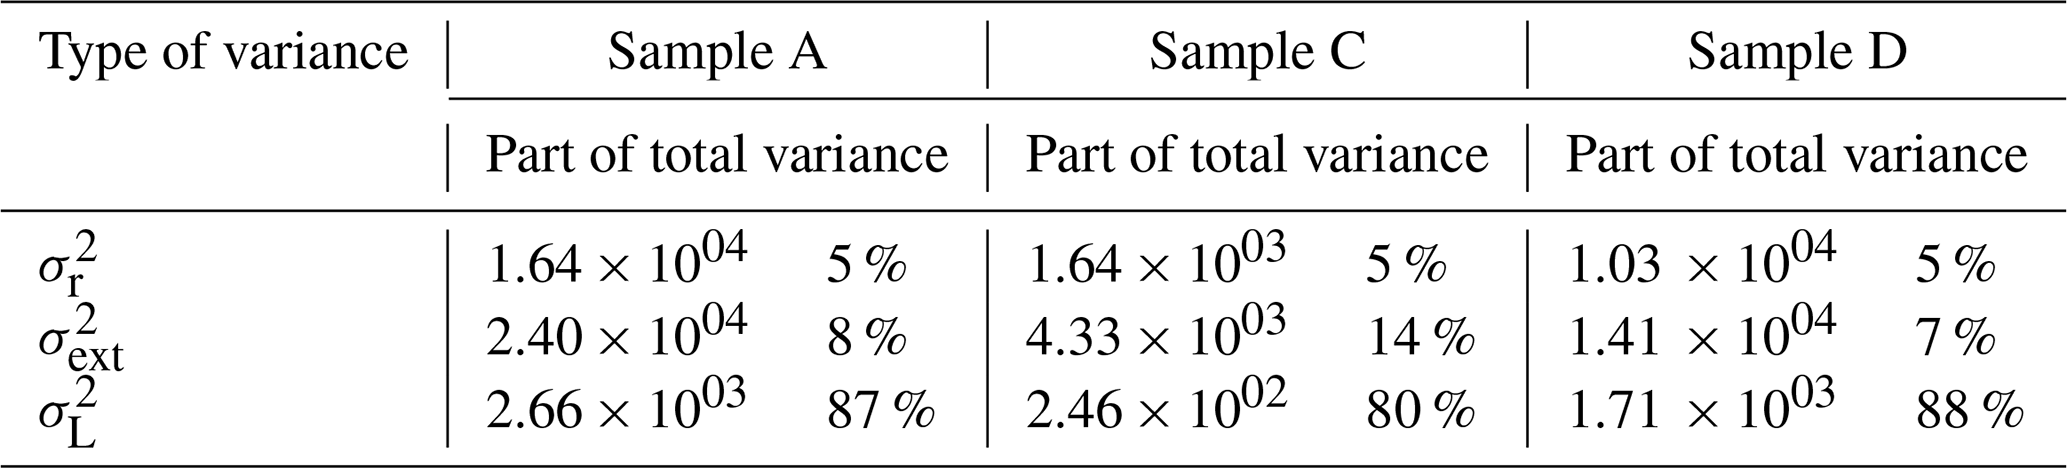
Note: – repeatability variance or residual error (variability between the three replicates of the same extract); – variability between the three extracts produced per sample within the same laboratory; – systematic differences between the different laboratories. Only laboratories with all replicates and all extracts considered for variance decomposition: Sample A – exclusion of labs 2, 3, 13, 16, 22; Sample C – exclusions of labs 13, 16 and 25; Sample D – exclusions 4, 5, 13, 16, 20 and 25.
As sample EF2 was a chemical solution, unaffected by sample extraction, it was used as a primary indicator for laboratories' repeatability. The relative standard deviation of the triplicate analyses across individual laboratories ranged from 0.47 % to 9.2 % (mean of 3.5 %) after the exclusion of a single extreme outlier (987 %). This denotes a very good repeatability for a sample subject to minimal procedural variability, primarily affected by solution preparation. Table 1 reports the results of the overall variance decomposition into the repeatability, the extraction, and the inter-laboratory variances. The repeatability for triplicate measurement was better than 5 % for all filter samples (A, C, D), which is consistent with the results of sample EF2. This shows that the variability in the results is consistent when the analysis of an extract is repeated, even for samples of different natures undergoing an extraction step. The extraction variance accounted for 7 %, 8 %, and 14 % of the total variance for samples A, D, and C, respectively. This indicates that the extraction step has a greater impact on results' variability than the intra-laboratory analytical part of the protocol (repeatability), particularly in the case of sample C. Therefore, sample C may be more sensitive to extraction operating parameters, such as temperature, agitation rate, or the K-PO4 volume used for the extraction. This sensitivity could be caused by the extract concentration of 10 µg mL−1, that could be less reproducible than concentrations of 25 µg mL−1 (performed for samples A and D). Sample C could also have a chemical composition leading to this higher variability, with species that would be less water-soluble, complexed by the phosphate buffer extracting solution, or with different dissolution rates. Finally, the results showed that differences between the laboratories (inter-laboratory variance) accounted for the largest share of the total variability, representing more than 80 % of the overall variability. This demonstrates that the key challenge for OP-AA harmonization remains the strict application of the analytical procedure itself. The most important factors influencing inter-laboratory variability may be linked to the AA consumption rate calculation (related to the linear regression and repeatability) and to volumetric operations (e.g., pipetting steps). These factors were reported to be the main drivers of uncertainty in OP-DTT measurements (Molina et al., 2020). The provided OP-AA protocol was intended to minimize both aspects by: (i) using 6–11 points in the linear regression, that gives the possibility to exclude outliers, and, (ii) the general recommendation of using a high-precision balance for volumetric operations linked to solution preparation. Some uncertainties could remain in the volumetric operations linked to the reaction part of the protocol (i.e. extract and reagents pipetting steps), that could be reduced by using automatic pipettes for sample handling and automatic injectors for reagents handling.
Other parameters that can vary between participants and are known to influence OP reactions are linked to laboratory conditions, including the use or not of a laminar flow hood, control of the lab temperature, temperature stability during the reaction step, or lab workers experience. Finally, the organizer recommended to purchase commercial HPLC-grade water in case of any doubt concerning water quality, to control for variation in this parameter. Four participants chose this option, and they did not obtain significantly better z-scores than the others. The other participants all reported water conductivity respecting ultra-pure requirements (18.2 MΩ cm). However, their total organic carbon values were either unknown or varied, which could also lead to some variability, and to systematic error. Overall, the fact that the inter-laboratory variability strongly exceeds both repeatability and extraction variances emphasizes that differences remain despite the use of a common protocol. This highlights the need for each participant to carefully control their experimental conditions.
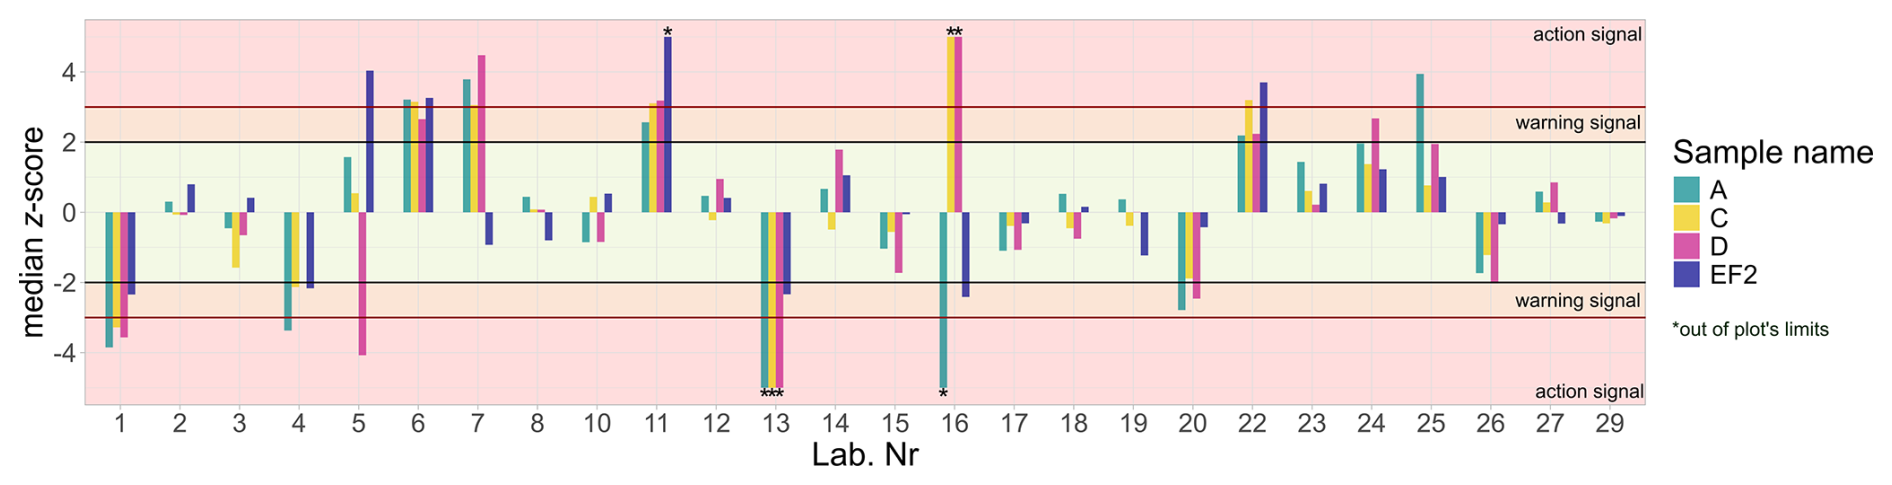
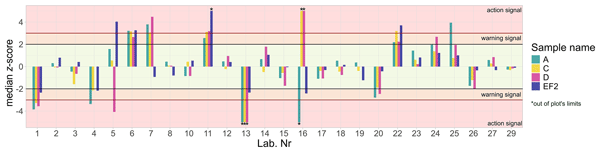
Figure 3Evaluation of participants' performance in the inter-laboratory comparison, with representation of median z-score per sample. Results were cropped at ≤ 5, and stars represent bars that exceed this value. Assigned values were 0.1210, 0.4674, 0.1047, 78.49 for samples A, C, D, EF2, respectively.
3.4 OP-AA SOP: Comparison of the laboratory performances
3.4.1 General description
For samples A, C, D and EF2, the laboratory performances were evaluated as the deviation from the assigned value (Fig. 3, assigned values of 0.1210, 0.4674, 0.1047, 78.49 for samples A, C, D, EF2, respectively). The results were considered satisfactory if −2 ≤ z-score ≤ 2; in the warning zone when 2 < < 3 and in the action zone if ≥ 3.
Z-scores for each extract of each sample are presented in the Supplement (Figs. S7 to S9 and Table S2). In addition, a median z-score (Fig. 2) was calculated for each sample and each participant to provide an overall indicator of laboratory performance. In total, 14 laboratories (54 %) have median z-scores for all 4 samples within the satisfactory interval. Two laboratories have mixed results falling both in the satisfactory and warning zones. Another group of 10 laboratories have at least one sample with an action signal. No participant had an action signal across all samples. However, one participant (laboratory 16) reported an issue with the provided AA reagent, resulting in significant discrepancies from the assigned value for all filter samples.
Samples A and D exhibited the greatest variability, with z-scores ranging from −26 to 20 and from −19 to 27, respectively. However, for both samples, a high number of laboratories obtained satisfactory results for all 3 extracts (n=12 and n=11 laboratories, respectively). Sample C showed slightly less variability, with 15 laboratories obtaining satisfactory results for all extracts, and z-scores ranging from −6 to 25. Finally, 18 laboratories obtained satisfactory z-scores for sample EF2, which also had the smallest range of z-scores (−2 to 7), consistent with the fewer technical difficulties presented by this sample. Overall, the distribution of results does not show a pattern of systematic over- or underestimation for any of the samples considered. Some participants followed clear patterns towards one direction for all samples, which suggests that specific deviations from the protocol could systematically draw results in one direction. There are not enough participants in this category to identify these deviations, but water quality or temperature of the lab, of the extraction or of the reaction could be sources of systematic errors. Participants with an action signal and with such patterns across samples should carefully examine their practices to try to identify the deviations from the protocol that could have led to these results. In particular, considering that sample EF2 is not affected by the extraction step, participants falling outside the satisfactory zone for this sample should carefully examine the other aspects of their manipulation such as volumetric operations, temperature, water quality, and calibration.
The z-score categories (i.e. satisfactory, warning signal and action signal) of the participants were compared between those who took part in the previous OP-DTT ILC1 (n=16 who participated to both ILC1 and ILC2) and the “new” participants (n=10). There were no statistical differences between the two groups, regardless of the sample considered (Table S3 in the Supplement). However, more participants obtained satisfactory results for all extracts of all samples in the OP-AA ILC. Indeed, a total of 9 participants (35 %) obtained satisfactory results for all extracts of all samples (i.e. 10 z-scores in the satisfactory ranges, Figs. S7–S9 in the Supplement). However, only 5 (25 %) had satisfactory results for all samples in the OP-DTT ILC, although the latter encompassed a total of 3 extracts (i.e. 3 z-scores in the satisfactory range). While important differences remain across the results, participants in this ILC tend to produce generally promising results, with most z-scores falling within the acceptable range and no evidence of systematic bias.
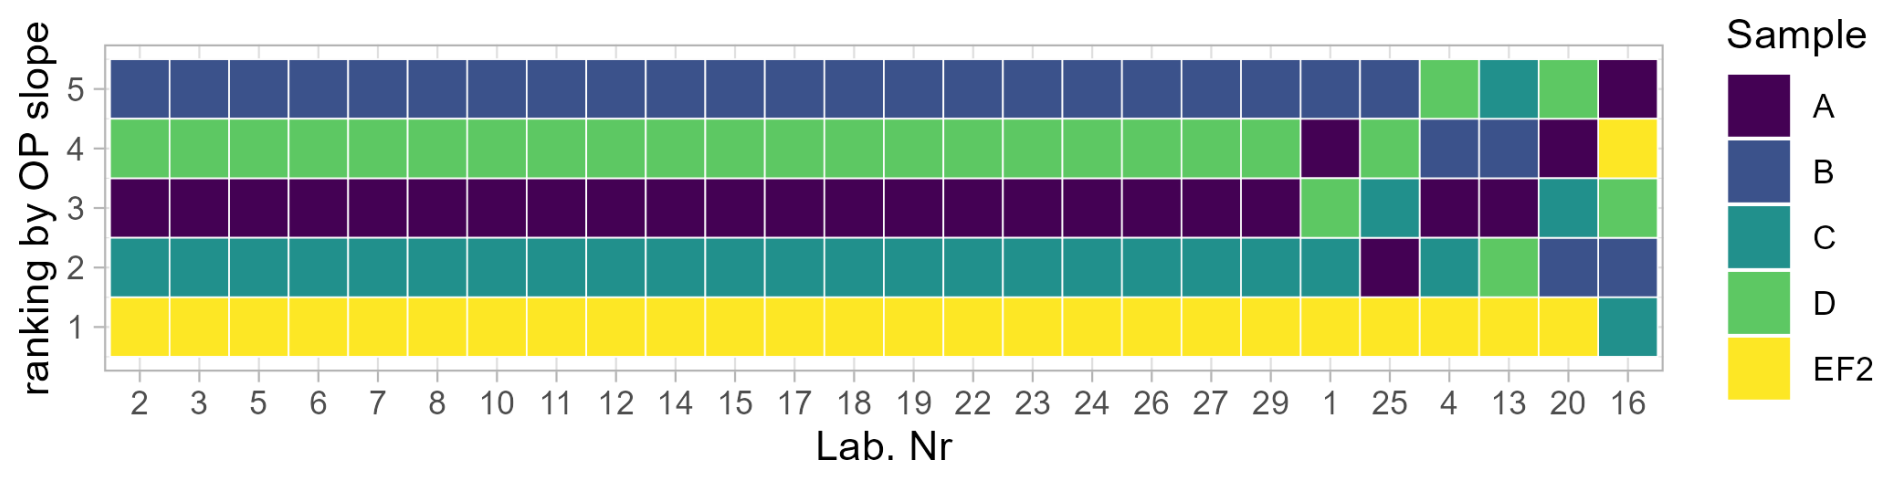
Figure 4Sample ranking with respect to OP slope for each participant, with 1 being the sample giving the highest OP and 5 the sample giving the lowest OP (in ).
Finally, the consistency of sample rankings was examined to determine whether the laboratories accurately captured the relative differences between the samples' slopes (), even when absolute deviations from the assigned values were observed. As shown in Fig. 4, 20 participants (77 %) reproduced the expected ranking (EF2 > C > D ≈ A > B), suggesting that despite variability in absolute values, the analytical procedures generally preserved the relative OP levels across samples.
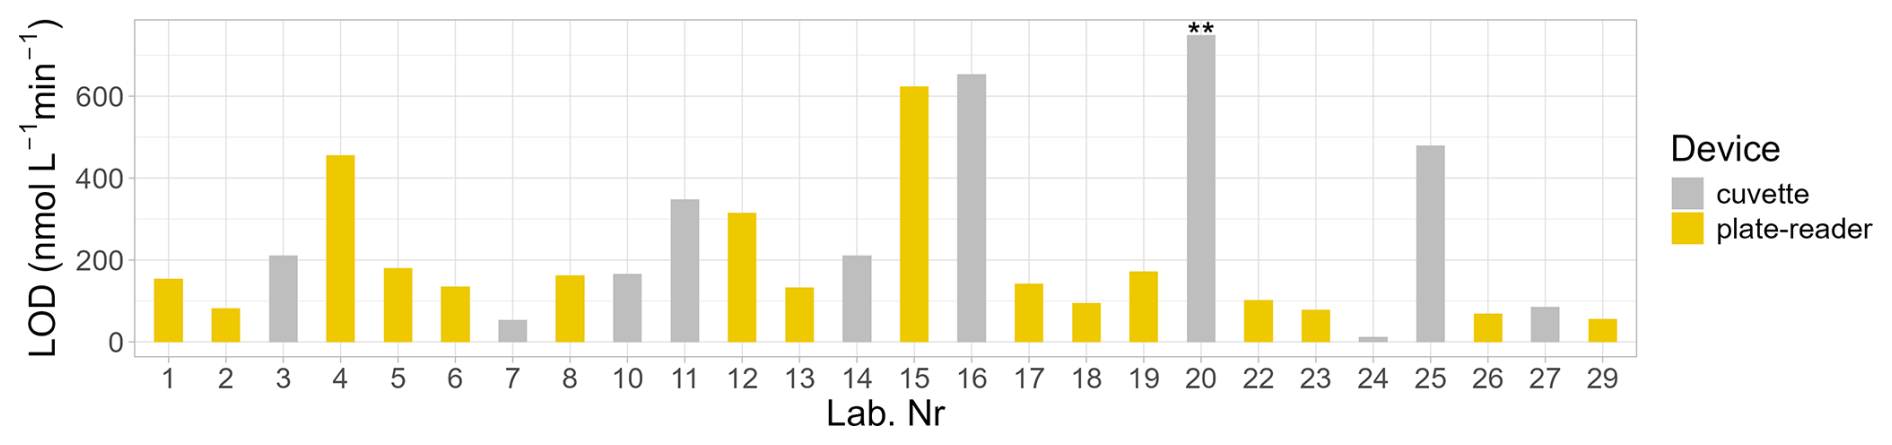
Figure 5Theoretical limits of detection based on an outlier-excluded standard deviation in sample B. Results were cropped at LOD ≤ 750 , and stars represent bars that exceed this value.
3.4.2 Methods' sensitivity
Since sample B was a blank filter, its variance is dominated by procedural and analytical noise, including the effects of sample preparation and instrumental factors. This sample was prepared under conditions representative of the average extraction conditions for samples extracted at 10 or 25 µg mL−1. The extraction volume-to-filter surface area ratio ranged from 6.6 to 13.2 mL cm−2 for samples D and A, respectively, resulting in an average ratio of 10 mL cm−2 for sample B, i.e. 2.00 mL for one 0.2 cm2 filter punch. First, sample B was used to calculate a theoretical limit of detection (LOD) and laboratories' performances were evaluated with regard to this value and whether other samples would have been flagged as below LOD. The LOD for each participant was calculated as LOD=3σB with σB the standard deviation of OPslope for samples B in the 3 replicates of 3 extractions (n=9). A maximum of 3 outliers were removed from each set of results, and at least the 6 most reproducible results were kept (Fig. S11 in the Supplement). Participants using plate-readers had LODs () similar to participants using cuvettes (Fig. 5). Therefore, the percentage of samples below the LOD was similar in the two groups, with 19 % (i.e. 3 out of 16) vs. 20 % (i.e. 2 out of 10) in the plate-reader users vs. cuvette users for sample A, 6 % vs. 20 % for sample C, 13 % vs. 20 % for sample D and 0 % vs. 10 % for sample EF2. Participants in the satisfactory z-score zone did not tend to have lower LOD as compared to participants in the warning or action zones (Table S5 in the Supplement) for any of the samples, suggesting that z-scores were not influenced by laboratory-specific sensitivity. This conclusion was not modified when using all of sample B's replicates for LOD calculation (Fig. S12 in the Supplement). The observed similarities suggest that the two methods are equivalent under low signal conditions or low-volume samples.
3.4.3 Influential parameters
In addition to being investigated a priori and during the ILC exercise by the organizer, the influence of some of the variables on z-score values was also investigated a posteriori, using participant-reported data. The investigated parameters can be separated into two categories: technical variables (device i.e. cuvettes or plate-reader, transport time, time before analysis and package temperature), and analytical variables (average slope of the negative control and AA concentration at time zero). Among the technical variables, package temperature was continuously logged during shipments, but the high correlation between the maximum temperature reached and the transit time (ρ > 0.7, Fig. S6 in the Supplement) prevented both parameters from being included in a multiple regression model. The device was only investigated by comparing results obtained using cuvettes vs. plate-readers, but there exist differences between plate-readers that could not be investigated, such as the duration of the spectroscopic measurement. Other technical parameters were already described above.
The investigated analytical variables can be influenced by both systematic and random deviations, such as the instrument model or stability, the calibration accuracy, the water quality, or protocol compliance. The average slope of the negative controls is subtracted from the samples' slopes to remove matrix effects due to AA background oxidation in K-PO4 buffer. Participants had to analyze one negative control in triplicate per analytical series. This resulted in some participants analyzing the negative control once (plate-reader users), and others up to 6 times. Three laboratories obtained extreme averages ± standard deviations in the negative controls' slopes of −3177 ± 6359 nM min−1, 2992 ± 18 nM min−1, and 4056 ± 27 nM min−1, the latter two obtained by participants using plate-readers. The negative value was obtained by the participant who reported a problem with the provided AA reagent (Lab. 16). Surprisingly, one of the participants with extreme positive slopes obtained satisfactory results for two samples, even though the negative controls were used in samples' slopes calculation. The deviation of sample B's slope from the average slope of the negative controls (Fig. S10 in the Supplement) ranged from −284 % to 328 %, with a median (25th percentile, 75th percentile) of 2 (−26, 26) %. This suggests that for most participants, the filter blank introduced a marginal effect as compared to the laboratory-dependent conditions. The median (25th percentile, 75th percentile) in the negative controls' slope among all participants was 490 (196, 774) nM min−1, showing a relatively high variation in this parameter (Table S4 in the Supplement), which participants should try to understand and minimize prior to launching series of analyses.
Table 2Contingency table of z-scores and AA concentration at time zero in the negative controls.
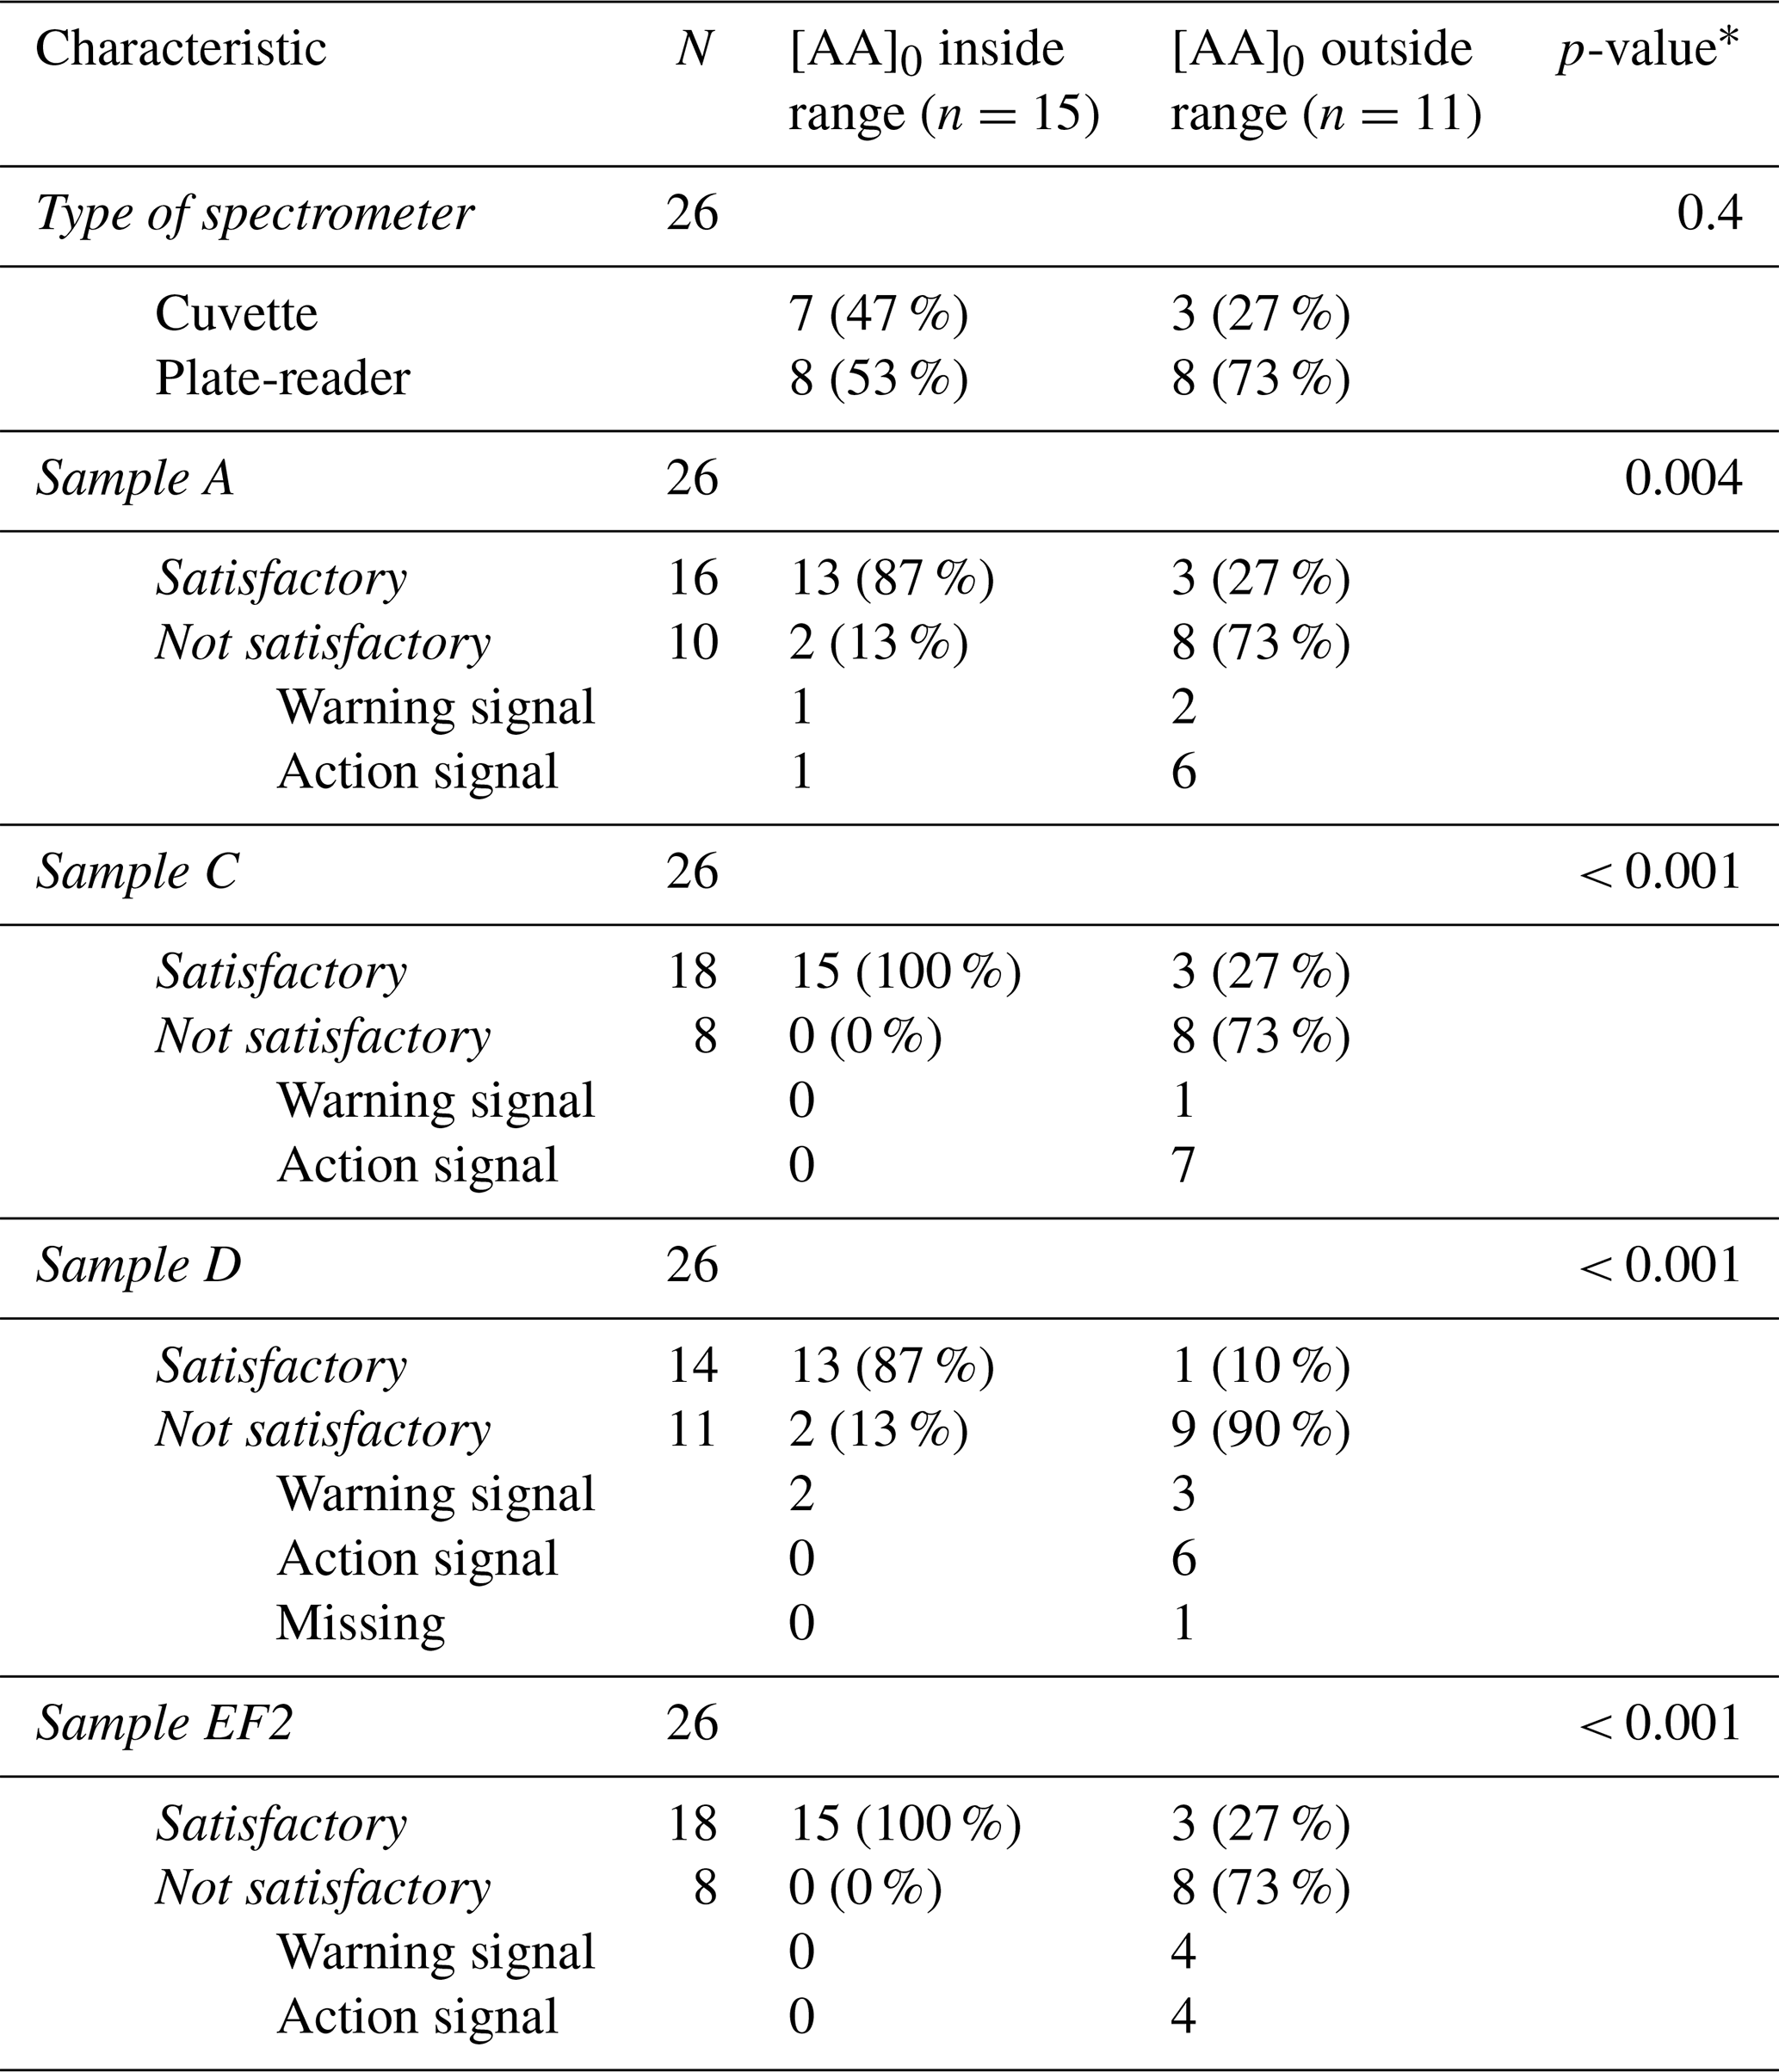
∗ Fisher's exact test for the difference between counts of types of spectrometers or between satisfactory and not satisfactory z-scores. Note: “outside of range”, defined as below 120 µM or above 146 µM.
The AA concentration at time zero in the negative controls [AA]0 was compared to the theoretical AA concentration [AA]th of 133 µM. Participants obtained [AA]0 ranging from −421 ± 2 to 12511 ± 10 275 µM, but with median (25th percentile, 75th percentile) over all participants of 130 (124, 136) µM, indicating general agreement between [AA]th and [AA]0. Participants with [AA]0 outside the theoretical range may have experienced instrument drift, fast degradation of AA throughout the analytical period, matrix absorbance (i.e. prior to AA injection) of the same magnitude as the absorbance at time zero (i.e. just after AA injection), or errors in the calibration curve or pipetting steps. These issues were suggested in the raw results of some participants but no single parameter could clearly be identified as the most probable cause. Table 2 shows that participants outside the [AA] theoretical range have a higher rate of results falling outside the satisfactory category. This suggests a very strong impact of OP calculation steps in the laboratories' performances.
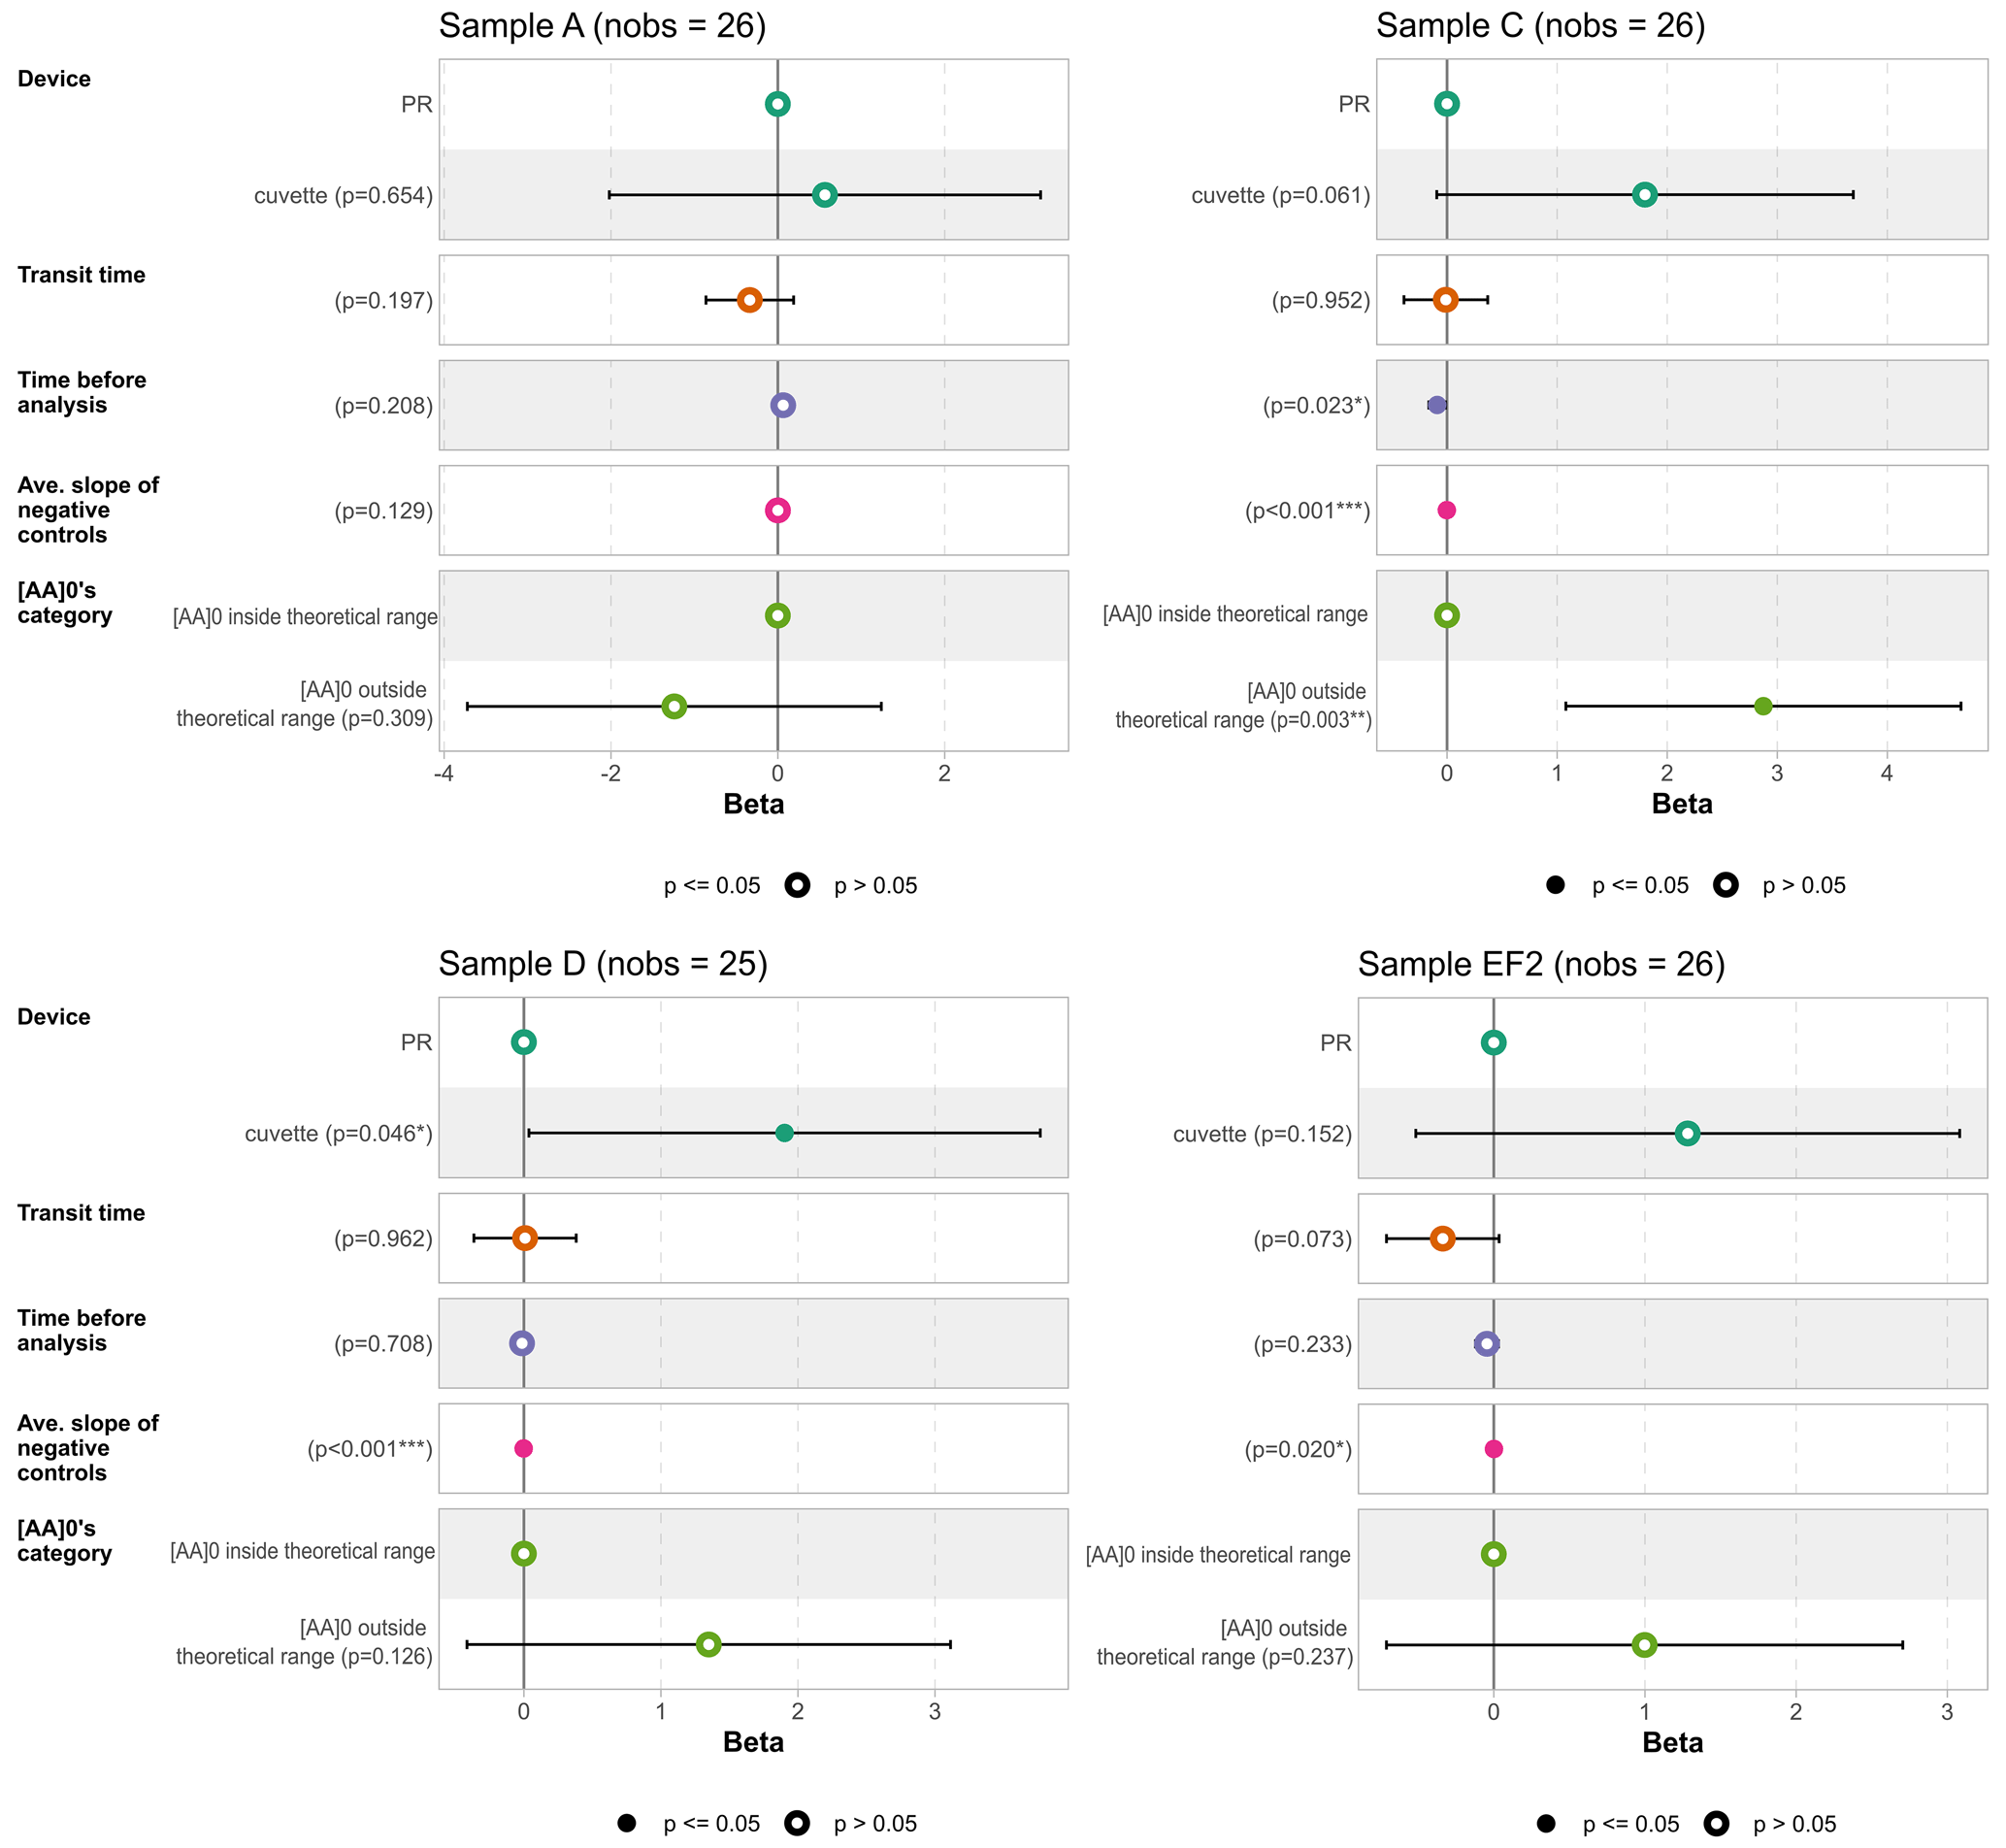
Figure 6Results of the adjusted multiple linear regression between median z-score values and technical and analytical parameters in each sample. The theoretical range of [AA]0 corresponds to a 10 % interval around the concentration fixed by the protocol (133 µM), i.e. 120–146 µM. Note: PR: plate-reader, [AA]0: concentration of AA at time zero in the negative controls.
The results of the multiple linear regression analysis are shown in Fig. 6, representing the influence of the technical and analytical parameters on participants' median z-score obtained, for each sample. No association trend was found for the transit time in any of the samples. Time before analysis presented a significant negative association only in sample C (β = −0.09 ± 0.04, p-value = 0.02). However, this association was not present after exclusion of the outliers (above the 99th and below the 1st percentiles, excluding 2 laboratories, β = −0.02 ± 0.04, p-value = 0.59). The average slope of the negative control was associated with lower z-scores for samples C (β = −1.8 × 10⁻³ ± 4 × 10⁻⁴, p-value < 0.01) and D (β = −1.5 × 10⁻³ ± 4 × 10⁻⁴, p-value < 0.01), and a higher z-score for sample EF2 (β = 1.0 × 10⁻³ ± 4 × 10⁻⁴, p-value = 0.02). However, this pattern disappeared for all samples after excluding the outliers (all p-values ≥ 0.2). More consistent patterns of association were found with the type of device, with cuvette-users exhibiting higher z-scores compared to plate-reader users. The most robust trends were obtained for samples C (β = 1.8 ± 0.9, p-value = 0.06 in the full model) and D (β = 1.9 ± 0.9, p-value = 0.05 in the full model). Participants using cuvette-based spectrometers reported finding the pipetting step more difficult, particularly for samples with the highest ratio of number of punches to extraction volume. However, this does not appear in the models' results. Sample D showed the strongest effect, despite having a similar ratio to sample A, for which there is no effect of the device. Finally, the effect of outside-of-range-[AA]0 led to significantly higher z-scores than [AA]0 in the pool of laboratories around 10 % [AA]th for sample C only (β = 2.9 ± 0.9, p-value < 0.01, β = 1.4 ± 0.9, p-value = 0.1 in both the full and without-outliers models, respectively). This pattern remains for sample D, but the lack of statistical significance with the other samples is probably caused by an effect that draws z-scores in both directions, making it difficult to detect an overall effect. The most consistent trend was the overestimation of z-scores among cuvette-users, while most of the other tested parameters showed only weak, non-robust associations with laboratory performance.
3.5 OP-AA SOP: OP calculation
In this ILC, the OP calculation was derived from the AA calibration curve (Eq. 1). However, a recent work investigating the mathematical determination of OP, published after the launch of the ILC, showed that this approach may yield higher OP-AA values than concentration-based methods relying on the initial AA concentration ([AA]0) and the absorbance at time zero (Eq. 3) (Souza et al., 2025). Since [AA]0 appears to be a crucial parameter in the paragraphs above, a sensitivity analysis was conducted on participants outside the [AA]th range who also provided information on AA solution preparation (n = 10, 8 using plate-readers, and 2 using cuvettes), to assess the influence of the calibration curve-derived [AA]0. OP was therefore recalculated using the concentration-based method in this sub-population (Fig. S13 in the Supplement). The results showed that applying the concentration-based method significantly improved participants' performances, with 7 laboratories shifting into the satisfactory z-score interval for at least one sample and 3 laboratories shifting into the satisfactory interval for all samples. Since reevaluating the results could affect the assigned value of each sample, it is not possible to reevaluate all results based on this calculation. Nevertheless, this sensitivity analysis strongly suggests that the OP calculation method is a critical variable in participants' performance. This is probably because the concentration-based method is impacted by AA solution preparation (correct weighing), volumetric operations linked to sample and AA introduction, and by analytical noise. On the other hand, the calibration curve approach is also impacted by uncertainties linked to each point on the calibration curve which can be greatly affected by the fast degradation of AA at low concentrations, and by the ability of users to correctly perform this step (i.e. dilution in K-PO4, minimizing the time between calibration and absorbance measurement, ensuring an identical optical path length between calibration points and samples…). This exploratory approach should be reproduced in future ILCs, since changing the calculation method would also affect the determination of the assigned values, but these preliminary results support the feasibility of implementing the current OP-AA SOP on a larger scale.
3.6 “Home” OP-AA protocols
Participants had the opportunity to perform their home protocols, to assess the differences in results compared to the SOP and what factors potentially drive them. Twelve participants provided such results. Among them, nine laboratories performed three extractions per sample and up to three replicates per extract. Two other laboratories performed one extraction per sample and up to three replicates per extract, and one participant performed one extraction per sample and one replicate per extract. Due to the diversity of these results, the conclusions drawn from this part are therefore more speculative and should be confirmed in future ILCs. Clustering analysis of the differences between the home and SOP results for each participant resulted in three clusters (Fig. S14 in the Supplement): five laboratories with close agreement between their home and SOP results, six laboratories with sample-dependent agreement between protocol results, and one laboratory with severe disagreement between protocol results (but with only one replicate per sample). Analyzing labs in the close accordance cluster revealed no shared technical patterns in their two protocols that could explain the strong accordance. In fact, the laboratories with the closest results between the two protocols (n°12 and n°18) used different extraction solutions (phosphate buffer vs. ultra-pure water), extraction devices (agitation and centrifugation vs. ultrasounds), extraction durations (60 min vs. 30 min), and ratios of PM to AA concentrations in the wells. Therefore, future work is clearly needed to better understand the impact of the various home protocols, to be able to comment on the existing published data. This work should also reflect on what trends regarding OP values would be expected depending on some crucial technical aspects of the protocols used.
This second ILC was based on the knowledge gained during the ILC1, which was carried out for the OP-DTT assay (Dominutti et al., 2025). It aimed to address participants' feedback, lessons learned, and community needs. The major strength of this work was the participants' strong commitment at each stage of the exercise, which enabled rich collaborative discussions and the sharing of different community perspectives on protocol development, and the gathering of a large amount of information regarding current practices.
One limitation of developing protocols for both the cuvette and the plate-reader absorbance measurement techniques is the potential induction for variability in one category as compared to the other. To address this aspect and help participants, a list of parameters to prioritize was shared prior to the ILC launch. The order of priority was as follows: reaction temperature (37 °C) > agitation during the reaction (if not continuous, agitate the cuvettes before each measurement) > perform the reaction directly in the cuvette (reduce number of pipetting steps) > number of time points (adjustable). A great benefit of the exchanges regarding these parameters was that participants became familiar with the SOP protocol, and consolidated their technical experience even before the analytical phase of the ILC began. Participants tried to meet the required conditions, including by testing home-built designs of incubation chambers for the extraction. The relatively small variation between extraction replicates shows that this step was reproducible for most participants, regardless of the final option.
Although it resulted in a certain variability among participants, the AA-SOP appears to lead to less extreme cases than the DTT-SOP (Dominutti et al., 2025), with slightly better z-score performances for the AA-SOP, despite the increased difficulty due to integrating all aspects of the analysis (extraction, analysis, calculations) and analyzing more samples. The proposed AA-SOP is an easier-to-deploy protocol that enables a more robust evaluation of results and the possibility of performing repeated kinetic measurements (ten measurements in thirty minutes). Such repeated measurements are not feasible with the OP-DTT assay because adding the titrating agent 5,5'-dithiobis-(2-nitrobenzoic acid) (DTNB) to stop the PM-DTT reaction requires more wells or labware. The good performance of participants who previously took part in the ILC1 could be attributed to their established expertise, skill enhancement or equipment improvement between the two inter-laboratory comparisons, or a more straightforward protocol. A combination of all these factors probably led to their good results. This study highlights how the community's commitment to protocol comparisons enables significant improvements in participants' knowledge, pointing out the structuring role of these exercises, and the importance of repeating them.
The present OP-DTT results could not be compared with the OP-AA SOP results, although it is necessary to be able to put both OP assays in perspective. One possible explanation for the high variability in OP-DTT results is the lack of clear instructions in the DTT-SOP regarding the extraction step which was not included in the ILC1. Some participants performed the extraction in ultra-pure water, while others used a K-PO4 buffer. The RI-URBANS Guidance document on the measurement of OP in PM (https://riurbans.eu/wp-content/uploads/2025/10/ST4.pdf, last access: 29 June 2026) recommends performing at least two complementary assays. Future work should focus on harmonizing both SOPs to draw joint conclusions about participants' performance on both tests.
Two recent studies have investigated OP metrology by either evaluating the main sources of uncertainties in OP-DTT measurements (Molina et al., 2020), or by investigating the impact of OP calculations on OP-DTT and OP-AA results (Souza et al., 2025). A key challenge in evaluating any protocol is the ability to use internal standards to provide reference values for OP. One recommendation for ILC is to use a commercially available chemical reference, when possible, so that future ILCs are also comparable to each other by using the reference value as a basis. However, ILC1 found that it was difficult to use the 1,4-naphthoquinone due to its aging during shipment. Sample EF2, made of CuSO4, was chosen in an attempt to achieve this goal. The results showed the highest rate of satisfactory performance and the lowest variability in the results (CV of 40 % among all 26 participants, using the average of the three replicates for each participant) when using the OP-AA-SOP. To the best of our knowledge, sample EF2's assigned value is the highest reported value for CuSO4, with ranging from 5.17 10−3 in phosphate buffer saline (Expósito et al., 2024) to 78.49 in the present study. Three similar studies reported an average of 33.24 ± 4.55 , which would correspond to a z-score of −2.9. The differences can mainly be attributed to the initial AA concentration (100 µM vs. 133 µM), since values would be higher when assuming a pseudo-first order kinetics as suggested in previous studies (Expósito et al., 2024; Souza et al., 2025). CuSO4 concentration and phosphate concentration during the reaction step can also explain these differences (Table S6 in the Supplement). A notable piece of information in the present ILC is also that the sample EF2 results were more variable among the different home AA protocols (CV = 112 % for the EF2 sample measurements, with 11 participants). This suggests that the SOP reduces the variability of results for this chemical reference. However, the 40 % CV remains too high at this stage to ascribe any OP-AA reference value to this compound.
Some feedback from groups that failed to obtain realistic results reported persistently high matrix absorbance at 265 nm across all well types (samples, negative controls, calibration curve, and chemical reference), preventing interpretation of any AA depletion kinetics; this systematic pattern, affecting calibration and controls equally, pointed toward an analytical/optical issue (e.g., plate UV-compatibility, reader configuration, or instrument linear range at 265 nm) rather than sample-specific extraction problems. To avoid this, participants should run a preliminary validation plate before the full assay, including the calibration curve, negative controls, and reference samples such as EF2 with known OP values to verify that absorbance signals fall within the instrument's reliable range and to catch issues such as unsuitable plate type, reagent storage, or pipetting errors while time still allows for troubleshooting.
This section provides recommendations for further standardizing OP measurements, valid for any OP probe or device used, and includes broader perspectives than those solely tested within the scope of the present ILC.
General recommendations
-
Filters to be analyzed for OP should always be cleaned or calcined (for Quartz fiber filters) prior to sampling. Filter impurities can impact the blank and the results differently, depending on the synergistic and antagonistic effects that can occur between the different chemical species in PM and filter impurities.
-
All field campaigns analyzed should include 10 % of field blanks by number to account for background oxidation of the sampling procedure and potential contamination (including trace elements that cannot be removed by calcinating filters prior to sampling).
-
The temperature can affect filters at different steps of the analytical process. When possible, laboratories should aim for a temperature-controlled room (± 5 °C) to limit premature and sample-dependent aging, solutions' degradation, and variations in kinetic parameters between analytical batches.
-
The analysis should be performed on the same day as the extraction to minimize the effect of the matrix aging. If the extracts must be stored, subsamples from the same campaign should be analyzed on the day of extraction and under the planned storage conditions, to assess the combined effects of aging and freeze-thaw cycles.
-
Samples should be prepared and handled under a laminar flow hood, by technical staff wearing powder-free polyethylene gloves, to prevent contamination.
-
We strongly recommend preconditioning all consumables (e.g., extraction tube, flask and pipet tips) with 5 % HNO3 (trace metal grade) for at least 24 h to limit the risk of contamination, followed by several rinsing steps using ultra-pure water, and drying in a clean environment (laminar flow hood). However, this step should be avoided for the microplates because the small well volume prevents proper rinsing, leading to potential light deviations and artifacts in the absorbance measurements.
Choice and preparation of reagents
-
Ultra-pure water (18.2 MΩ cm, TOC < 5 ppb) should be abstracted on the day of solution preparation to minimize AA degradation due to contaminated water. If the water quality is unstable over time, commercially available water of high purity should be purchased.
-
To limit the variation due to suppliers or purity in the ILC, the organizer provided all powder reagents at the highest degree of purity from their usual supplier. Laboratories should aim for high-purity products, and potentially test several providers prior to launching a long series of analyses, as this factor can greatly impact the results. In this case, the phosphate buffer was not purified, thanks to the high purity of the reagents (delivered as powders), avoiding any purification step that could increase the variability.
-
Preparation of the extraction matrix or the reagents must be performed cautiously, to minimize the uncertainties linked to volumetric operations, as previously reported for OP-DTT protocols (Molina et al., 2020). Balances and pipettes should be regularly controlled to ensure this crucial step, which is minimally influenced by laboratory equipment. To limit oxidation of AA due to exposure to light and oxygen in the air, the AA powder should be protected from light and be exposed to air for the weighing and dilution steps as shortly as possible, and stored below 4 °C when not used. As mentioned in the protocols, antioxidant diluted solutions should be prepared on each day of analysis. We recommend that users avoid keeping the buffer for too long to ensure the reproducibility of measurements. The appropriate length of the storage period highly depends on the purity of the reagents and should be tested by each group, but we advise storing it refrigerated for a maximum of two weeks.
Reaction step
-
Replicated negative control consisting in replacing sample extract by the K-PO4 buffer extracting matrix should be run along every batch of analysis.
-
The time between the calibration and its absorbance measurements should be minimized to have most accurate calibration curves. The absorbance measurement at time zero should also be performed as soon as possible after AA injection to be representative of the actual conditions at time zero.
-
Measurement of AA absorption is performed in the UV region and requires plates or cuvettes that are optimized for this domain. The suitability of the plates should be checked prior to any analysis, by measuring an AA absorbance spectrum, even if the UV domain is covered in the technical sheet provided by the supplier.
-
To be able to detect absorbance of light by particles, multiple absorbance measurements per replicate could be performed at each time point. High variations between measurements of the same replicate at the same time point would be indicators of such phenomenon, suggesting to either discard the absorbance reads or to reanalyze the sample.
-
Surface-mediated reactions from actual PM in the samples can only be captured when extracts are not filtered (Daher et al., 2011; Gao et al., 2017; Verma et al., 2012). However, this filtration step may increase the OP-AA variability and requires performing several filtration replicates to ensure that the measurements are unaffected by external variability or contamination from the filtration procedure. If extracts are filtered, the risks of contamination must be minimized by preconditioning the syringe filters (multiple rinsing with ultra-pure water).
-
OP analysis is based on a kinetic evaluation, with the reaction rate constant being a function of the temperature. To get the most reproducible results, it is important to limit temperature variations throughout the analytical process. For the reactants, a compromise has to be found to prevent premature oxidation of the solutions. The other solutions introduced in the plate or the cuvette (buffer/extract) should be as close to 37 °C as possible, since temperature greatly affects the reaction rate and the oxygen content of the solutions. Most importantly, to minimize inter-day variability when analyzing series of samples, all the different steps should be performed the exact same way every day.
Calculation step
-
Before running a long series of analyses, the ILC2 demonstrated the importance of performing preliminary controls: ensuring the linearity of the calibration curve, checking for coherence between [AA]th and [AA]0, and verifying the consistency and low values of the slope of the negative controls and/or blank filters. Validating these preliminary steps should limit the risk of incoherent results.
-
A chosen internal standard such as CuSO4 or a dedicated atmospheric sample should be analyzed along each analytical batch. The corrected slope obtained should remain stable over time and fall within a predefined acceptable range established by the laboratory by repeating the measurements of the standard under stable operating conditions.
Recommendations for future inter-laboratory comparisons
This work enables to draw some recommendations for future OP-ILCs. Although participants originated from countries with different meteorological and environmental conditions, future ILCs should try to include more diversity in geographical repartition of participating laboratories, to increase the representativity and challenges of the global OP community. The tested samples could also be chosen to represent this geographical diversity, with samples influenced by more specific sources. Filter nature i.e. quartz fiber, Teflon®, and glass fiber filters could also be compared. While this inter-laboratory comparison and the existing literature support the use of a concentration-based method for determining OP, future comparisons should implement both concentration-and calibration-based methods into the calculation file. This will allow to assess the robust averages of each method and to conclude on the best practices to adopt in a harmonized protocol.
Overall, this inter-laboratory comparison exercise demonstrates that OP-AA measurements can be implemented on a larger scale with a SOP combined with preliminary training. This scale-up appears easier to apply to the AA-SOP than to the DTT-SOP, as more participants obtained satisfactory results in the present ILC than in the DTT-ILC of 2023. The adoption of a shared protocol substantially improves the comparability of results, and this should facilitate identifying major sources of reactive PM across broader spatial scales. For laboratories already performing OP measurements, a practical first step toward harmonization could consist of additional OP measurements following the proposed SOP, thereby preserving previously generated datasets while enabling future comparability.
Repeated ILCs are essential for incorporating community feedback and gaining better insights from such rich datasets. This collaborative approach may also foster stronger commitment within the community than a strictly top-down normalization process would. Rather than enforcing strict procedural uniformity, the simplified SOP focuses on controlling a limited number of key parameters that critically influence OP-AA measurements. In light of ISO 5725-2, the present ILC shows that OP-AA measurements are reproducible under defined conditions, and that most observed variability arises from identifiable methodological factors, particularly volumetric operations and initial AA concentrations consistency, rather than from intrinsic instability of the assay. By prioritizing control of these parameters, the SOP effectively reduces methodological variability while allowing laboratories to adapt less critical aspects of the protocol to their technical environment.
AA-SOP and averaged values per sample and participant for both SOP and home protocols will be made accessible on a public repository: https://doi.org/10.5281/zenodo.23191154 (Marsal et al., 2026).
The supplement related to this article is available online at https://doi.org/10.5194/amt-19-7607-2026-supplement.
GU and AM designed the study and supervised the OP tests for the development of the simplified RI-URBANS AA protocol. SH, SD, PAD and JLJ reviewed the protocol. ED and AM tested the different steps of the protocol and prepared the samples, and PAD and AM organised the logistics of the intercomparison exercise. GH, RMH, AN, IM, AB, NM, XQ, and GU evaluated and decided on the samples to be compared and the protocol content. FC and JPP performed the data analysis and evaluated the performance of each group. AM processed the data of the study and wrote the paper together with SH, JLJ, PAD and GU before a first review by the RI-URBANS members. All authors participated in the interlaboratory comparison. All authors reviewed and edited the manuscript.
At least one of the (co-)authors is a member of the editorial board of Atmospheric Measurement Techniques. The peer-review process was guided by an independent editor, and the authors also have no other competing interests to declare.
Publisher's note: Copernicus Publications remains neutral with regard to jurisdictional claims made in the text, published maps, institutional affiliations, or any other geographical representation in this paper. The authors bear the ultimate responsibility for providing appropriate place names. Views expressed in the text are those of the authors and do not necessarily reflect the views of the publisher.
AN and CM acknowledge funding from the Swiss National Science Foundation AAIDI project and the European Union's Horizon Europe research and innovation program under project EASVOLEE (grant agreement No. 101095457). The authors thank the Leibniz Collaborative Excellence Program for funding the DUSTRISK project (K225/2019), led by Khanneh Wadinga Fomba, and the PROCOPE program for the grant awarded to Eduardo Souza (0185-DEU-23-0008LG1). Experiments in UCLM were supported by PID2022-139724OB-I00 project funded by MICIU/AEI (https://doi.org/10.13039/501100011033) and ERDF, the SBPLY/23/180225/000194 project funded by the Castilla-La Mancha Research and Innovation Agency and co-funded by the European Union and the 2025-GRIN-38334 project funded by the UCLM Internal Research Program and co-financed with ERDF funds. DC and MRG acknowledge the project TOX-IN-AIR, Call MUR PRIN 2022-PNRR, project code P2022JKP2S (CUP B53D23033620001), funded by European Union Next Generation EU Mission 4, Component C2, Investment 1.1. HH and PM acknowledge support by the project No. 24-10051S funded by the Czech Science Foundation. BTL and AJ acknowledge funding from the European Union – Next Generation EU (project BioMolTox, Program Contract of 8 December 2023, Class: 643-02/23-01/00016, Reg. no. 533-03-23-0006). AK and AD acknowledge the financial support from the Slovenian Research Agency (research core funding No. P2-0152). MF and FL acknowledge the ECRIN project, which is financially supported by the Hauts-de-France Region Council, the French Ministry of Higher Education and Research, and the European Regional Development Funds. ACK and SF acknowledge the project ADRIAirBURN (HRZZ-IP-2024-05-6224) supported by the Croatian Science Foundation. JL and TF acknowledge the support from the National Natural Science Foundation of China (No. 42307528) and Guangdong provincial project 2023QN10L005. SK and PS acknowledge funding from Environment and Climate Change Canada (Integrated Chemical Mixtures Project) and Trent University. RC and MK acknowledge funding by the Swiss National Science Foundation (Project Nr. 10.001.153).
This work was partially supported from the European Union's Horizon 2020 research and innovation program (grant agreement no. 101036245) (RI-URBANS), ACTRIS-FR, University of Birmingham and University of Helsinki through ACTRIS-HY.
This paper was edited by Jianhuai Ye and reviewed by Anil Patel and one anonymous referee.
Ayres, J. G., Borm, P., Cassee, F. R., Castranova, V., Donaldson, K., Ghio, A., Harrison, R. M., Hider, R., Kelly, F., Kooter, I. M., Marano, F., Maynard, R. L., Mudway, I., Nel, A., Sioutas, C., Smith, S., Baeza-Squiban, A., Cho, A., Duggan, S., and Froines, J.: Evaluating the Toxicity of Airborne Particulate Matter and Nanoparticles by Measuring Oxidative Stress Potential – A Workshop Report and Consensus Statement, Inhal. Toxicol., 20, 75–99, https://doi.org/10.1080/08958370701665517, 2008.
Bates, J. T., Fang, T., Verma, V., Zeng, L., Weber, R. J., Tolbert, P. E., Abrams, J. Y., Sarnat, S. E., Klein, M., Mulholland, J. A., and Russell, A. G.: Review of Acellular Assays of Ambient Particulate Matter Oxidative Potential: Methods and Relationships with Composition, Sources, and Health Effects, Environ. Sci. Technol., 53, 4003–4019, https://doi.org/10.1021/acs.est.8b03430, 2019.
Boogaard, H., Crouse, D. L., Tanner, E., Mantus, E., van Erp, A. M., Vedal, S., and Samet, J.: Assessing Adverse Health Effects of Long-Term Exposure to Low Levels of Ambient Air Pollution: The HEI Experience and What's Next?, Environ. Sci. Technol., 58, 12767–12783, https://doi.org/10.1021/acs.est.3c09745, 2024.
Borlaza-Lacoste, L., Mardoñez, V., Marsal, A., Hough, I., Dinh, V. N. T., Dominutti, P., Jaffrezo, J.-L., Alastuey, A., Besombes, J.-L., Močnik, G., Moreno, I., Velarde, F., Gardon, J., Cornejo, A., Andrade, M., Laj, P., and Uzu, G.: Oxidative potential of particulate matter and its association to respiratory health endpoints in high-altitude cities in Bolivia, Environ. Res., 255, 119179, https://doi.org/10.1016/j.envres.2024.119179, 2024.
Calas, A., Uzu, G., Martins, J. M. F., Voisin, D., Spadini, L., Lacroix, T., and Jaffrezo, J.-L.: The importance of simulated lung fluid (SLF) extractions for a more relevant evaluation of the oxidative potential of particulate matter, Sci. Rep., 7, 11617, https://doi.org/10.1038/s41598-017-11979-3, 2017.
Calas, A., Uzu, G., Kelly, F. J., Houdier, S., Martins, J. M. F., Thomas, F., Molton, F., Charron, A., Dunster, C., Oliete, A., Jacob, V., Besombes, J.-L., Chevrier, F., and Jaffrezo, J.-L.: Comparison between five acellular oxidative potential measurement assays performed with detailed chemistry on PM10 samples from the city of Chamonix (France), Atmos. Chem. Phys., 18, 7863–7875, https://doi.org/10.5194/acp-18-7863-2018, 2018.
Cho, A. K., Sioutas, C., Miguel, A. H., Kumagai, Y., Schmitz, D. A., Singh, M., Eiguren-Fernandez, A., and Froines, J. R.: Redox activity of airborne particulate matter at different sites in the Los Angeles Basin, Environ. Res., 99, 40–47, https://doi.org/10.1016/j.envres.2005.01.003, 2005.
Daher, N., Ning, Z., Cho, A. K., Shafer, M., Schauer, J. J., and Sioutas, C.: Comparison of the Chemical and Oxidative Characteristics of Particulate Matter (PM) Collected by Different Methods: Filters, Impactors, and BioSamplers, Aerosol Sci. Tech., 45, 1294–1304, https://doi.org/10.1080/02786826.2011.590554, 2011.
Dominutti, P. A., Jaffrezo, J.-L., Marsal, A., Mhadhbi, T., Elazzouzi, R., Rak, C., Cavalli, F., Putaud, J.-P., Bougiatioti, A., Mihalopoulos, N., Paraskevopoulou, D., Mudway, I., Nenes, A., Daellenbach, K. R., Banach, C., Campbell, S. J., Cigánková, H., Contini, D., Evans, G., Georgopoulou, M., Ghanem, M., Glencross, D. A., Guascito, M. R., Herrmann, H., Iram, S., Jovanović, M., Jovašević-Stojanović, M., Kalberer, M., Kooter, I. M., Paulson, S. E., Patel, A., Perdrix, E., Pietrogrande, M. C., Mikuška, P., Sauvain, J.-J., Seitanidi, K., Shahpoury, P., Souza, E. J. d. S., Steimer, S., Stevanovic, S., Suarez, G., Subramanian, P. S. G., Utinger, B., van Os, M. F., Verma, V., Wang, X., Weber, R. J., Yang, Y., Querol, X., Hoek, G., Harrison, R. M., and Uzu, G.: An interlaboratory comparison to quantify oxidative potential measurement in aerosol particles: challenges and recommendations for harmonisation, Atmos. Meas. Tech., 18, 177–195, https://doi.org/10.5194/amt-18-177-2025, 2025.
Expósito, A., Markiv, B., Santibáñez, M., Fadel, M., Ledoux, F., Courcot, D., and Fernández-Olmo, I.: Ascorbate oxidation driven by PM2.5-bound metal(loid)s extracted in an acidic simulated lung fluid in relation to their bioaccessibility, Air Qual. Atmos. Health, 17, 177–189, https://doi.org/10.1007/s11869-023-01436-8, 2024.
Fang, T., Verma, V., Bates, J. T., Abrams, J., Klein, M., Strickland, M. J., Sarnat, S. E., Chang, H. H., Mulholland, J. A., Tolbert, P. E., Russell, A. G., and Weber, R. J.: Oxidative potential of ambient water-soluble PM2.5 in the southeastern United States: contrasts in sources and health associations between ascorbic acid (AA) and dithiothreitol (DTT) assays, Atmos. Chem. Phys., 16, 3865–3879, https://doi.org/10.5194/acp-16-3865-2016, 2016.
Gao, D., Fang, T., Verma, V., Zeng, L., and Weber, R. J.: A method for measuring total aerosol oxidative potential (OP) with the dithiothreitol (DTT) assay and comparisons between an urban and roadside site of water-soluble and total OP, Atmos. Meas. Tech., 10, 2821–2835, https://doi.org/10.5194/amt-10-2821-2017, 2017.
Gao, D., Godri Pollitt, K. J., Mulholland, J. A., Russell, A. G., and Weber, R. J.: Characterization and comparison of PM2.5 oxidative potential assessed by two acellular assays, Atmos. Chem. Phys., 20, 5197–5210, https://doi.org/10.5194/acp-20-5197-2020, 2020.
Guascito, M. R., Lionetto, M. G., Mazzotta, F., Conte, M., Giordano, M. E., Caricato, R., De Bartolomeo, A. R., Dinoi, A., Cesari, D., Merico, E., Mazzotta, L., and Contini, D.: Characterisation of the correlations between oxidative potential and in vitro biological effects of PM10 at three sites in the central Mediterranean, J. Hazard. Mater., 448, 130872, https://doi.org/10.1016/j.jhazmat.2023.130872, 2023.
Gupta, T., Singh, S. P., Rajput, P., and Agarwal, A. K. (Eds.): Measurement, Analysis and Remediation of Environmental Pollutants, Springer Singapore, Singapore, https://doi.org/10.1007/978-981-15-0540-9, 2020.
He, L. and Zhang, J. (Jim): Particulate matter (PM) oxidative potential: Measurement methods and links to PM physicochemical characteristics and health effects, Crit. Rev. Env. Sci. Tec., 53, 177–197, https://doi.org/10.1080/10643389.2022.2050148, 2023.
Health Effects Institute: State of Global Air 2020, HEI, 28, 2020.
Hellack, B., Yang, A., Cassee, F. R., Janssen, N. A. H., Schins, R. P. F., and Kuhlbusch, T. A. J.: Intrinsic hydroxyl radical generation measurements directly from sampled filters as a metric for the oxidative potential of ambient particulate matter, J. Aerosol Sci., 72, 47–55, https://doi.org/10.1016/j.jaerosci.2014.02.003, 2014.
Hopke, P. K., Dai, Q., Li, L., and Feng, Y.: Global review of recent source apportionments for airborne particulate matter, Sci. Total Environ., 740, 140091, https://doi.org/10.1016/j.scitotenv.2020.140091, 2020.
Janssen, N. A. H., Strak, M., Yang, A., Hellack, B., Kelly, F. J., Kuhlbusch, T. A. J., Harrison, R. M., Brunekreef, B., Cassee, F. R., Steenhof, M., and Hoek, G.: Associations between three specific a-cellular measures of the oxidative potential of particulate matter and markers of acute airway and nasal inflammation in healthy volunteers, Occup. Environ. Med., 72, 49–56, https://doi.org/10.1136/oemed-2014-102303, 2015.
Kelly, F., Anderson, H. R., Armstrong, B., Atkinson, R., Barratt, B., Beevers, S., Derwent, D., Green, D., Mudway, I., Wilkinson, P., and HEI Health Review Committee: The impact of the congestion charging scheme on air quality in London. Part 2. Analysis of the oxidative potential of particulate matter, Res. Rep. Health Eff. Inst., 73–144, https://pubmed.ncbi.nlm.nih.gov/21830497/ (last access: 12 October 2026), 2011a.
Kelly, F., Armstrong, B., Atkinson, R., Anderson, H. R., Barratt, B., Beevers, S., Cook, D., Green, D., Derwent, D., Mudway, I., Wilkinson, P., and HEI Health Review Committee: The London low emission zone baseline study, Res. Rep. Health Eff. Inst., 3–79, https://pubmed.ncbi.nlm.nih.gov/22315924/ (last access: 12 October 2026), 2011b.
Kramer, A. J., Rattanavaraha, W., Zhang, Z., Gold, A., Surratt, J. D., and Lin, Y.-H.: Assessing the oxidative potential of isoprene-derived epoxides and secondary organic aerosol, Atmos. Environ., 130, 211–218, https://doi.org/10.1016/j.atmosenv.2015.10.018, 2016.
Li, Q., Wyatt, A., and Kamens, R. M.: Oxidant generation and toxicity enhancement of aged-diesel exhaust, Atmos. Environ., 43, 1037–1042, https://doi.org/10.1016/j.atmosenv.2008.11.018, 2009.
Liu, Q. and Schauer, J. J.: The oxidative potential of atmospheric particulate matter as an indicator of health risk of air pollution: a review, Environ. Chem. Lett., 24, 229–250, https://doi.org/10.1007/s10311-025-01882-z, 2026.
Maikawa, C. L., Weichenthal, S., Wheeler, A. J., Dobbin, N. A., Smargiassi, A., Evans, G., Liu, L., Goldberg, M. S., and Pollitt, K. J. G.: Particulate Oxidative Burden as a Predictor of Exhaled Nitric Oxide in Children with Asthma, Environ. Health Persp., 124, 1616–1622, https://doi.org/10.1289/EHP175, 2016.
Marsal, A., Sauvain, J.-J., Thomas, A., Lyon-Caen, S., Borlaza, L. J. S., Philippat, C., Jaffrezo, J.-L., Boudier, A., Darfeuil, S., Elazzouzi, R., Lepeule, J., Chartier, R., Bayat, S., Slama, R., Siroux, V., and Uzu, G.: Effects of personal exposure to the oxidative potential of PM2.5 on oxidative stress biomarkers in pregnant women, Sci. Total Environ., 911, 168475, https://doi.org/10.1016/j.scitotenv.2023.168475, 2024.
Marsal, A., Cavalli, F., Di Antonio, E., Houdier, S., Dominutti, P., Darfeuil, S., Jaffrezo, J.-L., Sauvage, S., Putaud, J.-P., Mudway, I. S., Nenes, A., Bougiatioti, A., Mihalopoulos, N., Prévôt, A. S. H., Paraskevopoulou, D., Kušan, A. C., Frka, S., Kroflič, A., Delić, A., Tariba Lovaković, B., Jurič, A., Molina, C., Contini, D., Guascito, M. R., Lintz, M., Rousset, D., Herrmann, H., Souza, E. J. D. S., Ledoux, F., Fadel, M., Yu, H., Yu, J., Baeza Romero, M. T., Cerrato-Alvarez, M., Van Os, M. F., Delaval, M. N., Mena Cabrera, Y. M., Trieu, N., Evans, G., Galindo, N., Gómez-Sanchez, N., Hlaváčková, H., Mikuška, P., Kadam, S., Shahpoury, P., López-Mahía, P., Moreda-Piñeiro, J., Cheung, R. K. Y., Kalberer, M., Introna, M., Steimer, S. S., Lin, Z., Paulson, S. E., Iram, S., Stevanovic, S., Audoux, T., Alleman, L. Y., Liu, J., Fang, T., Subramanian, P. S. G., Verma, V., Petäjä, T., Querol, X., Hoek, G., Harrison, R. M., and Uzu, G.: Data and protocols for the publication: “Harmonizing measurements of oxidative potential of PM: an interlaboratory comparison of the ascorbic acid assay,” Zenodo [data set], https://doi.org/10.5281/zenodo.23191154, 2026.
Molina, C., Andrade, C., Manzano, C. A., Richard Toro, A., Verma, V., and Leiva-Guzmán, M. A.: Dithiothreitol-based oxidative potential for airborne particulate matter: an estimation of the associated uncertainty, Environ. Sci. Pollut. Res., 27, 29672–29680, https://doi.org/10.1007/s11356-020-09508-3, 2020.
Mudway, I. S., Stenfors, N., Duggan, S. T., Roxborough, H., Zielinski, H., Marklund, S. L., Blomberg, A., Frew, A. J., Sandström, T., and Kelly, F. J.: An in vitro and in vivo investigation of the effects of diesel exhaust on human airway lining fluid antioxidants, Arch. Biochem. Biophys., 423, 200–212, https://doi.org/10.1016/j.abb.2003.12.018, 2004.
Mudway, I. S., Holgate, S., Forman, H. J., and Kelly, F. J.: Air pollution: Consequences for cellular redox signaling, antioxidant defenses and disease, Free Radical Bio. Med., 151, 1, https://doi.org/10.1016/j.freeradbiomed.2020.04.030, 2020.
Pietrogrande, M. C., Romanato, L., and Russo, M.: Synergistic and Antagonistic Effects of Aerosol Components on Its Oxidative Potential as Predictor of Particle Toxicity, Toxics, 10, 196, https://doi.org/10.3390/toxics10040196, 2022.
Shen, J., Taghvaee, S., La, C., Oroumiyeh, F., Liu, J., Jerrett, M., Weichenthal, S., Del Rosario, I., Shafer, M. M., Ritz, B., Zhu, Y., and Paulson, S. E.: Aerosol Oxidative Potential in the Greater Los Angeles Area: Source Apportionment and Associations with Socioeconomic Position, Environ. Sci. Technol., 56, 17795–17804, https://doi.org/10.1021/acs.est.2c02788, 2022.
Shi, T., Schins, R. P. F., Knaapen, A. M., Kuhlbusch, T., Pitz, M., Heinrich, J., and Borm, P. J. A.: Hydroxyl radical generation by electron paramagnetic resonance as a new method to monitor ambient particulate matter composition, J. Environ. Monitor., 5, 550, https://doi.org/10.1039/b303928p, 2003.
Souza, E. J. dos S., Uzu, G., Fomba, K. W., Dominutti, P. A., Mhadhbi, T., Jaffrezo, J.-L., and Herrmann, H.: A comparative study of methods for calculating the oxidative potential (OP) of atmospheric particulate matter, Environ. Sci.-Atmos., 5, 889–905, https://doi.org/10.1039/D5EA00025D, 2025.
Tassel, C., Jaffrezo, J.-L., Dominutti, P., Daellenbach, K. R., Darfeuil, S., Elazzouzi, R., Laj, P., Marsal, A., Mhadhbi, T., Dinh, V. N. T., Voiron, C., Houdier, S., Durif, M., Chatain, M., Francony, F., Cozic, J., Salque Moreton, G., Le Quilleuc, M., Ghersi, V., Gille, G., Mesbah, B., Stratigou, E., Zublena, M., Diémoz, H., Alastuey, A., D'Anna, B., Marchand, N., Conil, S., Gros, V., Van Os, M. F., Salma, I., Mihalopoulos, N., Močnik, G., Depina, K., Styszko, K., Hüglin, C., Querol, X., Prévôt, A. S. H., Favez, O., Siroux, V., and Uzu, G.: Oxidative potential of atmospheric particles in Europe and exposure scenarios, Nature, 647, 109–114, https://doi.org/10.1038/s41586-025-09666-9, 2025.
Verma, V., Rico-Martinez, R., Kotra, N., King, L., Liu, J., Snell, T. W., and Weber, R. J.: Contribution of Water-Soluble and Insoluble Components and Their Hydrophobic/Hydrophilic Subfractions to the Reactive Oxygen Species-Generating Potential of Fine Ambient Aerosols, Environ. Sci. Technol., 46, 11384–11392, https://doi.org/10.1021/es302484r, 2012.
Visentin, M., Pagnoni, A., Sarti, E., and Pietrogrande, M. C.: Urban PM2.5 oxidative potential: Importance of chemical species and comparison of two spectrophotometric cell-free assays, Environ. Pollut., 219, 72–79, https://doi.org/10.1016/j.envpol.2016.09.047, 2016.
Weichenthal, S., Crouse, D. L., Pinault, L., Godri-Pollitt, K., Lavigne, E., Evans, G., van Donkelaar, A., Martin, R. V., and Burnett, R. T.: Oxidative burden of fine particulate air pollution and risk of cause-specific mortality in the Canadian Census Health and Environment Cohort (CanCHEC), Environ. Res., 146, 92–99, https://doi.org/10.1016/j.envres.2015.12.013, 2016.
Xu, H., Gu, Y., Bai, Y., Li, D., Liu, M., Wang, Z., Zhang, Q., Sun, J., and Shen, Z.: Exploration and comparison of the relationship between PAHs and ROS in PM2.5 emitted from multiple anthropogenic sources in the Guanzhong Plain, China, Sci. Total Environ., 915, 170229, https://doi.org/10.1016/j.scitotenv.2024.170229, 2024.