the Creative Commons Attribution 4.0 License.
the Creative Commons Attribution 4.0 License.
 | 10 Feb 2026
Controlled release testing of commercially available methane emission measurement technologies at the TADI facility
Catherine Juéry
Vincent Blandin
James L. France
Philippine Burdeau
Adam R. Brandt
This study presents an independent and blinded controlled release evaluation of methane detection and quantification technologies in Europe. Conducted at the TotalEnergies Anomalies Detection Initiatives (TADI) site in France, the campaign tested eight commercial systems – including satellite, drone, and continuous monitoring platforms – under controlled single-blind conditions. Participants submitted methane emission rate estimates without prior knowledge of true release values. Performance was assessed through detection limit curves, parity plots, and statistical metrics including slope and R2. False positive detection rates ranged from 0 % to 11 %. Quantification slopes ranged from 0.09 to 1.13, with a trend toward underestimation, and R2 values ranged from 0.08 to 0.97. Wind conditions – particularly low speeds and high variability – were a key factor affecting quantification accuracy, emphasizing the need for high-quality wind data integration. This study underscores the importance of rigorous, standardized testing to benchmark technology performance and inform regulatory efforts. Results highlight platform-specific strengths and challenges, providing actionable insights for participants, policymakers, and regulators. These findings support the development of robust, validated methane measurement tools critical to achieving effective emissions monitoring and reduction strategies under evolving regulatory frameworks, such as those in the European Union.
- Article
(1359 KB) - Full-text XML
-
Supplement
(15250 KB) - BibTeX
- EndNote


Methane, a potent greenhouse gas with a global warming potential significantly higher than carbon dioxide over a 20 year period, is a critical target for emission-measuring technologies Anthropogenic methane emissions have contributed to 30 % of the global temperature increase since pre-industrial time, and given methane's short atmospheric lifespan and strong near-term warming impact, it is an ideal candidate for mitigation efforts (Ocko et al., 2021; Smith et al., 2020). Monitoring emissions is increasingly central to global strategies to limit temperature rise, with both established and emerging technologies being deployed across sectors (IEA, 2022; Ravikumar et al., 2020).
Targeting methane emissions from the oil and gas (O&G) sector – particularly upstream production – is one of the most cost-effective mitigation strategies when paired with appropriate policies (Kemp and Ravikumar, 2021). Recent initiatives, such as new European Union (EU) regulations, have reinforced the need for accurate detection and quantification (Official Journal of the European Union, 2024). Historically, participants relied on extrapolated “bottom-up” estimates, but research shows these often underestimate true emissions compared to direct measurement approaches (Allen, 2014; Sherwin et al., 2024b; Zhang et al., 2020). Policymakers and industry are shifting toward measurement-based data, reflected in efforts like the Oil & Gas Methane Partnership (OGMP) 2.0, a collaboration between industry and the United Nations to improving methane reporting through direct measurement.
Methane detection technologies are deployed globally using satellites, aircraft, drones, vehicles, and fixed ground-based systems. Measurements fall into three categories: (1) in situ concentration, (2) active imaging, and (3) passive imaging. In situ sensors measure local methane concentrations on various platforms. Active imaging systems use lasers at methane-absorbing wavelengths. Passive imaging relies on sunlight at methane-absorbing wavelengths, using aircraft, satellites, or fixed cameras. After measuring concentrations, algorithms – ranging from physical transport models to artificial intelligence – estimate emission rates from gas plumes.
Controlled release experiments, where methane is emitted under known conditions, benchmark technology performance. Blinded testing, in which participants estimate emissions without prior knowledge of true values, is essential for generating trusted, independent results. Previous studies have shown the efficacy of many technologies in detecting and quantifying point source emissions, though some require further refinement before widespread deployment (Bell et al., 2022, 2023; Chen et al., 2024; El Abbadi et al., 2024; Ilonze et al., 2024; Liu et al., 2024; Rutherford et al., 2023; Sherwin et al., 2024a).
Over a total of four weeks in June and September 2024, participants participated in controlled release testing at the TotalEnergies Anomalies Detection Initiatives (TADI) site in Pau, France. Independent, low- and high-volume single-blind tests were conducted to evaluate 15 commercial and academic measurement systems. The eight commercial technologies evaluated in this study included drone-mounted technologies (Aeromon BH12, GSMA AUSEA, SeekOps SeekIR, Flylogix), fixed-ground level technologies (SENSIA's Mileva 33 camera, SLB's Methane Lidar camera, and the Sensirion Nubo Sphere solution), and satellite observations (GHGSat). The technologies belonging to academic institutions and research laboratories will be evaluated in a separate publication.
This study advances methane detection through blinded controlled-release testing. Participants were evaluated on their ability to detect methane and quantify emission rates. Performance was assessed through detection limit curves and parity plots comparing true and submitted rates, constituting a large-scale, independent, and blinded controlled-release experiment on methane measurement technologies in Europe. Accurate methane emissions inventories are essential for developing effective climate change mitigation strategies, ensuring impactful reduction efforts. By characterizing the state of methane measurement technologies and establishing transparent evaluation methods, this study supports the development of robust, reliable tools to meet the demand for precise emissions monitoring in Europe and beyond.
We tested eight commercially available technologies in a single-blind controlled release study conducted over four weeks in June and September 2024: 17–21 June (Week 1), 24–28 June (Week 2), 9–13 September (Week 3), and 16–20 September (Week 4). The study occurred at the TADI site in southwestern France, a research and development platform owned and operated by TotalEnergies. Figure 1 contains an aerial view of the site, and a full description of the test site can be found in Sect. S1.1 in the Supplement. A team from Stanford University was onsite during the experiment to help coordinate along with TotalEnergies scientists and engineers. This section details the experimental setup, release procedures, participant technologies, data collection, and results submission methods.

Figure 1Map of the TADI test site. The gas release platform is indicated in red, the gas release control room in green, and the campaign headquarters in blue. Approximate location of the fixed sensors from Sensirion, SLB, and Sensia are indicated as well as common paths for drone flights.
2.1 Experimental setup
The tests followed a single-blind format, in which participants were not told the true release rates, nor the location of the release points. Participants were aware of the release start and stop time as a structured time format with announcement was used. For ease of coordination and planning among the teams on site, a pre-determined schedule was followed (e.g., pre-planning was required to maximize safety and results for drone and plane operations). Each release occurred for approximately 45 min, followed with a 15 min break for plume dispersion, which ensures a return to background levels of methane concentration between tests. After the plume dispersion period, the next 45 min period begins. The original experiment plan dictated 8 scheduled releases every day, with each day following the same schedule (see Sect. S1.2.1 for detailed schedule).
There were 40 releases scheduled each week, comprised of (1) non-zero, normal scale (i.e. 0–100 kg h−1 release rate) releases, (2) zero-releases to test for false positives, and (3) satellite-scale (i.e. ) releases. The implemented daily schedule of releases varied somewhat depending on the weather and specific demands during the week. There were occasionally weather conditions (e.g., heavy rain, dense fog) that prevented measurements from some technology types or imposed safety issues. The start and end of the release was announced to participants onsite over a radio, communicated to teams in the air overhead, and recorded in the campaign headquarters room. The release schedule was compiled in a spreadsheet and sent to all teams participating during that week. The release schedule and flowrates are discussed further in Sects. S1.3–S4.
Participants were directed to measure concurrently except for drones and aircraft, which were staggered in an alternating fashion (i.e. one technology of each type in the air during a release) for safety. See Sect. S1.3 for more information on participant scheduling.
2.2 Description of measurement technology
Eight commercial participants participated in the testing, deploying solutions via satellite, drone, and fixed ground sensors and cameras. The Aeromon BH-12, SeekOps SeekIR, and Flylogix sensors measure methane using an in situ concentration measurement device attached to a drone and utilizing mass balance methods to quantify emission rates. The AUSEA sensor utilizes a similar technology, as described in Bonne et al. (2024) and Joly et al. (2016, 2020). GHGSat's constellation of satellites (GHGSat-C) utilizes passive spectrometry technology (Diriker et al., 2022). Sensirion's Nubo Sphere solution was comprised of twelve in situ fixed-point methane emission continuous monitoring sensors. The SLB Methane Lidar Camera is an active imaging sensor utilizing tunable diode laser absorption spectrometry (TDLAS) technology. SENSIA's Mileva 33 camera is an optical gas imaging infrared sensor. Each team deploys proprietary algorithms along with the sensors to provide emission rate quantification estimates. Full descriptions of each participant's technology and team can be found in Sect. S2. Table 1 contains the specific technology deployed by each participant, along with the week(s) they participated in testing.
Table 1Participant and deployed solution, technology type, and week(s) of controlled release testing.
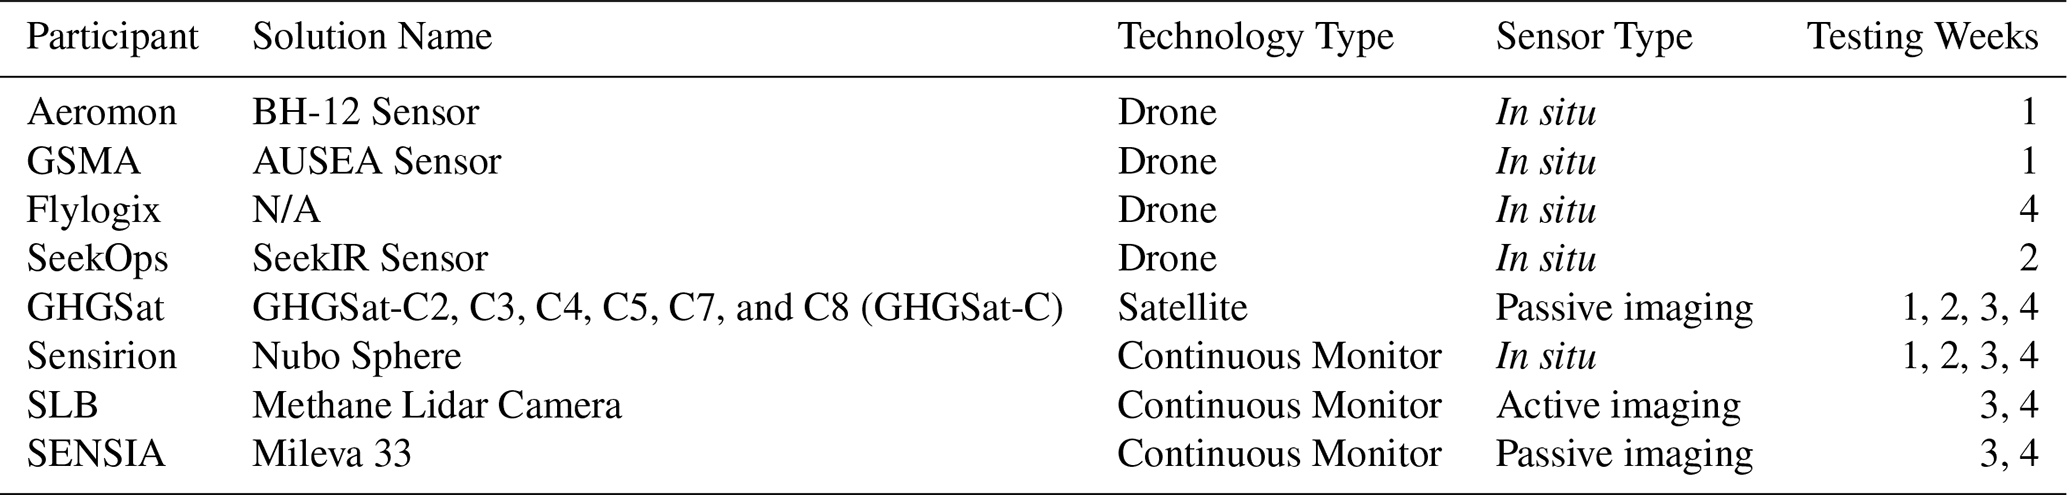
N/A: Participant did not specify a name of their measurement system.
2.3 Data collection procedures
Information about release flowrate, location, start and end time was recorded onsite by the site engineer. Deviations from the schedule were recorded by hand on the printed schedule and by the Stanford team. For each release, the input flowrate and associated uncertainty was recorded. Weather conditions, temperature, and prevailing windspeed and direction was recorded on site every morning and afternoon, and high-resolution wind data was collected using a ZX 300 Wind Lidar (i.e. wind speed and direction at various user-selected heights; see Sect. S3.2 for more information). Throughout their week(s) participating in the campaign, the participants measured methane concentrations with their instruments to provide an estimate of the release flowrate. Participants were required to bring and use their own wind measurement devices, if applicable to their technology. Each participant's measurement technique is described in more detail in Sect. S2.
2.4 Data submission and filtering process
Participants were allowed four weeks from the completion of each testing week to submit results for that week. All the commercial participants submitted their estimates within the required timeframe. After all participants submitted their results, true release rates were unblinded in a single-stage process. The true release rates were given to the teams on a weekly basis. True release rates were only released after every participant participating in that week had submitted their results. TADI wind lidar data was also given to participants with the unblinded true release rates.
During the data cleaning process, submitted estimates were categorized into one of three types: releases that teams measured and submitted a non-zero methane emission rate (“non-zero estimates”), releases for which teams submitted a methane emission rate of 0 kg h−1 (“zero estimates”), and releases for which teams did not submit any estimate (“N/A estimates”). The Stanford team developed three different criteria to filter and categorize each participants results: a strict data filtering criterion (Strict QC), the Stanford team's criteria (Stanford QC), and a participant-submitted criteria (Participant QC). The methods used to categorize participant estimates are discussed in detail in Sect. S4. Participants submitted zero-estimates differently (e.g., some reported in an estimate methane emission rate of 0 kg h−1, while others reported them as failed quantifications), resulting in the creation of the three different categorization methods. The Stanford QC process used additional data submitted with the estimates to determine whether the failed quantification was classified as a zero estimate (e.g., “no plume visible” or “below level of detection”) or N/A (e.g., clouds or heavy rain). The Stanford QC process was the default method used for data included in analysis.
The study results for each solution are presented in this section. Complicating the results analysis is the fact that several teams identified key issues with their data collection or treatment after true release rates were unblinded, discussed in more detail in Sect. 4.2.
3.1 Detection analysis
The ability of methane detection technologies to correctly identify the presence of emissions is a fundamental requirement for effective emissions monitoring and mitigation. In this section, we evaluate the detection performance of each participant by categorizing reported measurements as true positives (TP), false positives (FP), true negatives (TN), or false negatives (FN). True positives indicate successful detection of a known release, while false negatives represent missed detections. Conversely, false positives occur when a participant reports a detection where no release was present, and true negatives confirm correct identification of zero-release events.
The results presented here highlight the variability in detection capabilities across different technologies. As the start and stop time of each release was known by all the performers, the detection capability could be overestimated. Due to operational issues, the release schedule was not followed exactly by all the teams, meaning the minimum release detected presented might not be representative of the detection limit of the technology.
The percentages are calculated by dividing by the total number of non-zero releases included in the analysis. The table also includes the minimum and maximum release flowrates detected by each team (i.e. the participant reported in a quantification estimate for that release). A dash (–) indicates that no releases were able to be categorized as FP/TN due to that solution not measuring any zero releases or no zero releases passed the Stanford QC process.
Table 2 contains information on the TP, FP, TN, and FN performance for each participant, both in raw number of releases and percentage of releases included in solution analysis. Overall, the technologies saw a very low level of false positives and exhibited impressive detection capabilities. At most, a solution identified one false positive release, and half of the solutions did not report any false positives. The GSMA AUSEA sensor correctly categorized all their releases; as did GHGSat-C, although they only submitted one release for analysis. Notably, most solutions only incorrectly categorized one or two releases, such as Sensirion Nubo Sphere, Flylogix, SENSIA Mileva 33, Aeromon BH-12, and SeekOps SeekIR Sensor.
Table 2Summary of true positive (TP), false positive (FP), true negative (TN), and false negative (FN) releases by participant.
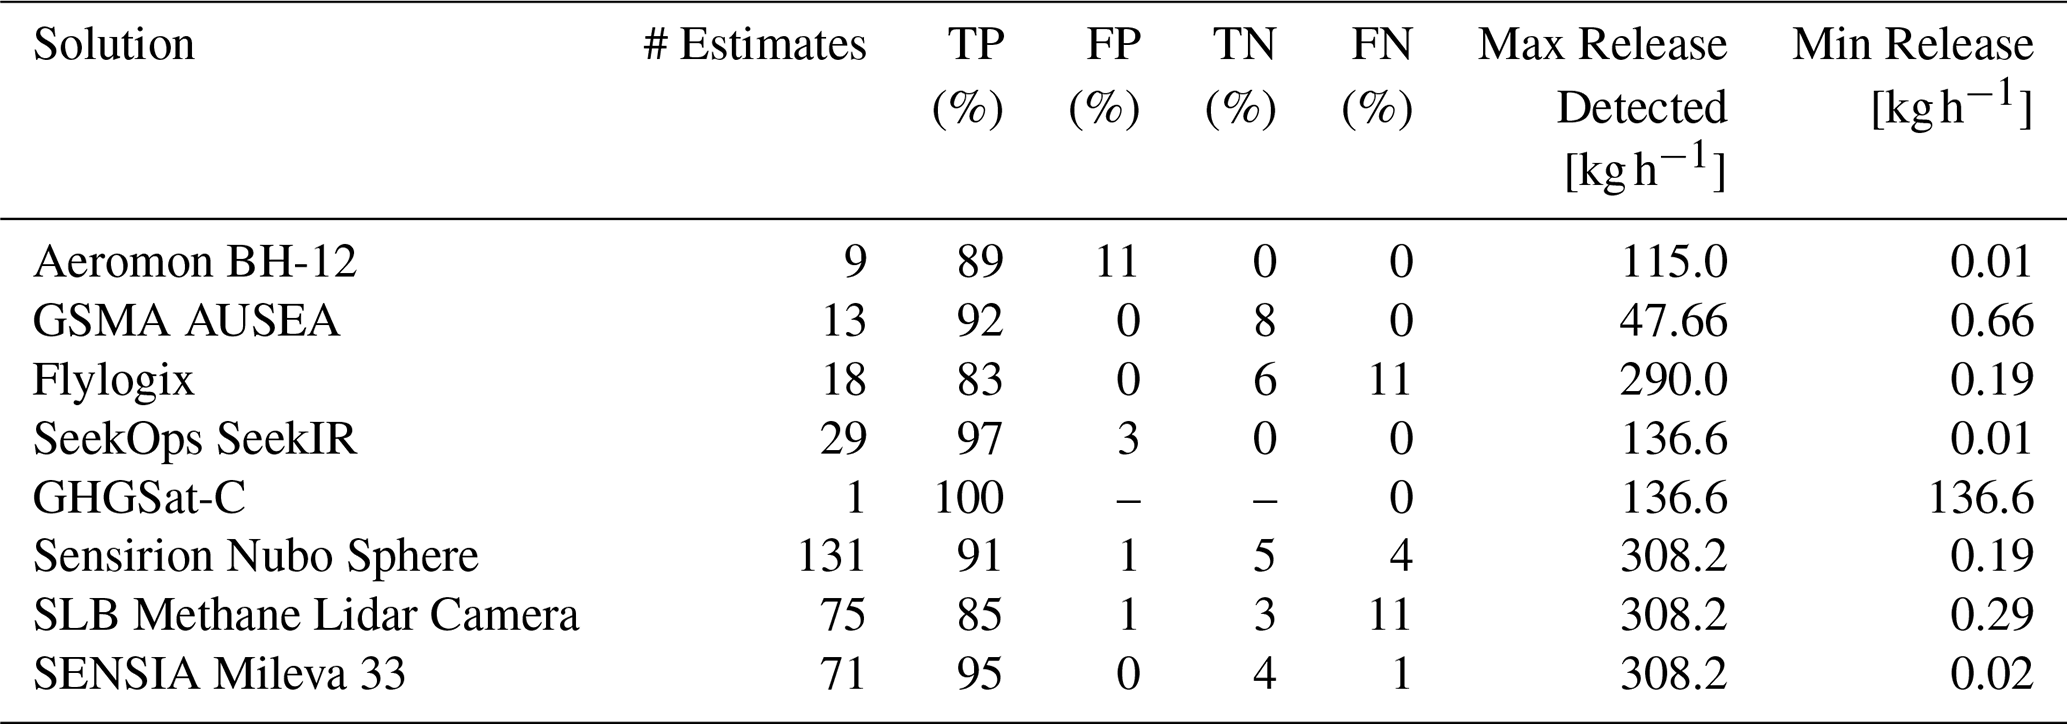
The technologies varied widely in their implementation (e.g., space-based compared to a fixed sensor placed meters from the release point). Therefore, the minimum release detected in this experiment ranged widely between technologies, from 0.01 to 210 kg h−1. GHGSat-C was only given large releases to characterize their minimum detection limits, as their technologies can only observe comparatively large sources (see Sect. S1.2.3). Other than the satellite, all commercial solutions succeeded in detecting emission rates of less than 1 kg h−1. All the drone and fixed-sensor teams were able to detect releases under 0.5 kg h−1. Due to alternating flights, two of the drone technologies (Aeromon BH-12 and GSMA AUSEA) could not cover the full range of releases, meaning the minimum detection limits could then be lower than the one noted here.
Figure 2 shows a normalized histogram of detected releases under 30 kg h−1 for each participant. For those solutions with false negatives emission categorization (Flylogix, Sensirion Nubo Sphere, SLB Methane Lidar Camera, and SENSIA Mileva 33), detection capabilities under 30 kg h−1 are visualized using logistic regression to plot a best fit line over a bin size of 6 kg h−1. This visualizes the probability of detection (POD) for the participants under this threshold and for this bin size.

Figure 2Detection capabilities below 30 kg (CH4) h−1. This figure shows the probability of detection for participant-quantified releases. Each release is marked by a vertical line at y=0 if not detected and y=1 if detected, ordered along the x axis by release volume. Blue bars indicate the proportion of detected releases within each bin, with error bars representing 95 % confidence intervals based on a binomial distribution. The darker blue line is the best fit of a logistic regression model on the probability data. GHGSat-C is excluded due to not measuring any releases below 30 kg (CH4) h−1. The x axis is based on the true release rate.
Flylogix and SENSIA Mileva 33 detected releases above 5 kg h−1 with 100 % probability. Sensirion Nubo Sphere failed to detect one release above 5 kg h−1, in the 15 to 20 kg h−1 range, but otherwise detected all releases above 5 kg h−1. The SLB Methane Lidar Camera failed to detect one release above 5 kg h−1, in the 20 to 25 kg h−1 range, but otherwise detected all releases above 5 kg h−1. No false negative emissions were reported for the other technologies, so it was not possible to determine their detection limit, except to say that it is below the minimum release detected. For most participants, especially the aerial technologies, more samples are needed for a statistically robust characterization of POD. Detection capabilities below 5 kg h−1 of methane are shown in Sect. S5.
3.2 Quantification analysis
Accurate quantification of methane emissions is essential for compliance, reporting, and mitigation. This section evaluates each participant's quantification performance by comparing estimated release rates to metered values, using parity plots, best-fit line slopes, R2 values, and accuracy thresholds. We also examine how environmental factors, especially wind, affected results across platforms.
After the true release rates and wind data were unblinded, participants identified issues with their quantification methods that contributed to discrepancies between the true and the estimated emission rates. Some participants investigated the causes for this performance and have published white papers detailing their analyses into why such performance occurred and how they will mitigate these issues in the future. A summary of these issues and citations to in-depth analyses, if published by a participant, are included in Sect. 4.2. All participants had the opportunity to publish a white paper with their post-unblinding analyses to be included in this report. The analysis in this study uses the estimates submitted before unblinding of true release rates.
Table 3 summarizes key quantification metrics for each participant, including the slope and R2 of estimates relative to metered values – indicating systematic bias and consistency, respectively. We also report the percentage of estimates where the true release fell within the participant's uncertainty bounds, and within 50 %–150 % and 90 %–110 % of the true value. These metrics assess both the calibration of reported uncertainty and the practical accuracy of quantification. We also include the percentage of total emissions measured that were quantified by each participant.
Table 3Key metrics for quantification performance across all participants.
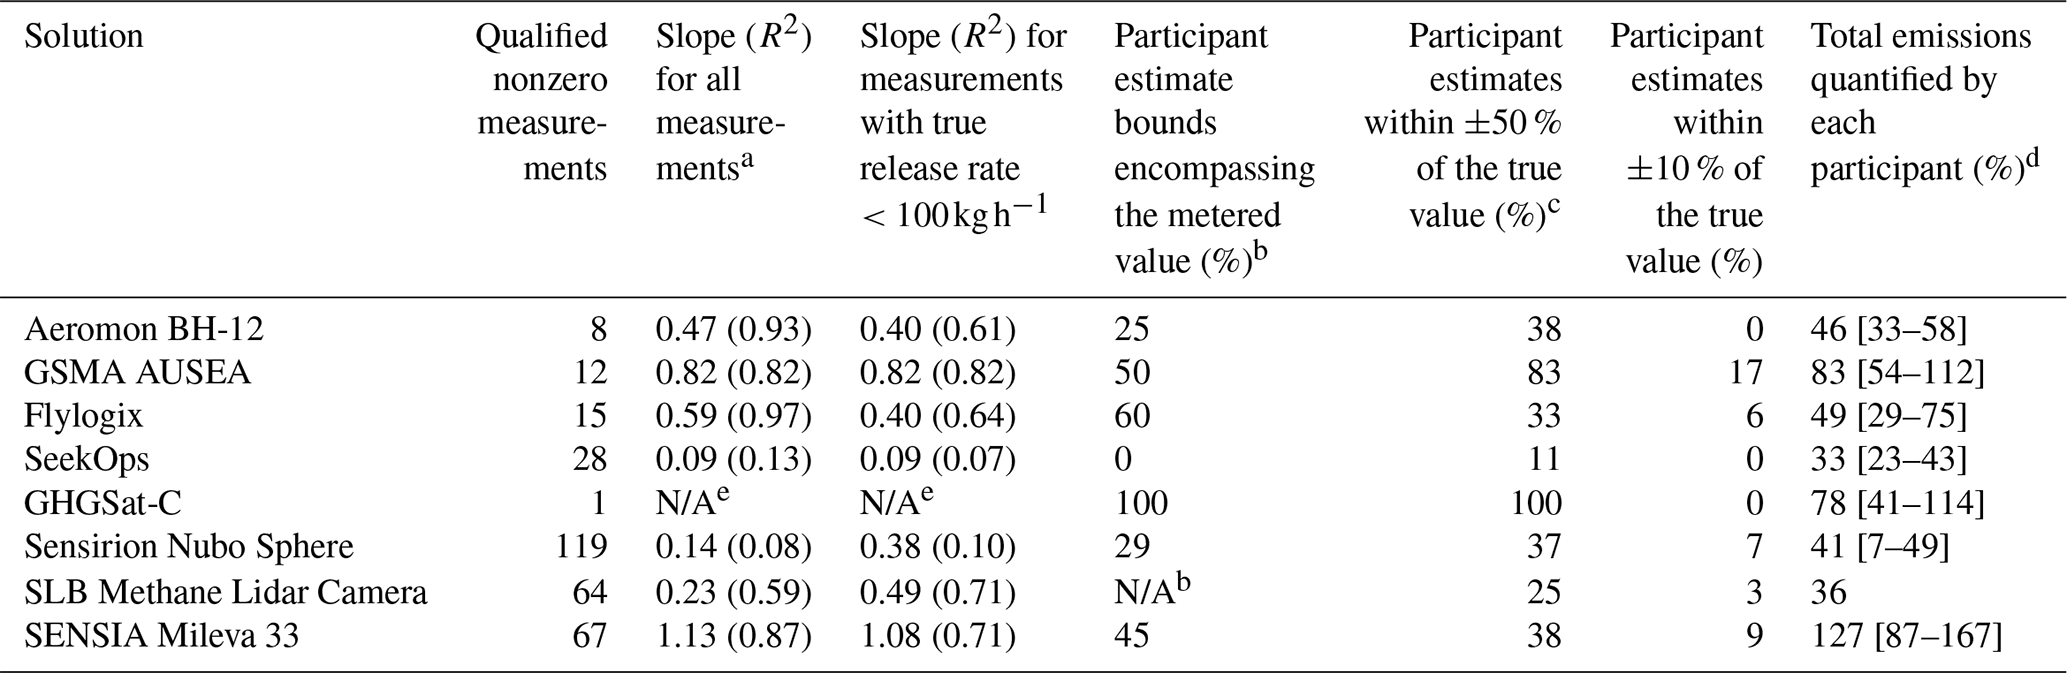
a Slope and R2 are associated with the linear equation of best using ordinal least squares.
b The percent of measurements that included the true release rate within the upper and lower bounds of each estimate provided by each participant.
c The percent of estimates that fell within ±50 % of the true release rate.
d The percent of true CH4 emissions quantified by each participant (the total emissions quantified by this solution compared to the total amount of methane emitted during these releases) with upper and lower uncertainty ranges reported by participants.
e The SLB Methane Lidar Camera did not report in the upper and lower bounds of the release rate estimates they submitted.
N/A: Participants submitted < 2 non-zero qualified estimates (cannot perform linear regression) or did not report uncertainty intervals.
Figure 3 presents a parity plot visualizing the agreement between participant-reported and true methane release rates. True metered release rate is given on the x axis while participant estimated release rate is given on the y axis. The 1:1 parity line (y=x) represents perfect agreement. Datapoints above the 1:1 parity line indicate that the participant over-estimated the release, while datapoints below the line indicate that the participant under-estimated the release. Additional plots calculating parity lines for releases with true methane emission rate under 100 kg h−1 and over 10 kg h−1 as well as individual plots for each participant, are included in Sects. S6.1–2.

Figure 3Quantification accuracy of the participants. Metered release rate is on the x axis. There is a small uncertainty associated with the true release flowrates, not shown in this figure. Participant reported quantification estimates are on the y axis. The dashed line represents the x=y parity line. See Sect. 4.1 for discussion of quantification performance.
3.3 Wind analysis
Wind conditions significantly influence methane plume behavior, affecting detection and quantification accuracy. Variability in wind speed, direction, and turbulence can distort plume shape and movement, making accurate measurement more challenging – especially under rapidly changing conditions. We analyzed measurement performance across bins of average wind speed, wind speed variability, and wind direction variability to identify where different technologies perform best or face limitations. Wind data were collected using TADI's ZX 300 Wind Lidar at 20 m height and were not available to participants until after unblinding. Wind statistics were calculated for each release window. The coefficient of variation (CoV), defined as the standard deviation normalized by the mean, was used to assess variability. Results are shown in aggregate (i.e. analysis performed on the combined quantification estimates of all the teams); participant specific results are in Sect. S7.1.
The impact of wind conditions on quantification ability is more clearly visualized when looking at the combined results of all solutions, shown in Fig. 4. As indicated by the slope of the parity line, quantification performance improves as wind speeds increase and the variability of wind speed and direction decrease. The figure suggests there is limited benefit once wind speeds are already . The trend indicated by the combined data offers insights into how wind conditions can influence the quantification abilities of a broad swath of methane detection technologies; however, more measurements are needed per bin to fully understand whether minimum detection threshold or quantification ability varies with wind, which was not possible in this experiment.

Figure 4Parity plot for combined data of all solutions, binned into different wind conditions during the release. The first row bins the releases by average wind speed, the second row bins the releases by wind speed CoV, and the third row bins the releases by wind direction CoV.
The results of this study provide valuable insights into the current capabilities and limitations of methane detection and quantification technologies. While most participants demonstrated strong detection performance, quantification accuracy varied significantly across different platforms and environmental conditions. This section explores the key findings, discusses potential sources of error, and highlights the broader implications for methane emissions monitoring and regulatory frameworks. Although improvement on detection and quantification ability is encouraging, the performance of individual solutions of all technology types should be scrutinized before deploying for field operations, as results can vary between technologies.
4.1 Detection and quantification performance
The ground-based solutions exhibited strong capabilities in detecting even the smallest leaks, with some solutions correctly identifying releases with flowrates as low as 0.01 kg h−1. Continuous monitors' detection ability improved upon performance seen in prior studies, with all solutions exhibiting a true positive rate of above 80 % and a false positive rate of 1 % or less. The probability of detection (POD) varied between the continuous monitor solutions, with a 90 % POD for all the solutions from under 1 to 25 kg h−1 of methane. The quantification performance of the continuous monitoring solutions varied, with two of the three continuous monitoring solutions (Sensirion Nubo Sphere and SLB Methane Lidar Camera) significantly underestimating the true value of emissions rates. All three solutions' quantification performance improved when focusing on methane releases under 100 kg h−1. This could mean that high-volume emissions quantification is an area of improvement for continuous monitoring methane detection and quantification solutions; the fixed location of the sensors and the distance between the release source and the continuous monitors could also contribute to the underestimation trend. The results presented here improve upon the results found in previous blinded controlled release testing of continuous monitoring solutions, especially in terms of false positive rates and true positive detection. As in the previous studies, the continuous monitoring solutions tended toward an underestimation of true release rates, with the exception of SENSIA Mileva 33 (Bell et al., 2023; Chen et al., 2024; Day et al., 2024; Ilonze et al., 2024). These studies also tested both point sensor networks and imaging technologies, and in general quantification performance was poor, consistent with the results of the Sensirion Nubo Sphere and SLB Methane Lidar Camera in this study.
Like continuous monitors, the drone technologies exhibited strong performance in detection of methane releases, while quantification performance varied. Overall, false positive rates remained low, and all true positive rates were above 80 %. The drone teams all succeeded in detecting releases below 0.7 kg h−1 and exhibited 90 % POD of below 6 kg h−1. The quantification performance varied significantly between participants, with impressive results for some solutions. There was an overall trend toward underestimation of the true release rate. Interestingly, mobile ground solutions' quantification performance was generally better when including high-volume () releases, with all participants except one exhibiting a best-fit slope farther from 1 when excluding large releases. When comparing these results to a previous controlled release study of mobile ground technologies, the mixed results found in this experiment offer some improvement (Ravikumar et al., 2019).
The performance in this experiment of the remote sensing (satellite) solution is more difficult to assess because of the limited number of releases measured. With the data available to this study, the detection limit is consistent with prior controlled release testing of aircraft and satellite solutions, with GHGSat-C detecting a release between 100 and 200 kg h−1 (El Abbadi et al., 2024; Rutherford et al., 2023; Sherwin et al., 2024a). However, GHGSat-C had to filter a significant amount (11/12) of release measurements due to weather conditions (clouds and/or rain). The difficulties of deploying remote sensing solutions in regions that experience significant cloud cover is one of the takeaways of this study, as there are limited data points to make definitive conclusions on detection and quantification ability. Prior work showed detection of numerous events in desert environments (Sherwin et al., 2024b). Given global distribution of oil and gas resources, some regions will clearly be easily observed with remote sensing (e.g., Middle East, Texas, North Africa), while other regions may suffer from significant challenges due to clouds and/or sun angle (e.g., Venezuela, Nigeria with tropical clouds, or Russia, Alaska, North Sea with clouds and poor sun angle). Additional controlled release testing of methane detecting satellites, including GHGSat-C, is currently underway to better characterize their performance.
Overall, all technologies struggled to quantify individual estimates, with only two teams (GSMA AUSEA, GHGSat) quantifying releases within 50 % of the true value over 50 % of the time, and all teams quantifying releases within 10 % of the true value in 20 % or less of the releases they submitted estimates for. However, three teams (GSMA AUSEA, GHGSat, and Sensia) contained 100 % quantification of the total amount of methane released over all their submitted release estimates within the uncertainty ranges they reported. This suggests that while overall, the tendency to underestimate emission rates is prevalent, participants of all technology types were able to quantify the total emissions within error.
4.2 Sources of error in quantification performance
Complicating the assessment of quantification performance was the post-unblinding discovery of data issues that go beyond uncalibrated algorithms. Aeromon contacted the Stanford and TADI team soon after unblinding to identify a malfunctioning wind sensor they had deployed while testing. Aeromon has published a white paper arguing that the wind measurements taken from a sensor on-board the drone consistently recorded lower-than-expected wind speeds due to sensor malfunctions, which contributed to the consistent underestimation of emission rates seen in this campaign (Hamedani Raja et al., 2025). The SLB team concluded in their post-unblinding analysis that the Methane Lidar Camera's anemometer also systematically underestimated the wind speed due to a wind shadow that was possibly related to the non-standard installation of the camera. The lower wind speeds again directly contributed to an underestimation of the true release rates (Doshi et al., 2025). Flylogix also credited underestimation of wind speeds with overall underestimation of their estimates in a white paper provided to the Stanford team but not released publicly. They stated that their weather station was unable to accurately measure wind speed and direction in the low wind conditions and was located too close to ground level. In all the analyses mentioned above, reprocessing the results with the unblinded wind data provided by the Stanford team improves quantification performance significantly. Wind field reconstruction in turbulent and sub-optimal conditions is fundamentally difficult, especially when dealing with low wind speeds and variable wind conditions present during the weeks of testing, leading to additional error in emission rate quantification. More testing is necessary to identify the level of wind observations that provide satisfactory information for release rate estimation.
Additional teams acknowledged other sources of error. SeekOps identified three sources of error in their estimates: data transcription errors, sensor saturation, and a systematic underestimation bias possibly caused by wind processing (Gully-Santiago et al., 2025). The data transcription errors resulted in estimates being assigned to the wrong release time, while the sensor saturation means the estimates they reported should have been lower limits rather than direct estimations. Sensirion determined that their plume dispersion model is not fully applicable for wind speeds and pointed to proximity between the sensor nodes and release points as a source of error in their algorithmic assumptions (Sensirion Connected Solutions, 2025). In their analysis, Flylogix also mentioned plume blowover (i.e., methane escaping above and possibly below the flight path), flight restrictions on the site, and deviation from their standard operations as sources of error. Flylogix usually deploys a fixed-wing aircraft for offshore operations and modified their testing protocol to participate in the TADI tests.
This study is a major independent and blinded controlled release test of methane detection and quantification technologies in Europe. By evaluating eight commercial systems across platforms – including satellites, drones, and continuous monitors – we provide a transparent assessment of detection and quantification performance. While most technologies reliably detected emissions, quantification accuracy varied widely, highlighting both capabilities and limitations of current methods. A central finding is the strong influence of environmental conditions – especially wind speed and variability – on quantification accuracy. Low or unstable wind conditions posed challenges for many mobile and remote sensing solutions, underscoring the need for improved methodologies and interpretation under real-world atmospheric variability.
One of the central themes of this study was the emphasis on collecting high-quality wind measurements, and a key conclusion is the significant role of wind conditions in quantification accuracy. Low wind speeds and high wind variability are non-optimal wind conditions in which to measure methane emissions. Further studies are needed to better characterize the impact of wind conditions on detection and quantification capabilities. However, wind speed, direction, and variability alone cannot fully explain the systematic underestimation observed across multiple participants. As discussed in Sect. 4.2, several teams identified key issues with their wind data after the unblinding of results. Such inconsistencies underscore the need for rigorous validation and cross-comparison of wind measurements to improve quantification reliability.
This finding highlights a broader theme that methane detection and quantification solutions must place greater emphasis on collecting accurate and reliable wind data. Without high-quality wind information, even the most advanced methane measurement technologies face inherent limitations in their ability to provide accurate emission estimates. In many quantification methods, wind uncertainty translates nearly directly into quantification uncertainty. This observation aligns with prior controlled release studies, which have consistently demonstrated the importance of robust and accurate wind data in improving the precision and reliability of methane quantification methodologies.
Conducting the experiment at an active industrial site introduced deployment constraints, including limiting where some technologies could operate. While realistic, these non-ideal conditions affected data collection for certain systems, which should be acknowledged while comparing the results to other controlled release experiments conducted under more ideal conditions. Some participants reported background concentrations of methane, possibly coming from surrounding industrial operations. While some of these constraints reflect the reality of operating on a site and are representative of the use case of these sensors, limitations of the test site and protocol required some deviation from real-world conditions. Another key difference between the experiment and real-world use cases is that participants were required to measure during their assigned week and release times, even if they would not usually deploy in those conditions (e.g. low wind speeds). The study design, focused on mobile ground-based solutions (i.e. drones), also posed challenges for evaluating satellite and continuous monitoring systems, which would have benefited from more observation time – particularly given Europe's cloudier weather. However, the fact that the experiment was conducted under realistic (non-ideal) conditions means that the performance demonstrated here is more likely to reflect real-world applications of these technologies. Additionally, the realistic conditions of the experiment helped to identify issues with some technologies that may have gone unnoticed in more ideal scenarios.
Future studies should consider technology-specific controlled release experiments to better evaluate each platform's strengths and limitations. Tailored tests for drones, aircraft, satellites, or ground-based sensors would enable more precise assessment under relevant operational conditions. Allowing participants to measure only when external conditions, such as wind speed, are suitable for measurement is another consideration. Expanding testing to varied environments – such as offshore settings, low sun angles, extreme weather, and differing surface reflectivity – would improve understanding of how these factors affect detection and quantification. These conditions are common in key production regions, including offshore areas and high latitudes. Additionally, targeted experiments examining wind effects could help technologies refine quantification methods and uncertainty estimates by integrating or adjusting for wind data. Further controlled release studies should also require participants to submit information about wind data used in their analysis before unblinding.
This research lays the groundwork for expanding standardized testing frameworks beyond North America and offers critical insights for policymakers, regulators, and industry stakeholders. As methane regulations evolve, especially in the EU, independent testing will be key to validating technologies and ensuring reported emissions reflect reality. Ultimately, this study demonstrates the importance of blinded controlled release testing in strengthening confidence in methane emission measurement data. Future work should help to refine quantification methods, broaden environmental testing, and integrate findings into emissions monitoring programs. Ongoing independent validation will be vital to building trust and driving effective methane emission reduction worldwide.
All data and code used in this study are available at https://doi.org/10.5281/zenodo.18381031 (McManemin, 2026). The repository includes scripts for data preprocessing, analysis, and figure generation, as well as documentation to reproduce the results presented in the manuscript. Additional details or support can be provided upon request.
The supplement related to this article is available online at https://doi.org/10.5194/amt-19-923-2026-supplement.
Conceptualization: AM, CJ, VB, AB. Project administration: AM, CJ, VB. Data curation: AM. Software: AM. Formal analysis: AM, CJ, AB. Writing – original draft: AM. Writing – review and editing: AM, CJ, VB, AB.
Catherine Juéry and Vincent Blandin contributed to the development of the AUSEA sensor technology. There are no other conflicts of interest.
Publisher's note: Copernicus Publications remains neutral with regard to jurisdictional claims made in the text, published maps, institutional affiliations, or any other geographical representation in this paper. The authors bear the ultimate responsibility for providing appropriate place names. Views expressed in the text are those of the authors and do not necessarily reflect the views of the publisher.
We acknowledge all operational teams who supported participation in this test, and provided logistical and coordination support. TADI (Jordi Jourde, and Yvan Faucher), Aeromon (Matti Irjala, Sina Hamedani Raja), GSMA, (Florian Parent), Flylogix (Charles Tavner), SeekOps (Brendan Smith, Michael Gully-Santiago), DTU (Charlotte Scheutz, Anders Michael Fredenslund), UHEI (Julia Wietzel, Martina Schmidt), UU (Roberto Paglini), CYI (Roubina Papaconstantinou, Pierre-Yves Quehe), LSCE (Jean-Daniel Paris), RHUL (James Lawrence France), Empa (Sandro Meier, Gerrit Kuhlmann, Dominik Brunner, Marius Vögtli, Andreas Hüni, Dominic Berger), FAAM (Stéphane Bauguitte), GHGSat (Marianne Girard), Sensirion (Susanne Pianezzi), SLB (Manasi Doshi, Tetsushi Yamada, Gokhan Erol), and SENSIA (Jorge Mataix Clau, Gonzalo Guerrero Torija). Their collective contributions were instrumental in the successful completion of this study.
AI tools such as ChatGPT, Claude, and Cursor were used in light editing of this manuscript and code generation.
This research has been supported by the United Nations Environment Programme – International Methane Emissions Observatory (agreement no. CCD24-CMB6608/RC/MSS).
This paper was edited by Nicholas Deutscher and reviewed by Andrew Feitz and one anonymous referee.
Allen, D. T.: Methane emissions from natural gas production and use: reconciling bottom-up and top-down measurements, Curr. Opin. Chem. Eng., 5, 78–83, https://doi.org/10.1016/j.coche.2014.05.004, 2014.
Bell, C., Rutherford, J., Brandt, A., Sherwin, E., Vaughn, T., and Zimmerle, D.: Single-blind determination of methane detection limits and quantification accuracy using aircraft-based LiDAR, Elem. Sci. Anth., 10, 00080, https://doi.org/10.1525/elementa.2022.00080, 2022.
Bell, C., Ilonze, C., Duggan, A., and Zimmerle, D.: Performance of Continuous Emission Monitoring Solutions under a Single-Blind Controlled Testing Protocol, Environ. Sci. Technol., 57, 5794–5805, https://doi.org/10.1021/acs.est.2c09235, 2023.
Bonne, J.-L., Donnat, L., Albora, G., Burgalat, J., Chauvin, N., Combaz, D., Cousin, J., Decarpenterie, T., Duclaux, O., Dumelié, N., Galas, N., Juery, C., Parent, F., Pineau, F., Maunoury, A., Ventre, O., Bénassy, M.-F., and Joly, L.: A measurement system for CO2 and CH4 emissions quantification of industrial sites using a new in situ concentration sensor operated on board uncrewed aircraft vehicles, Atmos. Meas. Tech., 17, 4471–4491, https://doi.org/10.5194/amt-17-4471-2024, 2024.
Chen, Z., El Abbadi, S. H., Sherwin, E. D., Burdeau, P. M., Rutherford, J. S., Chen, Y., Zhang, Z., and Brandt, A. R.: Comparing Continuous Methane Monitoring Technologies for High-Volume Emissions: A Single-Blind Controlled Release Study, ACS EST Air, 1, 871–884, https://doi.org/10.1021/acsestair.4c00015, 2024.
Day, R. E., Emerson, E., Bell, C., and Zimmerle, D.: Point Sensor Networks Struggle to Detect and Quantify Short Controlled Releases at Oil and Gas Sites, Chemistry, https://doi.org/10.26434/chemrxiv-2024-m0cww-v3, 2024.
Diriker, F. K., Larouche, B., and Zee, R. E.: Design and Development of GHGSat Constellation: Taking the Next Steps in Greenhouse Gas Monitoring, CASI ASTRO 2021, 2022.
Doshi, M., Yamada, T., Quinn, S., Erol, G., Boucher, C., Kenison, M., and Pomerantz, A.: Controlled Release Tests Results for the Methane Lidar Camera, EarthArXiv [preprint], https://doi.org/10.31223/X5HX58, 2025.
El Abbadi, S. H., Chen, Z., Burdeau, P. M., Rutherford, J. S., Chen, Y., Zhang, Z., Sherwin, E. D., and Brandt, A. R.: Technological Maturity of Aircraft-Based Methane Sensing for Greenhouse Gas Mitigation, Environ. Sci. Technol., 58, 9591–9600, https://doi.org/10.1021/acs.est.4c02439, 2024.
Gully-Santiago, M. A., Smith, B., Frederick, T., Dawson, K., and Elliott, D.: Results and Learnings from the TADI 2024 Methane Quantification Trial, SPE Europe Energy Conference and Exhibition, https://doi.org/10.2118/225634-MS, 2025.
Hamedani Raja, S., Bullock, T., Laurikainen, M., and Irjala, M.: Assessing anomalies in methane mass flow estimation: Investigating findings and lessons for enhanced monitoring, Zenodo, https://doi.org/10.5281/zenodo.14882794, 2025.
IEA: Global Methane Tracker 2022, IEA, Paris, https://www.iea.org/reports/global-methane-tracker-2022 (last access: 27 January 2026), 2022.
Ilonze, C., Emerson, E., Duggan, A., and Zimmerle, D.: Assessing the Progress of the Performance of Continuous Monitoring Solutions under a Single-Blind Controlled Testing Protocol, Environ. Sci. Technol., 58, 10941–10955, https://doi.org/10.1021/acs.est.3c08511, 2024.
Joly, L., Maamary, R., Decarpenterie, T., Cousin, J., Dumelié, N., Chauvin, N., Legain, D., Tzanos, D., and Durry, G.: Atmospheric Measurements by Ultra-Light SpEctrometer (AMULSE) Dedicated to Vertical Profile in Situ Measurements of Carbon Dioxide (CO2) Under Weather Balloons: Instrumental Development and Field Application, Sensors, 16, 1609, https://doi.org/10.3390/s16101609, 2016.
Joly, L., Coopmann, O., Guidard, V., Decarpenterie, T., Dumelié, N., Cousin, J., Burgalat, J., Chauvin, N., Albora, G., Maamary, R., Miftah El Khair, Z., Tzanos, D., Barrié, J., Moulin, É., Aressy, P., and Belleudy, A.: The development of the Atmospheric Measurements by Ultra-Light Spectrometer (AMULSE) greenhouse gas profiling system and application for satellite retrieval validation, Atmos. Meas. Tech., 13, 3099–3118, https://doi.org/10.5194/amt-13-3099-2020, 2020.
Kemp, C. E. and Ravikumar, A. P.: New Technologies Can Cost Effectively Reduce Oil and Gas Methane Emissions, but Policies Will Require Careful Design to Establish Mitigation Equivalence, Environ. Sci. Technol., 55, 9140–9149, https://doi.org/10.1021/acs.est.1c03071, 2021.
Liu, Y., Paris, J.-D., Broquet, G., Bescós Roy, V., Meixus Fernandez, T., Andersen, R., Russu Berlanga, A., Christensen, E., Courtois, Y., Dominok, S., Dussenne, C., Eckert, T., Finlayson, A., Fernández de la Fuente, A., Gunn, C., Hashmonay, R., Grigoleto Hayashi, J., Helmore, J., Honsel, S., Innocenti, F., Irjala, M., Log, T., Lopez, C., Cortés Martínez, F., Martinez, J., Massardier, A., Nygaard, H. G., Agregan Reboredo, P., Rousset, E., Scherello, A., Ulbricht, M., Weidmann, D., Williams, O., Yarrow, N., Zarea, M., Ziegler, R., Sciare, J., Vrekoussis, M., and Bousquet, P.: Assessment of current methane emission quantification techniques for natural gas midstream applications, Atmos. Meas. Tech., 17, 1633–1649, https://doi.org/10.5194/amt-17-1633-2024, 2024.
McManemin, A.: amcmanemin2/TADI_controlled_release_2024: Commercial team publication, Zenodo [code], https://doi.org/10.5281/zenodo.18381031, 2026.
Ocko, I. B., Sun, T., Shindell, D., Oppenheimer, M., Hristov, A. N., Pacala, S. W., Mauzerall, D. L., Xu, Y., and Hamburg, S. P.: Acting rapidly to deploy readily available methane mitigation measures by sector can immediately slow global warming, Environ. Res. Lett., 16, 054042, https://doi.org/10.1088/1748-9326/abf9c8, 2021.
Official Journal of the European Union: Regulation (EU) 2024/1787, EU/2024/1787, http://data.europa.eu/eli/reg/2024/1787/oj (last access: 27 Janaury 2026), 2024.
Ravikumar, A. P., Sreedhara, S., Wang, J., Englander, J., Roda-Stuart, D., Bell, C., Zimmerle, D., Lyon, D., Mogstad, I., Ratner, B., and Brandt, A. R.: Single-blind inter-comparison of methane detection technologies – results from the Stanford/EDF Mobile Monitoring Challenge, Elem. Sci. Anthr., 7, 37, https://doi.org/10.1525/elementa.373, 2019.
Ravikumar, A. P., Roda-Stuart, D., Liu, R., Bradley, A., Bergerson, J., Nie, Y., Zhang, S., Bi, X., and Brandt, A. R.: Repeated leak detection and repair surveys reduce methane emissions over scale of years, Environ. Res. Lett., 15, 034029, https://doi.org/10.1088/1748-9326/ab6ae1, 2020.
Rutherford, J. S., Sherwin, E. D., Chen, Y., Aminfard, S., and Brandt, A. R.: Evaluating methane emission quantification performance and uncertainty of aerial technologies via high-volume single-blind controlled releases, EarthArXiv [preprint], https://doi.org/10.31223/X5KQ0X, 2023.
Sensirion Connected Solutions: Sensirion Commentary TADI 2024, https://sensirion-connected.com/media/documents/5692F143/685119CF/SensirionCS_Report_Tadi-Stanford-2024_Commentary.pdf, last access: 25 June 2025.
Sherwin, E. D., El Abbadi, S. H., Burdeau, P. M., Zhang, Z., Chen, Z., Rutherford, J. S., Chen, Y., and Brandt, A. R.: Single-blind test of nine methane-sensing satellite systems from three continents, Atmos. Meas. Tech., 17, 765–782, https://doi.org/10.5194/amt-17-765-2024, 2024a.
Sherwin, E. D., Rutherford, J. S., Zhang, Z., Chen, Y., Wetherley, E. B., Yakovlev, P. V., Berman, E. S. F., Jones, B. B., Cusworth, D. H., Thorpe, A. K., Ayasse, A. K., Duren, R. M., and Brandt, A. R.: US oil and gas system emissions from nearly one million aerial site measurements, Nature, 627, 328–334, https://doi.org/10.1038/s41586-024-07117-5, 2024b.
Smith, S. J., Chateau, J., Dorheim, K., Drouet, L., Durand-Lasserve, O., Fricko, O., Fujimori, S., Hanaoka, T., Harmsen, M., Hilaire, J., Keramidas, K., Klimont, Z., Luderer, G., Moura, M. C. P., Riahi, K., Rogelj, J., Sano, F., van Vuuren, D. P., and Wada, K.: Impact of methane and black carbon mitigation on forcing and temperature: a multi-model scenario analysis, Clim. Change, 163, 1427–1442, https://doi.org/10.1007/s10584-020-02794-3, 2020.
Zhang, Y., Gautam, R., Pandey, S., Omara, M., Maasakkers, J. D., Sadavarte, P., Lyon, D., Nesser, H., Sulprizio, M. P., Varon, D. J., Zhang, R., Houweling, S., Zavala-Araiza, D., Alvarez, R. A., Lorente, A., Hamburg, S. P., Aben, I., and Jacob, D. J.: Quantifying methane emissions from the largest oil-producing basin in the United States from space, Sci. Adv., 6, eaaz5120, https://doi.org/10.1126/sciadv.aaz5120, 2020.