the Creative Commons Attribution 4.0 License.
the Creative Commons Attribution 4.0 License.
 | 19 Mar 2018
Bayesian aerosol retrieval algorithm for MODIS AOD retrieval over land
Tero Mielonen
Mikko R. A. Pitkänen
Robert C. Levy
Virginia R. Sawyer
Sami Romakkaniemi
Ville Kolehmainen
Antti Arola
We have developed a Bayesian aerosol retrieval (BAR) algorithm for the retrieval of aerosol optical depth (AOD) over land from the Moderate Resolution Imaging Spectroradiometer (MODIS). In the BAR algorithm, we simultaneously retrieve all dark land pixels in a granule, utilize spatial correlation models for the unknown aerosol parameters, use a statistical prior model for the surface reflectance, and take into account the uncertainties due to fixed aerosol models. The retrieved parameters are total AOD at 0.55 µm, fine-mode fraction (FMF), and surface reflectances at four different wavelengths (0.47, 0.55, 0.64, and 2.1 µm). The accuracy of the new algorithm is evaluated by comparing the AOD retrievals to Aerosol Robotic Network (AERONET) AOD. The results show that the BAR significantly improves the accuracy of AOD retrievals over the operational Dark Target (DT) algorithm. A reduction of about 29 % in the AOD root mean square error and decrease of about 80 % in the median bias of AOD were found globally when the BAR was used instead of the DT algorithm. Furthermore, the fraction of AOD retrievals inside the expected error envelope increased from 55 to 76 %. In addition to retrieving the values of AOD, FMF, and surface reflectance, the BAR also gives pixel-level posterior uncertainty estimates for the retrieved parameters. The BAR algorithm always results in physical, non-negative AOD values, and the average computation time for a single granule was less than a minute on a modern personal computer.
- Article
(1859 KB) - Full-text XML
-
Supplement
(1801 KB) - BibTeX
- EndNote


Atmospheric aerosols are small solid or liquid particles suspended in the atmosphere. They have a significant effect on the climate (IPCC, 2013; Kaufman et al., 2002) and they are found to impact, for example, the cloud formation processes and scattering and absorbtion of solar radiation in the atmosphere. Furthermore, the smallest atmospheric aerosol particles may be hazardous to human health when inhaled (Dockery et al., 1993; Seaton et al., 1995; Pope III et al., 2002; Cohen et al., 2017). As aerosols have widespread climate and health effects, because they may be transported in the atmosphere very far from their sources, and the effect of aerosols is one the biggest sources of uncertainty in future climate predictions, it is crucial to get accurate information on aerosols. Remote sensing of aerosols using satellite-based instruments provides a means to globally retrieve aerosol properties.
The Moderate Resolution Imaging Spectroradiometer (MODIS) on board NASA's Terra and Aqua satellites are among the oldest operating instruments orbiting the Earth and collecting information on Earth's surface and atmosphere. Terra and Aqua are both polar-orbiting satellites with wide swaths and they scan the entire surface of the Earth every 1–2 days. The primary operational algorithm to retrieve aerosol properties, such as the aerosol optical depth (AOD), is the Dark Target (DT), which uses MODIS data measured over dark surfaces (Kaufman et al., 1997a; Levy et al., 2013). There are two different versions of the DT algorithm: one for retrievals over land and another for retrievals over ocean. In this work, we concentrate on the retrievals over land. The physical concept behind the DT algorithm is the brightening effect, whereby an increased amount of aerosol over dark surface will reflect more solar radiation back to space and thus will make the scene look brighter. In practice, the retrieval is carried out by finding the aerosol properties that minimize the difference between the top-of-atmosphere (TOA) reflectances corresponding to radiative transfer simulations and the TOA reflectances measured by the MODIS instrument. One of the biggest problems in this type of approach is to distinguish between the fraction of TOA reflectance that was caused by the aerosols and the fraction that was caused by the land surface (Hyer et al., 2011; Mielonen et al., 2011; Gupta et al., 2016a). In the DT algorithm, surface reflectance at 2.1 µm is estimated and linear surface reflectance relationships are used to get an estimate for the surface reflectances at shorter wavelengths (0.47 and 0.64 µm). The current operational version of the DT algorithm is the Collection 6 (C6; Levy et al., 2013). The standard C6 aerosol retrieval products (named MOD04_L2 and MYD04_L2 for Terra and Aqua satellites, respectively) include the AOD and the fraction of fine-mode aerosol particles (fine-mode fraction, FMF) with pixel resolution of 10 × 10 km2 at nadir. The MODIS DT aerosol products are freely and openly available and are delivered in packages that consist of 5 min of measurement data and represent an area of about 2330 × 2030 km2. These 5 min data packages are referred to as granules. The MODIS data can be downloaded from the NASA LAADS DAAC system at https://ladsweb.modaps.eosdis.nasa.gov/.
Another widely used retrieval algorithm for MODIS is Deep Blue (DB; Hsu et al., 2004, 2013). The latest version of the algorithm is the C6 DB (enhanced) algorithm. The basic principle of the DB retrieval is similar to DT: find aerosol parameters that minimize the data misfit between the measured and modeled reflectances. In DB, the maximum likelihood principle is used in finding the unknown aerosol parameters. DB is used for over-land aerosol retrievals and was developed especially for retrievals over bright-reflecting surface. The capability of retrieving aerosol properties over bright-reflecting surfaces is useful, for example, in retrieving dust properties over deserts. Regardless of the bright-reflecting surface capabilities, DB does not carry out retrievals over snow or ice. The DB uses various MODIS spectral bands for cloud screening and aerosol typing, and the bands centered at 412, 490, and 670 nm are used for the actual retrieval. For some surface types DB uses similar surface reflectance relationships as DT, and for some surface types the surface reflectance values are directly taken from a database. The DB MODIS retrievals are delivered with the same C6 MODIS aerosol products as the DT retrievals. The third well-known algorithm used for the MODIS aerosol retrieval is the Multi-Angle Implementation of Atmospheric Correction (MAIAC) algorithm (Lyapustin et al., 2011a, b).
Both the DT and DB carry out the retrieval pixel by pixel. This means every pixel is retrieved independently of each other. This pixel-by-pixel approach makes the algorithm computationally efficient. Often, however, aerosol properties have strong spatial correlations (Anderson et al., 2003). Modeling and taking advantage of the spatial correlation structures of aerosol properties in the retrieval may therefore, in some cases, improve the accuracy of the retrieved parameters. One of the largest error sources in the MODIS AOD retrieval is the (partially) unknown surface reflectance: typical error for the retrieved AOD is proportional to 10 times the error in estimated surface reflectance (Kaufman et al., 1997b). More accurate surface reflectance values could improve the accuracy of the retrieval. Furthermore, one increasingly important problem with DT is that it sometimes retrieves unphysical negative AOD values. As the MODIS instruments have already passed their designed lifetimes and their sensitivities are rapidly decreasing, they require more and more frequent calibrations. As a result of sensor degradation and frequent calibrations, the number of negative AOD retrievals with the DT algorithm is increasing.
In this work, we developed a Bayesian aerosol retrieval (BAR) algorithm for MODIS aerosol retrieval over land. The new algorithm is based on the DT algorithm and the inversion part of the algorithm is reformulated as a statistical (Bayesian) inverse problem (Kaipio and Somersalo, 2005; Calvetti and Somersalo, 2007; Gelman et al., 2014). While the DT retrieves one pixel at a time, in the BAR all the dark surface and cloud-free pixels of a granule are retrieved simultaneously. BAR allows the use of statistical prior models for the unknown parameters. The prior models are probability distribution models for prior information, such as ranges of feasible values of the parameters and spatial correlations. BAR also allows us to take into account the statistics of the measurement noise and compensate for model uncertainties caused, for example, by the fixed aerosol models. Instead of the surface reflectance relationships used in the DT algorithm, we include the surface reflectances at different wavelengths as unknown parameters and retrieve the actual surface reflectances simultaneously with the aerosol properties.
MODIS aerosol products retrieved using the DT are among the most widely used aerosol products. The MODIS C6 standard aerosol products include the retrieved aerosol properties and measurement data with spatial resolution of about 10 × 10 km2 at nadir. In DT, the retrieval is carried out separately for each pixel and the retrieval parameters are the total AOD at 0.55 µm , fine aerosol model weighting η (FMF), and the surface reflectance at 2.1 µm . It should be noted that in DT, the FMF is actually the weighting coefficient for the TOA reflectances due to fine aerosol model and does not necessarily represent the true concentration fraction of the fine-mode aerosol. The surface reflectances at shorter wavelengths are estimated using predefined linear surface reflectance relationships that depend on the normalized difference vegetation index (NDVI) at shortwave infrared (SWIR) and the scattering angle of the light (Remer et al., 2001; Levy et al., 2007). In the DT retrieval, the TOA reflectances are simulated by mixing the reflectances corresponding to two different aerosol models:
where denotes the simulated TOA reflectances, η is the FMF, and and denote the TOA reflectances simulated according to the fine and coarse aerosol models, respectively. There are three different fine aerosol models, one coarse (dust) aerosol model, and one continental aerosol model in DT. The TOA reflectances and other radiative-transfer-related variables corresponding to each aerosol model are precomputed and stored in lookup tables (LUT) to make the algorithm computationally more efficient. In the DT retrieval, the fine aerosol model to be used is taken from a predefined database that contains aerosol model information based on location and season. For more information on the C6 DT retrieval algorithm see, for example, Levy et al. (2013).
BAR is a retrieval algorithm that uses the same aerosol models and preprocessing of the data, such as cloud-screening, as the DT. Because the same preprocessing is used, the BAR algorithm retrieves the same pixels as the operational DT algorithm. In BAR, the inversion part of the DT algorithm is formulated in a statistical (Bayesian) framework. In this statistical framework, the solution to the inverse retrieval problem is not a single value but a posterior probability distribution model of the unknown parameters given the measured MODIS TOA reflectances and prior information that we have on the unknowns. As the complete statistical model of the problem is the posterior probability distribution, it allows us to derive single point estimates that are referred to as the retrievals and quantify the posterior uncertainties of the retrievals for each pixel. The statistical framework also allows us, for example, to utilize information about the measurement noise and use data from as many MODIS spectral bands as available for the retrieval. The BAR algorithm is characterized by the following:
-
We use data from MODIS bands 3 (0.47 µm), 4 (0.55 µm), 1 (0.64 µm), and 7 (2.1 µm). All other bands could be used as well but four bands are selected to keep the computational costs moderate.
-
We retrieve the total AOD at 0.55 µm, the FMF, and the surface reflectances at four MODIS bands.
-
The surface reflectances at all bands are simultaneously retrieved with AOD and FMF. The surface reflectance relationships that are used in DT are not needed.
-
We simultaneously retrieve all unknown parameters in all dark land pixels of a granule.
-
We use prior probability density models for the values and the spatial correlation structure of the unknowns. The prior probability density models are used to encode the prior knowledge such as spatial correlation information, seasonal variability, or positivity constraints into the retrieval.
-
We utilize an approximation error model for the model uncertainties in the simulated TOA reflectances caused by the uncertainties in the aerosol models and radiative transfer simulations.
In the BAR AOD retrieval, statistical prior models for the retrieved parameters can be used. We make the following modeling selections in the BAR:
-
To avoid negative AOD retrievals, we retrieve AOD in logarithmic scale .
-
Instead of TOA reflectances in linear scale, we write also the TOA reflectances in the models in logarithmic scale as .
-
We model all unknown parameters in a granule by multivariate Gaussian prior models. The prior models are fully described by their expected value vectors and covariance matrices:
-
AOD , where 𝔼τ and Γτ denote the expected value vector and covariance matrix of the AOD, respectively;
-
FMF , where 𝔼η and Γη denote the expected value vector and covariance matrix of the FMF, respectively;
-
surface reflectances , where 𝔼τ and Γτ denote the expected value vector and covariance matrix of the surface reflectance, respectively.
-
-
We model AOD, FMF, and surface reflectances at all bands as mutually uncorrelated variables.
-
We model the observation noise and the approximation errors in TOA reflectances due to aerosol and radiative transfer models as additive multivariate Gaussian random variable e with distribution
In the BAR, we look for the maximum a posteriori (MAP) estimate for the unknown parameters. The prior and likelihood models that are used in the construction of the posterior model are explained in more detail in Sect. 3. With the models selected, the MAP estimate can be computed as
where is the (logarithm) of AOD at 0.55 µm, η denotes the FMF, ρs are the surface reflectances at all bands, and γ denotes auxiliary (fixed) model parameters such as measurement geometry, surface elevation, and aerosol models. Le, Lτ, Lη, and denote the Cholesky factors of , , , and , respectively. , where is the observation model based on aerosol and radiative transfer models and is based on LUTs. and contains the actual TOA reflectances measured by the MODIS instrument. In our implementation of BAR, we use the L-BFGS-B optimization algorithm (Byrd et al., 1995) to solve the retrieval optimization problem. For further details of the optimization problem, see Appendix Appendix A.
To quantify the uncertainties corresponding to the retrieved parameters we can compute an approximation for the posterior covariance matrix as
where the block diagonal matrix , and is the Jacobian matrix evaluated at the MAP estimate. The diagonal of the posterior covariance matrix contains posterior variances of each retrieved parameter at each pixel.
3.1 Prior models
Prior probability density models are used in the BAR retrieval to model information we have on unknown parameters prior to the retrieval. In the BAR, we use Gaussian prior models augmented with constraints that exclude non-physical solutions. For example, for the FMF the retrieval is restricted to an interval between 0 and 1. In practice, these constraints are implemented in the optimization algorithm. The multivariate Gaussian prior models are defined by their expected value vector and covariance matrix. In aerosol retrievals, the expected value vectors for aerosol parameters can be constructed, for example, by using values from aerosol climatologies. Covariance matrices encode information on the prior uncertainty of the parameters and correlations between different pixels.
3.1.1 Prior model for the AOD
In the BAR algorithm, the AOD is retrieved on a logarithmic scale to avoid negative AOD retrievals and multivariate Gaussian distributions are used as the prior models for the logarithm of the AOD. The expected value vector for AOD is based on the MAC-V2 climatology by Kinne et al. (2013). The MAC-V2 climatology contains monthly AOD values in a 1 ∘ by 1 ∘ grid. In the BAR retrieval, the nearest value from the MAC-V2 climatology is taken as the prior expectation for each pixel to be retrieved.
The spatial correlations and variances in the logarithm of AOD are modeled by using a covariance function that defines the AOD covariance matrix as
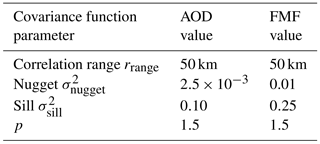
where Γτ(i,j) is the (i,j) element of the prior covariance matrix Γτ, when i=j and when i≠j, and denotes the distance between the pixels i and j. σnugget,τ denotes the so-called nugget and it represents the local component of the AOD variance (no spatial correlation). The sill σsill,τ describes the variance related to the spatially correlated component of AOD. Consequently, the total variance of AOD . The correlation range rrange,τ and pτ define the spatial correlation length and smoothness of the AOD fields. The larger the selected correlation range is, the larger the spatial structures we expect to see in AOD. In BAR, we used fixed values for the covariance function parameters and they are listed in Table 1. The sill and nugget parameter values were selected by analyzing previous MODIS retrievals. The range value was selected as 50 km (Anderson et al., 2003). This selection was made to let the neighboring pixels have relatively high spatial correlation but also to allow for certain features such as smoke plumes to be retrieved as well as possible and not be smoothed out too much. The term pτ was selected as 1.5 based on visual inspection of retrieved AOD fields. In this version of BAR, the covariance function parameters were manually selected but it is also possible to infer the covariance function parameters, for example, by performing variogram analysis on previous AOD retrieval data as in Chatterjee et al. (2010). This type of spatial correlation modeling is often used in geostatistical methods such as kriging.
Table 1The covariance function parameters used in aerosol optical depth (AOD) and fine-mode fraction (FMF) prior models.
3.1.2 Prior model for the FMF
For the FMF, we use a similar Gaussian prior as for the AOD. The prior expectation value for FMF is taken from the MAC-V2 climatology as for the AOD. The FMF is modeled as a spatially correlated parameter and the same type of covariance function as for the AOD is used to construct the prior covariance matrix Γη. The range, sill, and nugget values for the FMF prior model covariance are listed in Table 1. The sill was intentionally selected as relatively large value to allow for high prior uncertainty in the spatial part of the prior model.
3.1.3 Prior model for the surface reflectance
In the BAR algorithm, the surface reflectances at different wavelengths are treated as unknown parameters and they are simultaneously retrieved with AOD and FMF. In the BAR algorithm, we use Gaussian prior models for the surface reflectances. We model the surface reflectances at different bands as uncorrelated and the surface reflectances at each band as spatially uncorrelated. We note that this selection may not result in the best possible retrieval accuracy but makes the processing of a large number of MODIS granules significantly faster than with correlated models. With these choices for the surface reflectance, the prior model becomes an uncorrelated Gaussian density which is described by the expected surface reflectance values and their variances at each pixel. As expected values for the surface reflectance, we use the MODIS MCD43C3 albedo product blue-sky albedos computed with the weighting coefficient 0.5 (50 % of the white-sky albedo and 50 % of the black-sky albedo). This selection to use the blue-sky albedo was done based on a test in which we carried out retrievals with white-sky, black-sky, and blue-sky albedo-based prior models. The differences between the different surface albedo types were small but the blue-sky albedo resulted in the best results when compared with the collocated AERONET AOD values. The daily MODIS albedo product is stored in 0.05 ∘ by 0.05 ∘ grid. For the BAR, we precompute monthly expected surface reflectance corresponding to the surface albedo product grid. The monthly surface reflectance is computed as the temporal average of surface reflectances ±45 days around the middle day of the month. In the retrieval, the expected values for the surface reflectances are computed as an average of the three closest pixels in the monthly surface reflectance. Both the temporal variance in the original surface albedo product and the variance due to averaging are taken into account in the construction of the surface reflectance variance. - real-time analysis, the surface reflectance product for the retrieval day is not necessarily available. Therefore in the construction of the surface reflectance prior model, we used the MODIS albedo products corresponding to the retrieval month 1 year before the retrieval. This way it is possible to evaluate the near-real-time retrieval performance of the algorithm.
3.2 Observation model
In the DT algorithm, the TOA reflectance ρTOA,MODIS measured by MODIS is modeled according to Eq. (1) as a mixture of reflectances produced by two aerosol models: one for fine and one for coarse aerosols. The TOA reflectance corresponding to Lambertian surface, an aerosol model, and one MODIS band is computed as
where θ0, θ, and ϕ are the solar zenith, view zenith, and relative azimuth angles, respectively; denotes the atmospheric path reflectance; Tλ(θ0) and Tλ(θ) denote the downward and upward atmospheric transmissions; sλ is the atmospheric backscattering ratio; and the surface reflectance corresponding to a band centered at wavelength λ (Chandrasekhar, 1960; Lee and Kaufman, 1986).
To make the retrieval algorithm computationally efficient, the values of , Tλ, and sλ for various measurement geometries and AODs are precomputed into a LUT. Each aerosol model has their own LUT and the fine aerosol model to be used in the retrieval is predefined for each location and season. In the BAR retrieval, we use the same aerosol models as in the DT retrieval. In certain conditions, DT uses continental aerosol as the only aerosol model. If continental aerosol model was selected by the DT (Procedure B in MODIS DT over land retrieval), we use the continental aerosol model as the fine aerosol model and compute the total TOA reflectance as a mixture of TOA reflectances caused by the continental and coarse aerosol models.
Before the DT retrieval is carried out, the LUTs are prepared for the retrieval. The LUT models are first interpolated to the fixed measurement geometry and then corrected for the surface elevation. In the retrieval, the LUT models are then evaluated by linearly interpolating the values as function of total AOD. In BAR, we use the same LUTs (for four different bands) as in the DT. While the DT algorithm uses piecewise linear interpolation, in BAR we use fifth-order polynomial interpolation of the LUTs in order to make the model differentiable with respect to the unknown AOD at all points. The differentiability is required as the retrieval is carried out by solving an optimization problem using gradient-based methods.
In the BAR algorithm, the random observation noise in MODIS observations, for example due to measurement electronics in the instrument, is modeled by an additive noise process:
where n denotes the observation noise and is the observation model. In BAR, the observation noise is modeled as Gaussian zero-mean random variable, and its variances are based on MODIS aerosol product variable STD_Reflectance_Land.
3.3 Approximation errors
In the statistical (Bayesian) retrieval framework, it is possible to model the uncertainties and inaccuracies related to the physical models that are used in the retrieval (both aerosol and radiative transfer models). The model uncertainties can be related, for example, to uncertainty in the values of the auxiliary model parameters such as measurement geometry and fixed aerosol models. In the field of statistical inverse problems, these model errors are often referred to as approximation errors (Kaipio and Somersalo, 2007). In the BAR algorithm, we incorporate approximation errors due to fixed aerosol models and inaccuracies in the radiative transfer models. The approximation error is modeled as additive Gaussian random variable u. Adding u into the observation model (Eq. 5) results in observation model of the form
where includes both the observation noise and model uncertainties. The realization of u is unknown. The objective in the approximation error approach is to marginalize the posterior model with respect to the overall observation error. This means that we integrate the approximation error-related variables out of the full posterior probability distribution. This is a typical approach in statistics to treat unknown nuisance parameters. Typically, an approximate marginalization is obtained by using Gaussian model for n and u, leading to the data misfit form in Eq. (2) where 𝔼e and Γe are the mean and covariance of the overall error. For details, see Kolehmainen et al. (2011) and Kaipio and Kolehmainen (2013).
In this study, the estimation of the mean 𝔼u and covariance Γu for the Gaussian approximation error model is carried out by comparing collocated MODIS TOA reflectances with simulated TOA reflectances using AOD and FMF values from AERONET (Holben et al., 1998) observations (for details, see Appendix Appendix B). We model the approximation error u as spatially, but not spectrally, uncorrelated, meaning the correlations between MODIS bands are taken into account. The approximation error statistics are precomputed for different regions and months to account for spatial and seasonal variations. Similarly, as for the surface reflectance model, the approximation error models are constructed using AERONET and MODIS data collected 1 year before the retrieval month to make the evaluation of the near-real-time performance of the algorithm possible.
In BAR retrieval, we model the observation noise n and model uncertainties u as mutually uncorrelated and therefore in our model is distributed as .
To test the performance of the BAR algorithm, all MODIS daytime granules of the year 2015 are used. We retrieve all granules from Terra and Aqua (MOD04_D3 and MYD04_D3) and compare the retrievals to AERONET observations (version 3, level 1.5). In the AERONET collocation we follow similar comparison protocol as in Petrenko et al. (2012). That is, we require at least three MODIS pixels within 25 km from the AERONET station and at least two AERONET observations within ±30 min from the satellite overpass. We carry out two comparisons between retrievals with different algorithms:
-
To compare the overall performance and to make the comparison fair between different algorithms, we compare all pixels in which the retrieval was carried out regardless of the DT quality assurance (QA) information of the retrieval.
-
To study how the DT QA information affects the retrievals, we carry out another comparison in which we use the DT and BAR retrievals only at the pixels with DT QA flag 3.
In order to evaluate the near-real-time performance, we use the surface reflectance prior models and the uncertainty models that were constructed using MODIS and AERONET data from 2014 (1 year before the test year 2015). Also, as the approximation error statistics is generated using an independent AERONET dataset, the evaluation of the algorithm will not be using the same data and therefore not result in overoptimistic results that could be possible if same datasets were used for both modeling and evaluation of the algorithm.
The variables we compare are the AOD at 0.55 µm and Ångström exponent (AE). AERONET AOD at 0.55 µm is derived using the Ångström power law and AERONET Ångström exponent (440–675 nm). The AEs are used in the comparison instead of the FMF because
-
FMF in the DT algorithm is actually the weighting coefficient between the TOA reflectances corresponding to fine and coarse aerosol models and do not necessarily correspond to physical size distribution information;
-
in the DT aerosol models, the fine aerosol model includes a small amount of coarse particles in it and the coarse aerosol model includes a small amount of fine particles in it;
-
it is ambiguous to derive AERONET-based FMF as there are multiple size-distribution-related products that are based on slightly different algorithms and definitions;
-
it is possible to derive AE from MODIS retrieval using the aerosol models, retrieved total AOD, and FMF, and the AE is also available in the AERONET Direct Sun algorithm outputs.
The metrics we use to evaluate the retrieval algorithm performance and compare the MODIS and AERONET retrievals are correlation coefficient R, median bias, and root mean square error (RMSE). In addition, for AOD we also use the fraction of retrievals inside the DT expected error (EE) envelope ; that is we compute the fraction of MODIS AOD retrievals τMODIS that fulfill , where τAERONET denotes the AERONET AOD. To get an idea of regional performance of the algorithm, we evaluate the algorithm in nine different regions. The map of the regions and AERONET stations used for the evaluation is shown in Fig. 1. In addition, we also evaluate the retrieval algorithms over urban areas by comparing the retrievals over 17 selected AERONET stations that are located in urban areas. We also carry out a comparison between the BAR and DB retrievals. In addition, we evaluate the BAR posterior uncertainty estimates by comparing them to the discrepancies between AERONET and BAR algorithm AODs.

Figure 1Regions used in the evaluation of the algorithm: West North America (WNA), East North America (ENA), Central and South America (CSA), Europe (EUR), North Africa and Middle East (NAME), South Africa (SA), Northeast Asia (NEA), Southeast Asia (SEA), and Oceania (OCE). The red and blue dots show positions of all the AERONET stations used in the comparisons. The blue dots indicate stations classified as an urban station in the study.
5.1 Examples of single granule retrievals
Figure 2 shows AOD and AE retrievals near the Beijing area, China, on 11 October 2015, computed both with DT and BAR. The figure shows clearly that DT overestimates the AOD over the cities of Beijing and Tianjin. The overestimation may be caused by the urban surface that probably is not well described by the DT surface reflectance relationships used in the operational retrieval (Gupta et al., 2016b). The overestimation of AOD over urban areas due to surface may cause significant biases to, for example, the results of satellite-based air quality studies. In BAR, the AOD retrievals match the AERONET AODs well and cities of Beijing and Tianjin are not visible as high AOD areas in the figure. Furthermore, the DT AE retrievals over Beijing show AE values lower than 1, indicating large aerosol particles. The AERONET, however, shows AE larger than 1, indicating small aerosol particles. BAR shows AE values larger than 1 for almost all pixels shown in the figure.
Figure 3 shows AOD and AE retrievals over the USA on 10 July 2015. A smoke plume is clearly visible in the figure. In this case, both the DT and BAR produce similar AOD retrievals. The use of spatial correlation model for AOD in BAR can be seen as slight smoothing of the plume details when compared to the DT retrieval. In the BAR AE retrievals, the AE is larger than 1 in almost all pixels shown in the figure, indicating presence of small aerosol particles. In the DT AE retrieval, some pixels have AE values smaller than 1, showing presence of large aerosol particles. Large aerosol particles (small AE values) are not, however, typical for this area and season and therefore the small AE values, indicating large aerosol particle size seen in the DT data are likely artifacts caused by the retrieval algorithm. It should be noted, however, that the spatial correlation model for FMF may in some cases result in too smooth FMF fields that are unrealistic, for example in cases of smoke plumes, reducing the accuracy of the retrievals in these cases.
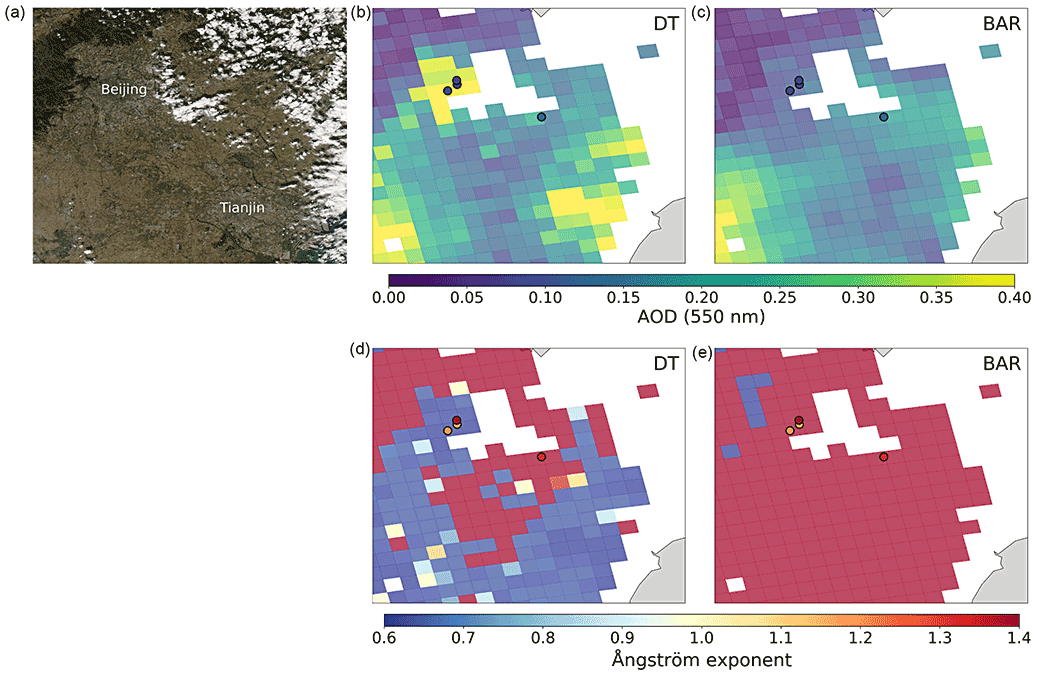
Figure 2(a, b, c) True color image of MODIS Aqua overpass over Beijing area, China, on 11 October 2015 (a), AOD retrievals computed with DT (b, d) and BAR (c, e) algorithms. (d, e) The Ångström exponent retrievals computed with DT (b, d), and BAR (c, e) algorithms. The circles correspond to AERONET AOD and Ångström exponent values at the satellite overpass time.

Figure 3(a, b, c) True color image of MODIS Aqua overpass near the border area of Minnesota and North and South Dakota, USA, on 10 July 2015 (a), AOD retrievals computed with DT (b, d), and BAR (c, e) algorithms. (d, e) The Ångström exponent retrievals computed with DT (b, d) and BAR (c, e) algorithms. The circles correspond to AERONET AOD and Ångström exponent values at the satellite overpass time.
5.2 Global performance of the algorithm
The global performance of the algorithm was evaluated using all the daytime retrievals from the year 2015. Figure 4 shows a global scatter density histogram comparison of the AERONET AOD and retrievals carried out with the DT, BAR, and DB algorithms. Figure 4 was constructed using all retrieved pixels regardless of the quality assurance values. It should be noted that the DT-based algorithms (DT and BAR) and DB algorithm apply different pre-processing of the data and the pixels in which the retrieval is carried out are selected differently. The DB algorithm was designed to be able to retrieve AOD also over bright-reflecting surfaces where the DT algorithm may not be used. Therefore, the DB algorithm usually accepts more pixels for retrieval than the DT algorithm. In this study, the number of AERONET–DB collocations (N= 57 308) was larger than the number of AERONET–DT collocations (N= 45 240). As BAR retrieves the same pixels as the DT algorithm there was no difference in the amount of data between these two retrieval algorithms. It should also be noted that the DT pixels are not necessarily a subset of the DB pixels and in some granules the DT and DB pixels may be completely separate sets.
The results show that the BAR AOD retrievals are significantly more accurate than the corresponding DT or DB retrievals when compared to the AERONET AOD. The fractions of retrievals inside the DT EE envelope () are 75.7, 54.6, and 64.6 % for BAR, DT, and DB, respectively. Furthermore, the median absolute errors are about 40 and 20 % smaller in BAR than in the DT and DB retrievals, respectively. Also the reduction in the median bias is significant: median biases for BAR, DT, and DB algorithms are 0.009, 0.046, and 0.020, respectively. The feature of both the BAR and DB retrievals that they do not allow for negative AOD retrievals is also visible in the figure. There are also clearly more AOD retrievals above the DT EE envelope than below it with all of the algorithms, but in the BAR the relative difference between the amount of retrievals above and below the envelope is the smallest.
Figure 5 shows similar plot as Fig. 4 but here the comparison was carried out using only the DT and BAR algorithms and pixels with DT QA flag 3 (Levy et al., 2013) for both algorithms. The results were slightly improved for both algorithms when compared with the all-pixel retrievals. Even though the difference between the performance of the algorithms is reduced, the BAR retrievals are clearly better than the DT retrievals. This is the result regardless of the filtering of the data that was carried out, based on the DT algorithm QA flag, which is designed to discard DT pixels with poor quality. The filtering reduced the amount of AERONET collocations by about 40 %. The results suggest that the BAR is not only capable of retrieving AOD with significantly improved accuracy than the DT retrieval but also capable of producing good quality retrievals over significantly larger areas.
The results for global AE retrievals for the DT and BAR algorithms are shown in Fig. 6. If AOD is very small, the reflectances observed by MODIS contain only a very small amount of information about the aerosol size distributions. Therefore, to evaluate the algorithm capability to retrieve size distribution information, we carried out the AE comparison only with retrievals that correspond to AERONET AODs larger than 0.2. The results in this figure include all retrieved pixels. The correlation coefficient is slightly better in DT AE (0.359) than in BAR AE (0.354) retrievals but the difference is negligible. The median and mean absolute errors and the median bias, however, are smaller in BAR retrievals. Visual inspection shows the BAR retrievals are better concentrated around the one-to-one line in the scatter plot whereas a large portion of DT retrievals are concentrated around the AE value of about 0.6.
We also evaluated the effect of using the approximation error model and spatial correlation models in the retrieval. The retrievals were carried out in all granules in year 2015 with and without the approximation error model and with and without the spatial correlation models for the AOD and FMF. In the retrievals without spatial correlation models, we set the off-diagonal elements of the prior covariance matrices as zeros both for AOD and FMF. The results are shown in Tables 2 and 3. The results show that the approximation error model plays the most significant role in improving the retrieval accuracy. Globally, the best correlation between the MODIS and AERONET retrievals is observed when the approximation error model is used and spatial correlation models are turned off. This result was unexpected as the spatial correlation models were expected on average to improve the retrieval accuracy. The results show, however, that the use of spatial correlation models does not increase the accuracy of the retrievals on average. These results, however, should be interpreted very carefully as they only show the global average statistics. In single retrieval cases, the spatial correlation models may be helpful especially in some specific scenarios or, for example, if higher spatial resolution were used. Also, the spatial correlation model parameters may play a significant role in the accuracy of the retrievals. Due to differences in local meteorology and aerosol sources, regional models for the spatial correlation may be needed to reach the best possible accuracy of the algorithm. In this study, the correlation model parameters were not based on a thorough analysis of aerosol properties correlation structures, and only a global correlation model was used. As the aerosol properties usually have clear spatial correlation we would recommend using the spatial correlation models in the retrievals.
Table 2Global statistics of AOD retrievals for Bayesian aerosol retrieval (BAR) run with different models. The models considered are the approximation error model and the spatial correlation model for AOD and FMF. X and – in the table indicate that the corresponding model was and was not included in the retrieval, respectively. All pixels were considered in the retrieval and each row correspond to data from 346 AERONET stations and 45 240 collocated observations.
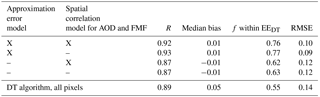
Table 3Global statistics of Ångström exponent retrievals for Bayesian aerosol retrieval (BAR) run with different models. The models considered are the approximation error model and the spatial correlation model for AOD and FMF. X and – in the table indicate that the corresponding model was and was not included in the retrieval, respectively. Only results with AERONET AOD ≥ 0.2 were used in the MODIS–AERONET comparison. All pixels were considered in the retrieval and each row correspond to data from 302 AERONET stations and 10 354 collocated observations.
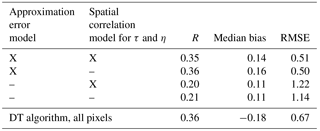
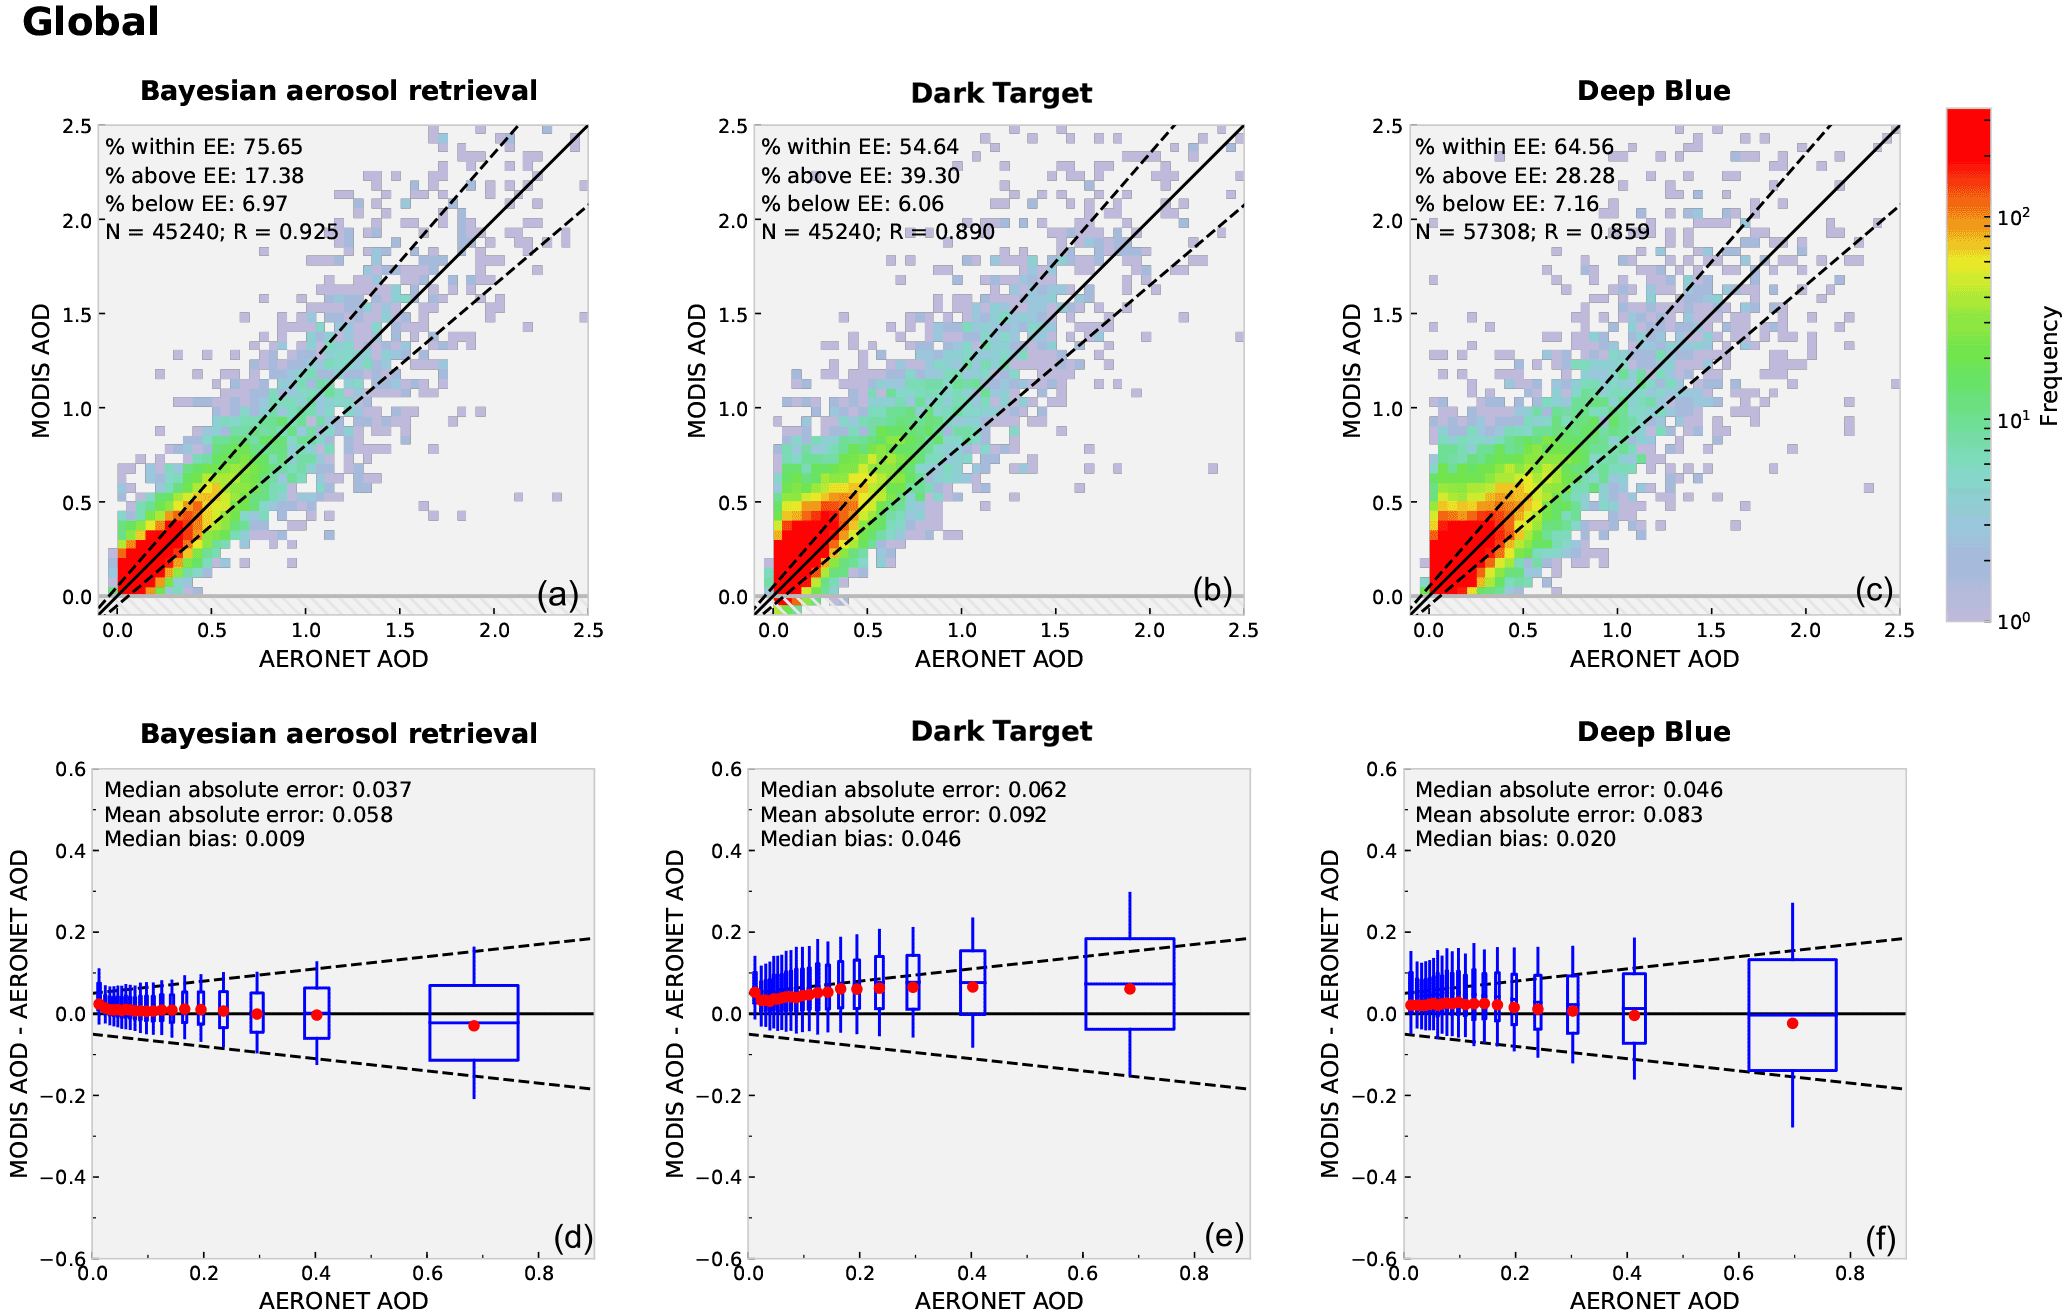
Figure 4(a, b, c) Scatter density histograms comparing global AERONET and MODIS Bayesian aerosol retrieval (a), MODIS Dark Target (b), and MODIS Deep Blue (c) AOD retrievals. The solid black line represents the 1:1 line and the dashed lines the MODIS Dark Target expected error envelope. (d, e, f) The retrieval error for MODIS Bayesian aerosol retrieval (d), MODIS Dark Target (e), and MODIS Deep Blue (f) retrievals plotted as function of AERONET AOD. The red dots and the horizontal lines inside the boxes represent the median and mean values of MODIS AOD error, respectively. The box height and whiskers represent the 1 and 2 standard deviation intervals of the MODIS AOD retrieval error, respectively. The width of the box corresponds to the standard deviations of the AOD bin.
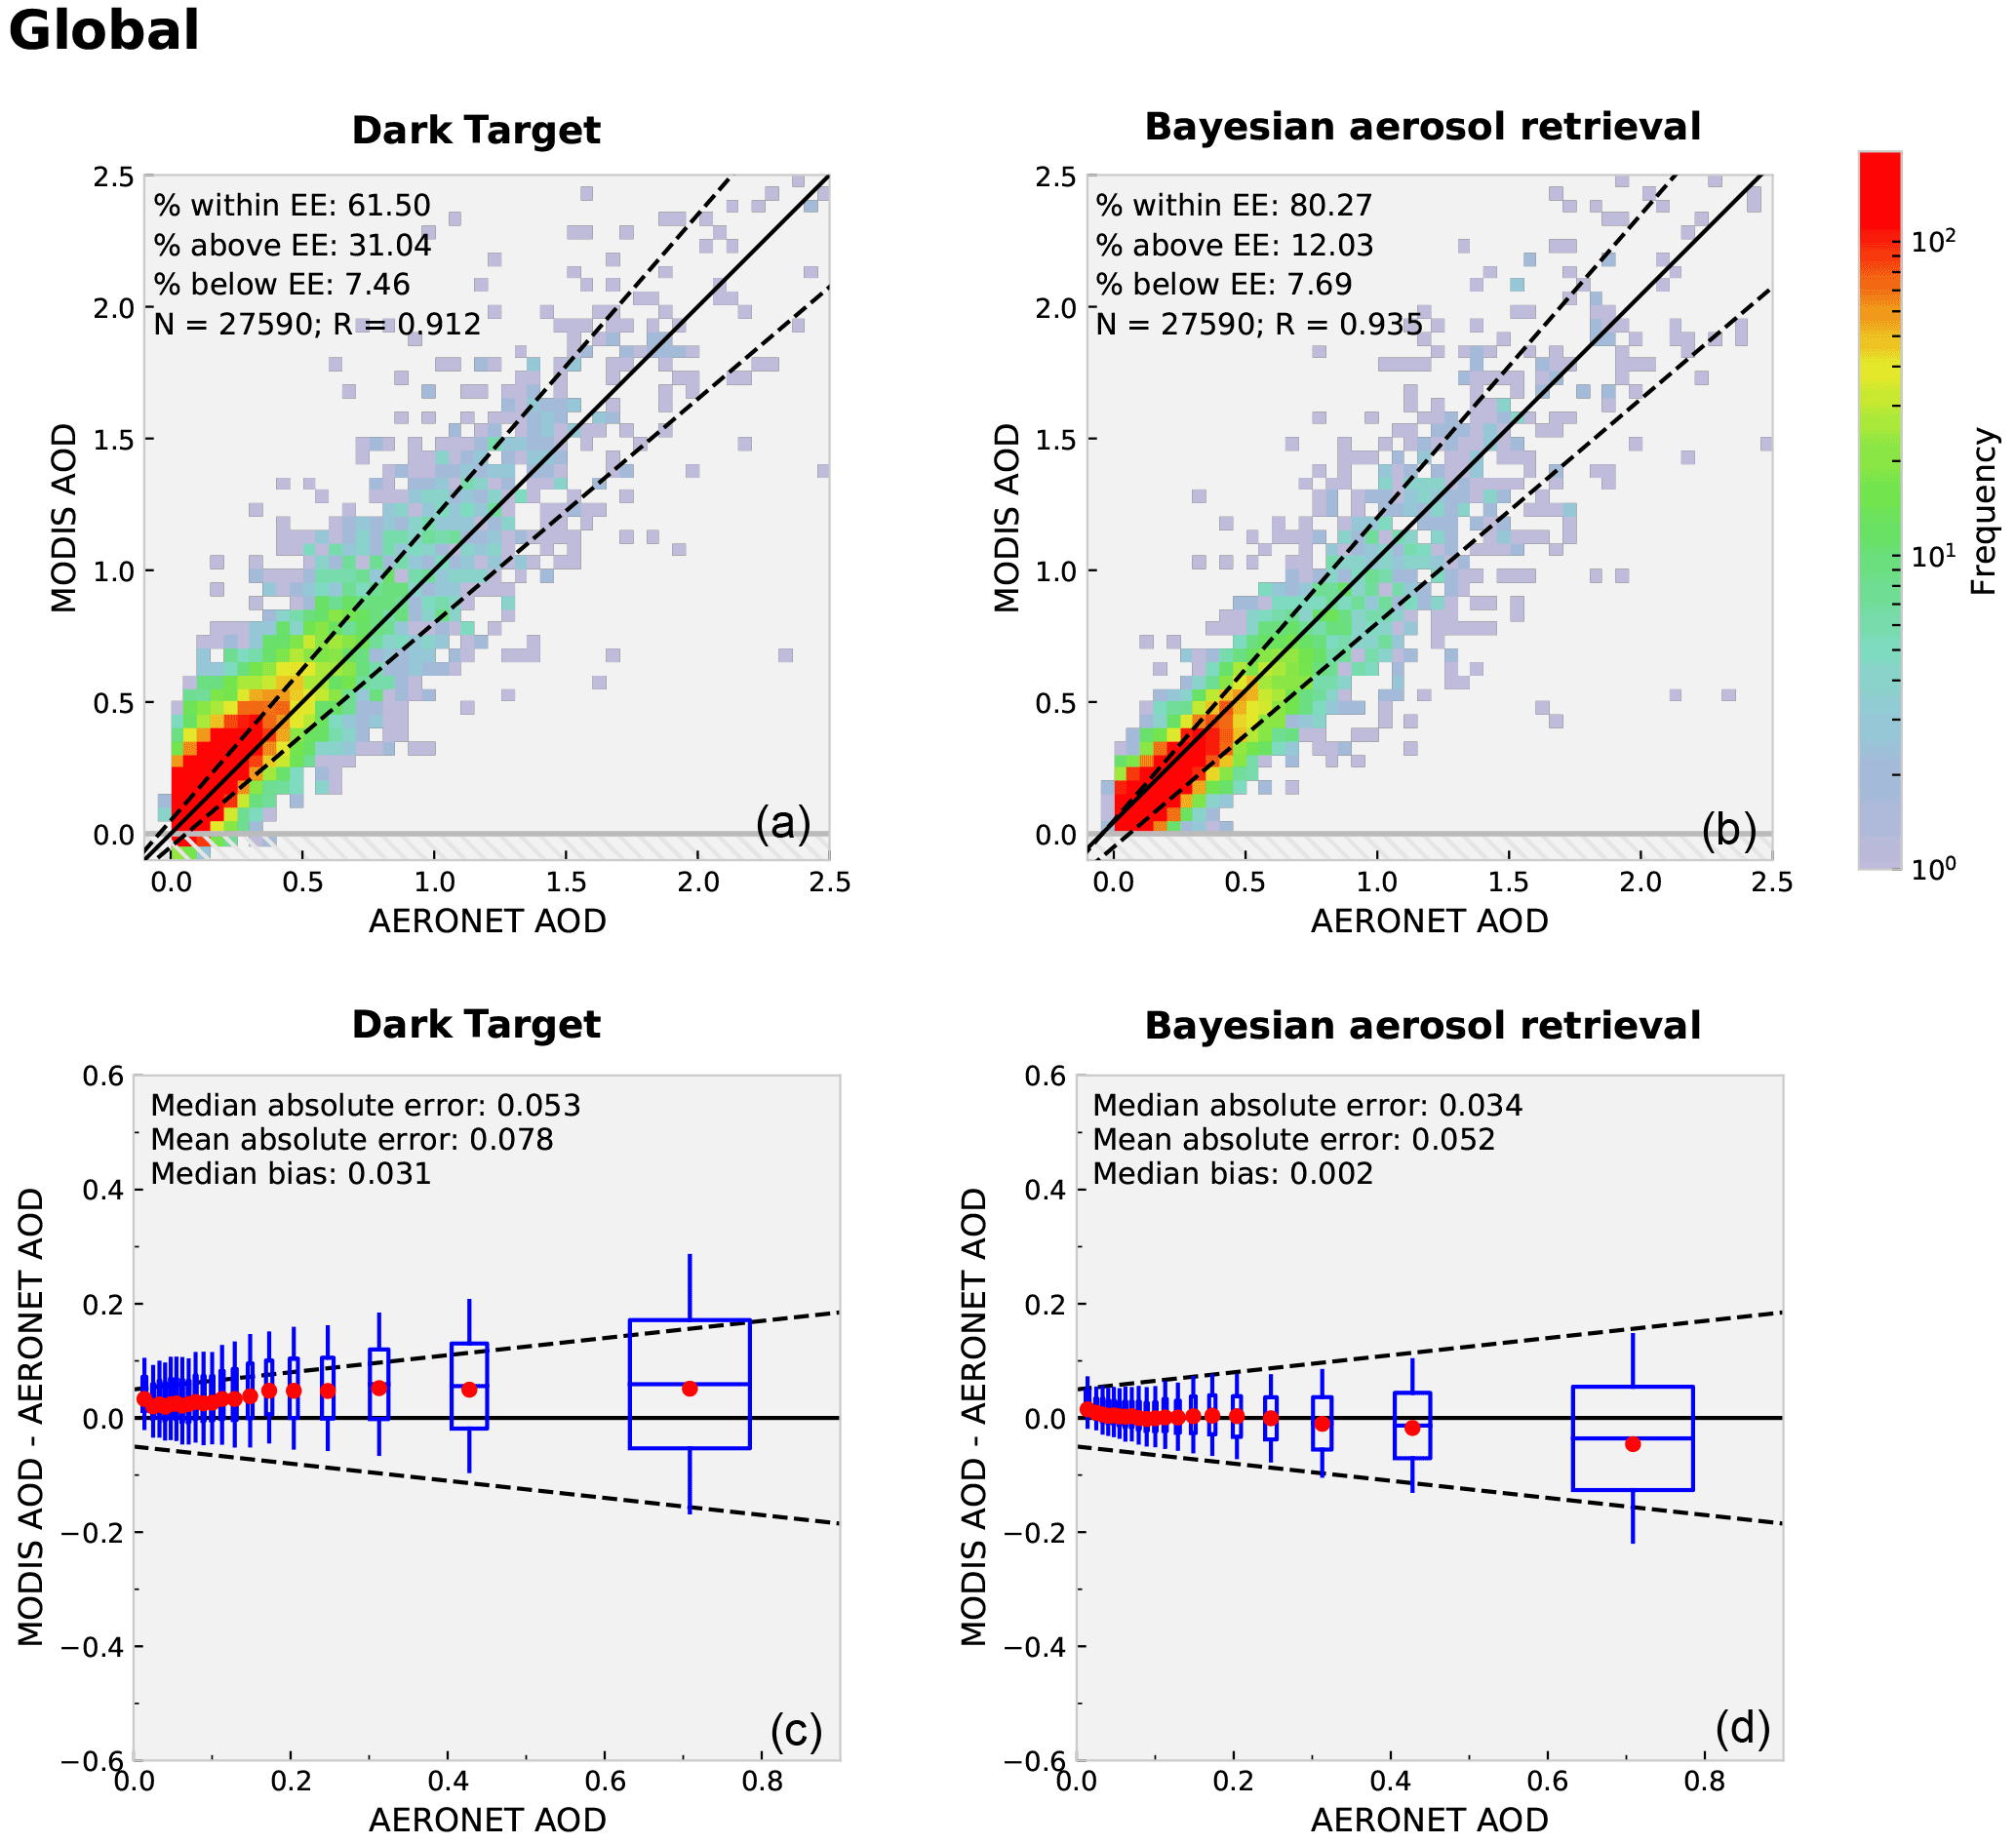
Figure 5Similar figure as Fig. 4 but only for MODIS Dark Target and MODIS Bayesian aerosol retrieval algorithms and corresponding only to pixels with MODIS DT quality assurance class value of 3.

Figure 6(a, b) Scatter density histograms comparing global AERONET and MODIS Dark Target (a) and MODIS Bayesian aerosol retrieval (b) Ångström exponent retrievals. The solid black line represents the 1:1 line. (c, d) The retrieval error for MODIS Dark Target (c) and MODIS Bayesian aerosol retrieval (d) retrievals plotted as function of AERONET Ångström exponent. The red dots and horizontal lines inside the boxes represent the median and mean values of MODIS Ångström error. The box height and whiskers represent the 1−σ and 2−σ intervals of the MODIS Ångström retrieval error. The width of the box corresponds to the 1−σ of Ångström exponent bin.
5.3 Regional performance of the algorithm
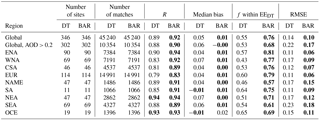
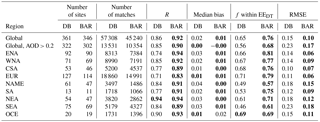
The global and regional results of the DT and BAR AOD retrievals with respect to the AERONET are shown in Table 4. The results show that the BAR AOD retrievals are significantly better than the DT retrievals globally and in most of the regions. The BAR algorithm performed better than or equal to the DT algorithm in all regions when measured in RMSE, correlation coefficient R, and fraction of retrievals inside the EE envelope. The AOD median bias is slightly worse only in Oceania (OCE; DT median bias −0.01, BAR median bias 0.02). The table shows that the largest improvements in the retrieval accuracy are seen in North America. The fraction of retrievals inside the EE envelope increased from 57 to 81 % in East North America (ENA) and from 43 to 77 % in West North America (WNA) when BAR retrieval was used instead of DT. The worst regional performance when measured with the correlation with AERONET AOD was in Europe (EUR). The worst regional performance when measured with the fraction of retrievals inside the EE envelope in BAR algorithm was in the North Africa/Middle East (NAME) region. This is probably explained by the surface type and frequent dust events in the region. It is also possible that the BAR algorithm may weight the fine aerosol model too much in this area, resulting in reduced retrieval accuracy for AOD.
Table 4Global and regional statistics of AOD retrievals for Dark Target (DT) and Bayesian aerosol retrieval (BAR) retrieval algorithms. All DT quality assurance classes are considered. Bolded numbers indicate the algorithm with better performance.
The global and regional results of the DT and BAR AE retrievals are shown in Table 5. The BAR AE retrievals have lower RMSE than the DT AE retrievals in all regions except Northeast Asia (NEA). The median bias in the retrieved AE is also smaller with BAR in most of the regions. In NAME, South Africa (SA), and Southeast Asia (SEA) the bias is, however, larger in the BAR retrievals. Especially in NAME region, the median bias is significantly higher in BAR retrievals and this presumably is an indication of the problems in correctly retrieving the AE in dust cases over relatively bright surfaces.
Global and regional AOD accuracy comparisons between the BAR and DB retrievals are shown in Table 6. The results show that the retrieval accuracy of BAR is clearly better than the one of DB. All retrieval metrics are similar or better for BAR algorithm in all regions except in OCE where the DB median bias is slightly better. Figures of retrieval comparisons between the BAR and DB algorithms are in the Supplement.
Table 5Global and regional statistics of Ångström exponent retrievals for Dark Target (DT) and Bayesian aerosol retrieval (BAR) algorithms. All DT QA flags are considered. Only retrievals with AERONET AOD larger than 0.2 were included. Bolded numbers indicate the algorithm with better performance.
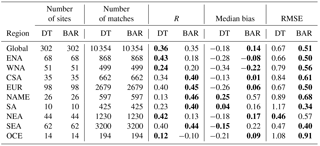
Table 6Global and regional statistics of AOD retrievals for Deep Blue (DB) and Bayesian aerosol retrieval (BAR) algorithms. All pixels are considered. Bolded numbers indicate the algorithm with better performance.
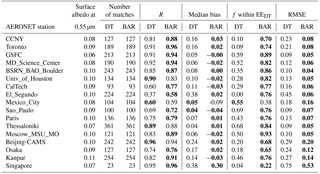
5.4 Retrieval over urban areas
AOD retrievals over urban areas were evaluated by comparing the MODIS AOD retrievals over AERONET stations that are located in urban areas. We selected 17 AERONET stations for this comparison and the results are presented in Table 7. Results indicate that the BAR AOD retrievals are significantly better than the DT retrievals at all but one station (Mexico City). As discussed in Sect. 5.1, the properties of the surface reflectance in urban areas might not be well represented in the DT retrievals. The problem with urban surfaces in DT is a well-known problem and in Gupta et al. (2016b) a modified surface reflectance relationship was proposed to be used over urban areas. BAR algorithm seems to better handle the urban surfaces than the DT algorithm and carries out the AOD retrieval with similar accuracy as for the surrounding regions. Table 7 also shows the mean black-sky surface albedo for the year 2015 near the AERONET station based on MCD43D3 product. There seems to be no clear connection between the black-sky surface albedo and the retrieval accuracy. More detailed results from the comparison between the BAR and DB retrievals over urban areas is shown in the Supplement.
Table 7Statistics of AOD retrievals for Dark Target (DT) and Bayesian aerosol retrieval (BAR) algorithms over urban AERONET stations. The location information for the AERONET sites can be found at the AERONET web page https://aeronet.gsfc.nasa.gov/.
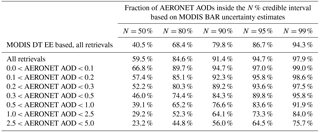
5.5 Per-pixel posterior uncertainty estimates of the retrieved parameters
The BAR algorithm provides approximate posterior uncertainties for retrieved quantities. We evaluate the AOD posterior uncertainty estimates of the BAR algorithm by comparing them to the discrepancies between the BAR retrievals and AERONET observations. Table 8 shows comparison of the uncertainty estimates and the retrieval errors as a function of AERONET AOD. Credibility intervals corresponding to the MODIS DT EE envelope are also computed and presented in the table. The table shows that BAR is capable of producing feasible uncertainty estimates. The comparison with the DT EE-based uncertainty estimates show that the BAR pixel-based uncertainties give on average more realistic estimates for the uncertainties related to the retrieved quantities over AERONET stations. On average the BAR uncertainty estimates were slightly larger than the true retrieval errors. In addition, the results also show that the BAR uncertainty estimates corresponding to large AOD values are often overoptimistic. This means that the pixel-level uncertainty estimates tend to be too low when the AOD is larger than 0.5.
Table 8Fraction of AERONET AODs inside 50, 80, 90, 95, and 99 % credible intervals based on MODIS BAR uncertainty estimates. For comparison also MODIS DT expected error (EE) envelope-based results are shown corresponding to DT retrievals.
A new AOD retrieval algorithm, Bayesian aerosol retrieval (BAR), was developed. The algorithm is based on the widely used MODIS DT algorithm. In the BAR algorithm, the inverse retrieval problem is formulated in a statistical (Bayesian) framework that allows systematic use of probabilistic models for prior information and approximation errors related to inaccuracies in the physical observation models and pixel-based uncertainty quantification for the retrieved parameters. In the BAR algorithm, the retrieved unknown parameters are the total AOD at 0.550 µm, FMF, and surface reflectances at 0.45, 0.55, 0.64, and 2.1 µm. The retrieval is carried out simultaneously in all the dark land pixels of a granule.
The BAR algorithm was evaluated by retrieving all MODIS granules from the year 2015 and compared with AERONET AOD and AE. Results showed that by using the BAR algorithm the accuracy of the AOD retrievals was significantly improved when compared to both DT and DB retrievals. Globally, the fraction of AOD retrievals inside the DT EE envelope increased from 55 to 76 % when BAR was used instead of DT. Moreover, the median bias in AOD was improved, and globally the bias was 0.01 while the bias of the DT algorithm was 0.05. The AOD retrievals were improved in all studied regions and the largest improvement was found in North America. Oceania was the region with the smallest improvement. The AE retrievals were also improved in most of the regions when BAR was used instead of the DT algorithm, but the improvement was not as clear as for the AOD. The reason why the AE did not improve similarly as the AOD retrievals is a topic of future research.
The BAR algorithm gives approximate posterior uncertainties in the retrieved parameters for each pixel. We compared the AOD uncertainty estimates with absolute values of retrieval errors over AERONET stations. The results show that BAR is capable of producing feasible uncertainty estimates for AOD.
The average retrieval time with the BAR algorithm was less than 1 min per granule on a modern personal computer and therefore the computational costs of the algorithm allow the use of BAR for near-real-time processing of MODIS data. The BAR algorithm is not restricted to MODIS retrievals only and by writing the observation models for different instruments it is possible to extend the algorithm to be used for aerosol retrievals with other instruments as well. The results show that modeling and taking into account the spatial correlations of unknown parameters and model uncertainties in the retrieval may significantly improve the accuracy of the retrievals. The inversion framework is not restricted to aerosol retrieval only and could be used for other types of remote sensing applications, such as cloud and trace gas retrievals.
The first version of the BAR algorithm was constructed especially to evaluate the feasibility and accuracy of the new modeling and inversion approach and many models and selections can still be improved to make the algorithm better. The planned improvements for the BAR algorithm in the future include the following:
-
Use of all possible MODIS bands. BAR algorithm is capable of utilizing all possible data and use of more MODIS bands will most likely improve the retrieval accuracy.
-
Spatial correlation models for the surface reflectance. More accurate models for the surface reflectance would improve the retrieval accuracy.
-
Retrievals over bright surfaces. Extension of the algorithm to retrievals over bright-reflecting surfaces is a straightforward task as the Deep Blue retrievals have already shown that it is possible to use MODIS data for aerosol retrievals over bright surfaces.
-
High-resolution retrievals. In high-resolution pixel-by-pixel retrievals, the anisotropic and non-smooth surface reflectance, and residual cloud contamination are major sources of uncertainties and may lead to poor retrieval accuracy. BAR takes into account the spatial correlations of aerosol properties and this may make the algorithm more tolerant to higher uncertainties. Therefore, the use of BAR would especially improve the high-resolution (3 km) aerosol retrievals.
-
Data fusion with AERONET. In the statistical inversion framework it is a straightforward task to include other data sources into the retrieval. Use of both MODIS and AERONET data together in a joint retrieval would combine the wide coverage of MODIS and the accuracy of AERONET for producing improved retrievals of the parameters.
-
Over ocean retrievals. If a suitable prior model for the ocean surface reflectance is used, BAR algorithm can be used also for over ocean retrievals.
The MAC-v2 climatology used for prior models was downloaded from ftp://ftp-projects.zmaw.de/aerocom/climatology/MACv2_2017/550nm_2005/. The radiative transfer lookup tables that are publicly available with Dark Target standalone code at https://darktarget.gsfc.nasa.gov/reference/code were used in BAR. The AERONET V3 data used in this study were downloaded from the NASA AERONET server at http://aeronet.gsfc.nasa.gov/. The MODIS data used in this study were downloaded from the NASA Level 1 and Atmosphere Archive and Distribution System (LAADS) at https://ladsweb.nascom.nasa.gov/. The Bayesian aerosol retrieval algorithm code, short documentation, and prior and uncertainty models are available at https://doi.org/10.5281/zenodo.1182939 (Lipponen, 2018).
Let
be the observation model describing the relationship between the AOD (τ), FMF (η), the surface reflectances at 0.47, 0.55, 0.64, and 2.1 µm (ρs), the measurement geometry and aerosol-model-related parameters (γ) and the simulated TOA reflectances (). The measurement noise and model-related uncertainties are included in the additive noise term e. It should be noted that all the above variables represent the values of all dark surface pixels in a granule and are therefore vector valued. The complete model of a statistical inverse problem is the posterior distribution
that is the conditional joint probability distribution for AOD τ, FMF η, and surface reflectance ρs values given the true MODIS-observed TOA reflectances ρTOA,MODIS. Here π denotes a probability distribution. From the posterior distribution, different point estimates and uncertainty estimates are usually computed and used to infer the retrieved parameters.
Applying the well-known Bayes theorem to the posterior distribution (Eq. A2), it can be written as
where is the likelihood distribution describing the relationship between the observed reflectances and the unknown parameters, is the prior distribution that can be used to model the information we have on unknown parameters (e.g., non-negativity, spatial correlation structures) prior to the observations, and π(ρTOA) is the evidence term that describes the probability of the event we observe. Usually, the evidence term is unknown, but as the observations have already been made and the value of ρTOA is fixed, it may be treated as a normalization constant which is not needed in the computation of the estimates.
We model the AOD, FMF, and surface reflections as uncorrelated and the noise term e, as an additive noise observation model Eq. (A1). Thus, the likelihood distribution takes the form (Kolehmainen et al., 2011; Kaipio and Kolehmainen, 2013)
where πe is the probability distribution of the measurement noise and approximation errors e, and ρTOA,MODIS denotes the actual reflectances measured by the MODIS.
Combining Eqs. (A3) and (A3) we get
In this study, we model the term e as a Gaussian distributed random variable:
where 𝔼e and Γe denote the expected value and covariance matrix of e. We also model the prior information for AOD τ, FMF η, and surface reflectance ρs as Gaussian distributed. Furthermore, we assume that AOD τ, FMF η, and surface reflectances ρs are mutually uncorrelated with prior models:
These selections result in a posterior distribution of
We select to look for the parameters τ,η and ρs that maximize the value of the posterior distribution (Eq. A5). This estimate is known as the maximum a posteriori (MAP) estimate. The MAP estimate may be found at the minimum of the minus logarithm of the posterior distribution as
where Le, Lτ, Lη, and are the Cholesky factors of the inverse covariance matrices , , , and , respectively.
In the BAR algorithm, we construct an approximation error model that describes the uncertainties and inaccuracies in the simulated TOA reflectances due to imperfect models and unknown aerosol and surface parameters. The construction of the model is based on simulated TOA reflectances that are compared with the reflectances measured by the MODIS instrument. In the construction of the approximation error model, the MODIS measurements are considered as the ground truth measurements.
Let
be the TOA reflectances simulated with the DT LUT model. Here γ denotes the auxiliary (fixed) model parameters such as measurement geometry, surface elevation, and aerosol models. We assume that AERONET can accurately measure the aerosol properties AOD τAERONET and FMF ηAERONET and that the MODIS MCD43C3 product can be used to derive accurate estimates for the surface reflectances ρs,MCD43C3. The contribution of uncertainties (mostly due to fixed DT aerosol and LUT models) in the simulated TOA reflectances corresponding to a single MODIS–AERONET collocated measurement can be computed as the discrepancy between the simulated and observed TOA reflectances at the AERONET station location as
In the BAR algorithm, we use N AERONET–MODIS collocations to compute a database of simulation–MODIS TOA reflectance discrepancies for all regions (shown in Fig. 1) and months. We model n as Gaussian multivariate random variable and estimate the expected value and covariance matrix as sample average and sample covariance of {n}. To minimize the effect of outliers to the uncertainty model we use the median instead of sample average. AERONET data do not directly include AERONET FMF ηAERONET. Therefore, the AERONET FMF is computed using a search approach in which the FMF values are tested and the one that produces the best match with the AERONET AE is selected as the ηAERONET.
The supplement related to this article is available online at: https://doi.org/10.5194/amt-11-1529-2018-supplement.
The authors declare that they have no conflict of interest.
We thank the AERONET PIs and their staff for establishing and maintaining
the AERONET sites used in this investigation.
We thank NASA MODIS team to kindly make the MODIS data publicly available.
Ville Kolehmainen acknowledges the Academy of Finland (Project 250215,
Finnish Centre of Excellence in Inverse Problems Research).
Edited by: Alexander Kokhanovsky
Reviewed by: Adam Povey and two anonymous referees
Anderson, T. L., Charlson, R. J., Winker, D. M., Ogren, J. A., and Holmén, K.: Mesoscale variations of tropospheric aerosols, J. Atmos. Sci., 60, 119–136, 2003. a, b
Byrd, R. H., Lu, P., Nocedal, J., and Zhu, C.: A limited memory algorithm for bound constrained optimization, SIAM J. Sci. Comput., 16, 1190–1208, 1995. a
Calvetti, D. and Somersalo, E.: An Introduction to Bayesian Scientific Computing: Ten Lectures on Subjective Computing, vol. 2, Springer Science & Business Media, 2007. a
Chandrasekhar, S.: Radiative transfer, Dover, New York, 1960. a
Chatterjee, A., Michalak, A., Kahn, R., Paradise, S., Braverman, A., and Miller, C.: A geostatistical data fusion technique for merging remote sensing and ground-based observations of aerosol optical thickness, J. Geophys. Res.-Atmos., 115, D20207, https://doi.org/10.1029/2009JD013765, 2010. a
Cohen, A. J., Brauer, M., Burnett, R., Anderson, H. R., Frostad, J., Estep, K., Balakrishnan, K., Brunekreef, B., Dandona, L., Dandona, R., Feigin, V., Freedman, G., Hubbell, B., Jobling, A., Kan, H., Knibbs, L., Liu, Y., Martin, R., Morawska, L., Pope, C. A., Shin, H., Straif, K., Shaddick, G., Thomas, M., van Dingenen, R., van Donkelaar, A., Vos, T., Murray, C. J. L., and Forouzanfar, M. H.: Estimates and 25-year trends of the global burden of disease attributable to ambient air pollution: an analysis of data from the Global Burden of Diseases Study 2015, Lancet, 389, 1907–1918, 2017. a
Dockery, D. W., Pope, C. A., Xu, X., Spengler, J. D., Ware, J. H., Fay, M. E., Ferris Jr, B. G., and Speizer, F. E.: An association between air pollution and mortality in six US cities, New Engl. J. Med., 329, 1753–1759, 1993. a
Gelman, A., Carlin, J. B., Stern, H. S., and Rubin, D. B.: Bayesian data analysis, vol. 2, Chapman & Hall/CRC Boca Raton, FL, USA, 2014. a
Gupta, P., Levy, R. C., Mattoo, S., Remer, L. A., and Munchak, L. A.: A surface reflectance scheme for retrieving aerosol optical depth over urban surfaces in MODIS Dark Target retrieval algorithm, Atmos. Meas. Tech., 9, 3293–3308, https://doi.org/10.5194/amt-9-3293-2016, 2016a. a
Gupta, P., Levy, R. C., Mattoo, S., Remer, L. A., and Munchak, L. A.: A surface reflectance scheme for retrieving aerosol optical depth over urban surfaces in MODIS Dark Target retrieval algorithm, Atmos. Meas. Tech., 9, 3293–3308, https://doi.org/10.5194/amt-9-3293-2016, 2016b. a, b
Holben, B. N., Eck, T. F., Slutsker, I., Tanre, D., Buis, J. P., Setzer, A., Vermote, E., Reagan, J. A., Kaufman, Y. J., Nakajima, T., Lavenu, F., Jankowiak, I., and Smirnov, A: AERONET – A federated instrument network and data archive for aerosol characterization, Remote Sens. Environ., 66, 1–16, 1998. a
Hsu, N., Jeong, M.-J., Bettenhausen, C., Sayer, A., Hansell, R., Seftor, C., Huang, J., and Tsay, S.-C.: Enhanced Deep Blue aerosol retrieval algorithm: The second generation, J. Geophys. Res.-Atmos., 118, 9296–9315, 2013. a
Hsu, N. C., Tsay, S.-C., King, M. D., and Herman, J. R.: Aerosol properties over bright-reflecting source regions, IEEE T. Geosci. Remote, 42, 557–569, 2004. a
Hyer, E. J., Reid, J. S., and Zhang, J.: An over-land aerosol optical depth data set for data assimilation by filtering, correction, and aggregation of MODIS Collection 5 optical depth retrievals, Atmos. Meas. Tech., 4, 379–408, https://doi.org/10.5194/amt-4-379-2011, 2011. a
IPCC: Climate Change 2013: The Physical Science Basis. Contribution of Working Group I to the Fifth Assessment Report of the Intergovernmental Panel on Climate Change, Cambridge University Press, Cambridge, United Kingdom and New York, NY, USA, https://doi.org/10.1017/CBO9781107415324, 2013. a
Kaipio, J. and Kolehmainen, V.: Approximate marginalization over modeling errors and uncertainties in inverse problems, in: Bayesian Theory and Applications, edited by: Damien, P., Dellaportas, P., Polson, N., and Stephens, D., Oxford University Press, 644–672, 2013. a, b
Kaipio, J. and Somersalo, E.: Statistical and computational inverse problems, Springer, New York, 2005. a
Kaipio, J. and Somersalo, E.: Statistical inverse problems: discretization, model reduction and inverse crimes, J. Comput. Appl. Math., 198, 493–504, 2007. a
Kaufman, Y., Tanré, D., Remer, L. A., Vermote, E., Chu, A., and Holben, B.: Operational remote sensing of tropospheric aerosol over land from EOS moderate resolution imaging spectroradiometer, J. Geophys. Res.-Atmos., 102, 17051–17067, 1997a. a
Kaufman, Y. J., Wald, A. E., Remer, L. A., Gao, B.-C., Li, R.-R., and Flynn, L.: The MODIS 2.1-um channel-correlation with visible reflectance for use in remote sensing of aerosol, IEEE T. Geosci. Remote, 35, 1286–1298, 1997b. a
Kaufman, Y. J., Tanré, D., and Boucher, O.: A satellite view of aerosols in the climate system, Nature, 419, 215–223, 2002. a
Kinne, S., O'Donnel, D., Stier, P., Kloster, S., Zhang, K., Schmidt, H., Rast, S., Giorgetta, M., Eck, T. F., and Stevens, B.: MAC-v1: A new global aerosol climatology for climate studies, J. Adv. Model. Earth Sy., 5, 704–740, https://doi.org/10.1002/jame.20035, 2013. a
Kolehmainen, V., Tarvainen, T., Arridge, S. R., and Kaipio, J. P.: Marginalization of uninteresting distributed parameters in inverse problems-application to diffuse optical tomography, Int. J. Uncertain. Quan., 1, 1–17, 2011. a, b
Lee, T. Y. and Kaufman, Y. J.: Non-Lambertian effects on remote sensing of surface reflectance and vegetation index, IEEE T. Geosci. Remote, GE-24, 699–708, 1986. a
Levy, R. C., Mattoo, S., Munchak, L. A., Remer, L. A., Sayer, A. M., Patadia, F., and Hsu, N. C.: The Collection 6 MODIS aerosol products over land and ocean, Atmos. Meas. Tech., 6, 2989–3034, https://doi.org/10.5194/amt-6-2989-2013, 2013. a, b, c, d
Levy, R. C., Remer, L. A., Mattoo, S., Vermote, E. F., and Kaufman, Y. J.: Second-generation operational algorithm: Retrieval of aerosol properties over land from inversion of Moderate Resolution Imaging Spectroradiometer spectral reflectance, J. Geophys. Res.-Atmos., 112, D13211, https://doi.org/10.1029/2006JD007811, 2007. a
Lipponen, A.: Bayesian Aerosol Retrieval algorithm for MODIS aerosol retrieval over land, version 1.0, https://doi.org/10.5281/zenodo.1182939, 2018.
Lyapustin, A., Martonchik, J., Wang, Y., Laszlo, I., and Korkin, S.: Multiangle implementation of atmospheric correction (MAIAC): 1. Radiative transfer basis and look-up tables, J. Geophys. Res.-Atmos., 116, D03210, https://doi.org/10.1029/2010JD014985, 2011a. a
Lyapustin, A., Wang, Y., Laszlo, I., Kahn, R., Korkin, S., Remer, L., Levy, R., and Reid, J.: Multiangle implementation of atmospheric correction (MAIAC): 2. Aerosol algorithm, J. Geophys. Res.-Atmos., 116, D03211, https://doi.org/10.1029/2010JD014986, 2011b. a
Mielonen, T., Levy, R. C., Aaltonen, V., Komppula, M., de Leeuw, G., Huttunen, J., Lihavainen, H., Kolmonen, P., Lehtinen, K. E. J., and Arola, A.: Evaluating the assumptions of surface reflectance and aerosol type selection within the MODIS aerosol retrieval over land: the problem of dust type selection, Atmos. Meas. Tech., 4, 201–214, https://doi.org/10.5194/amt-4-201-2011, 2011. a
Petrenko, M., Ichoku, C., and Leptoukh, G.: Multi-sensor Aerosol Products Sampling System (MAPSS), Atmos. Meas. Tech., 5, 913–926, https://doi.org/10.5194/amt-5-913-2012, 2012. a
Pope III, C. A., Burnett, R. T., Thun, M. J., Calle, E. E., Krewski, D., Ito, K., and Thurston, G. D.: Lung cancer, cardiopulmonary mortality, and long-term exposure to fine particulate air pollution, Jama, 287, 1132–1141, 2002. a
Remer, L. A., Wald, A. E., and Kaufman, Y. J.: Angular and seasonal variation of spectral surface reflectance ratios: Implications for the remote sensing of aerosol over land, IEEE T. Geosci. Remote, 39, 275–283, 2001. a
Seaton, A., Godden, D., MacNee, W., and Donaldson, K.: Particulate air pollution and acute health effects, Lancet, 345, 176–178, 1995. a
- Abstract
- Introduction
- Bayesian aerosol retrieval algorithm
- Bayesian aerosol retrieval models
- Evaluation of the algorithm
- Results
- Conclusions
- Code and data availability
- Appendix A: Derivation of the optimization problem in Eq. (2)
- Appendix B: Construction of the approximation error model
- Competing interests
- Acknowledgements
- References
- Supplement