the Creative Commons Attribution 3.0 License.
the Creative Commons Attribution 3.0 License.
Online differentiation of mineral phase in aerosol particles by ion formation mechanism using a LAAP-TOF single-particle mass spectrometer
Nicholas A. Marsden
Michael J. Flynn
James D. Allan
Mineralogy of silicate mineral dust has a strong influence on climate and ecosystems due to variation in physiochemical properties that result from differences in composition and crystal structure (mineral phase). Traditional offline methods of analysing mineral phase are labour intensive and the temporal resolution of the data is much longer than many atmospheric processes. Single-particle mass spectrometry (SPMS) is an established technique for the online size-resolved measurement of particle composition by laser desorption ionisation (LDI) followed by time-of-flight mass spectrometry (TOF-MS). Although non-quantitative, the technique is able to identify the presence of silicate minerals in airborne dust particles from markers of alkali metals and silicate molecular ions in the mass spectra. However, the differentiation of mineral phase in silicate particles by traditional mass spectral peak area measurements is not possible. This is because instrument function and matrix effects in the ionisation process result in variations in instrument response that are greater than the differences in composition between common mineral phases.
In this study, we introduce a novel technique that enables the differentiation of mineral phase in silicate mineral particles by ion formation mechanism measured from subtle changes in ion arrival times at the TOF-MS detector. Using a combination of peak area and peak centroid measurements, we show that the arrangement of the interstitial alkali metals in the crystal structure, an important property in silicate mineralogy, influences the ion arrival times of elemental and molecular ion species in the negative ion mass spectra. A classification scheme is presented that allowed for the differentiation of illite–smectite, kaolinite and feldspar minerals on a single-particle basis. Online analysis of mineral dust aerosol generated from clay mineral standards produced mineral fractions that are in agreement with bulk measurements reported by traditional XRD (X-ray diffraction) analysis.
- Article
(5067 KB) - Full-text XML
-
Supplement
(545 KB) - BibTeX
- EndNote


Aerosol has a strong environmental impact by affecting climate, atmospheric processes, ecosystems, human health and visibility. Airborne mineral dust, which accounts for a large fraction of the global aerosol burden (Cakmur et al., 2006), influences climate by direct radiative perturbation (Tegen and Lacis, 1996; Balkanski et al., 2007; Nousiainen et al., 2009), affecting cloud properties (Rosenfeld et al., 2001; DeMott, 2003) and atmospheric chemistry (Usher et al., 2003). In addition, mineral dust provides the land and ocean with nutrients (Duce and Tindale, 1991; Jickells and Spokes, 2001), causes damage to human health through the inhalation of fine particulate matter (Prospero et al., 2008; Samoli et al., 2011; Prospero and Mayol-Bracero, 2013) and causes disruption to transport and economy with intense episodes of reduced visibility (Prospero, 1999; Goudie and Middleton, 2006).
Ambient measurements of mineral dust composition are important for validation of global dust cycle models and their incorporation into atmospheric models (Claquin et al., 1999; Nickovic et al., 2012; Perlwitz et al., 2015). Differentiation of the mineral phase is particularly useful for the provenance of transported dust because distinct mass fraction ratios of mineral types, such as calcite content and illite∕kaolinite ratio, can be used as signatures of potential source area (PSA) (Caquineau et al., 2002; Scheuvens et al., 2013). The role of mineral dust particles in atmospheric processes is a function of its physical and chemical properties which can be influenced by source and transport processes (Formenti et al., 2011). The importance of chemical and mineralogical composition has been highlighted. Optical modelling of mineral dust aerosol has found that the radiative effects are very sensitive to iron-oxide–clay-mineral aggregates (Sokolik and Toon, 1999; Lafon et al., 2006), and in a radiative closure experiment McConnell et al. (2010) found that accurate representation of aggregates of illite and kaolinite clay minerals with hematite or goethite (iron oxide minerals) were required but the mineralogical combination had to be assumed due to the inability of traditional X-ray diffraction techniques to accurately resolve the mineralogy on sparsely populated filter samples collected during airborne measurements.
Laboratory experiments have found a strong mineralogical dependence on the onset temperature of ice nucleation with respect to supersaturation, which has implications for modelling cold and mixed-phase clouds (Zimmerman, 2008; Connolly, 2009). For example, Atkinson et al. (2013) demonstrated that from a collection of common minerals, K-feldspar particles were the most efficient INP in the immersion mode using a cold stage apparatus. Current climate models rely on simple parameterisation of INP number concentrations using properties such as surface area (Niemand et al., 2012) or particle size (DeMott et al., 2010, 2015), which assume all mineral dust behave in the same way regardless of chemical or mineralogical composition.
In the field of atmospheric science, mineral dust is often collected in small volumes on microporous filters which are then analysed offline by a variety of elemental, mineralogical and isotopic techniques. Typical techniques for elemental analysis include environmental scanning electron microscopy (ESEM), which reveals information on particle morphology, coupled with energy dispersive X-ray spectroscopy (EDS; e.g. Reid et al., 2003; Young et al., 2016) or transition electron microscopy (TEM; e.g. Kandler et al., 2007) for elemental analysis on a particle-by-particle basis. While elemental composition is strongly correlated to mineralogical composition, the quantitation required to differentiate common silicate mineral phase in the bulk sample is rarely achieved. X-ray diffraction (XRD) is the established technique used to identify major mineral phases in many disciplines. However, this approach is considered semi-quantitative and is subject to comparatively large errors, particularly when dealing with clay minerals in the fine fraction (<2 µm) (Moore and Reynolds, 1997) that require the preparation of textured samples. In addition, the XRD signal results only from the crystalline fraction so that the amorphous material is not counted, leading to a discrepancy with the total dust mass (Formenti et al., 2008). The limit of detection of XRD analysis means a mass loading of at least 800 µg of aerosol dust is typically required (Caquineau et al., 1997), making it unsuitable for the measurement of mineral dust particles with low number concentrations.
Online measurements of aerosol properties are highly desirable because changes in properties can be linked to atmospheric processes and artefacts associated with offline particle collection can be avoided. Single-particle mass spectrometry (SPMS) is an online measurement technique that obtains size-resolved composition of individual particles using laser desorption ionisation (LDI). In SPMS, aerosol is directly introduced into the instrument via an inlet and a high-powered laser is used to ablate and ionise refractory and non-refractory particles in a particle beam. Ions produced in a low vacuum source by the LDI process are analysed by time-of-flight mass spectrometry (TOF-MS). However, the composition measurement is considered non-quantitative on a single-particle basis due to variation in instrument function and particle matrix effects that influence the ion formation process (Hinz and Spengler, 2007; Murphy, 2007; Zhou et al., 2007). The origin of this matrix effect is not well understood, but systematic variation of ion signals in simple analogues of atmospheric aerosol suggests that ionisation potential, electron affinity and plume density are important factors (Reinard and Johnston, 2008).
Numerous studies of atmospheric aerosol using SPMS have identified a distinct silicate mineral class of particles in ambient aerosol (Middlebrook, 2003; Sullivan et al., 2007; Dall'Osto et al., 2010) and in ice residues extracted from mixed-phase clouds (Kamphus et al., 2010; Baustian et al., 2012; Worringen et al., 2015; Schmidt et al., 2016). Whilst this has proven useful in the investigation of internal and external mixing states of ambient aerosol population, identification of mineral types within the silicate class has remained elusive with SMPS because natural variation in composition between mineral phases is often smaller than the particle-to-particle variations in ion distribution recorded in the mass spectra due to instrument function and particle matrix effects.
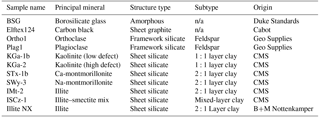
Table 1Summary of the dust samples used in this study (n/a = not applicable).
Ion formation processes in LDI can be studied by measuring initial ion velocities which are calculated by comparing the ion arrival time at the TOF-MS detector of certain ion species after systematic variation in ion focussing (e.g Spengler and Kirsch, 2003; Vera et al., 2005). In this paper we compare ion arrival times of key marker ions in a variety of crystal structures in otherwise chemically similar particle types. Using a laser ablation aerosol particle time-of-flight (LAAP-TOF) single-particle mass spectrometer (Aeromegt GmbH), we demonstrate that systematic variation in ion arrival times in laboratory-generated nominally pure mineral samples can be related to the ion formation mechanism and crystal structure of single particles. A method for the online differentiation of mineral phase in clay mineral standards is presented using a spectral peak centroid as a measure of average ion arrival time in addition to traditional peak area analysis. The application of the method to analyse ambient dust particles will be presented in a future publication.
2.1 Dust samples
Laboratory studies of the physiochemical properties of mineral dust require an appropriate sample material that is representative and relevant to atmospheric processes. Field studies show that most dust in the atmosphere is dominated by varying quantities of quartz, K-feldspar, plagioclase, calcite, hematite, kaolinite and the illite–smectite group of clay minerals (Kaufman et al., 2005; Kandler et al., 2007, 2009, 2011; Formenti et al., 2008; Jeong, 2008; Kaufmann et al., 2016). At a single-particle level, particle size dependence is observed with an abundance of quartz and feldspar grains in the coarse fraction and a fine fraction (<2 µm) dominated by clay minerals. Detailed studies on Asian and Saharan dust have revealed complex internal structures of individual particles in terms of mineralogy and morphology. TEM analysis of sliced particles revealed that the most common sub-5 µm particle type was clay-rich agglomerate, dominated by nano-thin platelets of illite–smectite series clay minerals (ISCM) with submicron grains of iron (hydr)oxides (goethite and hematite) commonly dispersed throughout the particles (Jeong and Nousiainen, 2014; Jeong et al., 2016).
Table 2Structural formulae of source clays from the Clay Minerals Society calculated from elemental analysis (Mermut and Cano, 2001).
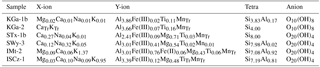
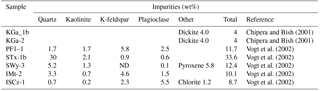
Table 3Minerological impurities in CMS clay as determined by X-ray diffraction.
In our laboratory study of silicate dust, clay mineral samples were chosen because they represent the most atmospherically relevant material in the size range of the LAAP-TOF transmission (0.5–2.5 µm). Samples of feldspar were compared to these clay samples because of the potential importance of K-feldspar as ice nuclei (Atkinson et al., 2013). In addition to aluminosilicates, 2.1 µm borosilicate glass spheres were used as an example of an amorphous silicate structure that contains abundant alkali and earth alkali metals that are not chemically bonded into a crystal structure. Carbon black (CB) (Elftex 124, Cabot Corp) was used as an example of a non-silicate particle that has a well-characterised molecular structure. A summary of the samples used in this study is provided in Table 1.
CB is distinct from the material commonly referred to as black carbon (BC) (Watson and Valberg, 2001; Long et al., 2013). CB has a characteristic particle morphology that consists of spherical primary particles fused into aciniform (grape-like) aggregates which cluster into larger-sized agglomerates. The primary particles are typically 10–500 nm in diameter and are composed of imperfect graphitic layers that are concentrically arranged around a growth centre (Rivin, 1986). The spaces between the graphitic layers often accommodate cations such as potassium and sodium. Elftex 124 is a flame-soot-derived CB product comprised of >95 % carbon (Wonaschütz et al., 2009).
Clay minerals have a sheet silicate structure in which silicate tetrahedra are 2-dimensionally polymerised to form structural layers that are separated by interlayer cations. The capacity of a clay mineral to accommodate interstitial cations (X-ions) in the interlayer spacing of a clay mineral is related to the layer charge of the structural layer. The structural layers of clay minerals are composed of alternating tetrahedral and octahedral sheets in which the layer charge is created by isomorphous substitution of lower valency ions. Substitution of Si4+ for Al3+ ions in the tetrahedra produces a tetrahedral charge, while substitution of Al3+ for Mg2+ in the octohedra (Y-ions) produces an octahedral charge. The composition of clay minerals is not fixed but is determined by the varying degrees of cation replacement in the structural unit and interstitial complex. For example, the nominal chemical formula of illite is stated in the form to express the variability in composition that can exist within the illite member of the clay mineral group.
Source clays from the Clay Minerals Society (CMS) have been the subject of chemical, physical and thermodynamic analysis and therefore very well characterised. Average elemental composition of Si, Al, Fe(II), Fe(III), Mg, Ti, Mn, P, Ca, Na, K and H2O of the bulk sample is available (Mermut and Cano, 2001) and enables the construction of the precise structural formula. The structural formulae for the source clay samples used in this study are given in a format that shows the average composition of the X-ions, Y-ions and tetrahedral layer in Table 2.
Kaolinite (samples KGa-1b and KGa-2) has a 1:1 layer structure in which each layer contains one tetrahedral layer and one octahedral layer. Kaolinite has no overall layer charge and hence a very low X-ion content. The remaining samples consist of the so-called 2:1 layer clays in which one octahedral layer is sandwiched between two tetrahedral layers. The layer charge created by this 2:1 layer structure is balanced by a certain quantity of X-ions. Illite-rich samples (IMT-2, ISCz-1) are characterised by very high quantities of K+, whereas the montmorillonite clays (STx-1b, SWy-3) are characterised by relatively high levels of Na+ and Ca2+.
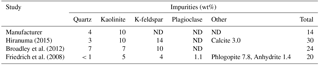
Naturally occurring rock is rarely monomineralic. Mineralogical impurities in source clays have been previously quantified by X-ray diffraction analysis (Table 3) for the bulk sample (Chipera and Bish, 2001) and <2 µm fraction (Vogt et al., 2002). For example, in natural environments montmorillonite is diagenetically altered to illite in the presence of K-feldspar (Garrels, 1984) so that clays often consist of fine interlayers of these two clay minerals. Sample ISCz-1 is an example of a clay that consists of microscopic interlayers of illite and smectite clay minerals (ISCM). Recently, Broadley et al. (2012) suggested illite NX (B+M Nottenkamper, Munich, Germany) as a suitable representation of ambient mineral dust sampled at remote locations and it has been used in numerous ice nucleation studies (Hiranuma et al., 2015). Illite NX is a clay-rich nanopowder that contains significant mineralogical impurities. XRD analysis has shown significant variation in the impurity content that may represent significant batch differences in mineralogy (Table 4).
Table 4Minerological impurities in illite NX as determined by X-ray diffraction. ND stands for not detected.
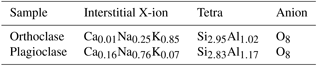
In framework silicates such as feldspar, the silicate structure is formed from 3-dimensionally polymerised silicate tetrahedral. In contrast to the interlayer cation structure of clay minerals, a low-valence cation is held in an interstitial cavity that balances the charge deficit created by substitution of Al3+ for Si4+ in the tetrahedral. Unlike clay minerals, the interstitial cations are fixed and not exchangeable during normal diagenetic processes. Most naturally occurring feldspars are not homogenous but contain separate potassium-rich and sodium-rich phases. Specimens of orthoclase (K-feldspar) and plagioclase were purchased from Geo Supplies Ltd, and analysed by XRF analysis to determine the average elemental composition. The average structural formula of the samples was then calculated from the relative proportions of the metal oxides (Table 5).
Table 5Structural formulae of feldspar sample calculated from XRF analysis.
2.2 Experimental set-up
Mineral dust aerosol was sampled by the LAAP-TOF after dry dispersion of powder in a home-made dust tower and transmission of the extracted aerosol through a centrifugal particle mass analyser (CPMA) (Cambustion, Ltd) (Olfert and Collings, 2005). Source clays, illite NX, borosilicate glass beads and CB were supplied in powder form or loose aggregate that was easily broken down into powder by gentle abrasion with a pestle and mortar. The feldspar samples were supplied as a large crystal that had to be reduced to powder in a timor mill prior to injection into the dust tower.
Powdered mineral dust was loaded into a modified sample vial and injected into the dust tower inlet using a short burst of compressed air from an air duster can. The mixing and suspension of mineral dust particles was achieved by turbulent flow, controlled with an adjustable flow of dried, filtered and oil-free compressed air (produced on site using a compressor) introduced into the bottom of the tower (Fig. 1). Aerosol was drawn out of the dust tower through the CPMA using a pumped sampling line throttled to a suitable flow rate (∼1.6 L min−1) using a needle valve. The flow was divided between the pumped line and the LAAP-TOF inlet (sampling at 0.078 L min−1) using a “Y piece”.
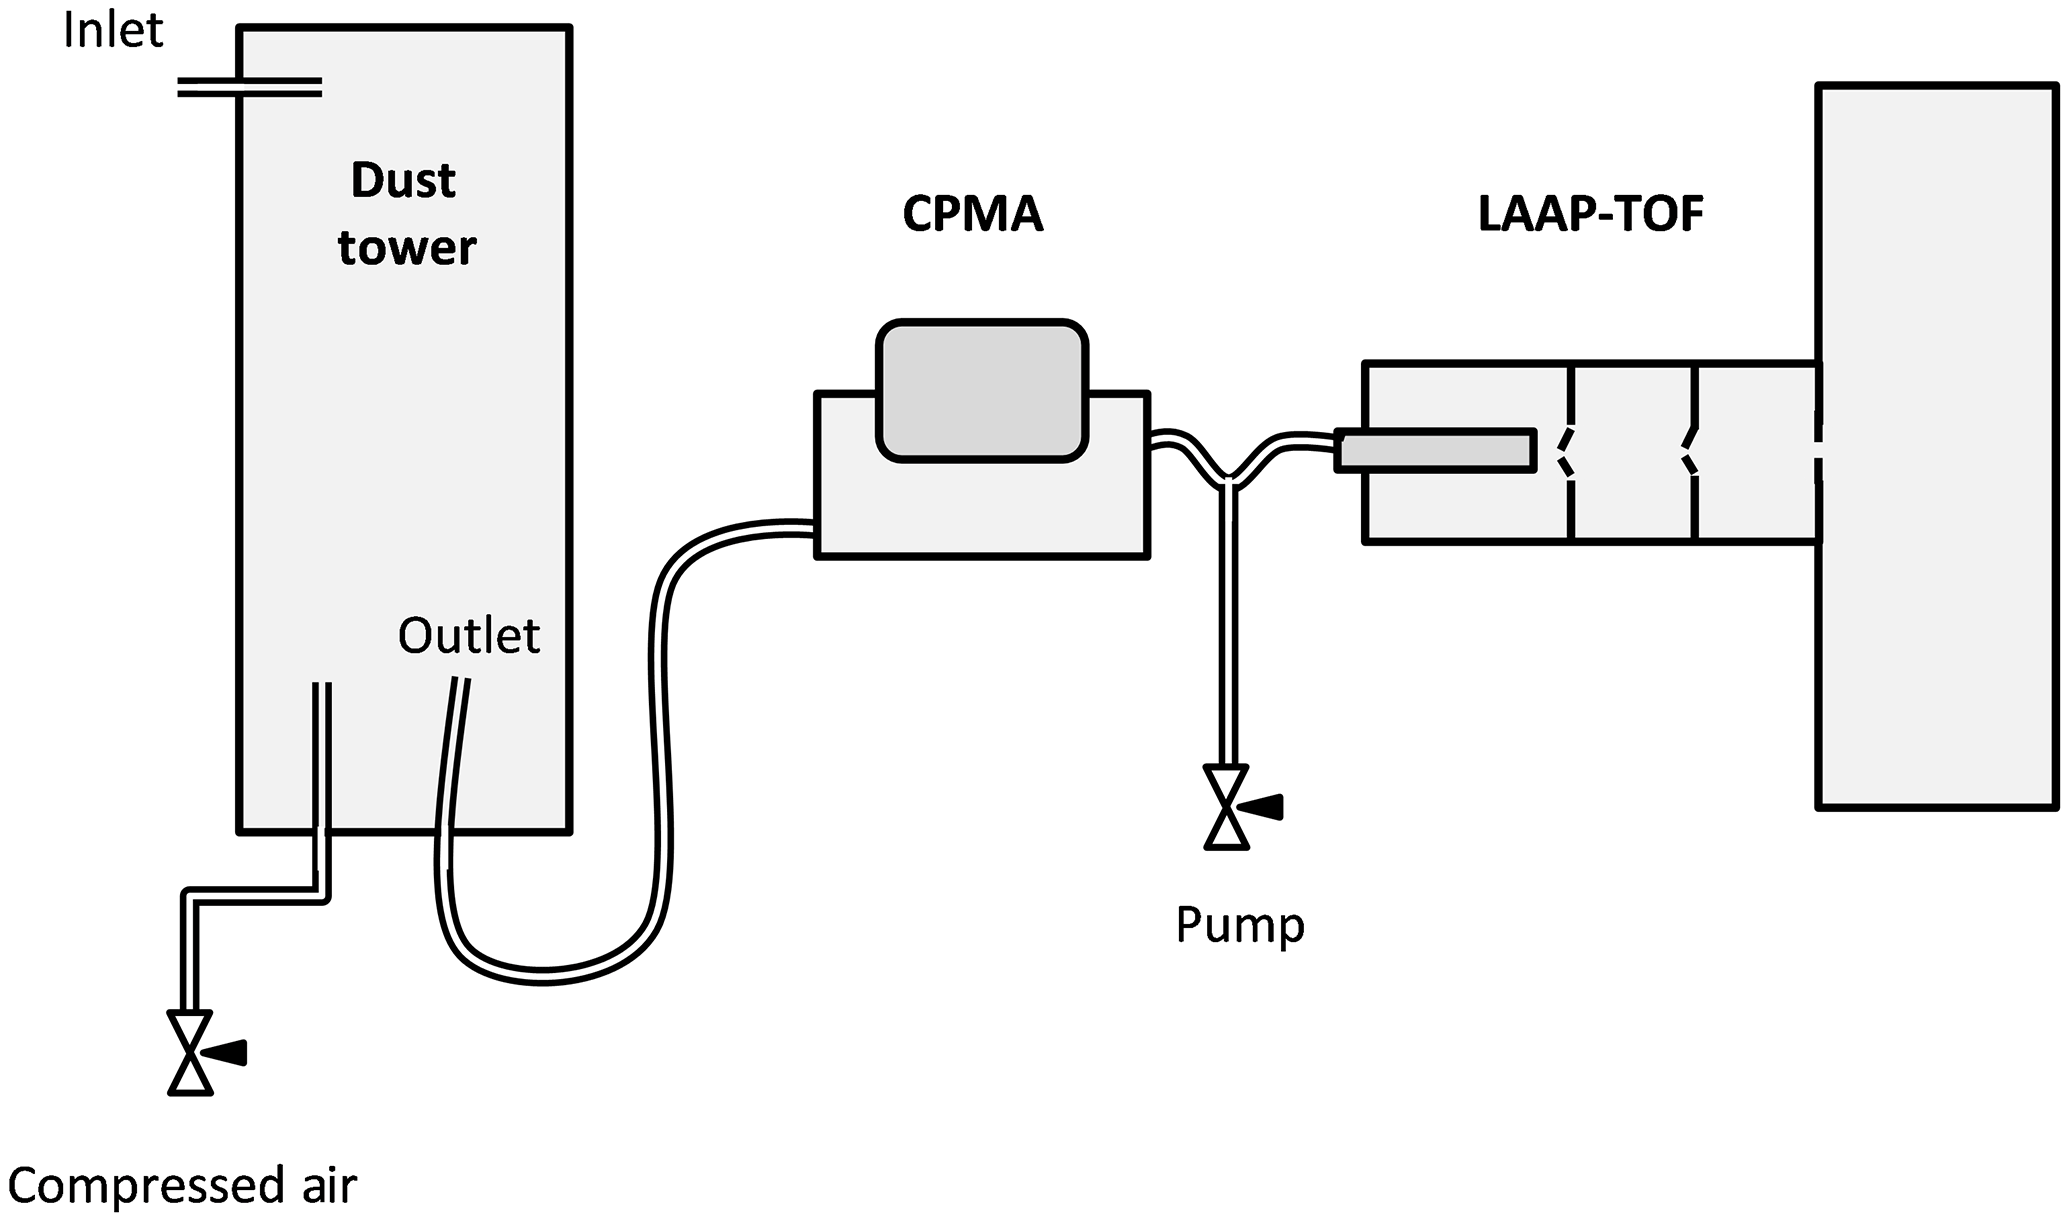
The experiment was operated in two modes. In polydisperse mode, the CPMA was inactive, so the mass distribution of the aerosol analysed by the LAAP-TOF was determined by the transmission efficiency of the aerodynamic lens. In monodisperse mode, the CPMA was used in static mode so that only the selected particle mass was transferred to the LAAP-TOF.
2.3 LAAP-TOF single-particle mass spectrometer
The LAAP-TOF used in this study is a modified version of the commercially available single-particle mass spectrometer manufactured by AeroMegt (GmbH) that features a modified optical detection system as described in detail by Marsden et al. (2016). Briefly, particle-laden air enters the instrument via an aerodynamic lens inlet (Liu et al., 1995) which produces a narrow but divergent particle beam along the instrument axis. A pulsed excimer laser interacts with a particle in the low-pressure source region towards the back of the instrument (Fig. 2). An optical particle detection stage located within the source region is used for temporal alignment of the excimer laser pulse with the presence of a particle in the ion source. The option to measure aerodynamic particle size using an additional optical particle detection stage located upstream of the instrument axis was not used in this study.
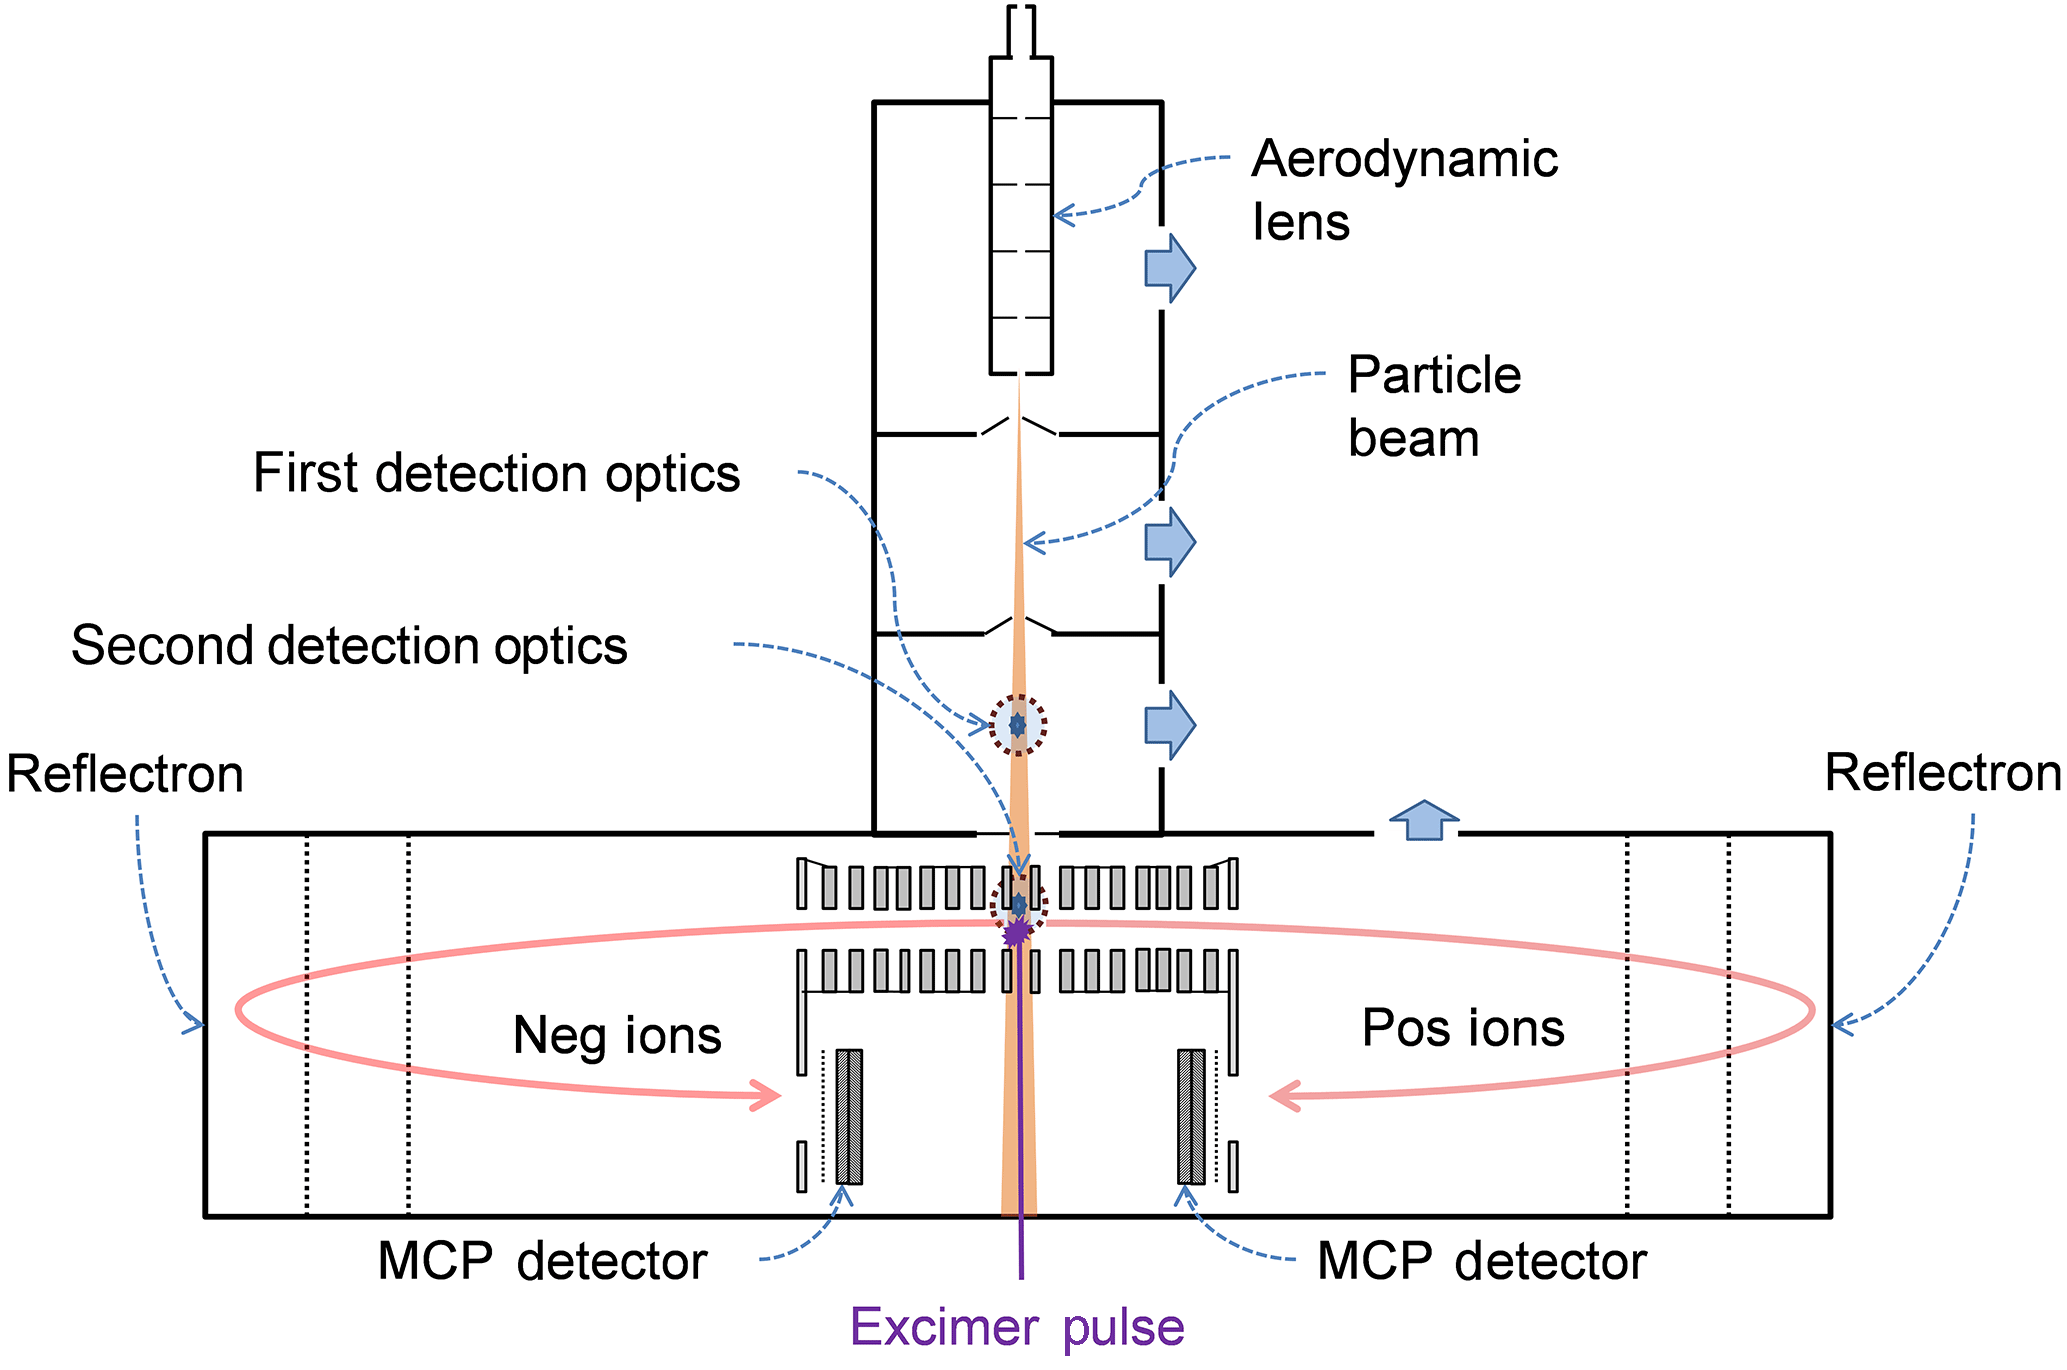
The version of the instrument used in this study features an aerodynamic lens inlet (model LP2.5 Aeromegt GmbH) for transmission of particles approximately 0.07–2.5 µm in diameter that is similar in design to the high-pressure lens (HPL) described by Williams et al. (2013). Divergence of the particle beam is size and shape dependent (Jayne et al., 2000), resulting in a morphological dependence on the fraction of particles that reaches the ionisation region (Huffman et al., 2005), an effect that is particularly important for measurements of irregularly shaped platy mineral in polydisperse dust.
Laser desorption ionisation takes place in a high vacuum (<1 × 10⁻⁶ mbar) region some 230 mm from the aerodynamic lens exit, where particles interact with a 8 ns pulse of 193 nm radiation that is fired co-axial but counter-propagate to the particle beam. The ablation laser, an ArF excimer (model EX5, GAM Laser Inc.), can be requested to produce 2–12 mJ per pulse via a setting in the software. The peak laser power actually encountered by a particle is unknown as the particle will transect the laser pulse at an unknown position in its profile due to particle divergence and temporal alignment. Consequently, particle-to-particle variations in the peak power and effective pulse duration can reduce the reproducibility of the measurement. A previous study with this instrument configuration has shown a sampling efficiency for ambient mineral dust of approximately 0.01 with a particle-size-dependent optical detection bias that favours the detection of particles with a mode of around 1.5 µm in diameter (Marsden et al., 2016). Sampling efficiency is important in SPMS as it influences the particle-counting statistics of an aerosol population and can introduce a bias of compositional measurement towards a particular particle type (Zelenyuk et al., 2009).
The TOF-MS used in the LAAP-TOF is a bipolar reflectron TOF analyser (BTOF, Tofwerks AG) for the simultaneous measurement of positive and negative ions. Ion arrival times at the multichannel plate (MCP) detectors, one for each ion mode, are recorded by a dual channel 14bit analogue to digital converter (model ADQ214, SP Devices) with a bin width of 2.5 ns. The ADQ clock is triggered by a signal that is synchronous with the firing of the ablation laser so that each spectrum represents the ions formed by a single-particle ablation event. The configuration of the extraction optics in the LAAP-TOF is unusual in that the first extraction lenses of the LAAP-TOF ion optics are grounded so that the evolution of the ion plume takes place in a field-free region and only ions with the correct ion trajectories are extracted for analysis.
2.4 Mass spectral peak analysis
The aim of the peak analysis is to evaluate how composition and crystal structure of the particles affect ion arrival times at the multichannel plate (MCP) detector by comparing the spectral characteristics of the samples of mineral dusts of known mineralogy. TOF-MS analysers focus a certain elemental or molecular ion species into a discrete packet of ions with arrival times at the detector that are represented by a Gaussian probability density function (PDF), which is represented as a spectral peak in the data. The average ion arrival time (T) of the ion packet at the detector is described by the peak centroid, while the peak width (FWHM) describes the distribution around this average.
Peak centroid and peak width were extracted from the raw spectra using a peak-fitting algorithm. Peak fitting within the spectra was problematic because of spectrum-to-spectrum variations in peak position, peak shape and interference from neighbouring peaks. To reduce the influence of these effects, a multipeak-fitting procedure (Multipeak fit v2, igor v6.36) was performed on a portion of the mass spectrum which contained the peak of interest. Peak-fitting parameters were set so that interfering signals were identified as separate peaks without comprising the integrity of the peak of interest. In most cases, the peak of interest was a well-defined Gaussian shape that was sufficiently separated from its neighbour, such as the example of molecular ion () in Fig. 3a. Occasionally, especially in illite-rich clay mineral samples, the molecular ion peak was much broader (Fig. 3b) therefore a number of data smooths were required to ensure satisfactory peak definition was obtained. A third peak morphology, featuring multiple modes was also encountered in illite-rich clays samples that required careful consideration. Using a suitable peak-fitting parameters (Number of Smooths 5, Number Fraction 0.1), the multimodal peak in Fig. 3c was resolved into two peaks whose peak centres were approximately 1 Da (50 ns) apart. Note that further resolution of this multimodal peak using a fewer data smooths resulted in peaks that were separated by <0.5 Da (20 ns) (Fig. 3d), which is an improbable solution in data that primary consists of singly charged ions. Consequently, peak-fitting parameters were chosen that ensured peak centroid spacing of integer values (in mass) were produced from all fitting. The origin of the multimodal peak morphology will be discussed in more detail in the results section.
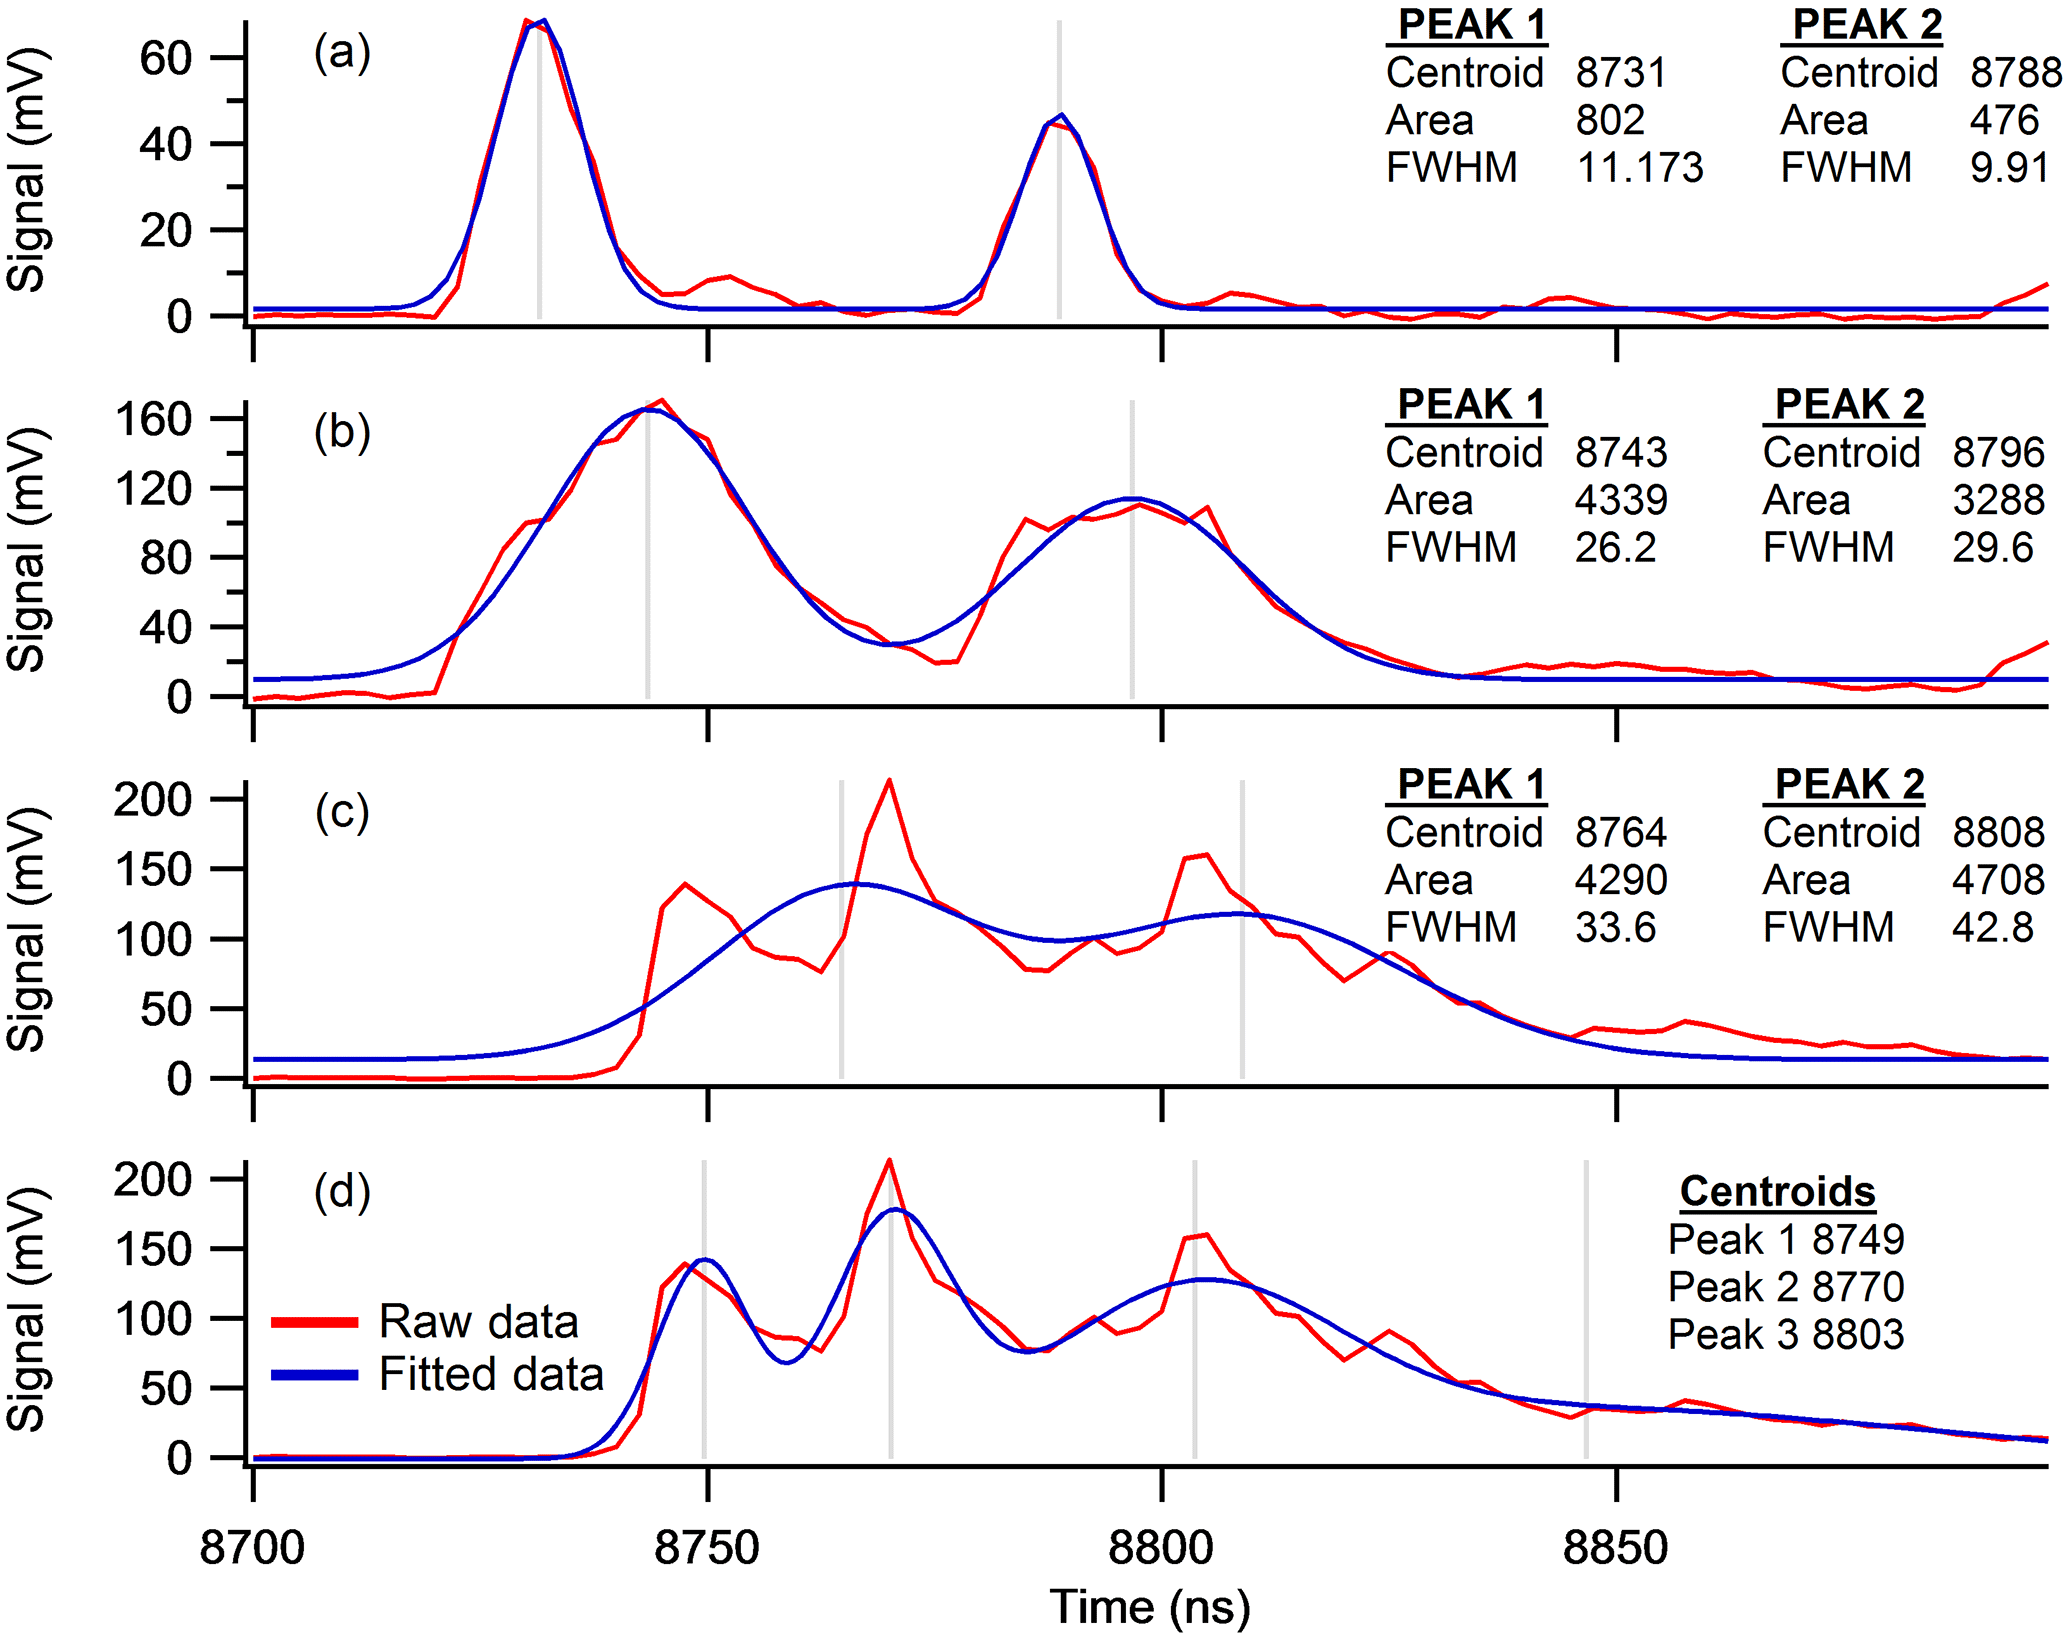
Figure 3Peak fitting of the molecular ion (m∕z −76) and its neighbour at m∕z −77. (a) Well-resolved Gaussian peaks with a peak centroid spacing of 50 ns, (b) peak broadening observed in illite-rich material, (c) multimodal peaks resolved into two peaks with approximately 50 ns spacing and (d) the same multimodal peak resolved into peaks with centroid spacing <50 ns by reducing the number of times data was smoothed to 2. Fitting parameters used were number of smoothes 5, Min fraction was 0.1 unless stated otherwise.
Prior to analysing the mineral dust samples, the ion optics were tuned for maximum resolution and symmetrical peak shape across the mass range for positive and negative ions using 700 nm diameter PSL particles. The effect of particle type on ion arrival times was initially evaluated by comparing mass-scale calibrations obtained from selected samples. Calibration coefficients were calculated for each sample type by fitting the first order approximation of the time of flight equation (Eq. 1) to the averaged peak centroid of three ion species. For the silicate, the same ion species were chosen in positive and negative ion modes for each sample. Changes in average arrival times of a certain ion species (i), apparent as a peak centroid shift (ΔT(i)) with respect to previously defined position, were examined in more detail by comparing the peak centroid with a nominal mass-scale calibration and comparing ΔT(i) with other ion species from within the spectrum (i.e. from the same ionisation event).
3.1 Tuning and calibration
Spectral resolution of the peaks in positive and negative spectra for PSL were typically 300 and 600 (FWHM at m∕z 36) respectively, with unit mass resolution easily achieved over the mass range 10–100 Da. The optimum tune settings for the positive ion optics differed somewhat from those of the negative ion optics despite their identical geometry, indicating significant differences in the translational energies of the positive and negative ions produced in the same particle ionisation event.
Typical mass spectra of feldspar mineral dust (Fig. 4a) show elemental ions of alkali metals in positive ion mode and molecular fragment ions of silicate at m∕z −60 (SiO2) and m∕z −76 (SiO3) in negative ion mode, which is in agreement with the mineral dust spectra observed by Gallavardin et al., 2008a, who used a similar 193 nm excimer laser at approximately 109 W cm−2. Detector saturation was apparent on several positive ion peaks when Channel 1 signal amplifier line to the A∕D was used (Fig. 4a, top). To avoid peak saturation, the Channel 2 signal amplifier with a greater attenuation was used for the subsequent peak analysis. The effect of changing the signal amplifier on the spectra is demonstrated in the typical mass spectra examples in Fig. 4. Detector saturation occurs at 1200 mV signal strength for the peaks at m∕z 27, 39 and 44 with the signal Channel 1. Saturation is avoided with signal Channel 2 but comes at the expense of poor signal-to-noise ratio of ion species such as C+ (m∕z 12) and CaO+ (m∕z 56). Note the relative signal height between ion species is altered when the signal channel is changed, highlighting insufficient dynamic range of the ion detection system.
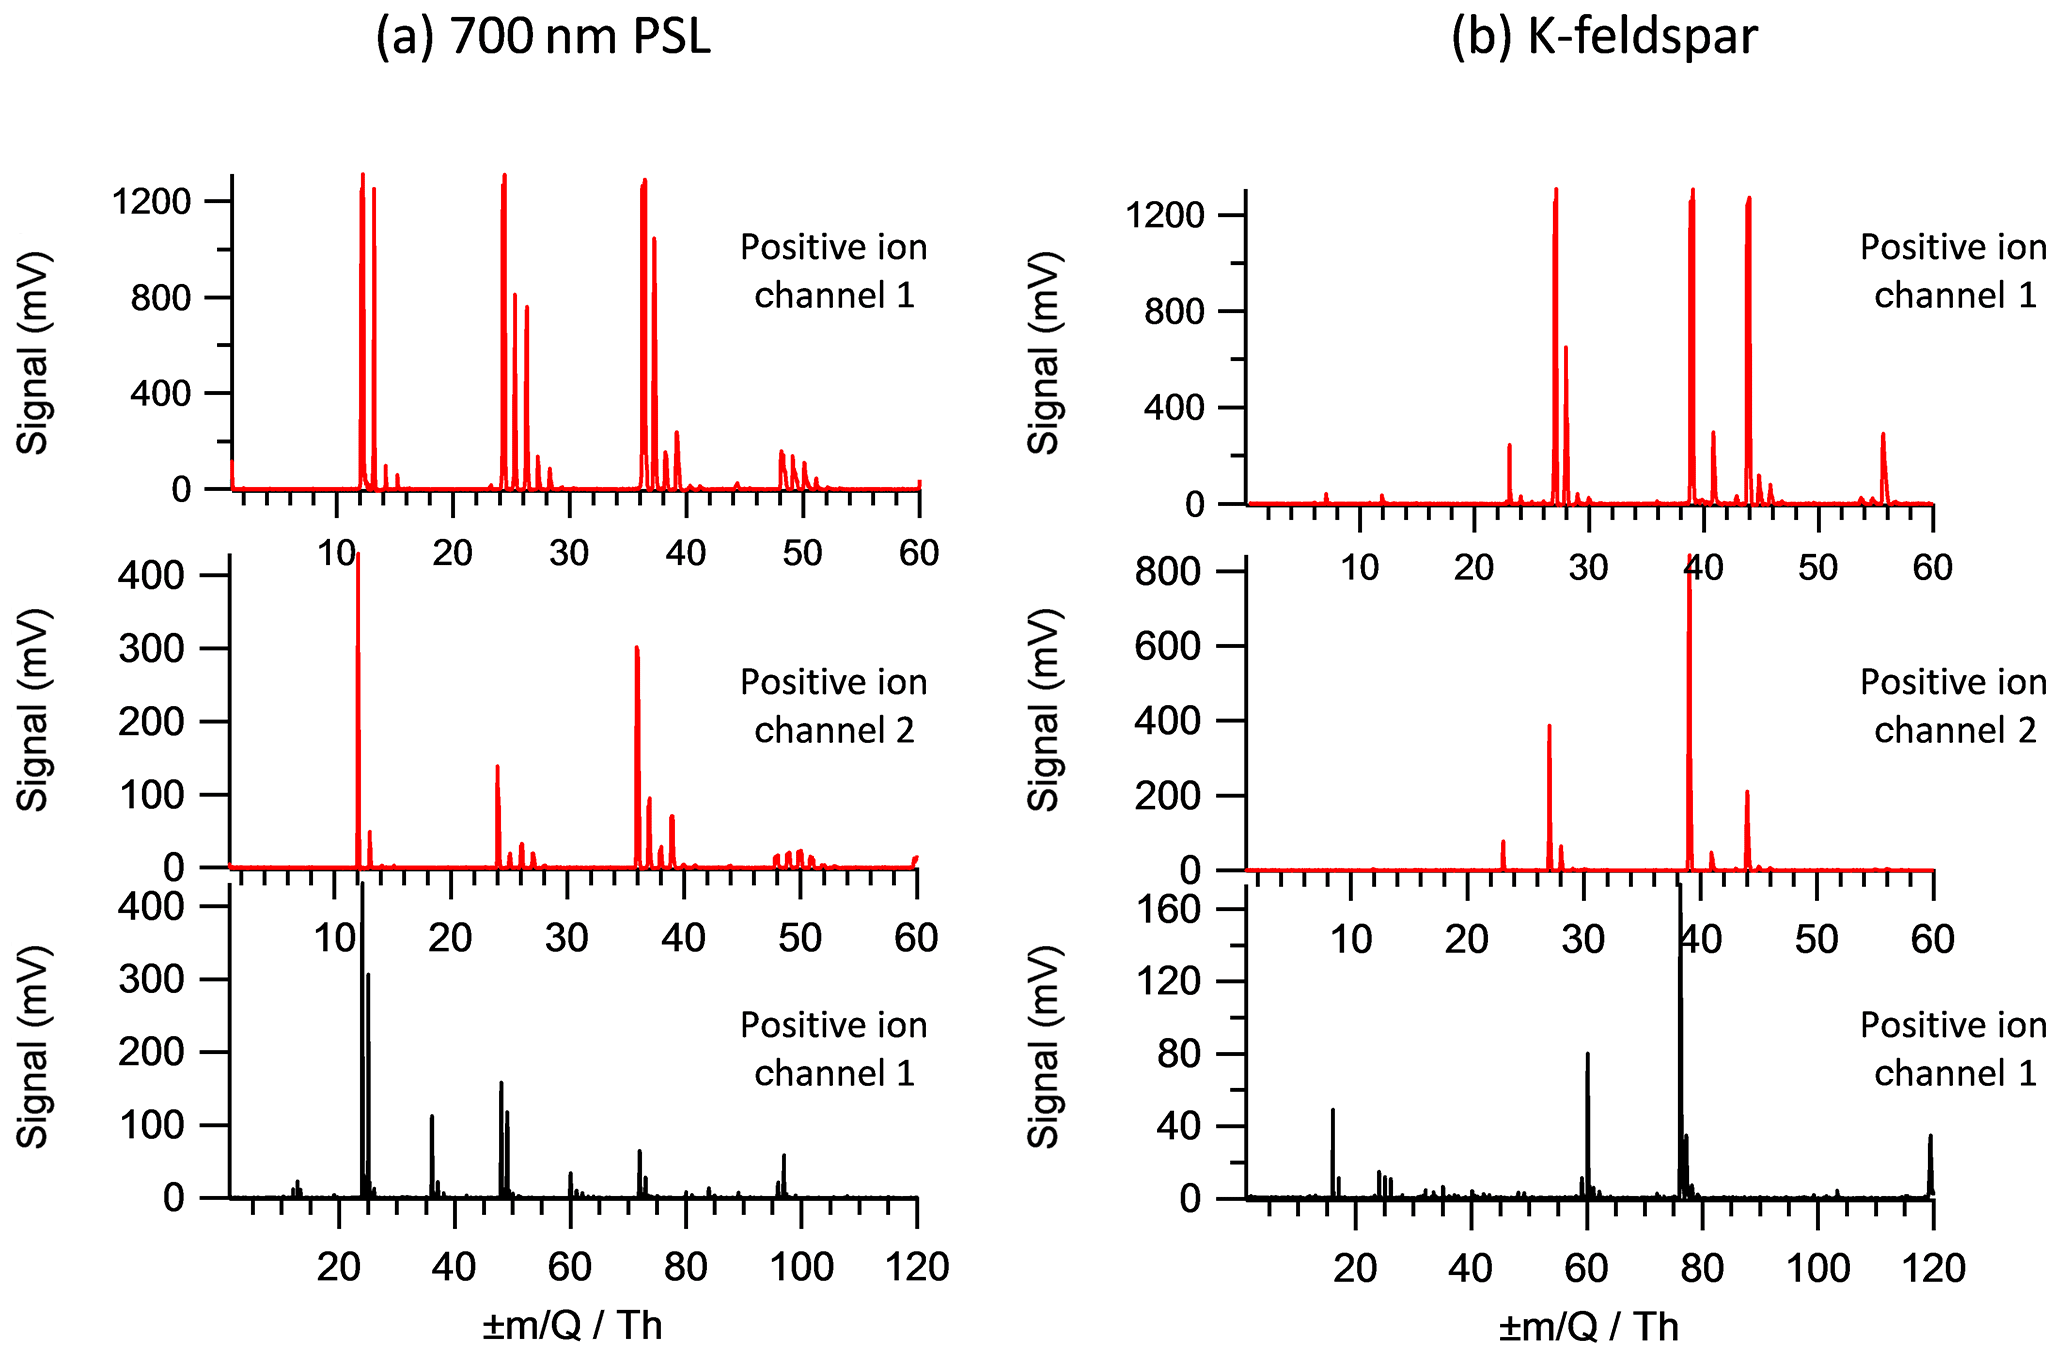
Figure 4Example spectra of (a) 700 nm PSL and (left column) and (b) orthoclase feldspar (right column). The dynamic range of the data is demonstrated by changing the positive ion signal line from Channel 1 (top spectra) to Channel 2 (middle spectra). Negative ion spectra are also shown (bottom spectra).
Mass-scale calibration over a limited mass range (m∕z 23–56) was possible in positive ion mode due to the limited number of peaks that were universally available in all spectra, whereas a mass-scale calibration with a wider mass range (m∕z 16–76) was possible in negative ion mode. Calibration coefficients obtained for PSL, Carbon black, K-feldspar and borosilicate glass are shown in Table 6. Note the increase in the intercept value for the K-feldspar and borosilicate glass samples, indicating an overall shift in the ion arrival times compared to the PSL.
Table 6Mass calibration coefficients calculated from the mode peak position (TOF) of three ion species for each samples in each ion mode. The ions species used are m∕z +24, +36 +48, −24, −60 and −72 in PSL and carbon black mass spectra and m∕z +27, +39, +44, −16, −60, and −76 in K-feldspar mass spectra. Positive ion calibration of the borosilicate glass was not possible with the peaks selected. Calibration points are expressed in 2.5 ns bin widths (n/a = not applicable).
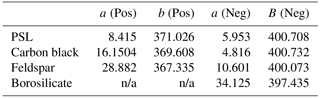
The average peak position and peak width (±2 SD) of the Al+, K+ and SiO+ positive ion species and O−, and negative ion species in the K-feldspar, illite IMt-2 and borosilicate glass samples are displayed in Fig. 5. In positive ion mode, the peak position is often 0.5 Da of the K-feldspar calibrated mass position in all sample types. In negative ion mode, the average position of the and is significantly larger for the illite IMt-2 than for K-feldspar or borosilicate glass. In addition to the peak analysis, average peak centroid and peak width are important for the creation of stick spectra used in routine cluster analysis techniques. The data-processing software provides an additional facility with which to apply a unique 3-parameter fit calibration to each spectrum. However, for this calibration to be successful, the peak of interest must be located ±0.5 Da from the average mass position, which is not the case in a significant number of peaks in mineral dust spectra.
Figure 5The mean mass-scale position and mass-scale width of three positive ion species and three negative ion species in silicate mineral particles. Measurement is with respect to the K-feldspar calibration. Error bars are 2 SDs of the mean calculated from 800 spectra per sample.
The mass-scale dependence of the peak position shift suggests that the differences in calibrations do not arise from a simple linear shift in ion arrival times for all ion species in the mass spectra. This is further demonstrated by examining ΔT(i) with respect to the negative ion calibration for borosilicate glass (Fig. 6). Carbon black has a clear mass dependence with respect to this calibration. Kaolinite does not have a strong mass dependence but is affected by a large kink in the mass scale between the SiO2 and SiO3 molecular ions (m∕z 60 and 76 respectively), which is apparent with all the silicate minerals analysed.
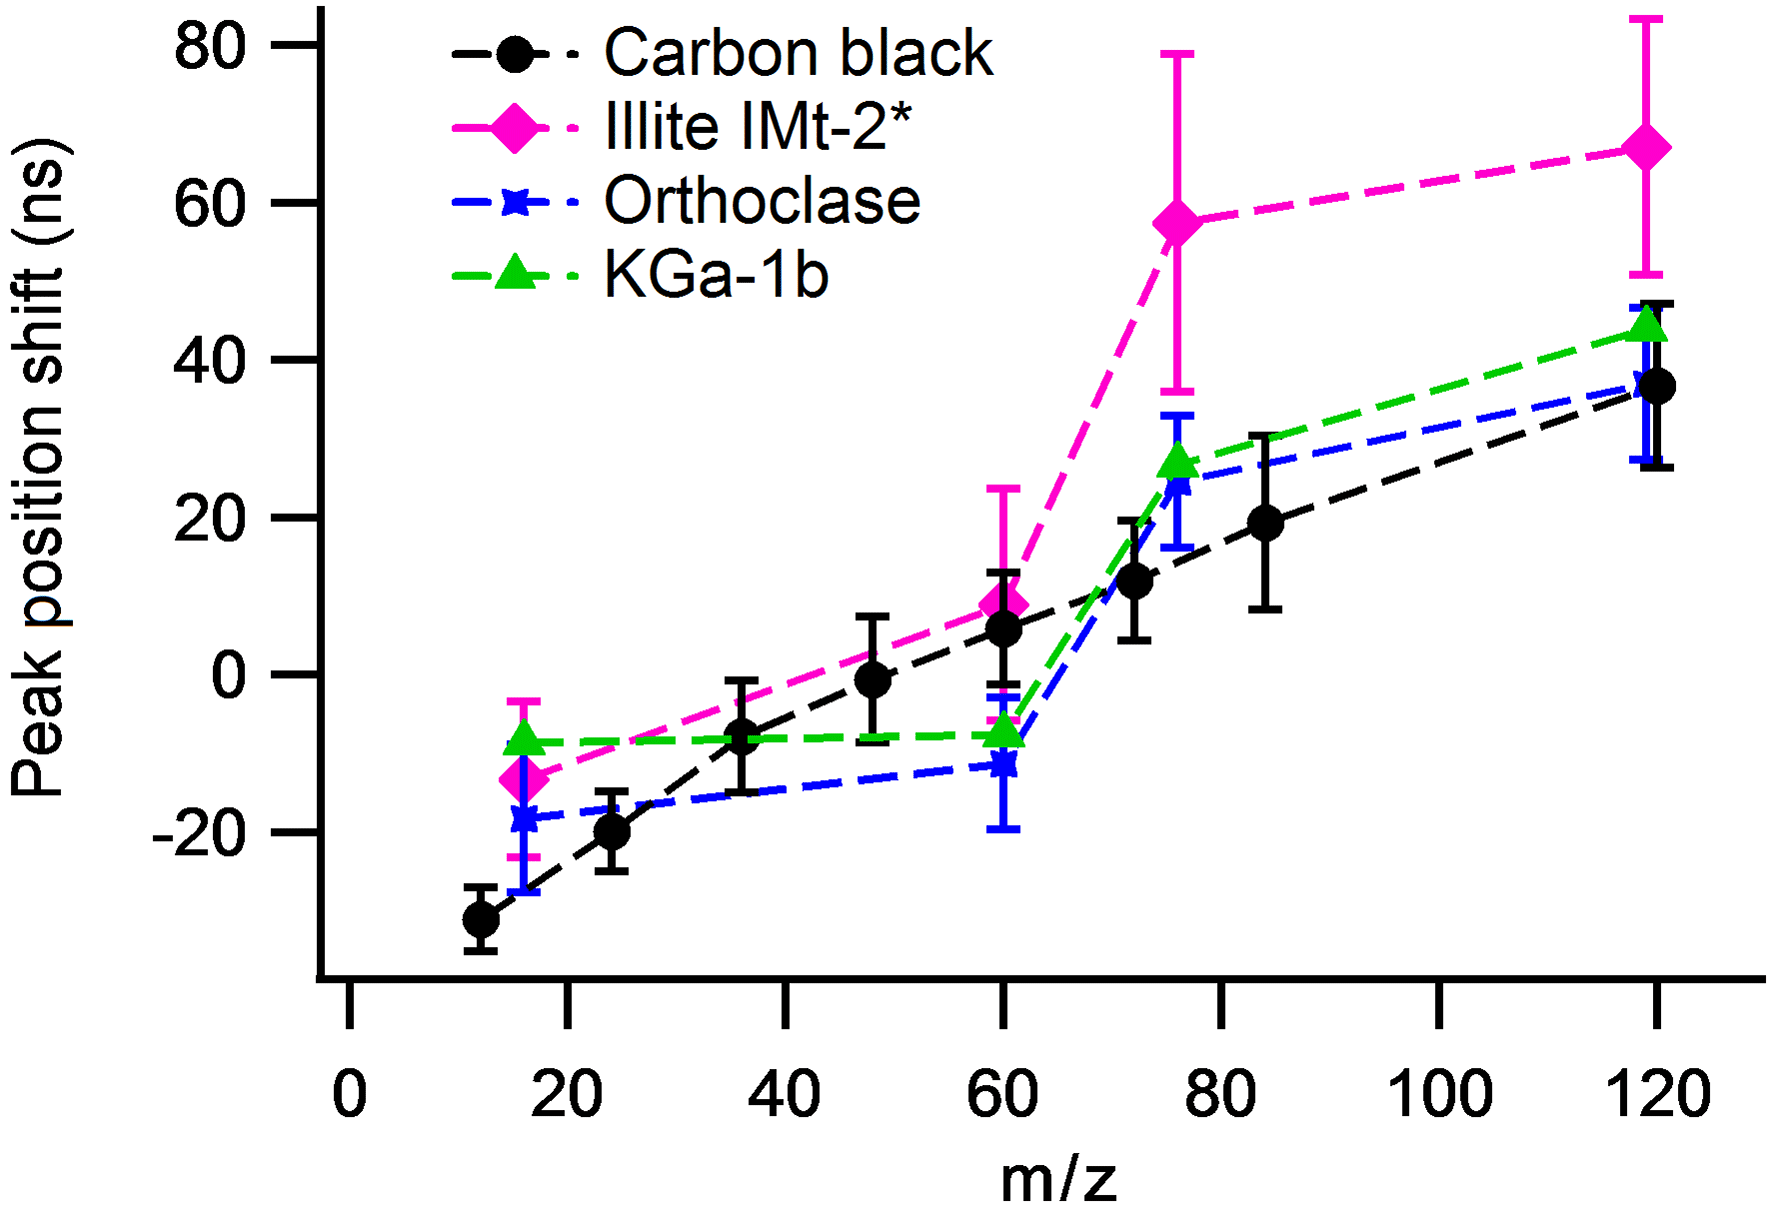
Figure 6Shift in ion arrival times (ΔT(i)) with respect to a nominal negative ion calibration with borosilicate glass. The mean and two SDs of the mean were calculated from 800 spectra per sample type.
3.2 Relative shift of elemental and molecular ion TOF
In this section we explore the relationship between the ion arrival times of O− elemental ion (TO) and the molecular ion () within discrete ionisation events. In the case of borosilicate glass, an amorphous silicate material, a scatter plot of arrival times measured in individual mass spectra display an approximately linear distribution of data points with a gradient of 1 (Fig. 7a), indicating that . In contrast, the non-silicate carbon black, a similar plot of elemental vs. molecular carbon ions measured from C at m∕z −12 and C6 ion at m∕z −60 gives a linear distribution of ion arrival times with a gradient of 0.35, indicating that generally .
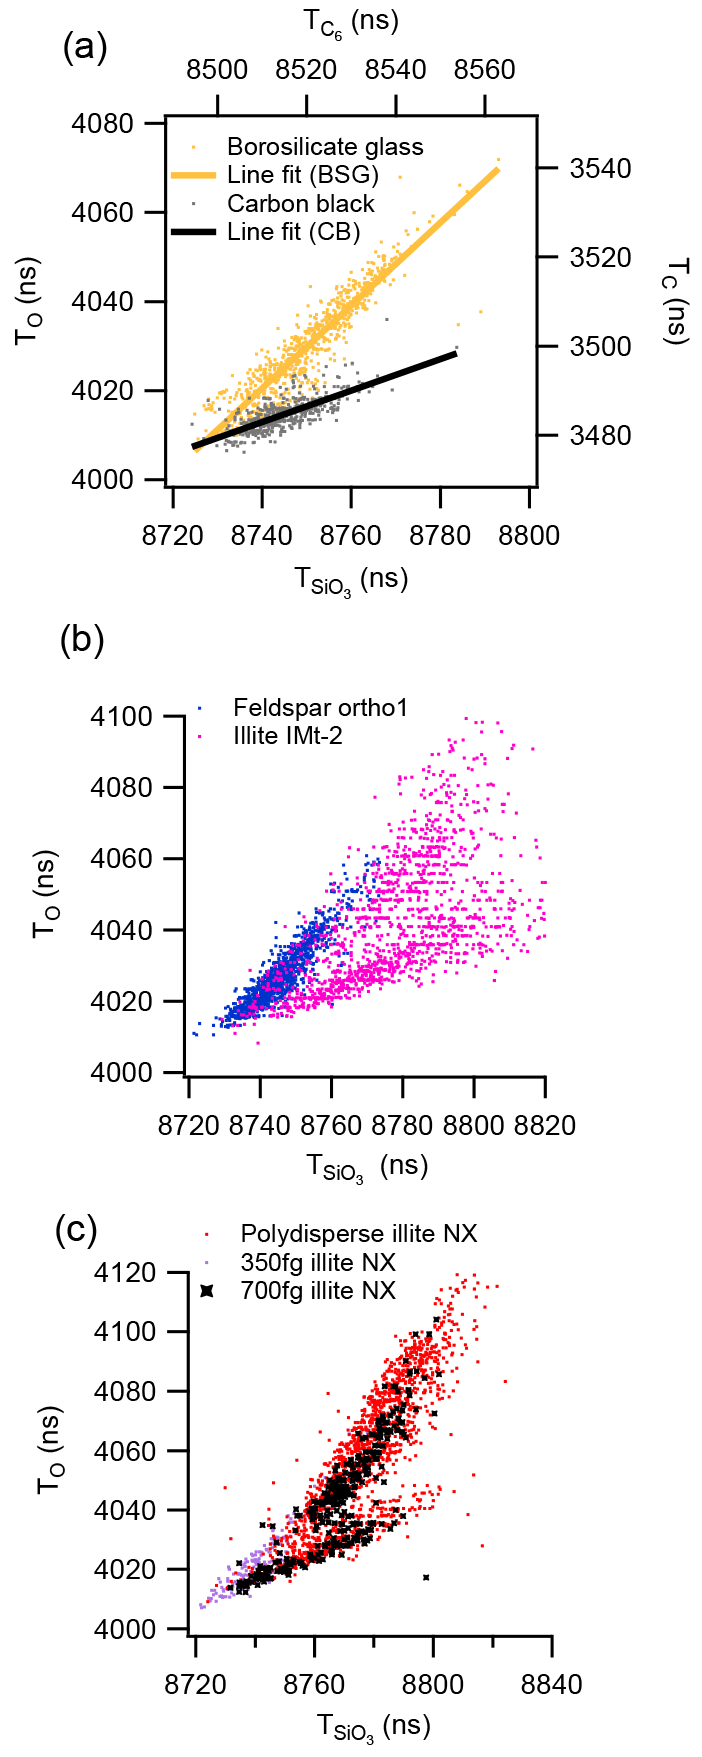
Figure 7Ion arrival times (T(i)) of elemental ions compared to molecular ion species in negative ion mode. Each point represents a single-particle measurement: (a) 2.1 µm borosilicate glass spheres and polydisperse carbon black, (b) polydisperse orthoclase feldspar and illite IMt-2 and (c) polydisperse illite NX and mass selected illite nx particle with the CPMA.
Similar distributions of ion arrival times can be observed with the LDI of crystalline silicate mineral dust. The framework silicate orthoclase feldspar has a distribution of ion arrival times that is similar to the distribution of the borosilicate glass but is narrower (Fig. 7b), whereas illite IMt-2, a sheet silicate, has a large mode that is similar to the carbon black, with an additional mode of particles that is more similar to the borosilicate glass. The silicate mineral sample with the most variation in ion arrival times is the illite NX for which several distinct modes are apparent (Fig. 7c). The multimodal nature of this distribution was still apparent after the particles were mass selected with the CPMA before analysis with the LAAP-TOF. The ion arrival time distribution of mass selected 350 fg illite NX particle shows a smaller variation of up to 20 ns, whereas mass-selected 700 fg illite NX particles have a distribution comparable to the polydisperse analysis.
In order to directly compare the ion arrival time distributions of different silicate minerals, the shift in arrival time (ΔT(i)) was calculated for each spectrum with respect to a set point on the timescale. For silicate-containing particles, ΔTO and were calculated with respect to the point at which the mode distributions converge on the scatter plots at TO=4010.2 ns and ns, which we will call the convergence point. The relative difference in the ion arrival times of the elemental and molecular ions in negative ion mode can then be expressed as a ratio (τ) for each particle analysed.
Histograms of τ values measured from the peak analysis in silicate mineral mass spectra are shown in Fig. 8. Potassium-rich clay minerals illite NX and illite IMt-2 (Fig. 8b) have a distinct mode around 0.3–0.5, which is aligned with the ratio derived from the peak analysis of carbon black. Other distinct modes can be seen in the illite IMt-2 sample at 0.79 and in the illite NX sample at 0.83 and 1.10, which are more similar to the distribution of τ values measured for borosilicate glass. (Fig. 8a) The smectite and montmorillonite clays have modes in the distribution that range from 0.4 to 0.86 and the 1:1 layer clay kaolinite has the largest mode at 0.93 (Fig. 8c).
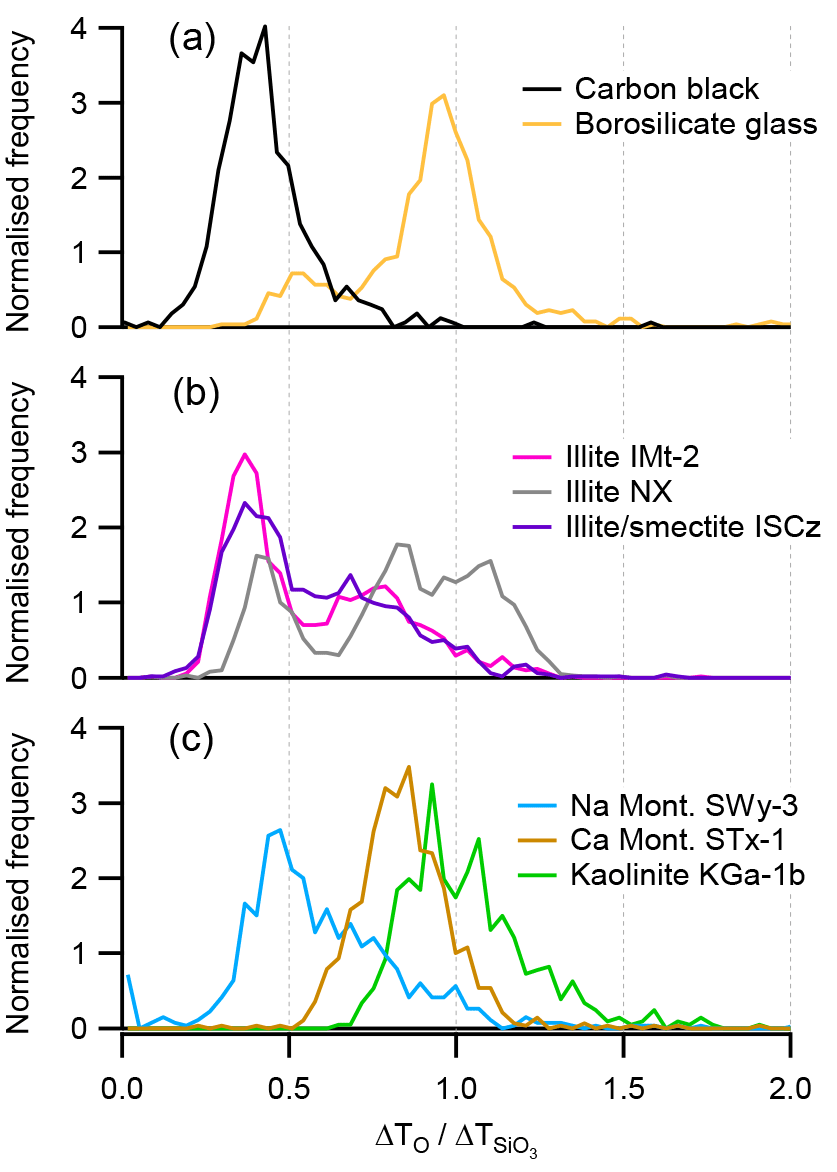
Figure 8Histograms of the ion arrival times shift ratio (τ) of the elemental ion O− and the molecular ion . (a) Borosilicate glass and carbon black (carbon black calculated from the ratio). (b) Potassium-rich illite containing samples and (c) Na- and Ca-rich samples of montmorillonite and kaolinite.
3.3 The effect of laser power setting
The laser power setting is an important parameter in SPMS because, along with the size of the focal point and pulse duration, the amount of energy contained in each pulse defines the peak power density that occurs in the ionisation region. Differences in power density have been shown to affect the mass spectral patterns produced. For example, Reents and Schabel (2001) found that variation in peak power density, achieved by varying the 193 nm laser power setting, resulted in variations in the sodium fraction reported in the mass spectra of NaCl. The effect of different laser power settings on the distribution of τ values for kaolinite sample KGa-1b and illite NX is shown in Fig. 9. For the kaolinite-rich sample, increasing the pulse energy results in a narrowing of the distribution. The effect on the illite rich sample is somewhat different, in that increasing the pulse energy has the effect of increasing the number of particles in the mode
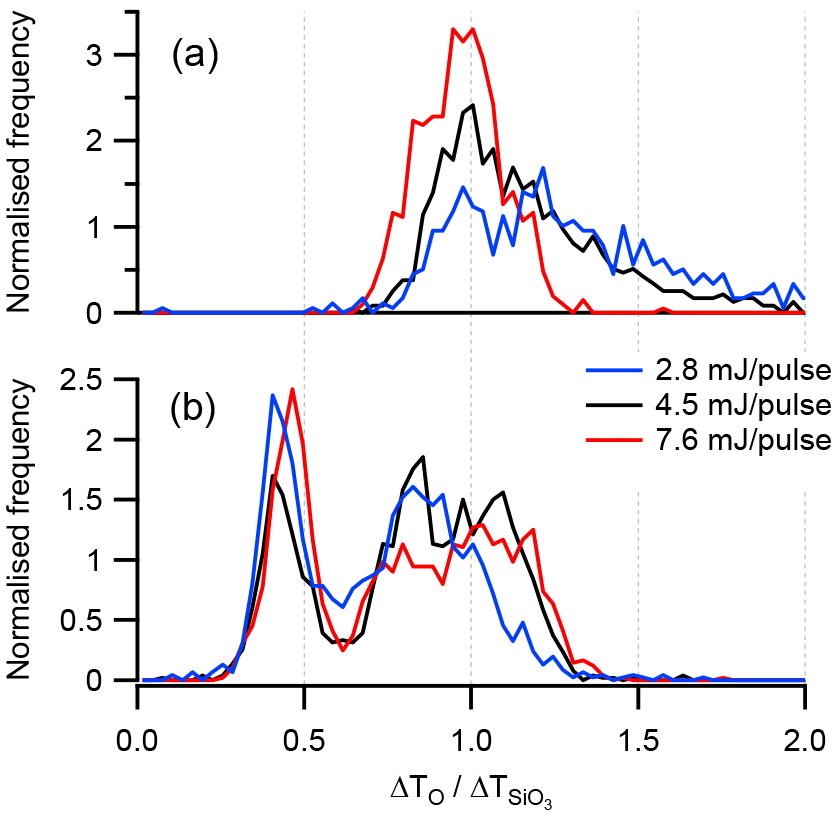
Figure 9Histograms of the ion arrival times shift ratio (τ) of the elemental ion O− and the molecular ion with different laser pulse energy settings. (a) Kaolinite sample KGa-1b and (b) illite NX.
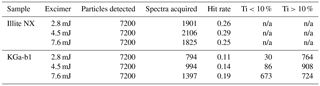
An explanation for this behaviour may be found in the hit-rate efficiency, defined as the number of spectra acquired divided by the number of particles detected (Table 7). The hit rate for illite NX was more than double that of KGa-1b at 4.5 mJ. In addition, hit rate was much more sensitive to energy setting with KGa-1b than with illite NX. Increasing the laser energy from 2.8 to 7.6 mJ per pulse resulted in a hit-rate increase of 42 % for the KGa-1b sample. Species-dependent hit rates are associated with the power density threshold required to initiate the ablation/ionisation process, which is related to the lattice energy and absorbing properties of the material at 193 nm (Thomson et al., 1997). It is therefore reasonable to assume that the increase in the τ>1 fraction in illite NX at 7.6 mJ per pulse is partly due to the presence of a material with a high-power density threshold such as kaolinite. The increase in the hit rate with KGa-1b at 7.6 mJ was in a large part due to the acquisition of spectra showing a purer form of kaolinite as indicated by the titanium content (Table 7). It is not known if the titanium was present in these particles as a structural cation, therefore altering the crystal structure, or as free titanium impurity.
Table 7The effect of the excimer pulse energy setting on the particle hit rate with illite NX and kaolinite sample KGa-1b. The number of particles that are low (<10 % peak area) and high (>10 % peak area) in titanium are given for the KGa-1b sample. The titanium content in the mass spectra was calculated from the combined peak area of the Ti+ (m∕z 48) and TiO+ (m∕z 64) and the total positive ion signal (n/a = not applicable).
3.4 The role of the interstitial complex
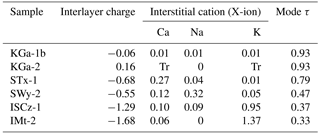
The main physiochemical difference between clay minerals is the nature of the interstitial X-ion that is accommodated between the silicate structural layers. For the source clays, the relative proportion of low-valence interstitial cations (X-ion) present in the structure is discernible from the structural formulae provided by the Clay Mineral Society (Table 2). These ion proportions are listed alongside the literature values for interlayer charge and value of τ of the principal mode derived from this study in Table 8. There is some negative correlation between τ and the layer charge, with the exception of the calcium-rich montmorillonite STx-1. In calcium-rich montmorillonite, the layer charge is balanced by abundant divalent ions of calcium, which have a first ionisation energy (589.8 kJ mol−1) that is higher than the aluminium (577.5 kJ mol−1) in the silicate structural layer. In contrast, SWy-1, ISCz-1 and IMt-2 samples have a layer charge that is principally balanced by sodium and potassium ions that have first ionisation energies that are lower than any component in the silicate structural layer (495.8 and 418.8 kJ mol−1 respectively).
Table 8Measured values of τ compared to the interlayer charge and cation ratios from structural formulae derived from elemental analysis (Tr is trace). Reference material is from the Clay Minerals Society.
A comparison of the interstitial X-ion content derived from elemental analysis and the measured τ value for clay minerals and feldspars is given in Fig. 10. The combined sodium and potassium content derived from the calculated structural formulae for source clays is plotted against the mode value of τ derived from the peak analysis. For clay samples that exhibit multimodal τ distributions, only the lowest principal mode is represented in the data. Relatively high levels of sodium and potassium result in a low τ value for these modes. For feldspars, the cation content is measured from the positive ion mass spectra and plotted against τ on a single-particle basis for orthoclase and plagioclase in Fig. 10a and b. In contrast, higher sodium and potassium content in feldspars result in high τ values. The influence of the calcium ion on the τ value in plagioclase feldspar is demonstrated in the colour function in plot Fig. 10b. When Ca/Na ratios are high, the τ is >1. This has similar response to the kaolinite sample, which is depleted in interstitial X-ions.

Figure 10Peak shift ratio (τ) with respect to the combined sodium and potassium content. Clay mineral standards are the mode value of τ against the cation content in the structural formula derived from elemental analysis of the bulk samples. Error bars are the 25 and 75 percentiles. Feldspar and illite NX cation content is measured from the positive ion mass spectral peak areas. (a) Polydisperse and mass selected 700 fg orthoclase feldspar particles and (b) plagioclase feldspar with the CaO content (m∕z 56) highlighted.(c) The representative clay mineral sample illite NX with the width of the SiO3 molecular ion highlighted in the colour function.
Mass selecting 700 fg orthoclase particles with the CPMA produces a similar distribution to polydisperse particles, suggesting there is not particle size effect to the distribution. The low recorded potassium and sodium content in some feldspar particles may be a result of the crushing of the sample as this is known to cause collapse of the interstitial cavity (Garcia-guinea and Correcher, 2000) so that feldspar particles with low cation content may not be representative of naturally occurring feldspar.
Distinctive clusters of data points are apparent in the illite NX sample when τ is plotted against alkali metal content derived from single-particle mass spectra (Fig. 10c). The concentration of particles in the region τ=1.0–1.2 are clearly distinguishable from particles in the τ=0.6–1.0 region by the content of low-valence potassium and sodium ions. These clusters of data points occupy similar areas of the plot to kaolinite and feldspars. The large cluster of particles with τ<0.64 is congruent with the principal mode in the Imt-2 and ISCz-1 samples and is also characterised by relatively large peak width values. Multimodal peak shapes, as described in Sect. 2.4, mainly occur with τ > 0.64 in the illite NX sample but were never observed for feldspar with peak widths of the SiO3 molecular ion that were always < 15 ns. Broad (> 15 ns), multimodal spectral peak morphologies were attributed to aggregated or mixed particles in which the ion formation process is not uniform.
3.5 Single-particle differentiation of clay mineral standards
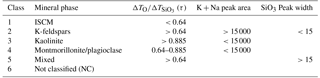
The dependence of the ion arrival times on the nature of the cations in the interstitial complex gives rise to the possibility of using these measurements to classify the mineralogical contents of mineral dust samples on a single-particle basis. Using published XRD analysis data as a guide, the classification scheme outlined in Table 9 was used to quantify the particle number concentrations of mineral types in the clay-rich mineral samples illite NX, IMt-2 and ISCz-1 (Fig. 11). The first class of particles is defined as the group of particles with τ<0.64 which only appear in samples rich in illite clays. This class is attributed to illite–smectite clay minerals (ISCM) because in natural clay samples, illite occurs in fine interlayers with smectite clays. The second class is particularly well developed in the illite NX and IMt-2 samples and is defined by τ>0.64 and high potassium and sodium content that is typical of the orthoclase (K-feldspar) sample. The exception is particles within this group that exhibit broad multimodal peak morphology which are placed in a separate class of mixed particles (class 5). Kaolinite (class 3) has, by definition, very low potassium and sodium content and is also defined by high τ measured in the pure form of the mineral (KGa-1b above). The fourth mineral class assigns particles with intermediate values of τ and relatively low potassium and sodium content to montmorillonite or Na-feldspar (plagioclase) because of the difficulty in distinguishing between these two minerals with the peak analysis. In cases in which the peak analysis was unable to produce a result, mainly due to failure of the peak fitting, were allocated to a non-classified particle class. Examples of raw mass spectra of each particle class are presented in the Supplement (S2) alongside example spectra for all other mineral samples used in this study.
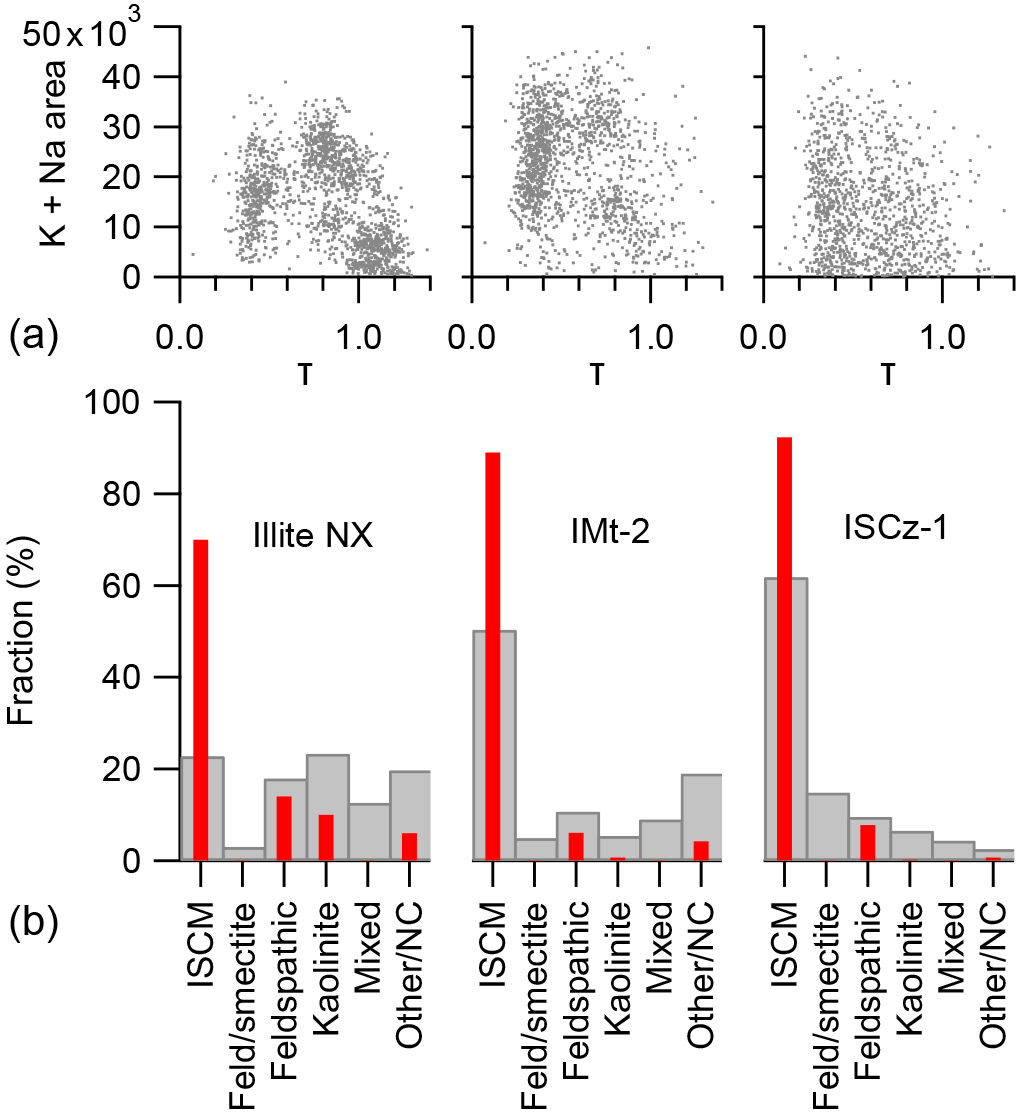
Figure 11Mineral-phase classification of illite NX, IMt-2 and ISCz-1 clay reference samples using a combined peak position shift and traditional peak area classification scheme. Single-particle measurements of (τ) vs. the combined potassium and sodium content are shown in the top panel (a). Panel (b) reports the particle number fractions determined by the peak analysis classification method (grey bars), and bulk mass fractions of minerals reported by XRD analysis of illite NX from Hiranuma et al. (2015), and IMt-2 and ISCz-1 from Vogt (2002) (red bars).
Table 9Single-particle mineral-phase classification scheme based on τ, combined potassium and sodium content, and SiO3 molecular ion peak width.
The differentiation of mineral phase by this classification method has some broad agreement with the XRD analysis. The relative particle number fraction of ISCM between the three samples is in agreement with the relative mass concentration of illite derived from XRD; i.e. ISCz-1 is the most illite-rich followed by IMt-2 and illite NX. A greater fraction of feldspar and kaolinite is also measured for illite NX than for the other samples in agreement with XRD analysis. The main difference in the mineral fraction reported by XRD analysis and this peak analysis technique is the relative fraction of ISCM minerals with non-ISCM mineral classes. The differences may arise from comparing a number-counting technique with a mass fraction, and from hit-rate bias in the LAAP-TOF measurement which may discriminate against certain particle types as discussed in Sect. 3.3 above. In addition, the XRD analysis technique does not report the fraction of amorphous material and the degree of homogeneity in the bulk samples is not well characterised and may result in sample-to-sample differences in the composition of a clay mineral standard.
The relatively poor resolution of the mineral differentiation makes the identification of the exact mineral phase difficult. Whilst the plots of τ vs. K + Na content (Fig. 11, top panels) produce distinct particle clusters for illite NX and IMt-2, the corresponding plot for ISCz-1 is much less differentiated. It is not clear if this occurs because of the poor resolution of the method or because the natural variation in composition of the latter sample.
3.6 Relative shift of positive and negative ions
The ratio ΔTK∕ΔTO is plotted against (τ) in Fig. 12. In this plot, the distribution of data points for borosilicate glass and orthoclase feldspar suggests a positive correlation between these ratios, with the trends in the distributions converging towards a point at which the magnitude of shift of all species is equal. In illite IMt-2 the ISCM mineral fraction, identified as class 1 in the classification scheme, does not show a correlation between positive alkali metals ion and negative silicate molecular ion arrival times, which may indicate a decoupling of the positive and negative ion formation process.
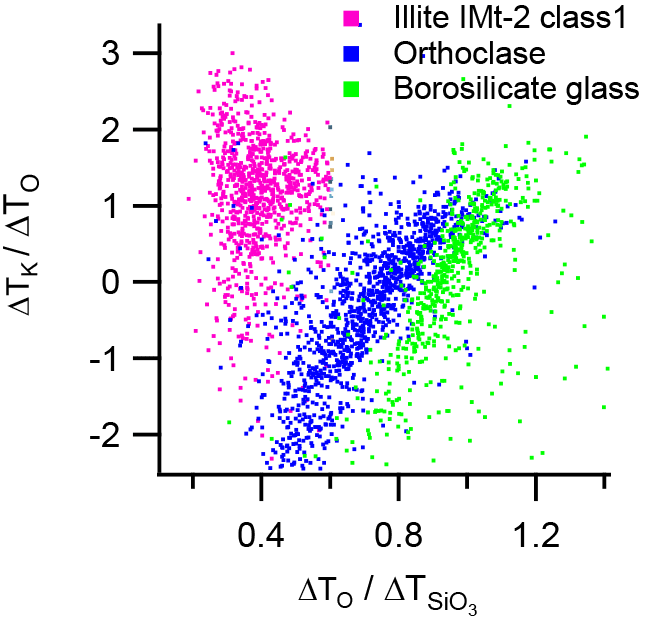
Figure 12Relative ion arrival times in positive ion with respect to relative ion arrival times in negative ion. Borosilicate glass and orthoclase feldspar polydisperse particles and the ISCM fraction (class 1) of illite IMt-2.
In TOF-MS the principal limitations in resolving the power of an instrument are attributed to the differences in initial ion velocity distribution (energy focussing) and differences in the initial starting positions (space focussing); it is not easy to decouple these effects (Guilhaus, 1995). In addition, ion formation time, ion trajectory through the ion optics, and temporal jitter of the timing electronics all contribute to differences in arrival times of a certain ion species at the TOF-MS detector. It is not possible to empirically derive the starting position, initial ion velocity or ion formation times from the ion arrival times alone. However, the relative differences in ion arrival times may hold clues to the nature of the ion formation mechanism even if the actual ion velocities and ion formation times are not quantified.
Ion arrival times have been studied with the Matrix-Assisted Laser Desorption Ionisation (MALDI) technique, in which the sample is presented on a sample plate. With this method of sample introduction, initial ion velocity distributions are considered to be the primary cause of mass spectral peak broadening (Colby et al., 1994) because the sample position is fixed, reducing the effects of space focussing. A measurement of initial kinetic energy of ions with MALDI indicated that the initial velocities of the matrix and analyte ions are identical, suggesting that the analyte molecule is entrained into an expanding molecular jet of matrix ions and neutrals (Beavis and Chait, 1991; Pan and Cotter, 1992). In contrast, Spengler and Kirsch (2003) observed a mass-dependent initial ion velocity that could result from thermal ionisation or a charge transfer and cluster decay ionisation mechanism.
In the case of SPMS, where the initial starting position is not fixed (due to particle beam divergence), space focussing is considered to be as important as energy focussing on causing differences in ion arrival times. However, with the field-free extraction featured in the LAAP-TOF, space focussing is reduced to a simple difference in the time it takes an ion to enter the extraction optics, which is likely to be small compared to the effects of different ion velocities. In addition, ion species dependence of the shift in ion arrival times recorded in the mass spectra indicate that the shot-to-shot differences in average flight times of the ions is not a result of a temporal offset of the firing of the excimer laser and/or starting of the A∕D timing device as this would affect all ion species equally. This reasoning leaves changes in initial ion velocity and ion formation time as the primary candidates for the cause of the peaks shifting and peak broadening observed. Changes in ion formation time will include differences in the timing of the initial particle–laser interaction due to particle trajectory and the properties of the material as well as the timing of ion species formation after the ablation process has commenced. The equal shift in ion arrival times of elemental and molecular ions observed with borosilicate glass suggests an equal addition to the scalar ion velocity and/or ion formation time, which can only be explained by shot to shot differences in ion formation time and initial ion velocities in a molecular jet. In contrast, the mass dependence to the negative ion peak shift for CB suggests a mass-dependent velocity difference, which suggests thermal ionisation or a charge transfer and cluster decay ionisation mechanism.
It is reasonable that decay of the crystal lattice would be a factor in the ablation of mineral particles whose crystalline mineral structures have a typical lattice energy of >5000 kJ mol−1 (Jenkins et al., 2002), which far exceeds the energy available to a typical particle in a single-laser pulse. Crystalline mineral structures could impose ion species dependence onto the lattice decay and ion entrainment, such as that observed when comparing the average peak positions of the mineral dust with respect to the amorphous glass calibration. In clay minerals, the exchangeable interstitial cations that are in a weakly bonded layer provide an energy sink for the laser energy and could be desorbed before the negatively changed tetrahedral and octahedral layers which then disintegrate by lattice decay. In this scenario, the effective decoupling of the positive and negative ion formation, as suggested in the comparison of positive and negative ion arrival times (Fig. 12), may result from differences in ion formation time and initial velocities of the K+ and ions species. This process is not possible in feldspar mineral whose silicate structure must be broken in order to release the interstitial cation so that the K+ and ion species coexist in the ion plume, producing equal ion velocities due to columbic forces and collisions. The provenance of the O− elemental ion in the negative ion spectra is a source of uncertainty in the interpretation of a lattice decay mechanism. In pure feldspars, the O− ion must be derived from the silica tetrahedra, but in clay minerals interstitial OH molecules or absorbed water in the particles are additional sources of oxygen. The presence of water may be of significance as it is known to affect the ionisation process in LDI (Neubauer et al., 1998) and warrants further investigation.
The weak interaction of the interstitial complex with the silicate tetrahedra controls the stability of minerals in natural rock-forming processes (Hawthorne, 2015) and would appear to have an influence on relative ion arrival times in SPMS. The influence of the interstitial potassium and sodium ion content on the relative arrival times of the O− and species forms the basis of our classification of mineral phase. Measurement of the potassium and sodium content by peak area analysis is a potential source of uncertainty in the measurement due to particle matrix effects and the insufficient dynamic range of the TOF-MS detector. In addition, the amount of energy encountered by particles due to instrument function and laser power setting could be an important consideration for the accuracy and reproducibility of the analysis. The influence of the laser power setting on the hit rate for kaolinite and illite demonstrate the potential for number fraction bias in the classification. Using the highest laser power setting would not be desirable for ambient sampling because of excessive fragmentation of non-silicate material such as internally and externally mixed organic material. One could also postulate that the same initial ion velocities would be reached by all ions if enough pulse energy is available to overcome the constraints of the lattice energy regardless of the crystal structure. In this study we found that 4.5 mJ pulse−1 was a suitable laser setting for differentiating particles types in illite NX.
The differentiation of mineral phases in this study was demonstrated with clay mineral standards with a well-characterised composition. The classification system was defined using the mineralogical composition from XRD analysis as a guide. Because of the huge variety in mineral phase that occurs in nature and the potential for phase mixing within a single particle, the identification of specific mineral phases is expected to be more difficult in complex natural samples such as desert dust, especially if XRD analysis of mineralogy is not available for reference. Even so, the distribution of τ values is expected to provide an insight into the composition of clay-sized fraction of a dust sample even if the exact mineral phase is not clearly identified. Analysis of the mineralogy of transported Saharan dust measured at Praia, Cape Verde during the ICE-D campaign (August 2015) is presented in a separate publication (Marsden et al., 2017).
Further work is required in development of this method. The tuning of the ion optics is of particular importance in determining the flight times of ions with respect to initial ion velocity. Modelling of the ion trajectories in a software package such as SIMION (Scientific Instrument Services, Inc.) may provide optimised tuning that further exploits the differences in ion focussing that arise from differences in particle composition. The transferability of the method to other LAAP-TOF instruments will also likely depend on the tuning of the ion optics. Tuning parameters used for this study are provided in the Supplement (S1). Establishing the role of fixed instrument design features will indicate how transferable this method is to other designs of single-particle mass spectrometers. For example, when extracting using an electric field one would expect an increased plume density and therefore an increase in space-charge effects and collisions as the ion plume is not free to expand in all directions. In addition, an orthogonal geometry of the excimer laser with the particle beam is likely to produce less variation in the position and timing in which a particle encounters the threshold power density for LDI compared to the co-axial geometry used in the LAAP-TOF.
A novel technique has been presented that uses peak centroid measurement in addition to peak areas that describe the mass spectral characteristics arising from the LDI of single particles of silicate mineral dust. To our knowledge, this is the first time that the properties of a material have been described by the relative changes in the ion arrival times of an ion species at a TOF-MS detector. Examination of the spectral patterns from dust samples reveals spectrum to spectrum variation in the relative peak position of the molecular ion with respect to the O− elemental ion that occurs in distinct modes. A comparison of these modes with the borosilicate glass and carbon black suggests that the mode preference is a result of particle crystal structure and elemental composition, the properties that define mineral phase.
Analysis of clay mineral standards and nominally pure feldspars suggest that the relative shift of the elemental and molecular ions is a function of the quantity and co-ordination of potassium and sodium cations in the interstitial complex. It is proposed that the mineral phase of the particle matrix influences the ion formation mechanism and produces variations in initial ion velocity and ion formation timing during the LDI of single particles. These effects are enhanced by the co-axial geometry of the excimer laser with the particle beam and are preserved in the field-free extraction regime in the TOF-MS implemented in the LAAP-TOF. This may represent an important step in the understanding of how LDI proceeds in SPMS.
Analysis of multimineralic clay mineral standards reveals a multimodal pattern in ion arrival times. A scheme that classifies single particles has been defined on the basis of the alkali metal peak areas and the relative difference in the shift in the ion arrival times of the O− and species with respect to a calibration, a parameter we call τ. Application of the scheme to clay mineral standards results in the single-particle differentiation of illite–smectite clay mineral (ISCM), feldspars and kaolinite that is in agreement with bulk mineralogy reported in semi-quantitative XRD analysis.
The nature of the interstitial complex and its effect on crystal structure can be extremely varied even within a single grain or crystal so that complete reproducibility would not be expected from any single-particle measurement of a natural mineral dust sample. In circumstances in which the actual mineral phase cannot be determined, it is still expected that the ion arrival time ratios will be a useful parameter in describing differences in physiochemical properties of silicate particles. This represents an important step forward in the study of atmospheric processes for which single-particle mineral phase is important.
All laboratory acquired data presented in this manuscript are available by request from the corresponding author (hugh.coe@manchester.ac.uk).
The supplement related to this article is available online at: https://doi.org/10.5194/amt-11-195-2018-supplement.
The experiment was designed and performed by NM with the support of MF. The data analysis was developed and performed by NM. The manuscript was prepared by NM with contributions from HC and JA.
The authors declare that they have no conflict of interest.
This work was supported by a PhD studentship awarded to Nicholas A. Marsden by
the Natural Environment Research Council (NERC M113463J). We would
like to thank Alison Pawley, Kate Brodie and Merren Jones for their
support in selecting representative mineral samples.
Edited by: Pierre Herckes
Reviewed by: three anonymous referees
Atkinson, J. D., Murray, B. J., Woodhouse, M. T., Whale, T. F., Baustian, K. J., Carslaw, K. S., Dobbie, S., O'Sullivan, D., and Malkin, T. L.: The importance of feldspar for ice nucleation by mineral dust in mixed-phase clouds, Nature, 498, 355–358, https://doi.org/10.1038/nature12278, 2013.
Balkanski, Y., Schulz, M., Claquin, T., and Guibert, S.: Reevaluation of mineral aerosol radiative forcings suggests a better agreement with satellite and AERONET data, Atmos. Chem. Phys., 7, 81–95, https://doi.org/10.5194/acp-7-81-2007, 2007.
Baustian, K. J., Cziczo, D. J., Wise, M. E., Pratt, K. A., Kulkarni, G., Hallar, A. G., and Tolbert, M. A.: Importance of aerosol composition, mixing state, and morphology for heterogeneous ice nucleation: a combined field and laboratory approach, J. Geophys. Res., 117, D06217, https://doi.org/10.1029/2011JD016784, 2012.
Beavis, R. C. and Chait, B. T.: Velocity distributions of intact high mass polypeptide molecule ions produced by matrix assisted laser desorption, Chem. Phys. Lett., 181, 479–484, https://doi.org/10.1016/0009-2614(91)90384-L, 1991.
Broadley, S. L., Murray, B. J., Herbert, R. J., Atkinson, J. D., Dobbie, S., Malkin, T. L., Condliffe, E., and Neve, L.: Immersion mode heterogeneous ice nucleation by an illite rich powder representative of atmospheric mineral dust, Atmos. Chem. Phys., 12, 287–307, https://doi.org/10.5194/acp-12-287-2012, 2012.
Cakmur, R. V., Miller, R. L., Perlwitz, J., Geogdzhayev, I. V., Ginoux, P., Koch, D., Kohfeld, K. E., Tegen, I., and Zender, C. S.: Constraining the magnitude of the global dust cycle by minimizing the difference between a model and observations, J. Geophys. Res.-Atmos., 111, 1–24, https://doi.org/10.1029/2005JD005791, 2006.
Caquineau, S., Magonthier, M.-C., Gaudichet, A., and Gomes, L.: An improved procedure for the X-ray diffraction analysis of low-mass atmospheric dust samples, Eur. J. Mineral., 9, 157–166, https://doi.org/10.1127/ejm/9/1/0157, 1997.
Caquineau, S., Gaudichet, A., Gomes, L., and Legrand, M.: Mineralogy of Saharan dust transported over northwestern tropical Atlantic Ocean in relation to source regions, J. Geophys. Res.-Atmos., 107, 4251, https://doi.org/10.1029/2000JD000247, 2002.
Chipera, S. J. and Bish, D. L.: Baseline studies of the clay minerals society source clays: powder X-ray diffraction analyses, Clay. Clay Miner., 49, 398–409, https://doi.org/10.1346/CCMN.2001.0490511, 2001.
Claquin, T., Schulz, M., and Balkanski, Y. J.: Modeling the mineralogy of atmospheric dust sources, J. Geophys. Res., 104, 22243, https://doi.org/10.1029/1999JD900416, 1999.
Colby, S. M., King, T. B., and Reilly, J. P.: Improving the resolution of matrix-assisted laser desorption/ionization time-of-flight mass spectrometry by exploiting the correlation between ion position and velocity, Rapid Commun. Mass Sp., 8, 865–868, 1994.
Connolly, P. J., Möhler, O., Field, P. R., Saathoff, H., Burgess, R., Choularton, T., and Gallagher, M.: Studies of heterogeneous freezing by three different desert dust samples, Atmos. Chem. Phys., 9, 2805–2824, https://doi.org/10.5194/acp-9-2805-2009, 2009.
Dall'Osto, M., Harrison, R. M., Highwood, E. J., O'Dowd, C., Ceburnis, D., Querol, X., and Achterberg, E. P.: Variation of the mixing state of Saharan dust particles with atmospheric transport, Atmos. Environ., 44, 3135–3146, https://doi.org/10.1016/j.atmosenv.2010.05.030, 2010.
DeMott, P. J.: African dust aerosols as atmospheric ice nuclei, Geophys. Res. Lett., 30, 1732, https://doi.org/10.1029/2003GL017410, 2003.
DeMott, P. J., Prenni, a J., Liu, X., Kreidenweis, S. M., Petters, M. D., Twohy, C. H., Richardson, M. S., Eidhammer, T., and Rogers, D. C.: Predicting global atmospheric ice nuclei distributions and their impacts on climate, P. Natl. Acad. Sci. USA, 107, 11217–11222, https://doi.org/10.1073/pnas.0910818107, 2010.
DeMott, P. J., Prenni, A. J., McMeeking, G. R., Sullivan, R. C., Petters, M. D., Tobo, Y., Niemand, M., Möhler, O., Snider, J. R., Wang, Z., and Kreidenweis, S. M.: Integrating laboratory and field data to quantify the immersion freezing ice nucleation activity of mineral dust particles, Atmos. Chem. Phys., 15, 393–409, https://doi.org/10.5194/acp-15-393-2015, 2015.
Duce, R. A. and Tindale, N. W.: Atmospheric transport of iron and its deposition in the ocean, Limnol. Oceanogr., 36, 1715–1726, https://doi.org/10.4319/lo.1991.36.8.1715, 1991.
Formenti, P., Rajot, J. L., Desboeufs, K., Caquineau, S., Chevaillier, S., Nava, S., Gaudichet, A., Journet, E., Triquet, S., Alfaro, S., Chiari, M., Haywood, J., Coe, H., and Highwood, E.: Regional variability of the composition of mineral dust from western Africa: results from the AMMA SOP0/DABEX and DODO field campaigns, J. Geophys. Res.-Atmos., 113, 1–12, https://doi.org/10.1029/2008JD009903, 2008.
Formenti, P., Schütz, L., Balkanski, Y., Desboeufs, K., Ebert, M., Kandler, K., Petzold, A., Scheuvens, D., Weinbruch, S., and Zhang, D.: Recent progress in understanding physical and chemical properties of African and Asian mineral dust, Atmos. Chem. Phys., 11, 8231–8256, https://doi.org/10.5194/acp-11-8231-2011, 2011.
Friedrich, F., Steudel, A., and Weidler, P. G.: Change of the re- fractive index of illite particles by reduction of the Fe con- tent of the octahedral sheet, Clay. Clay Miner., 56, 505–510, https://doi.org/10.1346/CCMN.2008.0560503, 2008.
Gallavardin, S., Lohmann, U., and Cziczo, D.: Analysis and differentiation of mineral dust by single particle laser mass spectrometry, Int. J. Mass Spectrom., 274, 56–63, https://doi.org/10.1016/j.ijms.2008.04.031, 2008.
Garcia-guinea, J. and Correcher, V.: Luminescence spectra of alkali feldspars: influence of crushing on the ultraviolet emission band, Spectrosc. Lett., 33, 103–113, https://doi.org/10.1080/00387010009350062, 2000.
Garrels, R. M.: Montmorillonite/Illite stability diagrams, Clay. Clay Miner., 32, 161–166, https://doi.org/10.1346/CCMN.1984.0320301, 1984.
Goudie, A. S. and Middleton, N. J.: Desert Dust in the Global System, Springer, Berlin, Germany, 2006.
Guilhaus, M.: Principles and instrumentation in time-of-flight mass spectrometry, Physical and instrumental concepts, J. Mass Spectrom., 30, 1519–1532, https://doi.org/10.1002/jms.1190301102, 1995.
Hawthorne, F. C.: Toward theoretical mineralogy?: A bond-topological approach, Am. Mineral., 100, 696–713, https://doi.org/10.2138/am-2015-5114, 2015.
Hinz, K. and Spengler, B.: Instrumentation, data evaluation and quantification in on-line aerosol mass spectrometry, J. Mass Spectrom., 42, 843–860, https://doi.org/10.1002/jms.1262, 2007.
Hiranuma, N., Augustin-Bauditz, S., Bingemer, H., Budke, C., Curtius, J., Danielczok, A., Diehl, K., Dreischmeier, K., Ebert, M., Frank, F., Hoffmann, N., Kandler, K., Kiselev, A., Koop, T., Leisner, T., Möhler, O., Nillius, B., Peckhaus, A., Rose, D., Weinbruch, S., Wex, H., Boose, Y., DeMott, P. J., Hader, J. D., Hill, T. C. J., Kanji, Z. A., Kulkarni, G., Levin, E. J. T., McCluskey, C. S., Murakami, M., Murray, B. J., Niedermeier, D., Petters, M. D., O'Sullivan, D., Saito, A., Schill, G. P., Tajiri, T., Tolbert, M. A., Welti, A., Whale, T. F., Wright, T. P., and Yamashita, K.: A comprehensive laboratory study on the immersion freezing behavior of illite NX particles: a comparison of 17 ice nucleation measurement techniques, Atmos. Chem. Phys., 15, 2489–2518, https://doi.org/10.5194/acp-15-2489-2015, 2015.
Huffman, J. A., Jayne, J. T., Drewnick, F., Aiken, A. C., Onasch, T., Worsnop, D. R., and Jimenez, J. L.: Design, modeling, optimization, and experimental tests of a particle beam width probe for the aerodyne aerosol mass spectrometer, Aerosol Sci. Tech., 39, 1143–1163, https://doi.org/10.1080/02786820500423782, 2005.
Jayne, J. T., Leard, D. C., Zhang, X., Davidovits, P., Smith, K. a., Kolb, C. E., and Worsnop, D. R.: Development of an aerosol mass spectrometer for size and composition analysis of submicron particles, Aerosol Sci. Tech., 33, 49–70, https://doi.org/10.1080/027868200410840, 2000.
Jenkins, H. D. B., Tudela, D., and Glasser, L.: Lattice potential energy estimation for complex ionic salts from density measurements, Inorg. Chem., 41, 2364–2367, https://doi.org/10.1021/ic011216k, 2002.
Jeong, G. Y.: Bulk and single-particle mineralogy of Asian dust and a comparison with its source soils, J. Geophys. Res.-Atmos., 113, 1–16, https://doi.org/10.1029/2007JD008606, 2008.
Jeong, G. Y. and Nousiainen, T.: TEM analysis of the internal structures and mineralogy of Asian dust particles and the implications for optical modeling, Atmos. Chem. Phys., 14, 7233–7254, https://doi.org/10.5194/acp-14-7233-2014, 2014.
Jeong, G. Y., Park, M. Y., Kandler, K., Nousiainen, T., and Kemppinen, O.: Mineralogical properties and internal structures of individual fine particles of Saharan dust, Atmos. Chem. Phys., 16, 12397–12410, https://doi.org/10.5194/acp-16-12397-2016, 2016.
Jickells, T. and Spokes, L.: Atmospheric iron inputs into the ocean, in: The Biochemistry of Iron in Seawater, Wiley, Chichester, UK, 85–121, 2001.
Kamphus, M., Ettner-Mahl, M., Klimach, T., Drewnick, F., Keller, L., Cziczo, D. J., Mertes, S., Borrmann, S., and Curtius, J.: Chemical composition of ambient aerosol, ice residues and cloud droplet residues in mixed-phase clouds: single particle analysis during the Cloud and Aerosol Characterization Experiment (CLACE 6), Atmos. Chem. Phys., 10, 8077–8095, https://doi.org/10.5194/acp-10-8077-2010, 2010.
Kandler, K., Benker, N., Bundke, U., Cuevas, E., Ebert, M., Knippertz, P., Rodríguez, S., Schütz, L., and Weinbruch, S.: Chemical composition and complex refractive index of Saharan Mineral Dust at Izaña, Tenerife (Spain) derived by electron microscopy, Atmos. Environ., 41, 8058–8074, https://doi.org/10.1016/j.atmosenv.2007.06.047, 2007.
Kandler, K., Schütz, L., Deutscher, C., Ebert, M., Hofmann, H., Jäckel, S., Jaenicke, R., Knippertz, P., Lieke, K., Massling, A., Petzold, A., Schladitz, A., Weinzierl, B., Wiedensohler, A., Zorn, S., and Weinbruch, S.: Size distribution, mass concentration, chemical and mineralogical composition and derived optical parameters of the boundary layer aerosol at Tinfou, Morocco, during SAMUM 2006, Tellus B, 61, 32–50, https://doi.org/10.1111/j.1600-0889.2008.00385.x, 2009.
Kandler, K., Lieke, K., Benker, N., Emmel, C., Küpper, M., Müller-Ebert, D., Ebert, M., Scheuvens, D., Schladitz, A., Schütz, L., and Weinbruch, S.: Electron microscopy of particles collected at Praia, Cape Verde, during the Saharan Mineral Dust Experiment: particle chemistry, shape, mixing state and complex refractive index, Tellus B, 63, 475–496, https://doi.org/10.1111/j.1600-0889.2011.00550.x, 2011.
Kaufman, Y. J., Koren, I., Remer, L. A., Tanré, D., Ginoux, P., and Fan, S.: Dust transport and deposition observed from the Terra-Moderate Resolution Imaging Spectroradiometer (MODIS) spacecraft over the Atlantic Ocean, J. Geophys. Res.-Atmos., 110, 1–16, https://doi.org/10.1029/2003JD004436, 2005.
Kaufmann, L., Marcolli, C., Hofer, J., Pinti, V., Hoyle, C. R., and Peter, T.: Ice nucleation efficiency of natural dust samples in the immersion mode, Atmos. Chem. Phys., 16, 11177–11206, https://doi.org/10.5194/acp-16-11177-2016, 2016.
Lafon, S., Sokolik, I. N., Rajot, J. L., Caquincau, S., and Gaudichet, A.: Characterization of iron oxides in mineral dust aerosols: implications for light absorption, J. Geophys. Res.-Atmos., 111, 1–19, https://doi.org/10.1029/2005JD007016, 2006.
Liu, P., Ziemann, P. J., Kittelson, D. B., and McMurry, P. H.: Generating particle beams of controlled dimensions and divergence: I. theory of particle motion in aerodynamic lenses and nozzle expansions, Aerosol Sci. Tech., 22, 293–313, https://doi.org/10.1080/02786829408959748, 1995.
Long, C. M., Nascarella, M. A., and Valberg, P. A.: Carbon black vs. black carbon and other airborne materials containing elemental carbon: physical and chemical distinctions, Environ. Pollut., 181, 271–286, https://doi.org/10.1016/j.envpol.2013.06.009, 2013.
Marsden, N., Flynn, M. J., Taylor, J. W., Allan, J. D., and Coe, H.: Evaluating the influence of laser wavelength and detection stage geometry on optical detection efficiency in a single-particle mass spectrometer, Atmos. Meas. Tech., 9, 6051–6068, https://doi.org/10.5194/amt-9-6051-2016, 2016.
McConnell, C. L., Formenti, P., Highwood, E. J., and Harrison, M. A. J.: Using aircraft measurements to determine the refractive index of Saharan dust during the DODO Experiments, Atmos. Chem. Phys., 10, 3081–3098, https://doi.org/10.5194/acp-10-3081-2010, 2010.
Mermut, A. R. and Cano, A. F.: Baseline studies of the clay mineral society source clays: chemical analyses of major elements, Clay. Clay Miner., 49, 381–386, 2001.
Middlebrook, A. M.: A comparison of particle mass spectrometers during the 1999 Atlanta Supersite Project, J. Geophys. Res., 108, 8424, https://doi.org/10.1029/2001JD000660, 2003.
Moore, D. M. and Reynolds, R. C.: X-Ray diffraction and the identification and analysis of clay minerals, 2nd Ed., Oxford Univ. Press. Oxford, New York, 1997.
Murphy, D. M.: The design of single particle laser mass spectrometers, Mass Spectrom. Rev., 26, 150–165, https://doi.org/10.1002/mas.20113, 2007.
Neubauer, K. R., Johnston, M. V., and Wexler, A. S.: Humidity effects on the mass spectra of single aerosol particles, Atmos. Environ., 32, 2521–2529, https://doi.org/10.1016/S1352-2310(98)00005-3, 1998.
Nickovic, S., Vukovic, A., Vujadinovic, M., Djurdjevic, V., and Pejanovic, G.: Technical Note: High-resolution mineralogical database of dust-productive soils for atmospheric dust modeling, Atmos. Chem. Phys., 12, 845–855, https://doi.org/10.5194/acp-12-845-2012, 2012.
Niemand, M., Möhler, O., Vogel, B., Vogel, H., Hoose, C., Connolly, P., Klein, H., Bingemer, H., DeMott, P., Skrotzki, J., and Leisner, T.: A particle-surface-area-based parameterization of immersion freezing on desert dust particles, J. Atmos. Sci., 69, 3077–3092, https://doi.org/10.1175/JAS-D-11-0249.1, 2012.
Nousiainen, T., Zubko, E., Niemi, J. V., Kupiainen, K., Lehtinen, M., Muinonen, K., and Videen, G.: Single-scattering modeling of thin, birefringent mineral-dust flakes using the discrete-dipole approximation, J. Geophys. Res.-Atmos., 114, 1–12, https://doi.org/10.1029/2008JD011564, 2009.
Olfert, J. S. and Collings, N.: New method for particle mass classification – the Couette centrifugal particle mass analyzer, J. Aerosol Sci., 36, 1338–1352, https://doi.org/10.1016/j.jaerosci.2005.03.006, 2005.
Pan, Y. and Cotter, R. J.: Measurement of initial translational energies of peptide ions in laser desorption ionization mass-spectrometry, Org. Mass Spectrom., 27, 3–8, 1992.
Perlwitz, J. P., Pérez García-Pando, C., and Miller, R. L.: Predicting the mineral composition of dust aerosols – Part 1: Representing key processes, Atmos. Chem. Phys., 15, 11593–11627, https://doi.org/10.5194/acp-15-11593-2015, 2015.
Prospero, J. M.: Long-range transport of mineral dust in the global atmosphere: impact of African dust on the environment of the southeastern United States, P. Natl. Acad. Sci. USA, 96, 3396–3403, https://doi.org/10.1073/pnas.96.7.3396, 1999.
Prospero, J. M. and Mayol-Bracero, O. L.: Understanding the transport and impact of African dust on the Caribbean Basin, B. Am. Meteorol. Soc., 94, 1329–1337, https://doi.org/10.1175/BAMS-D-12-00142.1, 2013.
Prospero, J. M., Blades, E., Naidu, R., Mathison, G., Thani, H., and Lavoie, M. C.: Relationship between African dust carried in the Atlantic trade winds and surges in pediatric asthma attendances in the Caribbean, Int. J. Biometeorol., 52, 823–832, https://doi.org/10.1007/s00484-008-0176-1, 2008.
Reents, W. D. and Schabel, M. J.: Measurement of individual particle atomic composition by aerosol mass spectrometry, Anal. Chem., 73, 5403–5414, https://doi.org/10.1021/ac010436c, 2001.
Reid, J. S., Jonsson, H. H., Maring, H. B., Smirnov, A., Savoie, D. L., Cliff, S. S., Reid, E. A., Livingston, J. M., Meier, M. M., Dubovik, O., and Tsay, S. C.: Comparison of size and morphological measurements of coarse mode dust particles from Africa, J. Geophys. Res.-Atmos., 108, 8593, https://doi.org/10.1029/2002JD002485, 2003.
Reinard, M. S. and Johnston, M. V: Ion formation mechanism in laser desorption ionization of individual nanoparticles., J. Am. Soc. Mass Spectr., 19, 389–399, https://doi.org/10.1016/j.jasms.2007.11.017, 2008.
Rivin, D.: Carbon Black, in: Handbook of Environmental Chemistry, Springer, Berlin, Germany, 101–158, 1986.
Rosenfeld, D., Rudich, Y., and Lahav, R.: Desert dust suppressing precipitation: a possible desertification feedback loop, P. Natl. Acad. Sci. USA, 98, 5975–80, https://doi.org/10.1073/pnas.101122798, 2001.
Samoli, E., Nastos, P. T., Paliatsos, A. G., Katsouyanni, K., and Priftis, K. N.: Acute effects of air pollution on pediatric asthma exacerbation: evidence of association and effect modification, Environ. Res., 111, 418–424, https://doi.org/10.1016/j.envres.2011.01.014, 2011.
Scheuvens, D., Schütz, L., Kandler, K., Ebert, M., and Weinbruch, S.: Bulk composition of northern African dust and its source sediments – a compilation, Earth-Sci. Rev., 116, 170–194, https://doi.org/10.1016/j.earscirev.2012.08.005, 2013.
Schmidt, S., Schneider, J., Klimach, T., Mertes, S., Schenk, L. P., Kupiszewski, P., Curtius, J., and Borrmann, S.: Online single particle analysis of ice particle residuals from mountain-top mixed-phase clouds using laboratory derived particle type assignment, Atmos. Chem. Phys., 17, 575–594, https://doi.org/10.5194/acp-17-575-2017, 2017.
Sokolik, I. N. and Toon, O. B.: Incorporation of mineralogical composition into models of the radiative properties of mineral aerosol from UV to IR wavelengths, J. Geophys. Res.-Atmos., 104, 9423–9444, https://doi.org/10.1029/1998JD200048, 1999.
Spengler, B. and Kirsch, D.: On the formation of initial ion velocities in matrix-assisted laser desorption ionization: virtual desorption time as an additional parameter describing ion ejection dynamics, Int. J. Mass Spectrom., 226, 71–83, https://doi.org/10.1016/S1387-3806(02)00974-0, 2003.
Sullivan, R. C., Guazzotti, S. A., Sodeman, D. A., and Prather, K. A.: Direct observations of the atmospheric processing of Asian mineral dust, Atmos. Chem. Phys., 7, 1213–1236, https://doi.org/10.5194/acp-7-1213-2007, 2007.
Tegen, I. and Lacis, A. A.: Modeling of particle size distribution and its influence on the radiative properties of mineral dust aerosol, J. Geophys. Res.-Atmos., 101, 19237–19244, https://doi.org/10.1029/95jd03610, 1996.
Thomson, D. S., Middlebrook, A. M., and Murphy, D. M.: Thresholds for laser-induced ion formation from aerosols in a vacuum using ultraviolet and vacuum-ultraviolet laser wavelengths, Aerosol Sci. Tech., 26, 544–559, https://doi.org/10.1080/02786829708965452, 1997.
Usher, C. R., Michel, A. E., and Grassian, V. H.: Reactions on mineral dust., Chem. Rev., 103, 4883–4939, https://doi.org/10.1021/cr020657y, 2003.
Vera, C. C., Trimborn, A., Hinz, K.-P., and Spengler, B.: Initial velocity distributions of ions generated by in-flight laser desorption/ionization of individual polystyrene latex microparticles as studied by the delayed ion extraction method, Rapid Commun. Mass Sp., 19, 133–146, https://doi.org/10.1002/rcm.1753, 2005.
Vogt, C., Lauterjung, J., and Fischer, R.: Investigation of the clay fraction (<2µm) of the clay minerals society reference clays, Clay. Clay Miner., 50, 388–400, 2002.
Watson, A. Y. and Valberg, P. A.: Carbon Black and soot: two different substances, Am. Ind. Hyg. Assoc. J., 62, 218–228, https://doi.org/10.1080/15298660108984625, 2001.
Williams, L. R., Gonzalez, L. A., Peck, J., Trimborn, D., McInnis, J., Farrar, M. R., Moore, K. D., Jayne, J. T., Robinson, W. A., Lewis, D. K., Onasch, T. B., Canagaratna, M. R., Trimborn, A., Timko, M. T., Magoon, G., Deng, R., Tang, D., de la Rosa Blanco, E., Prévôt, A. S. H., Smith, K. A., and Worsnop, D. R.: Characterization of an aerodynamic lens for transmitting particles greater than 1 micrometer in diameter into the Aerodyne aerosol mass spectrometer, Atmos. Meas. Tech., 6, 3271–3280, https://doi.org/10.5194/amt-6-3271-2013, 2013.
Wonaschütz, A., Hitzenberger, R., Bauer, H., Klatzer, B., Caseiro, A., and Puxbaum, H.: Application of the Integrating Sphere Method to Separate the Contributions of Brown and Black Carbon in Atmospheric Aerosols Application of the Integrating Sphere Method to Separate the Contributions of Brown and Black Carbon in Atmospheric Aerosols, Environ. Sci. Technol., 43, 1141–1146, 2009.
Worringen, A., Kandler, K., Benker, N., Dirsch, T., Mertes, S., Schenk, L., Kästner, U., Frank, F., Nillius, B., Bundke, U., Rose, D., Curtius, J., Kupiszewski, P., Weingartner, E., Vochezer, P., Schneider, J., Schmidt, S., Weinbruch, S., and Ebert, M.: Single-particle characterization of ice-nucleating particles and ice particle residuals sampled by three different techniques, Atmos. Chem. Phys., 15, 4161–4178, https://doi.org/10.5194/acp-15-4161-2015, 2015.
Young, G., Jones, H. M., Darbyshire, E., Baustian, K. J., McQuaid, J. B., Bower, K. N., Connolly, P. J., Gallagher, M. W., and Choularton, T. W.: Size-segregated compositional analysis of aerosol particles collected in the European Arctic during the ACCACIA campaign, Atmos. Chem. Phys., 16, 4063–4079, https://doi.org/10.5194/acp-16-4063-2016, 2016.
Zelenyuk, A., Yang, J., Imre, D., and Choi, E.: Achieving size independent hit-rate in single particle mass spectrometry, Aerosol Sci. Tech., 43, 305–310, https://doi.org/10.1080/02786820802637915, 2009.
Zhou, L., Park, K., Milchberg, H. M., and Zachariah, M. R.: Understanding the interaction of an intense laser pulse with nanoparticles: application to the quantification of single particle mass spectrometry, Aerosol Sci. Tech., 41, 818–827, https://doi.org/10.1080/02786820701484955, 2007.
Zimmermann, F., Weinbruch, S., Schütz, L., Hofmann, H., Ebert, M., Kandler, K., and Worringen, A.: Ice nucleation properties of the most abundant mineral dust phases, J. Geophys. Res., 113, D23204, https://doi.org/10.1029/2008JD010655, 2008.