the Creative Commons Attribution 4.0 License.
the Creative Commons Attribution 4.0 License.
Aggregated particles caused by instrument artifact
S. Marcela Loría-Salazar
W. Patrick Arnott
Grant C. Edwards
Matthieu B. Miller
Mae S. Gustin
Previous studies have indicated that superaggregates, clusters of aggregates of soot primary particles, can be formed in large-scale turbulent fires. Due to lower effective densities, higher porosity, and lower aerodynamic diameters, superaggregates may pass through inlets designed to remove particles < 2.5 µm in aerodynamic diameter (PM2.5). Ambient particulate matter samples were collected at Peavine Peak, NV, USA (2515 m) northwest of Reno, NV, USA from June to November 2014. The Teledyne Advanced Pollution Instrumentation (TAPI) 602 BetaPlus particulate monitor was used to collect PM2.5 on two filter types. During this time, aggregated particles > 2.5 µm in aerodynamic diameter were collected on 36 out of 158 sample days. On preliminary analysis, it was thought that these aggregated particles were superaggregates, depositing past PM10 (particles < 10 µm in aerodynamic diameter) pre-impactors and PM2.5 cyclones. However, further analysis revealed that these aggregated particles were dissimilar to superaggregates observed in previous studies, both in morphology and in elemental composition. To determine if the aggregated particles were superaggregates or an instrument artifact, samples were investigated for the presence of certain elements, the occurrence of fires, high relative humidity and wind speeds, as well as the use of generators on site. Samples with aggregated particles, referred to as aggregates, were analyzed using a scanning electron microscope for size and shape and energy dispersive X-ray spectroscopy was used for elemental analysis. It was determined, based on the high amounts of aluminum present in the aggregate samples, that a sampling artifact associated with the sample inlet and prolonged, high wind events was the probable reason for the observed aggregates.
- Article
(4439 KB) - Full-text XML
- BibTeX
- EndNote
When primary particles collide and stick together, agglomerates or aggregates can form, creating complex structures (Kulkarni et al., 2011a). Agglomerate particles can be categorized as branched-chain or compact aggregates (Kulkarni et al., 2011a). Branched-chain particles with internal voids between branches and compact aggregates with internal voids have mass equivalent diameters that are less than the volume equivalent diameter, which implies lower densities than an equivalent ideal spherical particle (Kulkarni et al., 2011a). Soot particles are fractal-like, chain aggregates produced from incomplete combustion (Kulkarni et al., 2011a; Wang et al., 2017). Large-scale, turbulent fires provide vortices where soot aggregates (∼ 100 s of monomers) can be trapped in a high particle to volume area, creating superaggregates consisting of thousands of monomers (Chakrabarty et al., 2014; Kearney and Pierce, 2012; Kulkarni et al., 2011a).
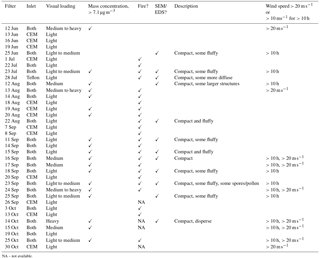
Table 1Days at PEAV in 2014 with visible aggregates on filters, the inlet with aggregates (CEM – cation exchange membranes, Teflon filters, or both inlets), the loading on the filters, whether PM2.5 mass concentration exceeded 75th percentile value for the sample period (7.1 µg m−3), presence of fire flag, scanning electron microscopy (SEM) and energy dispersive X-ray spectroscopy (EDS) analysis, subjective description of the shape, and whether wind speed exceeded 20 m s−1 for at least one hour of the sample day or wind speed exceeded 10 m s−1 for 10 h or longer leading up to or during the sample day.
NA – not available.
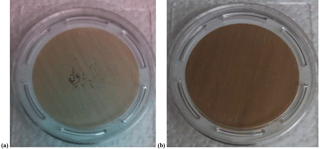
Figure 1Filter (a) is from the higher-elevation, rural site (PEAV) and filter (b) is from the lower-elevation, urban site (UNRG) on 16 September 2014. Aggregates were observed at PEAV but not at UNRG.
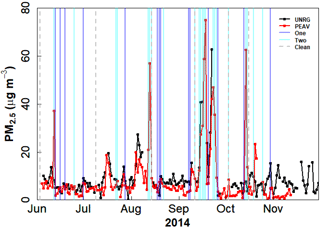
Figure 2PM2.5 (µg m−3) at PEAV (red) and UNRG (black) for June to November 2014. Vertical dark blue lines are days with aggregates on one inlet, vertical light blue lines are days with aggregates on two inlets, and dashed grey lines are days when the inlets were cleaned.
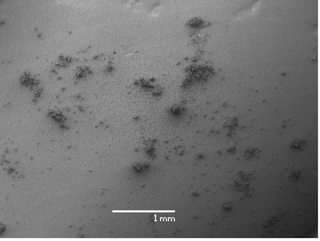
Ambient particulate matter (PM) samples were collected as part of a project to develop and apply a new particulate monitor configured for the measurement of atmospheric mercury (Hg) and lead (Pb) isotopes (Pierce and Gustin, 2016; Pierce et al., 2017). One Teledyne Advanced Pollution Instrumentation (TAPI) 602 BetaPlus particulate monitor was located at a high-elevation site on Peavine Peak, NV, USA (PEAV) and another TAPI was located at a lower-elevation site ∼ 12 km southeast in Reno, NV, USA (UNRG), to collect particles < 2.5 µm in aerodynamic diameter (PM2.5). During the sampling campaign, when instruments were deployed simultaneously at PEAV and UNRG, June to November of 2014, 36 of 158 sample days had particles > 2.5 µm in aerodynamic diameter on sample filters at PEAV, but similar particles, > 2.5 µm in aerodynamic diameter, were not observed at the lower-elevation site (Table 1, Figs. 1 and 2). A season of drought leading to high-intensity wildfires in the western USA (CA, 2017) resulted in numerous smoke events. Preliminary images of the filters from scanning electron microscopy (SEM) seemed to support the hypothesis that these large particles were fire-generated superaggregates (Fig. 3), similar to those observed from several wildfires in Chakrabarty et al. (2014) and from a laboratory fire in Kearney and Pierce (2012). Superaggregates tend to have larger mobility diameters than smaller particles; however, they have low aerodynamic diameters (a measure of their terminal settling velocity), lower effective densities, and are more porous, causing different behavior than primary particles or smaller aggregates (Chakrabarty et al., 2014; Kulkarni et al., 2011a). In Chakrabarty et al. (2014), superaggregates were collected in the third stage of an aerosol impactor with a cut point of < 0.3 µm aerodynamic diameter (Da).
The observation of large aggregated particles, or aggregates that did not conform to the description of superaggregates (e.g., fractal dimensions and lengths) from previous studies led us to wonder if the observed aggregates may in fact be an artifact of the instrument setup and not an ambient air phenomenon. In this manuscript, superaggregates refer to large aggregated particulate matter capable of moving through an inlet with a small cut size, while aggregates refer to the aggregated particulate matter under investigation in this study. Possible explanations for the aggregates, including elemental composition, presence of fires and fire indicators, correlations with relative humidity (RH) and wind speed, as well as the use of generators on site, were investigated. SEM and energy dispersive X-ray spectroscopy (EDS) were used to determine the shape and elemental composition. This paper presents the results of this investigation and the most probable cause for the observed aggregates.
The Peavine Peak, NV, USA (PEAV, 2515 , 39.5895∘ N, 119.9290∘ W) measurement site was located above the tree line in a sage/steppe ecosystem at the summit, ∼ 15 km east of the Sierra Nevada mountain range and ∼ 12 km northwest of downtown Reno, NV, USA. The measurement trailer was located within a fenced area that also contained a radio and cellular relay station. The fence restricted unauthorized visitors from approaching within ∼ 15 m of the measurement trailer. There were weekly visits to the site for maintenance of the relay station. There is one dirt road that leads up to the site from the southwest, all other dirt roads and trails are > 500 m away from the site and lower in elevation. Traffic in the area consists of off-road gasoline and diesel vehicles (trucks, all-terrain vehicles, and dirt bikes), as well as non-motorized traffic. Backup power diesel generators, for the relay station, were periodically operated at the site. During June to October 2014, PEAV was, on average, within the planetary boundary layer from the valley and was influenced by upslope mixing from the valley and free-tropospheric air (Pierce et al., 2017). In November 2014, the average planetary boundary layer height was below PEAV and thus, air from the free troposphere primarily influenced the site.
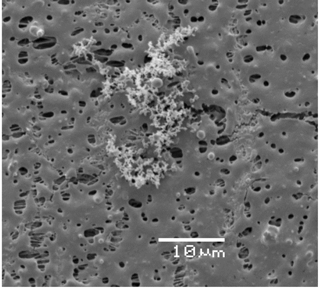
Figure 3Scanning electron microscopy (SEM, uncoated, backscattered electron imaging, low vacuum) image of an aggregate on a Teflon filter from the higher-elevation, rural site (PEAV) on 18 September 2014.
The lower-elevation site was located near the valley floor at the University of Nevada, Reno Greenhouse complex (UNRG) at the Nevada Agricultural Experiment Station Greenhouse Facility (1367 , 39.5374∘ N, 119.8044∘ W) in Reno, NV, USA near the intersection of two major highways, Interstate-80 and Interstate-580 (US Route 395). UNRG and PEAV have ∼ 1 km difference in elevation.
Great Basin National Park, NV (GBNP, 2061 , 39.0052∘ N, 114.2161∘ W) is located on the eastern side of Nevada. Measurements occurred from March to October 2015. The TAPI located at PEAV was moved to GBNP and measurements were made at this high-elevation site, which was also impacted by wildfires during a similar time of year as when it was previously located at PEAV. The measurement trailer was collocated with a Clean Air Status and Trends Network (CASTNET) site.
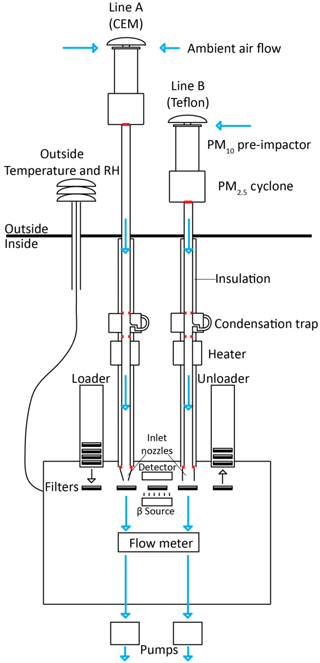
Figure 4Diagram of Teledyne Advanced Pollution Instrumentation (TAPI) 602 BetaPlus particulate monitor (modified from Pierce and Gustin, 2017). Blue indicates the airflow through the instrument. Red indicates where aluminum tubing is in contact with another surface: the base of the PM2.5 cyclones, before and after the condensation water traps, and where the sample tubes entered the TAPI measurement box above the inlet nozzles.
3.1 Particulate measurements
The TAPI was configured to measure PM2.5 mass concentration through two separate inlets each with a 10 µm pre-impactor (FAI Instrument S.R.L. Fonte Nuova, Rome) and a 2.5 µm cyclone (VSCC-A, BGI inc. Waltham, Ma, USA) in-line to prevent particles > 2.5 µm in aerodynamic diameter from continuing in the sample stream (Fig. 4). Ambient air was sampled at 16.7 L min−1 for 24 h (00:00 to 00:00 PST) simultaneously through two filter mediums: 47 mm cation exchange membranes (CEM; Pall Corporation, PN: MSTGS3R, Line A), and 47 mm Teflon (Pall Corporation, PN: EW-36329-08, Line B). Particulate matter mass concentration on the filters was measured using β attenuation (Sohirripa Spagnolo, 1987). At 24 h resolution the TAPI has a detection limit of 0.3 µg m−3 (TAPI, 2012). CEM filters were destructively analyzed for total Hg (Pierce and Gustin, 2017), Teflon filters were used for Pb isotope (Pierce et al., 2017) and aggregate analysis. Teflon membranes are made of polytetrafluoroethylene (PTFE), a hydrophobic fluorocarbon.
Inlets were connected to the instrument by 2.1 m (CEM filter line) and 1.7 m (Teflon filter line) anodized aluminum (Al) sample tubes (2.54 cm outer diameter), supplied with the instrument, that passed into the temperature-controlled trailer to the TAPI housed inside (Fig. 4). Inside the temperature-controlled trailer, sample lines connected to condensation water traps on each line to collect any water droplets that formed on the inside of the sample tubes due to condensation. Just below the condensation water traps were sample line heaters (Fig. 4). The sample line heaters were set to heat only if the RH in the sample air stream exceeded 40 % and heating terminated once the RH reached 30 %. A CEM reference filter was also used automatically throughout the sample process to account for humidity effects on the sample filters (TAPI, 2012).
The pressure drop across the CEM filters was higher than the pressure drop across the Teflon filters due to difference in material. The higher-pressure drop on the CEM filters (Pierce and Gustin, 2017; TAPI, 2012) necessitated a different sample line inlet nozzle (located where the sample line enters the TAPI measurement box, Fig. 4), tested and adjusted by Teledyne before the instruments were operated. The inlet nozzle was therefore a different size (smaller in diameter) for the CEM sample line (0.75 cm diameter) compared to the Teflon sample line (1.9 cm diameter) and may have caused different flow dynamics for the CEM sample line. Constrictions in sample air flow causes gases in the sample stream to increase in velocity and focus in the center of the tube; this dynamic causes increased particle deposition (Kulkarni et al., 2011b). The different inlet nozzle sizes required a different β sample area (CEM: 4.7 cm2 β sample area, Teflon: 12 cm2 β sample area), the area of the filter used for β attenuation. The filters were supported in different filter cartridges for the CEM and Teflon filters due to the difference in β sample area. Filters were automatically loaded and unloaded, and then held in an unloader tube until collection every 1 to 2 weeks. Sample inlets were cleaned monthly, following instructions from the instrument manual, and pumps were rebuilt every 6 to 8 months.
Calibration of the operating flow rate regulation system, β source span checks, and pneumatic circuit leak tests automatically occurred at the start of each sampling period for both sample lines. There were 3 days during the sample period in October 2014 when data validation did not pass after the automatic tests were performed. These days are discussed in Sect. 4.5. On 25 days, of 158 in the sample period, there were warnings related to pump valve, span tests, leak tests, or internal cooling fan failure. These warnings cleared and the sample passed data validation for the day. Six days with warnings occurred on days with aggregates. Four days, 13, 16, 19 June, and 16 September, were pneumatic leak test warnings; two days, 18 and 23 September, were pump valve warnings. Aggregates on the June warning days occurred only on the CEM inlet, aggregates on the September warning days occurred on both inlets.
3.2 Shape, size, and elemental composition
Particles collected on the Teflon filters were analyzed at Macquarie University in Sydney, New South Wales, Australia using SEM (JEOL USA Inc. model: 6480 LA, Peabody, MA, USA) for size, shape, and elemental composition. Preliminary SEM analysis was performed with backscattered electron imaging on uncoated filter segments in low vacuum to avoid charging and breakdown of the aggregates. Elemental analysis using EDS was also performed with backscattered electron imaging in low-vacuum mode. A second SEM analysis with secondary electron imaging, using a different filter segment from the initial SEM, was performed with gold coating, to prevent charging during analysis in high vacuum. The second SEM analysis was a more in depth exploration of the morphology of the aggregates.
3.3 Fire indicators using aerosol optical properties
Aerosol optical depth (AOD, 440 nm) and Ångström Extinction Exponent (AEE, 440–870 nm) were collected from a Cimel (CE-318) sun photometer used in the AErosol RObotic NETwork, located at the University of Nevada, Reno (UNR) campus on top of a four-story building, ∼ 0.9 km northwest of UNRG and ∼ 11 km southeast of PEAV (Loría-Salazar, 2014; Loría-Salazar et al., 2017). One hour data were collected and averaged for 24 h. AOD is a measure of the columnar aerosol loading and when compared with surface PM2.5 measurements can aid in identifying periods of wildfires (Loría-Salazar et al., 2017). AEE is used as a qualitative indicator of particle size; AEE ∼ 1 is indicative of coarse mode aerosols (i.e., dust and sea salt) while AEE ≥ 2 is indicative of fine mode aerosols from biomass burning or urban pollution (Eck et al., 1999). Data with AEE >1.8 and when fine mode fraction was > 0.6 were flagged as fire periods (Loría-Salazar et al., 2016).
3.4 Meteorological data
At PEAV, RH was measured by an HMP45c model Campbell Scientific RH monitor (±0.2 ∘C and ±2 % RH), wind speed was measured by an RM Young 05305 wind vane (±0.2 m s−1). Wind speed at UNRG was collected from the Western Regional Climate Center. Wind speed at GBNP was collected from the CASTNET site. Hourly meteorological data was used for 1 h max values and 24 h averages.
3.5 Generator use
From 20 October (Monday) to 24 October (Friday), multiple diesel generators were operated at PEAV while maintenance was occurring on the power lines at the relay station. A backup power, diesel generator was also located on site and was operated periodically throughout the sample period. The backup generator was located ∼ 10 m southeast and around the corner of the relay station building from the measurement trailer. Exact timing of backup generator use is not available.
4.1 Particulate measurements
Of the 36 sample days with aggregates > 2.5 µm in aerodynamic diameter at the PEAV site, aggregates were observed on both inlets 22 days, the other 14 days, aggregates were observed on one inlet (Table 1). For all single inlet days, except for one, aggregates were observed on the CEM inlet. This may be due to the higher-pressure drop across the CEM filter and higher flow constriction causing different flow dynamics for the CEM sample line. Aggregates, when observed only on a single inlet, had visually light loading compared to other aggregate samples, only two of the 14 single inlet days exceeded the 75th percentile PM2.5 concentration (7.1 µg m−3) for the sample period and both of those days had visually high PM2.5 loading, a fire flag, and minimal aggregates. Presence of aggregates in some cases were associated with high PM2.5 concentrations, 20 of the 36 days had concentrations > 7.1 µg m−3; however, due to aerosols from fires, this was not always related to aggregate loading.
The instrument used at PEAV was located at the lower-elevation site (UNRG) with another TAPI instrument, before and after it was located at PEAV. Correlation between this instrument and the TAPI instrument located at UNRG was high before (r2 = 0.80, p < 0.05, n = 6) and after (r2 = 0.88, p < 0.05, n = 71) it was located at PEAV, indicating that the two instruments were operating similarly (Pierce and Gustin, 2017). Furthermore, no aggregates were observed when the TAPI was moved to GBNP from March to October 2015, which was also impacted by fire plumes (Pierce and Gustin, 2017).
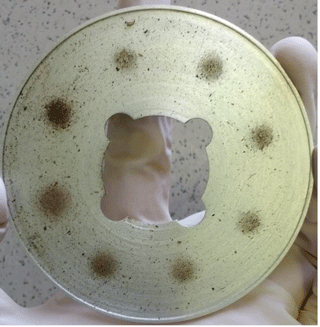
Figure 5PM10 pre-impactor plate from the CEM inlet (Line A, Fig. 4) during a routine cleaning after a high wind event.
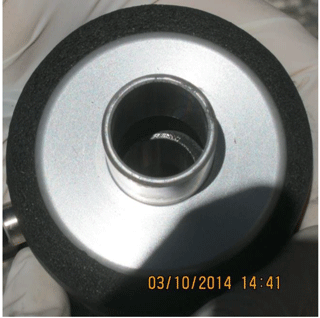
Figure 6Condensation water trap during a cleaning on 3 October 2014. Black powder was visible in the condensation water trap. The black around the outside of the trap is insulating foam.
Aggregates, black in color, occurred on filters on days when inlets were cleaned and on days before and after cleaning (Fig. 2). Black aggregates were not observed in the PM10 pre-impactor or PM2.5 cyclone inlets during routine inlet cleaning; brown dust particulates were observed (Fig. 5). During a thorough cleaning on 3 October 2014, after aggregates had been observed for multiple days in September, black particulate matter was noticed in the condensation water traps (Fig. 6). After cleaning the condensation water traps and reassembling the inlets, aggregates were again observed on multiple days in October.
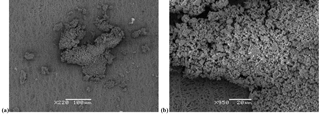
Figure 7Scanning electron microscopy (SEM) images of aggregates (gold-coated, secondary electron imaging, high vacuum) for (a) 16 September 2014 (b) higher magnification of same aggregate.
4.2 Shape, size, and elemental composition
During the second, in depth look at the aggregates using the SEM, it became apparent that the aggregates were not predominantly ”fluffy” (Fig. 3) like those observed in Chakrabarty et al. (2014) or Kearney and Pierce (2012), but more compact and did not resemble chain-aggregates (Fig. 7, Table 1). On 8 of the 12 filters analyzed on the SEM, aggregates that were fluffy could be located; however, they were outnumbered by compact aggregates such as those in Figs. 7 and 8. The fluffy aggregates observed were 10 to 20 µm in length (Fig. 3), whereas the compact aggregates observed were 10 to > 100 µm in length (Fig. 7). Furthermore, previous studies found the elemental composition of superaggregates to be mainly carbon (C) and oxygen (O, Chakrabarty et al., 2014).
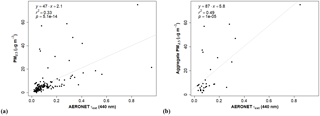
Figure 9Aerosol Optical Depth (AOD, τext) from the Cimel sun photometer located near the low-elevation site in Reno plotted against PM2.5 (µg m−3) at PEAV for (a) all data and (b) days with aggregates.
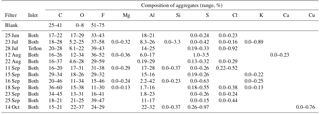
Teflon filters used in this study were 25 to 41 % C, 0 to 8 % O, and 51 to 75 % fluorine (F) identified by EDS. Filter segments with PM2.5 but no aggregates, had a range of elements including C, O, F, sodium (Na), magnesium (Mg), Al, silicon (Si), sulfur (S), chlorine (Cl), potassium (K), calcium (Ca), and iron (Fe). For these segments, F (21 to 68 %) and C (22 to 61 %) with some O (3.4 to 19 %), and small amounts of the remaining elements dominated the chemical composition. Aggregate chemical composition in comparison consisted of C, O, F, Mg, Al, Si, S, Cl, K, Ca, and copper (Cu), dominated by F (11 to 59 %), C (15 to 60 %), O (4.6 to 38 %), Al (0.19 to 42 %, and small amounts of the remaining elements (Table 3).
4.3 Fire indicators using aerosol optical properties
There was a drought in the western USA from 2012 to 2016 that contributed to dry conditions and many wildfires throughout 2014 (CA, 2017). There were ∼ 52 fires that exceeded 1 km2 of burned area in California and ∼ 63 fires that exceeded 4 km2 of burned area in Oregon and Washington in 2014. There were two large fires during the measurement campaign. The first and largest in California for 2014, the Happy Camp Complex Fire, located in northern California, ∼ 400 km northwest of PEAV, burned 543 km2 from 14 August to 31 October (CA, 2017). The King Fire burned 390 km2 in El Dorado County, California, ∼ 100 km southwest of PEAV from 13 September to 9 October 2014 (CA, 2017). Several fire plumes throughout the measurement campaign affected PEAV (Pierce et al., 2017), and aggregates occurred more frequently in September 2014 when the fire plume from the King Fire was heavily impacting the area (Fig. 2).
Aerosol Optical Depth (AOD, at 440 nm), a measure of the columnar aerosol loading, was positively correlated with PM2.5 at PEAV for all data (r2 = 0.33, p < 0.05, Fig. 9a) and higher if only days with aggregates were used (r2 = 0.49, p < 0.05, Fig. 9b). If aggregate days were removed, the correlation increased to 0.58. The positive correlation for AOD and PM2.5 for aggregates days was influenced by one point with AOD > 0.8 (highest AOD observed for the entire sample period) that occurred on 18 September, when smoke from the King Fire was heavily influencing the sites (Fig. 9b). When this point is removed the correlation decreases to 0.36.
AEE was used here as a general indicator of particle size to identify biomass burning in the region. For 31 aggregate days with AEE available, 24 days occur during days with fires. Of 158 days during the sample period with data from the Cimel, 120 days had fire flags. There was no correlation between AEE and all PM2.5 nor between AEE and PM2.5 on days with aggregates.
4.4 Meteorological data
Ambient RH was measured at PEAV, as well as inside the instrument box of the TAPI during sample collection and sample analysis with β attenuation. Same day, 24 h RH was not correlated with PM2.5 for all data or days with aggregates for any of the RH measurements (outside RH, internal TAPI RH during sample collection, and internal TAPI RH during sample analysis). The in-line heaters did not turn on during this time, as RH during sampling did not exceed 40 %. RH also did not exceed 40 % during sample analysis with β attenuation. It is possible that if RH was causing hygroscopic growth of particles, consequently creating larger particles, the effect was lagged and same day RH would therefore not be an effective measure. However, lagging the RH by 1, 2, and 5 days did not improve the correlation with aggregate days.
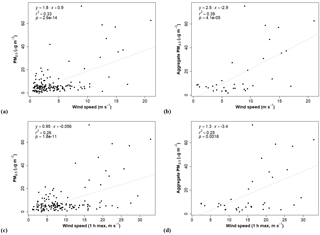
Higher wind speeds were observed at PEAV (median: 2.5 m s−1, range: 0.0 to 36 m s−1) relative to UNRG (median: 1.4 m s−1, range: 0.0 to 9.6 m s−1). PEAV also had higher wind speeds than GBNP (median: 2.4 m s−1, range: 0.0 to 13 m s−1) where the TAPI was later located during the fire season of 2015 with no aggregates observed. Wind speed was weakly, positively correlated with PM2.5 for all data (r2 = 0.33, p value < 0.05, n = 152, Fig. 10a). This correlation increased only slightly when only days with aggregates were used in the analyses (r2 = 0.39, p values < 0.05, n = 36, Fig. 10b). Maximum (max) 1 h wind speed was also only weakly correlated with PM2.5 (r2 = 0.26, p value < 0.05, Fig. 10c) for all data and analyses using only days with aggregates (r2 = 0.25, p value < 0.05, Fig. 10d).
There were 49 days out of 155 at PEAV with wind speed measurements, when wind speed exceeded 10 m s−1 for at least one hour of the day. Twenty-seven out of 36 days with aggregates occurred on days with hourly wind speeds > 10 m s−1, and 33 out of 36 days with aggregates occurred on days with wind speeds > 5 m s−1. Of the nine days with observed aggregates that did not occur on high wind days, seven had aggregates only on one inlet, which always had light loading. On the 13 aggregate days labeled as medium or heavy loading (Table 1), wind speeds exceeded 20 m s−1 for at least one hour of the day or wind speeds exceeded 10 m s−1 for 10 h or longer leading up to or during that day. Five days with high wind speed occurred during the week of generator use (20 to 24 October), and it is unclear if aggregates were present due to the high loading on these filters. Of the remaining 17 days with high wind speeds, 12 days occurred either before or after an aggregate day or had only one hour of the day that exceeded 10 m s−1.
4.5 Generator use
From 20 October (Monday) to 24 October (Friday), multiple generators were operated at PEAV. On 22 to 24 October, the data from the TAPI located at PEAV did not pass data validation due to two errors related to flow rate and pump valve. Heavy loading observed on the filters (Fig. 11a) caused the TAPI to be unable to sample through these filters for the full sample period. Collection of heavily loaded filters terminated once the generators were turned off (Fig. 11b), indicating that particulates produced by the generators did not remain in the sample lines. A backup power generator was located on site and was operated periodically throughout the sample period. We do not have exact timing for generator use but most likely, the generator would have been operated on weekdays when maintenance was performed except during unexpected power outages. The authors are not aware of any unexpected power losses that occurred during the sample period. Aggregates occurred on weekends five times (both inlets 3 days and on one inlet 2 days).
Potential causes of the particles > 2.5 µm in aerodynamic diameter investigated here include presence of fires, high RH potentially causing hygroscopic growth of particulates in the sample stream, high wind events causing degradation of the Al tubing, and exhaust from generators operated on site. The large number of fires in the western USA, the days with fire flags (120 days out of 158 with data available) throughout the measurement campaign, and the increase in aggregates during September 2014 when the fire plume from the King Fire was heavily impacting the area (Fig. 2) seemed to support superaggregates generated by high-intensity fires. The moderate correlation between AOD and PM2.5 (r2 = 0.33 for all data and r2 = 0.49 for aggregate days, Fig. 9) indicated that high aerosol loading in the atmospheric column may influence the occurrence of aggregates. If aggregate days were removed, however, the correlation increased to 0.58. The removal of the one point with AOD > 0.8 decreased the correlation for aggregate days to 0.36. AEE, used here as a general indicator of particle size to identify biomass burning in the region (Fig. 10), demonstrated that many days with fires occurred with no aggregates. Based on findings in Loría-Salazar et al. (2017), we would expect PM2.5 and AOD to be positively correlated in certain conditions (unstable conditions in a well-mixed boundary layer and during wildfires). Given the high frequency of fires, if the aggregates were generated and transported in fire plumes, we would expect the correlation with AOD and with AEE to be higher.
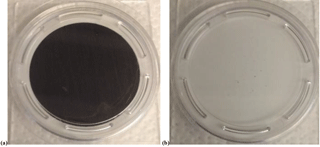
Figure 11Teflon filters from (a) 21 October 2014 during multiple generators running at PEAV and (b) 25 October 2014 the day after multiple generators were running at PEAV.
It is possible that high RH could promote hygroscopic growth of aerosols in ambient air or in the sample stream. Absorbing water can cause changes in size, morphology, chemical composition, and reactivity of particles leading to larger particles or possible aggregation in the sample line (Lee et al., 2008). Hygroscopic growth factors (diameter of a particle at a certain RH/dry diameter) are estimated for ammonium sulfate, ammonium nitrate, and sea salt aerosols, for use in the national network, IMPROVE light extinction algorithm (Pitchford et al., 2007). Pure ammonium sulfate crystallizes at 37 % RH, and it is assumed no hygroscopic growth occurs below 37 % RH, based on the efflorescence or hysteresis branch of the ammonium sulfate growth curve (Pitchford et al., 2007; Clegg et al., 1998). Sea salt aerosols are assumed to have no hygroscopic growth below 47 % RH and ambient organic mass particulates are assumed to have limited to no hygroscopic growth (Pitchford et al., 2007).
Table 2Days at PEAV in 2014 with visible aggregates on filters, the inlet with aggregates (CEM – cation exchange membranes, Teflon filters, or both inlets), and the elemental composition of sections of Teflon with particulate matter, but no aggregates.

Table 3Days at PEAV in 2014 with visible aggregates on filters, the inlet with aggregates (CEM – cation exchange membranes, Teflon filters, or both inlets), and the elemental composition of sections of Teflon with visible aggregates.
The western USA generally has higher ambient organic carbonaceous mass particulates, lower mass concentration of inorganic species known to impact hygroscopic growth (sulfates and nitrates), and strong seasonal fluctuations in boundary layer RH compared to the eastern USA (Nguyen et al., 2016; Buseck and Schwartz, 2003; Malm et al., 2011, 2004; Malm and Sisler, 2000). Wintertime buildup of particulate nitrate has been observed in western USA valleys (Green et al., 2015), but PEAV would likely not be affected by this buildup due to elevation and sample period. Furthermore, Loría-Salazar et al. (2017) found no correlation between AOD measurements and RH in the boundary layer in Reno, NV for a yearlong sample period in 2013. Outside RH did at times exceed 37 % during the sample period; however, internal TAPI RH measurements indicated that the RH in the sample stream did not exceed 37 %. Due to the higher ambient organic mass particulates in the western USA, the elemental composition of the aggregates, and RH < 37 % in the sample line, it does not seem likely that hygroscopic growth was the cause of the aggregates.
High wind speeds may have caused sections of the anodized Al inlet tubing to twist and rub together, a process that can lead to fretting corrosion (Davis, 1999; Waterhouse, 1992). Fretting is defined as small-amplitude movement that can occur between contacting surfaces, usually due to external vibration (Waterhouse, 1992). Fretting corrosion arises when dry oxidation during rubbing occurs, producing a black powder of aluminum oxide, more likely to occur when aluminum contacts aluminum (Davis, 1999). Aluminum tubing was in contact with another surface in four places: where the sample tubes connected to the base of the PM2.5 cyclones, before and after the water condensation water traps, and where the sample tubes entered the TAPI measurement box (marked in red, Fig. 4). On several occasions during site visits, it was noticed that the PM10 and PM2.5 inlets were in different positions from the last site visit, indicating that high wind speeds had caused the inlets to rotate on the sample tubes. The observation of a black powder in the condensation water traps (Fig. 6) and not in the PM10 pre-impactor (Fig. 5) or PM2.5 cyclone supports the generation of aggregates in the sample line after the inlets and before the condensation water traps. The increase of Al and O in the aggregate samples indicated that the anodized coating on the sample lines was possibly undergoing fretting corrosion. Anodized Al coatings are ∼ 80 % Al oxide, ∼ 18 % Al sulfate, and ∼ 2 % water.
Samples collected from 20 October (Monday) to 24 October (Friday), when multiple generators were running at PEAV indicate that aggregates may have been caused by generator exhaust, due to the similarity of the filter at the end of the period to other aggregate filters. Smits et al. (2012) measured generator exhaust emissions at different loadings for a small-scale generator using a low-sulfur fuel. Diesel generators emit nitrogen oxides (NOx), volatile organic compounds (VOCs), carbon monoxide (CO), and PM (Smits et al., 2012). Elements found in the generator exhaust included K, Ca, titanium (Ti), strontium (Sr), chromium (Cr), Fe, nickel (Ni), manganese (Mn), Cu, zinc (Zn), Pb, S, and Cl. Elements that were not detected included Si, vanadium (V), selenium (Se), cadmium (Cd), antimony (Sb), and Al. SEM images from Smits et al. (cf. Fig. 4 of Smits et al., 2012) look similar to the SEM images collected in the current study, however, the absence of Al in Smits et al. (2012) differs from our findings (Tables 2 and 3). Aluminum was assumed to be a tracer for environmental atmospheric samples in Smits et al. (2012); filters with ambient PM2.5 from PEAV are consistent with this assumption with small amounts of Al (Table 2). Aggregate samples however had much higher Al (Table 3), indicating these samples were not background environmental PM2.5. Aluminum is not a common additive to diesel fuel or lubricating oil. The fact that aggregates were observed on weekends, when it is unlikely that maintenance was occurring, and the large percentage of Al in the composition indicated that generator exhaust was likely not the cause of the aggregates.
During the sampling campaign at PEAV from June to November 2014, the presence of fires and fire indicators, high RH, high wind speeds, and use of generators on site were investigated to understand the presence of ambient particles that exceeded 2.5 µm in aerodynamic diameter on 36 measurement days. Particles > 2.5 µm in aerodynamic diameter were not observed on samples from the same days at the lower-elevation site, from the TAPI before and after it was deployed at PEAV, nor when it was moved to another high-elevation site, GBNP, impacted by fires in 2015. RH and AEE were not correlated with the presence of aggregates, indicating RH and indicators of fire were not associated with aggregate formation. The presence of aerosols in the column (AOD) was correlated with PM2.5, however, the positive correlation was heavily influenced by one data point and AOD did not fully explain the presence of aggregates. Linear regression may not be adequate to identify the cause due to mass concentration of the filters being a combination of PM2.5 and aggregate mass. Generator use at the site could be the source of the aggregates and would be an interesting area of further research if particulates from the exhaust were able to deposit past the PM10 pre-impactor and PM2.5 cyclones, however chemical composition did not support generator exhaust as the source of aggregates.
High concentrations of Al and O observed in the EDS elemental analysis suggested that the anodized Al sample tube coating contributed aggregates to the samples. Fretting corrosion, occurring where two sections of Al tubing were rubbing together, caused by prolonged, high wind events at PEAV seems to be the most likely explanation of the observed aggregates. Aluminum tubing was in contact with another surface in four places: the base of the PM10 pre-impactor, before and after the condensation water trap, and where the sample tubes enter the TAPI measurement box (marked in red in Fig. 4). The observation of black aggregates in the condensation water traps (Fig. 6) but not on the PM10 pre-impactor plates (Fig. 5) or in the PM2.5 cyclones also supports fretting corrosion occurring in the sample line downstream of the PM10 pre-impactor plates and the PM2.5 cyclones. More experiments to test this theory are needed to understand the specific conditions promoting fretting corrosion.
In other particulate monitors, such as the Beta Attenuation Monitor (BAM-1020), used in regulatory networks, filter tape is automatically advanced, without post-processing. The BAM uses a similar inlet setup to the TAPI. At sites with high wind speeds, if there are sections of Al tubing susceptible to fretting corrosion, a similar situation could occur and go unnoticed and potentially impact measured PM2.5 concentrations. The observations presented suggest inlet configuration is important to consider for sites with high wind events.
Data can be made available upon request.
The authors declare that they have no conflict of interest.
We acknowledge the Nevada Division of Environmental Protection (NDEP), the
UNR College of Biotechnology and Natural Resources, and a USDA-HATCH grant
(NIFA Accession# NEV05295) for supporting this project. We would like to
acknowledge help from Sue Lindsey and Katrina Macsween at
Macquarie University in Sydney, New South Wales, Australia for assistance
with and use of the scanning electron microscope. Thank you to Dave Metts of
High Sierra Communications for allowing access to and support at the Peavine
Peak site. Thank you to Kristien King for assistance with data
processing.
Edited by: Pierre
Herckes
Reviewed by: two anonymous referees
Buseck, P. R. and Schwartz, S. E.: 4.04 – Tropospheric aerosols, in: Treatise on Geochemistry, edited by: Holland, H. D. and Turekian, K. K., Pergamon, Oxford, 91–142, 2003.
CA (2014 Large Fires List): available at: http://cdfdata.fire.ca.gov/incidents/incidents_statsevents\#2014 (last access: October 2017), 2017.
Chakrabarty, R. K., Beres, N. D., Moosmuller, H., China, S., Mazzoleni, C., Dubey, M. K., Liu, L., and Mishchenko, M. I.: Soot superaggregates from flaming wildfires and their direct radiative forcing, Sci. Rep.-UK, 4, 5508, https://doi.org/10.1038/srep05508, 2014.
Clegg, S. L., Brimblecombe, P., and Wexler, A. S.: Thermodynamic model of the system H+----H2O at tropospheric temperatures, J. Phys. Chem.-US, 102, 2137–2154, https://doi.org/10.1021/jp973042r, 1998.
Davis, J. R.: Corrosion of Aluminum and Aluminum Alloys, A S M International, Materials Park, OH, USA, 1999.
Eck, T. F., Holben, B. N., Reid, J. S., Dubovik, O., Smirnov, A., O'Neill, N. T., Slutsker, I., and Kinne, S.: Wavelength dependence of the optical depth of biomass burning, urban, and desert dust aerosols, J. Geophys. Res., 104, 31333–31349, https://doi.org/10.1029/1999JD900923, 1999.
Green, M. C., Chow, J. C., Watson, J. G., Dick, K., and Inouye, D.: Effects of snow cover and atmospheric stability on winter PM2.5 concentrations in western U.S. valleys, J. Appl. Meteorol. Clim., 54, 1191–1201, https://doi.org/10.1175/JAMC-D-14-0191.1, 2015.
Kearney, S. P. and Pierce, F.: Evidence of soot superaggregates in a turbulent pool fire, Combust. Flame, 159, 3191–3198, https://doi.org/10.1016/j.combustflame.2012.04.011, 2012.
Kulkarni, P., Baron, P. A., Sorenson, C. M., and Harper, M.: Nonspherical particle measurement: shape factor, fractals, and fibers, in: Aerosol Measurement, John Wiley & Sons, Inc., Hoboken, NJ, USA, 507–547, 2011a.
Kulkarni, P., Baron, P. A., and Willeke, K.: Fundamentals of single particle transport, in: Aerosol Measurement, John Wiley & Sons, Inc., Hoboken, NJ, USA, 15–30, 2011b.
Lee, A. K. Y., Ling, T. Y., and Chan, C. K.: Understanding hygroscopic growth and phase transformation of aerosols using single particle Raman spectroscopy in an electrodynamic balance, Faraday Discuss., 137, 245–263, https://doi.org/10.1039/B704580H, 2008.
Loría-Salazar, S. M., Arnott, W. P., and Moosmüller, H.: Accuracy of near-surface aerosol extinction determined from columnar aerosol optical depth measurements in Reno, NV, USA, J. Geophys. Res.-Atmos., 119, 11355–11374, https://doi.org/10.1002/2014JD022138, 2014.
Loría-Salazar, S. M., Holmes, H. A., Arnott, W. P., Barnard, J. C., and Moosmüller, H.: Evaluation of MODIS columnar aerosol retrievals using AERONET in semi-arid Nevada and California, U.S.A., during the summer of 2012, Atmos. Environ., 144, 345–360, https://doi.org/10.1016/j.atmosenv.2016.08.070, 2016.
Loría-Salazar, S. M., Panorska, A., Arnott, W. P., Barnard, J. C., Boehmler, J. A. M., and Holmes, H. A.: Toward understanding atmospheric physics impacting the relationship between columnar aerosol optical depth and near-surface PM2.5 mass concentrations in Nevada and California, U.S.A., during 2013, Atmos. Environ., 171, 289–300, https://doi.org/10.1016/j.atmosenv.2017.10.023, 2017.
Malm, W. C. and Sisler, J. F.: Spatial patterns of major aerosol species and selected heavy metals in the United States, Fuel Process. Technol., 65–66, 473–501, https://doi.org/10.1016/S0378-3820(99)00111-3, 2000.
Malm, W. C., Schichtel, B. A., Pitchford, M. L., Ashbaugh, L. L., and Eldred, R. A.: Spatial and monthly trends in speciated fine particle concentration in the United States, J. Geophys. Res.-Atmos., 109, D03306, https://doi.org/10.1029/2003JD003739, 2004.
Malm, W. C., Schichtel, B. A., and Pitchford, M. L.: Uncertainties in PM2.5 gravimetric and speciation measurements and what we can learn from them, J. Air Waste Manage., 61, 1131–1149, 2011.
Nguyen, T. K. V., Ghate, V. P., and Carlton, A. G.: Reconciling satellite aerosol optical thickness and surface fine particle mass through aerosol liquid water, Geophys. Res. Lett., 43, 11903–11912, https://doi.org/10.1002/2016GL070994, 2016.
Pierce, A. M. and Gustin, M. S.: Development of a particulate mass measurement system for quantification of ambient reactive mercury, Environ. Sci. Technol., 51, 436–445, https://doi.org/10.1021/acs.est.6b04707, 2016.
Pierce, A. M., Gustin, M. S., Christensen, J. N., and Loría-Salazar, S. M.: Use of multiple tools including lead isotopes to decipher sources of ozone and reactive mercury to urban and rural locations in Nevada, USA, Sci. Total Environ., 615, 1411–1427, https://doi.org/10.1016/j.scitotenv.2017.08.284, 2017.
Pitchford, M., Maim, W., Schichtel, B., Kumar, N., Lowenthal, D., and Hand, J.: Revised algorithm for estimating light extinction from IMPROVE particle speciation data, J. Air Waste Manage., 57, 1326–1336, 2007.
Smits, M., Vanpachtenbeke, F., Horemans, B., De Wael, K., Hauchecorne, B., Van Langenhove, H., Demeestere, K., and Lenaerts, S.: Effect of operating and sampling conditions on the exhaust gas composition of small-scale power generators, PLOS ONE, 7, e32825, https://doi.org/10.1371/journal.pone.0032825, 2012.
Sohirripa Spagnolo, G.: Automatic instrument for aerosol samples using the beta-particle attenuation, J. Aerosol Sci., 18, 899–902, https://doi.org/10.1016/0021-8502(87)90151-0, 1987.
TAPI: Operation Manula: Model 602 BETA PLUS particle measurement system, Teledyne Advanced Pollution Instrumentation, San Diego, CA, 2012.
Wang, Y., Liu, F., He, C., Bi, L., Cheng, T., Wang, Z., Zhang, H., Zhang, X., Shi, Z., and Li, W.: Fractal dimensions and mixing structures of soot particles during atmospheric processing, Environ. Sci. Tech. Lett., 4, 487–493, https://doi.org/10.1021/acs.estlett.7b00418, 2017.
Waterhouse, R. B.: Fretting fatigue, Int. Mater. Rev., 37, 77–98, https://doi.org/10.1179/imr.1992.37.1.77, 1992.


