the Creative Commons Attribution 4.0 License.
the Creative Commons Attribution 4.0 License.
 | 06 Jul 2018
Characterization of steady-state fluorescence properties of polystyrene latex spheres using off- and online spectroscopic methods
Nicole J. Savage
J. Alex Huffman
Fluorescent dyed polystyrene latex spheres (PSLs) are commonly used for characterization and calibration of instruments detecting fluorescence signals from particles suspended in the air and other fluids. Instruments like the Ultraviolet Aerodynamic Particle Sizer (UV-APS) and the Waveband Integrated Bioaerosol Sensor (WIBS) are widely used for bioaerosol research, but these instruments present significant technical and physical challenges requiring careful characterization with standard particles. Many other research communities use flow cytometry and other instruments that interrogate fluorescence from individual particles, and these also frequently rely on fluorescent PSLs as standards. Nevertheless, information about physical properties of commercially available PSLs provided by each manufacturer is generally proprietary and rarely available, making their use in fluorescence validation and calibration very difficult.
This technical note presents an overview of steady-state fluorescence properties of fluorescent and non-fluorescent PSLs, as well as of polystyrene-divinylbenzene (PS-DVB) particles, by using on- and offline spectroscopic techniques. We show that the “fluorescence landscape” of PSLs is more complex than the information typically provided by manufacturers may imply, especially revealing multimodal emission patterns. Furthermore, non-fluorescent PSLs also exhibit defined patterns of fluorescent emission originating from a mixture of polystyrene and detergents, which becomes a crucial point for fluorescence threshold calibrations and qualitative comparison between instruments. By comparing PSLs of different sizes, but doped with the same dye, changes in emission spectra from bulk solutions are not immediately obvious. On a single-particle scale, however, fluorescence intensity values increase with increasing particle size. No significant effect in the fluorescence signatures was detectable by comparing PSLs in dry vs. wet states, indicating that solvent water may only play a minor role as a fluorescence quencher.
Because information provided by manufacturers of commercially available PSLs is generally very limited, we provide the steady-state excitation–emission matrices (EEMs) of PSLs as open-access data within the Supplement. Detergent and solvent effects are also discussed in order to provide information not available elsewhere to researchers in the bioaerosol and other research communities. These data are not meant to serve as a fundamental library of PSL properties because of the variability of fluorescent properties between batches and as a function of particle aging and agglomeration. The data presented, however, provide a summary of spectral features which are consistent across these widely used fluorescent standards. Using these concepts, further checks will likely be required by individual researchers using specific lots of standards.
- Article
(7773 KB) - Full-text XML
-
Supplement
(93363 KB) - BibTeX
- EndNote


Commercially available microspheres are widely used as tools in numerous scientific research disciplines (e.g., DNA hybridization probes, as tracers for blood flow and neuronal pathways), diagnostics (e.g., immunoassays), and size calibrations (e.g., flow cytometry and microscope calibration) (e.g., Härmä et al., 2000; Hiesinger et al., 2001; Katz and Iarovici, 1990; Luchtel et al., 1998; Schwartz et al., 1998; Spiro et al., 2000). Fluorescent polystyrene latex spheres (PSLs) play a particularly important role in the characterization and calibration of instruments that rely on particle autofluorescence (also called intrinsic fluorescence) detection. For example, PSLs are commonly used for testing and calibration of instruments such as flow cytometers and light-induced fluorescent (LIF) instruments (e.g., Hasegawa, 2013; Healy et al., 2012; Jung et al., 2012; Kanaani et al., 2008; Robinson et al., 2017; Toprak and Schnaiter, 2013).
LIF techniques can be utilized for rapid characterization of bioaerosols, also referred to as primary biological aerosol particles (PBAP). As a result, a number of real-time and commercial instruments including the Ultraviolet Aerodynamic Particle Sizer (UV-APS; TSI Inc., Shoreview, MN, USA) and the Waveband Integrated Bioaerosol Sensor (WIBS; Droplet Measurement Technologies, Longmont, CO, USA) are being commonly used in bioaerosol research communities (e.g., Agranovski et al., 2003; Bhangar et al., 2014; Brosseau et al., 2000; Foot et al., 2008; Huffman et al., 2010; Perring et al., 2015; Stanley et al., 2011; Toprak and Schnaiter, 2013). The main principle common to these techniques is the detection of intrinsic fluorescence from fluorophores such as amino acids, coenzymes, vitamins, and pigments that ubiquitously occur in aerosols of biological origin (e.g., Hill et al., 2009; Li et al., 1991; Pan et al., 2010; Pöhlker et al., 2012, 2013). These PBAP represent a diverse and dynamic subset of airborne particles, consisting of whole organisms like bacteria, viruses, archaea, algae, fungi, and related reproductive units (e.g., pollen, bacterial and fungal spores), as well as decaying biomass and fragments from plants or insects (e.g., Deepak and Vali, 1991; Després et al., 2012; Jaenicke, 2005; Madelin, 1994; Pöschl, 2005). They are ubiquitous in the Earth's atmosphere, where they affect many environmental mechanisms and, therefore, represent an important link between ecosystem activities and atmospheric processes (e.g., Andreae and Crutzen, 1997; Després et al., 2012; Fröhlich-Nowoisky et al., 2016; Fuzzi et al., 2006; Huffman et al., 2013; Möhler et al., 2007; Morris et al., 2014).
Because commercially available fluorescent PSLs are so critical to the underlying operation of many instruments, their use forms indispensable and often unseen foundations onto which much of the UV-LIF instrumentation and literature are built. The information content provided by each PSL manufacturer about fluorescent properties, composition, and potential additives is limited, making their use in fluorescence validation and calibration of LIF techniques difficult. In order to provide a solid foundation for the use and inter-comparison of instrumentation that relies on commercial fluorescent PSLs, we performed measurements on fluorescent and non-fluorescent PSLs using both on- and offline spectroscopic techniques. Here we present a thorough characterization of the steady-state fluorescence properties of commercially available PSLs that cover a fluorescence emission range spanning UV (ultraviolet), vis (visible light), and near-IR (infrared) wavelengths. Information about the fluorescent molecules used to dope commercial PSLs is typically proprietary and not publically accessible. As a result, steady-state excitation–emission matrices (EEMs) of PSLs are not published by the manufacturer and can take even well-equipped researchers significant time to investigate individually. We therefore provide fluorescence spectra of PSLs varied by fluorescent dye, manufacturer, and particle size as open-access data, revealing a more complete picture of the “fluorescence landscape” of PSLs as tools, which bioaerosol and other research communities may utilize.
Since the size dependence of fluorescence intensity on single-particle scale is crucially important for LIF-based PBAP detection (Hill et al., 2015; Sivaprakasam et al., 2011; Swanson and Huffman, 2018), we further address selected aspects of the PSL size–intensity relationship. However, it is important to note that a comparison of fluorescence intensities from different instruments (e.g., offline spectroscopy and microscopy as well as online WIBS-4A measurements) is not trivial, as it depends on the properties of the fluorescent particles, on one hand, and on the optical design and detector settings of the instruments, on the other hand. Therefore, we discuss certain intensity-related aspects here semi-quantitatively, whereas an in-depth analysis of single-particle fluorescence intensities is beyond the scope of this work.
In this study, PSLs have been prepared in different ways (e.g., directly from the vendor bottle and washed with ultrapure water) to analyze and explain polystyrene-specific fluorescence patterns and effects from additives (e.g., detergents). Furthermore, because PSLs are usually stored in aqueous suspension, we compared measurements in both dry and wet states to distinguish the effect of water as a fluorescence quencher. These results will provide researchers fundamental information regarding fluorescent PSLs as key calibrant particles on which they can base their instrument operation, thus enabling results based on a more coherent set of fluorescent properties.
Table 1Polystyrene latex spheres (PSLs) and polystyrene-divinylbenzene particles (PS-DVB) used in this study. Excitation wavelength (λex) and emission wavelength (λem) are peak values reported by the manufacturer. FS is fluorescence spectroscopy and FM is fluorescence microscopy. As a conventional expression (e.g., Hill et al., 2009, Pöhlker et al., 2012, Thermo Scientific Particle Technology-Product Catalog and Technical Reference Guide printing CT6000.1_1/119), we use a backslash to separate excitation and emission wavelengths (λex ∕ λem, not to be confused with “divided by”).
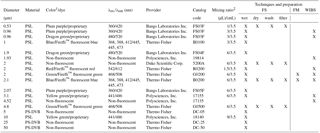
1 Color terminology taken from manufacturer information. 2 The mixing ratio describes the amount of PSL stock solution (µL) diluted in ultrapure water (mL).
A list of acronyms and abbreviations used in this study can be found in Appendix A. A summary of the sizes, properties, and commercial sources of all PSLs used in this study can be found in Table 1. Furthermore, Table 1 specifies which of the subsequently outlined measurements have been conducted for the individual PSL samples. PSLs from the following four manufacturers were used in this study, with relevant product information of the manufacturer's websites:
-
Thermo Fisher (Waltham, MA, USA, https://www.thermofisher.com/de/de/home/life-science/cell-analysis/qdots-microspheres-nanospheres/fluorescent-microspheres.html, last access: 31 October 2017);
-
Bangs Laboratories Inc. (Fishers, IN, USA, http://www.bangslabs.com/products/fluorescent-microspheres, last access: 31 October 2017), referring specifically to the TechNotes provided on the website, which summarize helpful peripheral information;
-
Polysciences Inc. (Warrington, PA, USA, http://www.polysciences.com/default/catalog-products/microspheres-particles/polymer-microspheres/fluoresbrite-sup-r-sup-fluorescent-microspheres, last access: 31 October 2017);
-
Duke Scientific Corp. (Palo Alto, CA, USA), whose PSLs are now licensed by Thermo Fisher Particle Technology group.
In addition to PSLs, polystyrene-divinylbenzene (PS-DVB) particles were also used in this study. The main chemical difference between PS-DVB particles and PSLs is the polystyrene-divinylbenzene crosslinks to the styrene monomer, which polystyrene does not include. To our knowledge, all fluorescent PSLs used here were internally labeled via the “dye diffusion and entrapment” procedure (for details see Bangs Laboratories website). Accordingly, the fluorophores are distributed homogenously within the particles and are not covalently bound to the outside surface of polymer matrix. This implies that the majority of fluorophores incorporated into the polymeric particles are not in contact with the water in aqueous PSL suspensions, reducing solvatochromism influences (e.g., polarity of the solvent), which can result in shifts in absorption and emission spectra (Pellach et al., 2012).
2.1 Fluorescence spectroscopy on PSLs in aqueous suspension
The EEMs of the PSL samples were recorded by using a LS-45 Luminescence Spectrometer (Perkin Elmer, Inc.; Waltham, MA, USA) and the software FL WinLab (Perkin Elmer, Inc.). Spectra were recorded at a photomultiplier tube (PMT) voltage of 650 V and an emission scan speed of 1500 nm min−1. Excitation wavelengths λex= 200–650 nm (5 nm increments) and emission wavelengths λem= 200–800 nm (0.5 nm increments) were used for the recording of EEMs. Data were analyzed using Igor Pro (Wavemetrics, Lake Oswego, OR, USA). Due to a subsequently detected, wavelength-dependent spectral shift within the near-IR emission range of the LS-45 Luminescence Spectrometer, 2.0 µm red PSLs were measured with a Dual-FL Fluorescence Spectrometer (HORIBA Instruments Inc., Kyoto, Japan) and the software Aqualog V3.6 (HORIBA Instruments Inc.). Emissions derived from other fluorescent PSLs are not affected by this artifact. The Dual-FL Fluorescence Spectrometer uses a CCD as the emission detector. The EEM of red PSLs was measured at excitation wavelengths between λex= 240 and 650 nm (1 nm increments), an emission range between λem= 250 and 700 nm (0.58 nm increments) at a low detector gain setting (2.25 e− per count) and a exposure time of 2 s. Data were also analyzed using Igor Pro. It is important to note that fluorescence intensity values of red PSLs measured with the Dual-FL cannot be directly associated to fluorescence intensities of PSLs measured with the LS-45 due to different instrument properties and settings. Further details on the fluorescence spectroscopy (FS) measurements and analysis can be found in Pöhlker et al. (2012).
Before preparing an aliquot, each PSL solution was vortexed for 30 s to break up possible agglomerates. The PSL solutions were diluted in 3.5 mL ultrapure water (MilliQ, 18 MΩ) with a pH of 7 in a 10 × 10 × 40 mm UV quartz cuvette (Hellma Analytics, Müllheim, Germany) (see Table 1). To avoid sedimentation of PSLs in the cuvette during the measurements, a magnetic stirrer was used to constantly stir the sample. Measurements were taken directly after sample preparation. The background signal (ultrapure water) was measured under the same conditions and subtracted from each sample. This procedure is called “wet preparation” throughout the paper.
The aqueous mass mixing ratio (mass PSL in mass water) of PSL particles in the stock suspensions is stated by the manufacturer as ∼ 1 % (see corresponding information from manufacturer websites). Accordingly, for PSLs of different sizes, the number concentration of suspended PSL particles decreases steeply with increasing diameter (N ∼ 1/d3 based on the relationship between diameter and volume of an individual spherical particle). For the FS measurements, diluted PSL suspensions were used to avoid self-quenching of fluorescence and inner-filtration effects (Sinski and Exner, 2007). However, it is important to note that highly diluted suspensions reduce the signal strength and counting statistics. Table 1 specifies the adjusted mixing ratios (volume of PSL stock suspension in volume of ultrapure water) for the individual PSL samples. Larger quantities (6 and 9 µL) of the PSL stock suspension were used for particles with larger diameters (≥ 1.9 µm) to partially compensate for decreasing PSL particle number concentrations. Because of the higher sensitivity of the Dual-FL in comparison to the LS-45, only 1.5 µL of red PSL stock solution was diluted into 3.5 mL ultrapure water. Otherwise, red PSLs were prepared identically to other PSLs measurements in aqueous solutions as stated in this paragraph. Note that independent of the size vs. number concentration relationship, some uncertainty remains regarding the PSL mixing ratio since agglomeration could occur upon aging of the suspensions.
2.2 Fluorescence spectroscopy on PSLs in dry state
In addition to the FS analysis of suspended PSL samples, dry PSLs were analyzed using a front surface accessory (Perkin Elmer, Inc.). The PS-DVB particles, which were purchased in a dry state, were measured by placing the sample directly onto a synthetic fused silica window inside the surface holder in a quantity such that the plane was fully covered. As described by Pöhlker et al. (2012), fluorescent emissions from weakly fluorescent solids are qualitatively superimposed by light leakage and/or absorption effects contributing to high background signals. We therefore normalized each fluorescence matrix by the intensity of light leakage (normalization factor, NF) to make fluorescence intensities comparable along all solid samples without altering or losing actual fluorescence features. Each solid sample matrix was divided by this NF. For further details regarding this normalization method, we refer to Pöhlker et al. (2012).
PSL samples in dried state were analyzed by comparison with aqueous PSL suspensions to investigate the influence of water as a potential fluorescence quencher (Lakowicz, 1999). Here, several drops of PSL stock suspensions were dried by placing them directly onto the synthetic fused silica window of the front surface accessory. In this state, the silica window was placed inside a clean laboratory fume hood underneath an empty petri dish to prevent the sample from being contaminated with airborne particles that could exhibit fluorescence. After the water evaporated from the droplets, the procedure was repeated by adding additional droplets until the surface was completely covered with a solid PSL layer, which was then used for FS analysis. This procedure is called “dry preparation” throughout the paper.
2.3 Additional measurements and PSL preparation
PSLs purchased in aqueous suspension are mixed by the manufacturer with additives such as detergents for the prevention of agglomeration. To determine the contribution these additives make to resulting fluorescence emission, PSLs were prepared in multiple ways as described in the following paragraphs.
To remove PSL additives from the aqueous phase, small volumes of PSL stock suspensions (see Table 1) were diluted into 1.5 mL ultrapure water and centrifuged for 5 min at 5.0 relative centrifugal force. The aqueous supernatant was discarded and the solid PSL pellet was resuspended in 1.5 mL ultrapure water. The procedure was repeated three times for thorough cleaning, though the last resuspension was performed in 3.5 mL ultrapure water. The resulting suspensions of washed PSLs were analyzed by FS as outlined in Sect. 2.1. This procedure is called “washed preparation” throughout the paper.
FS was also performed on filtered PSL suspensions, i.e., in the absence of solid PSL material. PSL stock suspensions were diluted into 3.5 mL ultrapure water and forced through a syringe filter with a pore size of 200 nm (Macherey-Nagel, Chromafil PET-20/15 MS) to filter out PSLs and other solid fragments. The particle-free aqueous phase was measured in the absence of PSLs for soluble additives and/or detergents. This procedure is called “filtered preparation” throughout the paper.
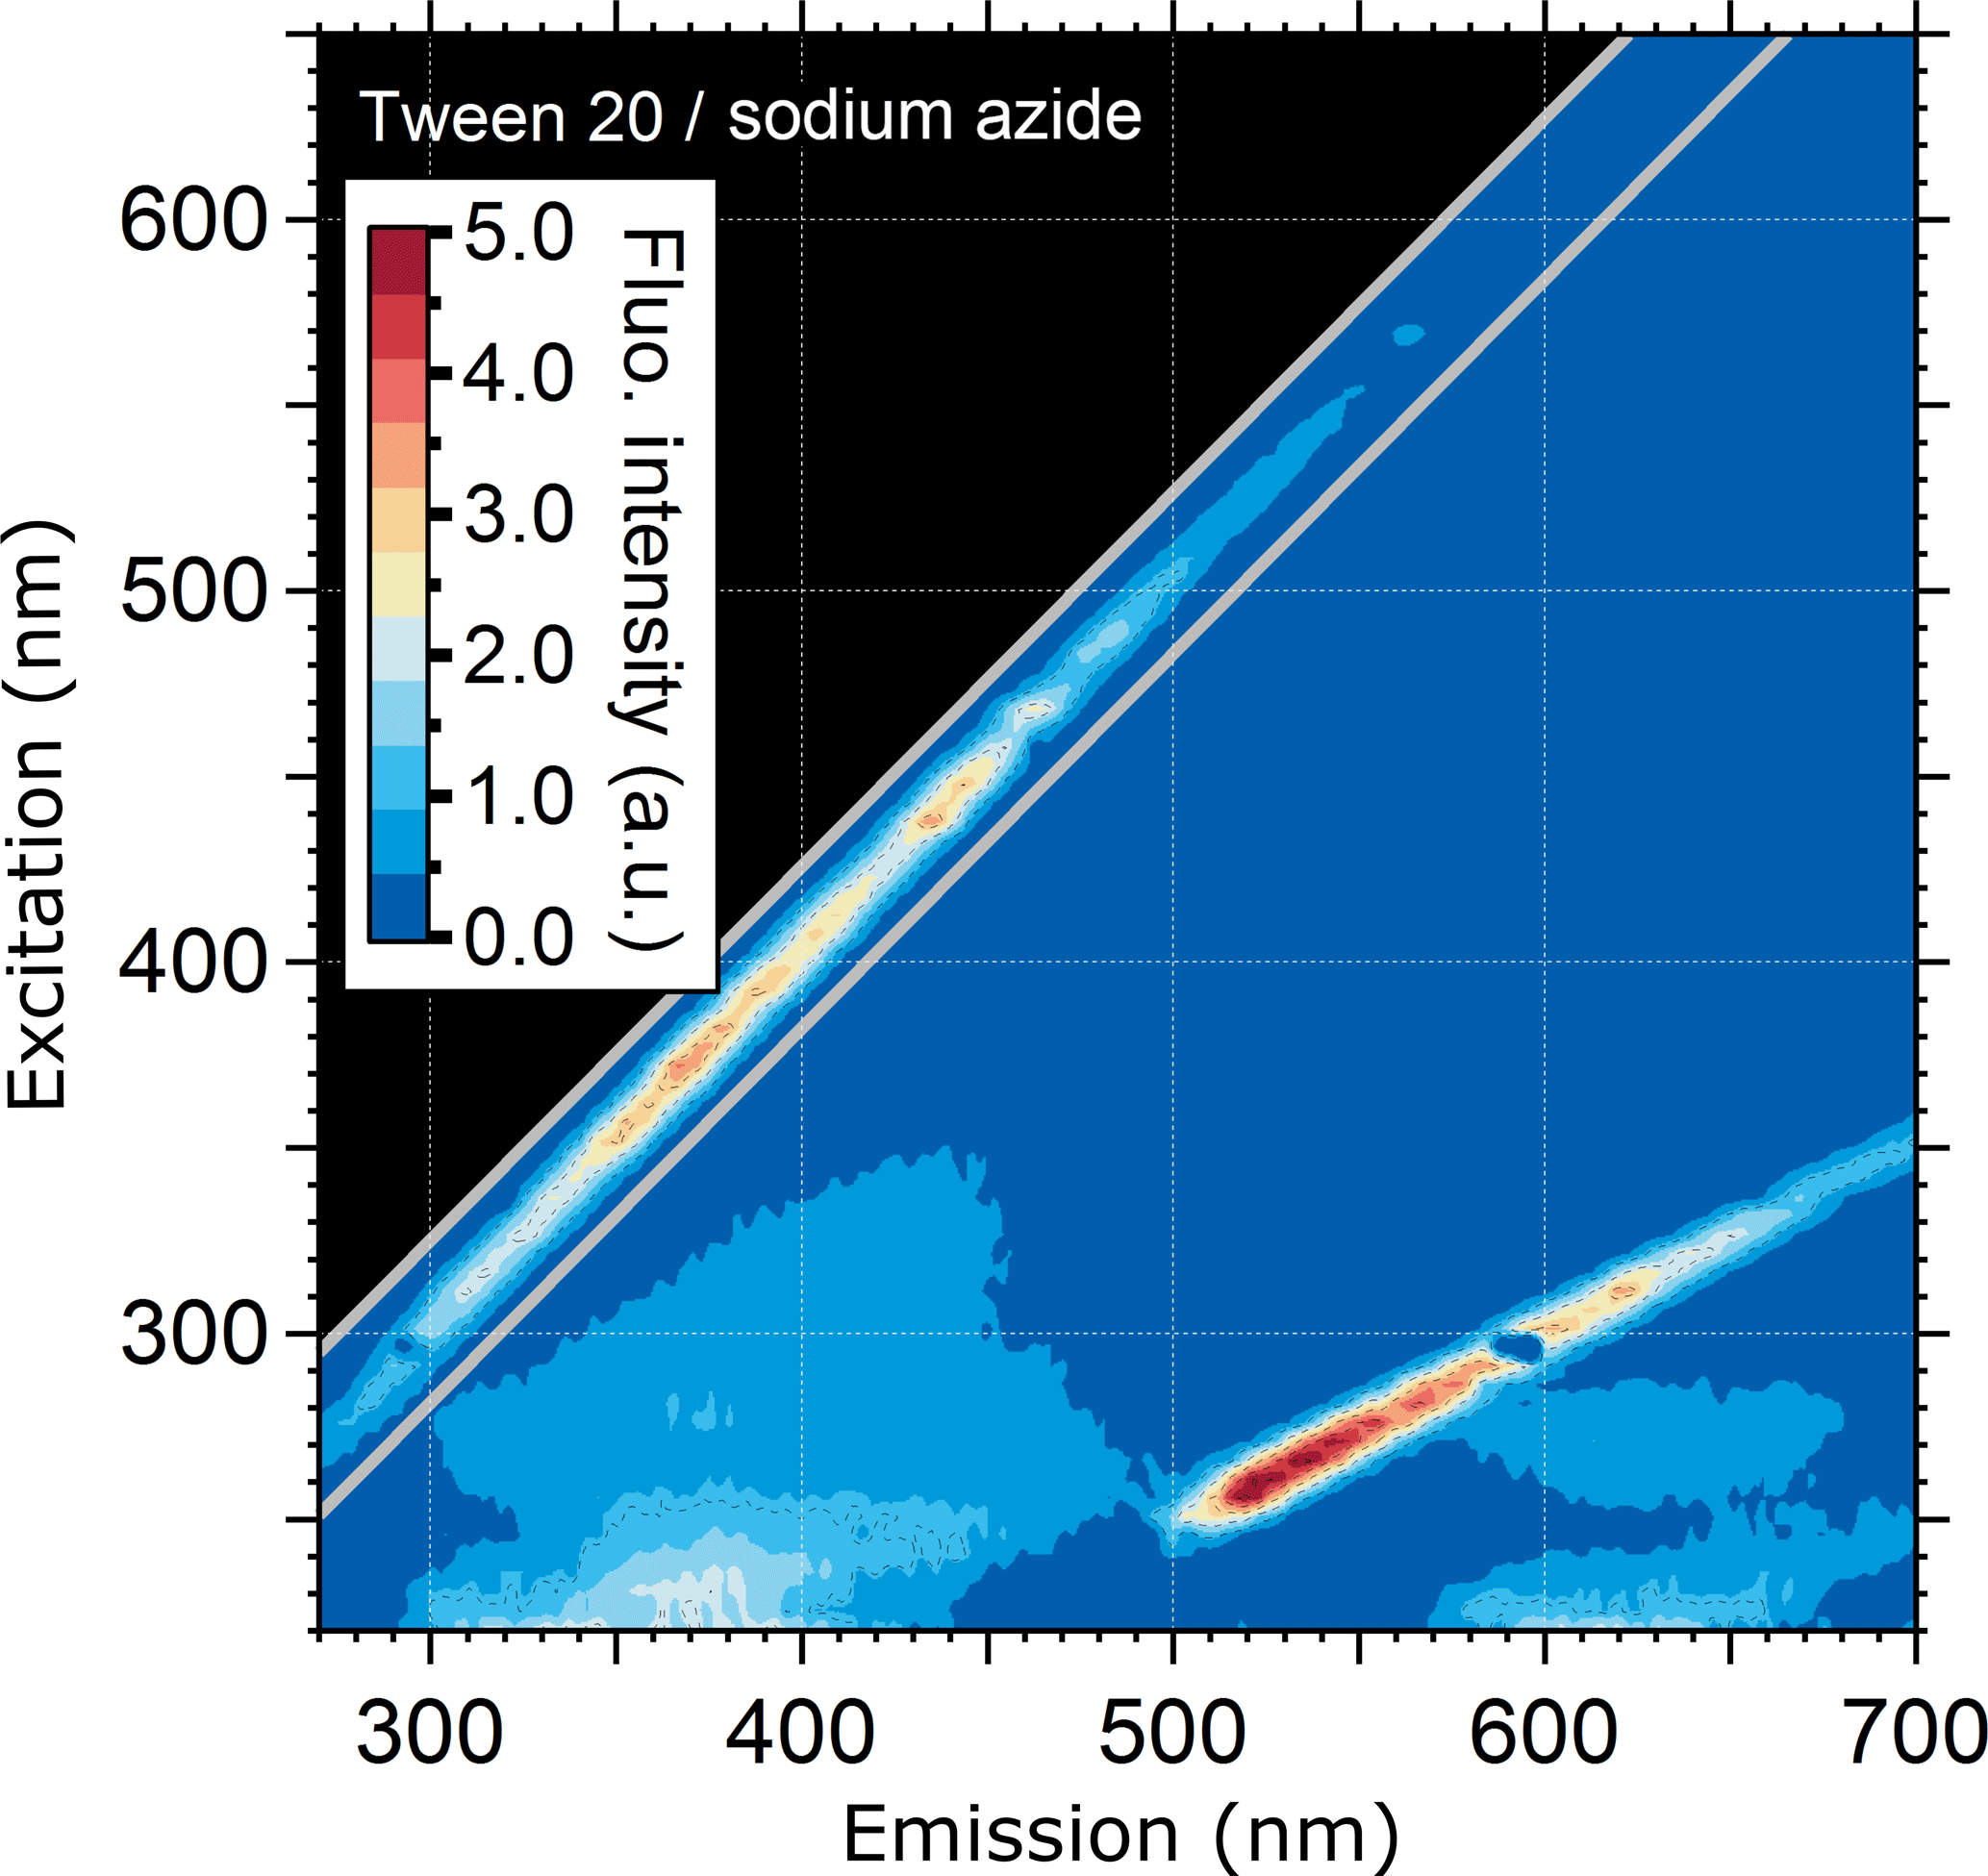
According to publicly available manufacturer information, one additive in aqueous PSL suspensions is the Tween 20 buffer (polyethylene glycol sorbitan monolaurate) in combination with sodium azide (registered trademark of Croda International PLC). Here it serves as a detergent to prevent the coagulation of particles. The exact concentration of this detergent depends on the manufacturer. For comparison, we used 6 µL of a Tween 20–sodium azide solution (Emd Millipore Corp., 5037) in 3.5 mL ultrapure water for FS.
2.4 Fluorescence microscopy on selected PSL samples
Microscopy analysis of selected PSL samples (i.e., 2.1 µm blue and 2.0 µm green) was conducted with fluorescence microscopes (i.e., a BZ-9000 from Keyence, Inc., Osaka, Japan, and an Eclipse Ti2 from Nikon, Tokyo, Japan). For the analysis of the blue PSLs, an OP-66834 DAPI-BP (λex= 360/20, λDichroic= 400, λem= 460/25 nm) fluorescence filter was used. For the analysis of the green PSLs, an GFP-4050B-000 (λex= 466/40, λDichroic= 495, λem= 525/50 nm) fluorescence filter was used.
A fraction of one drop of PSL stock suspension was mixed into one drop of glycerol gelatin (Sigma Aldrich) and placed between a specimen holder and a cover slip. The sample was used immediately after the glycerol gelatin had dried completely (< 5 min). Microscope settings were adjusted to record images with fluorescence intensities just below the detector saturation. The size and fluorescence intensity determination of individual PSLs within the image was performed by using ImageJ (Schneider et al., 2012). Fluorescence images were converted to gray scale, a binary image was obtained after conducting a thresholding, and then the mean gray scale intensity values were used as a relative measure for the mean fluorescence intensity values. For a detailed description of the BZ-9000 fluorescence microscope performance and related image analyses, we refer to Pöhlker et al. (2013).
2.5 Online PSL analysis using the WIBS-4A
As already discussed, fluorescent PSLs are used by a wide variety of scientific fields to calibrate and test instruments. While it is beyond the scope here to present a wide variety of technical examples, we found it instructive to choose one instrument and to include how factors relating to fluorescent PSLs can impact its application. Many LIF instruments deployed for the rapid detection of bioaerosol particles have become commonly used within the bioaerosol community, and a growing number of instruments are commercially available (e.g., Huffman and Santarpia, 2017). The WIBS-4A, in particular, has been used for the purposes of both laboratory validations and longer-term ambient measurements (e.g., Healy et al., 2012; Hernandez et al., 2016; Huffman et al., 2013; O'Connor et al., 2013; Perring et al., 2015; Robinson et al., 2013; Savage et al., 2017; Toprak and Schnaiter, 2013). The WIBS-4A provides information about particle size, a light scattering asymmetry factor (AF, broadly related to particle shape), and fluorescence properties for individual particles in real time. Single particles first cross a continuous wave diode laser (635 nm, 15 mW), which is used for particle detection, sizing (side scattering light), and scattering asymmetry (forward scattering light). After passing the diode laser, two xenon flash lamps are triggered to illuminate the particle at λex= 280 and 370 nm, respectively. The fluorescence emission derived from each excited particle is collected by two chamber mirrors and reflected onto two separate PMTs. Each particle is excited separately by the two lamps, fired in sequence, and thus a total of three channels of fluorescence emission intensity are acquired for each particle, referred to as FL1, FL2, and FL3. The FL1 channel measures emitted light between λem= 310 and 400 nm (at λex= 280 nm), the FL2 channel measures between λem= 420 and 650 nm (at λex= 280 nm), and the FL3 channel measures between λem= 420 and 650 nm (at λex= 370 nm). Emission detected in the 310 to 400 nm band from the 370 nm excitation is not detected because of PMT saturation. A detailed technical description of the WIBS series can be found elsewhere (e.g., Foot et al., 2008; Kaye et al., 2000, 2005; Savage et al., 2017; Stanley et al., 2011). The voltage settings used for all data presented here are PMT1 (AF) 400 V, PMT2 (particle sizing and FL1 emission) 450 mV, and PMT3 (FL2, FL3 emission) 732 mV.
PSLs in aqueous solution were aerosolized by using the portable aerosol generator AG-100 (Droplet Measurement Technologies, Longmont, CO, USA). For measurements of both fluorescent and non-fluorescent PSLs by the WIBS-4A, one drop of the suspension was diluted into 10 mL ultrapure water. For the aerosolization setup, an additional diffusion dryer was not utilized. This is because the major portion of water vapor from the aerosolization process evaporates inside the mixing chamber of the aerosol generator and distributions of particles were observed to match reported PSL diameters. Thus, the outlet of the aerosol generator was directly connected to the inlet of the WIBS-4A. Data were analyzed by using Igor Pro.
For the determination of the median fluorescence intensity values recorded by the WIBS-4A, a histogram of the emission signal in each of the detection channels was fitted with a Gaussian function. The fluorescence intensity observed from individual particles is a function of both particle size and the fluorescent quantum yield of the mixture of fluorophores within the particle. Because the particles interrogated here are relatively monodisperse PSLs, the particle size distribution is assumed to be Gaussian. Thus, within a distribution of particles of a single composition, the fluorescence intensity is expected also to be Gaussian in nature. This assumption breaks down when observed fluorescence intensity saturates the detector but can still be instructive for comparison of particles, as was discussed by Savage et al. (2017).
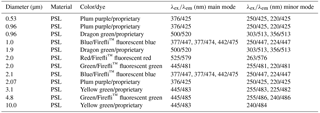
Table 2Steady-state fluorescence signatures of PSL solutions. Excitation wavelength (λex) and emission wavelength (λem) are peak values measured with the LS-45 Luminescence Spectrometer and the Dual-FL Fluorescence Spectrometer. Note that the lower emission detection range of the Dual-FL is set to 250 nm for which the second minor mode for 2.0 µm red PSLs cannot be detected.
3.1 Fluorescence signatures of PSLs in suspension
Figure 1 shows EEMs from six different PSL suspensions, each containing a different fluorophore. This figure highlights the characteristic differences in the steady-state fluorescence signatures of fluorescent dyes in particles nominally between 2 and 3 µm in diameter (see also Table 2). Additional EEMs can be found in the Supplement Fig. S1. The six presented fluorophore types in Fig. 1 represent dyes covering a spectral range of λem = ∼ 400 to 600 nm.
Generally, the fluorescence modes of all PSLs are comparatively broad, spanning emission bands of ∼ 100 nm or more. In several cases, the fluorescence modes reveal a fine structure, with two emission peaks at the same excitation wavelength, e.g., as a main mode1 with a shoulder (e.g., Fig. 1c and d; 2.0 µm green and 3.10 µm yellow green, respectively) or as two clearly separated main modes (e.g., Fig. 1b; 2.1 µm blue). As a further general feature, all fluorescent PSL samples measured within this study reveal a multimodal fluorescence signal, in which main and minor modes occur in the same emission band, but being spectrally separated due to different excitation wavelengths. As an example, yellow green PSLs in Fig. 1d show a main mode at λex = 450 nm/λem = 483 nm and minor modes at λex = 255 nm/λem = 483 nm as well as λex = 225 nm/λem = 482 nm. Note here that the specified excitation and emission maxima in Table 2 for those modes that overlap with the first- and second-order scattering bands (diagonal lines within EEMs) are approximate values with some uncertainty. The main mode for Fig. 1d (ΔλStokes = λem−λex = 33 nm) represents the signal from fluorophore dye. The minor modes (ΔλStokes = 228 and 257 nm) can probably be explained by light absorption of the polystyrene matrix, which is known to show pronounced UV absorption (Li et al., 1991), followed by energy transfer to the fluorophore which induces fluorescence emission. Note that energy transfer or migration is a commonly observed phenomenon in fluorescence applications (e.g., Charreyre et al., 1995, 1997; Hennig et al., 2013).
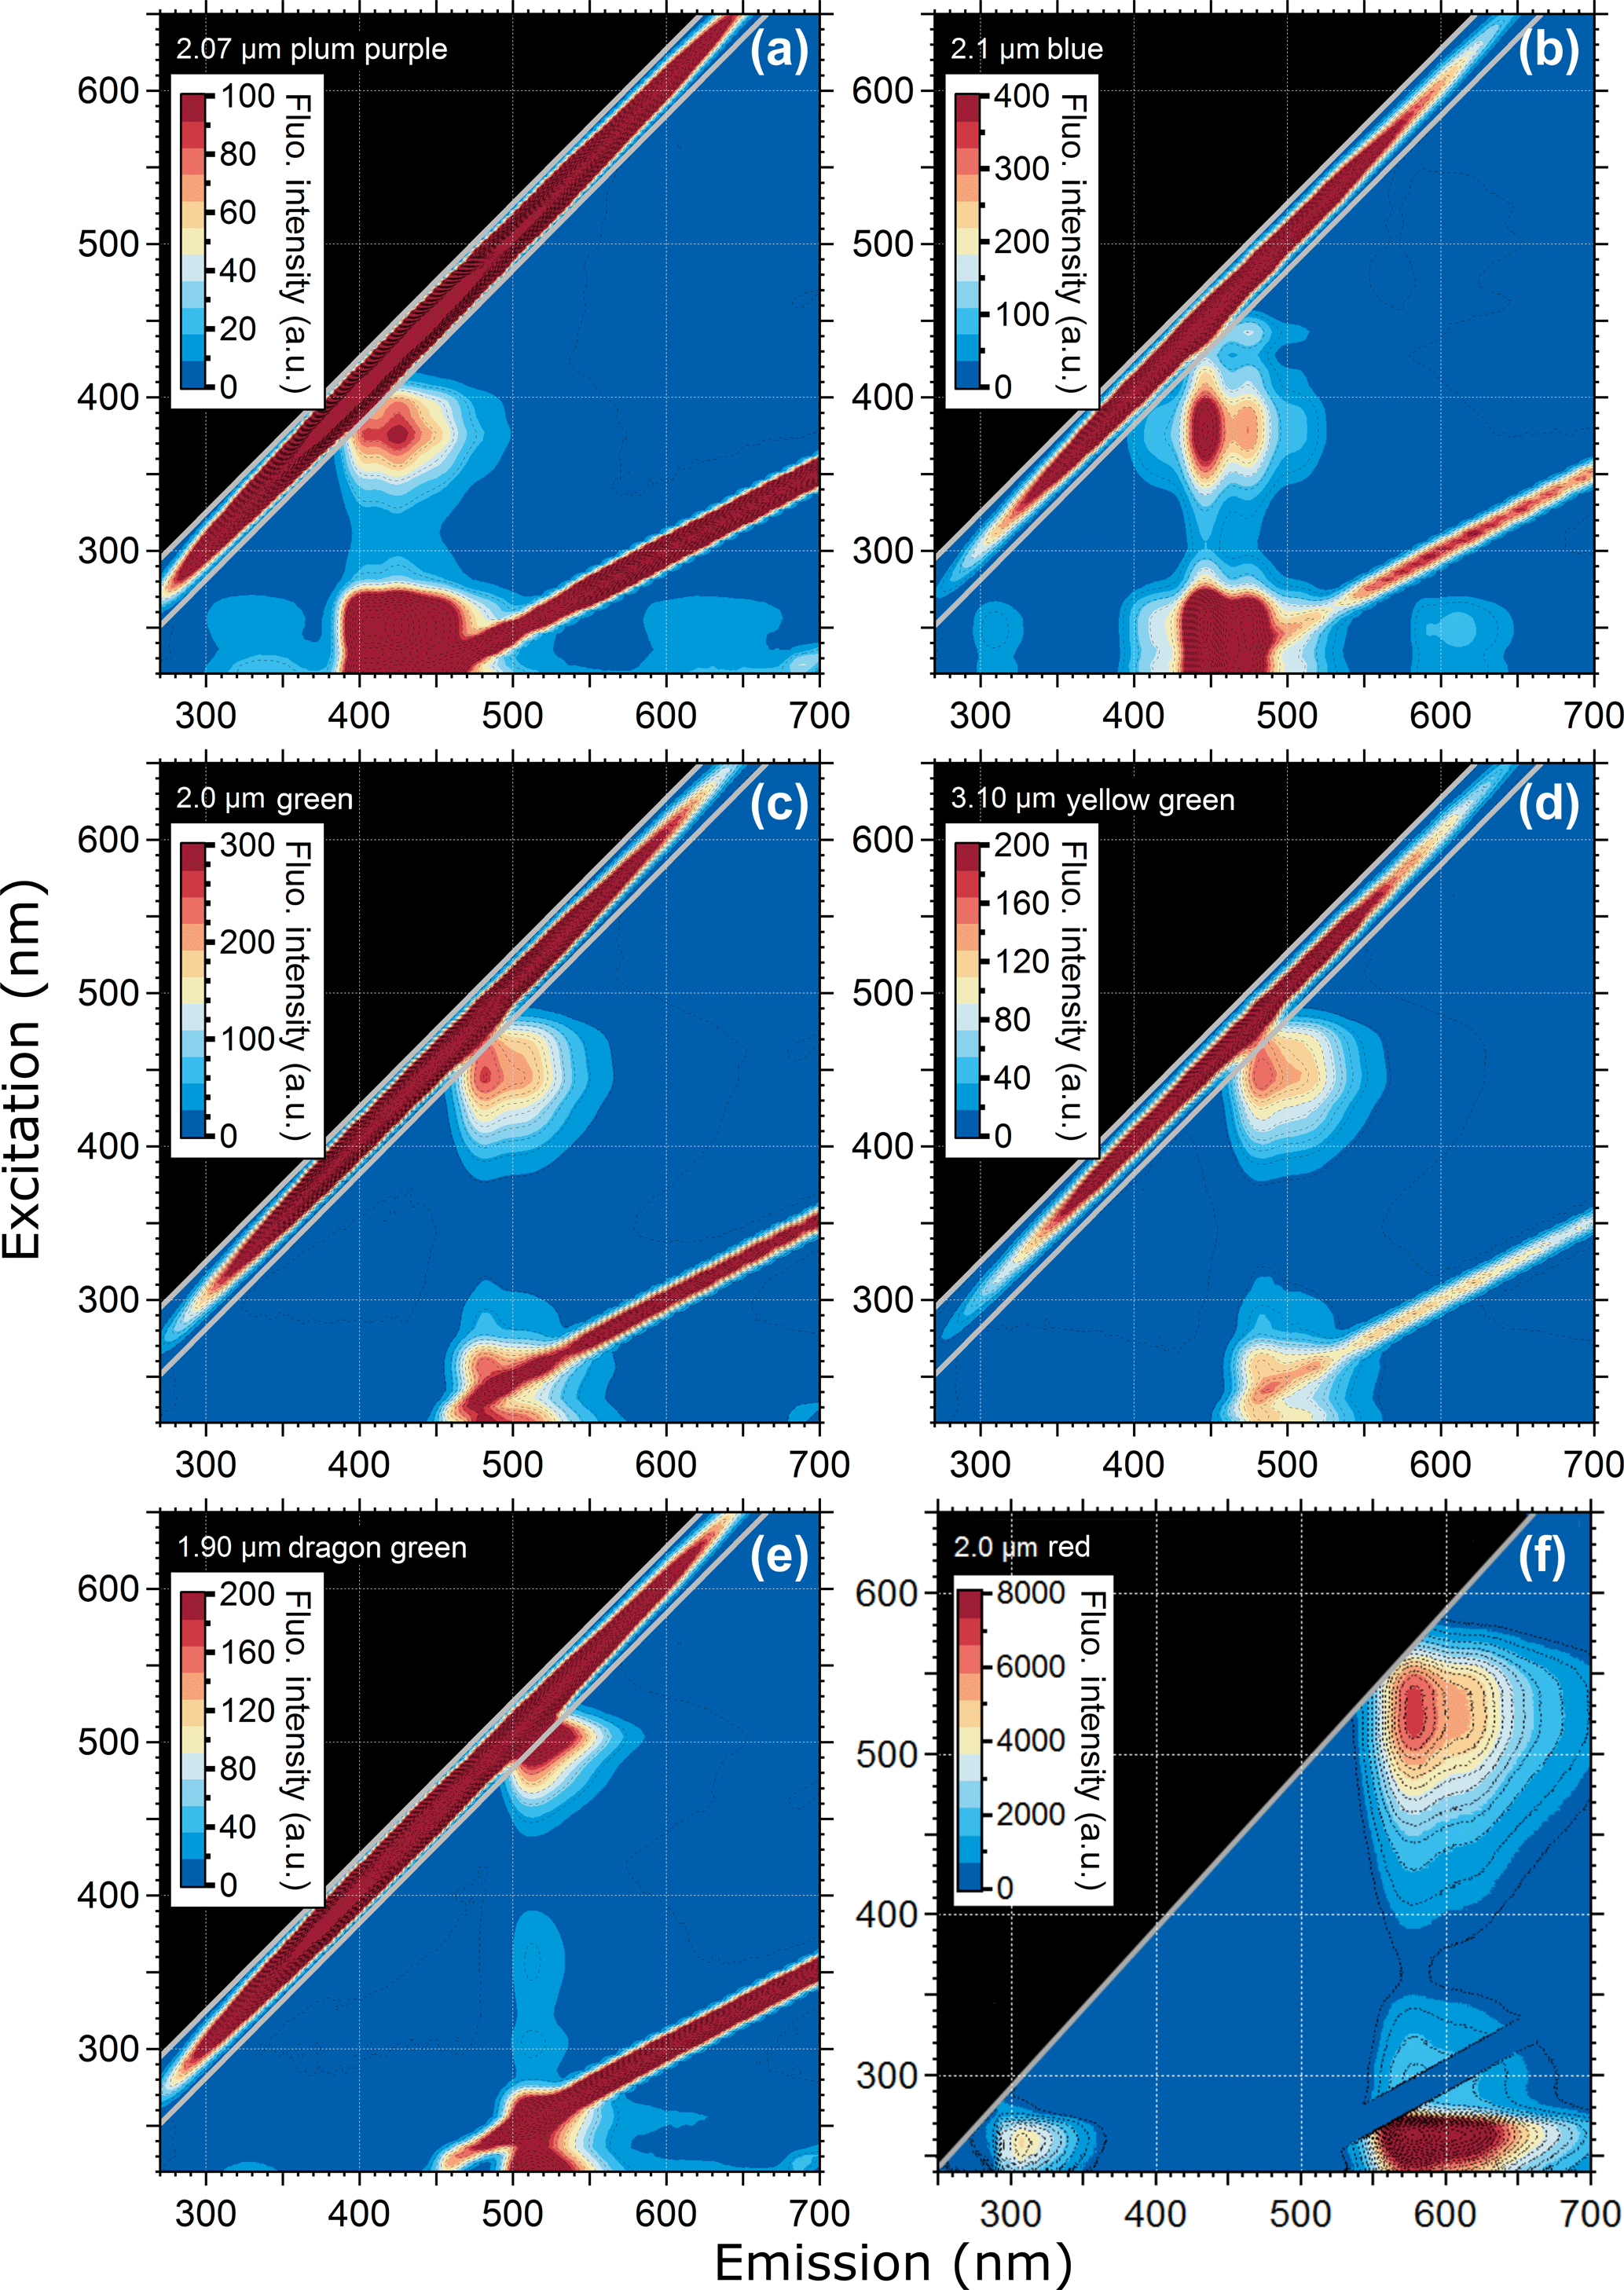
Figure 1Excitation–emission matrix of selected PSLs showing multimodal steady-state fluorescence signatures. Fluorescence intensity values shown as arbitrary units (a.u.). Diagonal lines show first- and second-order elastic scattering (Zepp et al., 2004). The first-order elastic scattering occurs when the incident wavelength is equal to the emitted wavelength (λex=λem) and the second-order elastic scattering is a diffraction grating effect where incident photons can also appear in an emission range doubled to the incident wavelength (2λex=λem). Note that 2.0 µm red PSLs (F) were measured with the Dual-FL Fluorescence Spectrometer between λex= 240–650 nm and λem= 250 and 700 nm. The first- and second-order elastic scattering were subtracted automatically by the Aqualog V3.6 software.
As can be seen in Table 1, PSL manufacturers only report fluorescence modes derived from a single excitation wavelength, which exclusively refers to the main mode. The one exception to this observation is that the manufacturer of blue PSLs (Thermo Fisher, Waltham, MA, USA) reports three fluorescence modes. Additional spectral information is not available (Robin Pyzik-Shuler (Thermo Fisher) and Ben Nelson (Bangs Laboratories Inc.), personal communication, 2017). The unspecified minor modes, unrelated to the dye fluorescence, can be a crucial factor for the calibration of LIF instruments. This is because many LIF instruments detect fluorescence in broad emission bands that conflate emission from the dye and polystyrene into a single detection channel, which could be erroneously interpreted to correlate with dye fluorescence. The excitation range λex= < 300 nm is particularly susceptible to this issue because it can promote fluorescence from the pronounced minor modes (see also Sect. 3.4).
In comparison to the fluorescence information stated by each manufacturer in Table 1, FS measurements reveal slightly different spectral locations of the mode maxima. In general, the excitation wavelengths stated by manufacturer's specifications (Table 1) rather intersect the shoulders of the emission signal and do not match signal maxima as we measured (Table 2). For example, red PSLs are stated to have a signal maximum at λex/λem= 542/612 nm (Table 1), while the signal measured reveals a signal maximum at λex/λem= 525/579 nm (Table 2). PSL spectral information provided by each manufacturer should thus be seen as approximate values, while spectral properties may vary slightly depending on measurement conditions (e.g., pH of aqueous medium). Nevertheless, the methods and conditions used by PSL manufacturers to determine fluorescence data are unknown.
One similarity that fluorescent, non-fluorescent, and also PS-DVB particles show is a consistent signal in the approximate region of λex/λem= 220–260/290–350 nm, which is unrelated to the emission signal derived from the embedded fluorophores. The origin of this particular emission signal is described in detail in the following section.
Figure 2 verifies that PSLs of different sizes, but with consistent fluorophore, show the same spectral fluorescence signatures. Generally, fluorescence emission spectra are qualitatively consistent between the two sizes analyzed for each particle dye. Note that for PSL bulk measurements, the fluorescence mode intensities are a function of the excited amounts of fluorophore in the light path inside the cuvette, which in turn depends on the size of the PSLs and their number concentration in suspension. Accordingly, slightly different mode intensities between 0.53 and 2.07 µm plum purple PSLs (Fig. 2a, b) and between 3.10 and 10.0 µm yellow green PSLs (Fig. 2c, d) originate from different concentrations of solids in aqueous solution as described above. Due to the uncertainty of the PSL number concentrations, the absolute intensities in the EEMs in Fig. 2 are not particularly informative here. For non-fluorescent PS-DVB particles in dry state, the signal pattern for 50.0 µm (Fig. 2e) reveals a sharper signal peak at λex/λem= 287/337 nm compared to 5.0 µm PS-DVB particles (Fig. 2f). This effect is likely based on size-dependent surface structure of the dry PS-DVB samples measured with the front surface accessory. The surface configuration of a layer of large 50.0 µm PS-DVB particles on the silica window may provide more surface structures for light scattering and reabsorption than a layer of smaller 5.0 µm PS-DVB particles. Therefore, the subtle shift in signal patterns may be interpreted as light refraction and scattering artifacts.

Figure 2Excitation–emission matrix of selected PSLs showing multimodal steady-state fluorescence signatures in relation to PSL size. Compared are PSLs containing the same fluorophore but having different sizes (except e and f, where no fluorophore is present). PS-DVB particles in panels (e) and (f) are measured in dry state.
It is important to note that physical properties of PSLs underlie production processes, for which their quality cannot be considered to be consistent and, therefore, might shift even within the same production batch (Robinson et al., 2017). Additionally, PSLs also undergo aging processes (e.g., via reactions with radical species and destruction of aromaticity), which can result in, for example, decreasing fluorescence intensities or size inaccuracies due to particle agglomeration over time (Pellach et al., 2012).
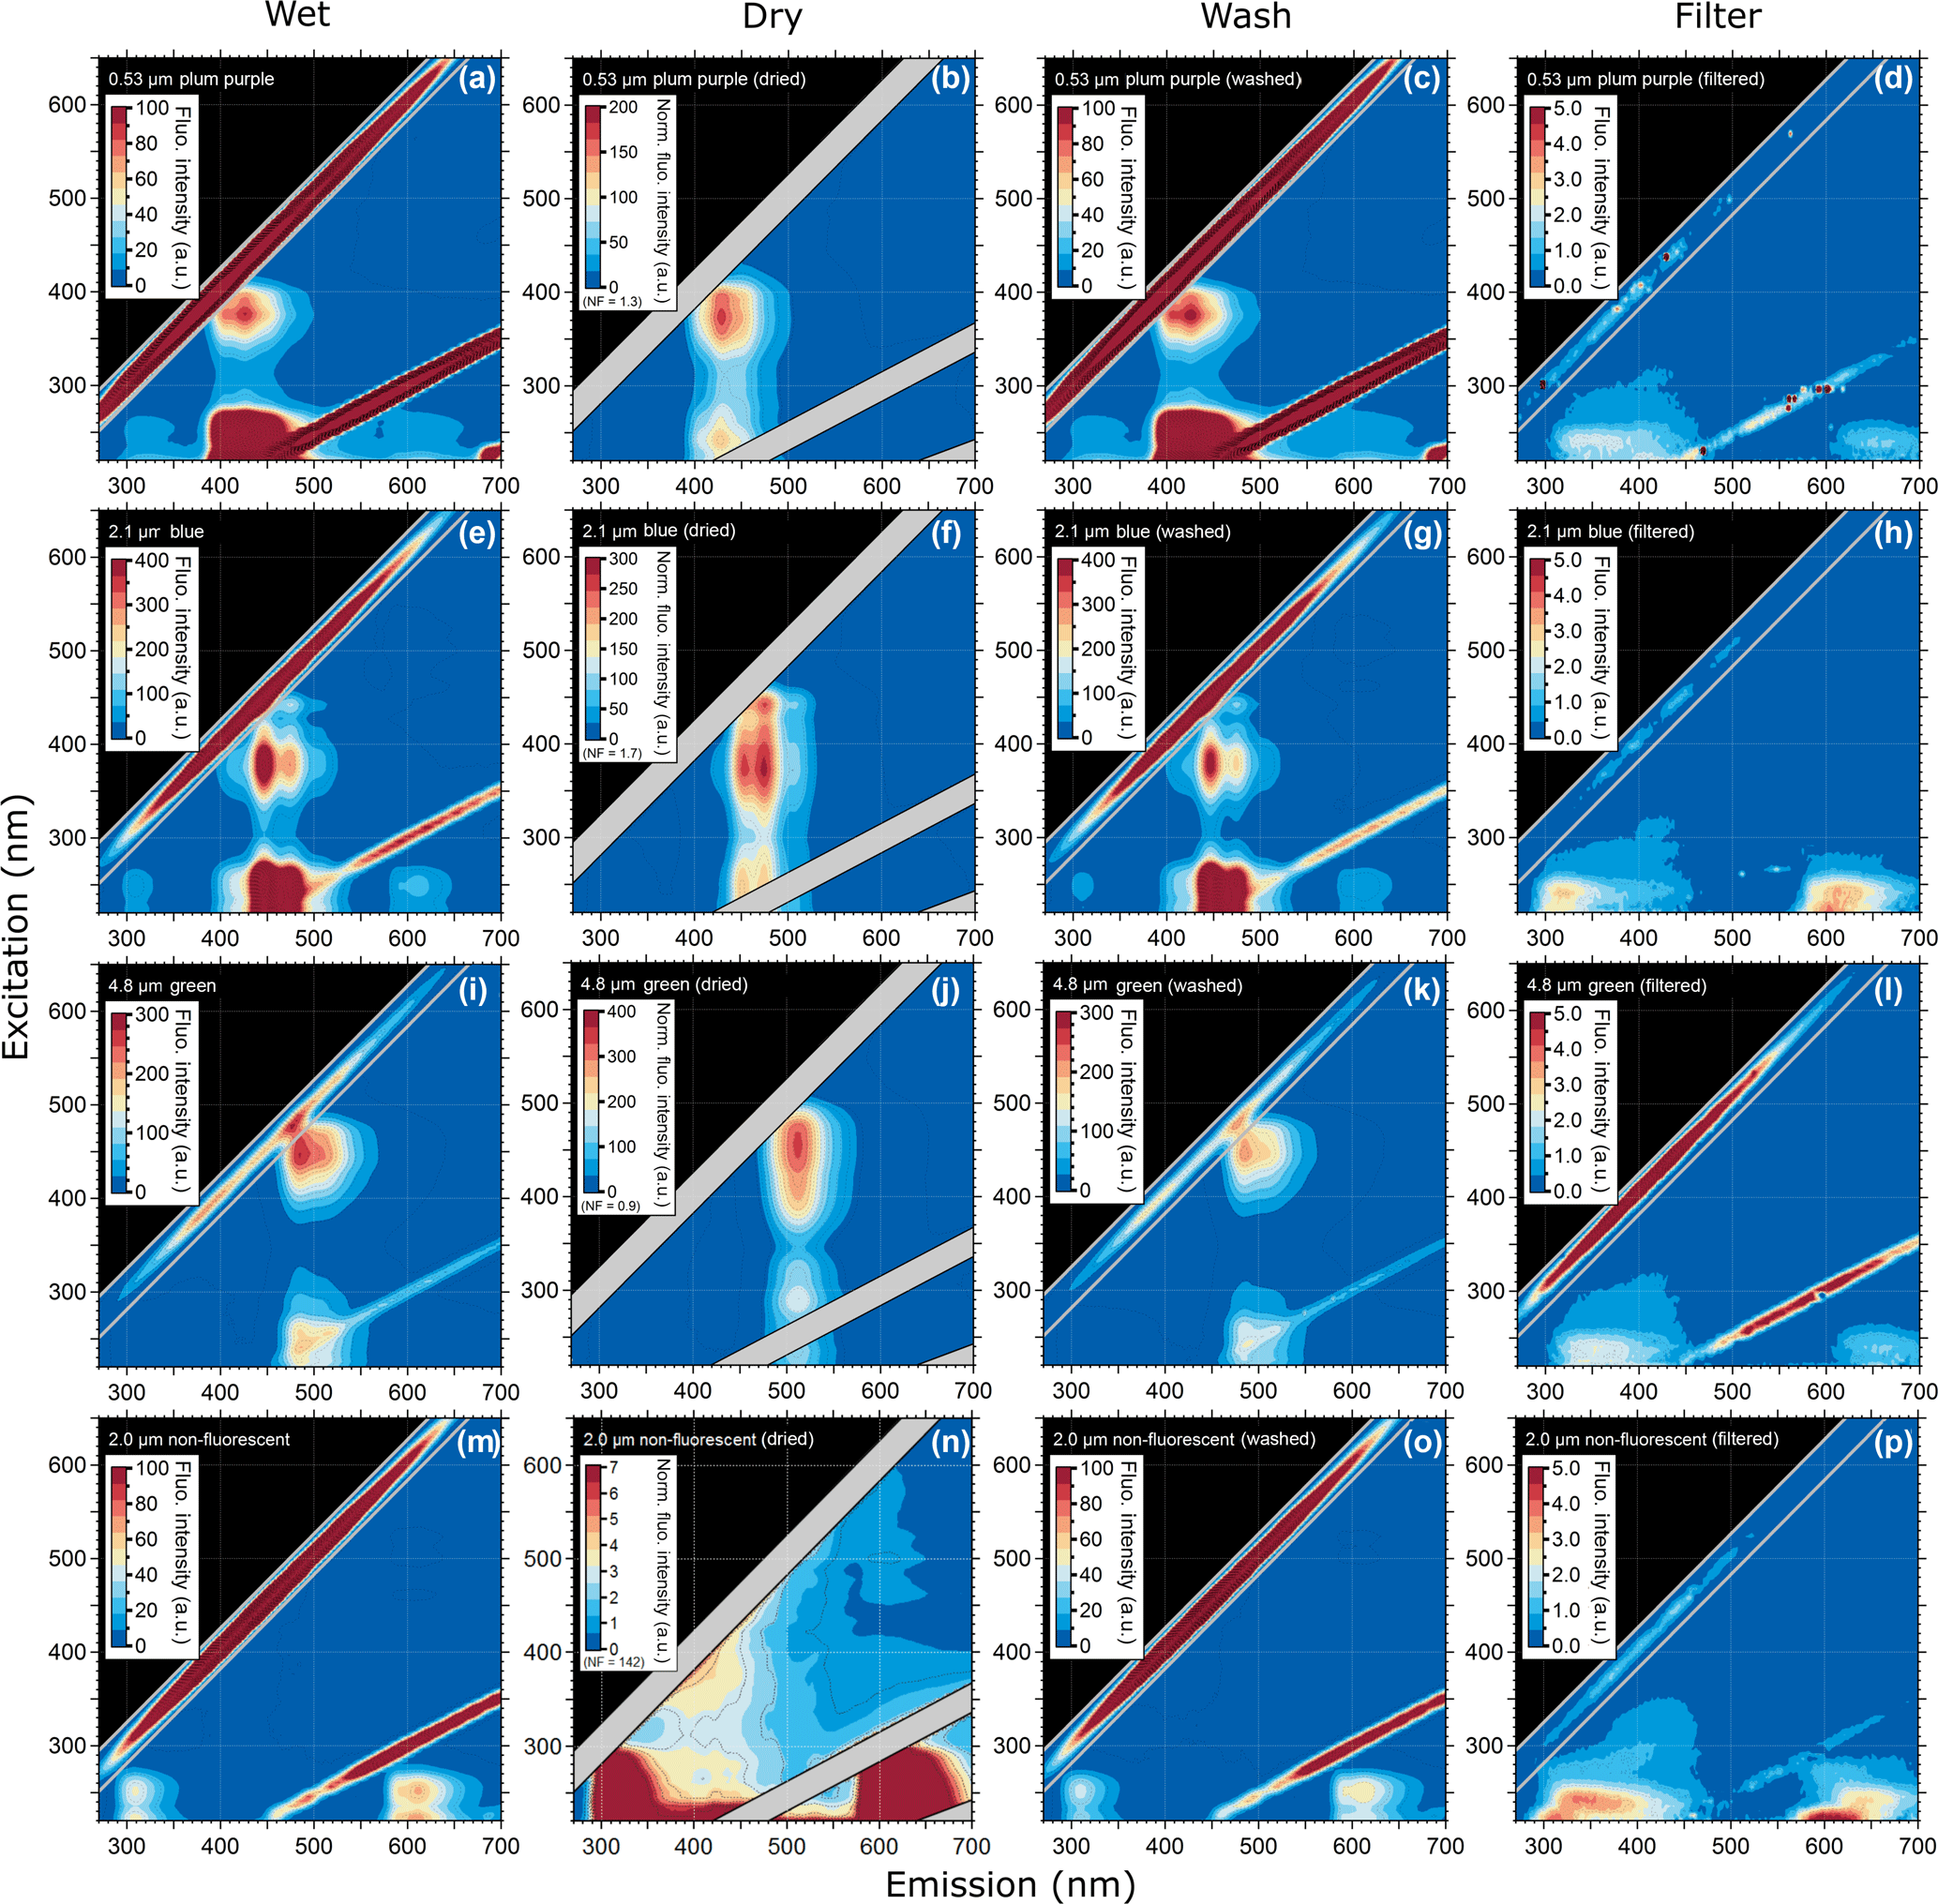
Figure 3Excitation–emission matrix of selected PSLs showing multimodal steady-state fluorescence signatures for different ways of PSL preparation. Shown are EEMs of wet PSL, similar to Figs. 1 and 2 (a, e, i, m), EEMs after PSLs were dried (b, f, j, n), washed (c, g, k, o), and filtered (d, h, l, p).
3.2 Fluorescence emission variations after PSL preparation
The EEMs of wet PSLs and after being dried, washed, and filtered are shown in Fig. 3. In comparison to wet PSLs (Fig. 3a, e, i, m), the EEMs of dried PSLs (Fig. 3b, f, j, n) showed a higher fluorescence intensity and so a blocking filter (Perkin Elmer, Inc.) was used to decrease incoming light by 99 % to prevent the PMT from being saturated. Note that the blocking filter was used for all dry samples (fluorescent and non-fluorescent PSLs, as well as PS-DVB particles), while all wet PSLs were measured without a blocking filter. The increased intensity for dry samples is due to the high concentration of particles on the silica window. Additionally, the water content for wet PSLs could act as a quencher decreasing fluorescence intensity values (Lakowicz, 1999). Even if the water background were subtracted from the sample, a water layer on the PSL surface might affect fluorescence properties due to water–fluorophore interactions. Overall, dried PSLs generally exhibit fluorescence emission modes that are broader and more intense than wet PSLs. In contrast, signals near the second-order elastic scattering lines, which are usually merged into a saturation mode for wet PSLs, are more distinct for dry samples. The peaks in the EEM are generally not affected by wetness state, only showing minor variations (< 5 nm), which are related to instrument performance, concentrations, and physical environment of the sample. The 4.8 µm green PSLs are an exception to this statement, because the particles show a red shift of the signal. While wet green PSLs show a main mode at λex/λem= 445/485 nm (Fig. 3i, Table 2), the main mode for dry PSLs shifts to λex/λem= 454/510 nm (Fig. 3j). The red shift of the spectra may be a result of water–fluorophore interactions or light scattering and reabsorption effects, as described for 5.0 and 50.0 µm PS-DVB particles. On one hand, because of the high concentration of dried particles on the silica window, inner filter effects, as described above, might promote a spectral shift. On the other hand, dry PSLs with smaller sizes (e.g., plum purple and blue PSLs; Fig. 3b, f) do not show a recognizable shift for which this effect seems to be rather size-dependent than based on inner filtering.
To explain the potential polystyrene–detergent signal for λex/λem= 220–260/290–350 nm occurring across all measured PSLs, particles were washed with ultrapure water to remove any soluble additives (Fig. 3c, g, k, o). Neither emission pattern nor the fluorescence intensity values are affected by removing additives from the aqueous phase, and the spectra remain qualitatively unchanged. Nevertheless, spectra of the filtered aqueous phase (Fig. 3d, h, l, p) reveal a broad, but weak signal, which occurs for approximately λex/ 220–260/300–450 nm. This signal is likely to be caused by a Tween 20 and sodium azide additive which is a known detergent used by all four manufacturers to prevent PSLs from agglomerating. To explore this hypothesis, Fig. 4 shows the emission signal of Tween 20–sodium azide, which exhibits a similar pattern to the spectral patterns of the filtered PSL solutions (i.e., washing water including detergents; Fig. 3d, h, l, and p). The results presented in Figs. 2, 3, and 4 indicate that the signal consistent among all measured PSLs and PS-DVB particles is likely to arise from a mixture of polystyrene and/or detergent emissions. Differences in signal patterns caused by the crosslinked divinylbenzene in PS-DVB particles are not obvious by direct comparison to PSLs. According to manufacturer information, dry PS-DVB particles may contain trace amounts of dispersants, which are not further specified. The contribution of those specific dispersants to the emission signal can therefore not be explored independently. PS-DVB particles did not undergo washing tests in this study, and so dispersants are still present in current fluorescence measurements of these particles. Due to potentially small amounts of dispersants, however, the emission signal for 5.0 and 50.0 µm particles (Fig. 2e, f) most likely originates from polystyrene, while the filtered aqueous solutions (Fig. 3d, h, l, p) reveal emission signals from detergents. Additional detergents beyond Tween 20 and sodium azide are stated as proprietary by each manufacturer, for which the exact components for PSLs in aqueous solution are unknown. The detergent signals measured within this study can, therefore, include additional components affecting emission patterns.
Even if the strength of the mixed polystyrene–detergent signal is considered to be low compared to fluorophore emissions, it can still affect the calibration of LIF instruments using excitation wavelengths in a UVB (280–315 nm) or UVC (200–280 nm) range with simultaneously high detection sensitivity. In this context it is important to note that PSLs labeled as “non-fluorescent” by the manufacturer show fluorescence emission when excited at λex < 300 nm. Thus, if non-fluorescent PSLs are used for the determination of fluorescent detection thresholds, the instrument operator must be especially aware of emission properties of PSLs in this particular spectral range. Figure S2 highlights the EEM of 2.0 µm non-fluorescent PSLs displayed with a lower fluorescence intensity scale (compare Fig. 3m), showing that the emission signal is not present above λex= ∼ 300 nm. Thus, instruments using excitation wavelengths in a UVA (320–400 nm) or vis range (400–700 nm) are not affected by the mixed polystyrene–detergent signal derived from PSLs.
3.3 Fluorescence microscopy of PSLs
Results discussed above are based on bulk spectra averaged from several hundreds of particles per spectrum and may not represent fluorescence properties of single particles. Therefore, we performed fluorescence microscopy of 2.1 µm blue and 2.0 µm green PSLs. Figure 5b shows the size distribution of PSLs observed between 1.7 and 3.0 µm, while the majority of particles occur in a size range between 2.0 and 2.3 µm. Only very few PSLs (3 out of 80 particles, Fig. 5a, b) reveal sizes which are far off from their nominal diameter (e.g., 2.9–3.0 µm, as marked by red arrows in Fig. 5a). According to manufacturer information, the standard deviation of the size of fluorescent PSLs is in general broader than those of non-fluorescent PSLs for which they are not intended for size calibrations.
The fluorescence intensity increases with increasing PSL size (Fig. 5b) due to the increasing amount of fluorophore being excited. The relationship of the measured intensity, I, and particle diameter, D, can be described by a power law fit , typically with 2 3 (e.g., Hill et al., 2015; Sivaprakasam et al., 2011; Swanson and Huffman, 2018). Hill et al. (2015) reported that small and/or slightly absorbing particles typically show y approaching 3 (i.e., volume dependence), whereas rather large and/or absorbing particles show y approaching 2 (i.e., surface dependence). The microscopy-based results obtained here agree well with this y range: For 2.1 µm blue PSLs we observed y = 2.6 ± 0.5 and for 2.0 µm green PSLs we observed y = 2.9 ± 0.2 (Fig. S3).
Table 3PSLs measured with the WIBS-4A. Median fluorescence intensity observed (± 1 standard deviation) shown for each fluorescence channel, in arbitrary units (a.u.). At 2046 arbitrary units, emissions are marked as “saturation”. Excitation wavelength (λex) and emission wavelength (λem) are peak values reported by the manufacturer.

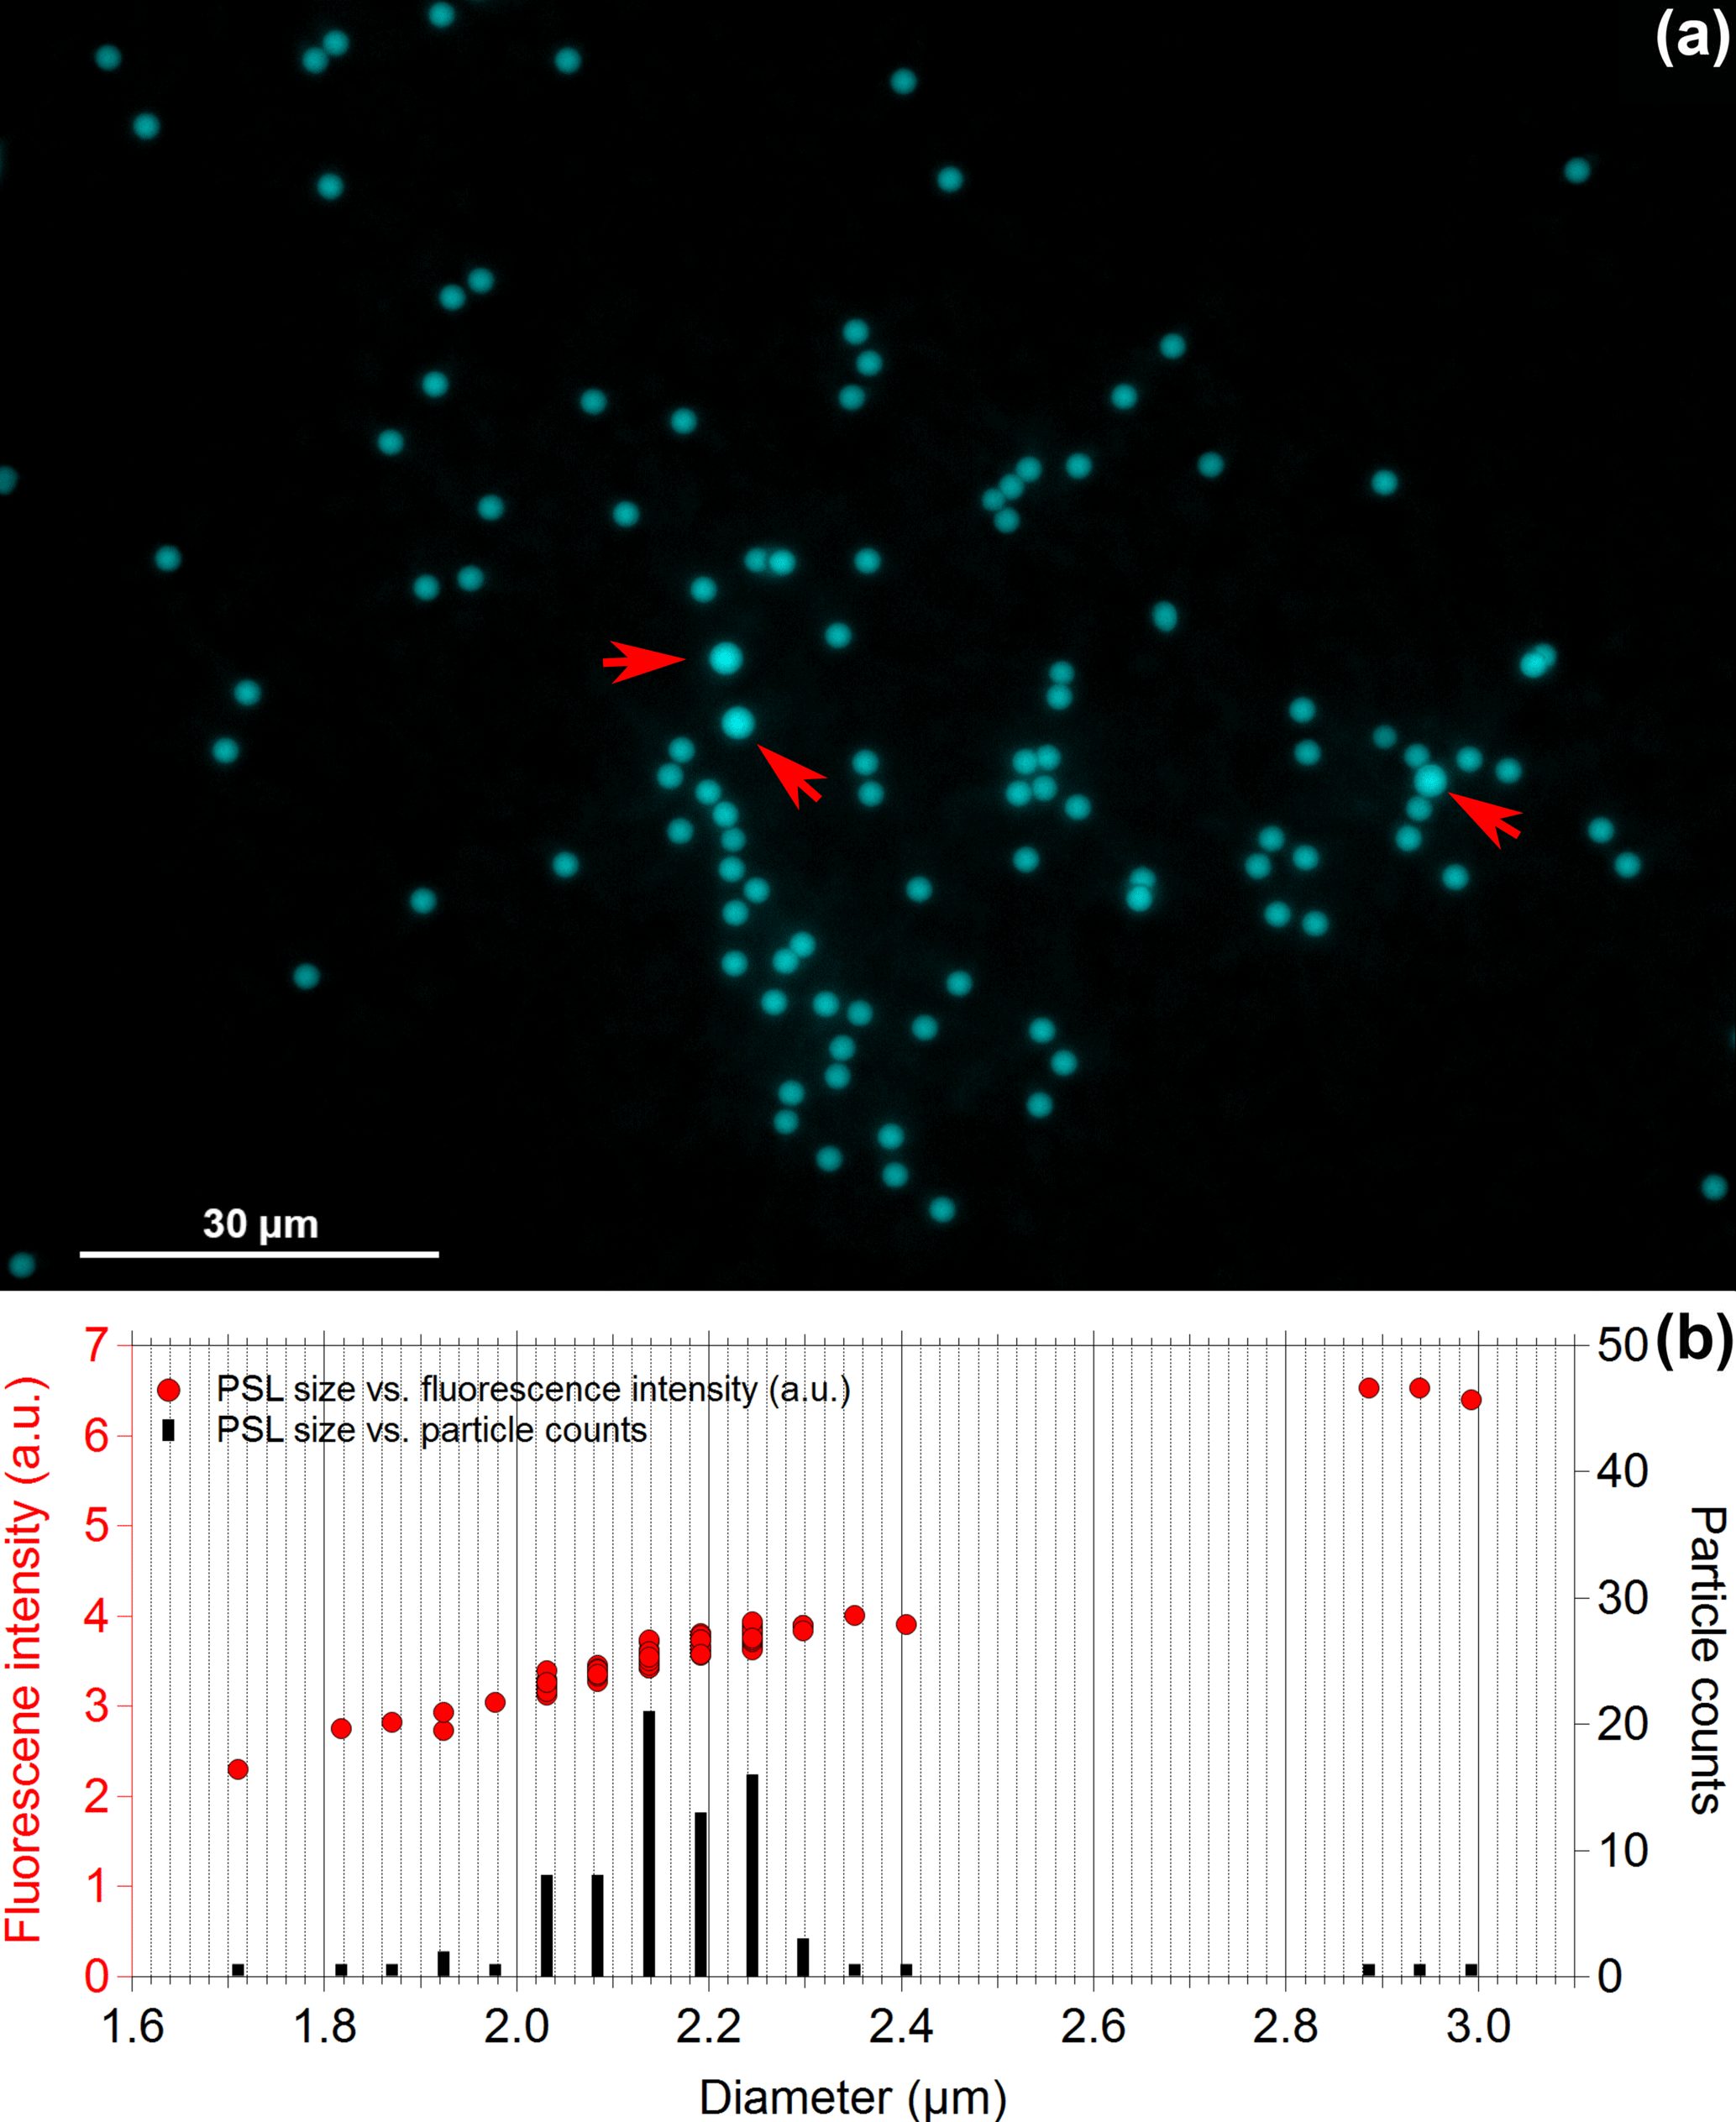
Figure 5Fluorescence microscopy of 2.1 µm blue PSLs. Panel (a) shows the microscopy image of 80 particles in total, while panel (b) contrasts PSL size vs. fluorescence intensity (left axis) and PSL size vs. particle counts (right axis). Red arrows in panel (a) mark PSLs with sizes between 2.9 and 3 µm.
3.4 PSL measurements with the WIBS-4A
The use of commercially available fluorescent PSLs is critical for the accurate operation of a number of atmospheric instruments, including the WIBS and other UV-LIF instruments for bioaerosol detection. As a perspective of the importance of understanding PSL properties, eight PSL types were analyzed using the WIBS-4A. A summary of data parameters for each collection of PSLs analyzed is summarized in Table 3. The purpose of the analysis is to show how the variability of fluorescence properties may be interrogated on a single-particle basis and how the WIBS-4A may be utilized to differentiate between the particles as a resource for UV-LIF users.
Summarizing the fluorescence distributions in this way can enable a comparison of similar PSL fluorophores to be compared across instruments as a very rough intensity check. These data may be used not only by WIBS users but also by users of other UV-LIF instrumentation who may use such data for fluorescence calibration, instrument alignment, and excitation pulsing. Nevertheless, comparing the specifics of the intensity values (e.g., Table 3) across different studies should be treated with extreme caution. A number of instrumental factors, including gain settings of detectors used for fluorescence detection, can significantly influence observed fluorescence intensities, making direct comparisons, even within similar instrumentation, challenging at best. In this context it is worth noting that the data reported here were recorded with the same WIBS unit used by Savage et al. (2017). Moreover, Savage et al. (2017) measured three PSL samples (2.0 µm green, 2.0 µm red, and 2.1 µm blue – same type and manufacturer, but different batches as those used in present work) and the obtained results agree with the results in Table 3. This suggests that the WIBS-derived PSL fluorescence intensities in Table 3 can be compared to the fluorescence intensities of the extent library of fluorescent materials and standard organisms in Savage et al. (2017).
As outlined in Sect. 3.3, the single-particle fluorescence intensity increases steeply with particle size. Accordingly, comparatively large PSLs saturate the WIBS detector at some point depending on the detector gain settings. For the WIBS settings used here, saturation occurs for PSL sizes > 2 µm. Specifically, the main mode of 2.1 µm blue PSLs saturates channel FL3, the minor mode of 3.1 µm yellow green PSLs saturates FL2, and 4.52 µm non-fluorescent PSLs saturate FL1. Obviously, PSLs that tend to saturate the WIBS detector are inappropriate for fluorescence intensity checks and spectral validations. For routine performance checks using the WIBS settings outlined in Sect. 2.5, we recommend the use of 1.0 µm blue, 2.0 µm green, and 2.0 µm red PSLs. Crucially important for LIF users is the observation that nominally non-fluorescent PSLs indeed show fluorescence emission in the UV range that can be strong enough to even saturate LIF instrument detectors (i.e., the WIBS FL1 channel). Although weak in comparison to the PSL fluorophore modes (Fig. 3), the responsible polystyrene–detergent signal becomes dominant for large PSL sizes due to the steep intensity increase with particle size. The issue of fluorescence intensity calibration within UV-LIF instruments is sufficiently important and problematic that it has been discussed by a number of authors. In particular, Robinson et al. (2017) developed a fluorescence calibration strategy for WIBS channels FL1 and FL2. The issue requires continued attention, however, from the UV-LIF community. It is also important to mention that previous works using the WIBS-4 utilized detector gain switching, which allowed detection of highly fluorescent or large (low gain) particles along with weakly fluorescent or small (high gain) particles (Healy et al., 2012). This feature is not present in the WIBS-4A commercialized by DMT, Inc., but is being explored by more recent generations of various UV-LIF instruments.
Most UV-LIF instrument users rely on fluorescent PSLs for some aspect of their studies. Ultimately, more work will be required to develop more stable and generally accepted particle fluorescence calibration standards that can be applied reliably across instruments, time, and geography. One such example is the recent work presented by Robinson et al. (2017), who used a mixture of tryptophan and ammonium sulfate to calibrate one fluorescence channel and pure quinine to calibrate a second channel. The authors of this paper did not, however, present a strategy to calibrate the third WIBS channel (FL3).
This study presents an overview of relevant physical properties of fluorescent and non-fluorescent PSLs utilizing on- and offline techniques (fluorescence spectroscopy, fluorescence microscopy, and WIBS-4A detection). We analyzed 18 different particle standards (PSL and PS-DVB particles) that are commonly used for the characterization and validation of LIF instruments.
The steady-state fluorescence emission spectra of PSLs shown here are slightly different than values reported by each manufacturer, likely due to the method used for fluorescence determination, instrument performance, and particle concentrations. Other conditions such as particle age, agglomeration, and storage conditions could contribute to spectral differences. Moreover, in addition to the dominant fluorescence modes, we observed an additional set of fluorescence modes at shorter excitation wavelengths (λex= < 300 nm), revealing the multimodal fluorescence signature of fluorescent PSLs. We also detected a further emission signal at approximately λex/λem= 220–260/290–350 nm, which does not originate from embedded fluorophores. This specific fluorescence signal occurs for both fluorescent and non-fluorescent PSLs, as well as for PS-DVB particles. For PS-DVB particles the fluorescence response most likely originates from the polymer matrix. For PSLs in solution, the emission pattern is likely to result from a mixture of polystyrene and detergents (e.g., Tween 20–sodium azide). Changes in emission spectra were not detected as a function of increasing particle size.
Dried PSLs did not reveal significant EEM changes compared to PSLs in the wet state. Even if a potential water layer on PSLs may act as a fluorescence quencher, the interference on measurements appears insignificant. By washing PSL solutions with ultrapure water to remove additives, fluorescence emission patterns were shown not to be affected. The filtered aqueous phase (soluble surface coatings of PSLs in the absence of particles) showed an emission signal similar to the fluorescence response of Tween 20–sodium azide solutions, which is commonly used as a detergent to prevent PSLs from agglomerating. Since further additives are proprietary, it is unknown in how far these additives might contribute to the overall emission signal. Because of the partially spectral overlap of the polystyrene and Tween 20–sodium azide signal, we were not able to distinguish both emissions from each other with the techniques used in this study. Additionally, the signal strength of Tween 20–sodium azide is rather low compared to the emission of polystyrene, making a differentiation challenging.
On a single-particle scale, PSLs from one production batch were shown to be uniform, only deviating slightly in size (±0.3 µm). Furthermore, the fluorescence intensity of single particles was shown to increase with increasing particle size which can be described by power law relationship with exponents between 2 and 3.
Many instruments utilize fluorescent PSLs for spectral calibration. This can be challenging for a number of reasons that are important to discuss here. First, fluorescent modes are rather broad and their spectral location is influenced by the chemical environment and molecular interactions of the fluorophore (i.e., hydration state, pH, temperature, matrix or solvent molecules present). This can lead to slight red- and blue-shifted emission compared to observations shown here. This means that by using an instrument with a given optical filter cut-off, PSLs under one set of conditions may or may not appear within a given detection channel.
It is also important to note that the particle size and/or fluorescence intensity of PSLs used as calibrants can vary as a function of production quality, which cannot be assumed to be consistent between manufacturers or even between production lots from the same provider. Additionally, PSLs undergo aging processes, even when stored properly (i.e., at 4 ∘C). According to Robinson et al. (2017), the shelf stability of PSLs is widely considered to be poor. However, to our knowledge there have been no published studies that address qualitative variances due to shelf degradation and so these issues cannot be predicted in detail. Nevertheless, the degradation of the fluorophore embedded in the sphere due to reactions with, for example, radicals and a resulting loss of aromaticity, will most likely lead to decreasing fluorescence intensities over time. Another likely age-dependent effect can occur when the detergent, used to prevent PSLs in aqueous solution from agglomeration, degrades with age and thus facilitates the aggregation of (i) PSLs with each other or (ii) PSLs with the surfactant itself. Both possibilities would likely lead to sizing inaccuracies (caused by PSL clusters or shifting refractive indices due to the accumulation of surfactant material on the PSL surface) and changing fluorescent intensity values (increased fluorescence intensities derived from PSL clusters). Faster accumulation of surfactant material on the PSL surface could, in some circumstances, also alter derived fluorescence emission patterns by either diffract excitation–emission wavelengths or contributing to the fluorophore signal itself. The time period and the degree of PSL aging are dependent on storage conditions and the quality of the production lot individually and are, therefore, not predictable.
While the specifics of emission spectra shown here are not likely to repeat in specific detail, the trends are expected to be broadly consistent. Nevertheless, even if PSLs serve as a simple and easy to apply approach for routinely sizing, spectral, and rough fluorescence intensity validations of LIF instruments, they cannot be compared to the complex nature of spectral information derived from bioaerosols in environmental systems. By comparing bioaerosol data from Hernandez et al. (2016) and Savage et al. (2017), fluorescence intensity values of PSLs, fully doped with fluorescent dyes, will very likely exceed the emission intensity of bioaerosols of equal sizes in most cases.
We introduce these topics as important for many research communities to consider. By understanding general features, such as the inclusion of fluorescent modes from polystyrene polymers and included surfactants or detergents, individual researchers may probe specific spectral features important to the operation of their own instruments. We provide spectrally resolved steady-state EEMs of the measured lots of PSLs as open-access data as a community resource for better interpretation of fluorescence responses of LIF and related instrumentation.
The data of EEMs presented here have been deposited as Supplement files (tab-delimited text *.txt) for use in follow-up studies. For specific data requests or detailed information on the deposited data, please refer to the corresponding author.
| Acronym | Description |
| AF | Asymmetry factor |
| EEM | Excitation–emission matrix |
| FM | Fluorescence microscopy |
| FS | Fluorescence spectroscopy |
| IR | Infrared |
| LIF | Light-induced fluorescence |
| NF | Normalization factor |
| PBAP | Primary biological aerosol particles |
| PMT | Photomultiplier tube |
| PSL | Polystyrene latex spheres |
| PS-DVB | Polystyrene-divinylbenzene |
| UV | Ultraviolet |
| UV-APS | Ultraviolet aerodynamic particle sizer |
| Vis | Visible light |
| WIBS | Waveband integrated bioaerosol sensor |
The supplement related to this article is available online at: https://doi.org/10.5194/amt-11-3987-2018-supplement.
The authors declare that they have no conflict of interest.
This work was supported by the Max Planck Society (MPG) and the Max Planck
Graduate Center with the Johannes Gutenberg-University Mainz (MPGC).
Financial support for Nicole Savage was provided by the Phillipson Graduate
Fellowship from the University of Denver. We thank Ulrich Pöschl,
Meinrat O. Andreae, Maria Praß, Jan-David Förster, Benjamin Swanson,
David Walter, Florian Ditas, Jorge Saturno, Bruna Holanda, Daniel Moran,
Thomas Klimach, Björn Nillius, Anna-Lena Leifke, and Jing Ming for
their support and stimulating discussions.
The article processing charges for this open-access
publication were covered by the Max Planck Society.
Edited by: Francis Pope
Reviewed by: two anonymous referees
Agranovski, V., Ristovski, Z., Hargreaves, M., Blackall, P., and Morawska, L.: Real-time measurement of bacterial aerosols with the UVAPS: performance evaluation, J. Aerosol Sci., 34, 301–317, https://doi.org/10.1016/S0021-8502(02)00181-7, 2003.
Andreae, M. O. and Crutzen, P. J.: Atmospheric Aerosols: Biogeochemical Sources and Role in Atmospheric Chemistry, Science, 276, 1052–1058, https://doi.org/10.1126/science.276.5315.1052, 1997.
Bhangar, S., Huffman, J. A., and Nazaroff, W. W.: Size-resolved fluorescent biological aerosol particle concentrations and occupant emissions in a university classroom, Indoor Air, 24, 604–617, 2014.
Brosseau, L. M., Vesley, D., Rice, N., Goodell, K., Nellis, M., and Hairston, P.: Differences in detected fluorescence among several bacterial species measured with a direct-reading particle sizer and fluorescence detector, Aerosol Sci. Tech., 32, 545–558, 2000.
Charreyre, M.-T., Yekta, A., Winnik, M. A., Delair, T., and Pichot, C.: Fluorescence energy transfer from fluorescein to tetramethylrhodamine covalently bound to the surface of polystyrene latex particles, Langmuir, 11, 2423–2428, 1995.
Charreyre, M.-T., Tcherkasskaya, O., Winnik, M. A., Hiver, A., Delair, T., Cros, P., and Mandrand, B.: Fluorescence energy transfer study of the conformation of oligonucleotides covalently bound to polystyrene latex particles, Langmuir, 13, 3103–3110, 1997.
Deepak, A., and Vali, G.: The International Global Aerosol Program (IGAP) Plan: Overview (Vol. 1), A. Deepak Pub., 1991.
Després, V. R., Huffman, J. A., Burrows, S. M., Hoose, C., Safatov, A. S., Buryak, G., and Jaenicke, R.: Primary biological aerosol particles in the atmosphere: a review, Tellus B, 64, 15598, https://doi.org/10.3402/tellusb.v64i0.15598, 2012.
Foot, V. E., Kaye, P. H., Stanley, W. R., Barrington, S. J., Gallagher, M., and Gabey, A.: Low-cost real-time multiparameter bio-aerosol sensors, Proc. SPIE, 7116, 1–12, 71160, https://doi.org/10.1117/12.800226, 2008.
Fröhlich-Nowoisky, J., Kampf, C. J., Weber, B., Huffman, J. A., Pöhlker, C., Andreae, M. O., and Pöschl, U.: Bioaerosols in the Earth System: Climate, Health, and Ecosystem Interactions, Atmos. Res., 182, 346–376, https://doi.org/10.1016/j.atmosres.2016.07.018, 2016.
Fuzzi, S., Andreae, M. O., Huebert, B. J., Kulmala, M., Bond, T. C., Boy, M., Doherty, S. J., Guenther, A., Kanakidou, M., Kawamura, K., Kerminen, V.-M., Lohmann, U., Russell, L. M., and Pöschl, U.: Critical assessment of the current state of scientific knowledge, terminology, and research needs concerning the role of organic aerosols in the atmosphere, climate, and global change, Atmos. Chem. Phys., 6, 2017–2038, https://doi.org/10.5194/acp-6-2017-2006, 2006.
Härmä, H., Tarkkinen, P., Soukka, T., and Lövgren, T.: Miniature single-particle immunoassay for prostate-specific antigen in serum using recombinant Fab fragments, Clin. Chem., 46, 1755–1761, 2000.
Hasegawa, N.: Quantitative Comparison of the Autofluorescence of Bacteria and Polystyrene Microspheres under Violet Wavelength Excitation for Verification of Fluorescence-based Bioaerosol Detector Results, Biocontrol Sci., 18, 211–215, 2013.
Healy, D. A., O'Connor, D. J., and Sodeau, J. R.: Measurement of the particle counting efficiency of the “Waveband Integrated Bioaerosol Sensor” model number 4 (WIBS-4), J. Aerosol Sci., 47, 94–99, https://doi.org/10.1016/j.jaerosci.2012.01.003, 2012.
Hennig, A., Hatami, S., Spieles, M., and Resch-Genger, U.: Excitation energy migration and trapping on the surface of fluorescent poly (acrylic acid)-grafted polymer particles, Photoch. Photobio. Sci., 12, 729–737, 2013.
Hernandez, M., Perring, A. E., McCabe, K., Kok, G., Granger, G., and Baumgardner, D.: Chamber catalogues of optical and fluorescent signatures distinguish bioaerosol classes, Atmos. Meas. Tech., 9, 3283–3292, https://doi.org/10.5194/amt-9-3283-2016, 2016.
Hiesinger, P. R., Scholz, M., Meinertzhagen, I. A., Fischbach, K., and Obermayer, K.: Visualization of synaptic markers in the optic neuropils of Drosophila using a new constrained deconvolution method, J. Comp. Neurol., 429, 277–288, 2001.
Hill, S. C., Mayo, M. W., and Chang, R. K.: Fluorescence of Bacteria, Pollens, and Naturally Occurring Airborne Particles?: Excitation/Emission Spectra, Army Research Laboratory, Applied Physics, (February), 2009.
Hill, S. C., Williamson, C. C., Doughty, D. C., Pan, Y.-L., Santarpia, J. L., and Hill, H. H.: Size-dependent fluorescence of bioaerosols: Mathematical model using fluorescing and absorbing molecules in bacteria, J. Quant. Spectrosc. Ra., 157, 54–70, https://doi.org/10.1016/j.jqsrt.2015.01.011, 2015.
Huffman, J. A. and Santarpia, J.: Online Techniques for Quantification and Characterization of Biological Aerosols, Microbiology of Aerosols, 83–114, 2017.
Huffman, J. A., Treutlein, B., and Pöschl, U.: Fluorescent biological aerosol particle concentrations and size distributions measured with an Ultraviolet Aerodynamic Particle Sizer (UV-APS) in Central Europe, Atmos. Chem. Phys., 10, 3215–3233, https://doi.org/10.5194/acp-10-3215-2010, 2010.
Huffman, J. A., Prenni, A. J., DeMott, P. J., Pöhlker, C., Mason, R. H., Robinson, N. H., Fröhlich-Nowoisky, J., Tobo, Y., Després, V. R., Garcia, E., Gochis, D. J., Harris, E., Müller-Germann, I., Ruzene, C., Schmer, B., Sinha, B., Day, D. A., Andreae, M. O., Jimenez, J. L., Gallagher, M., Kreidenweis, S. M., Bertram, A. K., and Pöschl, U.: High concentrations of biological aerosol particles and ice nuclei during and after rain, Atmos. Chem. Phys., 13, 6151–6164, https://doi.org/10.5194/acp-13-6151-2013, 2013.
Jaenicke, R.: Abundance of cellular material and proteins in the atmosphere, Science, 308, p. 73, https://doi.org/10.1126/science.1106335, 2005.
Jung, J. H., Park, S. Y., Lee, J. E., Lee, B. U., and Bae, G. N.: Distinguishing Biotic and Abiotic Particles Using an Ultraviolet Aerodynamic Particle Sizer for Real-Time Detection of Bacterial Bioaerosols, Environ. Eng. Sci., 29, 866–874, https://doi.org/10.1089/ees.2011.0276, 2012.
Kanaani, H., Hargreaves, M., Smith, J., Ristovski, Z., Agranovski, V., and Morawska, L.: Performance of UVAPS with respect to detection of airborne fungi, J. Aerosol Sci., 39, 175–189, 2008.
Katz, L. C. and Iarovici, D. M.: Green fluorescent latex microspheres: a new retrograde tracer, Neuroscience, 34, 511–520, 1990.
Kaye, P., Stanley, W. R., Hirst, E., Foot, E. V, Baxter, K. L., and Barrington, S. J.: Single particle multichannel bio-aerosol fluorescence sensor, Opt. Express, 13, 3583–3593, https://doi.org/10.1364/OPEX.13.003583, 2005.
Kaye, P. H., Barton, J. E., Hirst, E., and Clark, J. M.: Simultaneous light scattering and intrinsic fluorescence measurement for the classification of airborne particles, Appl. Opt., 39, 3738–3745, https://doi.org/10.1364/AO.39.003738, 2000.
Lakowicz, J. R.: Principles of Fluorescence Spectroscopy, Plenum publishers New York, 1999.
Li, J. K., Asali, E. C., Humphrey, A. E., and Horvath, J. J.: Monitoring cell concentration and activity by multiple excitation fluorometry, Biotechnol. Progr., 7, 21–27, https://doi.org/10.1021/bp00007a004, 1991.
Li, T., Zhou, C., and Jiang, M.: UV absorption spectra of polystyrene, Polym. Bull., 25, 211–216, 1991.
Luchtel, D. L., Boykin, J. C., Bernard, S. L., and Glenny, R. W.: Histological methods to determine blood flow distribution with fluorescent microspheres, Biotech. Histochem., 73, 291–309, 1998.
Madelin, T. M.: Fungal aerosols: A review, J. Aerosol Sci., 25, 1405–1412, https://doi.org/10.1016/0021-8502(94)90216-X, 1994.
Möhler, O., DeMott, P. J., Vali, G., and Levin, Z.: Microbiology and atmospheric processes: the role of biological particles in cloud physics, Biogeosciences, 4, 1059–1071, https://doi.org/10.5194/bg-4-1059-2007, 2007.
Morris, C. E., Conen, F., Huffman, J. A., Phillips, V., Pöschl, U., and Sands, D. C.: Bioprecipitation: a feedback cycle linking Earth history, ecosystem dynamics and land use through biological ice nucleators in the atmosphere, Glob. Change Biol., 20, 341–351, https://doi.org/10.1111/gcb.12447, 2014.
O'Connor, D. J., Healy, D. A., and Sodeau, J. R.: The on-line detection of biological particle emissions from selected agricultural materials using the WIBS-4 (Waveband Integrated Bioaerosol Sensor) technique, Atmos. Environ., 80, 415–425, 2013.
Pan, Y.-L., Hill, S. C., Pinnick, R. G., Huang, H., Bottiger, J. R., and Chang, R. K.: Fluorescence spectra of atmospheric aerosol particles measured using one or two excitation wavelengths: Comparison of classification schemes employing different emission and scattering results, Opt. Express, 18, 12436–12457, https://doi.org/10.1364/OE.18.012436, 2010.
Pellach, M., Goldshtein, J., Ziv-Polat, O., and Margel, S.: Functionalised, photostable, fluorescent polystyrene nanoparticles of narrow size-distribution, J. Photoch. Photobio. A, 228, 60–67, 2012.
Perring, A. E., Schwarz, J. P., Baumgardner, D., Hernandez, M. T., Spracklen, D. V., Heald, C. L., and Fahey, D. W.: Airborne observations of regional variation in fluorescent aerosol across the United States, J. Geophys. Res.-Atmos., 120, 1153–1170, https://doi.org/10.1002/2014JD022495, 2015.
Pöhlker, C., Huffman, J. A., and Pöschl, U.: Autofluorescence of atmospheric bioaerosols – fluorescent biomolecules and potential interferences, Atmos. Meas. Tech., 5, 37–71, https://doi.org/10.5194/amt-5-37-2012, 2012.
Pöhlker, C., Huffman, J. A., Förster, J.-D., and Pöschl, U.: Autofluorescence of atmospheric bioaerosols: spectral fingerprints and taxonomic trends of pollen, Atmos. Meas. Tech., 6, 3369–3392, https://doi.org/10.5194/amt-6-3369-2013, 2013.
Pöschl, U.: Atmospheric Aerosols: Composition, Transformation, Climate and Health Effects, Angew. Chem. Int. Edit., 44, 7520–7540, https://doi.org/10.1002/anie.200501122, 2005.
Robinson, E. S., Gao, R.-S., Schwarz, J. P., Fahey, D. W., and Perring, A. E.: Fluorescence calibration method for single-particle aerosol fluorescence instruments, Atmos. Meas. Tech., 10, 1755–1768, https://doi.org/10.5194/amt-10-1755-2017, 2017.
Robinson, N. H., Allan, J. D., Huffman, J. A., Kaye, P. H., Foot, V. E., and Gallagher, M.: Cluster analysis of WIBS single-particle bioaerosol data, Atmos. Meas. Tech., 6, 337–347, https://doi.org/10.5194/amt-6-337-2013, 2013.
Savage, N. J., Krentz, C. E., Könemann, T., Han, T. T., Mainelis, G., Pöhlker, C., and Huffman, J. A.: Systematic characterization and fluorescence threshold strategies for the wideband integrated bioaerosol sensor (WIBS) using size-resolved biological and interfering particles, Atmos. Meas. Tech., 10, 4279–4302, https://doi.org/10.5194/amt-10-4279-2017, 2017.
Schneider, C. A., Rasband, W. S., and Eliceiri, K. W.: NIH Image to ImageJ: 25 years of image analysis, Nat. Methods, 9, 671–675, 2012.
Schwartz, A., Marti, G. E., Poon, R., Gratama, J. W., and Fernández-Repollet, E.: Standardizing flow cytometry: a classification system of fluorescence standards used for flow cytometry, Cytometry, 33, 106–114, 1998.
Sinski, J. F. and Exner, J.: Concentration dependence in the spectra of polycyclic aromatic hydrocarbon mixtures by front-surface fluorescence analysis, Appl. Spectrosc., 61, 970–977, 2007.
Sivaprakasam, V., Lin, H.-B., Huston, A. L., and Eversole, J. D.: Spectral characterization of biological aerosol particles using two-wavelength excited laser-induced fluorescence and elastic scattering measurements, Opt. Express, 19, 6191–6208, https://doi.org/10.1364/OE.19.006191, 2011.
Spiro, A., Lowe, M., and Brown, D.: A bead-based method for multiplexed identification and quantitation of DNA sequences using flow cytometry, Appl. Environ. Microbiol., 66, 4258–4265, 2000.
Stanley, W. R., Kaye, P. H., Foot, V. E., Barrington, S. J., Gallagher, M., and Gabey, A.: Continuous bioaerosol monitoring in a tropical environment using a UV fluorescence particle spectrometer, Atmos. Sci. Lett., 12, 195–199, https://doi.org/10.1002/asl.310, 2011.
Swanson, B. E. and Huffman, J. A.: Development and characterization of an inexpensive single-particle fluorescence spectrometer for bioaerosol monitoring, Opt. Express, 26, 3646–3660, 2018.
Toprak, E. and Schnaiter, M.: Fluorescent biological aerosol particles measured with the Waveband Integrated Bioaerosol Sensor WIBS-4: laboratory tests combined with a one year field study, Atmos. Chem. Phys., 13, 225–243, https://doi.org/10.5194/acp-13-225-2013, 2013.
Zepp, R. G., Sheldon, W. M., and Moran, M. A.: Dissolved organic fluorophores in southeastern US coastal waters: correction method for eliminating Rayleigh and Raman scattering peaks in excitation–emission matrices, Mar. Chem., 89, 15–36, 2004.
Subsequently, the term “main mode” will be used describing the emission signals with a small Stokes shift and the term “minor mode” the emission signals with a large Stokes shift.
fluorescence landscapeof PSLs is more complex than the information provided by manufacturers may imply. By understanding general fluorescence properties of PSLs, individual researchers may probe specific spectral features important to the operation of their own instruments.