the Creative Commons Attribution 4.0 License.
the Creative Commons Attribution 4.0 License.
 | 30 Oct 2018
Potential of INSAT-3D sounder-derived total precipitable water product for weather forecast
Ashim Kumar Mitra
Mrutyunjay Mohapatra
Rajjev Bhatla
The objectives of the INSAT-3D satellite are to enhance the meteorological observations and to monitor the Earth's surface for weather forecasting and disaster warning. One of the weather-monitoring capabilities of the INSAT-3D sounder is the estimation of water vapour in the atmosphere. The amount of water vapour present in the atmospheric column is derived as the total precipitable water (TPW) product from the infrared radiances measured by the INSAT-3D sounder. The present study is based on TPW derived from INSAT-3D sounder, radiosonde (RS) observations and the corresponding National Oceanic and Atmospheric Administration (NOAA) satellite. To assess retrieval performances of INSAT-3D sounder-derived TPW, RS TPW observations are considered for the validation from May to September 2016 from 34 stations belonging to the India Meteorological Department (IMD). The analysis is performed on daily, monthly, and subdivisional bases over the Indian region. The comparison of INSAT-3D TPW with RS TPW on daily and monthly bases shows that the root mean square error (RMSE) and correlation coefficients (CC) are ∼8 mm and 0.8, respectively. However, on subdivisional and overall scales, the RMSE found to be in the range of 1 to 2 mm and CC was around 0.9 in comparison with RS and NOAA. The spatial distribution of INSAT-3D TPW with actual rainfall observation is also investigated. In general, INSAT-3D TPW corresponds well with rainfall observation; however, it has found that heavy rainfall events occur in the presence of high TPW values. In addition, the cases of thunderstorm events were assessed using TPW from INSAT-3D and network of Global Navigation Satellite System (GNSS) receiver. This shows the good agreement between TPW from INSAT-3D and GNSS during the mesoscale activity. The improvement in the estimation of TPW is carried out by applying the GSICS calibration corrections (Global Space-based Inter-Calibration System) to the radiances from infrared (IR) channels of the sounder, which is used by IMDPS (INSAT Meteorological Data Processing System). The current TPW from INSAT-3D satellite can be utilized operationally for weather monitoring and forecast purposes. It can also offer substantial opportunities for improvement in nowcasting studies.
- Article
(3046 KB) - Full-text XML
- BibTeX
- EndNote


Water vapour is one of the most variable quantities in the troposphere, playing a crucial role in the climate and weather. It regulates air temperature by absorbing thermal radiation both from the Sun and the Earth; it is directly proportional to the latent energy available for the generation of storms; and it is the ultimate source of all forms of condensation and precipitation. Latent heat released during cloud formation dominates the structure of diabatic heating of the atmosphere (Trenberth et al., 2005; Trenberth and Stepaniak, 2003a, b). The observations of TPW are essential for weather, climate modelling, and prediction. The TPW may be used for monitoring the mesoscale to synoptic-scale convective activity, monsoonal activities, and moisture gradients. It has shown a significant improvement in precipitation forecasts when TPW is incorporated in the numerical weather prediction models (Kuo et al., 1996). Utilizing the TPW data, Yuan et al. (1993) showed an increment of ∼8 mm in the tropical TPW resulting from doubling of atmospheric CO2. The water vapour varies in time and in space (both vertically and horizontally) and the gaps in the observations makes its use impossible for climate and weather forecasting/nowcasting related studies (Trenberth and Olson, 1988). This could be possible with higher temporal and spatial resolution of accurate temperature and moisture profiles, either from in situ observations or remotely sensed data. Recently, The Sounder for Atmospheric Profiles of Humidity in the Inter-tropical Regions (SAPHIR) on board the Megha-Tropiques satellite has made the relative humidity (RH) profiles available in the tropical latitudes (Ratnam et al., 2013). SAPHIR has good spatial coverage with limited temporal resolution.
The products, especially the retrievals of vertical profiles of temperature and humidity, from the sounder of the INSAT-3D satellite are important in weather monitoring and forecasting in the study of mesoscale weather phenomena. The higher ground resolution of 30 km and high vertical resolution (about 5 km) along with hourly observations from INSAT-3D sounder provide frequent information on the 3-D structure of atmospheric temperature and humidity for the whole Earth disk seen by the satellite (except in and below clouds). They could be used together with the imagers to produce high-resolution cloud detection or water vapour features, used to track rapidly evolving phenomena. However, the INSAT-3D sounder observations of TPW are limited for sky conditions (Venkat Ratnam et al., 2016).
In the present study, the TPW derived from INSAT-3D sounder is statistically compared with radiosonde observations and NOAA satellite data over the period May to September 2016. The purpose of this comparison is to investigate the potential of the operational hourly TPW product for the monitoring of weather phenomenon over the Indian region. However, initial work using INSAT-3D sounder data was carried out by Mitra et al. (2015), showing the comparison of INSAT-3D data with RS observations from 10 IMD stations (India Meteorological Department). Utilizing the RS observations from 34 stations and data from ERA-Interim, NCEP reanalysis and other satellites like AIRS, MLS, and SAPHIR, Venkat Ratnam et al. (2016) showed reasonable agreement among these data sets. It is shown that there is a large difference between INSAT-3D and other data sets, both in temperature and water vapour above 25∘ N latitude, perhaps due to differences in their geometries (Venkat Ratnam et al., 2016). In the present paper, we extended the work with 34 RS stations and taking NOAA data on daily, monthly, and subdivisional scales followed by the case studies of thunderstorm events with an IMD-installed network of GNSS TPW. Furthermore, the spatial distribution of INSAT-3D TPW with an actual rainfall observation has also been investigated.
2.1 INSAT-3D sounder scan processing strategy
2.1.1 INSAT-3D sounder specification
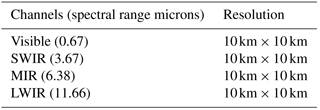
INSAT-3D is an advanced weather satellite with improved imaging system and atmospheric sounding. The observations of INSAT-3D sounder are utilized to retrieve the vertical profile of the atmosphere in terms of temperature and humidity. INSAT-3D sounder has one visible spectral channel and 18 channels in shortwave infrared (SWIR), middle infrared (MIR) and longwave infrared (LIR) regions. For all the channels, the ground resolution is 10 km×10 km. Further details of the INSAT-3D sounder can be found in Mitra et al. (2015).
2.1.2 INSAT-3D sounder scan processing strategy
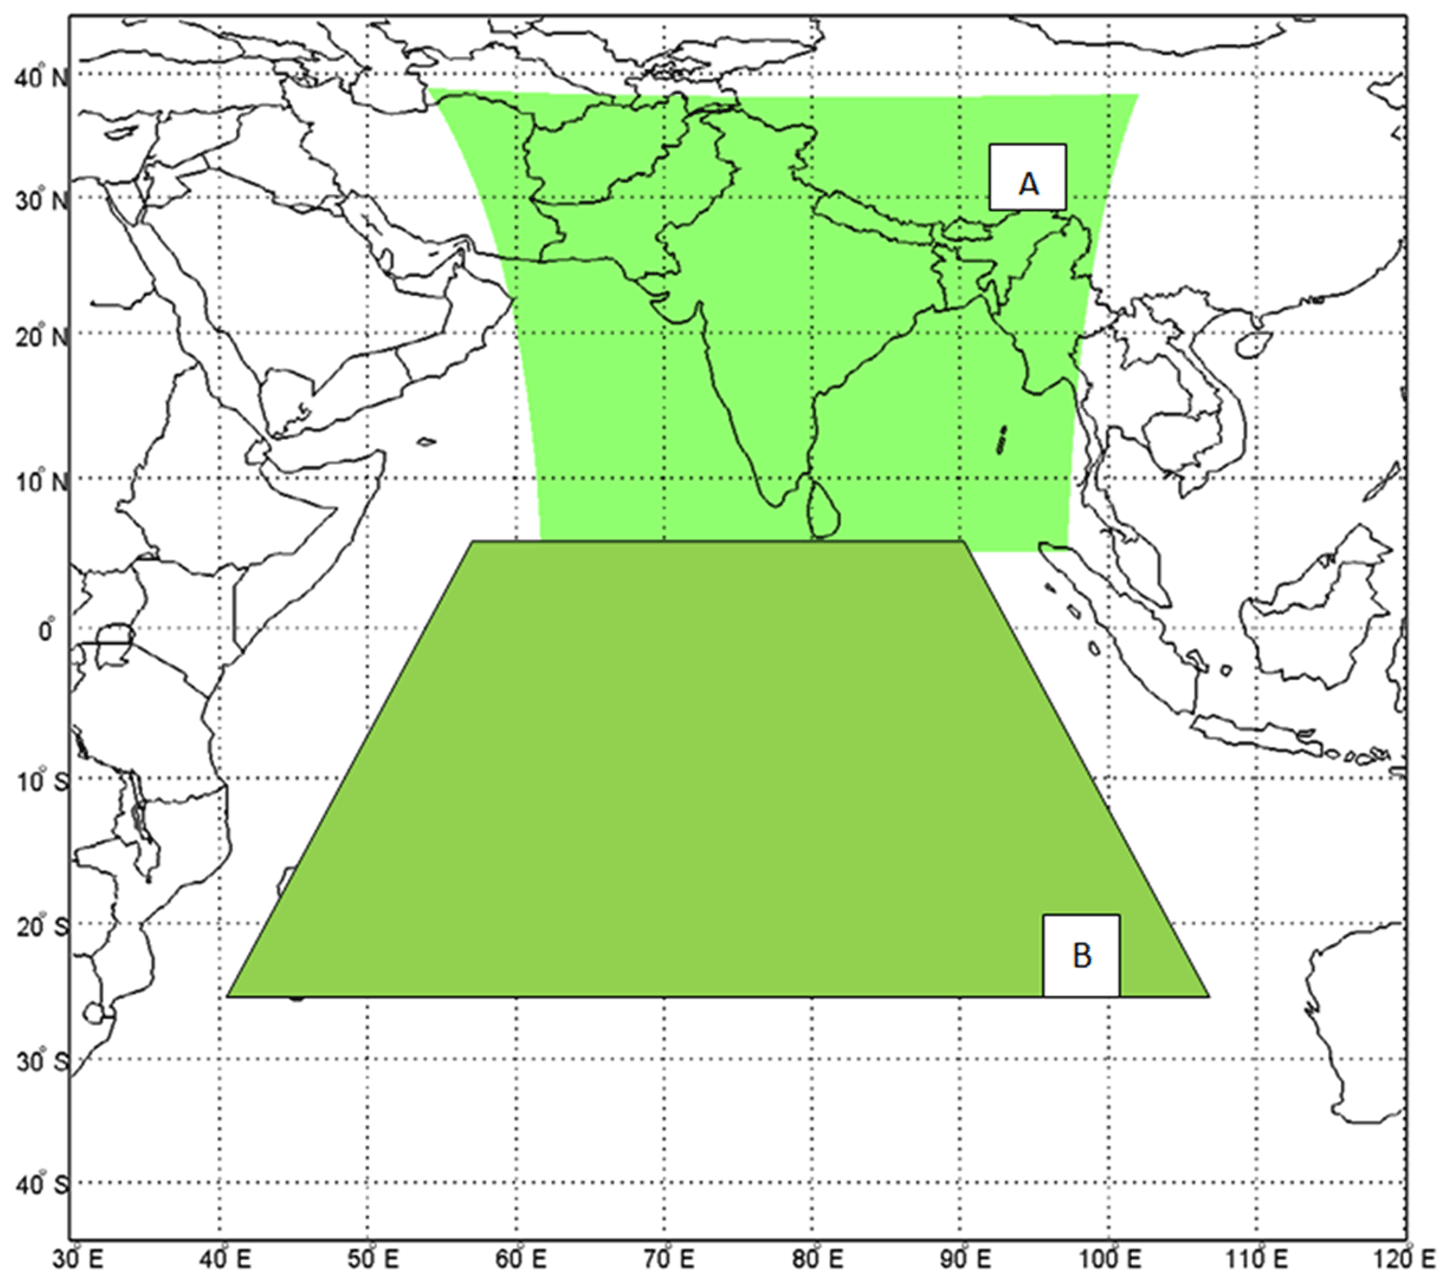
INSAT-3D scans in the full frame mode, which is north–south (NS), covering the entire Earth disc in about 25.7 min. Figure 1 shows the areas over the Indian land mass (A) and over the Southern Hemisphere (B), over which the sounder data is being processed by IMDPS (Meteorological Data Processing System), New Delhi on an operational basis. While the Indian land mass is scanned every hour, there is a 6 h interval for the southern hemispheric area. This simple scanning strategy is kept in such a way that sounding over a larger region (land and ocean) will be available every hour. The sounder completes the sounding of a 10 km×10 km area in 0.1 s and performs a space-looking procedure once every 2 min. Black-body calibration is performed every 20 min or on command. The INSAT-3D sounder has the capability to scan in steps of 64×64 pixels. Scanning a region covering 640×640 pixels that is roughly 6400 km×6400 km takes ∼180 min. The benefit of this kind of scan strategy can be utilized for studies of initial convection, and genesis of evolution of squall lines and their fine structures (Purdom et al., 1996a). The INSAT-3D sounder scan strategy can be used for nowcasting and NWP (numerical weather prediction) model assimilation over the Indian region.
2.2 Radiosonde observations (RS)
In IMD, upper-air observations are made at 43 RS stations, 34 RS stations are being used and 62 pilot balloon observatories to provide pressure, temperature, humidity and wind at various levels in the atmosphere up to an altitude of 30–35 km. Figure 2 shows the location (marked in red) of 34 RS stations. Observations from these stations are utilized for the comparison with INSAT-3D TPW. The types of ground equipment used in RS observatories are (1) Radiosonde Ground equipment (ECIL/DIGITAL) along with X band Win, (2) d finding Radars (EEC/MULTIMET) at 401 MHz and (3) IMS-1500 Radiotheodolite at 1680 MHz and SAMEER Radiotheodolite at 401 MHz. The performance of IMD's GPS radiosonde stations has been very thoroughly examined using ECMWF global data (Kumar et al., 2011).
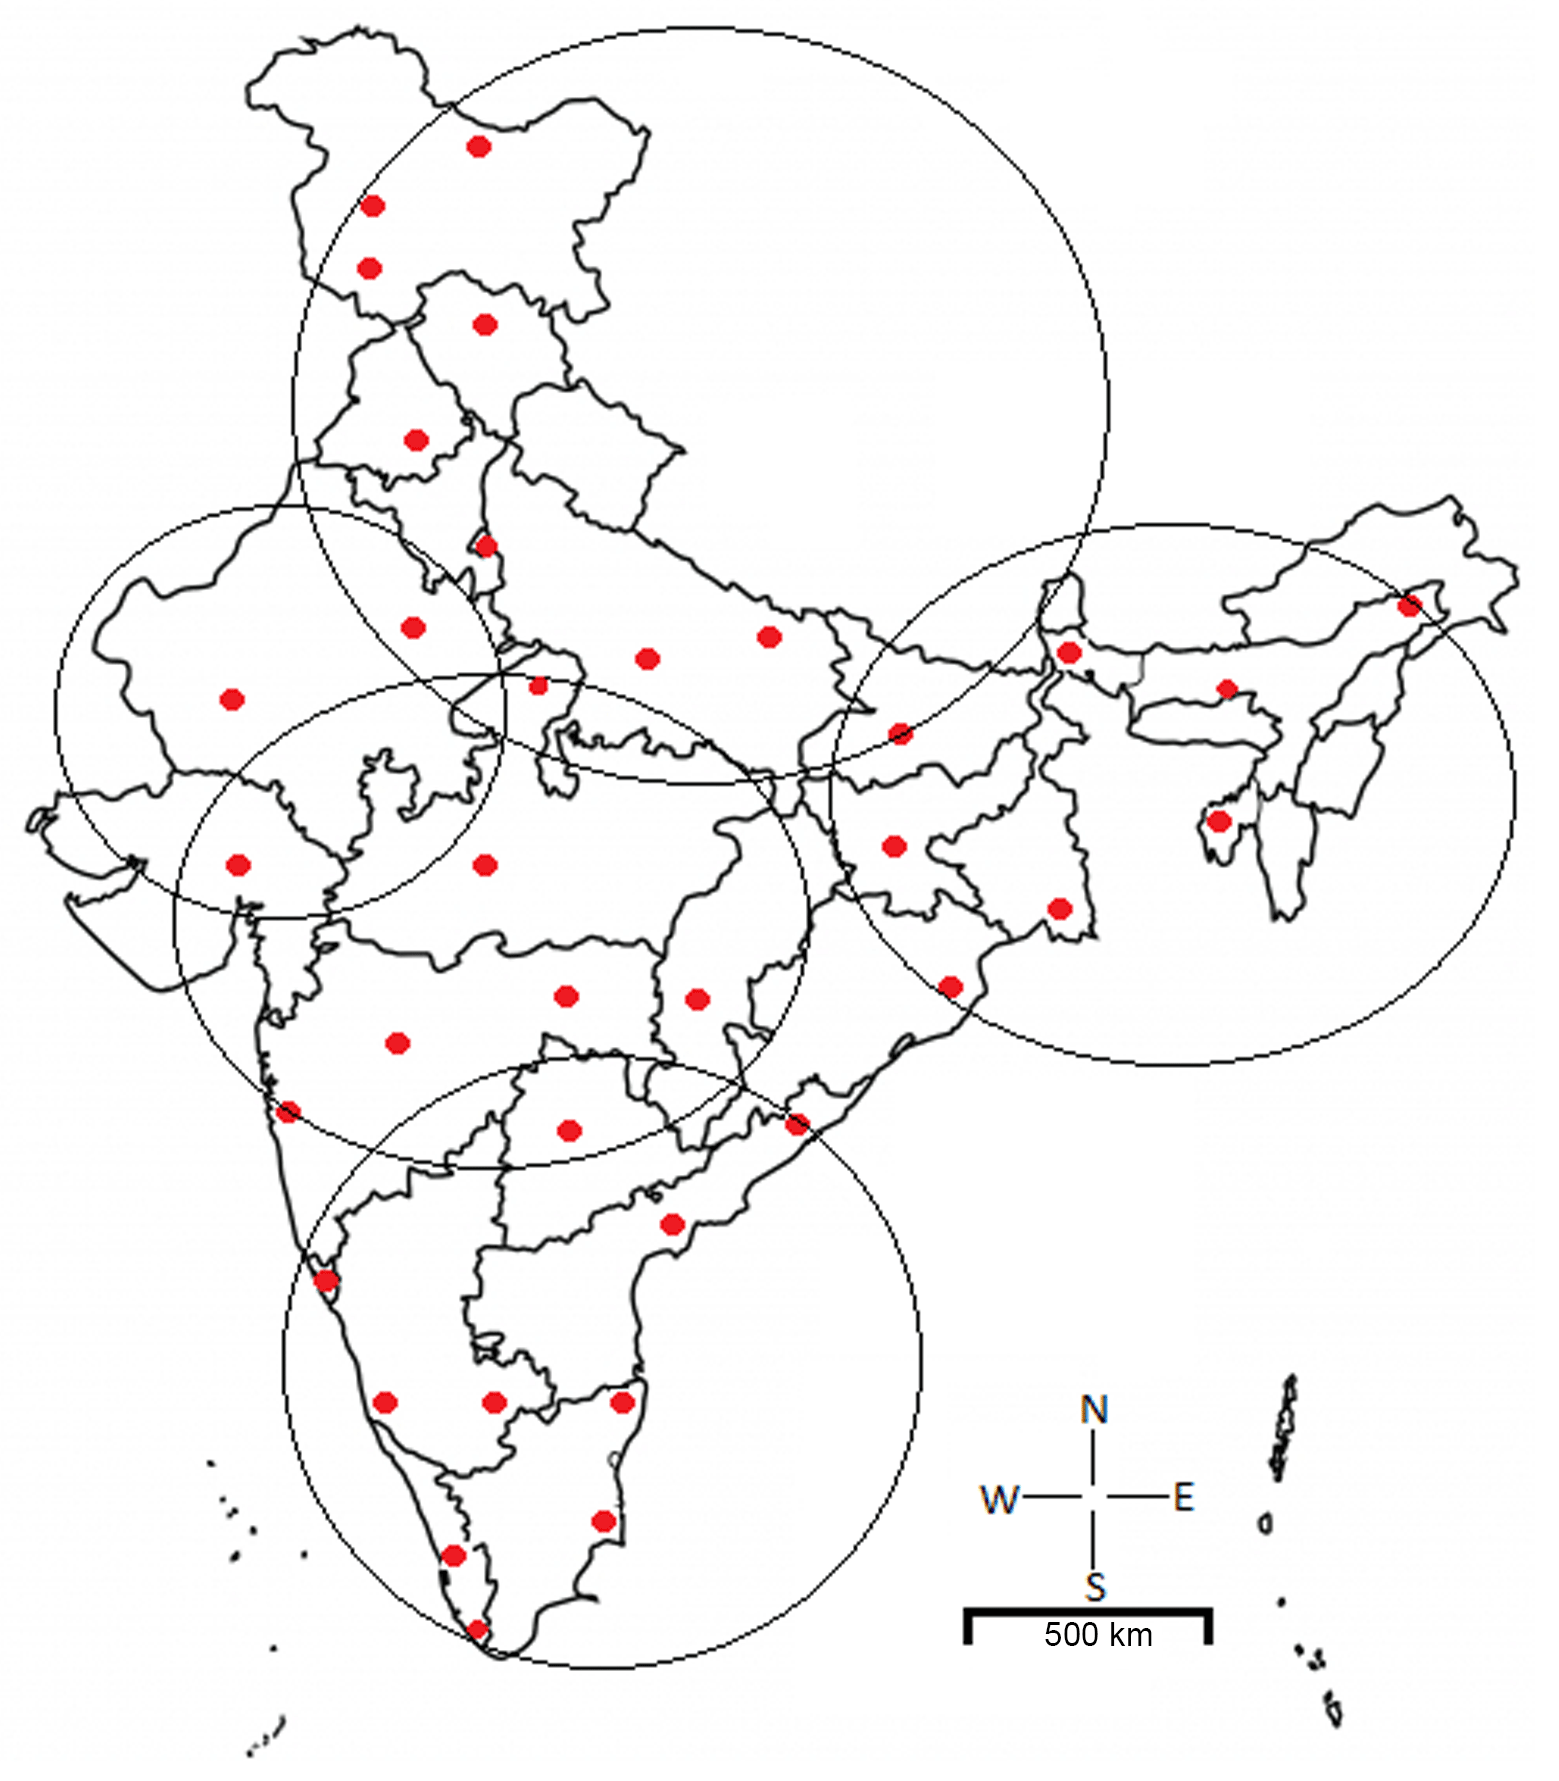
Figure 2Radiosonde stations (red dots) of IMD over India. Areas marked with ellipses represent different subdivisions.
2.3 Global Navigation Satellite System (GNSS)
IMD is augmenting Integrated Network of Global Navigation Satellite System (GNSS) receivers from 5 to 30 for integrated precipitable water vapour (IPWV) measurements. The network is capable of using other GNSS network data of research institutes in real-time basis for enhancing data spatial density and processing. The equipment has advanced meteorological sensors to measure the temperature, pressure, and humidity of the station and is capable of working independently in all-weather conditions with a high temporal resolution. Though satellites do not often fail, if one does, GNSS receivers can pick up signals from other satellites of the system. The data can be found from http://gnss.imd.gov.in/TrimblePivotWeb/ (last access: 18 October 2018).
2.4 NOAA satellite observation
The NOAA (National Oceanic and Atmospheric Administration) Satellite and Information Service provides timely access to global environmental data from satellites and other sources to monitor and understand the atmospheric variation over the Earth in efficient manner. In this study, we used blending TPW from two satellite sources, one from the Advanced Microwave Sounding Unit (AMSU) instruments on NOAA satellites (Ferraro et al., 2005) and the other from the Special Sensor Microwave Imager (SSM/I) instruments on Defence Meteorological Satellite Program (DMSP) satellites. In the blended TPW product, individual biases of the data sources have been mitigated to produce a more meteorologically significant product. A blending retrieval procedure was detailed (Kidder et al., 2007) and the methodology provides seamless global coverage without gaps to allow for the analysis of atmospheric moisture over land and ocean (Schmit et al., 2002; Smith et al., 2007). The products are on a Mercator projection with 16 km resolution at the Equator. The products are hourly in a HDF-EOS file format. These operational products were produced by the NOAA/NESDIS (National Environmental Satellite, Data, and Information Service) Office of Satellite and Product Operations (OSPO).
2.5 GSICS-based intercalibration
There is an on-board black body, which is responsible for generation of calibration information for all the IR channels in the geostationary satellite sounder. In-orbit readings of black-body temperatures revealed a gradient among the sensor, which led to inaccuracy in getting the correct black-body temperature. It was also observed that, during satellite midnight, Sun rays from behind the Earth directly enter the sensor and lead to an increase in black-body temperatures. This phenomenon leads to generation of incorrect calibration information. In order to provide climate quality products and to improve the calibration coefficients, GSICS (Global Space based Intercalibration System)-based intercalibration is used for INSAT-3D. The GSICS aims to intercalibrate a diverse range of satellite instruments to produce corrections ensuring consistency in satellite data sets. Allowing usage of calibration data, it produces globally homogeneous products for environmental monitoring. In addition, GSICS develops common methodologies to check the quality of sensors operated by various satellite agencies over the worldwide. The post-launch calibration strategy involves spectral response function of sensors, sensor performances and intercalibration of satellite sensor. Finally, recalibration of archived data or products of sensors is carried out, if necessary. The GSICS corrections are routinely applied in the IMDPS system of IMD by SAC (ISRO). The channelwise GSICS coefficients are found and applied during the radiometric correction process.
INSAT-3D retrieval algorithm under IMDPS at New Delhi is designed for retrieving vertical profiles of atmospheric temperature and moisture from clear-sky infrared radiances measured over different absorption bands (http://satellite.imd.gov.in/dynamic/INSAT3D_Catalog.pdf, last access: 18 October 2018). The observed radiance in various sounder channels is processed on an hourly timescale. IMD, New Delhi has adapted the sounder retrieval scheme from the operational High-Resolution Infrared Radiation Sounder (HIRS) processing scheme and Geostationary Operational Environmental Satellites (GOES) algorithms developed by Cooperative Institute for Meteorological Satellite Studies (CIMSS), University of Wisconsin, USA (Ma et al., 1999; Li et al., 2000). In this scheme, physical and regression-based retrievals are employed, which include spectral bands in and around the CO2 and H2O absorbing bands. In the scheme, computation of the hybrid first-guess atmospheric profiles uses a linear combination of a regression retrieval and NWP model forecast (Mitra et al., 2015). The methodology is followed by a non-linear physical retrieval procedure (Li et al., 2000; Ma et al., 1999) for consistency with the sounder observations. The Pressure-Layer Fast Algorithm for Atmospheric Transmittance (PFAAST) radiative transfer model (Hannon et al., 1996) has been used for forward computation of sounder channel radiances along with Jacobians. As mentioned before, GSICS corrections have incorporated in the INSAT-3D sounder radiances.

Mathematically, if a(p) is the mixing ratio at the pressure level, p, then the precipitable water vapour W, contained in a layer bounded by pressures p1 and p2 is given by
where ρ represents the density of water and g is the gravity constant (9.8 m s−2). Further details can be found at http://satellite.imd.gov.in/dynamic/INSAT3D_Catalog.pdf (last access: 18 October 2018).
The each RS observation was paired with closest INSAT-3D TPW and patterned according to criteria suggested in Fuelberg and Olson (1991). The collocation criteria for INSAT-3D retrievals with RS and NOAA data are based on the following. (1) The absolute distance between the position (latitude and longitude) of the RS and the INSAT-3D retrievals is 0.5∘ (50 km) or smaller. This will minimize the differences arising from horizontal gradients in water vapour or TPW. (2) The temporal difference between two sets of data is around ±120 min depending on retrievals and location of the RS station. (3) The timing of INSAT-3D and RS observations was matched at 00:00 and 12:00 UTC.
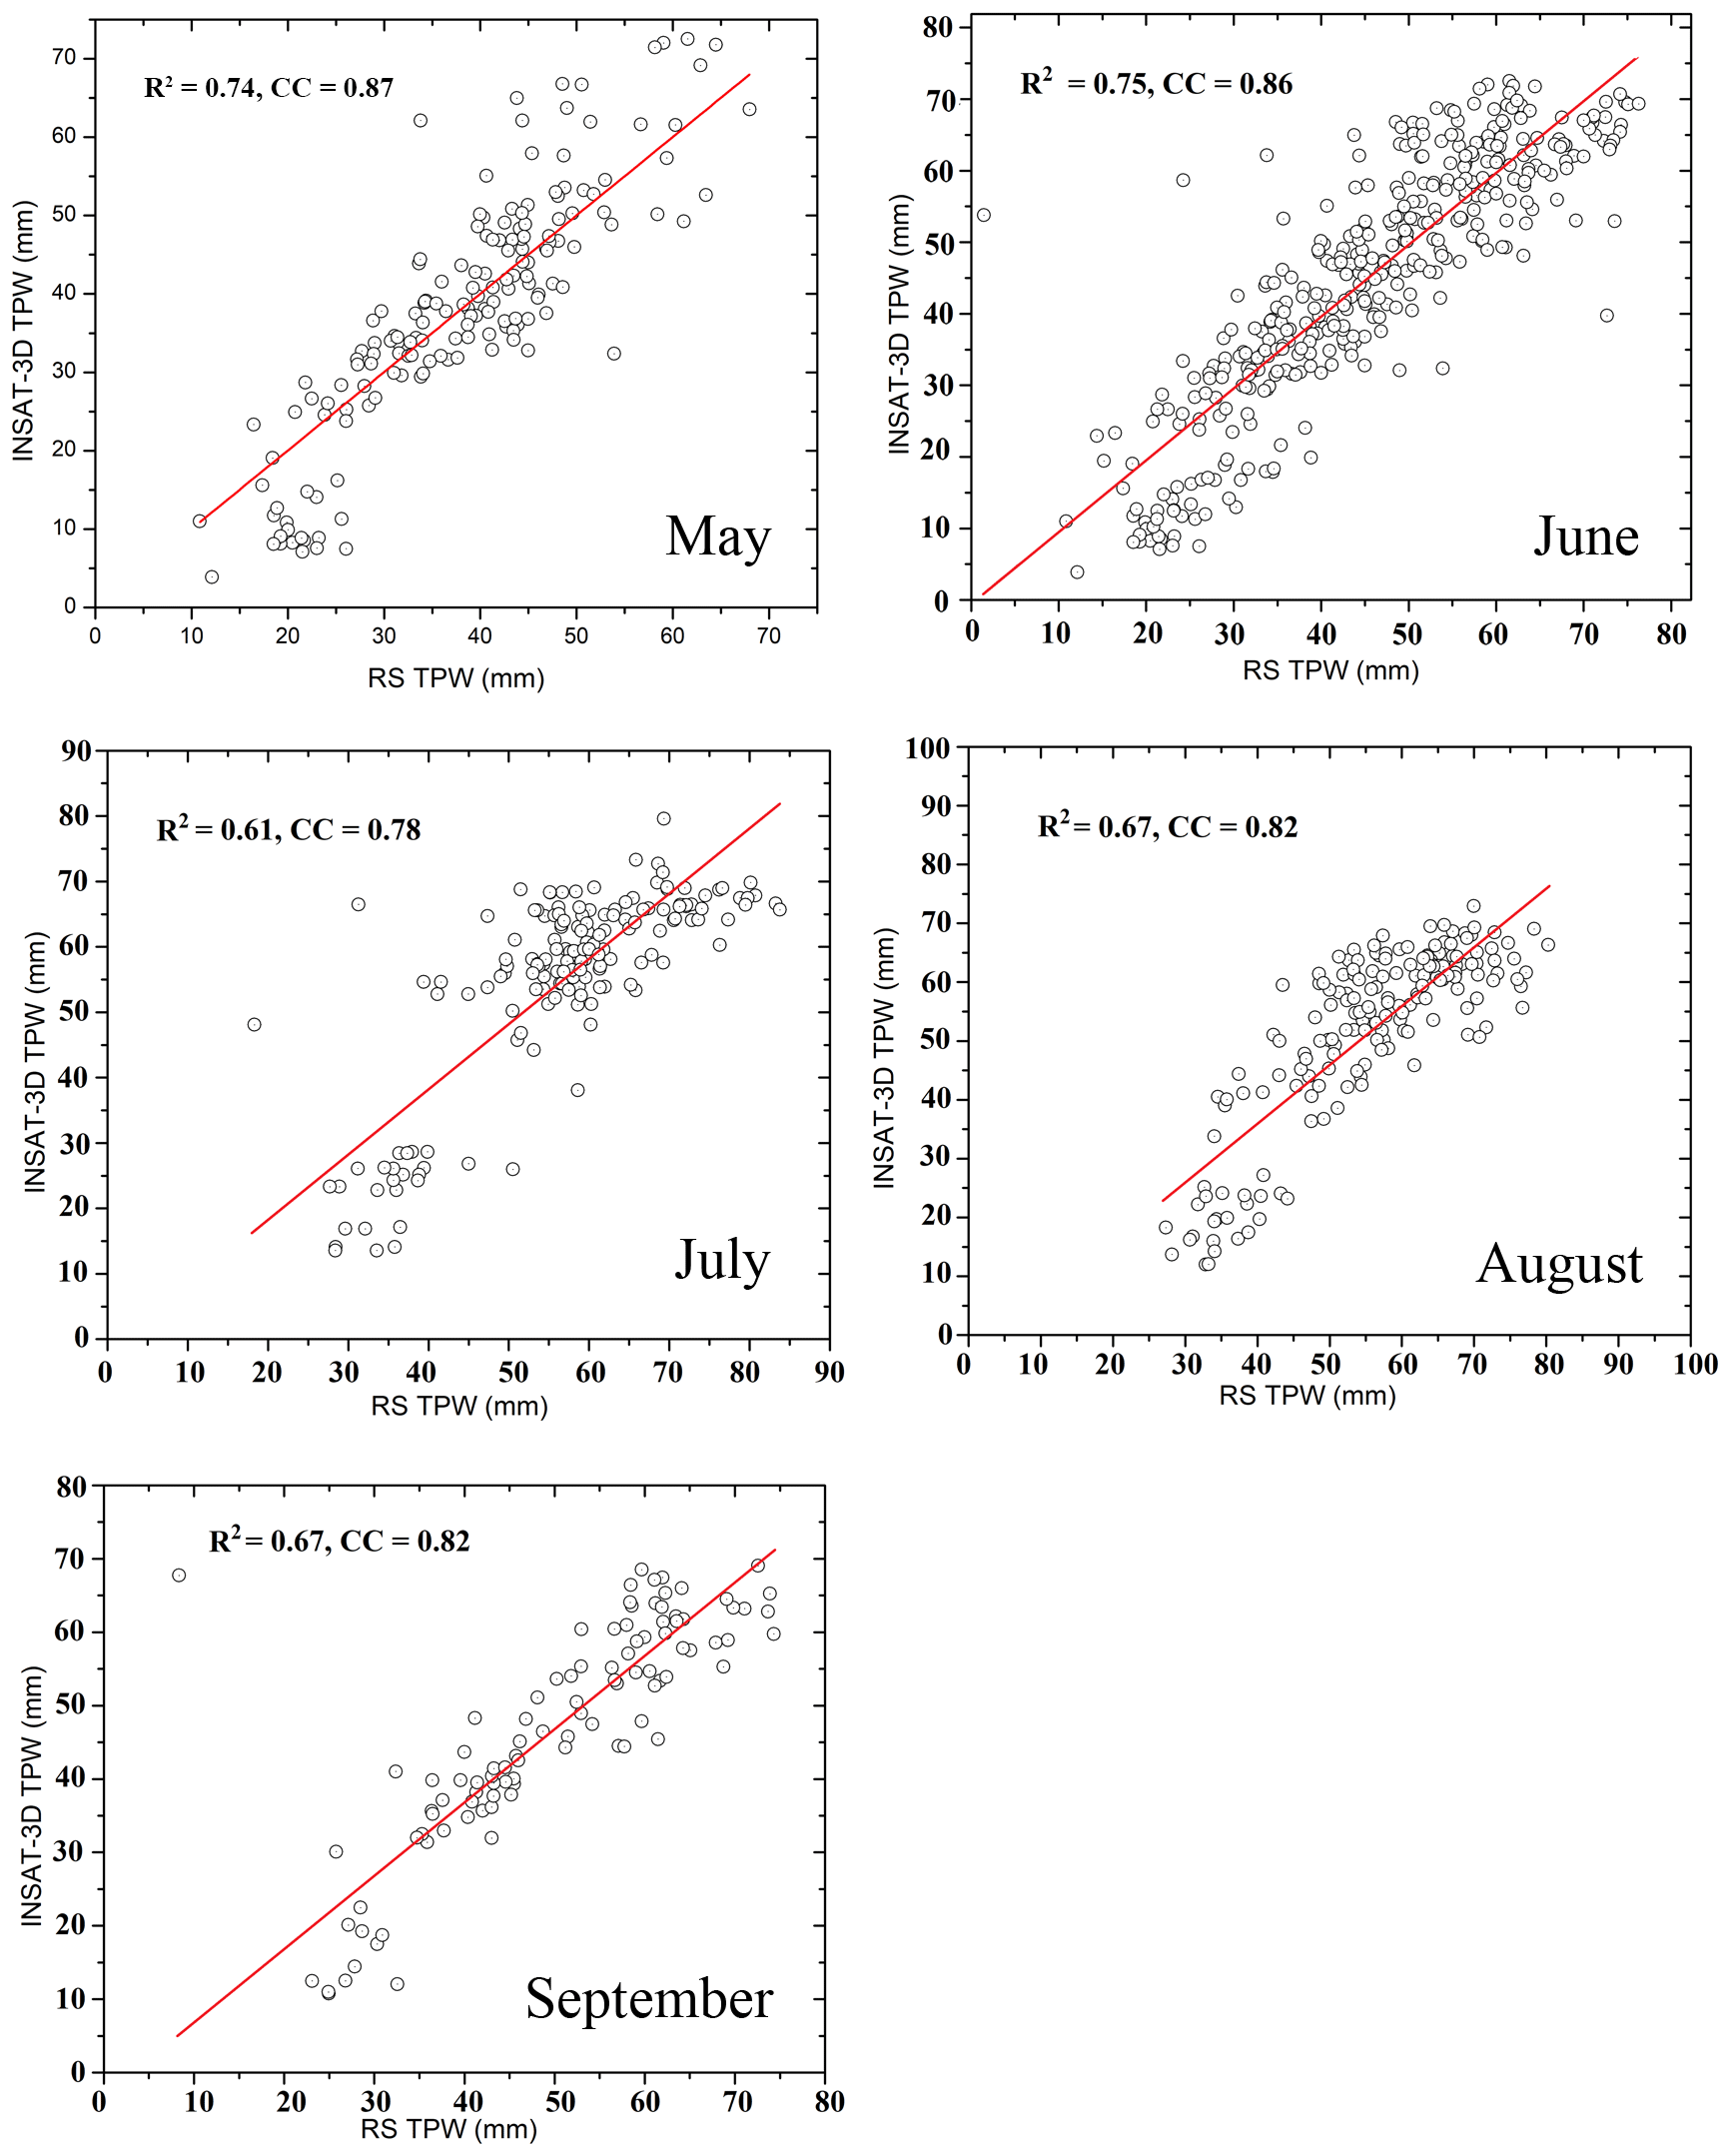
Figure 4Comparison of INSAT-3D-derived TPW with RS-observed TPW for May, June, July, August, and September 2016.
4.1 Comparison of INSAT-3D with RS and NOAA TPW at daily, monthly, and subdivision scales
INSAT-3D-derived TPW is available at hourly interval over the Indian region. For validation purposes of TPW and its usefulness in weather monitoring and forecast, it is desirable to compare INSAT-3D TPW at different timescales with different sets of data. Thus, on a daily scale, we compared the INSAT-3D TPW with all the collocated measurements of RS TPW. On a monthly scale, monthly averaged data on collocated points were used. For the subdivision scale, five different regions were categorized according to meteorological subdivisions: northern India (NI), eastern India (EI), central India (CI), western India (WI) and peninsular India (PS) (Fig. 2).
Table 2Statistics and correlation between total precipitable water measured by INSAT-3D and RS.
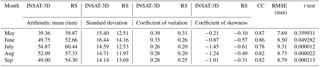
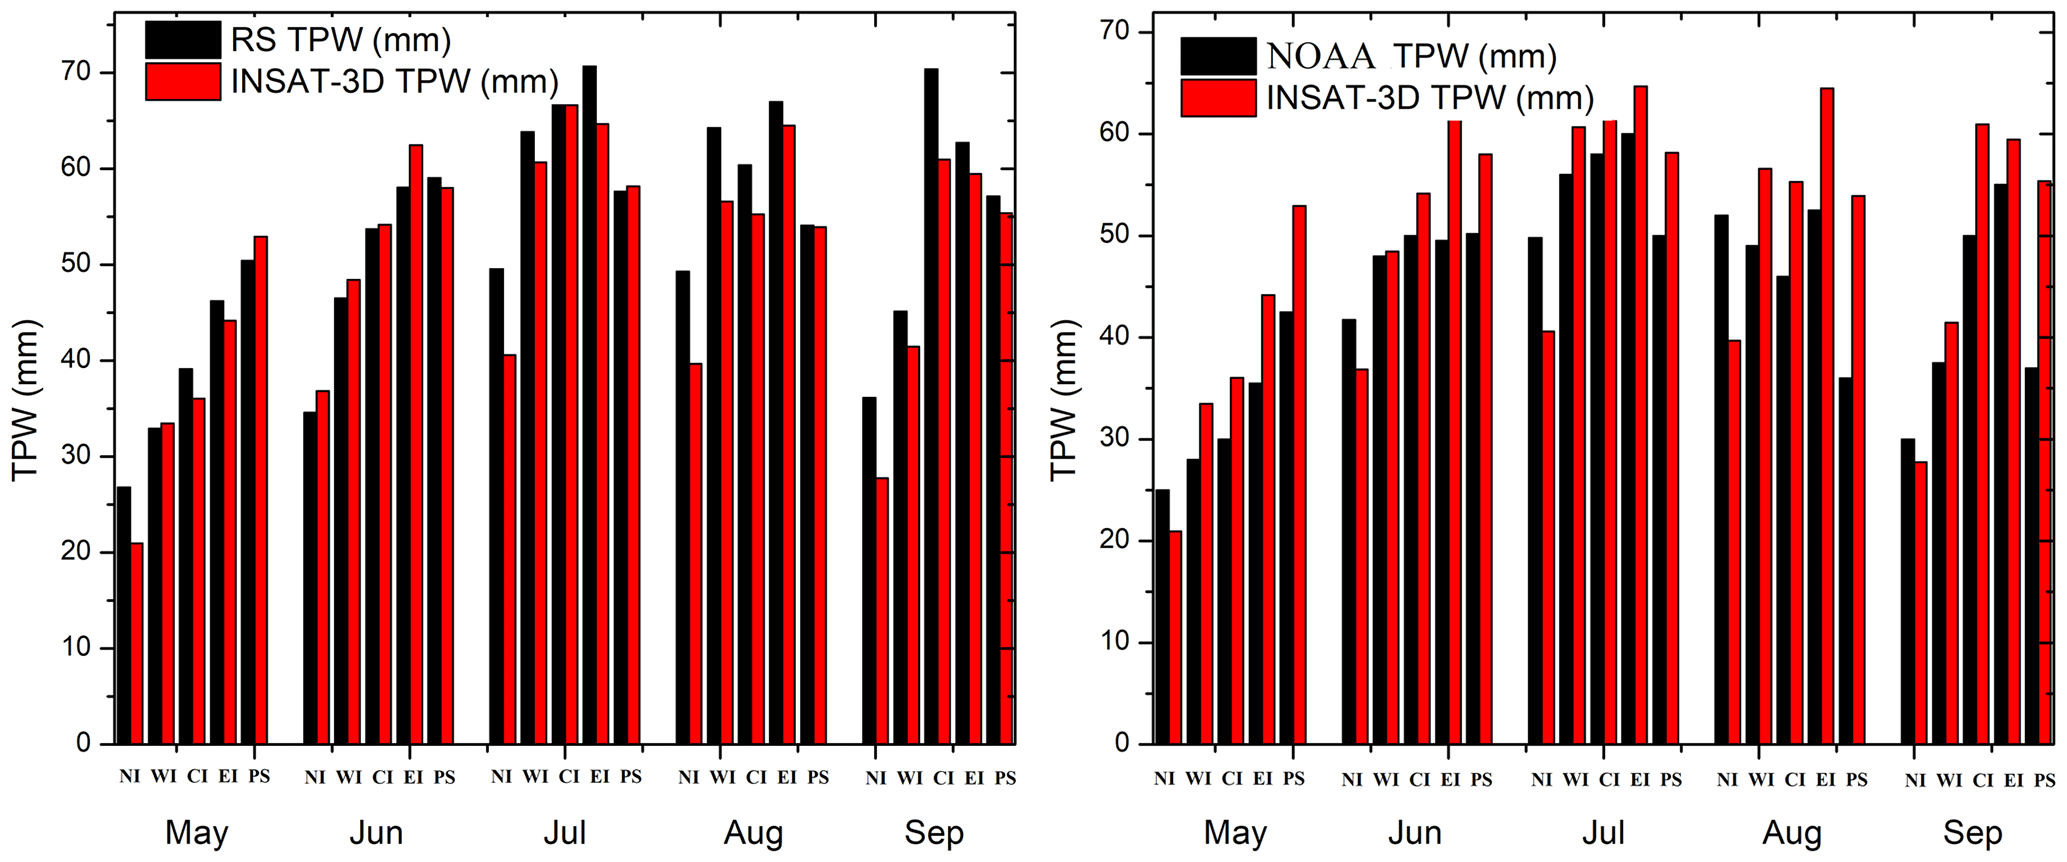
Figure 5Comparison of INSAT-3D-derived TPW with RS- and NOAA-observed TPW at subdivision scales NI, WI, CI, WI, and PS from May to September 2016.
Figure 3 shows the comparison of INSAT-3D and RS TPW on a daily scale during May–September 2016. On a day-to-day basis, INSAT-3D TPW agrees well with RS TPW. INSAT-3D TPW is able to measure the synoptic features of weather phenomena on a monthly scale over the Indian region very well. However, the magnitude differs, it can be termed as source of error due to registration and navigation issues at night-time. The more consistent and better correlation was seen above 40 mm, whereas for TPW values less than 40 mm, INSAT-3D underestimates slightly. This might be attributed to seasonal variation, topography of the region, and different climatic zones across India. The largest differences are observed mainly over mountainous areas and/or near the sea, which reveal differences in representativeness. Good confidence in INSAT-3D TPW estimates is gained during periods of moderate to heavy rain. The overall correlation on a daily scale was found to be 0.86. In a previous study, Mitra et al. (2015) reported 0.73 correlations using 10 IMD stations.
Figure 4 shows the comparison of INSAT-3D and RS TPW on a monthly scale during May–September 2016. The correlation coefficients are in the range of 0.78–0.87. It can be noted that, during the monsoon period, especially in the months of June, July, and August, when heavy rainfall (above 64.5 mm) occurs, INSAT-3D TPW shows good agreement with RS TPW. Mostly INSAT-3D TPW is higher when rainfall occurrence is higher above 40 mm. The statistics corresponding to this comparison is shown in Table 2. INSAT-3D coefficients of variation are high compared with RS, which indicates the higher variability in total precipitable water. The mean difference between RS and INSAT-3D TPW is much higher in the month of July, at 5.57 mm. It is due to the substantial rainfall during the monsoon season and in the subsequent months of August and September is 5.24 and 5.3 mm. It was also reported by Venkat Ratnam et al. (2016) that mean differences in the water vapour are as high as 20 %–30 %. The dry bias of 10 %–25 % in the INSAT-3D channel was compared to a similar satellite and the reanalysis data set was also noted. The coefficient of variation is lower for the months from July to September 2016. The coefficient of skewness is found to be negative between the INSAT-3D and RS measurements, which indicates that the mean is less than the mode of the data. The correlation coefficient shows good agreement with RMSE from June to September 2016, except in the month of July. The Student's t test is calculated for the significance of the computed parameter. The Student's t test shows the statistical significance of a linear relationship among the data, i.e. INSAT-3D and RS TPW.
Figure 5 shows the comparison of INSAT-3D with RS and NOAA TPW on a subdivisional scale from May to September 2016. It can be clearly seen from the figures that INSAT-3D TPW underestimates RS TPW, whereas it overestimates the NOAA TPW for the entire region during the monsoon period. A good correlation is observed for the regions CI and PS compared to EI and NI. However, opposite trends were found while comparing INSAT-3D with NOAA TPW. INSAT-3D TPW is always higher over NOAA TPW data. One of the possible reasons is that INSAT-3D sounder-derived TPW was calculated from the radiances sampled every hour, while NOAA TPW were based on only two satellite passes with Equator crossing times of 02:30 and 14:30 LT (in Indian Standard Time). Therefore, the sampling frequency of the radiometer is much higher in a geostationary satellite than a polar satellite. In general, subdivisional comparison reveals that the INSAT-3D TPW agrees well with RS and NOAA TPW below 23∘ N, whereas the difference is higher above 23∘ N.
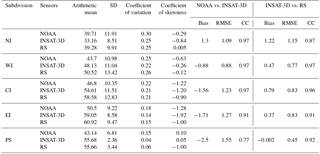
Table 3 shows the statistics for the comparison of TPWs from INSAT-3D, RS, and NOAA at the subdivisions over India. INSAT-3D coefficients of variation are similar to those of RS, but in the case of NOAA they are higher with respect to INSAT-3D and RS. This might be attributed to the lower number of correlated points in the data set. The coefficient of skewness values was found to be negative for INSAT-3D, RS, and NOAA measurements. The correlation coefficients of TPWs were found to be in good agreement for INSAT-3D and NOAA (0.96) as well as for INSAT-3D and RS (0.87) from June to September 2016.
Table 3Statistics of INSAT-3D-derived-, RS-, and NOAA-observed TPW subdivision scales of India.
4.2 Comparison of INSAT-3D TPW with actual rainfall observation
The box–whisker plot shown in Fig. 6 compares the actual rainfall observation and INSAT-3D TPW for different values from June to September 2016. This figure is constructed from the daily rainfall observations of between 0 to 140 mm occurring over the 34 stations and collocated mean INSAT-3D TPW values between 0 and 90 mm over the entire Indian region. It can be seen from Fig. 6 that TPW is binned for the ranges 0–20, 21–40, 41–60, 61–81, and > 80. As seen from the whiskers, the rainfall has the least scatter for the 0–20 bin, while for TPW > 80 it shows the most scatter. The mean and median are almost the same for all the TPW bins, except for the TPW > 80. There exists exponential behaviour between rainfall amounts with higher INSAT-3D TPW values. However, further analysis with a higher number of observations is required for the quantification of a non-linear or exponential relationship. Atmospheric constituents and synoptic scale of monsoon conditions are important factors when considering the occurrence of rainfall and satellite-derived TPW. It is demonstrated from Fig. 6 that the heavy and heavy-to-very-heavy rainfall correspond to the higher TPW values (60–80 and above 80 mm). The TPW corresponds to the cloud-free observations and rainfall measurements are for cloudy atmosphere. This can be obviously related to the fact that the heavy rainfall occurs in the presence of higher TPW values (Wu et al., 2003). However, for the light-to-moderate rainfall amount (less than 40 mm) INSAT-3D TPW is comparable. The moisture convergence, advection of moisture over geographical locations of the subdivisions occasionally receive heavy-to-very-heavy rainfall due to synoptic-scale monsoon circulations or its topography. The highly mountainous regions like the north-east, Jammu–Kashmir and parts of the Western Ghats (on the western coast of India), have less evaporation and higher rainfall as the moisture-laden air mass is transported over the regions (Venkat Ratnam et al., 2016). Similarly, it is also observed that the rainfall is overestimated in dry conditions because the falling raindrops evaporate before coming to the surface in dry conditions, resulting in the overestimation of rainfall.

Figure 6The box–whisker plot for comparison of INSAT-3D TPW with actual rainfall over the Indian region.
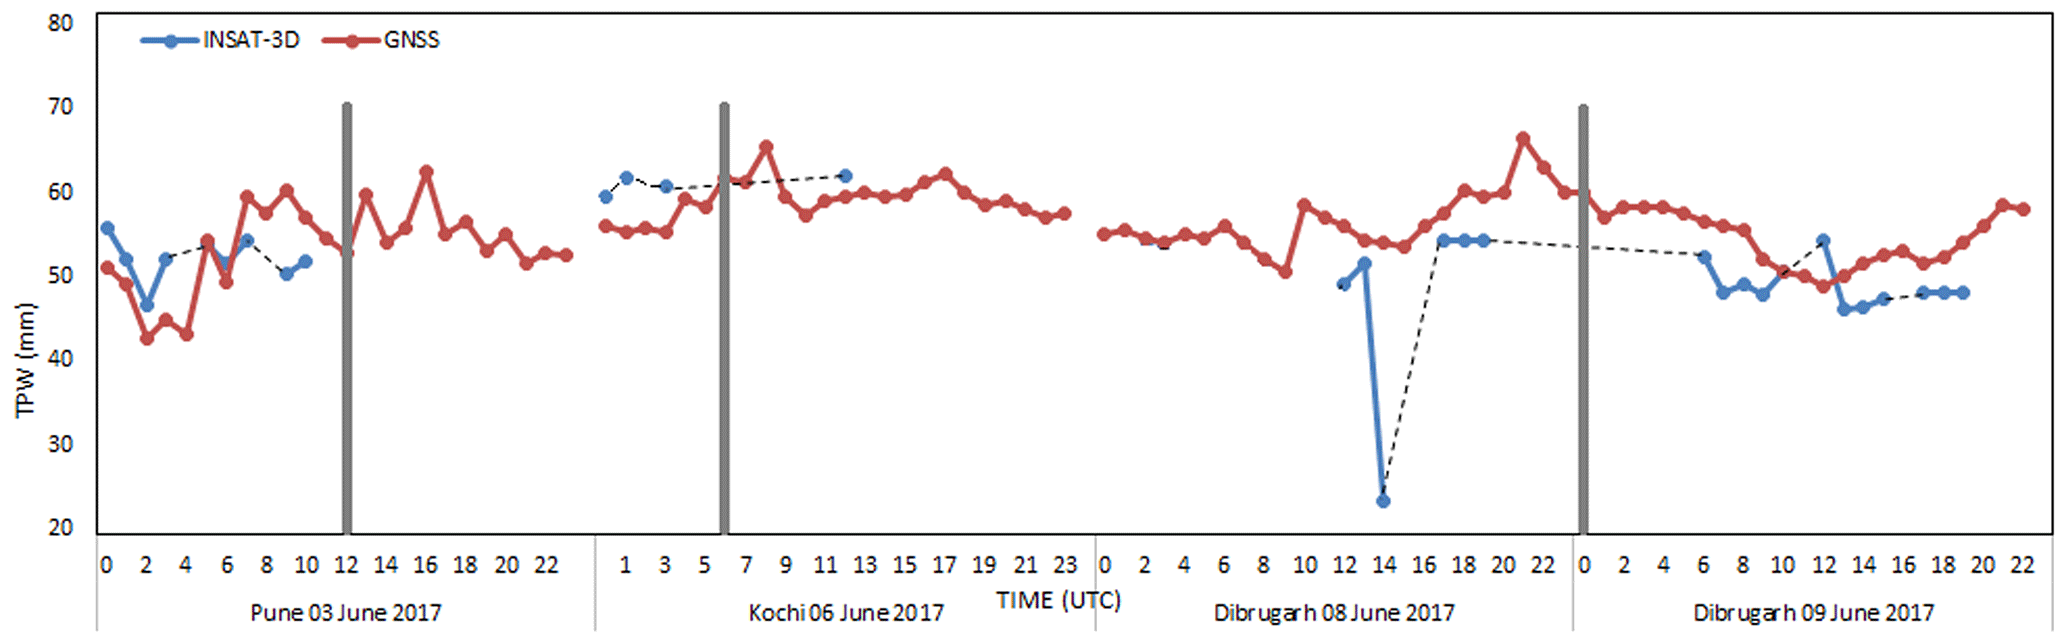
Figure 7Thunderstorm weather events in Pune on 3 June 2017, Kochi on 6 June 2017 and Dibrugarh on 8–9 June 2017.
4.3 Case studies of INSAT-3D TPW with ground-based GNSS TPW
Keeping in the mind the potential impact of TPW, hourly INSAT-3D sounder derived TPW, and GNSS TPW were analysed for thunderstorm events that occurred in Pune (18.52∘ E 73.85∘ N, 12:00 UTC, 3 June 2017), Kochi (9.93∘ E 76.26∘ N, 06:00 UTC, 6 June 2017), and Dibrugarh (27.47∘ E 94.91∘ N, 00:00 UTC, 9 June 2017).
The purpose of using the IMD GNSS instrument is that it has a maximum coverage of India and access to multiple satellites, redundancy and availability at all times. Further details can be found at http://gnss.imd.gov.in/TrimblePivotWeb/ (last access: 18 October 2018).
Figure 7 shows the hourly comparison between TPW derived from INSAT and GNSS during thunderstorm events. The grey bar shows the time of occurrence (i.e., 12:00 UTC) of the thunderstorm over Pune city. It was observed from the satellite images (not shown here) that the initial convection development starts at 06:00 UTC with multiple significant convections. It can be seen from Fig. 7 that the INSAT-3D TPW shows higher TPW values around 53 mm in comparison with GNSS TPW of 54 mm at 06:00 UTC. The higher TPW of INSAT-3D continues up to 11:00 UTC, which is in agreement with GNSS TPW. The thunderstorm was reported at 12:00 UTC. Since the INSAT-3D retrieval cannot be made over a cloudy region, the TPW observation was not available after 12:00 UTC.
In the case of the event at Kochi city, the grey bar shows the time of occurrence of the thunderstorm at 06:00 UTC. It was observed from the satellite imageries that initial convection development starts at 01:00 UTC. INSAT-3D TPW shows the higher TPW values around 58 mm in comparison with GNSS TPW of 51 mm at 01:00 UTC. The TPW observation was not available after the 03:00 UTC due to cloudy conditions. The higher TPW of INSAT-3D continues up to 03:00 UTC in agreement with GNSS TPW and a thunderstorm was observed at 06:00 UTC.
At 00:00 UTC a thunderstorm over Dibrugarh city was reported. The initial convection development started at 18:00 UTC with values around 53 mm in comparison with GNSS TPW of 58 mm at 18:00 UTC. It can be very easily seen from Fig. 7 that a fall in TPW occurs at 14:00 UTC from 50 to 24 mm. This is due to less precipitation in Dibrugarh, while from 14:00 to 18:00 UTC, no precipitation was noted due to the cloudy sky. The higher TPW of INSAT-3D continues up to 20:00 UTC, which is in agreement with GNSS TPW. The thunderstorm was reported at 00:00 UTC on 9 June 2017.
The case studies show that during the thunderstorm events, INSAT-3D-derived TPW compares reasonably well with GNSS TPW observations, indicating the potential of INSAT-3D-derived TPW for the studies on thunderstorm events. Along with other meteorological parameters (e.g., CAPE; convective available potential energy), instability indices with INSAT-3D TPW and the mesoscale activities can be very easily detected and utilized for weather forecasts. However, the above case studies confirm the usefulness of INSAT-3D-derived TPW prior to the event and it can be considered one of the precursors for convective activities.
In the present study, we have assessed the retrieval performance of INSAT-3D-derived TPW by comparing it with corresponding observations from the RS network, NOAA satellite, and GNSS network over the Indian subcontinent. The comparison carried out at daily, monthly, and subdivisional scale covering the south-west monsoon season with different geographical regions of the entire Indian subcontinent. The INSAT-3D-derived TPW are in good agreement with the TPW derived from in situ measurement (RS) and NOAA satellites. The RMSE and CC found to be around 8 mm and ∼0.8 in comparison with RS TPW on daily and monthly basis. On a subdivisional scale as a whole, the RMSE and CC compared with RS and NOAA TPW were found to be 0.80 and 0.90 mm, and 1.2 and 0.91 mm. It is to be noted that the INSAT-3D TPW on a monthly scale shows very good agreement with the subdivisional-scale rainfall observations. In addition, the comparison of INSAT-3D TPW with actual rainfall observation was also made during the same period. It was observed that the heavy and heavy-to-very heavy rainfall corresponds well with the higher TPW values. This indicates the reliability of using the TPW product to forecast monsoon precipitation over the Indian region. The improvement observed in the current INSAT-3D sounder products TPW is mainly attributed to the GSICS bias corrections, which are applied to the sounder radiances at IMDPS by SAC/ISRO. The advantages of the INSAT-3D TPW product offers real-time availability over the Indian region with good spatial (resolution 30 km) and temporal resolution (hourly) compared to others derived from polar-orbiting satellites. The quality of TPW product of INSAT-3D shows the potential for its usefulness in weather monitoring and forecasting purposes for the improvement in nowcasting over the Indian region. In a future study, INSAT-3D and INSAT-3DR-derived TPW in staggering mode (every half an hour) can be utilized for the detection and the study of mesoscale activity like thunderstorms during the pre-monsoon and monsoon seasons.
The INSAT-3D data and GNSS receiver data are taken from National Satellite Meteorological Centre, India Meteorological Department, New Delhi.
The authors declare that they have no conflict of interest.
Authors are grateful to Kanduri Jayaram Ramesh, the Director General of
Meteorology IMD for offering valuable suggestions. We appreciate the work of
Chandra Kishtawal and
Pradeep Kumar Thapliyal, who applied a GSCIS correction at IMDPS to improve sounder
retrievals. We thank them for providing their technical inputs. The first
author also thanks NOAA for providing satellite data of TPW used in the
comparison with data from the INSAT 3D sounder.
Edited by: Hiren Jethva
Reviewed by: Sankar Nath and one anonymous referee
Ferraro, R. R., Weng, F., Grody, N. C., Zhao, L., Meng, H., Kongoli, C., Pellegrino, P., Qiu, S., and Dean, S.: NOAA Operational Hydrological Products Derived From the Advanced Microwave Sounding Unit, IEEE T. Geosci. Remote, 43, 1036–1049, 2005.
Fuelberg, H. E. and Oslon, S. R.: An assessment of VAS derived retrievals and parameters used in thunderstorm forecasting, Mon. Weather Rev., 119, 795–814, 1991.
Hannon, S., Strow, L. L., and Mc Millan, W. W.: Atmospheric Infrared fast transmittance models: A comparison of two approaches, Proc. SPIE – Int. Soc. Opt. Eng., 2830, 94–105, 1996.
Kidder, S. Q. and Jones, A. S.: A blended satellite Total Precipitable Water product for operational forecasting, J. Atmos. Ocean. Tech., 24, 74–81, 2007.
Kuo, Y. H., Zou, X., and Guo, Y. R.: Variational assimilation of precipitable water using a non-hydrostatic mesoscale adjoint model, Mon. Weather Rev., 124, 122–147, 1996.
Kumar, G., Madan, R., Krishnan, K. C. Sai, and Jain, P. K.: Technical and operational characteristics of GPS radiosounding system in upper air network, Mausam, 62, 403–416, 2011.
Li, J., Wolf, W. W., Menzel, W. P., Zhang, W., Huang, H. L., and Achtor, T. H.: Global soundings of the atmosphere from ATOVS measurements: The algorithm and validation, J. Appl. Meteorol., 39, 1248–1268, 2000.
Ma, X. L., Schmit, T., and Smith, W.: A non-linear physical retrieval algorithm – Its application to the GOES-8/9 sounder, J. Appl. Meteor., 38, 501–503, 1999.
Mitra, A., Bhan, S., Sharma, A., Kaushik, N., Parihar, S., Mahandru, R., and Kundu, P. K.: INSAT-3D vertical profile retrievals at IMDPS, New Delhi, Mausam, 66, 687–694, 2015.
Purdom, J. F. W. and Menzel, W. P.: Evolution of satellite observations in the United States and their use in meteorology, in: Historical Essays on Meteorology 1919–1995, American Meteorological Society, edited by: Fleming, J. R., Braun-Brumfield Inc., 99–155, 1996.
Ratnam, M. V., Basha, G., Murthy, B. V. K., and Jayaraman, A.: Relative humidity distribution from SAPHIR experiment on board Megha-Tropiques satellite mission: Comparison with global radiosonde and other satellite and reanalysis data sets, J. Geophys. Res., 118, 1–9, 2013.
Schmit, T. J., Feltz, W. F., Menzel, W. P., Jung, J., Noel, A. P., Heil, J. N., Nelson, J. P., and Wade, G. S.: Validation and use of GOES Sounder moisture information, Wea. Forecast., 17, 139–154, 2002.
Smith, T. L., Benjamin, S. J., Gutam, S. I., and Sahm, S.: Short-Range Forecast Impact from Assimilation of GPS-IPW Observations into the Rapid Update Cycle, Mon. Weather Rev., 135, 2914–2930, 2007.
Trenberth, K. E. and Olson, J. G.: An Evaluation and Intercomparison of Global Analyses from the National Meteorological Center and the European Centre for Medium Range Weather Forecasts, AMS, 28, 1520-0477, 1988.
Trenberth, K. E. and Stepaniak, D. P.: Seamless poleward atmospheric energy transports and implications for the Hadley circulation, J. Climate, 16, 3706–3722, 2003a.
Trenberth, K. E. and Stepaniak, D. K.: Covariability of components of poleward atmospheric energy transports on seasonal and inter annual timescales, J. Climate, 16, 3691–3705, 2003b.
Trenberth, K. E., Fasullo, J., and Smith, L.: Trends and variability in column-integrated atmospheric water vapor, Clim. Dynam., 24, 741–758, 2005.
Venkat Ratnam, M., Hemanth Kumar, A., and Jayaraman, A.: Validation of INSAT-3D sounder data with in situ measurements and other similar satellite observations over India, Atmos. Meas. Tech., 9, 5735–5745, https://doi.org/10.5194/amt-9-5735-2016, 2016.
Wu, P., Hamada, J. I., Mori, S., Tauhid, Y. I., Yamanaka, M. D., and Kimura, F.: Diurnal variation of precipitable water over a mountainous area of Sumatra Island, J. Appl. Meteorol., 42, 1107–1115, 2003.
Yuan, L., Anthes, R., Ware, R., Rocken, C., Bonner, W., Bevis, M., and Businger, S.: Sensing climate change using the global positioning systems, J. Geophys. Res., 98, 25–30, 1993.