the Creative Commons Attribution 4.0 License.
the Creative Commons Attribution 4.0 License.
 | 19 Dec 2018
Analysis of spatial and temporal patterns of on-road NO2 concentrations in Hong Kong
Ying Zhu
Ka Lok Chan
Yun Fat Lam
Martin Horbanski
Denis Pöhler
Johannes Boll
Ivo Lipkowitsch
Mark Wenig
In this paper we present an investigation of the spatial and temporal variability of street-level concentrations of NO2 in Hong Kong as an example of a densely populated megacity with heavy traffic. For the study we use a combination of open-path remote sensing and in situ measurement techniques that allows us to separate temporal changes and spatial patterns and analyse them separately. Two measurement campaigns have been conducted, one in December 2010 and one in March 2017. Each campaign lasted for a week which allowed us to examine diurnal cycles, weekly patterns as well as spatially resolved long-term changes. We combined a long-path differential optical absorption spectroscopy (DOAS) instrument with a cavity-enhanced DOAS and applied several normalizations to the data sets in order to make the different measurement routes comparable. For the analysis of long-term changes we used the entire unfiltered data set and for the comparison of spatial patterns we filtered out the accumulation of NO2 when stopping at traffic lights for focusing on the changes of NO2 spatial distribution instead of comparing traffic flow patterns. For the generation of composite maps the diurnal cycle has been normalized by scaling the mobile data with coinciding citywide path-averaged measurement results.
An overall descending trend from 2010 to 2017 could be observed, consistent with the observations of the Ozone Monitoring Instrument (OMI) and the Environment Protection Department (EPD) air quality monitoring network data. However, long-term difference maps show pronounced spatial structures with some areas, e.g. around subway stations, revealing an increasing trend. We could also show that the weekend effect, which for the most part of Hong Kong shows reduced NO2 concentrations on Sundays and to a lesser degree on Saturdays, is reversed around shopping malls. Our study shows that spatial differences have to be considered when discussing citywide trends and can be used to put local point measurements into perspective. The resulting data set provides a better insight into on-road NO2 characteristics in Hong Kong, which helps to identify heavily polluted areas and represents a useful database for urban planning and the design of pollution control measures.
- Article
(15730 KB) - Full-text XML
- BibTeX
- EndNote


Nitrogen dioxide (NO2) is one of the major air pollutants and plays a key role in both tropospheric and stratospheric chemistry. It participates in the catalytic formation of tropospheric ozone (O3) and also contributes to the formation of secondary aerosols (Huang et al., 2014; Jang and Kamens, 2001) and causes acid rain. High NO2 concentration is known to be toxic to humans. Nitrogen oxides (NOx), defined as the sum of nitric oxide (NO) and NO2, are released into the atmosphere from both natural and anthropogenic sources. Major sources of NOx include fossil fuel combustion, biomass burning, lightning and oxidation of ammonia (Bond et al., 2001; Zhang et al., 2003). In Hong Kong, vehicle emissions are the main source of NOx. Similarly to many metropolitan areas, a decreasing trend in ambient and roadside NOx levels has been observed (Carslaw, 2005; Keuken et al., 2009; Tian et al., 2011), which was contributed to by the effective vehicular emission control measures in the past. However, the pollution levels measured at both ambient and roadside air quality monitoring stations have still occasionally exceeded the World Health Organization (WHO) guideline values of 40 µg m−3 (annual) and 200 µg m−3 (hourly) for NO2, with more frequent exceedance of hourly NO2 with high values observed at roadside stations. A rising trend in the NO2∕NOx ratio with a reduction of NOx is recorded at the roadside monitoring stations in Hong Kong, which means the reduction rate of NO2 is slower than NO in recent years (Tian et al., 2011). Vehicular NO2 is either primarily emitted at the tail pipe or secondarily formed from oxidation of NO emissions involving ozone and volatile organic compounds (VOCs) at the ambient level (Chang et al., 2016; Muilwijk et al., 2016). The increase in the NO2∕NOx ratio could either relate to the upgrades of vehicle engines and catalytic filters or changes at the composition and ambient level of VOCs. However, NO2 concentration changes rapidly with time and has a very strong spatio-temporal variability, which is often unknown in urban areas (Longley et al., 2015). Regular roadside air quality monitoring stations are not sufficient to capture these variations and could not provide an overview of the roadside pollution situation representative of Hong Kong. Therefore, it is necessary to take on-road mobile measurements for a better understanding of the pollutant distribution and spatial coverage of NO2 for the entire city.
In order to capture the spatial and temporal variability of NO2 concentrations in the central metropolitan area of Hong Kong, we use a combination of two different differential optical absorption spectroscopy (DOAS) techniques, a long-path DOAS (LP-DOAS) and a cavity-enhanced DOAS (CE-DOAS), as well as an ultraviolet (UV)-based dual-beam in situ ozone monitor (Model 205, 2B Technologies). CE-DOAS is a relatively new spectroscopic measurement technique, which uses an optical resonator to produce a long light path to enhance the absorption signal within a limited space (Platt et al., 2009). Sensitive measurements of trace gases have already been demonstrated by Langridge et al. (2006), Venables et al. (2006), Washenfelder et al. (2008), Thalman and Volkamer (2010), Min et al. (2016) and Chan et al. (2017b). Compared to other in situ NO2 monitoring techniques, CE-DOAS is insensitive to other reactive nitrogen (NOy) in the atmosphere, making it a better option for small-scale measurements and detection of spatial variation of trace gases. Its high accuracy allows for fast sampling, which is important for mobile measurements.
Mobile measurements are an effective tool for obtaining the spatial and temporal variations of highly dynamic on-road pollutants. Therefore, it has been widely used for determining on-road vehicle emission factors (Ning et al., 2012; Uhrner et al., 2007; Vogt et al., 2003) and assessing the impacts of urban planning on air quality (Chan et al., 2017b; Rakowska et al., 2014).
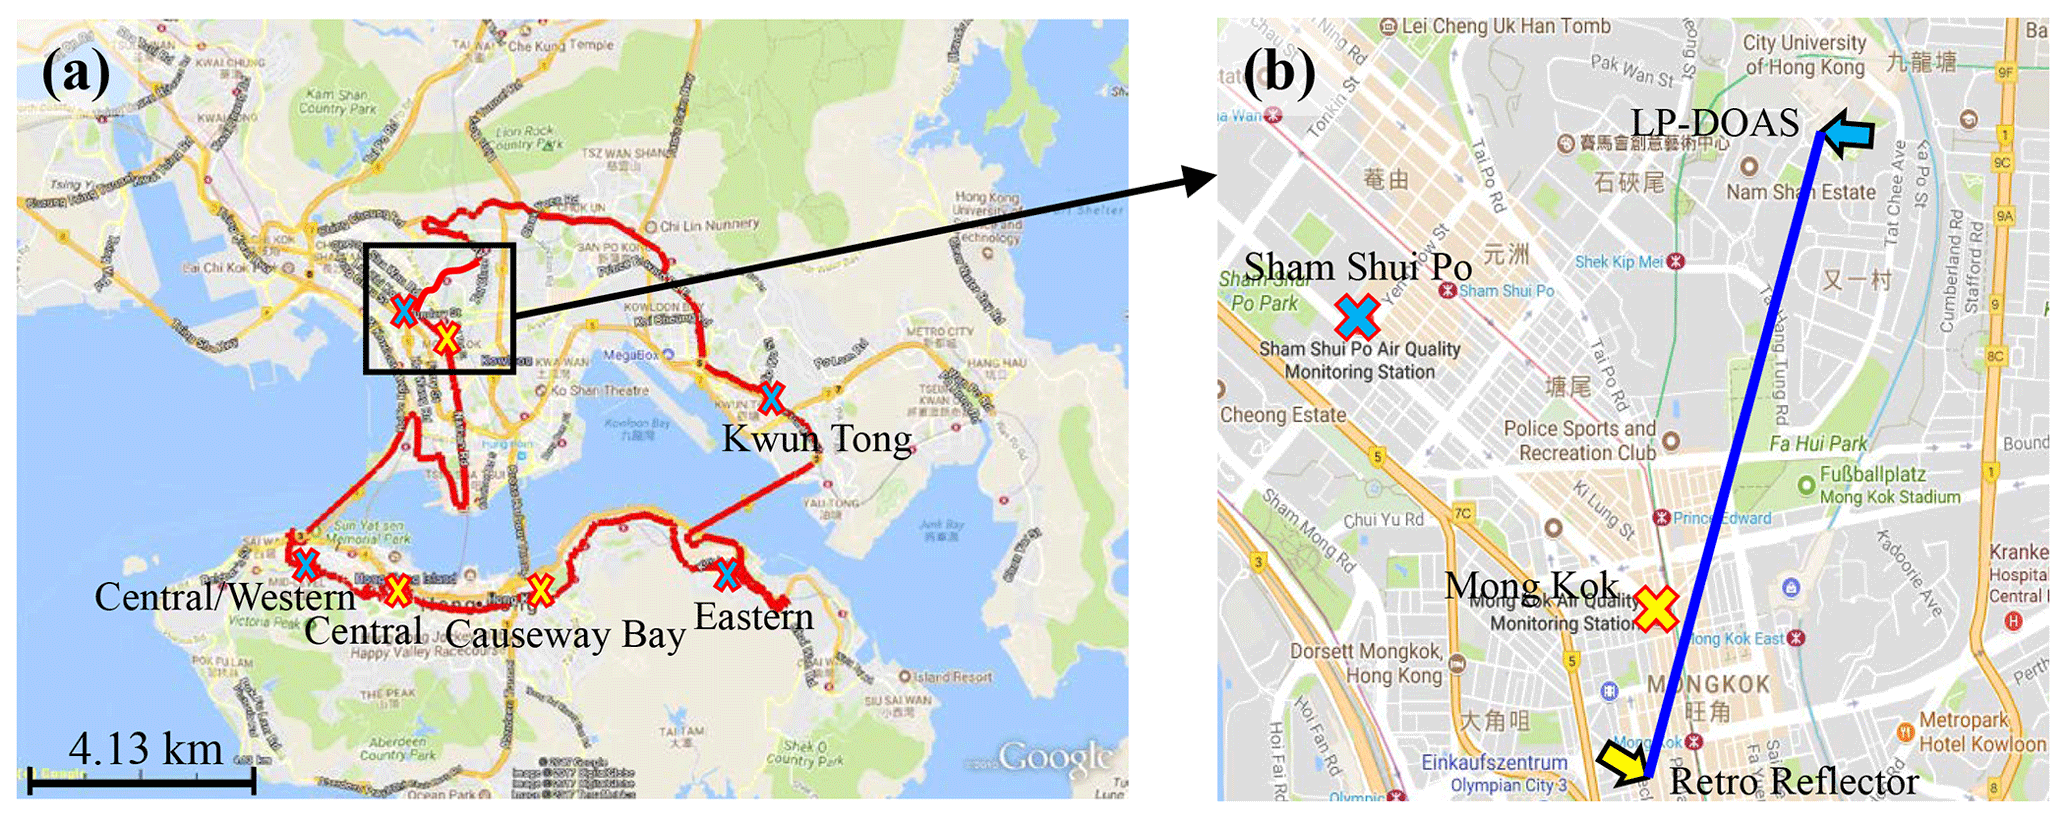
Figure 1Map of Hong Kong city centre. (a) The standard measurement route; (b) the location of LP-DOAS. Yellow crosses indicate three roadside EPD monitoring stations while blue crosses represent four ambient EPD monitoring stations. The blue line indicated in panel (b) represents the optical path of the LP-DOAS.
Mobile CE-DOAS measurements of on-road NO2 were taken in December 2010 and March 2017. The mobile measurements were used to investigate the relationship between on-road and ambient air quality. In addition, LP-DOAS measurements were taken to investigate the temporal variation of general ambient NO2 in Hong Kong. Details of the mobile CE-DOAS and LP-DOAS experimental set-ups are presented in Sect. 2. In Sect. 3.2, the data filtering and normalization algorithms applied to the mobile measurement data are introduced. The mobile NO2 measurements are then analysed together with LP-DOAS and local monitoring station data for the long-term trends, and the results are shown in Sect. 3.3. Section 3.4 presents an analysis of the characteristics of the weekend effect for different parts of the city. In addition, the spatial patterns of on-road NO2 and the identification of pollution hotspots are presented in Sect. 3.5.
2.1 Mobile cavity-enhanced DOAS
A CE-DOAS instrument was employed for mobile measurements using a sampling inlet positioned on top of the front part of the vehicle at a height of about 1.5 m above ground. The measurements were taken in December 2010 and March 2017 and divided into two parts: (a) measurements along a standard route that cover a large part of the urban area of Hong Kong and (b) a single measurement in different areas that are not covered by the route. The regular route covers Mong Kok, Central and Causeway Bay, which are the busiest areas in Hong Kong (see Fig. 1). The standard route measurements were taken 2 to 3 times per day in order to cover non-rush hours and morning and evening rush hours. The varying route measurements were mostly taken during non-rush hours, which aims to provide better spatial coverage and identify pollution hotspots. Measurements taken in 2010 focus more on the on-road NO2 spatial distribution and the identification of pollution hotspots. Therefore, the 2010 measurements include more non-standard routes in order to have better spatial coverage. On the other hand, the objectives of the 2017 measurements were refined to investigate the spatio-temporal variations over major pollution hotspots, which are mostly concentrated in the city centre. As a result, we focused more on the standard route measurements over the city centre in 2017.
The principle of the CE-DOAS (Platt et al., 2009) is similar to that of the cavity-enhanced absorption spectroscopy (CEAS) (Fiedler et al., 2003). The measured absorption spectrum of an incoherent broadband light source (e.g. LED) is used to determine the concentration of trace gases, which allows the application of the DOAS technique for the detection of multiple trace gases by a single instrument.
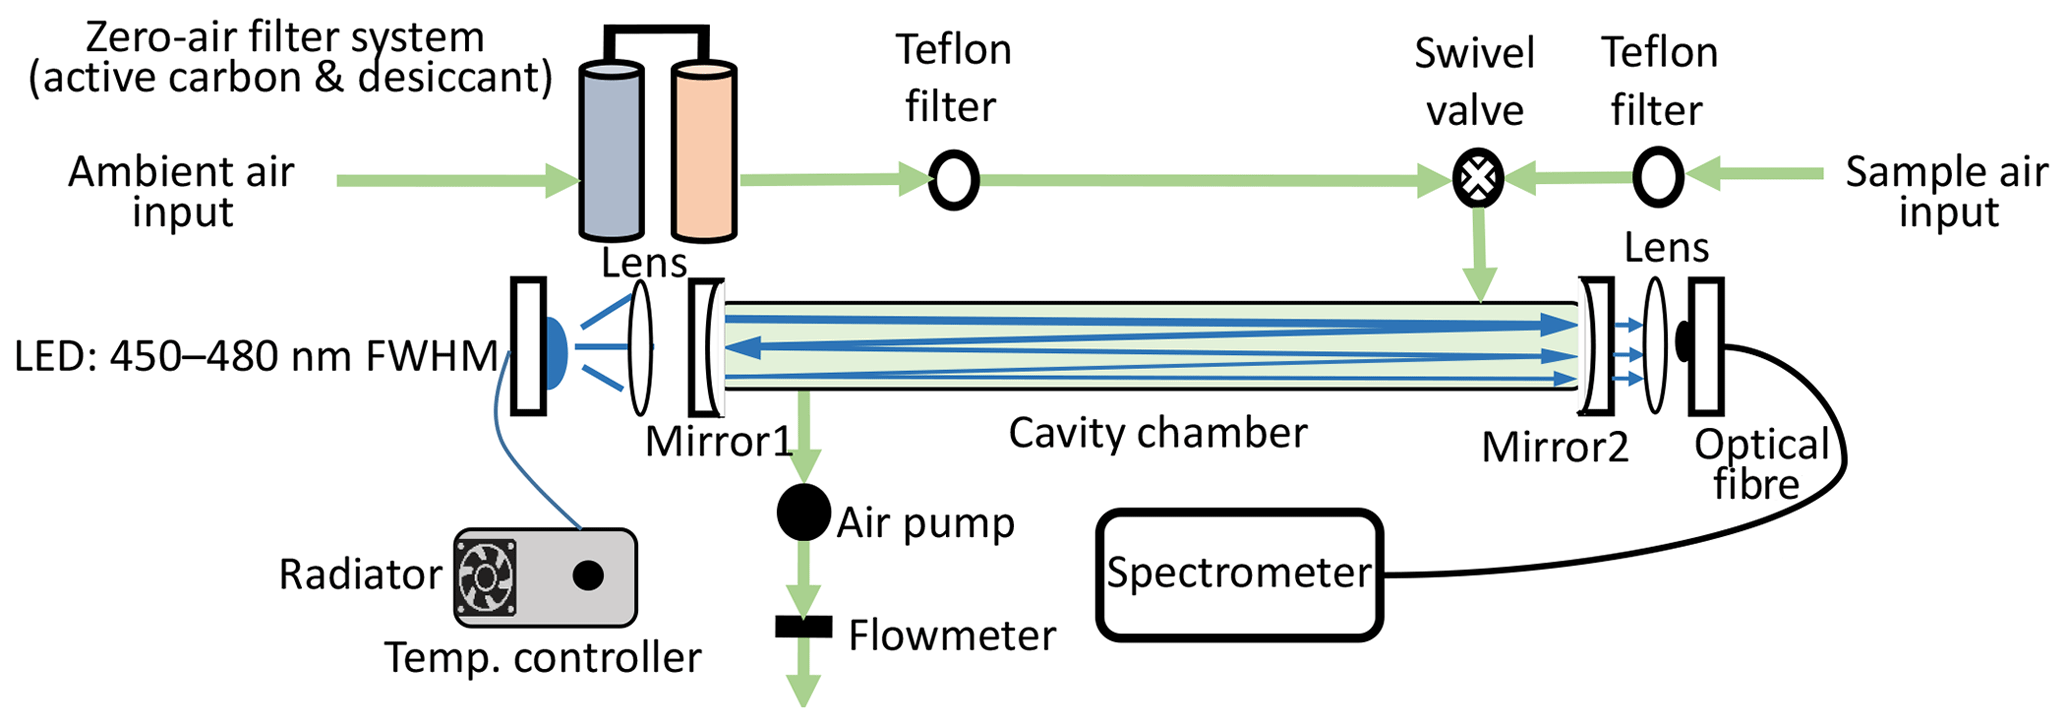
A schematic diagram of the CE-DOAS instrument is shown in Fig. 2. The CE-DOAS consists of a blue LED light source, an optical resonator with two highly reflective mirrors, a spectrometer and an air sampling system. Dielectric-coated highly reflective mirrors (reflectivity >99.98 % at 440 nm) are placed at both ends of the sampling cell to form an optical resonator. Light from the high-power blue LED (CREE XR-E royal blue, 440–455 nm FWHM) is coupled to the optical resonator by a convex lens with a focal length of 25 mm. Light escaping from the other side of the optical resonator is coupled to an optical fibre with a numerical aperture of 0.22 by a convex lens with a focal length of 50 mm and an aluminum mirror. The transmitted light is redirected to the spectrometer for spectral analysis through the optical fibre. Spectra are recorded by an Avantes spectrometer (AvaSpec-ULSi2048L-USB2) with a Sony ILX511 charge-coupled device (CCD) detector. The spectral range of the spectrometer is adjusted to 395–492 nm with a spectral resolution of 0.47 nm (FWHM). The sampling cell is made by a Teflon pipe with a length of 50 cm and a sampling volume of 286.3 cm3. The sample flow of the system is achieved by a direct current vacuum pump located at the outlet side of the sampling chamber. A Teflon filter is placed in front of the inlet of the sampling cavity to avoid aerosols entering the sampling cavity and affecting the optical path by scattering and contamination of the highly reflective mirrors. The time resolution of the CE-DOAS was adjusted to 4 s during the mobile measurement. The detection limit of the instrument is 1 ppbv. A more detailed description of the CE-DOAS instrument can be found in Platt et al. (2009) and Chan et al. (2017b).
In this study, the software DOASIS (Kraus, 2005) was used for the CE-DOAS spectral evaluation. The CE-DOAS spectral fit is performed in the wavelengths from 435.6 to 455.1 nm, which includes several strong NO2 and water vapour absorption bands. Reference absorption cross sections of NO2 (Vandaele et al., 2002), H2O (Rothman et al., 2003), glyoxal (CHOCHO) (Volkamer et al., 2005) and O4 (Hermans et al., 1999) were included in the DOAS fitting.
2.2 Long-path DOAS observations
A light-emitting diode (LED)-based LP-DOAS system was installed on the rooftop of the City University of Hong Kong building, providing measurements of near-surface NO2. The retro reflectors were placed on a high-rise building located at the centre of Kowloon, realizing an optical path of 1.9 km (total absorption path of 3.8 km). The spectral range of the spectrometer was adjusted from 400 to 462 nm with a spectral resolution of 0.4 nm (FWHM). The average altitude of the LP-DOAS light path is ∼50 m above ground level, covering a long light path over the urban area of Hong Kong, providing a better overview of the spatial distribution of ambient NO2 level. Details of the experimental set-up and the data retrieval procedure of the LP-DOAS can be found in Chan et al. (2012, 2017a). When focusing on the spatial variations, we used ambient NO2 values measured by the LP-DOAS to normalize the temporal dependency of the mobile CE-DOAS measurements. Since the mobile measurements record data from different parts of the city at different times of the day, the diurnal variability has to be normalized in order to produce a concentration map that is representative of daily average concentration of NO2. Details of the normalization procedure are presented in Sect. 3.2.
2.3 Local air quality monitoring network
Ambient NO2 data in Hong Kong were acquired from the air quality monitoring network of Hong Kong which is operated by the Environmental Protection Department (EPD). The air quality monitoring network comprises 13 ambient and 3 roadside monitoring stations (see Fig. 1 for the locations of some of the stations). The ambient stations are located at different altitude and in general above 10 m a.g.l., while the roadside stations are measuring at 3 m a.g.l. The measurements cover both urban and rural areas in Hong Kong. The NO2 and NOx concentrations are measured by in situ chemiluminescence NOx analyzer. Ultra-violet (UV) absorption O3 analyzer is used for O3 monitoring. More details of the air quality monitoring network can be found at http://www.aqhi.gov.hk/en/monitoring-network/air-quality-monitoring-network.html (last access: 30 November 2018). Hourly NO2 concentrations from seven nearby air quality monitoring stations were used to compare to LP-DOAS and CE-DOAS NO2 measurements. In addition, NO2, NOx and O3 data from the monitoring stations are used for long-term trend analysis.
2.4 OMI satellite observations
The Ozone Monitoring Instrument (OMI) is a passive nadir-viewing satellite-borne imaging spectrometer (Levelt et al., 2006) on board the Earth Observing System (EOS) Aura satellite. The instrument consists of two CCDs covering a wavelength range from 264 to 504 nm. A scan provides measurements at 60 positions across the orbital track, covering a swath of approximately 2600 km. The spatial resolution of OMI varies from ∼ 320 km2 (at nadir) to ∼ 6400 km2 (at both edges of the swath). The instrument scans along 14.5 sun-synchronous polar orbits per day, providing daily global coverage observations.
In this study, NASA's OMI NO2 standard product version 3 (SPv3) is used (Krotkov et al., 2017). The slant column densities (SCDs) of NO2 are derived from Earth's reflected spectra in the visible range (402–465 nm) using an iterative sequential algorithm (Marchenko et al., 2015). The OMI NO2 SCDs are converted to vertical column densities (VCDs) by using the concept of air mass factor (AMF) (Solomon et al., 1987). The AMFs are calculated based on NO2 and temperature profiles derived from the Global Modeling Initiative (GMI) chemistry transport model simulations with a horizontal resolution of 1∘ (latitude) × 1.25∘ (longitude) (Rotman et al., 2001). Separation of stratospheric and tropospheric columns is achieved by the local analysis of the stratospheric field over unpolluted areas (Bucsela et al., 2013).
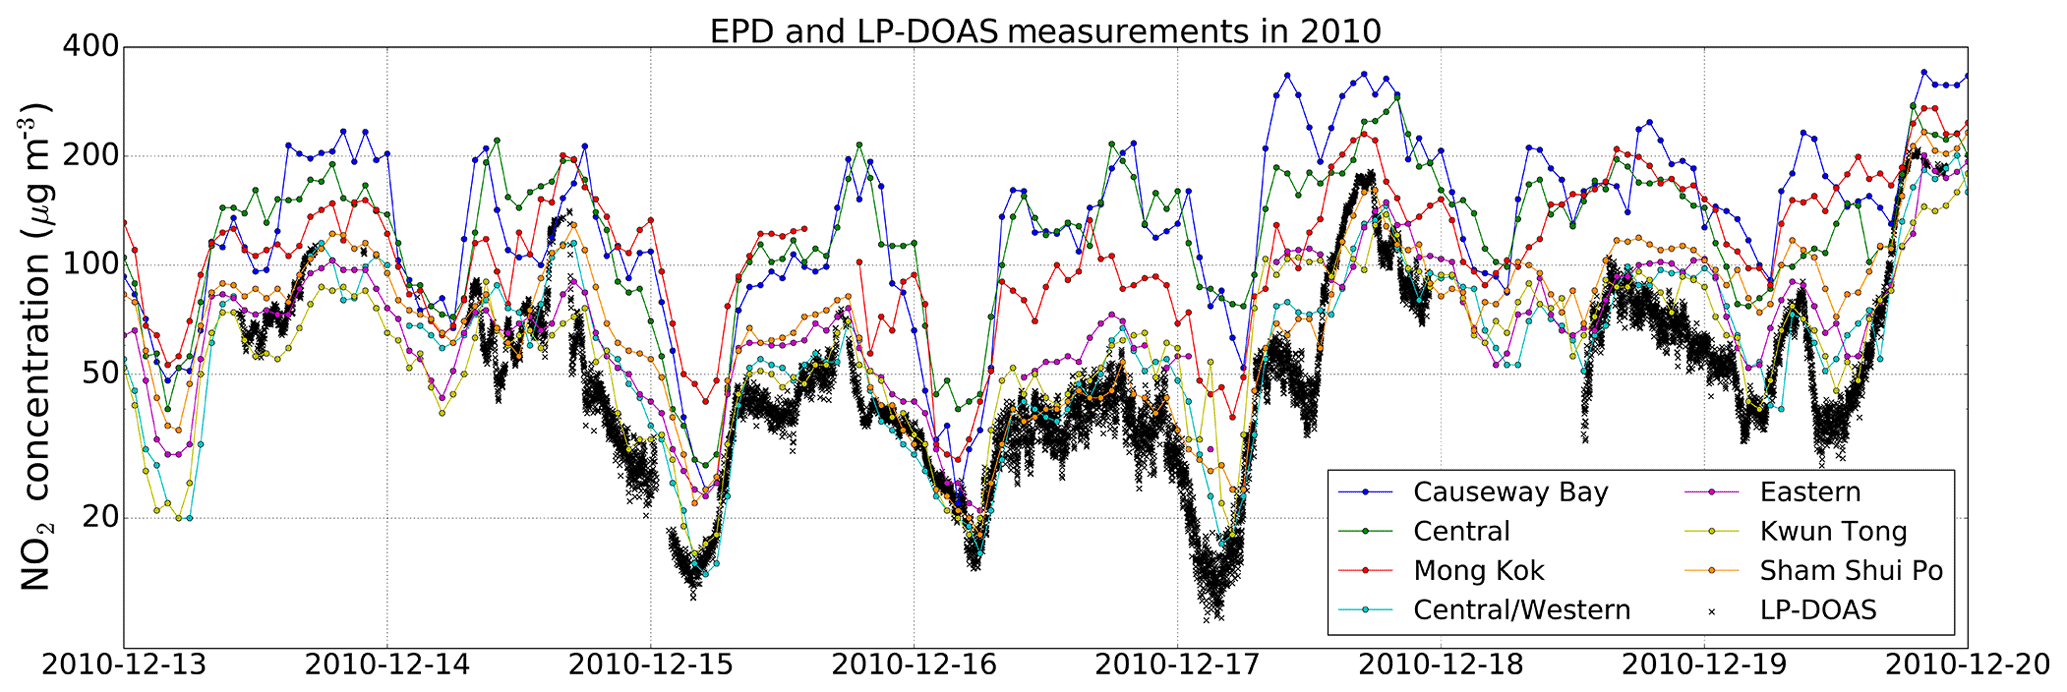
Figure 3Time series of NO2 concentration measured by LP-DOAS and EPD monitoring stations during the measurement campaign in 2010.
3.1 NO2 measurement comparison
Our LP-DOAS measurements of atmospheric NO2 in Hong Kong started in December 2010. The data show significant diurnal, weekly and seasonal variability. The daytime annual average NO2 concentration measured by the LP-DOAS from 2011 to 2015 is 47.5 µg m−3. A decreasing trend can be observed (see Sect. 3.3 for more detailed discussion), but they are all still higher than the annual average of 40 µg m−3 in the WHO guideline (same standard as the Hong Kong air quality objective for NO2). Additionally, episodes of high NO2 levels are occasionally recorded, especially from long-range transportation of air pollutants from mainland China (Kuhlmann et al., 2015).
A time series of NO2 concentrations measured by LP-DOAS and EPD monitoring stations are shown in Fig. 3. On one hand, both LP-DOAS and EPD measurements show similar variation pattern with higher values during the daytime and lower values at night. On the other hand, LP-DOAS and different EPD stations measurements also demonstrate different characteristics of NO2. The significant spatial dependency of NO2 is also confirmed in long-term changes (see Sect. 3.3 for more detailed discussion). All measurements show an elevated NO2 level during the morning (08:00 to 10:00 UTC + 8) and afternoon (17:00 to 19:00 UTC + 8) rush hours. However, the absolute concentration measured by different stations varies in a wide range. In addition, differences in measurement height also contribute to differences in these measurements. In order to have a better overview of the NO2 spatial distribution, temporal variation and their emission source pattern, we took mobile measurements of on-road NO2 using a CE-DOAS instrument. On-road measurements can easily be influenced by the traffic condition, e.g. accumulation of emission during traffic congestion, and the diurnal variation of ambient NO2. In order to correct for these effects in the mobile measurement, we have filtered data which are influenced by traffic condition and normalized the on-road measurement for diurnal variation of NO2.
3.2 Data filtering and normalization
3.2.1 Comparison of concentrations during fluent traffic and traffic congestion
Traffic congestion can result in higher pollution levels due to accumulation of vehicle emissions, caused by less turbulent mixing with cleaner air and longer NO to NO2 reaction time. It has been observed that high concentrations of NO2 were recorded during low-speed driving in our measurements, i.e. in a traffic jam or waiting in front of a traffic light. Figure 4 shows the time series of vehicle speed and measured NO2 concentration during a traffic congestion on 2 March 2017. Note that the vehicle speed is calculated from the GPS data with an error of about 0.6 m. Converting the error into vehicle speed would be 1.4 km h−1. Therefore, the vehicle speed is never zero, even if the vehicle stops. In the example shown in Fig. 4, the vehicle slowed down and stopped for half a minute at a traffic light. The NO2 level goes up from about 100 to more than 400 µg m−3. The NO2 level rises about 8 s after the vehicle stopped. When the vehicle started moving again, the measured NO2 level gradually dropped back to the pre-stop level within 20 s.
In order to separate data that is influenced the NO2 spikes induced by traffic congestion or idling, we filtered data from 8 s after the vehicle speed drop below 5 km h−1 to 20 s after the vehicle speed goes above 5 km h−1 again. In order to avoid filtering data due to poor GPS signal, this filter only applies when the vehicle speed is below 5 km h−1 for more than 8 s. The lag time shown in this case is 8 s. It is the combination of accumulation of NO2 at the ambient level and the lag time of the instrument. The lag time of the instrument is ∼4 s, while the time of accumulation of NO2 varies with the ambient condition. The average NO2 concentrations for the standing condition are 239 µg m−3, which is 14.5 % higher on average. We filter out traffic light or traffic jam stops only to have a consistent NO2 spatial distribution under fluent driving conditions for the direct comparison of measurements in different days and years, in order to focus on the concentrations instead of the congestion patterns. This filter criterion removed 37 % and 30 % of the total number of measurement data in 2010 and 2017. However, since the filter mainly removes measurements at low speed or standing, only 10 % and 11 % of the spatial points were removed for 2010 and 2017. This filter is only applied to generate maps for comparison.
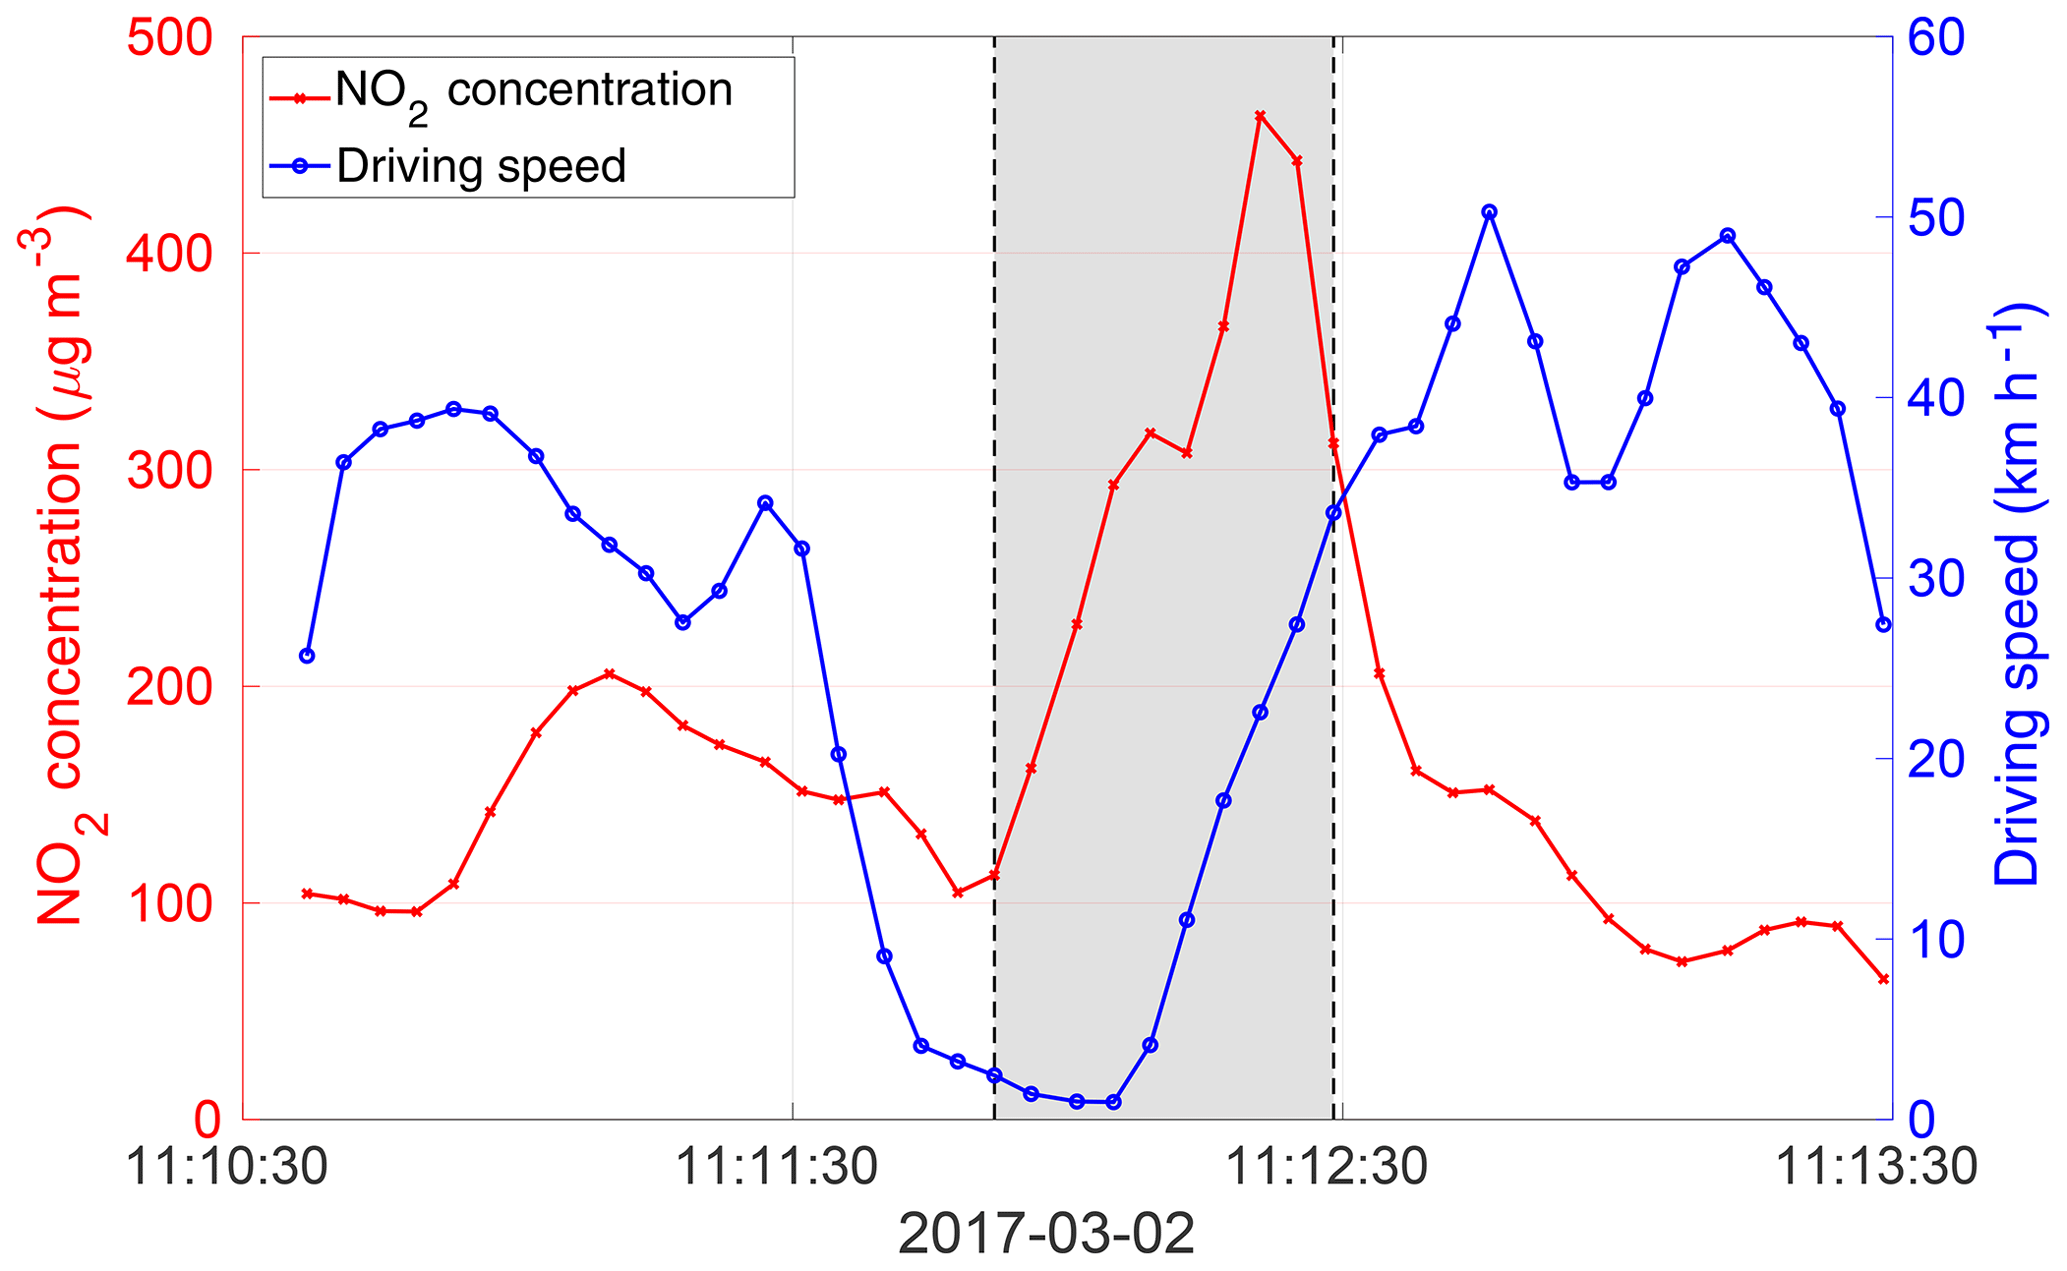
Figure 4Time series of the driving speed and the coinciding NO2 concentration during traffic congestion. Data in grey area will be filtered out in a later analysis.
3.2.2 Normalization of the diurnal cycle
In order to separate the NO2 spatial and temporal variability and show a representative spatial distribution of NO2 in Hong Kong, we developed an algorithm using LP-DOAS measurements to normalize the diurnal variations. Although the LP-DOAS measurement covers a long light path over the urban area in Hong Kong, the NO2 values provided might still not be representative of all measurement areas due to local influences. Therefore, we use a normalized long-term average of diurnal NO2 cycle for each weekday to correct for the temporal variation effect. The normalized data are less depending on outliers caused by the overpass pollution plume and can also interpolate data gaps due to instrumental problems and bad weather.
LP-DOAS measurements of atmospheric NO2 for each day are first normalized by dividing by the daily mean NO2 concentration. The resulting normalized NO2 levels are then averaged for each day of the week over a period of 2 years to obtain a representative diurnal NO2 variation pattern. The normalized and averaged diurnal NO2 variation pattern of the corresponding weekday are scaled and shifted to fit the normalized LP-DOAS measurement for each day during the mobile measurement campaign. The inverse of the 1σ (standard deviation) variation of the 2-year averaged and normalized NO2 level is used as weighting in the least squares regression to scale and shift the long-term average diurnal pattern. In order to avoid single high values affecting the whole regression, the normalized NO2 level exceeded the 1σ variation of the 2-year averaged, and the normalized NO2 level was not considered in the regression process. Figure 5 shows the normalized NO2 concentration measured by the LP-DOAS on 17 December 2010. The normalized 2-year Friday mean NO2 diurnal pattern, the diurnal pattern of scaled NO2 measurement taken on 17 December 2010 and normalized EPD monitoring data are shown as well. All data illustrate similar characteristics with significant peaks in the morning (08:00 to 10:00 UTC + 8) and evening (17:00 to 19:00 UTC + 8) rush hours. Compared to the original LP-DOAS measurements, the fitted mean diurnal NO2 pattern matches better with measurements from most of the EPD monitoring stations, indicating that the fitted diurnal pattern better represents the general condition in Hong Kong. The fitted long-term diurnal pattern is then used to correct for the diurnal effect of the mobile measurement. Mobile measurements are multiplied by the simultaneous NO2 level of the resulting normalized LP-DOAS diurnal pattern to obtain a more representative value of the measurement areas.
3.3 Long-term trends of NO2
On-road CE-DOAS measurements are analysed together with LP-DOAS and EPD monitors data to investigate the long-term trends in on-road and ambient NO2. The observed trends at different locations are compared to the changes of the mobile on-road CE-DOAS NO2 measurements in 2010 and 2017 taken within 100 m radius of the 3 EPD roadside stations or within 1 km radius of the centre of the LP-DOAS measurement path (Fig. 6a, b, c and d), in order to illustrate the differences between on-road mobile and roadside stationary measurements and to examine the consistency of the long-term trend in roadside NO2 derived from stationary measurements. The time series represent monthly averaged ambient NO2 concentrations measured during the daytime. OMI satellite observations of monthly average tropospheric NO2 VCDs over Hong Kong are shown in Fig. 6e. The data were filtered for cloud fraction larger than 50 % and averaged for OMI pixel within 50 km of the measurement site. The on-road CE-DOAS NO2 measurements are in general much higher than the ambient monitoring station data. This is mainly due to the difference in measurement height. The inlet of our on-road mobile measurement platform was set up at 1.5 m a.g.l, while the EPD roadside stations were measured at 3 m a.g.l. and the ambient stations were located at even higher altitudes. As the tail pipes of vehicles are usually at 10–30 cm a.g.l., our mobile measurement inlet is much closer to the emission sources and therefore in general measures higher NO2 concentrations.
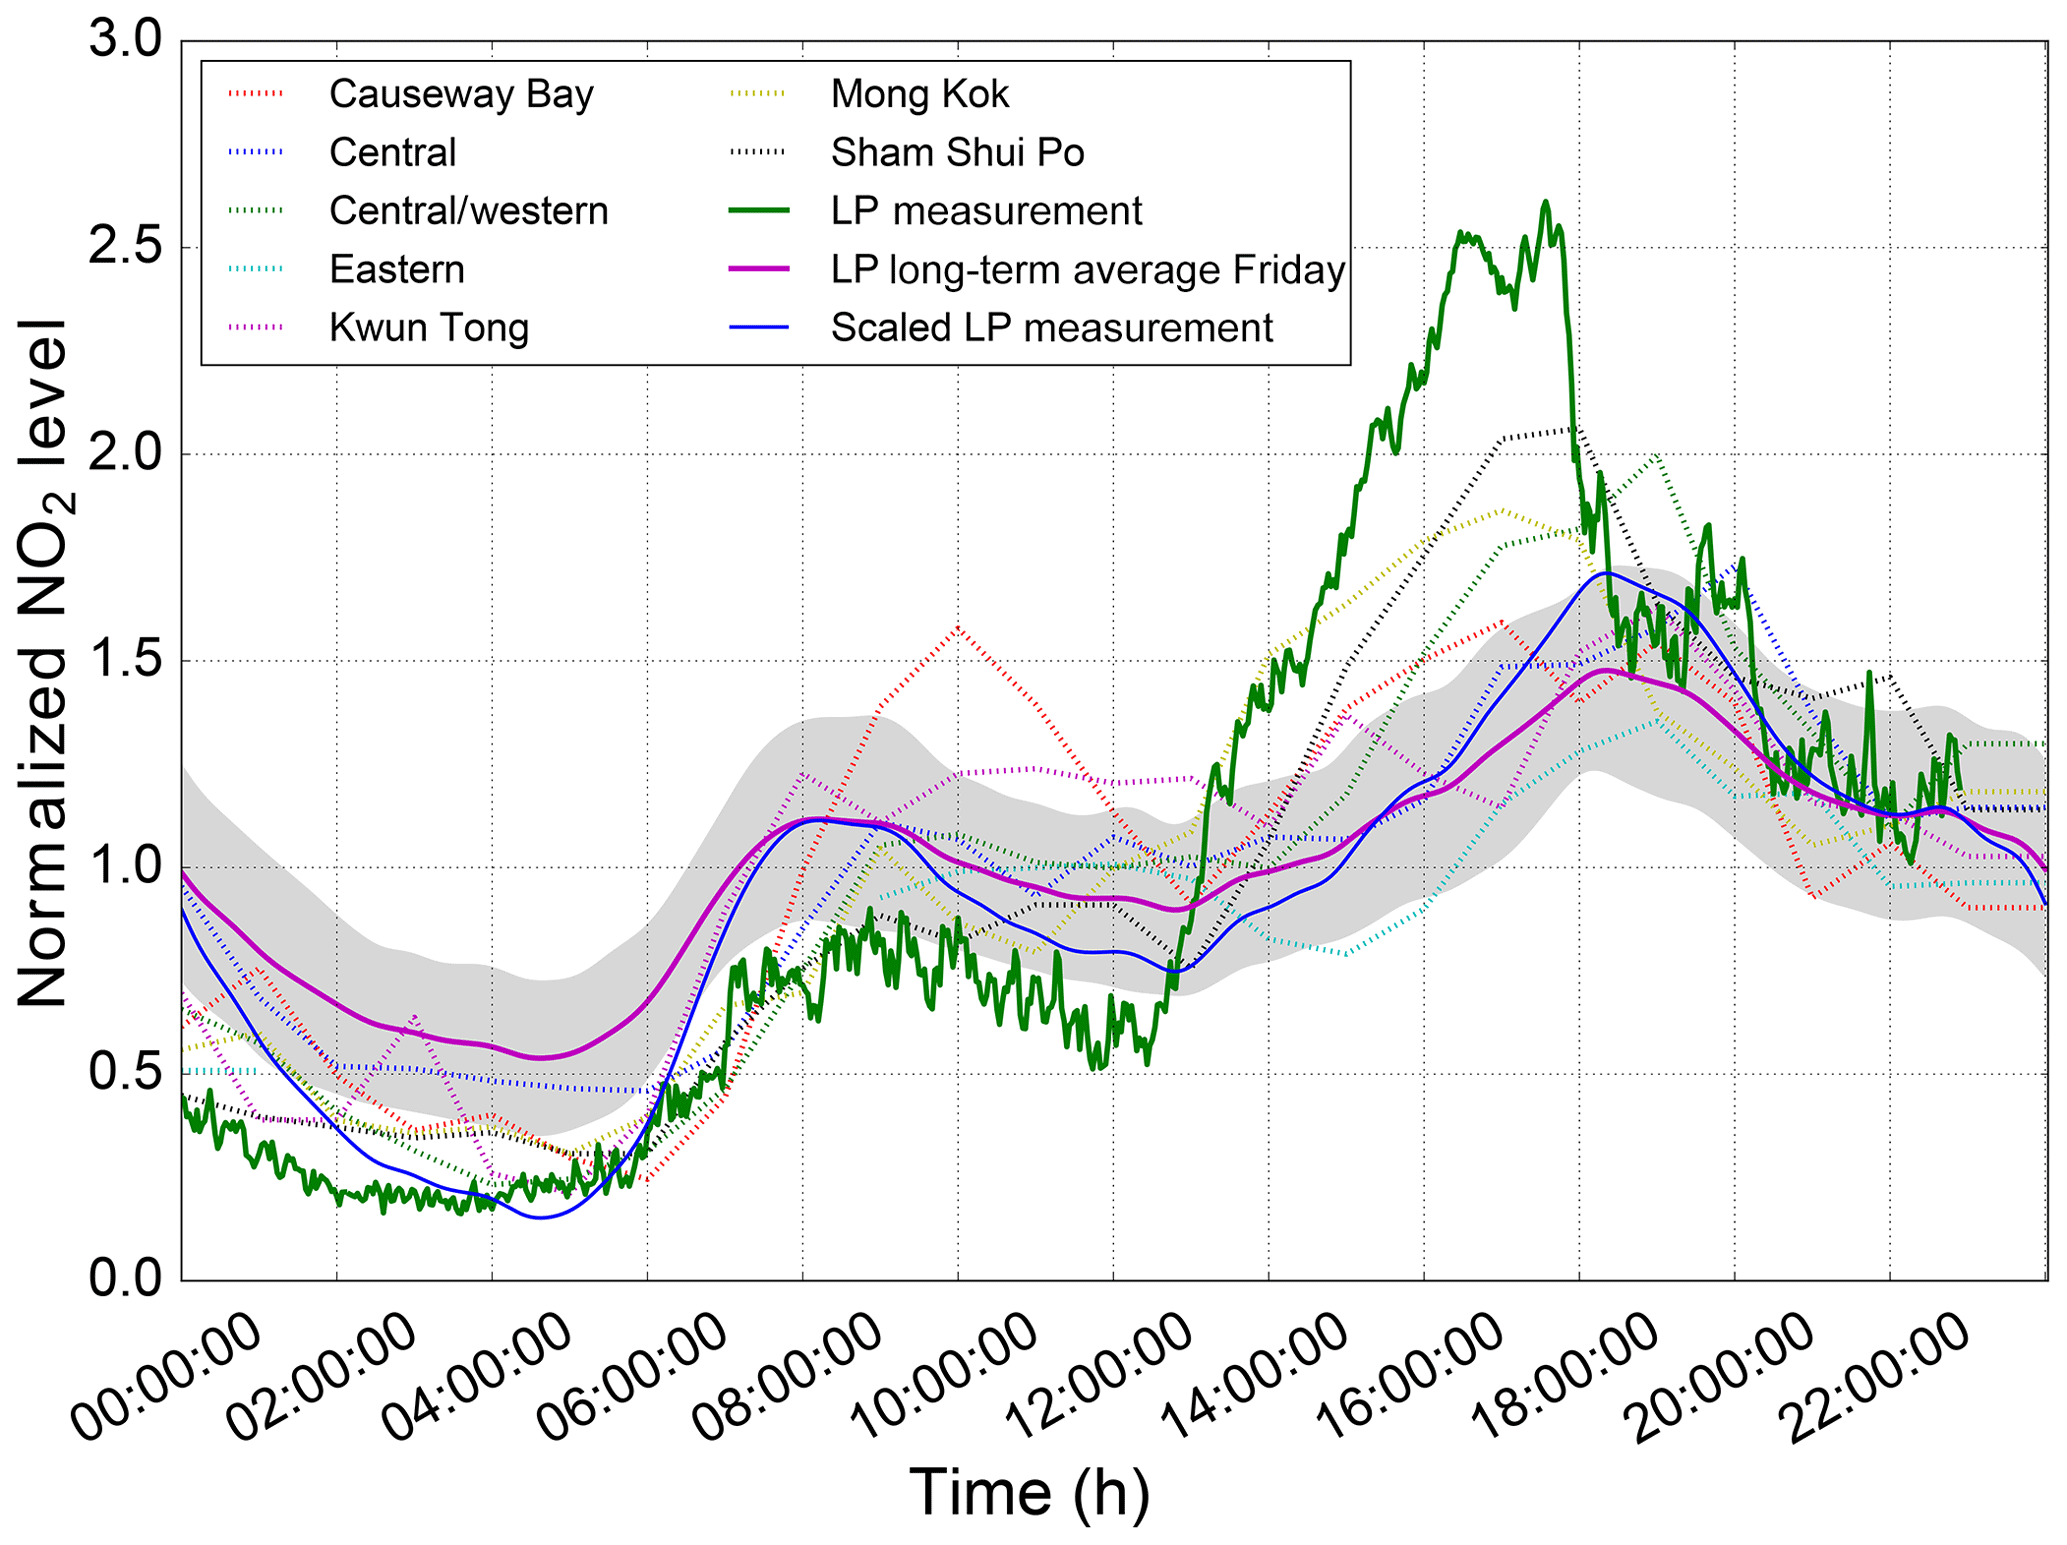
Figure 5Normalized diurnal cycle of NO2 on Friday in Hong Kong in 2010 measured by the LP-DOAS and EPD monitoring stations. EPD measurements on 17 December 2010 from seven monitoring stations are indicated as a dashed line. The green curve represents LP-DOAS measurement, while the purple line is the 2-year averaged diurnal pattern with shaded area of the 1σ standard deviation variation. The blue line shows the scaled and shifted diurnal pattern of ambient NO2 on Friday 17 December 2010.
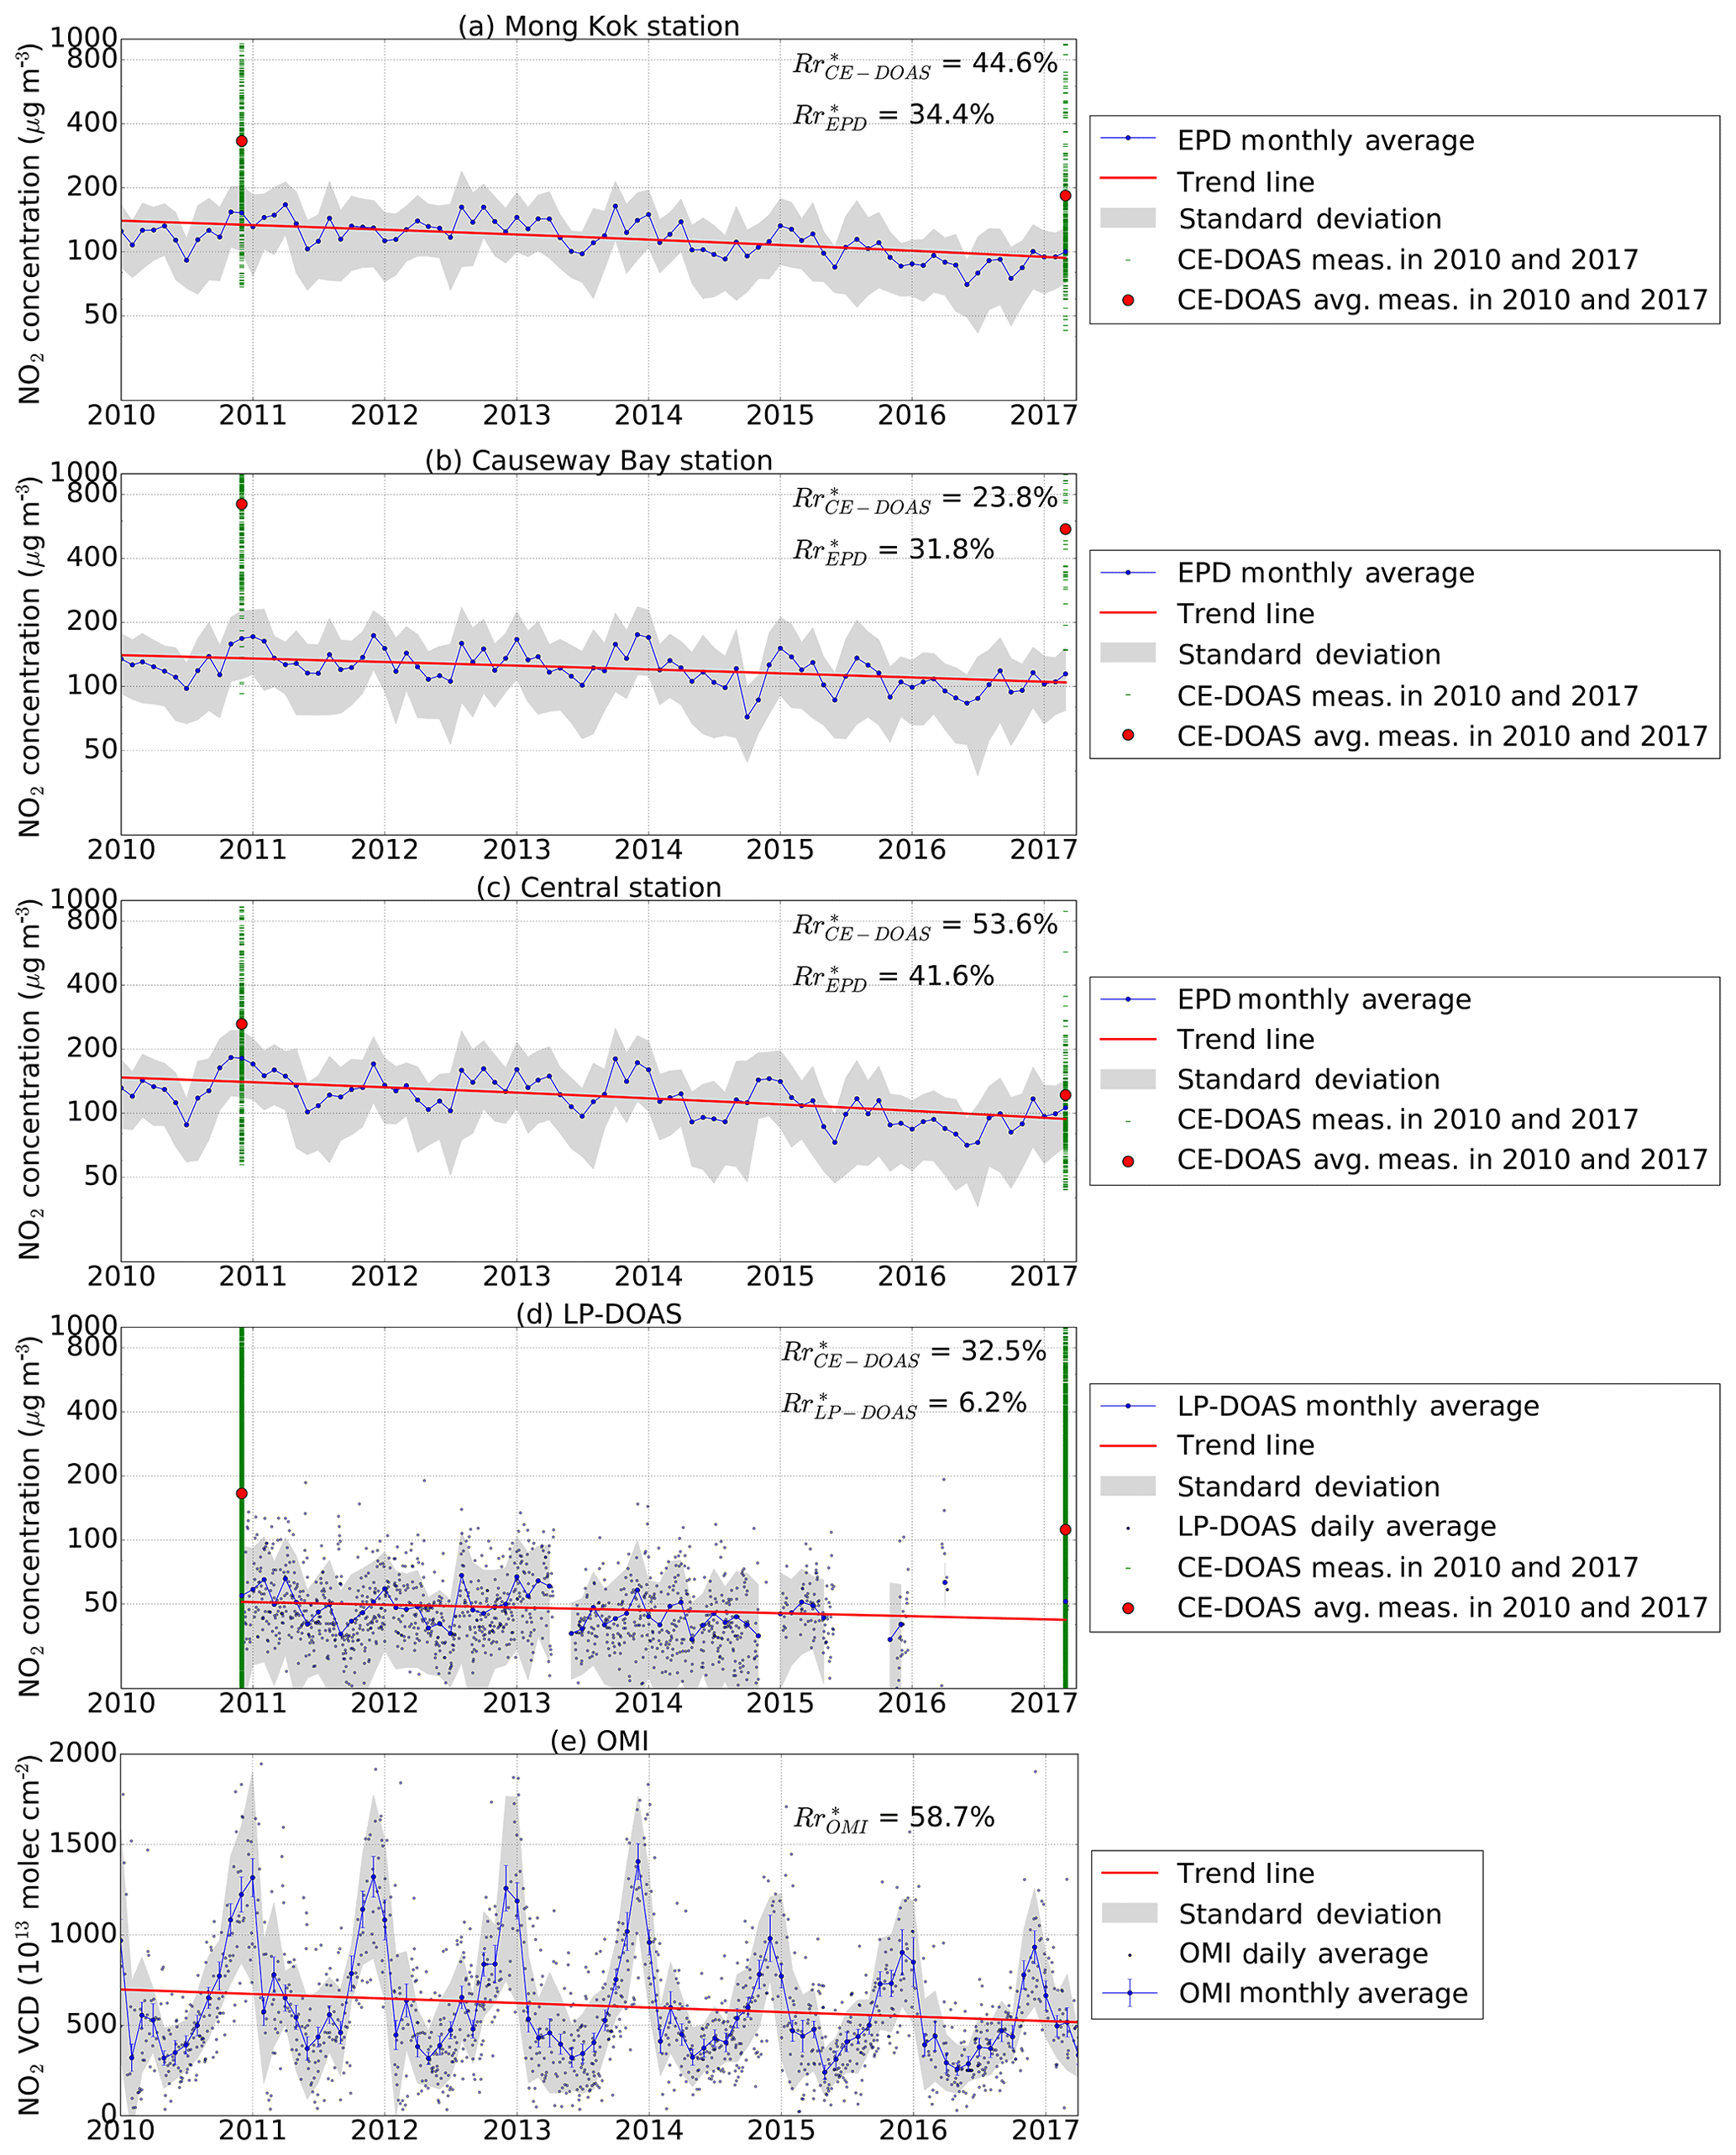
Figure 6Monthly averaged daytime NO2 concentration from January 2010 to March 2017 measured by three EPD stations and LP-DOAS. Red dots indicate the averaged NO2 concentration measured by the CE-DOAS within 100 m radius of (a) Mong Kok, (b) Causeway Bay and (c) Central roadside station. Panel (d) shows the CE-DOAS measurements within a 1 km radius of the centre of the LP-DOAS measurement path and monthly daytime averaged ambient NO2 levels observed by the LP-DOAS. Panel (e) shows the monthly averaged OMI tropospheric NO2 VCDs over Hong Kong. The reduction rates, Rr, indicated on the figures are calculated by taking the relative difference between averaged data taken in December 2010 and March 2017. The low reduction of LP-DOAS is due to sparse measurements in March 2017.
On-road, ambient and satellite measurements of NO2 all show a decreasing trend. Ambient NO2 levels measured by the LP-DOAS show a descending trend with a rate of 2.5 % yr−1. Stronger decreasing trends of roadside NO2 are observed by EPD in Mong Kok, Causeway Bay and Central roadside station with annual decreasing rates of 4.4 %, 3.3 % and 4.8 %. A similar reduction rate is also observed by on-road CE-DOAS measurements. The CE-DOAS measurement taken in 2010 and 2017 are compared: on-road NO2 levels are reduced overall by 28 % for areas along the standard measurement route, which would correspond to an annual decreasing rate of 4.0 %. NO2 levels in 85 % of the measurement area are significant reduced (>1 ppbv) by 37 % on average, whereas NO2 levels in 14 % of the area are elevated (>1 ppbv) by 22 % on average. The reduction rate for on-road NO2 levels around the EPD roadside monitoring stations varies from 24 % to 54 %. This reduction change can also be observed from space by OMI satellite. Tropospheric NO2 VCDs show a descending trend with a rate of 3.7 % yr−1. In addition, Fig. 7a and b show tropospheric NO2 VCDs over the Pearl River delta from 1 November 2010 to 31 January 2011 and from 1 February to 31 April 2017. In general, tropospheric NO2 VCDs are reduced by ∼50 % (7 % yr−1) over Hong Kong, while the reduction over Pearl River delta ranges from 30 % to 60 %.
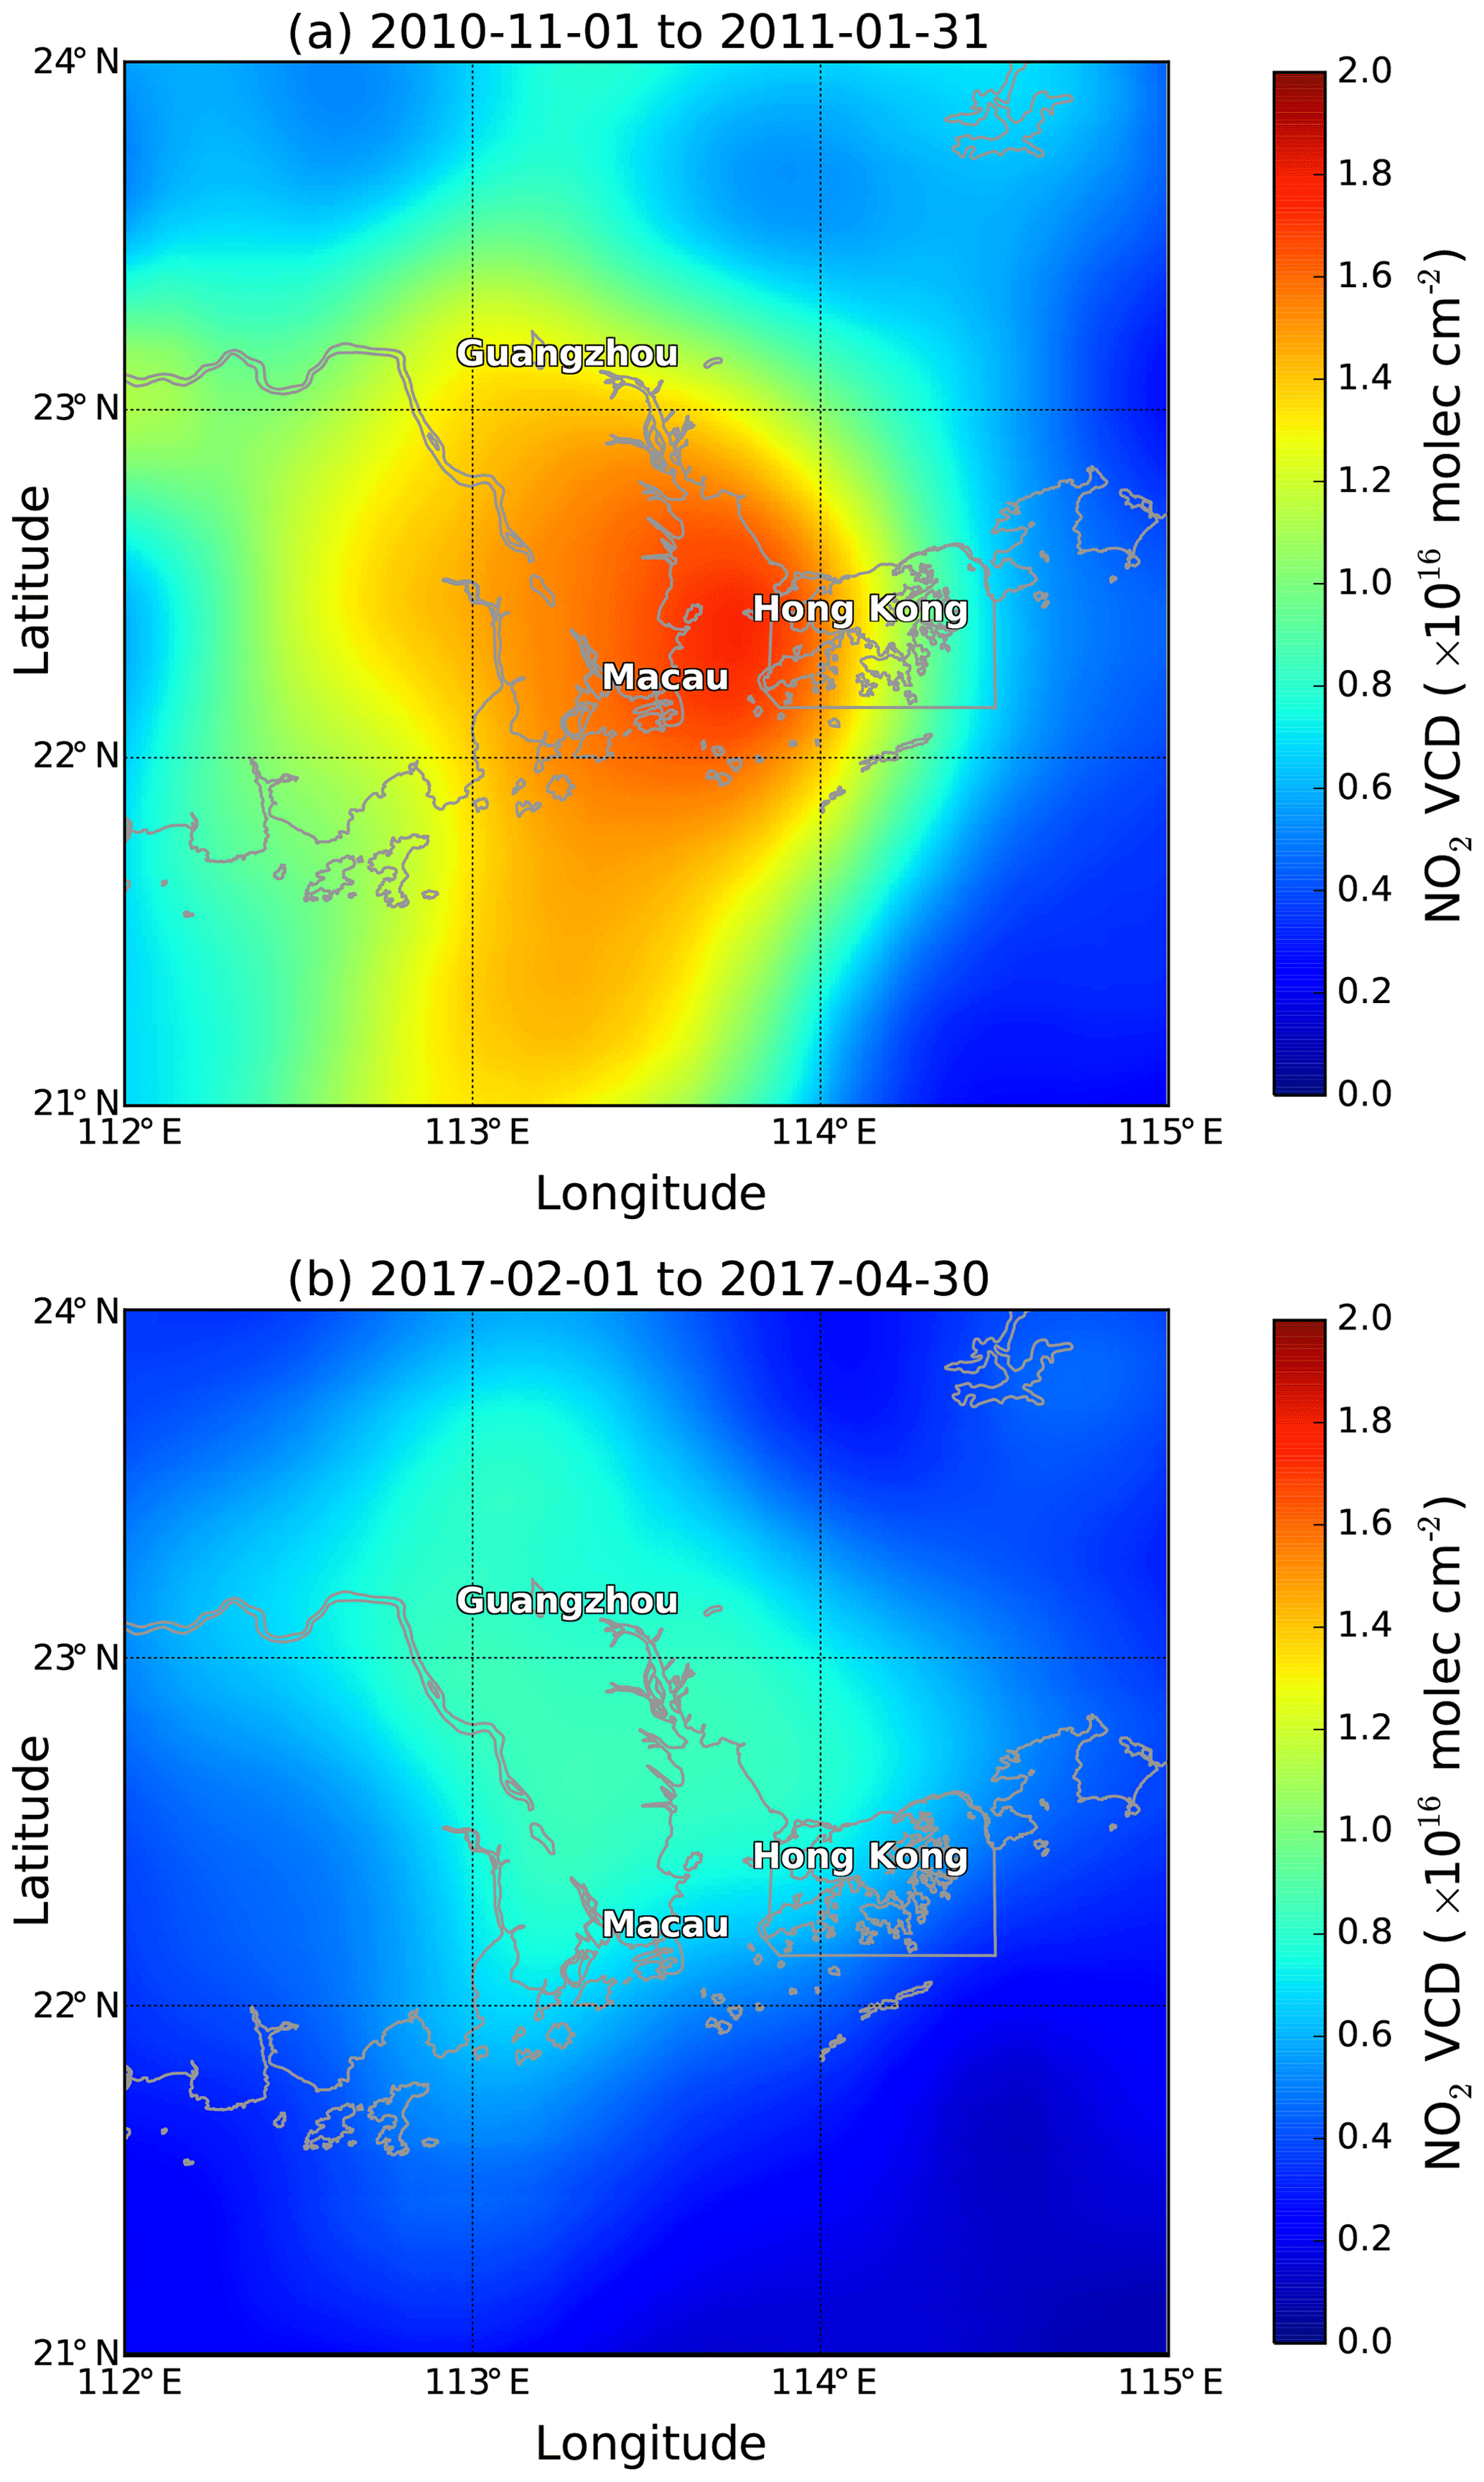
Figure 7Averaged OMI tropospheric NO2 VCDs over Pearl River delta (a) from 1 November 2010 to 31 January 2011 and (b) from 1 February 2017 to 31 April 2017.
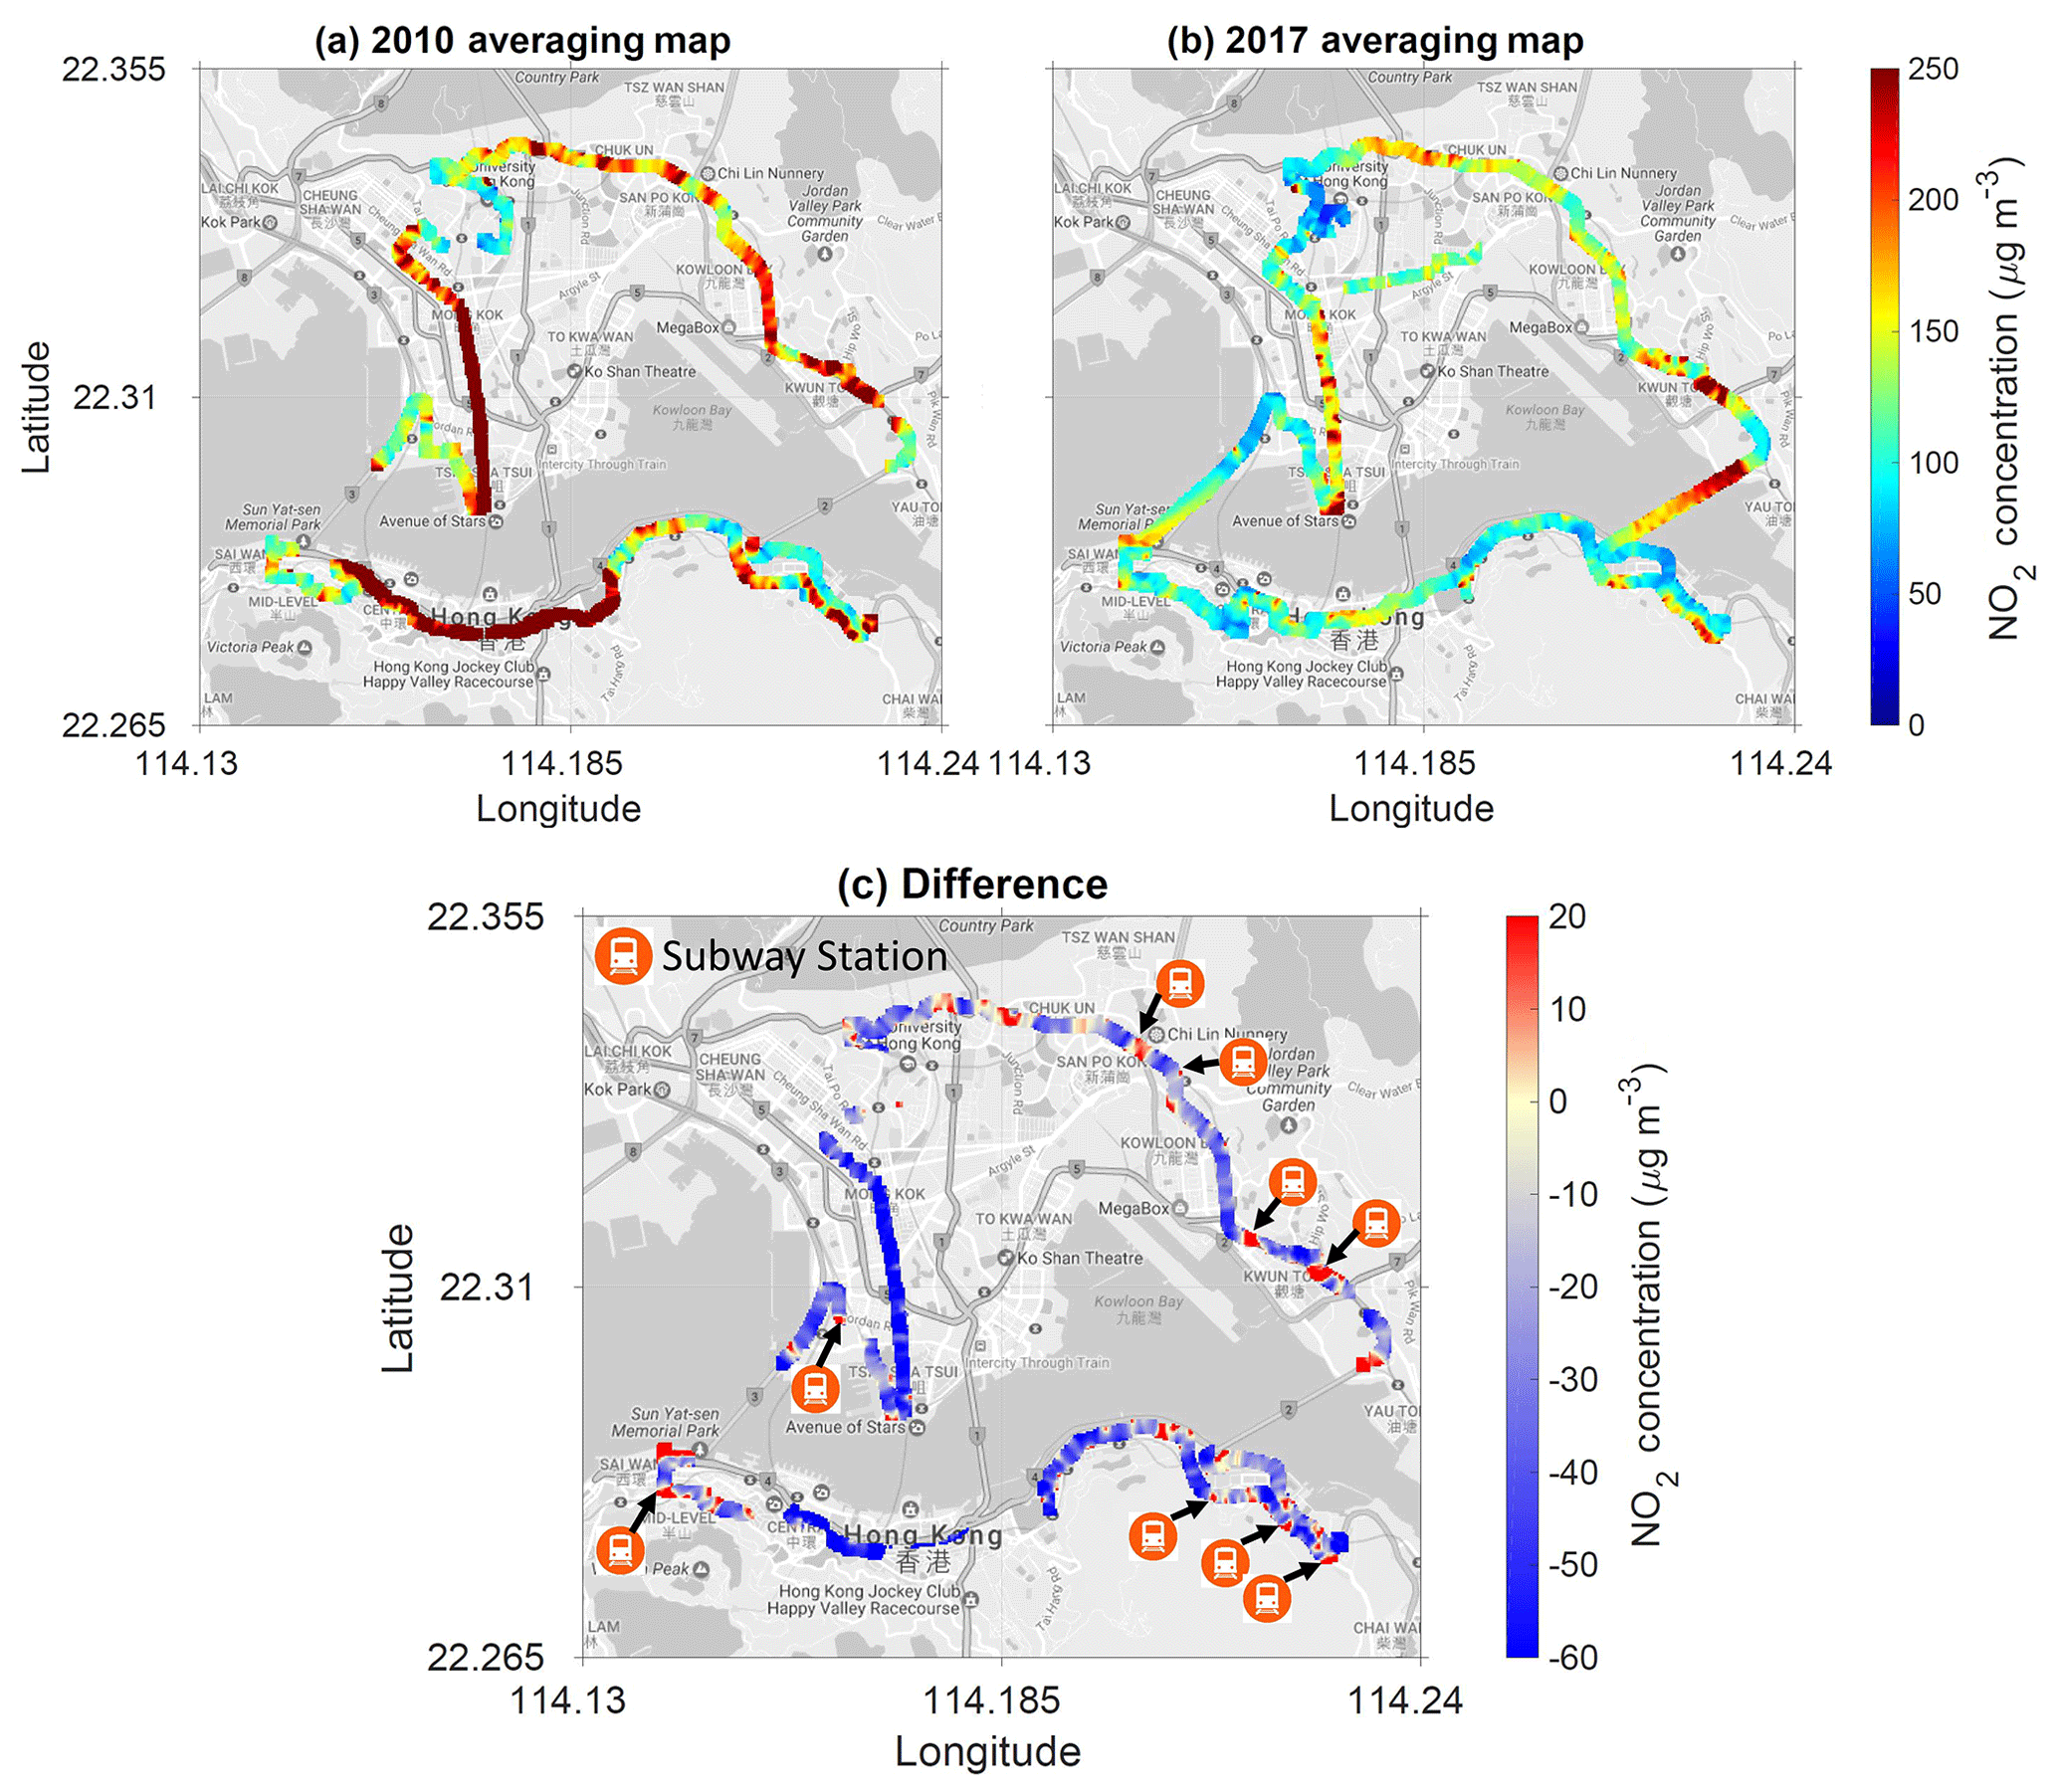
Figure 8Averaged on-road NO2 concentrations measured along the standard route during (a) December 2010 and (b) March 2017. Panel (c) shows the relative differences between 2010 and 2017. The markers indicate the location of metro stations. Measurements taken during morning rush hours, noontime and evening rush hours are weighted equally in the averaging.
Averaged on-road NO2 concentrations measured along the standard route during December 2010 and March 2017 are shown in Fig. 8a and b, the differences in Fig. 8c. The measurement routes are slightly different due to road constructions and maintenance. The two measurement campaigns were carried out in winter and early spring. We have analysed the meteorological parameters including temperature, humidity, wind speed and wind direction taken during the two measurement campaigns. The results show that the meteorological conditions are quite similar during the two campaigns. In general, a significant reduction (ranging from 20 % to 50 %, and on average 4 % yr−1) of on-road NO2 can be observed, which is consistent with the LP-DOAS and EPD monitoring data. The reduction of the on-road NO2 level along Nathan Road, the busiest road in Kowloon, is ranging from 50 % to 60 % (around 7 % to 8 % yr−1). On the other hand, an enhancement of the NO2 level can be observed around subway stations, e.g. Hong Kong University station, Kwun Tong station, Diamond Hill station, and Ngau Tau Kok station. It probably reflects the fact that there are more bus terminals or bus stops surrounding metro stations in 2017 compared to 2010. Data from the transport department show that the total number of licensed franchised buses has slightly increased by 3 % from 5729 in 2010 to 5916 in 2016 (http://www.td.gov.hk/en/transport_in_hong_kong/transport_figures/monthly_traffic_and_transport_digest/index.html, last access: 30 November 2018). Although the number of franchised buses only has a small contribution to the total number of vehicles in Hong Kong (608 000 in 2010, 746 000 in 2016), franchised buses can account for up to 40 % of the traffic at busy traffic corridors (http://www.info.gov.hk/gia/general/201512/31/P201512310204.htm, last access: 30 November 2018). Average daily public transport usage also increased from 11.6 million times per day in 2010 to 12.6 million times per day in 2016. According to the annual reports of Transport International Holdings Limited, the parent company of the Kowloon Motor Bus Company, the largest franchised bus operator in Hong Kong, the total number of buses running by the company increased slightly from 3988 in 2010 to 4162 in 2016. However, the number of bus routes reduced from 393 in 2010 to 384 in 2016. These changes are mainly due to the reformation of the operational strategies of the franchised bus operators. Due to the expansion of the metro system in Hong Kong, the role of buses has gradually changed from point-to-point long-distance services to a connector between destinations and metro stations. Therefore, enhancement of NO2 levels is observed around metro stations. On the other hand, franchised bus operators in Hong Kong started to introduce low-emission buses (i.e. Euro IV and V) in 2009. Buses with models earlier than Euro III are proven to be more polluted than the latest models (Dallmann et al., 2011; Lau et al., 2015; Mock, 2014; Pastorello and Melios, 2016). Therefore, bus companies started to install a retro fit catalytic convertor on earlier bus models and these buses will be replaced completely by buses with higher emission standards by 2021. In addition, the government set up low-emission zones (LEZs) for franchised buses in three busiest traffic corridors in Hong Kong on 31 December 2015. Buses with emission standards below Euro IV are not allowed to operate within these low-emission zones. Therefore, both roadsides and their nearby ambient NO2 levels show a descending trend. Navigation (water transport), road transport and public electricity generation are the largest sources of NOx according to the 2015 Hong Kong Emission Inventory Report and data from the EPD Hong Kong Air Pollutant Emission Inventory, accounting for 33 %, 30 % and 25 % of total NOx emissions in 2010 (only NOx is available in the EPD inventory) and 37 %, 18 % and 28 % in 2016, respectively. NOx emissions from navigation and public electricity generation are rather constant, while emissions from road transport show a significant reduction of ∼50 % from 32.1 t in 2010 down to 16.2 t in 2015. This is coherent with the decreasing trend in NO2 from 2010 to 2017.
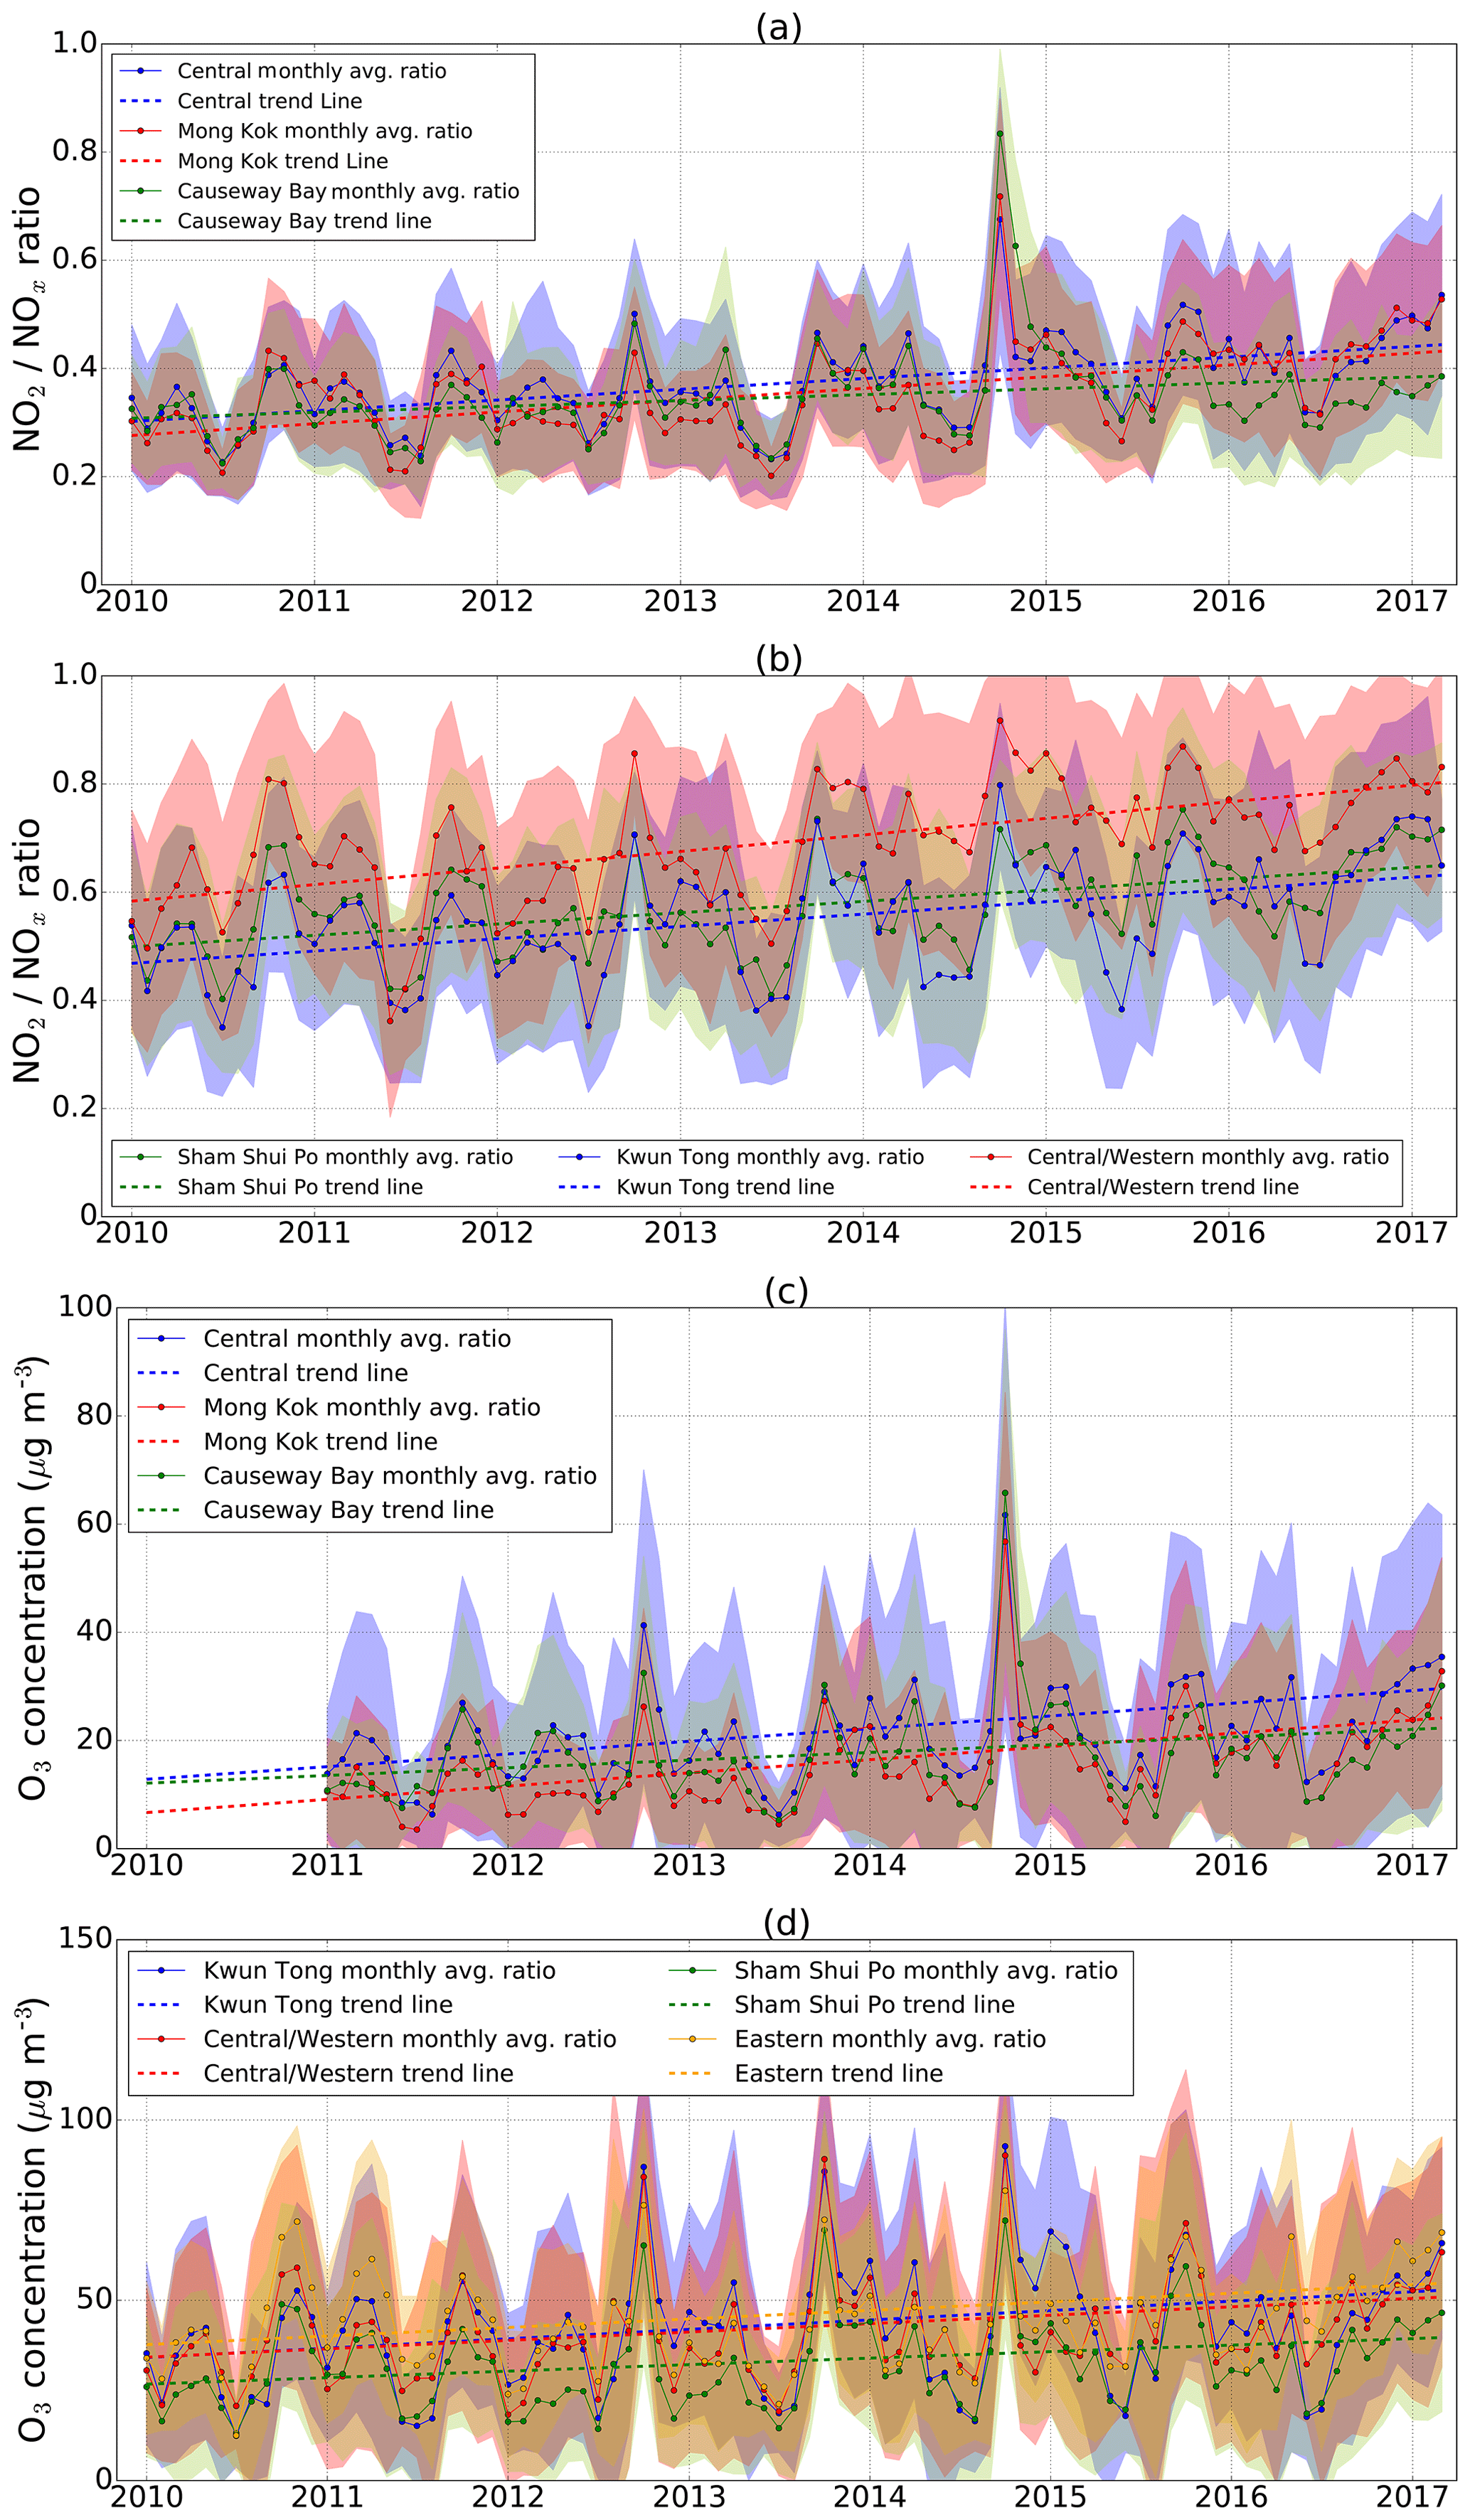
Figure 9Monthly averaged NO2∕NOx ratio from EPD at (a) roadside stations and (b) ambient stations. O3 concentrations measured by EPD at (c) roadside stations and (d) ambient stations are shown. Shadowed area indicates the 1σ standard deviation variation of measurements.
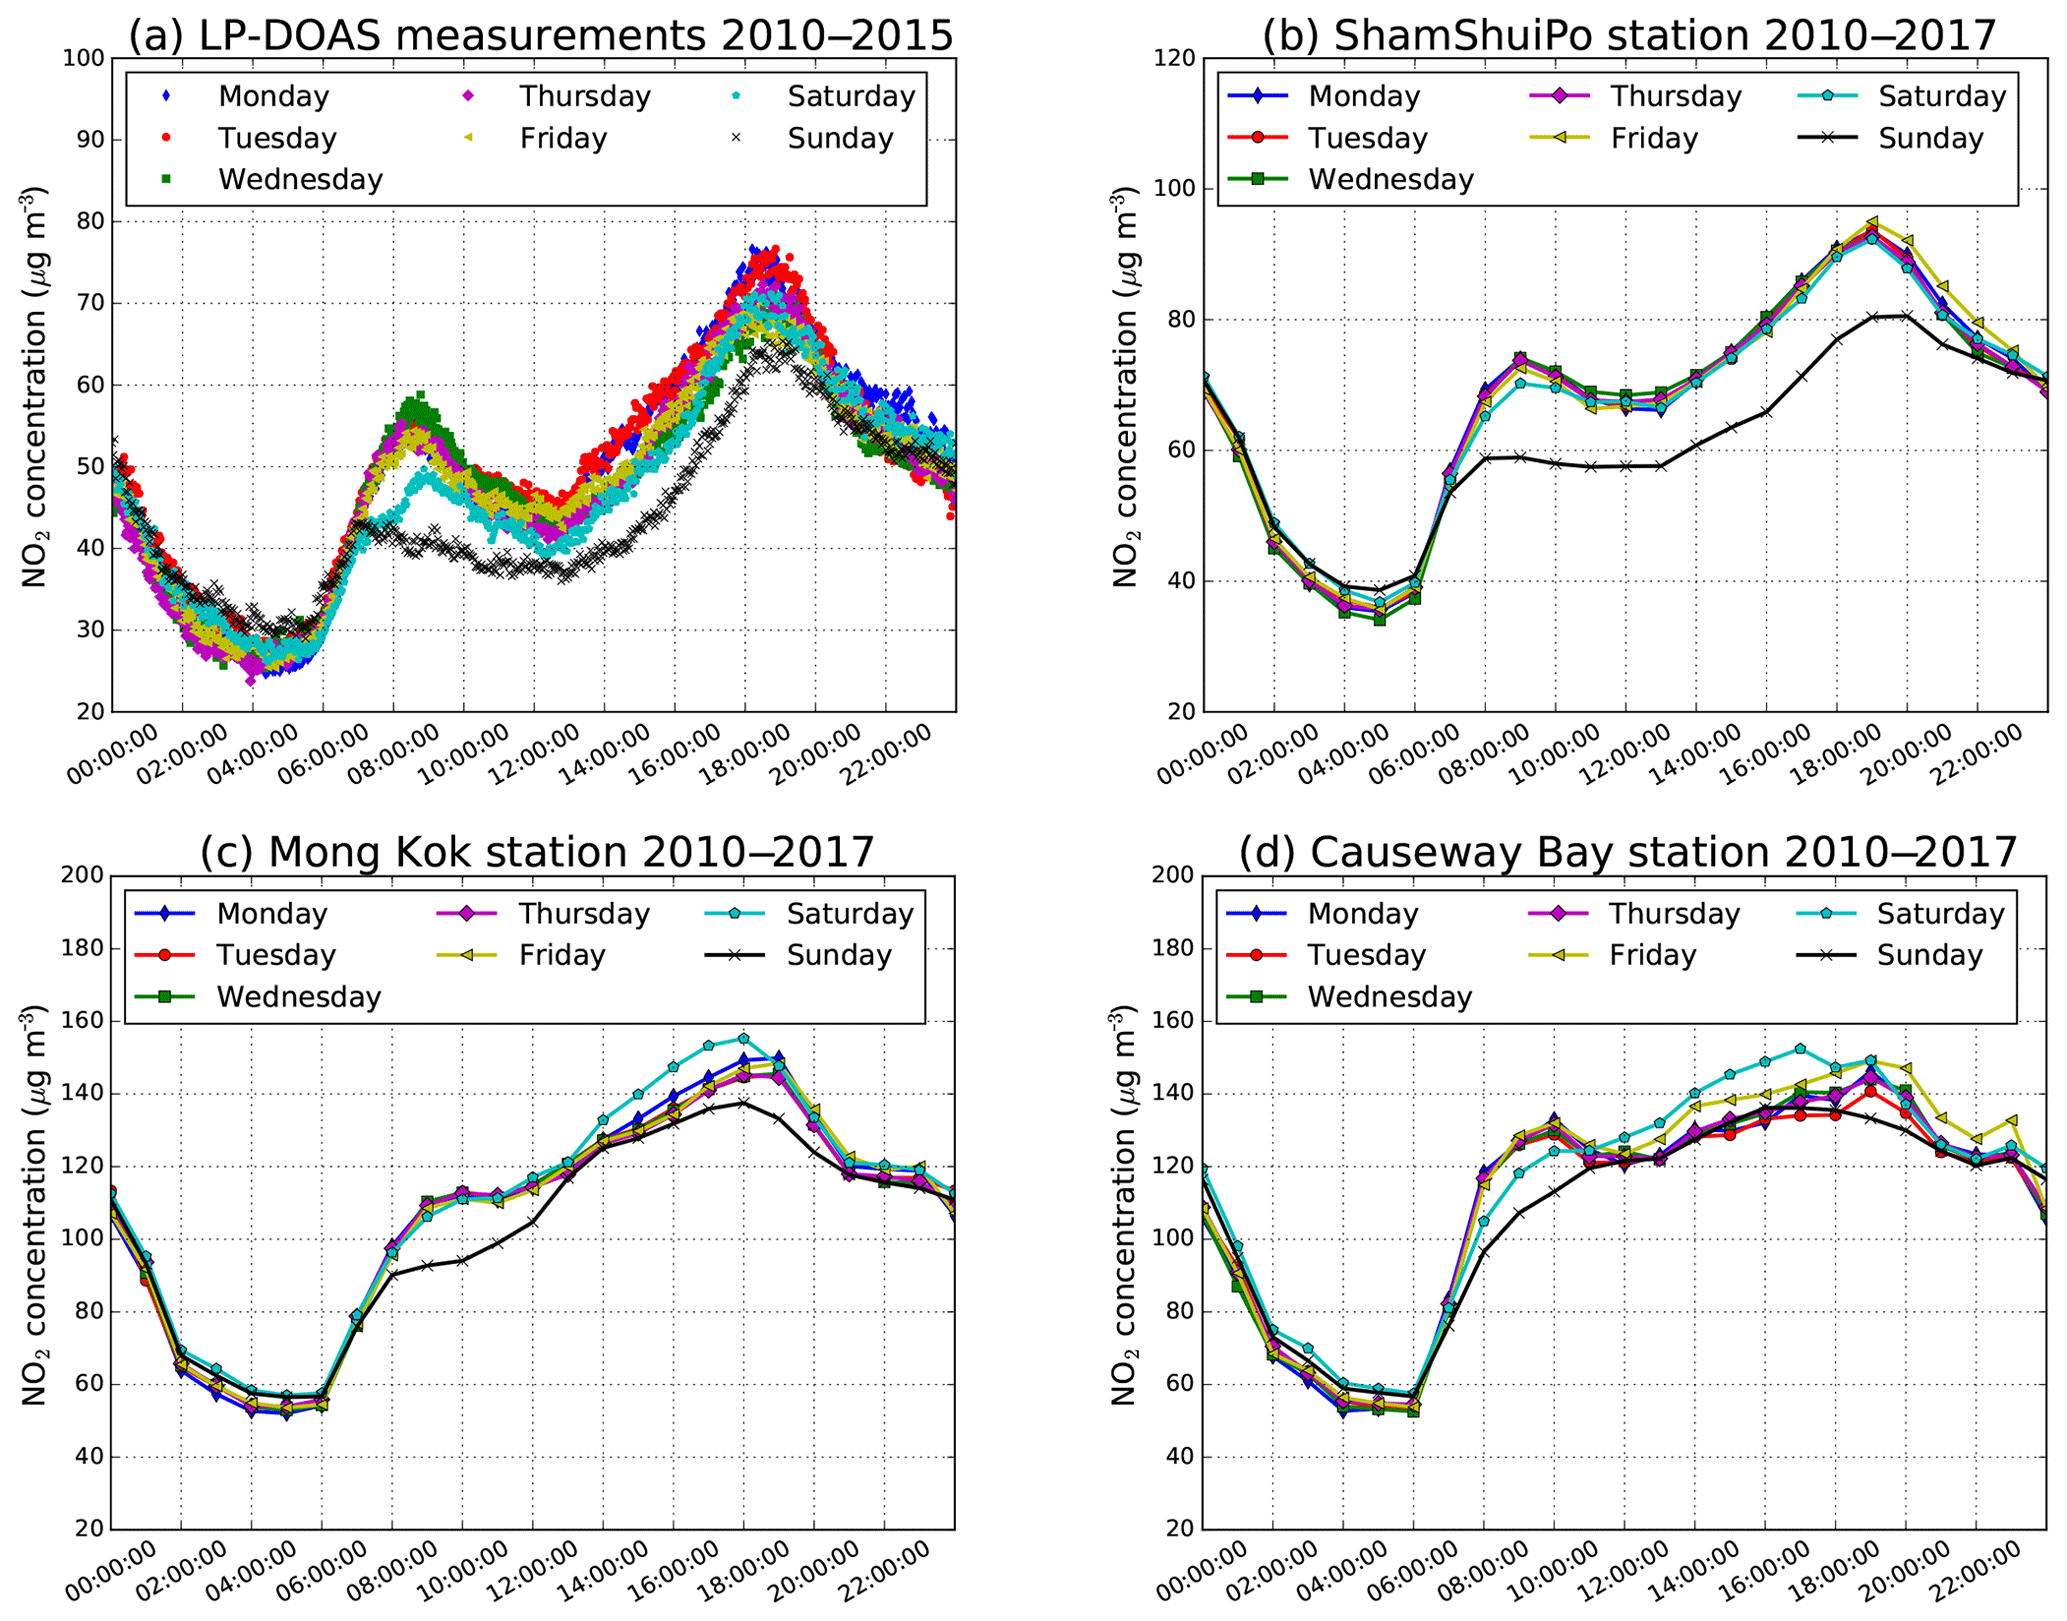
Figure 10Panel (a) shows the 5-year average diurnal cycle of NO2 of each day of the week was measured by LP-DOAS. The 7-year average diurnal cycle of NO2 of each day of the week measured by EPD at (b) Sham Shui Po station, (c) Mong Kok station and (d) Causeway Bay station.
We have looked into the NO2∕NOx ratio as well as the O3 concentration in order to better understand the impacts of reduction of vehicular emission of NOx. An increasing trend in the NO2∕NOx ratio is observed from both roadside and ambient monitoring stations. Figure 9 shows the NO2∕NOx ratio for (a) roadside and (b) ambient stations. Ozone concentrations from both (c) roadside and (d) ambient stations are shown for reference. Decreasing roadside NO2 level with an increasing NO2∕NOx ratio implies a significant reduction of primary NO emissions. The reduction of primary NO could be subjected to the upgraded catalytic converter of diesel vehicles (from Euro III or earlier models to Euro IV and V), which reduces the total NOx emission and increases the NO2∕NOx ratio (Kašpar et al., 2003). Newer diesel engines in general reduce the total NOx emission by ∼50 % according to the European emission standards for diesel passenger cars (EU emission standards, 2007). The Euro III diesel engine emissions limit of NOx is 0.50 g km−1, whereas the Euro IV emissions limit has been reduced by half to 0.25 g km−1. However, this standard might not fully reflect the real driving condition (Franco et al., 2014) and it should be confirmed by more realistic mobile measurements. Furthermore, Tian et al. (2011) observed a rising roadside NO2∕NOx ratio as well, coinciding with the introduction of new environmental friendly pre-Euro light- and heavy-duty vehicles in 2000 and 2003. Ning et al. (2012) also suggested that the proposal of replacing Euro II and III franchised buses to meet Euro IV or even higher emission standards will result in an increase in the roadside NO2∕NOx ratio. In addition, a general rising trend in ambient and roadside ozone is also observed from the EPD monitoring data. The increase in atmospheric NO2∕NOx with a large reduction of NO may be partly related to the recent increase in the ambient O3 level, as less NO is available for the titration process under a heavy NOx environment. However, it is difficult to quantify the contribution of an increase in ozone on the NO2∕NOx ratio. Discussion of the interaction between O3 and NOx is, however, beyond of the scope of the paper.
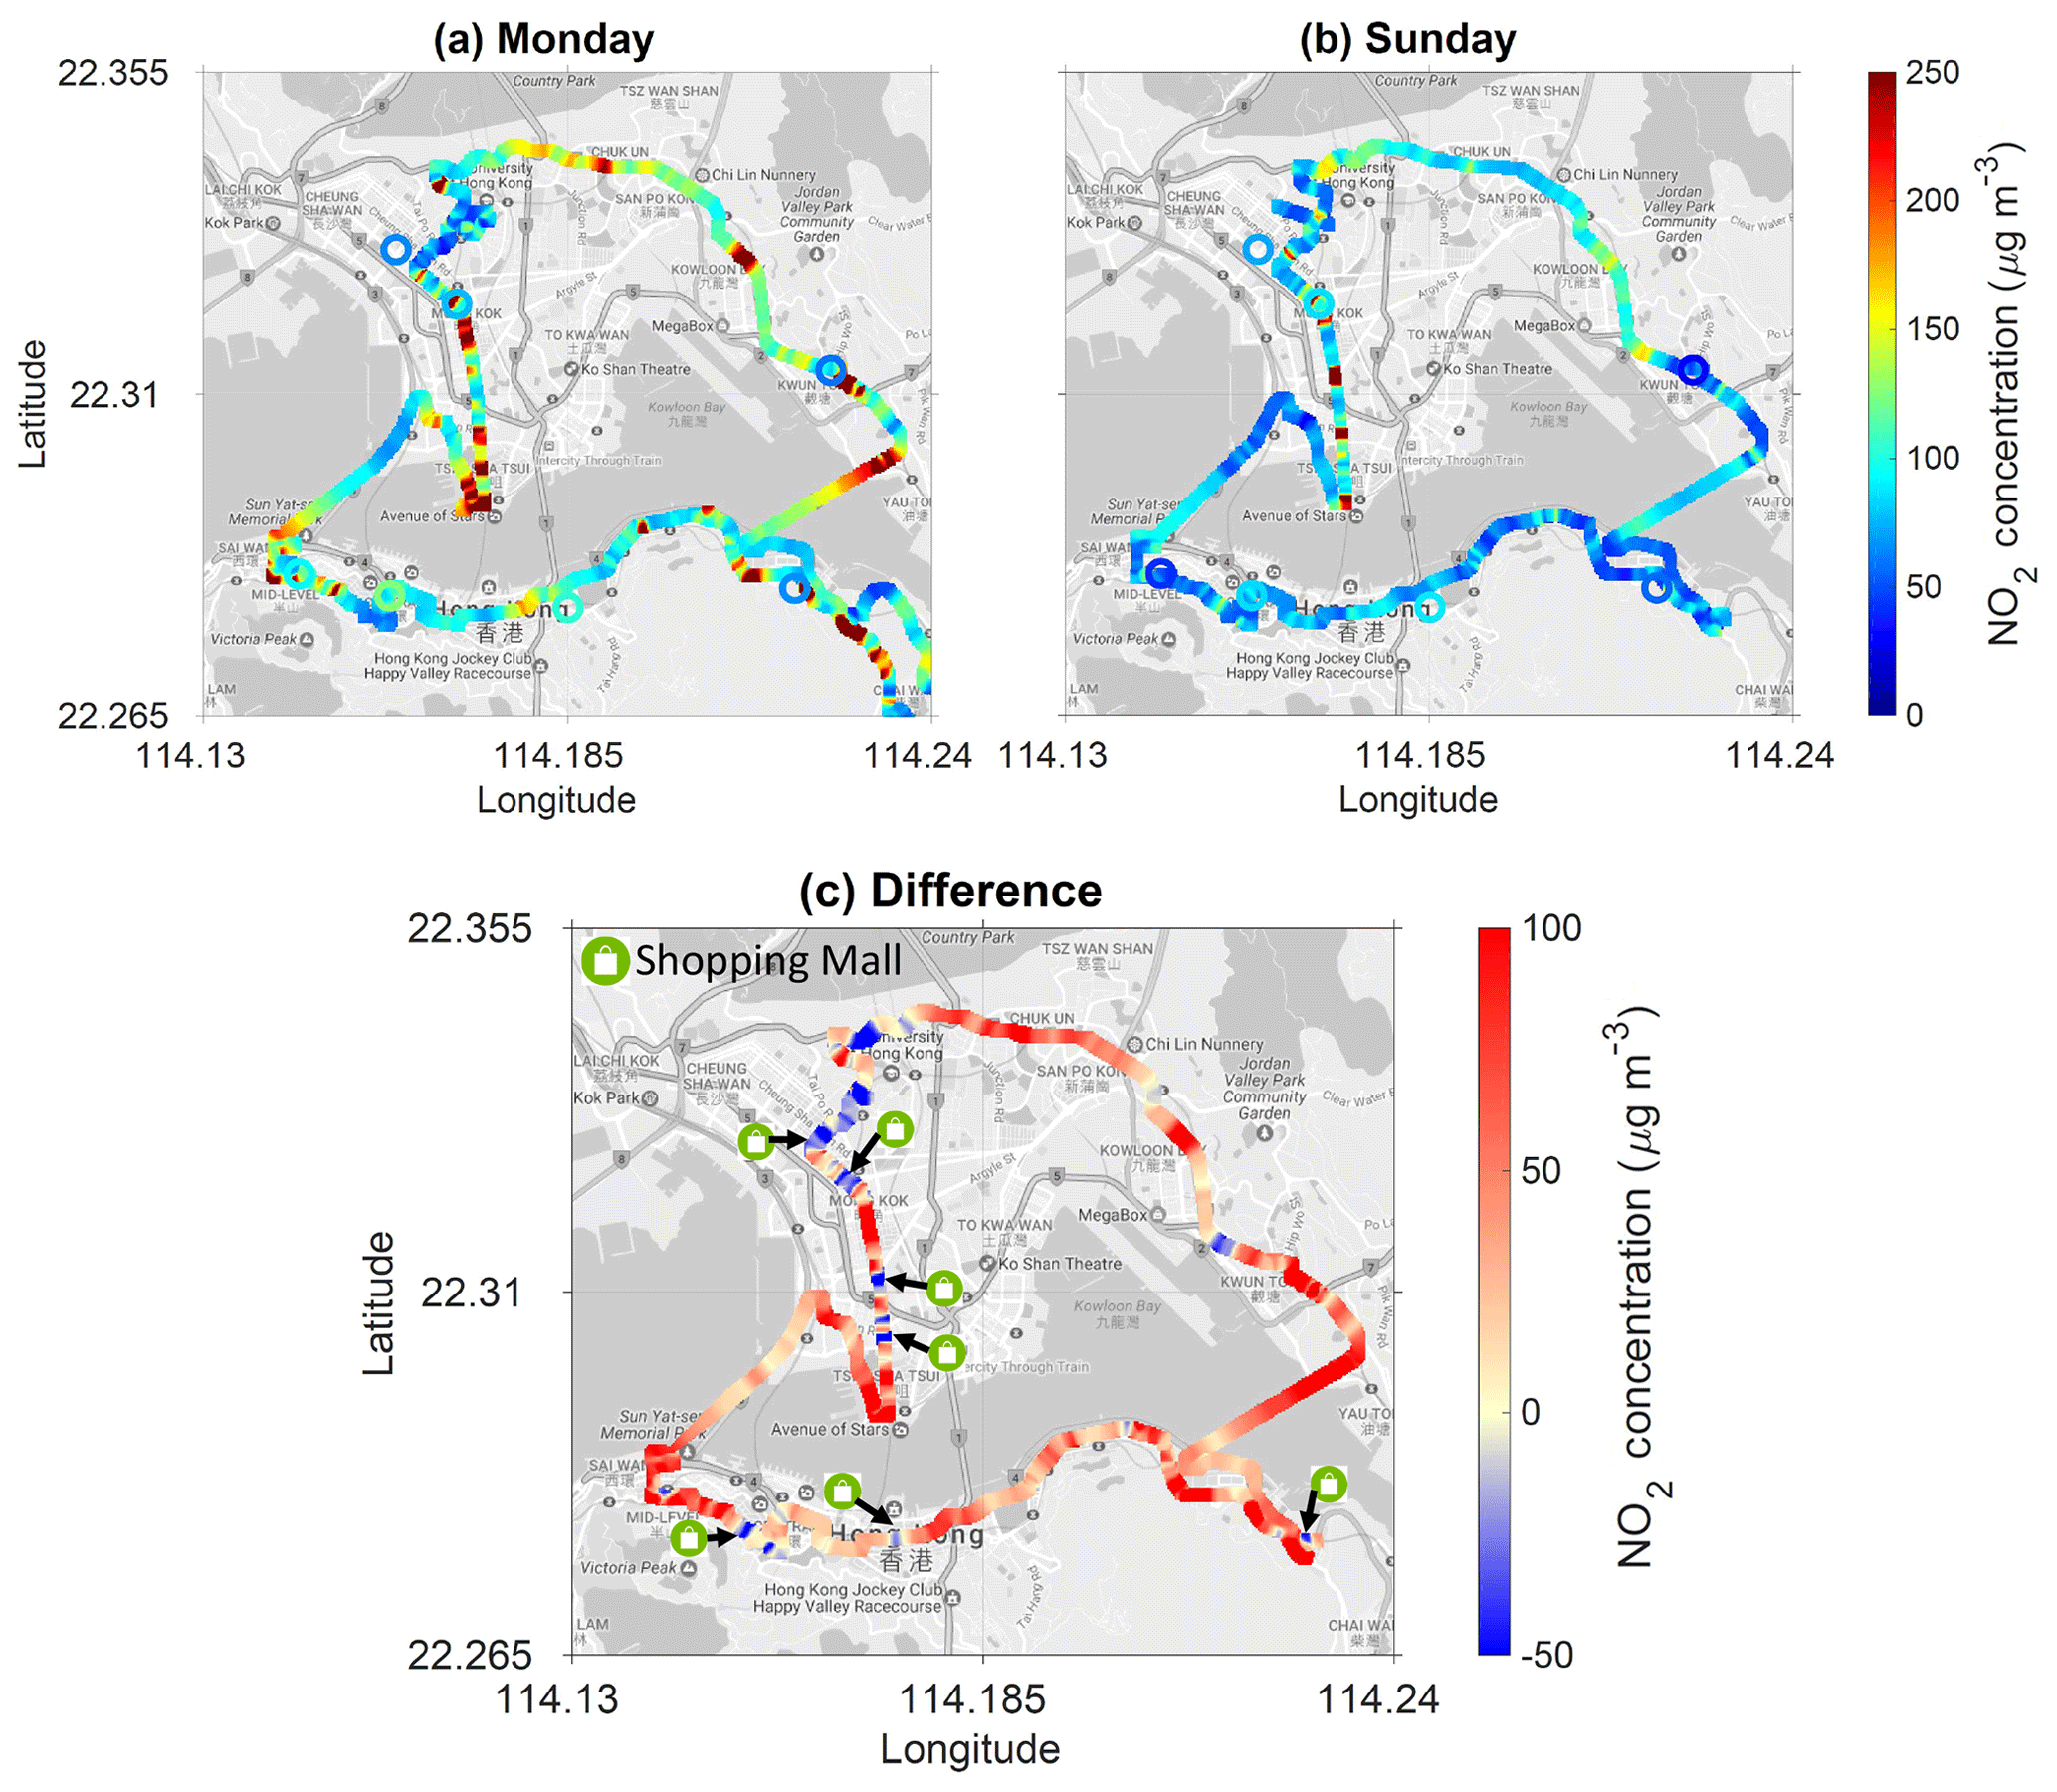
Figure 11Mobile CE-DOAS measurement of on-road NO2 on (a) Monday (6 March 2017) and (b) Sunday (5 March 2017). Coinciding NO2 concentrations measured by the seven EPD stations are shown on the map as circle markers for reference. The colour scale of the EPD measurements is the same as the mobile measurements. Panel (c) shows the differences between Monday and Sunday. The markers indicate the location of major shopping malls.
3.4 Weekend effect
Figure 10a shows the 5-year average diurnal cycle of NO2 of each day of the week measured by LP-DOAS, and the 7-year average NO2 diurnal patterns measured by EPD Sham Shui Po, Mong Kok and Causeway Bay station are shown in Fig. 10b, c and d. The diurnal patterns of NO2 illustrate different characteristics between the weekdays and weekend. Different measurement locations also show different characteristics of NO2 during the weekend. The LP-DOAS measurement indicates that the NO2 concentration is on average 3.3 % lower on Saturday and 8.7 % lower on Sunday compared to the weekdays. However, the morning rush hour (08:00 to 10:00 UTC + 8) peak of NO2 is significantly reduced by 23.1 % on Sunday, while the evening rush hour (18:00 to 20:00 UTC + 8) peak shows a less-pronounced reduction of 9.7 %. NO2 measurements from the Sham Shui Po ambient station and the LP-DOAS show a similar diurnal variation pattern and weekend reduction. The weekend reduction is less pronounced for the roadside measurements in Mong Kok. The NO2 level is on average 3.8 % lower on Sunday compared to the weekdays, with reduction during the morning and evening rush hours of 13.1 % and 7.3 %, respectively. Similar weekend reductions are also observed by other EPD roadside stations, i.e. Causeway Bay and Central. These differences in the diurnal cycle are most likely due to different types of land use. Traffic emissions are the main source of NO2 in urban areas, which is strongly dependent on human activities. In residential areas, traffic is reduced during the weekend as most of the residents do not work on Sundays; e.g. the frequency of buses is reduced during the weekend. However, the traffic load is mostly unchanged in commercial areas, since shops are also open on Sundays.
In order to further investigate the relationship between residents' activities during the weekdays and weekend and NO2 emissions, we have looked into the morning standard route measurements on a sequential Sunday and Monday in 2017. Two sequential days are used for comparison so as to avoid influences from different meteorological conditions. NO2 concentration maps measured on Sunday and Monday are shown in Fig. 11a and b and their difference in c. Coinciding NO2 concentration measured by the seven EPD stations is also shown for reference. The NO2 level on Sunday is on average about 45 % lower than that of Monday. The mobile measurements are in general agreement with coinciding EPD data, while discrepancies can be observed for peak values captured by the more frequently measuring CE-DOAS. This discrepancy is mainly due to the difference in measurement time. Mobile measurements recorded the instant concentration of on-road NO2, which could easily be influenced by a single incident – the on-road NO2 level varies especially rapidly. On the other hand, EPD monitors provide hourly averaged NO2 concentrations, which tend to average out those local pollution peaks. Besides, four EPD ambient monitoring stations are located more than 15 m above ground level. Therefore, EPD ambient stations are expected to measure lower NO2 concentrations compared to on-road CE-DOAS measurements. In addition, NO2 concentrations of each location show rapid changes, which are highly dependent on the traffic flow. However, a consistent elevated NO2 level is observed over the most busy roads, such as Nathan Road in Kowloon and western and eastern Cross-Harbor tunnels. On Monday 85 % of the measurements show significantly higher (>1 ppbv) NO2 concentrations, whereas 13 % of the measurements show significantly lower (>1 ppbv) NO2 concentrations on Sunday. The spatial pattern of elevated NO2 level on Sunday matches the location of large shopping malls. Similar difference maps are observed between other workdays and Sunday. The number of licensed private cars grows by ∼30 % from 415 000 in 2010 to 536 000 in 2016, while the public transport usage increases by ∼9 % from 11.6 million times per day in 2010 to 12.6 million times per days in 2016 (http://www.td.gov.hk/en/transport_in_hong_kong/transport_figures/monthly_traffic_and_transport_digest/index.html). These numbers implied that the usage per private car is greatly reduced. The decrease in private car usage is mainly due to the reduction in daily commuters using private cars, which is coherent with the increase in public transport usage. As a result, most of the private cars are mainly used during the weekends in Hong Kong. People are taking public transport for their daily commute to avoid traffic jams during the weekdays, while they go shopping in their own cars at the weekend. The parking spaces are limited around these shopping areas, resulting in low-speed cruising and traffic congestion during the weekend. As a consequence, an enhancement of NO2 level can be observed over these locations. This is an interesting example of how people's daily lives influence the pollution patterns.

Figure 12(a) Averaged spatial distribution of NO2 in Hong Kong measured by the mobile CE-DOAS in 2010. (b) Normalized spatial distribution of NO2 over Hong Kong measured by the mobile CE-DOAS in 2010. The CE-DOAS data are normalized using coinciding normalized LP-DOAS data. The black box indicates the area of the city centre used for the other maps. The standard route measurement was taken 3 times per day, while other locations only have a single or a few overpasses during the two campaigns.
3.5 Spatial distribution of NO2 in Hong Kong
In order to have a better overview of major pollution hotspots in Hong Kong, all measurements taken in 2010 were spatially averaged to a high-resolution grid of 20 m × 20 m (Fig. 12a). These measurements covered most of the major roads in Hong Kong, including highway, urban, suburban and rural areas. As the spatial coverage of measurements taken in 2010 and 2017 is quite different and there is a general decreasing trend in NO2, we only use data measured in 2010 for the spatial distribution analysis to avoid any bias toward lower values over the city centre. Elevated NO2 levels are mainly distributed over motorways and busy roads that always have high traffic intensity in the city centre, e.g. Route 8 and Route 9, Nathan Road in Kowloon, Queen's Road in Central, and Hennessy Road from Admiralty to Causeway Bay. About 29 % of the on-road measurements exceeded the WHO 1 h guideline value of 200 µg m−3, while 27 % of the data measured in the city centre exceeded the guideline. High NO2 values over motorways are probably due to more heavy-duty vehicles. On the other hand, traffic congestion and street canyon effects (Rakowska et al., 2014) are the major causes of elevated on-road NO2 in the city centre.
As described in Sect. 3.2.2, on-road pollutants mainly produced by vehicles and the traffic flow patterns also have a large impact on pollutant distributions (Fu et al., 2017; Huan and Kebin, 2012; Kaur et al., 2007; Rakowska et al., 2014; Westerdahl et al., 2005). The diurnal dependency of the measurement times is corrected for using the simultaneous normalized LP-DOAS measurement. The normalized spatial distribution of on-road NO2 is shown in Fig. 12b. This normalized data set provides a better overview of the daily average. NO2 levels over some regions are significantly enhanced after applying the normalization, particularly, the residential area in Yuen Long district and Tung Chung district, where the Hong Kong International airport is located. Some other areas (mainly at the city centre and highways) obtained lower NO2 values after normalization. Enhancement of NO2 concentrations after normalization for certain areas is due to the fact that the mobile measurement took place during non-peak hours during the day, while a reduction of NO2 concentrations is due to the measurement vehicle overpassing the regions during rush hours of the day. Compared to unnormalized data, only 27 % of normalized on-road measurements exceeded the WHO 1 h guideline and about 20 % of the area in the city centre exceeded the guideline. The slightly decreased NO2 levels in both the whole of Hong Kong and just in the city centre are presumably due to the fact that the measurement campaigns are conducted during the daytime, when the NO2 level is in general higher compared to night-time.
A high-resolution spatial distribution map of street-level NO2 makes identifying city pollution hotspots possible. It could meanwhile provide valuable information for urban planning as well as help with the development of pollution control measures. For obtaining the pollutant information, on-road mobile CE-DOAS measurements were successfully deployed in Hong Kong in December 2010 and March 2017, respectively. The diurnal dependency due to the different sampling times of mobile measurements was normalized through combining the continuous measurements of LP-DOAS. Furthermore, the algorithm, which was developed to separate and filter the accumulation of local emissions due to traffic congestion, helped us to focus on the concentrations instead of the stopping frequency during the comparison of the spatial distributions.
The long-term trend and spatial variations of ambient, roadside and on-road NO2 levels were investigated by analysing on-road CE-DOAS measurements together with LP-DOAS and EPD monitoring stations. The long-term trend analysis showed that the ambient NO2 level was descending with a rate of 2.5 % yr−1, while the roadside NO2 level showed a strong decreasing trend with an annual reduction rate ranging from 3.4 % to 4.9 %. This observation matched the mobile measurement results that on-road NO2 was in general reduced by 20 %–50 % between 2010 and 2017. The changes in the operational strategies of the major franchised bus company in Hong Kong could be revealed by the enhancements of NO2 level observed at locations close to metro stations. In addition, a rising trend in the NO2∕NOx ratio was observed in both roadside and ambient monitoring data. This was mainly subjected to the reduction of vehicle emissions, which were typically associated with the NO2∕NOx ratio. Increasing the O3 concentration also contributed to the reduction of the NO2 level in the past few years in Hong Kong.
The temporal emissions, characteristic of different districts in Hong Kong, were investigated using mobile measurements taken on different days of the week. The weekend reduction rate of on-road measurements was much higher than the long-term ambient roadside observation of LP-DOAS and EPD monitoring stations. By analysing the spatial pattern of the weekend reduction effect, we found that the NO2 levels of most residential districts were reduced on Sunday, while commercial and shopping areas showed a rather constant NO2 level throughout the week. The mobile CE-DOAS measurements presented in this paper offered a full-scale observation of the on-road NO2 characteristics in Hong Kong. Simultaneously, these spatial distribution measurement results are also important for chemical transport model validations and assessment of effects on human health.
The mobile measurement data are available on request from the corresponding author (ka.chan@dlr.de).
The authors declare that they have no conflict of interest.
This article is part of the special issue “Advances in cavity-based techniques for measurements of atmospheric aerosol and trace gases”. It is not associated with a conference.
The work described in this paper was jointly supported by the German Academic
Exchange Service (DAAD) Programme des Projektbezogenen Personenaustauschs
(PPP) (project ID: 57334317), the Germany/Hong Kong Joint Research Scheme
sponsored by the Research Grants Council of Hong Kong and the German Academic
Exchange Service (reference no. G-CityU104/16), and the Research Grants
Council of the Hong Kong Special Administrative Region, China (project no. CityU 11305817). We thank Annette Schütt, Teng Fei, Song Hao, Willy Ying
for helping with the organization of the measurement campaign.
Edited by: Katherine Manfred
Reviewed by: two anonymous referees
Bond, D. W., Zhang, R., Tie, X., Brasseur, G., Huffines, G., Orville, R. E., and Boccippio, D. J.: NOx production by lightning over the continental United States, J. Geophys. Res.-Atmos., 106, 27701–27710, https://doi.org/10.1029/2000JD000191, 2001. a
Bucsela, E. J., Krotkov, N. A., Celarier, E. A., Lamsal, L. N., Swartz, W. H., Bhartia, P. K., Boersma, K. F., Veefkind, J. P., Gleason, J. F., and Pickering, K. E.: A new stratospheric and tropospheric NO2 retrieval algorithm for nadir-viewing satellite instruments: applications to OMI, Atmos. Meas. Tech., 6, 2607–2626, https://doi.org/10.5194/amt-6-2607-2013, 2013. a
Carslaw, D. C.: Evidence of an increasing NO2∕NOx emissions ratio from road traffic emissions, Atmos. Environ., 39, 4793–4802, https://doi.org/10.1016/j.atmosenv.2005.06.023, 2005. a
Chan, K. L., Pöhler, D., Kuhlmann, G., Hartl, A., Platt, U., and Wenig, M. O.: NO2 measurements in Hong Kong using LED based long path differential optical absorption spectroscopy, Atmos. Meas. Tech., 5, 901–912, https://doi.org/10.5194/amt-5-901-2012, 2012. a
Chan, K., Wiegner, M., Wenig, M., and Pöhler, D.: Observations of tropospheric aerosols and NO2 in Hong Kong over 5 years using ground based MAX-DOAS, Sci. Total Environ., 619–620, 1545–1556, https://doi.org/10.1016/j.scitotenv.2017.10.153, 2017a. a
Chan, K. L., Wang, S., Liu, C., Zhou, B., Wenig, M. O., and Saiz-Lopez, A.: On the summertime air quality and related photochemical processes in the megacity Shanghai, China, Sci. Total Environ., 580, 974–983, https://doi.org/10.1016/j.scitotenv.2016.12.052, 2017b. a, b, c
Chang, Y., Zou, Z., Deng, C., Huang, K., Collett, J. L., Lin, J., and Zhuang, G.: The importance of vehicle emissions as a source of atmospheric ammonia in the megacity of Shanghai, Atmos. Chem. Phys., 16, 3577–3594, https://doi.org/10.5194/acp-16-3577-2016, 2016. a
Dallmann, T. R., Harley, R. A., and Kirchstetter, T. W.: Effects of diesel particle filter retrofits and accelerated fleet turnover on drayage truck emissions at the Port of Oakland, Environ. Sci. Technol., 45, 10773–10779, https://doi.org/10.1021/es202609q, 2011. a
EU emission standards: European Union emission standards for new light duty vehicles (passenger cars and light commercial vehicles), directive 98/69/EC, DieselNet, available at: https://www.dieselnet.com/standards/eu/ld.php#stds (last access: 6 February 2018), 2007. a
Fiedler, S. E., Hese, A., and Ruth, A. A.: Incoherent broad-band cavity-enhanced absorption spectroscopy, Chem. Phys. Lett., 371, 284–294, https://doi.org/10.1016/S0009-2614(03)00263-X, 2003. a
Franco, V., Sánchez, F. P., German, J., and Mock, P.: Real-world exhaust emissions from modern diesel cars, available at: https://www.theicct.org/publications/real-world-exhaust-emissions-modern-diesel-cars (last access: 30 November 2018), 2014. a
Fu, X., Liu, J., Ban-Weiss, G. A., Zhang, J., Huang, X., Ouyang, B., Popoola, O., and Tao, S.: Effects of canyon geometry on the distribution of traffic-related air pollution in a large urban area: Implications of a multi-canyon air pollution dispersion model, Atmos. Environ., 165, 111–121, https://doi.org/10.1016/j.atmosenv.2017.06.031, 2017. a
Hermans, C., Vandaele, A. C., Carleer, M., Fally, S., Colin, R., Jenouvrier, A., Coquart, B., and Mérienne, M.-F.: Absorption cross-sections of atmospheric constituents: NO2, O2, and H2O, Environ. Sci. Pollut. R., 6, 151–158, https://doi.org/10.1007/BF02987620, 1999. a
Huan, L. and Kebin, H.: Traffic Optimization: A New Way for Air Pollution Control in China's Urban Areas, Environ. Sci. Technol., 46, 5660–5661, https://doi.org/10.1021/es301778b, 2012. a
Huang, R.-J., Zhang, Y., Bozzetti, C., Ho, K.-F., Cao, J.-J., Han, Y., Daellenbach, K. R., Slowik, J. G., Platt, S. M., Canonaco, F., Zotter, P., Wolf, R., Pieber, S. M., Bruns, E. A., Crippa, M., Ciarelli, G., Piazzalunga, A., Schwikowski, M., Abbaszade, G., Schnelle-Kreis, J., Zimmermann, R., An, Z., Szidat, S., Baltensperger, U., Haddad, I. E., and Prévôt, A. S. H.: High secondary aerosol contribution to particulate pollution during haze events in China, Nature, 514, 218–222, 2014. a
Jang, M. and Kamens, R. M.: Characterization of Secondary Aerosol from the Photooxidation of Toluene in the Presence of NOx and 1-Propene, Environ. Sci. Technol., 35, 3626–3639, https://doi.org/10.1021/es010676+, 2001. a
Kašpar, J., Fornasiero, P., and Hickey, N.: Automotive catalytic converters: current status and some perspectives, Catal. Today, 77, 419–449, https://doi.org/10.1016/S0920-5861(02)00384-X, 2003. a
Kaur, S., Nieuwenhuijsen, M., and Colvile, R.: Fine particulate matter and carbon monoxide exposure concentrations in urban street transport microenvironments, Atmos. Environ., 41, 4781–4810, https://doi.org/10.1016/j.atmosenv.2007.02.002, 2007. a
Keuken, M., Roemer, M., and van den Elshout, S.: Trend analysis of urban NO2 concentrations and the importance of direct NO2 emissions versus ozone/NOx equilibrium, Atmos. Environ., 43, 4780–4783, https://doi.org/10.1016/j.atmosenv.2008.07.043, 2009. a
Kraus, S.: DOASIS A Framework Design for DOAS, PhD thesis, Combined Faculties for Mathematics and for Computer Science, University of Mannheim, Mannheim, Germany, 2005. a
Krotkov, N. A., Lamsal, L. N., Celarier, E. A., Swartz, W. H., Marchenko, S. V., Bucsela, E. J., Chan, K. L., Wenig, M., and Zara, M.: The version 3 OMI NO2 standard product, Atmos. Meas. Tech., 10, 3133–3149, https://doi.org/10.5194/amt-10-3133-2017, 2017. a
Kuhlmann, G., Lam, Y. F., Cheung, H. M., Hartl, A., Fung, J. C. H., Chan, P. W., and Wenig, M. O.: Development of a custom OMI NO2 data product for evaluating biases in a regional chemistry transport model, Atmos. Chem. Phys., 15, 5627–5644, https://doi.org/10.5194/acp-15-5627-2015, 2015. a
Langridge, J. M., Ball, S. M., and Jones, R. L.: A compact broadband cavity enhanced absorption spectrometer for detection of atmospheric NO2 using light emitting diodes, Analyst, 131, 916–922, 2006. a
Lau, C. F., Rakowska, A., Townsend, T., Brimblecombe, P., Chan, T. L., Yam, Y. S., Močnik, G., and Ning, Z.: Evaluation of diesel fleet emissions and control policies from plume chasing measurements of on-road vehicles, Atmos. Environ., 122, 171–182, https://doi.org/10.1016/j.atmosenv.2015.09.048, 2015. a
Levelt, P., Van den Oord, G. H. J., Dobber, M., Malkki, A., Visser, H., de Vries, J., Stammes, P., Lundell, J., and Saari, H.: The ozone monitoring instrument, IEEE T. Geosci. Remote, 44, 1093–1101, https://doi.org/10.1109/TGRS.2006.872333, 2006. a
Longley, I., Somervell, E., and Gray, S.: Roadside increments in PM10, NOx and NO2 concentrations observed over 2 months at a major highway in New Zealand, Air Qual. Atmos. Hlth., 8, 591–602, https://doi.org/10.1007/s11869-014-0305-4, 2015. a
Marchenko, S., Krotkov, N. A., Lamsal, L. N., Celarier, E. A., Swartz, W. H., and Bucsela, E. J.: Revising the slant column density retrieval of nitrogen dioxide observed by the Ozone Monitoring Instrument, J. Geophys. Res.-Atmos., 120, 5670–5692, https://doi.org/10.1002/2014JD022913, 2015. a
Min, K.-E., Washenfelder, R. A., Dubé, W. P., Langford, A. O., Edwards, P. M., Zarzana, K. J., Stutz, J., Lu, K., Rohrer, F., Zhang, Y., and Brown, S. S.: A broadband cavity enhanced absorption spectrometer for aircraft measurements of glyoxal, methylglyoxal, nitrous acid, nitrogen dioxide, and water vapor, Atmos. Meas. Tech., 9, 423–440, https://doi.org/10.5194/amt-9-423-2016, 2016. a
Mock, P.: European vehicle market statistics, Pocketbook, Lugano, Switzerland, 2014. a
Muilwijk, C., Schrijvers, P., Wuerz, S., and Kenjereš, S.: Simulations of photochemical smog formation in complex urban areas, Atmos. Environ., 147, 470–484, https://doi.org/10.1016/j.atmosenv.2016.10.022, 2016. a
Ning, Z., Wubulihairen, M., and Yang, F.: PM, NOx and butane emissions from on-road vehicle fleets in Hong Kong and their implications on emission control policy, Atmos. Environ., 61, 265–274, https://doi.org/10.1016/j.atmosenv.2012.07.047, 2012. a, b
Pastorello, C. and Melios, G.: Explaining road transport emissions: a non-technical guide, Tech. rep., European Environment Agency, Luxembourg, 2016. a
Platt, U., Meinen, J., Pöhler, D., and Leisner, T.: Broadband Cavity Enhanced Differential Optical Absorption Spectroscopy (CE-DOAS) – applicability and corrections, Atmos. Meas. Tech., 2, 713–723, https://doi.org/10.5194/amt-2-713-2009, 2009. a, b, c
Rakowska, A., Wong, K. C., Townsend, T., Chan, K. L., Westerdahl, D., Ng, S., Močnik, G., Drinovec, L., and Ning, Z.: Impact of traffic volume and composition on the air quality and pedestrian exposure in urban street canyon, Atmos. Environ., 98, 260–270, https://doi.org/10.1016/j.atmosenv.2014.08.073, 2014. a, b, c
Rothman, L., Barbe, A., Benner, D. C., Brown, L., Camy-Peyret, C., Carleer, M., Chance, K., Clerbaux, C., Dana, V., Devi, V., Fayt, A., Flaud, J.-M., Gamache, R., Goldman, A., Jacquemart, D., Jucks, K., Lafferty, W., Mandin, J.-Y., Massie, S., Nemtchinov, V., Newnham, D., Perrin, A., Rinsland, C., Schroeder, J., Smith, K., Smith, M., Tang, K., Toth, R., Auwera, J. V., Varanasi, P., and Yoshino, K.: The HITRAN molecular spectroscopic database: edition of 2000 including updates through 2001, J. Quant. Spectrosc. Ra., 82, 5–44, https://doi.org/10.1016/S0022-4073(03)00146-8, 2003. a
Rotman, D. A., Tannahill, J. R., Kinnison, D. E., Connell, P. S., Bergmann, D., Proctor, D., Rodriguez, J. M., Lin, S. J., Rood, R. B., Prather, M. J., Rasch, P. J., Considine, D. B., Ramaroson, R., and Kawa, S. R.: Global Modeling Initiative assessment model: Model description, integration, and testing of the transport shell, J. Geophys. Res.-Atmos., 106, 1669–1691, https://doi.org/10.1029/2000JD900463, 2001. a
Solomon, S., Schmeltekopf, A. L., and Sanders, R. W.: On the interpretation of zenith sky absorption measurements, J. Geophys. Res.-Atmos., 92, 8311–8319, https://doi.org/10.1029/JD092iD07p08311, 1987. a
Thalman, R. and Volkamer, R.: Inherent calibration of a blue LED-CE-DOAS instrument to measure iodine oxide, glyoxal, methyl glyoxal, nitrogen dioxide, water vapour and aerosol extinction in open cavity mode, Atmos. Meas. Tech., 3, 1797–1814, https://doi.org/10.5194/amt-3-1797-2010, 2010. a
Tian, L., Hossain, S. R., Lin, H., Ho, K. F., Lee, S. C., and Yu, I. T. S.: Increasing trend of primary NO2 exhaust emission fraction in Hong Kong, Environ. Geochem. Hlth., 33, 623–630, https://doi.org/10.1007/s10653-011-9375-5, 2011. a, b, c
Uhrner, U., von Löwis, S., Vehkamäki, H., Wehner, B., Bräsel, S., Hermann, M., Stratmann, F., Kulmala, M., and Wiedensohler, A.: Dilution and aerosol dynamics within a diesel car exhaust plume-CFD simulations of on-road measurement conditions, Atmos. Environ., 41, 7440–7461, https://doi.org/10.1016/j.atmosenv.2007.05.057, 2007. a
Vandaele, A. C., Hermans, C., Fally, S., Carleer, M., Colin, R., Mérienne, M.-F., Jenouvrier, A., and Coquart, B.: High-resolution Fourier transform measurement of the NO2 visible and near-infrared absorption cross sections: Temperature and pressure effects, J. Geophys. Res.-Atmos., 107, 4348, https://doi.org/10.1029/2001JD000971, 2002. a
Venables, D. S., Gherman, T., Orphal, J., Wenger, J. C., and Ruth, A. A.: High sensitivity in situ monitoring of NO3 in an atmospheric simulation chamber using incoherent broadband cavity-enhanced absorption spectroscopy, Environ. Sci. Technol., 40, 6758–6763, 2006. a
Vogt, R., Scheer, V., Casati, R., and Benter, T.: On-Road Measurement of Particle Emission in the Exhaust Plume of a Diesel Passenger Car, Environ. Sci. Technol., 37, 4070–4076, https://doi.org/10.1021/es0300315, 2003. a
Volkamer, R., Spietz, P., Burrows, J., and Platt, U.: High-resolution absorption cross-section of glyoxal in the UV–VIS and IR spectral ranges, J. Photochem. Photobiol. A, 172, 35–46, https://doi.org/10.1016/j.jphotochem.2004.11.011, 2005. a
Washenfelder, R. A., Langford, A. O., Fuchs, H., and Brown, S. S.: Measurement of glyoxal using an incoherent broadband cavity enhanced absorption spectrometer, Atmos. Chem. Phys., 8, 7779–7793, https://doi.org/10.5194/acp-8-7779-2008, 2008. a
Westerdahl, D., Fruin, S., Sax, T., Fine, P. M., and Sioutas, C.: Mobile platform measurements of ultrafine particles and associated pollutant concentrations on freeways and residential streets in Los Angeles, Atmos. Environ., 39, 3597–3610, https://doi.org/10.1016/j.atmosenv.2005.02.034, 2005. a
Zhang, R., Tie, X., and Bond, D. W.: Impacts of anthropogenic and natural NOx sources over the U.S. on tropospheric chemistry, P. Natl. Acad. Sci. USA, 100, 1505–1509, https://doi.org/10.1073/pnas.252763799, 2003. a