the Creative Commons Attribution 4.0 License.
the Creative Commons Attribution 4.0 License.
 | 14 Mar 2019
Ultrasonic nebulization for the elemental analysis of microgram-level samples with offline aerosol mass spectrometry
Rachel E. O'Brien
Kelsey J. Ridley
Manjula R. Canagaratna
John T. Jayne
Philip L. Croteau
Douglas R. Worsnop
Sri Hapsari Budisulistiorini
Jason D. Surratt
Christopher L. Follett
Daniel J. Repeta
Jesse H. Kroll
The elemental composition of organic material in environmental samples – including atmospheric organic aerosol, dissolved organic matter, and other complex mixtures – provides insights into their sources and environmental processing. However, standard analytical techniques for measuring elemental ratios typically require large sample sizes (milligrams of material or more). Here we characterize a method for measuring elemental ratios in environmental samples, requiring only micrograms of material, using a small-volume nebulizer (SVN). The technique uses ultrasonic nebulization of samples to generate aerosol particles (100–300 nm diameter), which are then analyzed using an aerosol mass spectrometer (AMS). We demonstrate that the technique generates aerosol from complex organic mixtures with minimal changes to the elemental composition of the organic material and that quantification is possible using internal standards (e.g., ). Sample volumes of 2–4 µL with total solution concentrations of at least 0.2 g L−1 form sufficient particle mass for elemental ratio measurement by the AMS, despite only a small fraction (∼ 0.1 %) of the sample forming fine particles after nebulization (with the remainder ending up as larger droplets). The method was applied to aerosol filter extracts from the field and laboratory, as well as to the polysaccharide fraction of dissolved organic matter (DOM) from the North Pacific Ocean. In the case of aerosol particles, the mass spectra and elemental ratios from the SVN–AMS agree with those from online AMS sampling. Similarly, for DOM, the elemental ratios determined from the SVN–AMS agree with those determined using combustion analysis. The SVN–AMS provides a platform for the rapid quantitative analysis of the elemental composition of complex organic mixtures and non-refractory inorganic salts from microgram samples with applications that include analysis of aerosol extracts and terrestrial, aquatic, and atmospheric dissolved organic matter.
- Article
(967 KB) - Full-text XML
-
Supplement
(443 KB) - BibTeX
- EndNote


A large number of environmental systems, including the atmosphere, natural waters, and terrestrial systems, contain complex organic mixtures composed of hundreds to thousands of molecular species. Our ability to understand and model such complex chemical systems is often greatly improved when we characterize them in terms of simple chemical frameworks. On the simplest level, the analysis of average elemental ratios can provide important information on potential sources of organic matter samples, as well as the chemical and/or biological transformation processes that modify their composition. For example, the elemental ratios of atmospheric organic aerosol – e.g., oxygen ∕ carbon ratio (O:C), hydrogen ∕ carbon ratio (H:C), and nitrogen ∕ carbon ratio (N:C) – provide information on aerosol sources and aging (Aiken et al., 2008; Canagaratna et al., 2015; Chen et al., 2015; Daumit et al., 2013; Heald et al., 2010; Jimenez et al., 2009; Kroll et al., 2011). Similarly, in water and soil samples, the elemental ratios of carbon, nitrogen, and phosphorous reveal insights into sources and processing of dissolved and particulate organic matter (Becker et al., 2014; Hansman et al., 2015; Koch et al., 2005; Lu et al., 2015).
The most widespread technique for elemental analysis is high-temperature combustion followed by elemental (carbon, hydrogen, nitrogen, and sulfur – CHNS) analysis, which is highly accurate but can require milligrams of material (Skoog et al., 1998). For many trace environmental samples, like atmospheric aerosol, this can require extremely long collection times, which lead to low time resolution. This limits the amount of information provided for systems that exhibit high temporal variability, such as air masses in major urban regions. An alternative approach for measuring the elemental ratios of aerosol is online (real-time) techniques. The most widely used instrument for such measurements is the Aerodyne high-resolution time-of-flight aerosol mass spectrometer (HR-ToF-AMS) (Decarlo et al., 2006), which can measure elemental ratios of ambient aerosol using just nanograms of material. Over the last decade, in situ analysis of aerosol particles with the AMS has enabled rapid, sensitive characterization of aerosol concentrations, sources, and atmospheric aging, improving our ability to model atmospheric aerosol and consequently its climate and health effects (Kroll et al., 2015; Ng et al., 2011b; Jimenez et al., 2009; Canagaratna et al., 2007).
Recently, a number of researchers have used the AMS in an “offline mode”, in which atmospheric samples are collected on filters, extracted, and then atomized into the AMS. Examples include the analysis of sources and aging of atmospheric organic material from aerosol filter extracts (Bozzetti et al., 2017; Huang et al., 2014; Sun et al., 2011; Xu et al., 2015; Ye et al., 2017), cloud and/or fog, water samples (Kaul et al., 2014; Lee et al., 2012), and organic material in glaciers (Xu et al., 2013). Offline AMS has proven especially useful for the analysis of aerosol particles larger than 1 µm (Bozzetti et al., 2016; Daellenbach et al., 2016; Ge et al., 2017). Offline AMS has also proven useful in investigating fractionation and solubility of atmospheric organic material in water and organic solvents (Daellenbach et al., 2016; Mihara and Mochida, 2011; Xu et al., 2016). These studies used both custom-made and commercial atomizers with solvent volumes of at least 5–15 mL. To generate aerosol particles in the size range needed for the AMS, this requires sample masses on the order of 50 µg. While this represents a substantial improvement over the sample mass requirements of conventional CHNS analysis, it is still sufficiently large to limit the applicability of the approach since it can require relatively large organic samples collected with high-volume samplers, often over 24 h or more.
In this work, we characterize a new technique for the elemental analysis of very small sample masses, using ultrasonic nebulization. Aerosol generation with a small-volume nebulizer (SVN) expands the range of environmental samples that can be measured, where either sample size is limited or solvent contamination is a concern. The SVN generates aerosol suitable for analysis with aerosol instrumentation, including not only the AMS and scanning mobility particle sizer (SMPS), but also single-particle mass spectrometers (e.g., particle analysis by laser mass spectrometry, PALMS; Murphy et al., 1998), soft ionization sources (e.g., extractive electrospray ionization, EESI; Gallimore and Kalberer, 2013), and thermal desorption chemical ionization mass spectrometers (e.g., Filter Inlet for Gases and AEROsols, FIGAERO CIMS; Lopez-Hilfiker et al., 2014). Here, we present results characterizing the SVN using an HR-ToF-AMS and an SMPS and demonstrate production and elemental analysis of aerosol using 2–4 µL of liquid samples, with masses of organic material as low as ∼0.4 µg. In some cases, depending on the sample, pre-concentration is required to generate suitable solutions for analysis. The concentration ranges needed (described below) are comparable to the concentrations used for other offline characterizations including soft ionization with electrospray ionization into mass spectrometers. Thus, this technique provides a platform for direct comparison between offline-AMS samples and other analytical techniques. Quantification of total organic concentrations is demonstrated using internal standards. We examine the effects of aerosol collection, extraction, and nebulization on the mass spectra and elemental ratios observed for offline and online AMS. The aim of this work is to demonstrate that offline analysis of organic mixtures with the SVN–AMS can provide quantitative characteristic elemental ratios for trace environmental and biological samples using just micrograms of sample.
2.1 Small-volume nebulizer
The SVN, illustrated in Fig. 1, creates an aerosol by ultrasonically nebulizing a small droplet placed on a thin film stretched across a water reservoir. The aerosol is then carried by a gentle flow of either house air (zero air, Aadco Instruments) or argon (Airgas, 99.999 % purity) into the AMS. The three main components of the SVN, described in detail below, are (1) a bottom cylinder with an ultrasonic transducer and water bath, (2) a thin film that is press-fit onto the top of the water bath by an upper cylinder with a slightly larger ID, and (3) a vertical glass tube that connects to the AMS. The connections between all components are airtight, but the apparatus is easily disassembled to inject samples onto the film, as well as to clean the thin film and change the water bath.
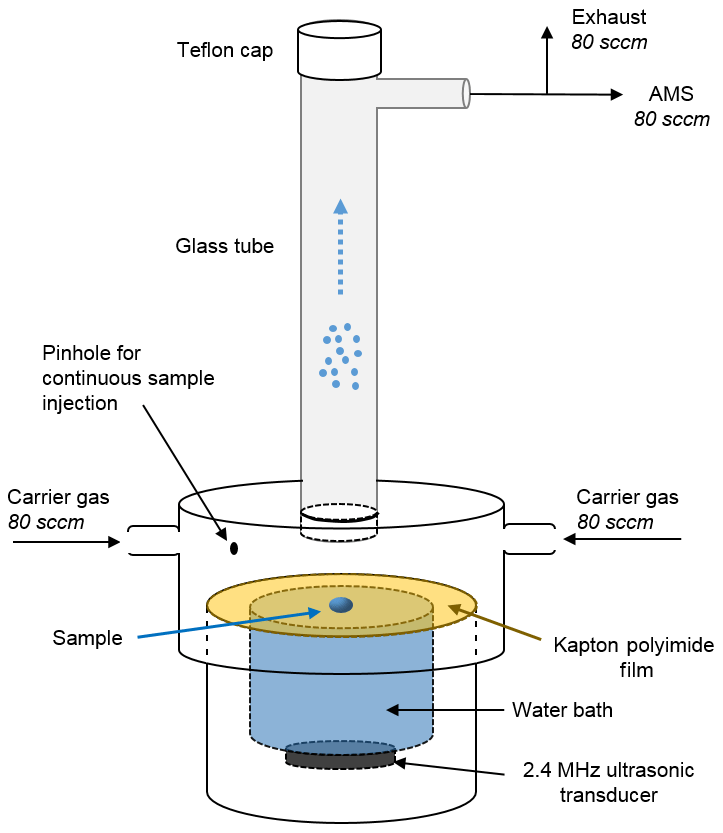
Figure 1Schematic diagram of the small-volume ultrasonic nebulizer (SVN). Samples (2–4 µL) are loaded on the Kapton (or Teflon) film through either the hole in which the glass tube is seated (for discrete injections) or through the pinhole (for continuous injections). After the transducer is turned on, the aerosol is carried up through the glass tube and into the instrument by a ∼ 160 sccm (standard cubic centimeters per minute) flow of zero air or argon carrier gas. The water bath between the transducer and the Kapton film carries ultrasonic waves up to the film and serves to cool the ultrasonic transducer.
In the bottom section of the SVN, the 2.4 MHz ultrasonic transducer (Sonaer, Inc., model 241VM) is located just under the liquid reservoir, with a thin film stretched across the top of the reservoir to provide a clean nebulization surface for the sample. We use a 0.001 in. thick Kapton film or Teflon film, as these two were found to have the lowest background signal and the best performance in terms of the amount of aerosol generated compared to other materials tested. Press-fit onto the bottom piece is another PVC cylinder that has two side ports with carrier gas inlets and a larger hole in the top into which a 15 cm glass tube is seated. The distance from the thin film to the bottom of the glass tube is ∼1.5 cm. During experiments, the nebulized aerosol is carried up through the vertical glass tube and into the stainless steel tubing that leads to the AMS. Additional components such as Nafion™ (Perma Pure LLC) dryers can be placed in line if desired, but such modifications were not investigated in the present work.
Samples can be introduced into the SVN using two different approaches: discrete injections of individual samples (for individual “one-shot” measurements) or continuous addition of a sample flow (for continual analysis, enabling signal averaging). For most studies, Milli-Q water was used as the solvent; in some cases we used HPLC-grade methanol, though the organic background signal is higher. This was likely due to a combination of increased organic background in organic solvents and incomplete evaporation of methanol prior to measurement. For most of the work described here, we used discrete injections of 2–5 µL of aqueous solutions manually deposited directly onto the center of the Kapton film. For continuous injections, solutions made with Milli-Q or organic solvents were introduced via a syringe pump (Harvard Apparatus model 22), which sends liquid flow (20–40 µL min−1) through a borosilicate capillary entering the SVN via a small downward-facing hole in the upper PVC piece (Fig. 1). In the future, such a port could also be used to provide automated discrete sample introduction using an autosampler.
For aqueous samples containing salts and small organic molecules, only 1 %–2 % of the original sample mass was observed to remain on the thin film after a discrete injection (Fig. S2). To ensure a clean surface between different samples, the surface was cleaned by nebulizing 2–8 µL of Milli-Q water off the surface 5–10 times over approximately 1 min. The cleanliness of the surface was then verified by nebulizing a salt solution (at least 0.5 g L−1) between each sample. The salt solution is necessary to ensure that any contaminants can be seen since pure water risks generating aerosol particles that are too small to be measured in the AMS. For samples in which carryover was observed (for example, the dissolved organic matter solutions discussed in Sect. 3.1), additional cleaning of the film was undertaken with sonication in a deionized water bath followed by rinsing with HPLC-grade methanol for >30 s. Careful maintenance of the surface ensures uncontaminated mass spectra and accurate quantification of the solution components.
2.2 AMS data collection and analysis
While a number of different aerosol instruments could be used with the SVN, here we focus primarily on elemental analysis by the HR-ToF-AMS. The AMS has previously been described in detail (Canagaratna et al., 2007; Decarlo et al., 2006) and provides quantitative measurements of non-refractory material (organics, ammonium sulfate, ammonium nitrate, etc.) for aerosol particles between approximately 40 and 1000 nm. The mass spectrometer used in the AMS is a HR-ToF-AMS (Tofwerk AG), run under “V mode” for a mass resolution of 2000–3000 m/Δm. This mass-resolving power enables peak fitting and identification of all organic fragment ions observed here (), which enables the calculation of quantitative elemental ratios for the organic mixture, after correcting for fragmentation bias during electron ionization (Aiken et al., 2007, 2008; Canagaratna et al., 2015). For AMS data collected using indoor or outdoor air, the intensities of CO+ and H2O+ are complicated by gas-phase interferences ( and gas-phase H2O+). For samples compared to chamber or ambient online-AMS data sets, zero air was the carrier gas, standard empirical estimates were used, and the improved ambient method for elemental ratios was applied (Canagaratna et al., 2015). With the SVN, inert carrier gases such as argon can also be used, allowing for the direct measurement of the CO+ ion intensity. This is demonstrated below for dissolved organic matter; the majority of the other samples were run with zero air.
For discrete sampling, “fast MS” mode (Kimmel et al., 2010) was used because the pulse length of a single injection is ∼30–60 s long. Fast MS mode generates mass spectra every 0.5–2 s and the instrument cycles between the “closed” state, in which the aerosol beam is blocked, and the “open” state, in which the aerosol beam can reach the vaporization and ionization region for detection. For the work shown here, mass spectra were collected every 0.5 s for a duration of ∼15–18 s in the open state, followed by 3 s in the closed state. The closed spectrum provides information on the instrument background, including contributions from gas-phase species, and is subtracted from the open spectrum in data processing. For the high-resolution peak fitting and the analysis of the mass spectrum and the elemental ratios, the average mass spectrum across all injections is used. For quantification, the total signal under each injection pulse is used. For continuous injections, the standard AMS operating mode (“GenAlt” mode) was used. This provides an average mass spectrum (by subtracting the closed signal from the open signal), as well as particle time-of-flight (PToF) data (providing aerosol size distributions for all aerosol components), once per minute. All AMS data were analyzed using software packages Squirrel (v1.57I) and Pika (v1.16I), available at http://cires1.colorado.edu/jimenez-group/ToFAMSResources/ToFSoftware/ (last access: 25 July 2016).
The aerodynamic lens on the AMS has a transmission efficiency of nearly 100 % for particles with aerodynamic diameters of 70–500 nm; for somewhat smaller particles (40–70 nm), this transmission is lower but not negligible (Jimenez et al., 2003). Thus, high enough solution concentrations are used such that the dried particles formed in the nebulizer are larger than ∼100 nm in aerodynamic diameter. Collection efficiencies (CEs) in the AMS can vary depending on the extent to which aerosol particles bounce off the thermal element prior to vaporization (Docherty et al., 2013). This can impact the absolute concentrations observed, but for internally mixed samples, the relative concentrations of different aerosol components are independent of CE. In this work, most measurements (including elemental ratios) are reported as relative measurements, and thus no CE correction is applied. Some biases may arise if the aerosol is not internally mixed, but for all systems examined so far in PToF, no size dependence in composition was observed (Fig. S1 in the Supplement).
2.3 Sample collection and solution preparation
As described below, samples were prepared from a number of sources, including commercially available standards, the extracts of chamber and ambient aerosol particles collected on filters, and dissolved organic matter from the Pacific Ocean. For all solutions, either ultrapure water (18.2 M Ω cm, Milli-Q) or HPLC-grade methanol was used. Prior to use, all glassware was cleaned with a methanol solvent wash and baked at 450 ∘C for 6 h.
Chamber aerosol (enabling offline vs. online comparisons) was generated in the MIT 7.5 m3 Teflon environmental chamber, run in continuous-volume “semi-batch” mode. Details on the facility are given elsewhere (Hunter et al., 2014). Experiments were run at 20 ∘C, with <5 % relative humidity (RH), in the dark, and under low-NOx (<10 ppb) conditions using ozone as the oxidant. Ammonium sulfate seeds were added for an initial concentration of ∼ 60 µg m−3. The precursor, α-pinene, had an initial mixing ratio of 100 ppb; a Pen-Ray lamp (Jelight model 600) was used to add an initial ozone concentration of ∼ 700 ppb of ozone. The ozone concentration decreased due to consumption and dilution to 400 ppb by the end of the experiment. The initial organic loading was ∼ 70 µg m−3 and decayed due to dilution, sampling, and wall loss to a final value of ∼ 18 µg m−3. Filter samples were collected on Zeflour® PTFE membrane filters (0.5 µm pore size) at flow rates of ∼5 L min−1 for 10 h. Laboratory blank filters were prepared by placing separate filters in the filter holder for 10 min before the start of the experiments. All filters were stored in baked aluminum foil packets, sealed in plastic bags, and placed in a freezer at −20 ∘C until extraction. Filters were extracted with ∼4 mL of HPLC-grade methanol. In order to avoid oxidation of the organic species in the extract, no sonication was used; instead, the vials were gently agitated by hand intermittently over 3 h. Solutions were concentrated by evaporating to dryness under a gentle stream of ultra-high-purity N2. Dried samples were stored in the freezer at −20 ∘C until reconstitution with Milli-Q water and analysis by the SVN–AMS. Blank subtraction was carried out with a scaling of the filter blank to 12 % of the sample signal, as determined from the internal standard in each sample.
Field samples from the Southern Oxidant and Aerosol Study (SOAS) in 2013 were collected on pre-baked Tissuquartz™ filters (Pall Life Science, 8×10 in.) from Look Rock, TN, starting on 16 June 2013 using a high-volume aerosol filter sampler with a PM2.5 cyclone (Tisch Environmental, Inc.) as described by Budisulistiorini et al. (2015). For filter extraction, a 37 mm punch was extracted in a pre-cleaned scintillation vials with 20 mL high-purity methanol (LC-MS Chromasolv® grade, Sigma-Aldrich) by sonication for 45 min. Filter extract was filtered through a 0.2 µm syringe filter (Acrodisc® PTFE membrane, Pall Life Sciences) to remove suspended filter fibers. The filtered extract was then blown down to dryness under a gentle N2(g) stream at room temperature. An aerosol chemical speciation monitor (ACSM) (Ng et al., 2011a) was deployed at the same field site (Budisulistiorini et al., 2015); the average mass spectrum for the length of the filter sample was used for comparison with the present SVN–AMS measurements. For all analyses presented here (chamber and ambient) sufficient mass was extracted to enable the analysis of individual filter samples, with no combination of extracts from different samples required.
Standard solutions were prepared from commercially available compounds dissolved in Milli-Q water. Reagents used included ammonium sulfate, ammonium nitrate, isotopically labeled ammonium nitrate (), citric acid, mannitol, PEG-400, 4-hydroxy-3-methoxy-DL-mandelic acid (HMMA), and HPLC-grade methanol, all from Sigma-Aldrich, all at ≥99 % purity.
The dissolved organic matter (DOM) polysaccharide sample was collected at the Natural Energy Laboratory Hawaii Authority facility in Kona, Hawaii. Seawater from a depth of 20 m was pumped though a 0.2 µm filter to remove particles, and the high-molecular-weight fraction of organic matter in the filtrate was concentrated by ultrafiltration using a membrane with a 1 nm pore size and a nominal 1000 Da molecular weight cutoff. This fraction was desalted by serial dilution and concentration with Milli-Q water and then freeze-dried. Low-molecular-weight humic substances and residual salts were removed by stirring with anion (hydroxide form) and cation exchange resins (hydrogen form). The final product was freeze-dried to yield a fluffy white powder. Conventional CHNS analysis was carried out using a CE-440 elemental analyzer (Exeter Analytical). This powder was dissolved in Milli-Q water at approximately 1 g L−1 to prepare solutions for analysis.
3.1 Nebulization and aerosol size
Figure 2a shows a time series of measured aerosol mass concentrations of a typical nebulized aerosol pulse from a 4 µL solution containing approximately 0.33 g L−1 each of mannitol, ammonium sulfate, and ammonium nitrate. The nebulizer is turned on at t=0 and shortly afterwards ( s) the aerosol packet is observed in the AMS. The start of the nebulization is timed so that a closed (background) measurement occurs during the downslope of the signal (closed measurements shown as gaps, e.g., –21 s). This background is subtracted from the aerosol particle signal during data processing. Measurements are collected until the signal returns to the baseline ( s).

Figure 2Measurements of the composition and size of nebulized samples from the SVN. (a) Time series of aerosol composition from a single 4 µL nebulization of an aqueous solution (mannitol, ammonium nitrate, and ammonium sulfate). Data were recorded using fast-mode MS for the AMS-open scans, with a mass spectrum collected every 0.5 s (filled circles). The gaps in the trace correspond to closed cycles where the aerosol beam was blocked to provide a background subtraction (gas phase and instrument background) that was applied during data processing. Measured concentrations are not corrected for collection efficiency (CE) in the AMS, which affects the absolute values but not the relative concentrations. The inset shows the average mass spectrum acquired across the injection, normalized to total ion signal. (b) Aerosol size distribution from a ∼ 1 g L−1 citric acid solution measured with an SMPS (black line). The gradient represents the transmission efficiency for particles into the AMS with nearly 100 % between 70 and 500 nm and decreased but substantial transmission for spherical particles 30–70 nm and 500 nm to 2.5 µm (Jimenez et al., 2003); thus, the smallest particles in the distribution will not be efficiently detected by the AMS.
Figure 2b shows the size distribution of the particles generated by nebulizing an aqueous solution of citric acid with continuous injection via syringe pump and a total concentration of ∼1 g L−1 into an SMPS (TSI, Inc.). The particles have size distributions centered at 150–200 nm (electrical mobility diameter). These particles were sampled into the SMPS without passing through a dryer. The SVN was approximately 3 m further away from the inlet of the SMPS so the particles are likely to be somewhat smaller than those entering the AMS, due to water evaporation in the dry carrier gas. We find injections of solutions with total concentrations above 0.2 g L−1 provide sufficient aerosol mass for analysis (Fig. S1). These measurements compare well with calculations based on the size of droplets reported by the manufacturer (Sonaer, Inc.) of approximately 1.7 µm using water solutions. Assuming that the density of the dried particle is 1.3 g cm−3 (Nakao et al., 2013), the minimum sample concentration that will form a 100 nm dried particle is approximately 0.3 g L−1. More dilute solutions do not generate signal in the AMS because the majority of the aerosol particles that are formed are too small for transmission through the aerodynamic lens of the AMS (Fig. 2b). To generate large enough aerosol particles from more dilute solutions, larger initial droplets could be formed by changing the transducer to one that vibrates at a lower frequency. However, for these larger droplets, drying will require the loss of a greater amount of solvent, so that any impurities in the solvent will make up a larger (and possibly even dominant) fraction of the resulting fine particles. Thus the use of ultrasonic nebulization at lower frequencies was not investigated here.
3.2 Quantification
3.2.1 Nebulization efficiency
A key quantity describing the potential sensitivity of the SVN–AMS is the SVN nebulization efficiency, the ratio of the mass measured in the AMS compared to the mass of analyte placed on the thin film. This was determined by loading 4 µL of a known solution onto the film and measuring the mass of each component in the AMS integrated over the injection pulse, determined by
where MAMS is the mass measured by the AMS in micrograms, f(t) is the instantaneous mass concentration measured in the AMS (µg m−3), and νAMS is the gas flow rate into the AMS in cubic meters per second. For each injection, the background-subtracted AMS signal is calculated (Fig. 2a). The gaps due to closed cycles are bridged by interpolation, and the area under the injection curve is calculated via trapezoidal integration from time points before and after the pulse (t1 and t2, respectively). The mass measured in the AMS is affected by three factors: the amount of aerosol formed and transported out of the SVN, the fraction of the gas flow from the SVN that is sampled by the AMS (typically about 50 % ), and the fraction of aerosol that bounces off the heater element before vaporizing (the AMS CE).
Figure 3 shows the mass measured in the AMS compared to the mass deposited on the nebulizer for replicate injections of four different aqueous solutions of citric acid, ammonium nitrate, ammonium sulfate, and isotopically labeled ammonium nitrate (, used later as an internal standard) with concentrations ranging between approximately 0.1 and 0.2 g L−1 for each of the components (but with the same total concentration, 0.75 g L−1). Six replicate injections of 4 µL drops of the solutions from one of the calibration curves (Sect. 3.2.2 below) were atomized, and the total mass observed in the AMS was calculated using Eq. (1). (Details on the concentrations of analytes in these calibration solutions are provided in the Supplement.) There are variations in the efficiency from sample to sample and run to run; thus the trends shown in Fig. 3 are illustrative only. The key trait observed is that the measured nebulization efficiencies are on the order of 0.02 %–0.06 %, indicating that the aerosol mass detected with the AMS is approximately 3 orders of magnitude lower than the mass originally deposited on the thin film.

Figure 3Mass of each component placed on the thin film vs. the mass measured by the AMS for four different solutions with varying concentrations of citric acid, ammonium sulfate, ammonium nitrate, and the internal standard (), all with a total solution concentration of 0.75 g L−1. Each sample had five replicate injections, with the vertical spread in the measured masses indicating substantial run-to-run variability (up to a factor of 3) among injections.
The majority of the sample mass loss likely occurs during the nebulization process itself. For aqueous solutions in the SVN, large droplets are observed to be ejected off the surface of the film at the same time as the aerosol is generated. These ejected droplets are then lost to the walls of the SVN. The ejection of these droplets appears to be a necessary part of the nebulization mechanism for water samples as smaller volumes (<1 µL) of water do not generate such droplets and also do not appear to form aerosol. This observed mechanism is in agreement with previous studies of aerosol generation for ultrasonic nebulization, in which cavitation within the droplet (Lang, 1962) and boiling and/or jetting from a droplet chain (Simon et al., 2015) have been observed.
The size distribution and number of aerosol particles from ultrasonic nebulization have been shown to be affected by the frequency of the ultrasonic vibration; the properties of the liquid including surface tension, density, and viscosity; and the concentration of the solution (Donnelly et al., 2005; Lang, 1962; Simon et al., 2015). The present application involves a relatively dilute solution, so the only parameter that is likely to vary is the surface tension, by use of different solvents. Nebulization of solvents with lower surface tension, such as methanol, led to the ejection of much smaller droplets, and consequently substantially higher nebulization efficiencies (∼10 %). However, methanol (and other HPLC-grade organic solvents) was found to give higher background signals in the AMS than Milli-Q water, likely due to higher levels of low-volatility contaminants. This difference was also observed by Daellenbach et al. (2016); therefore, Milli-Q water appears to be the ideal solvent to use for most environmental samples. However, with adequate solvent background characterization, organic solvents may be optimal for environmental samples with more non-polar components (e.g., petroleum or fresh tail pipe emissions).
3.2.2 Internal standards and calibration curves
In Fig. 3, the vertical spread of data points illustrates the variation in nebulization efficiency from one injection to the next. This is likely the result of small differences in the droplet shape or position on the film, leading to differences in how the droplets are ejected from the surface during aerosol formation. This run-to-run variability in nebulization efficiency, as well as the lack of a linear correlation between the mass placed on the film and the mass observed, complicates quantification and necessitates the use of an internal standard to quantify the concentration of organic species within the original sample. In some cases, an inorganic ion that is independently quantified, such as sulfate, can serve as this internal standard (Daellenbach et al., 2016). However, in many cases such an independent measurement is not available; additionally, some environmental samples may not contain appreciable levels of measurable inorganic species, or else such species may not be soluble in the solvent of choice (e.g., ionic species in organic solvents). In these cases, an internal standard needs to be added to the solution prior to nebulization.
For use with the AMS, the internal standard must meet a number of requirements: it must be non-refractory, soluble, unreactive with the other sample components, not already present in the solution, and easily distinguishable from other species in the sample. For nebulization of samples dissolved in organic solvents, organic internal standards (e.g., phthalic acid; Chen et al., 2016; Han et al., 2016) meet these requirements. In the present work, which focuses on aqueous samples only, we use an inorganic internal standard of isotopically labeled ammonium nitrate (). An example mass spectrum for an internal standard solution is shown in Fig. 4a. The background signal from other components (organic material, sulfate, and nitrate) is very low. Another tested option is ammonium iodide (NH4I). Both of these salts work well as internal standards for both laboratory and ambient samples since neither 15NO3 nor iodide is present in appreciable amounts in the atmosphere and there is usually a very small contribution of organic fragments at the fragment masses observed for those salts. Typically, the internal standards are added at the same order of magnitude concentration as the sample. For all tests of background signals and blanks, the internal standard is added to the solutions at concentrations of between 0.5 and 1 g L−1 in order to generate aerosols of sufficient size for the AMS. This allows an analysis of any trace material present in the blank by creating an aerosol population to transfer the trace material into the AMS and allows for a background subtraction using the internal standard.
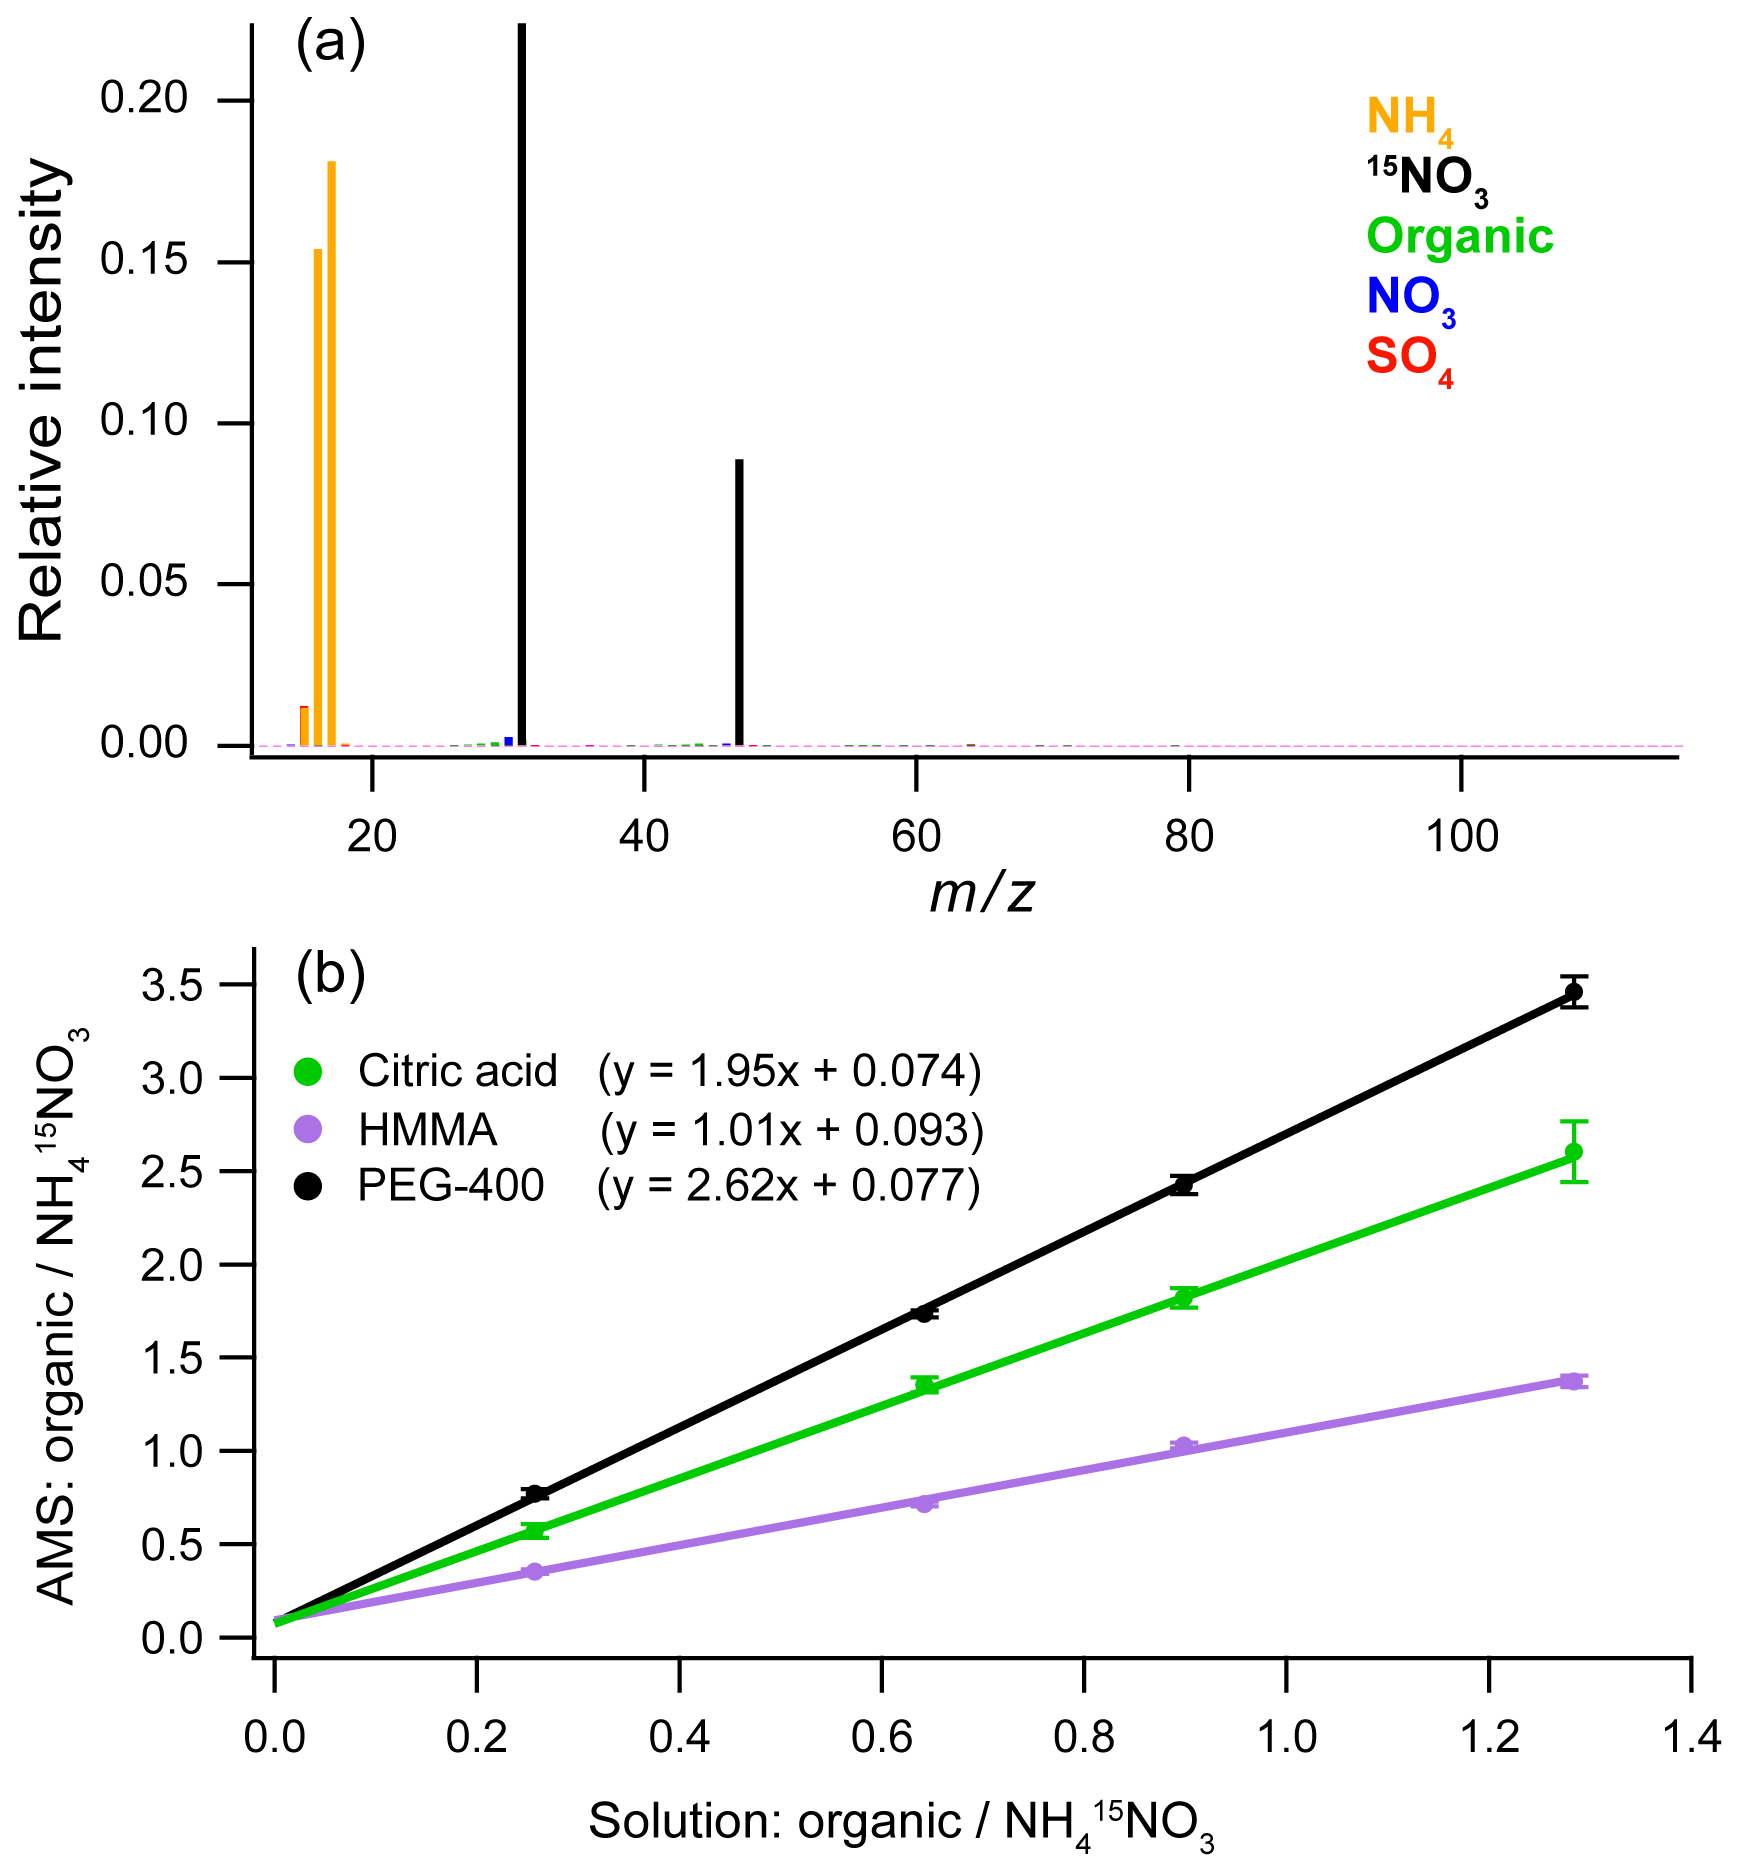
Figure 4(a) Blank of the Kapton film using 1 g L−1 internal standard solution (15N – ammonium nitrate). (b) Calibration curves made using an internal standard for solutions with three different organic compounds: citric acid, 4-hydroxy-3-methoxy-DL-mandelic acid (HMMA), and polyethylene glycol 400 (PEG-400). The error bars are ±1σ for five replicate injections.
Figure 4b shows calibration curves with linear responses for three different organic compounds (citric acid; 4-hydroxy-3-methoxy-DL-mandelic acid, HMMA; and polyethylene glycol 400, PEG-400) at four concentrations using as the internal standard. For the calibration curve, the ratios of the AMS signals for the analyte over the internal standard are compared to the ratios for known solution concentrations, thus correcting any variations in the mass of analyte nebulized. For quantification of unknowns, known concentrations of the internal standard are added to the samples at ratios comparable to what is used for the calibration curve. The ratio of the measured AMS signals can then be used to calculate the unknown analyte concentration from the calibration curve.
For quantification of complex organic mixtures using this technique, the most accurate organic calibration standards will have chemical structures similar to the average structure of the mixture. The slope of each line is related to the relative ionization efficiency (RIE) of the organic compound in the AMS (Jimenez et al., 2003). The RIE values in Fig. 4b for HMMA and citric acid (1.01 and 1.95, respectively) bracket the range of RIE values for different types of organics measured using standard AMS calibration techniques (Jimenez et al., 2016). This range likely arises from differences in how the organic compounds dissociate during volatilization on the heater. The heater in the AMS is typically set at 600 ∘C, and so most organic molecules found in organic aerosol thermally decompose prior to electron impact ionization (Canagaratna et al., 2015; Jimenez et al., 2016), leading to RIEs in the range of 1.0–2.0. In contrast, the slope of 2.62 for PEG-400 is substantially outside of the range of values. However, with the AMS, complex mixtures are less likely to show large variations in RIE than different individual compounds, such as those used in Fig. 4. For extracts of atmospheric aerosol or other smaller organic mixtures, the RIE of 1.4, which is typically used for AMS measurements (Canagaratna et al., 2007; Jimenez et al., 2016; Xu et al., 2018), is likely the best value to use as an initial calibration slope. For extracts of other types of organic mixtures, compounds that have a structure similar to the average organic composition should be used to calibrate the samples.
3.3 Mass spectral analysis
The primary goal of the SVN–AMS is to measure quantitative chemical information, specifically elemental ratios, from complex organic mixtures. We have characterized these for a number of different chemical systems, described below. Results are summarized in Fig. 5 (comparing SVN–AMS and online AMS mass spectra) and Table 1 (comparing elemental ratios measured with SVN–AMS with those measured by either online AMS or CHNS analysis).
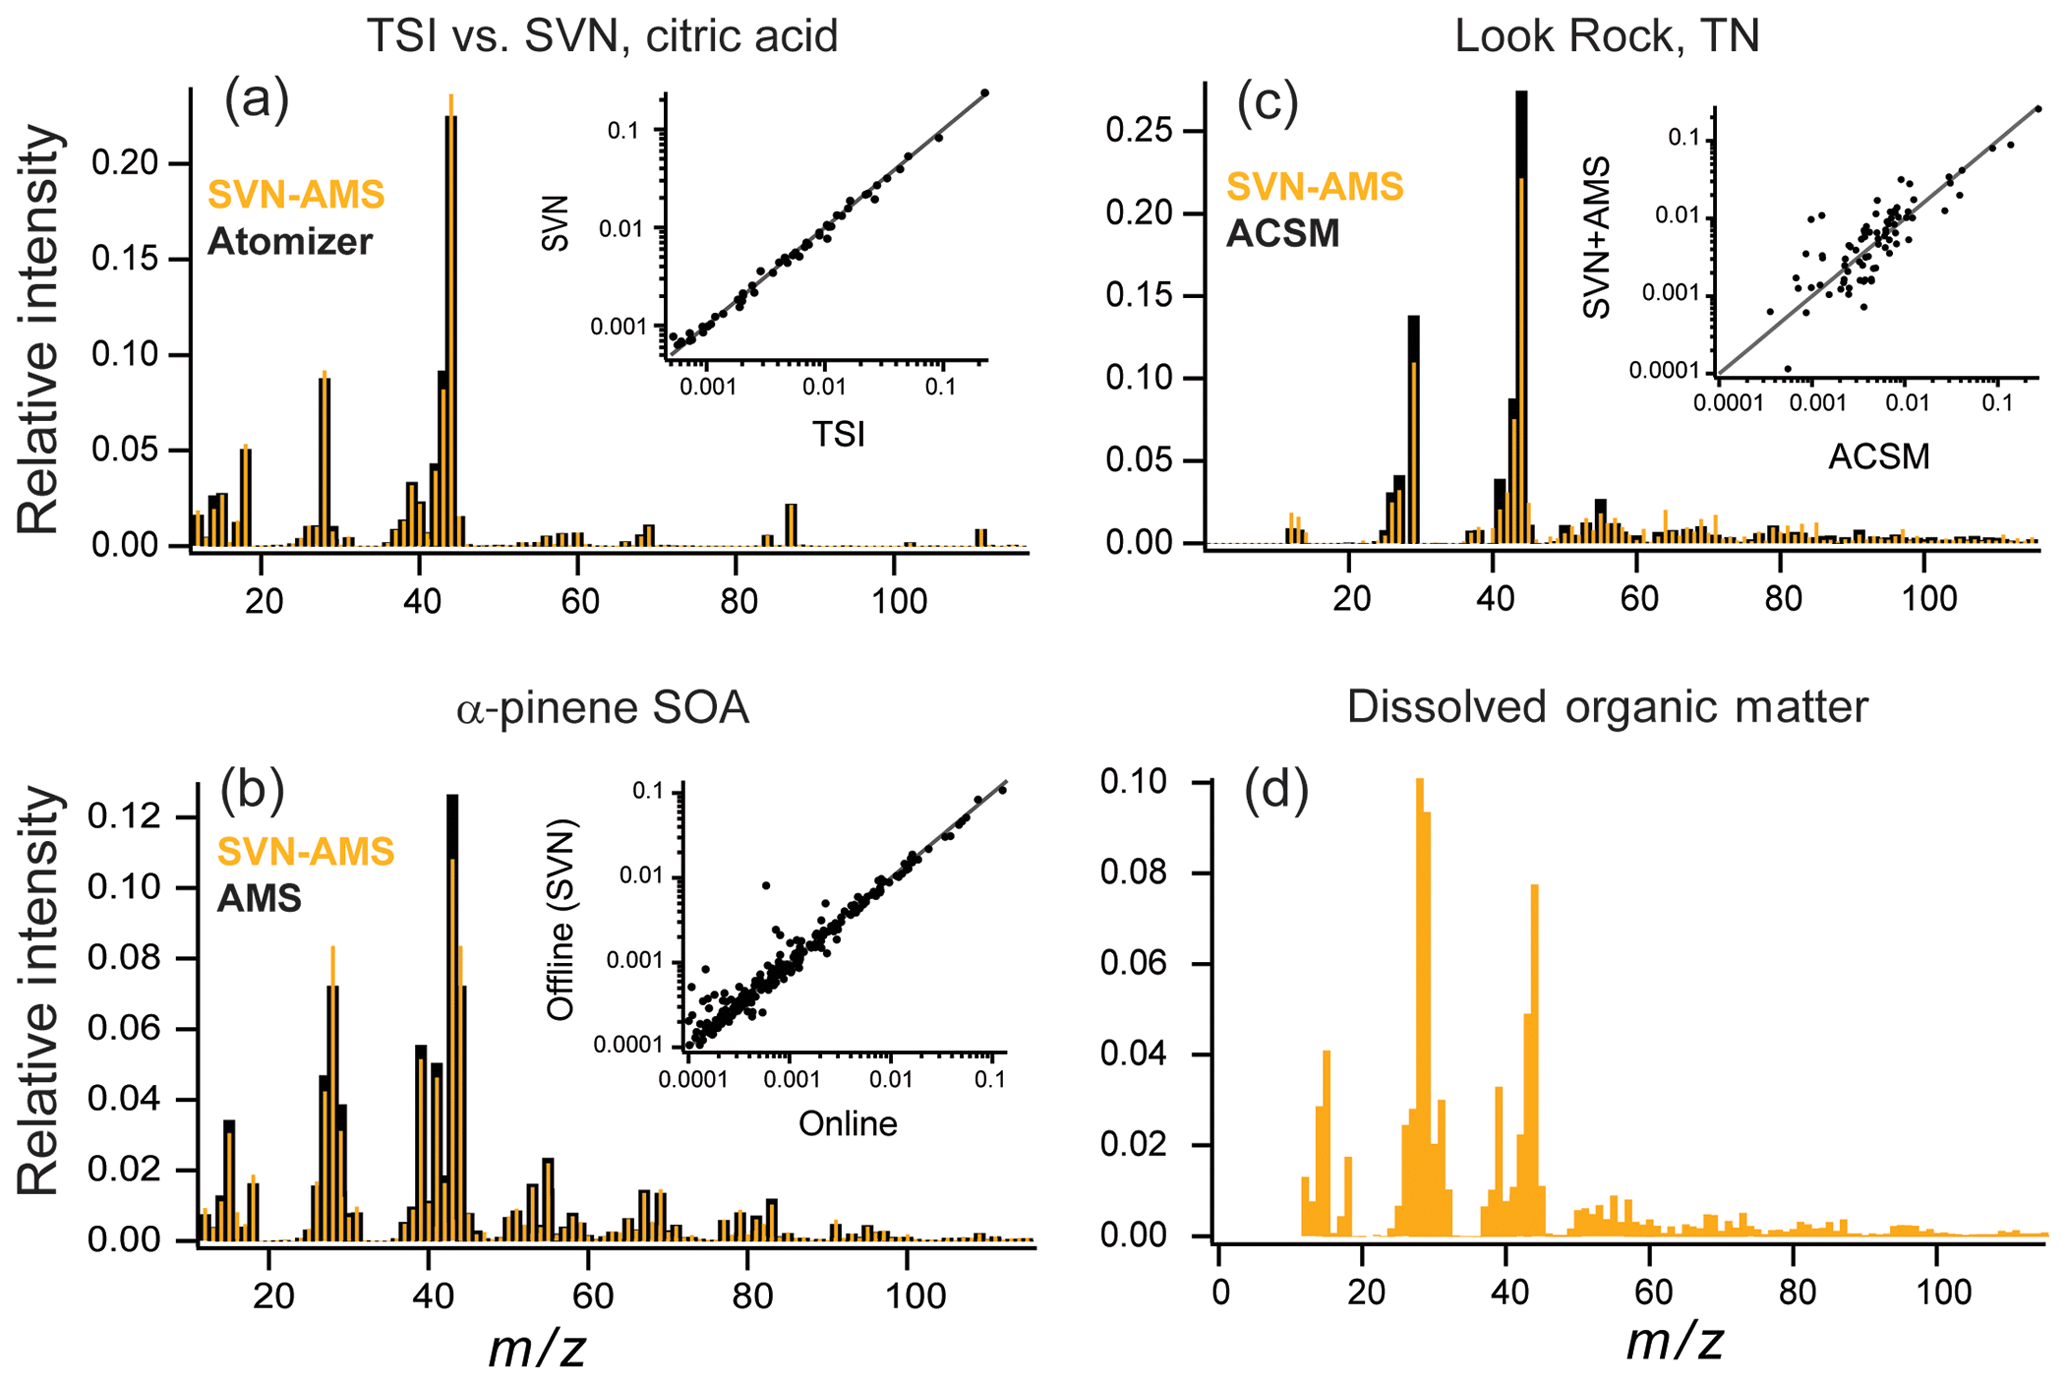
Figure 5Online (or TSI atomizer) (black) vs. SVN nebulizer (orange) mass spectra for (a) an aqueous solution of citric acid at 1 g L−1, (b) α-pinene + O3 chamber SOA, and (c) a SOAS campaign sample from Look Rock, TN, with online data collected on an ACSM. Smaller insets in (a), (b), and (c) show direct comparison of intensities for each mass spectrum on a log scale. (d) AMS mass spectra from North Pacific Ocean dissolved organic matter (polysaccharide fraction) nebulized with the SVN (since this sample was not from aerosol particles, no online samples are available).
Table 1Elemental ratios measured by SVN–AMS vs. other techniques for the various mixtures examined in this work.

a Elemental ratios are estimated from parameterizations for f44 and f43 (Aiken et al., 2008; Ng et al., 2011b). b There is no established method for determining N:C from unit mass resolution (UMR) data.
One concern with using ultrasonic nebulization to generate aerosol particles is the possibility that the high temperatures possibly reached by the solution during nebulization may degrade the organic compounds, affecting their mass spectra (and hence measured elemental composition). Figure 5a shows a comparison of a solution containing 1 g L−1 of citric acid aerosolized with a TSI atomizer (TSI 3076, 276 kPa gas) (black) and the SVN (gold), with the inset showing a direct comparison among the intensities measured for each ion in the mass spectrum. The degree of agreement can be described by the dot product of the intensities for matching peaks in the two spectra, as well as the log of the intensities before taking the dot product (log–dot product), which gives the lower-intensity peaks greater weight. Very good overlap between the two mass spectra is observed, with a dot product of 0.99 and a log–dot product of 0.96. This indicates minimal degradation of the citric acid by ultrasonic nebulization.
A high degree of similarity is also observed between offline and online aerosol measurements for more complex mixtures. Figure 5b shows mass spectra for a comparison of offline (gold) vs. online (black) secondary organic aerosol (SOA), generated from the dark ozonolysis of α-pinene. The online mass spectra are the average real-time AMS mass spectrum averaged over the 10 h of filter collection. For all filter samples, spectra from the SVN are background subtracted using spectra collected from blank filter samples. These blanks provide the background for any trace organic material on the filters before collection as well as any background organic material introduced during sample preparation. The overlap in Fig. 5b between the mass spectra is very good, with a dot product of 0.98 and a log–dot product of 0.98. The elemental ratios are also very similar between the two samples with an H:C of 1.6 for both and O:C of 0.48 for the chamber and 0.49 for the SVN samples (Table 1). The largest difference is observed at m∕z 44 () and m∕z 43 (C2H3O+) with a larger fraction of in the offline sample. The intensity of CO+ (m∕z 28) is also different, but only because it is set equal to the intensity of the ion, as is commonly done for ambient sampling with the AMS (given that the CO+ ion generally cannot be distinguished from the much more abundant ion). The organic contribution from H2O+, OH+, and O+ is also constrained by the signal so any differences in intensity will also show up in those ions (Aiken et al., 2008). The observed difference in and C2H3O+ ion intensity is likely a result of the extraction step prior to nebulization, which may preferentially dissolve the most water-soluble (oxidized) SOA components. Additionally, the online measurement is for fine mode aerosol while the offline measurement collects the full range of particle sizes on the filter. However, based on the agreement in H:C and O:C in the online and offline cases, these factors do not appear to bias elemental ratio measurements substantially.
Figure 5c shows a comparison of online and offline measurements of ambient organic aerosol, specifically ACSM measurements and SVN–AMS measurements of a filter extract collected simultaneously during the 2013 SOAS field campaign in Look Rock, TN (20:00 EST, 4 July to 07:00 EST, 5 July 2013). Since the ACSM is a unit-mass-resolution instrument, the HR-AMS data are degraded to unit mass resolution, and ions that are determined from the m∕z 44 signal (, 16, 17, 18, and 28) are excluded from the analysis. Additionally, ions at m∕z 30 and 31 were removed from comparison because of interferences from the internal standard (m∕z 31) and nitrate in the sample (m∕z 30).
The two mass spectra in Fig. 5c have a high degree of agreement between the major ions (dot product of 0.98). However, there is substantially more variation among the two techniques than in the chamber study, especially in the lower-abundance peaks (; see inset), as reflected in the lower log–dot product of only 0.90. Possible reasons for this lower correlation include fractionation from the extraction step, the different sizes measured (PM2.5 for the filter vs. fine mode aerosol for the ACSM) (Daellenbach et al., 2016), the uncertainty in ACSM signals at higher masses due to uncertainty in the relative ion transmission curve (Ng et al., 2011a), and the losses of relatively volatile compounds during collection, extraction, and handling. Additional work is necessary to quantify the importance of these effects, and care should be taken when comparing the full mass spectra for online compared to offline SVN–AMS analysis. The high degree of overlap in the intensities of the dominant ions between the online (AMS and ACSM) measurements and offline (SVN–AMS) results indicates that the ensemble organic composition for these aerosol samples is generally well-represented by the SVN–AMS measurements (Table 1). However, the estimated elemental ratios from a lower-resolution AMS are more uncertain than from the HR-ToF-AMS. Thus, the ratios for these samples in Table 1 are provided only as a demonstration of the overall agreement between the two techniques.
For the SVN, the small sample volume requirements can make it attractive for the analysis of other environmental samples that are soluble in water (or organic solvents) and that have low enough vapor pressures to remain in the condensed phase after sample preparation and nebulization. Here we demonstrate the analysis of the high-molecular-weight fraction of the polysaccharide fraction of dissolved organic matter (DOM) with the SVN–AMS. The DOM sample was prepared using a standard protocol for the isolation of this fraction of the organic material (see Sect. 2.3). This preparation removes the lower-molecular-weight compounds so chemicals such as methane sulfonic acid are not expected to be observed. Figure 5d shows an example AMS mass spectrum from DOM collected from the Pacific Ocean. The mass spectrum is dominated by oxidized fragments containing one or more oxygen atoms with smaller amounts of nitrogen-containing fragments. The sample preparation for the DOM removed all salts; thus the ammonium fragments were assumed to be from organonitrogen species and were assigned to the organic fraction. The measured N:C and H:C values of 0.081 and 1.7, respectively, match those measured by CHNS analysis (0.080 and 1.74, respectively). This demonstrates that with the SVN, microgram quantities of dissolved environmental mixtures can be nebulized and sampled into the AMS, providing a rapid, quantitative method to determine elemental ratios in these complex organic mixtures.
A new ultrasonic nebulizer has been described and characterized for generation of aerosol from very small sample masses. We demonstrate the application of this technique to offline-AMS analysis of complex organic mixtures from aerosol filter extracts and DOM. Data sets that include quantitative organic mass, characteristic mass spectra, and quantitative elemental ratios can be generated from only 0.4 to 1.2 µg of material. For these samples, pre-concentration was required to prepare a suitable solution concentration for analysis. This will be required for some types of environmental samples and care should be taken to minimize artifacts during solution preparation. A direct comparison between the mass spectra generated by commercial spray atomizers and particles sampled directly from the atmosphere showed high degrees of agreement, indicating minimal composition changes during sample preparation and nebulization. Nebulization of aqueous samples generated measurable aerosol from 0.1 % of the sample mass. Higher nebulization efficiencies (and smaller ejected droplets) were observed for methanol, likely due to its lower surface tension. The SVN, combined with the offline AMS, provides rapid analysis of non-refractory organic and inorganic compounds. For other types of characterization, including analysis of refractory material or organic molecular composition, the SVN can also be coupled with other aerosol instrumentation such as PALMS or CIMS.
Future improvements in the nebulization and collection efficiency of the SVN–AMS will enable analysis with even lower sample mass requirements. The use of organic internal standards is one method to potentially improve collection efficiency in the AMS as the higher organic content may decrease the bounce of particles off the vaporizer. Additionally, the use of solvents with a lower surface tension than water shows promise for improved nebulization efficiencies. Finally, in contrast to atomizers (in which the carrier gas generates the aerosol), ultrasonic nebulizers decouple the aerosol formation from the carrier gas flow rate, enabling potential concentration of the aerosol prior to sampling. A useful future direction for this technique will be to characterize the background signal in different organic solvents and optimize the continuous-flow configuration to minimize the return of large ejected droplets back onto the film. Continuous flow with organic solutions will also enable the analysis of more hydrophobic organic samples such as fresh vehicle emissions, cooking oils, and petrochemical samples. In the future, the SVN can be used to generate aerosol for quantitative and qualitative analysis of other environmental samples to investigate sources or processing and aging of these organic mixtures. The SVN, combined with aerosol measurement techniques such as the AMS, provides a rapid, quantitative method to characterize the chemical and elemental properties of complex organic mixtures, producing rich data sets for the exploration of exceptionally trace environmental samples.
All data sets including mass spectra and SMPS data are available on request from Rachel E. O'Brien, reobrien@wm.edu.
The document contains additional information on particle sizes and memory effects between runs. The supplement related to this article is available online at: https://doi.org/10.5194/amt-12-1659-2019-supplement.
MRC, JTJ, PLC, DRW, JHK, and KJR designed and built the SVN. SHB, JDS, CLF, and DJR provided ambient aerosol samples and DOM. REO and JHK designed experiments and REO carried them out. REO and JHK prepared the paper with contributions from all authors.
The authors declare that they have no conflict of interest.
This work was supported by National Oceanic and Atmospheric Administration grant nos. NA13OAR4310072 and NA140AR4310132. Kelsey J. Ridley acknowledges support from the NSF Graduate Research Fellowship Program. Sri Hapsari Budisulistiorini and Jason D. Surratt acknowledges support from the U.S. Environmental Protection Agency award no. 835404, Electric Power Research Institute (EPRI), and National Oceanic and Atmospheric Administration grant no. NA13OAR4310064. Special thanks are due to David Karl and Eric Grabowski, University of Hawaii, for the CHNS elemental analysis of DOM. Daniel J. Repeta acknowledges support from the Gordan and Betty Moore Foundation award 6000 and the Simons Foundation SCOPE award 329108.
This paper was edited by Keding Lu and reviewed by four anonymous referees.
Aiken, A. C., DeCarlo, P. F., and Jimenez, J. L.: Elemental analysis of organic species with electron ionization high-resolution mass spectrometry, Anal. Chem., 79, 8350–8358, https://doi.org/10.1021/ac071150w, 2007.
Aiken, A. C., Decarlo, P. F., Kroll, J. H., Worsnop, D. R., Huffman, J. A., Docherty, K. S., Ulbrich, I. M., Mohr, C., Kimmel, J. R., Sueper, D., Sun, Y., Zhang, Q., Trimborn, A., Northway, M., Ziemann, P. J., Canagaratna, M. R., Onasch, T. B., Alfarra, M. R., Prevot, A. S. H., Dommen, J., Duplissy, J., Metzger, A., Balensperger, U., and Jimenez, J. L.: O/C and OM/OC Ratios of Primary, Secondary, and Ambient Organic Aerosols with High-Resolution Time-of-Flight Aerosol Mass Spectrometry, Environ. Sci. Technol., 42, 4478–4485, https://doi.org/10.1021/es703009q, 2008.
Becker, J. W., Berube, P. M., Follett, C. L., Waterbury, J. B., Chisholm, S. W., Delong, E. F., Repeta, D. J., and Metz, T.: Closely related phytoplankton species produce similar suites of dissolved organic matter, Front. Microbiol., 5, 1–14, https://doi.org/10.3389/fmicb.2014.00111, 2014.
Bozzetti, C., Daellenbach, K. R., Hueglin, C., Fermo, P., Sciare, J., Kasper-Giebl, A., Mazar, Y., Abbaszade, L., El Kazzi, M., Gonzalez, R., Shuster-Meiseles, T., Flasch, M., Wolf, R., Kr, A., Francesco Canonaco, E., Schnelle-Kreis, R., Slowik, J. G., Zimmermann, R., Rudich, Y., Baltensperger, U., El Haddad, I., and Preo, A. H.: Size-Resolved Identification, Characterization, and Quantification of Primary Biological Organic Aerosol at a European Rural Site, Environ. Sci. Technol., 50, 3425–3434, https://doi.org/10.1021/acs.est.5b05960, 2016.
Bozzetti, C., Sosedova, Y., Xiao, M., Daellenbach, K. R., Ulevicius, V., Dudoitis, V., Mordas, G., Bycenkiene, S., Plauškaite, K., Vlachou, A., Golly, B., Chazeau, B., Besombes, J.-L., Baltensperger, U., Jaffrezo, J.-L., Slowik, J. G., El Haddad, I., and Prévôt, A. S. H.: Argon offline-AMS source apportionment of organic aerosol over yearly cycles for an urban, rural, and marine site in northern Europe, Atmos. Chem. Phys., 17, 117–141, https://doi.org/10.5194/acp-17-117-2017, 2017.
Budisulistiorini, S. H., Li, X., Bairai, S. T., Renfro, J., Liu, Y., Liu, Y. J., McKinney, K. A., Martin, S. T., McNeill, V. F., Pye, H. O. T., Nenes, A., Neff, M. E., Stone, E. A., Mueller, S., Knote, C., Shaw, S. L., Zhang, Z., Gold, A., and Surratt, J. D.: Examining the effects of anthropogenic emissions on isoprene-derived secondary organic aerosol formation during the 2013 Southern Oxidant and Aerosol Study (SOAS) at the Look Rock, Tennessee ground site, Atmos. Chem. Phys., 15, 8871–8888, https://doi.org/10.5194/acp-15-8871-2015, 2015.
Canagaratna, M. R., Jayne, J. T., Jimenez, J. L., Allan, J. D., Alfarra, M. R., Zhang, Q., Onasch, T. B., Drewnick, F., Coe, H., Middlebrook, A., Delia, A., Williams, L. R., Trimborn, A. M., Northway, M. J., Decarlo, P. F., Kolb, C. E., Davidovits, P., and Worsnop, D. R.: Chemical and Microphysical Characterization of Ambient Aerosols with the Aerodyne Aerosol Mass Spectrometer, Mass Spec. Rev., 26, 185–222, https://doi.org/10.1002/mas.20115, 2007.
Canagaratna, M. R., Jimenez, J. L., Kroll, J. H., Chen, Q., Kessler, S. H., Massoli, P., Hildebrandt Ruiz, L., Fortner, E., Williams, L. R., Wilson, K. R., Surratt, J. D., Donahue, N. M., Jayne, J. T., and Worsnop, D. R.: Elemental ratio measurements of organic compounds using aerosol mass spectrometry: characterization, improved calibration, and implications, Atmos. Chem. Phys., 15, 253–272, https://doi.org/10.5194/acp-15-253-2015, 2015.
Chen, Q., Heald, C. L., Jimenez, J. L., Canagaratna, M. R., Zhang, Q., He, L.-Y., Huang, X.-F., Campuzano-Jost, P., Palm, B. B., Poulain, L., Kuwata, M., Martin, S. T., Abbatt, J. P. D., Lee, A. K. Y., and Liggio, J.: Elemental composition of organic aerosol: The gap between ambient and laboratory measurements, Geophys. Res. Lett., 42, 4182–4189, https://doi.org/10.1002/2015GL063693, 2015.
Chen, Q., Ikemori, F., and Mochida, M.: Light Absorption and Excitation-Emission Fluorescence of Urban Organic Aerosol Components and Their Relationship to Chemical Structure, Environ. Sci. Technol., 50, 10859–10868, https://doi.org/10.1021/acs.est.6b02541, 2016.
Daellenbach, K. R., Bozzetti, C., Krepelová, A., Canonaco, F., Wolf, R., Zotter, P., Fermo, P., Crippa, M., Slowik, J. G., Sosedova, Y., Zhang, Y., Huang, R.-J., Poulain, L., Szidat, S., Baltensperger, U., El Haddad, I., and Prévôt, A. S. H.: Characterization and source apportionment of organic aerosol using offline aerosol mass spectrometry, Atmos. Meas. Tech., 9, 23–39, https://doi.org/10.5194/amt-9-23-2016, 2016.
Daumit, K. E., Kessler, S. H., and Kroll, J. H.: Average chemical properties and potential formation pathways of highly oxidized organic aerosol, Farady Discuss., 165, 181–201, https://doi.org/10.1039/c3fd00045a, 2013.
Decarlo, P. F., Kimmel, J. R., Trimborn, A., Northway, M. J., Jayne, J. T., Aiken, A. C., Gonin, M., Fuhrer, K., Horvath, T., Docherty, K. S., Worsnop, D. R., and Jimenez, J. L.: Field-Depolyable, High-Resolution, Time-of-Flight Aerosol Mass Spectrometer, Anal. Chem., 78, 8281–8289, doi:8410.1029/2001JD001213.Analytical, 2006.
Docherty, K. S., Jaoui, M., Corse, E., Jimenez, J. L., Offenberg, J. H., Lewandowski, M., and Kleindienst, T. E.: Collection Efficiency of the Aerosol Mass Spectrometer for Chamber-Generated Secondary Organic Aerosols, Aerosol Sci. Technol., 47, 294–309, https://doi.org/10.1080/02786826.2012.752572, 2013.
Donnelly, T. D., Hogan, J., Mugler, A., Schubmehl, M., Schommer, N., Bernoff, A. J., Dasnurkar, S., and Ditmire, T.: Using ultrasonic atomization to produce an aerosol of micron-scale particles, Rev. Sci. Instrum., 76, 1–10, https://doi.org/10.1063/1.2130336, 2005.
Gallimore, P. J. and Kalberer, M.: Characterizing an Extractive Electrospray Ionization (EESI) Source for the Online Mass Spectrometry Analysis of Organic Aerosols, Environ. Sci. Technol., 47, 734–7331, https://doi.org/10.1021/es305199h, 2013.
Ge, X., Li, L., Chen, Y., Chen, H., Wu, D., Wang, J., Xie, X., Ge, S., Ye, Z., Xu, J., and Chen, M.: Aerosol characteristics and sources in Yangzhou, China resolved by offline aerosol mass spectrometry and other techniques, Environ. Pollut., 225, 74–85, https://doi.org/10.1016/j.envpol.2017.03.044, 2017.
Han, Y., Kawamura, K., Chen, Q., and Mochida, M.: Formation of high-molecular-weight compounds via the heterogeneous reactions of gaseous C8–C10 n-aldehydes in the presence of atmospheric aerosol components, Atmos. Environ., 126, 290–297, https://doi.org/10.1016/j.atmosenv.2015.11.050, 2016.
Hansman, R. L., Dittmar, T., and Herndl, G. J.: Conservation of dissolved organic matter molecular composition during mixing of the deep water masses of the northeast Atlantic Ocean, Mar. Chem., 177, 288–297, https://doi.org/10.1016/j.marchem.2015.06.001, 2015.
Heald, C. L., Kroll, J. H., Jimenez, J. L., Docherty, K. S., Decarlo, P. F., Aiken, A. C., Chen, Q., Martin, S. T., Farmer, D. K., and Artaxo, P.: A simplified description of the evolution of organic aerosol composition in the atmosphere, Geophys. Res. Lett., 37, L08803, https://doi.org/10.1029/2010GL042737, 2010.
Huang, R.-J., Zhang, Y., Bozzetti, C., Ho, K.-F., Cao, J.-J., Han, Y., Daellenbach, K. R., Slowik, J. G., Platt, S. M., Canonaco, F., Zotter, P., Wolf, R., Pieber, S. M., Bruns, E. A., Crippa, M., Ciarelli, G., Piazzalunga, A., Schwikowski, M., Abbaszade, G., Schnelle-Kreis, J., Zimmermann, R., An, Z., Szidat, S., Baltensperger, U., El Haddad, I., and Prévôt, A. S. H.: High secondary aerosol contribution to particulate pollution during haze events in China, Nature, 514, 218–222, https://doi.org/10.1038/nature13774, 2014.
Hunter, J. F., Carrasquillo, A. J., Daumit, K. E., and Kroll, J. H.: Secondary Organic Aerosol Formation from Acyclic, Monocyclic, and Polycyclic Alkanes, Environ. Sci. Technol., 48, 10227–10234, https://doi.org/10.1021/es502674s, 2014.
Jimenez, J. L., Jayne, J. T., Shi, Q., Kolb, C. E., Worsnop, D. R., Yourshaw, I., Seinfeld, J. H., Flagan, R. C., Zhang, X., Smith, K. A., Morris, J. W., and Davidovits, P.: Ambient aerosol sampling using the Aerodyne Aerosol Mass Spectrometer, J. Geophys. Res., 108, 8425, https://doi.org/10.1029/2001JD001213, 2003.
Jimenez, J. L., Canagaratna, M. R., Donahue, N. M., Prevot, A. S. H., Zhang, Q., Kroll, J. H., Decarlo, P. F., Allan, J. D., Coe, H., Ng, N. L., Aiken, A. C., Docherty, K. S., Ulbrich, I. M., Grieshop, A. P., Robinson, A. L., Duplissy, J., Smith, J. D., Wilson, K. R., Lanz, V. A., Hueglin, C., Sun, Y. L., Tian, J., Laaksonen, A., Raatikainen, T., Rautiainen, J., Vaattovaara, P., Ehn, M., Kulmala, M., Tomlinson, J. M., Collins, D. R., Cubison, M. J., Dunlea, E. J., Huffman, J. A., Onasch, T. B., Alfarra, M. R., Williams, P. I., Bower, K., Kondo, Y., Schneider, J., Drewnick, F., Borrmann, S., Weimer, S., Demerjian, K., Salcedo, D., Cottrell, L., Griffin, R., Takami, A., Miyoshi, T., Hatakeyama, S., Shimono, A., Sun, J. Y., Zhang, Y. M., Dzepina, K., Kimmel, J. R., Sueper, D., Jayne, J. T., Herndon, S. C., Trimborn, A. M., Williams, L. R., Wood, E. C., Middlebrook, A. M., Kolb, C. E., Baltensperger, U., and Worsnop, D. R.: Evolution of Organic Aerosols in the Atmosphere, Science, 80, 1525–1529, https://doi.org/10.1126/science.1179518, 2009.
Jimenez, J. L., Canagaratna, M. R., Drewnick, F., Allan, J. D., Alfarra, M. R., Middlebrook, A. M., Slowik, J. G., Zhang, Q., Coe, H., Jayne, J. T., and Worsnop, D. R.: Comment on “The effects of molecular weight and thermal decomposition on the sensitivity of a thermal desorption aerosol mass spectrometer,” Aerosol Sci. Technol., 50, i–xv, https://doi.org/10.1080/02786826.2016.1205728, 2016.
Kaul, D. S., Gupta, T., and Tripathi, S. N.: Source Apportionment for Water Soluble Organic Matter of Submicron Aerosol: A Comparison between Foggy and Nonfoggy Episodes, Aerosol Air Qual. Res., 14, 1527–1533, https://doi.org/10.4209/aaqr.2013.10.0319, 2014.
Kimmel, J. R., Farmer, D. K., Cubison, M. J., Sueper, D., Tanner, C., Nemitz, E., Worsnop, D. R., Gonin, M., and Jimenez, J. L.: Real-time aerosol mass spectrometry with millisecond resolution, Int. J. Mass Spectrom., 303, 15–26, https://doi.org/10.1016/j.ijms.2010.12.004, 2010.
Koch, B. P., Witt, M., Engbrodt, R., Dittmar, T., and Kattner, G.: Molecular formulae of marine and terrigenous dissolved organic matter detected by electrospray ionization Fourier transform ion cyclotron resonance mass spectrometry, Geochim. Cosmochim. Acta, 69, 3299–3308, https://doi.org/10.1016/j.gca.2005.02.027, 2005.
Kroll, J. H., Donahue, N. M., Jimenez, J. L., Kessler, S. H., Canagaratna, M. R., Wilson, K. R., Altieri, K. E., Mazzoleni, L. R., Wozniak, A. S., Bluhm, H., Mysak, E. R., Smith, J. D., and Kolb, C. E.: Carbon oxidation state as a metric for describing the chemistry of atmospheric organic aerosol, Nat. Chem., 3, 133–139, https://doi.org/10.1038/NCHEM.948, 2011.
Kroll, J. H., Lim, C. Y., Kessler, S. H., and Wilson, K. R.: Heterogeneous Oxidation of Atmospheric Organic Aerosol: Kinetics of Changes to the Amount and Oxidation State of Particle-Phase Organic Carbon, J. Phys. Chem. A, 119, 10767–10783, https://doi.org/10.1021/acs.jpca.5b06946, 2015.
Lang, R. J.: Ultrasonic Atomization of Liquids, J. Acoust. Soc. Am., 34, 6–8, 1962.
Lee, A. K. Y., Hayden, K. L., Herckes, P., Leaitch, W. R., Liggio, J., Macdonald, A. M., and Abbatt, J. P. D.: Characterization of aerosol and cloud water at a mountain site during WACS 2010: secondary organic aerosol formation through oxidative cloud processing, Atmos. Chem. Phys., 12, 7103–7116, https://doi.org/10.5194/acp-12-7103-2012, 2012.
Lopez-Hilfiker, F. D., Mohr, C., Ehn, M., Rubach, F., Kleist, E., Wildt, J., Mentel, Th. F., Lutz, A., Hallquist, M., Worsnop, D., and Thornton, J. A.: A novel method for online analysis of gas and particle composition: description and evaluation of a Filter Inlet for Gases and AEROsols (FIGAERO), Atmos. Meas. Tech., 7, 983–1001, https://doi.org/10.5194/amt-7-983-2014, 2014.
Lu, Y., Li, X., Mesfioui, R., Bauer, J. E., Chambers, R. M., Canuel, E. A., and Hatcher, P. G.: Use of ESI-FTICR-MS to Characterize Dissolved Organic Matter in Headwater Streams Draining Forest-Dominated and Pasture-Dominated Watersheds, PLoS One, 10, 1–21, https://doi.org/10.1371/journal.pone.0145639, 2015.
Mihara, T. and Mochida, M.: Characterization of Solvent-Extractable Organics in Urban Aerosols Based on Mass Spectrum Analysis and Hygroscopic Growth Measurement, Environ. Sci. Technol., 45, 9168–9174, https://doi.org/10.1021/es201271w, 2011.
Murphy, D. M., Thomson, D. S., and Mahoney, M. J.: In Situ Measurements of Organics, Meteoritic Material, Mercury, and Other Elements in Aerosols at 5 to 19 Kilometers, Science, 80, 1664–1669, 1998.
Nakao, S., Tang, P., Tang, X., Clark, C. H., Qi, L., Seo, E., Asa-Awuku, A., and Iii, D. C.: Density and elemental ratios of secondary organic aerosol: Application of a density prediction method, Atmos. Environ., 68, 273–277, https://doi.org/10.1016/j.atmosenv.2012.11.006, 2013.
Ng, N. L., Herndon, S. C., Trimborn, A., Canagaratna, M. R., Croteau, P. L., Onasch, T. B., Sueper, D., Worsnop, D. R., Zhang, Q., Sun, Y. L., and Jayne, J. T.: An Aerosol Chemical Speciation Monitor (ACSM) for Routine Monitoring of the Composition and Mass Concentrations of Ambient Aerosol, Aerosol Sci. Technol., 45, 780–794, https://doi.org/10.1080/02786826.2011.560211, 2011a.
Ng, N. L., Canagaratna, M. R., Jimenez, J. L., Chhabra, P. S., Seinfeld, J. H., and Worsnop, D. R.: Changes in organic aerosol composition with aging inferred from aerosol mass spectra, Atmos. Chem. Phys., 11, 6465–6474, https://doi.org/10.5194/acp-11-6465-2011, 2011b.
Simon, J. C., Sapozhnikov, O. A., Khokhlova, V. A., Crum, L. A., and Bailey, M. R.: Ultrasonic atomization of liquids in drop-chain acoustic fountains, J Fluid Mech., 766, 129–146, https://doi.org/10.1017/jfm.2015.11.Ultrasonic, 2015.
Skoog, D. F., Holler, F. J., and Nieman, T. A.: Principles of Instrumental Analysis, Saunders College Pub, Philadelphia, 1998.
Sun, Y., Zhang, Q., Zheng, M., Ding, X., Edgerton, E. S., and Wang, X.: Characterization and Source Apportionment of Water-Soluble Organic Matter in Atmospheric Fine Particles (PM2.5) with High-Resolution Aerosol Mass Spectrometry and GC-MS, Environ. Sci. Technol., 45, 4854–4861, https://doi.org/10.1021/es200162h, 2011.
Xu, J., Zhang, Q., Li, X., Ge, X., Xiao, C., Ren, J., and Qin, D.: Dissolved Organic Matter and Inorganic Ions in a Central Himalayan Glacier-Insights into Chemical Composition and Atmospheric Sources, Environ. Sci. Technol., 47, 6181–6188, https://doi.org/10.1021/es4009882, 2013.
Xu, J. Z., Zhang, Q., Wang, Z. B., Yu, G. M., Ge, X. L., and Qin, X.: Chemical composition and size distribution of summertime PM2.5 at a high altitude remote location in the northeast of the Qinghai-Xizang (Tibet) Plateau: insights into aerosol sources and processing in free troposphere, Atmos. Chem. Phys., 15, 5069–5081, https://doi.org/10.5194/acp-15-5069-2015, 2015.
Xu, L., Guo, H., Weber, R. J., and Ng, N. L.: Chemical Characterization of Water-Soluble Organic Aerosol in Contrasting Rural and Urban Environments in the Southeastern United States, Environ. Sci. Technol., 51, 78–88, https://doi.org/10.1021/acs.est.6b05002, 2016.
Xu, W., Lambe, A., Silva, P., Hu, W., Onasch, T., Williams, L., Croteau, P., Zhang, X., Renbaum-Wolff, L., Fortner, E., Jimenez, J. L., Jayne, J., Worsnop, D., and Canagaratna, M.: Laboratory evaluation of species-dependent relative ionization efficiencies in the Aerodyne Aerosol Mass Spectrometer Laboratory evaluation of species-dependent relative ionization efficiencies in the Aerodyne Laboratory eva, Aerosol Sci. Technol., 52, 626–641, https://doi.org/10.1080/02786826.2018.1439570, 2018.
Ye, Z., Liu, J., Gu, A., Feng, F., Liu, Y., Bi, C., Xu, J., Li, L., Chen, H., Chen, Y., Dai, L., Zhou, Q., and Ge, X.: Chemical characterization of fine particulate matter in Changzhou, China, and source apportionment with offline aerosol mass spectrometry, Atmos. Chem. Phys., 17, 2573–2592, https://doi.org/10.5194/acp-17-2573-2017, 2017.