the Creative Commons Attribution 4.0 License.
the Creative Commons Attribution 4.0 License.
 | 15 Mar 2019
The interference of tetrachloromethane in the measurement of benzene in the air by a gas chromatography–photoionisation detector (GC-PID)
Cristina Romero-Trigueros
Marta Doval Miñarro
Enrique González Ferradás
The European Union requires that benzene in the air is continuously measured due to its toxicity and widespread presence in the population nuclei, mainly motivated by vehicle emissions. The reference measuring technique is gas chromatography (GC). Automatic chromatographs used in monitoring stations must verify the operating conditions established in Standard EN 14662 part 3, which includes a type approval section with a number of tests that analysers must pass. Among these tests, the potential interference of a number of compounds is evaluated. The 2005 version of the mentioned standard requires the evaluation of the potential interference of tetrachloromethane (TCM). The 2015 version eliminates TCM as a potential interferent. Although most consumer uses of TCM have been banned, recent studies have measured significant concentrations of TCM in the air. In this paper, the potential interference of TCM in benzene measurements obtained with gas chromatography coupled to a photoionisation detector (GC-PID) has been investigated. Our study shows that the simultaneous presence of benzene and TCM causes a significant decrease in benzene readings. For TCM concentrations of 0.7 µg m−3 (typical of urban areas) and 4.5 µg m−3 (detected in the vicinity of landfills), the relative errors in benzene measurements were 34 % and 70 %, respectively, which are far too high compared to the maximum overall uncertainty allowed for benzene measurements (25 %). Possible mechanisms to qualitatively and quantitatively explain the behaviour of the PID when measuring benzene with and without TCM have been proposed.
- Article
(751 KB) - Full-text XML
- BibTeX
- EndNote


Benzene is a volatile organic compound (VOC) (Tisserand and Young, 2014). Directive 2008/50/EC (European Commission, 2008) defines VOCs as organic compounds from anthropogenic and biogenic sources, other than methane, that are capable of producing photochemical oxidants by reactions with nitrogen oxides in the presence of sunlight. Benzene sources include natural emissions from vegetation and oceans (Misztal et al., 2015), microbial decomposition (Neves et al., 2005), wildfires (Wentworth et al., 2018), and volcanoes (Tassi et al., 2015); anthropogenic emissions mainly from vehicles that use fossil fuels (von Schneidemesser et al., 2010); and, in central and northern European countries, emissions from the combustion of wood used for domestic heating (Hellén et al., 2008). It is also present in tobacco smoke (Darrall et al., 1998) and in a wide range of industrial and household products (solvents, adhesives, paints and cleaning products) and is also a raw material for the synthesis of other products, such as dyes, detergents, plastics and explosives (Guenther et al., 1995). Its content in gasoline is regulated by Directive 2009/33/CE, and it has to be < 1 % (v∕v) (European Commission, 2009).
Due to the chemical stability of benzene compared with most VOCs (with a half-life of 9.4 days; Atkinson, 2000), its permanence in the atmosphere is high. Consequently, it can be transported over long distances. It is degraded by OH radicals in the troposphere, forming phenol and glyoxal, among other compounds (Atkinson, 2000; Volkamer et al., 2001).
Benzene is a recognised inducer of leukaemia (D'Andrea and Reddy, 2016) and also affects the central nervous and immune systems and damages genetic material (Bahadar et al., 2014). It is the only VOC in Europe whose concentrations in the air are regulated. Its annual limit value is 5 µg m−3 at 293 K and 101.4 kPa, and monitoring it in the air is mandatory (European Commission, 2008). The standardised methods for the measurement of benzene concentrations in the air were established by Directive 2008/50/EC (European Commission, 2008) and are described in the Standard EN 14662 published in 2005, which is composed of five parts (CEN, 2005a, b, c, d, e). All parts are still valid, but part 3 was modified in 2015 (CEN, 2015). Each part describes a measuring method using gas chromatography (GC), but they differ in the sample collection and the automation of the analysis. Part 1 of the Standard EN 14662 describes the sampling of air by pumping, using active carbon as an adsorbent and carrying out thermal desorption before the analysis. Part 2 differs from part 1 in the desorption process, where carbon disulfide is used. Parts 4 and 5 describe a method where diffusive samplers are used to collect the sample, followed by thermal desorption (part 4) or solvent desorption (part 5) and GC. Part 3 of the 2005 and 2015 versions of the standard describes an automated method of sampling and analysis, which is commonly used in the air quality monitoring stations in Europe. Both versions contain a type approval section that consists of a series of tests that analysers must pass before commercialisation. Among the type approval tests, the potential interference of a number of substances has to be evaluated.
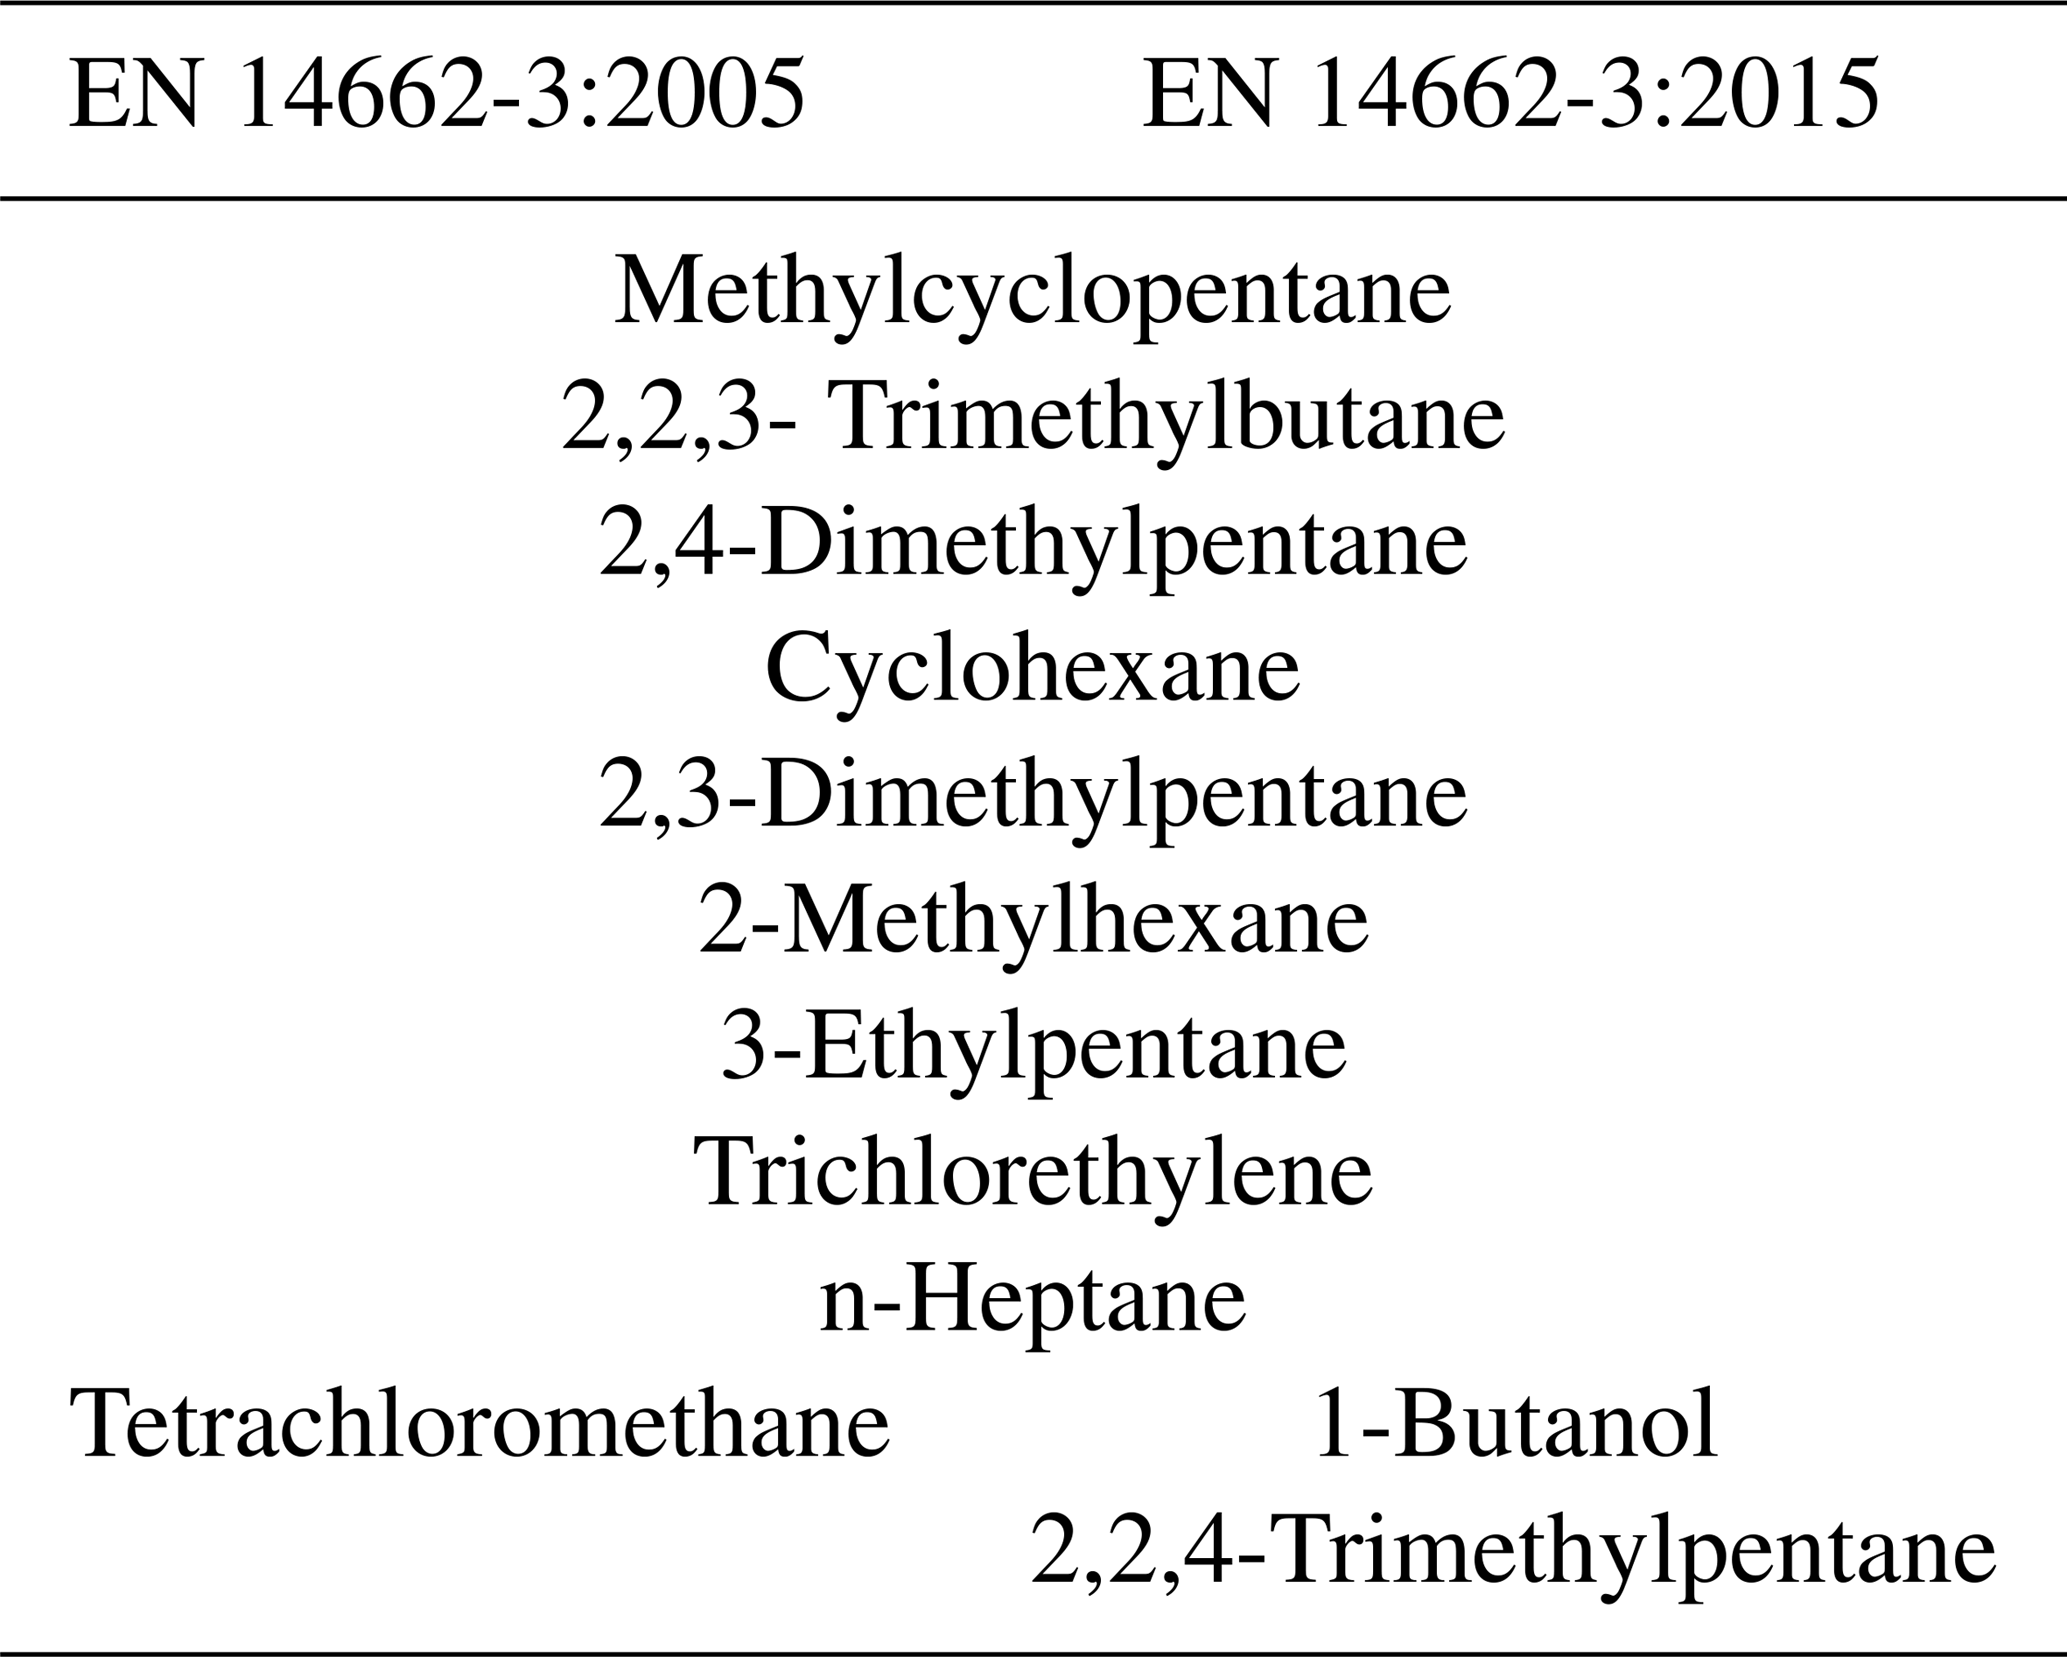
The 2005 version of the Standard EN 14662-3 included a list of paraffinic, cyclic and halogenated organic compounds (including tetrachloromethane – TCM) that had to be tested as potential interferents. In the 2015 version, all hydrocarbons are maintained and isooctane (2,2,4-trimethylpentane) and 1-butanol have been added but TCM has been removed. Table 1 shows all the common and specific components of each version.
Table 1Organic compounds used to assess interferences in the measurement of benzene in the air, in accordance with standards EN 14662-3 (2005 and 2015 versions).
The synthesis of TCM for emissive uses was controlled and practically banned by the Montreal Protocol because it is an ozone-depleting substance (Sherry et al., 2018). However, its use as a raw material for the synthesis of other substances such as hydrofluorocarbons, pyrethroid pesticides or perchloroethylene is still allowed (Graziosi et al., 2016). Diffuse emissions may occur in its manufacture or during its use in the aforementioned syntheses. In this sense, 9500 Mt of TCM were estimated to be emitted in 192 countries in 2007 (Penny et al., 2010). However, since the entry into force of the Montreal Protocol, there has been a progressive decrease in the environmental presence of TCM, with a decrease in its global average concentration of 10 to 15 pptv decade−1 (equivalent to 69 to 104 ng Nm−3 decade−1) (Valeri et al., 2017). In 2005, the Agency for Toxic Substances and Disease Registry (ATSDR, 2005) determined a global average concentration of 0.7 µg Nm−3 with peaks in urban areas of 1.4 to 4.5 µg Nm−3, whereas 45 µg Nm−3 was detected in the vicinity of landfills (Brosas-Montecastro, 2008). More recent data collected in several cities of the world confirm average values of 0.61 µg Nm−3 in Lukang (Taiwan), 0.64 µg Nm−3 in Bristol (UK) and 1.10 µg Nm−3 in Bilbao (Spain) (de Blas et al., 2016). In this last city, maximum concentrations of 9.94 µg Nm−3 have been measured. These values justify the need for studying its potential interference in benzene measurements. It should also be noted that the global average lifetime of TCM reported in the recent literature is 44 years (36–58) (Ko et al., 2013; Valeri et al., 2017), so its effects, such as the one indicated here, will be manifested during the next decades.
Given the above, in this paper, the potential interference of TCM in benzene measurements carried out by gas chromatography coupled to a photoionisation detector (GC-PID) is studied. A mechanism that explains the observed behaviour is also proposed.
2.1 Experimental set-up
An in-house-designed controlled atmosphere chamber was used to generate dynamic test mixtures of benzene in the air with and without TCM (Fig. 1). This chamber was used in previous works (Romero-Trigueros et al., 2016, 2017), and only a brief description will be given here. Zero air was generated from ambient air with a JUN-AIR compressor (Michigan, USA) provided with a drier, which is capable of reducing the relative humidity of the air down to 5 %. This dry air flows through three consecutive scrubbers containing silica gel with an indicator (orange gel) (Merck, Darmstadt, Germany) and K47 active charcoal (Chiemivall, Barcelona, Spain) to remove any traces of remaining humidity and other gases present in the air. After purification, a periodic check of organic pollutants in the zero air was carried out by gas chromatography, ensuring they were below their limits of detection. Benzene was incorporated to the zero air from a high-concentration gas mixture of benzene in nitrogen. Two mixtures from Abelló Linde (Valencia, Spain) were purchased at nominal concentrations of 1000 and 350 µg m−3 of benzene (5 % expanded uncertainty). TCM was also incorporated from one of the two gas cylinders of TCM in nitrogen available in the laboratory (18 and 65 µg m−3, 5 % expanded uncertainty) (Praxair, Guildford, UK) depending on the final concentrations required for our tests. An additional gas cylinder containing a mixture of the components in Table 1 at 2000 µg m−3 nominal concentration in nitrogen (5 % expanded uncertainty) (Praxair, Guildford, UK) was used to perform the interference test detailed in Standard EN 14662-3: 2005. All mixtures were certified by their respective manufacturers according to ISO Standard 6141:2000 (ISO, 2000). The flow rate of zero air and the target species were controlled and measured with Bronkhorst HI-TEC (Ruurlo, The Netherlands) mass flow controllers (ranges of 0–0.4 L min−1 for the benzene in nitrogen and TCM in nitrogen mixtures and 0–12 L min−1 for the zero air). The chamber allows for the humidification of the mixtures with an in-house-designed humidifier (Romero-Trigueros et al., 2017). Sample and environmental temperature can also be controlled as can sample pressure at the inlet of the GC-PID. The laboratory was provided with a mercury barometer (Thies CLIMA, Göttingen, Germany), and high-sensitivity Magnehelic gauges (Dwyer, Michigan, USA) were connected to the input of each chromatograph to maintain the flow at the reference pressure. Sample relative humidity and temperature were measured with a Testo 645 thermo hygrometer (Barcelona, Spain). All the tests carried out in the present work were done with dry gases at 293±2 K and 101.3 kPa.
The final concentration of component x (Cpx, expressed in µg m−3) after mixing all the gas flows can be determined from the mass balance expressed in Eq. (1):
where is the concentration of component x in the high-concentration gas cylinder, is the flow rate from the gas cylinder containing pollutant x, Qa is the zero air flow rate and ΣQb is the sum of the rest of flow rates coming from gas cylinders. These concentrations and flow rates are expressed at 293 K and 101.3 KPa. These conditions were maintained at the entrance of each chromatograph for all tests. The expanded uncertainties of all generated concentrations of pollutants were estimated from the standard uncertainties of the high-concentration gas mixtures in the cylinders and the standard uncertainties of the gas flow rates. In all cases, the final expanded uncertainty was less than 5 %, according to the limit established in Standard EN 14662-3.
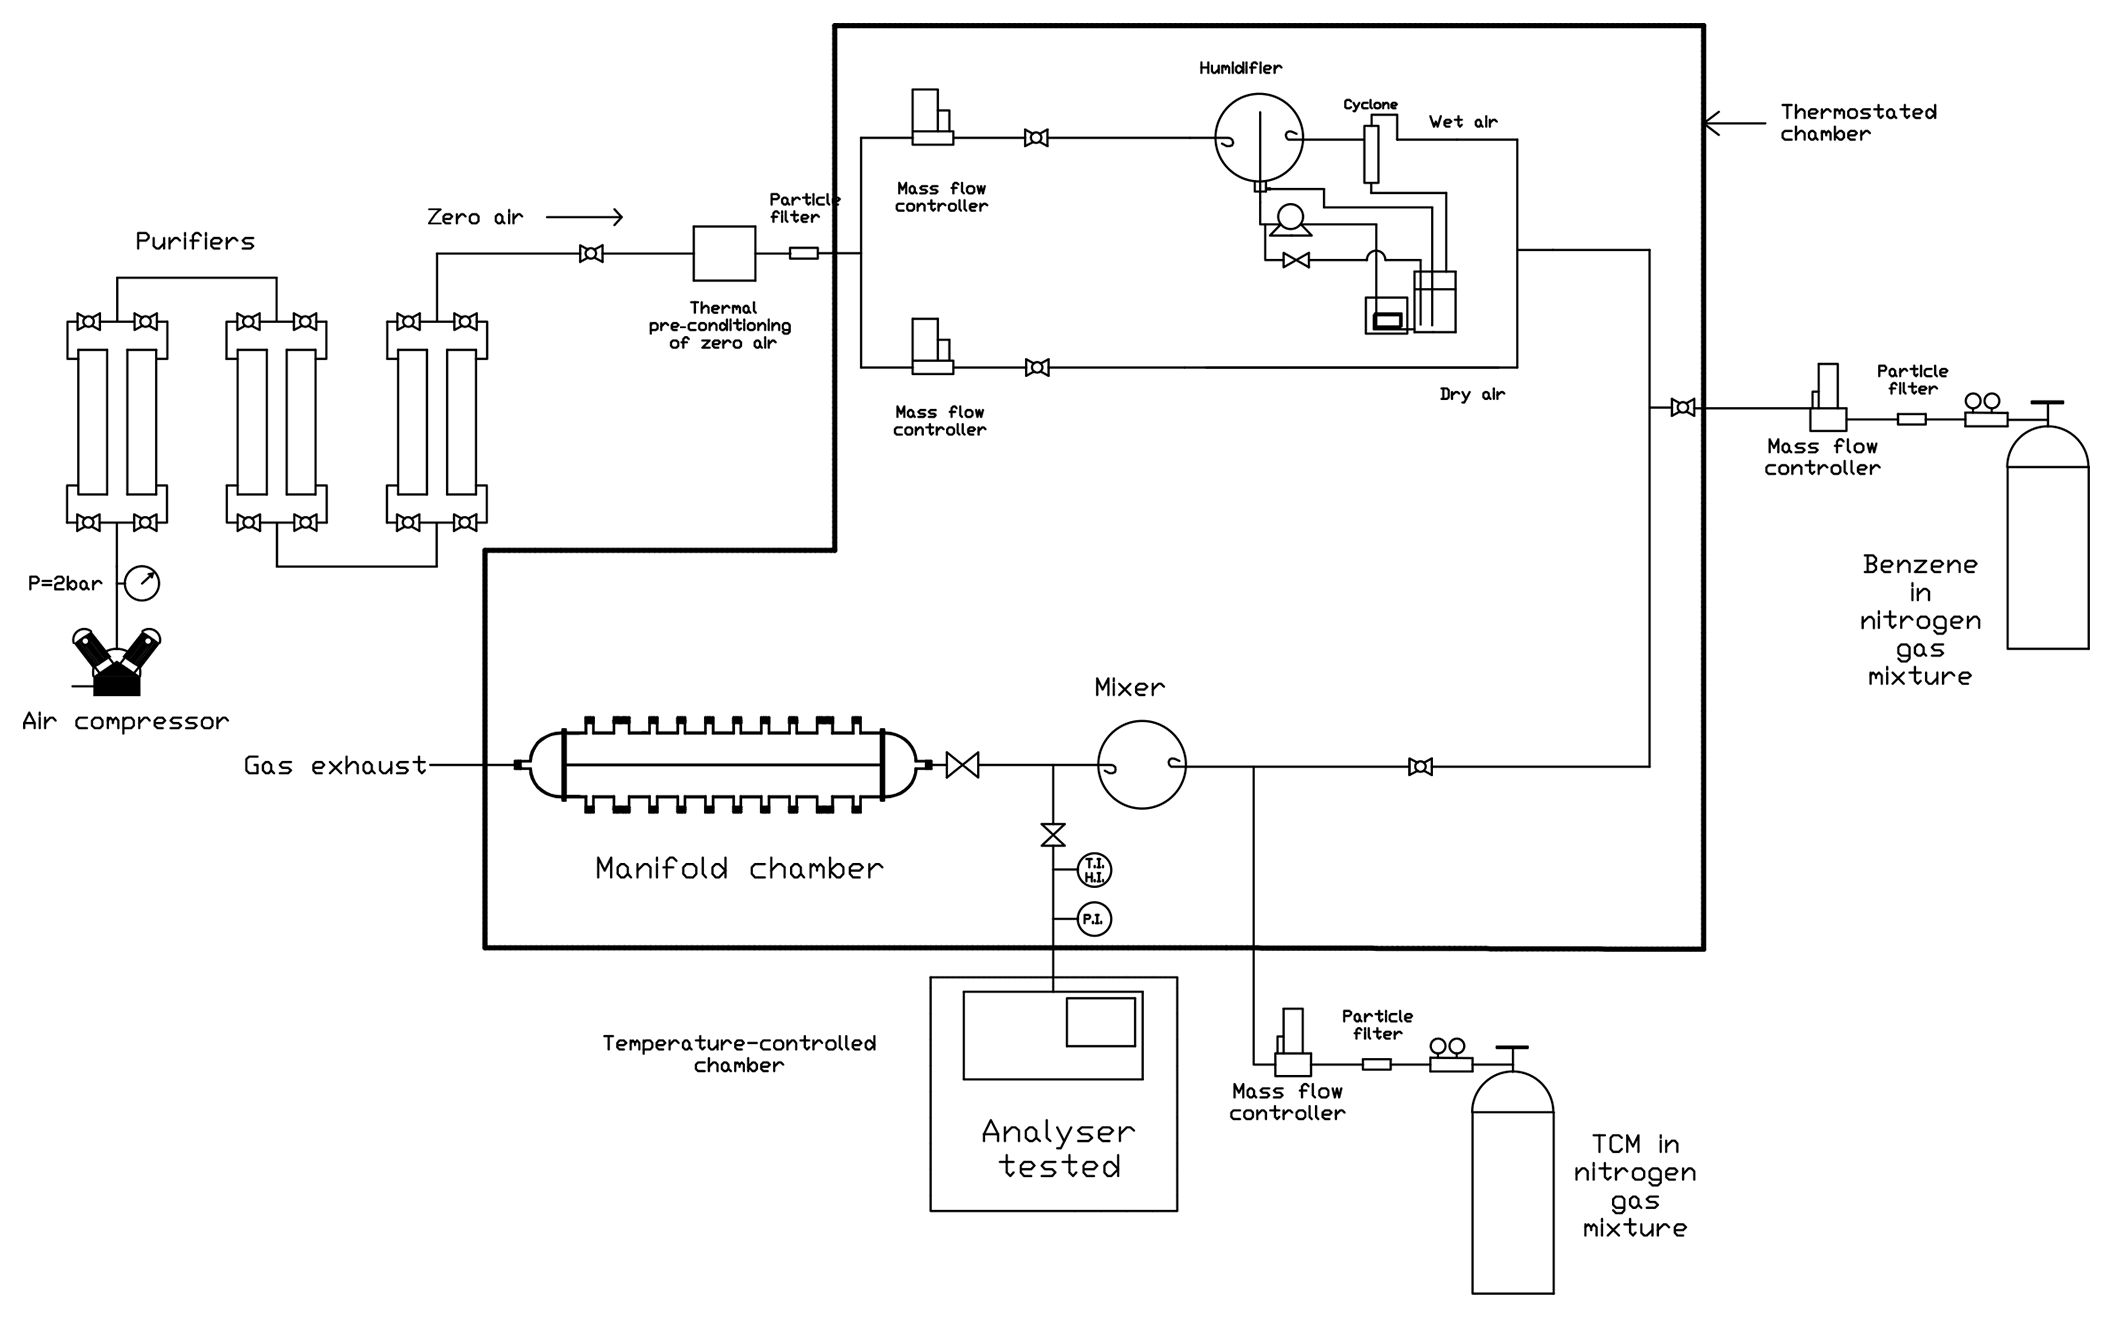
Figure 1Schematic of the components of the controlled atmosphere chamber used to obtain gas mixtures of benzene in the air with and without potential interferent substances. (HI: humidity indicator; TI: temperature indicator; PI: pressure indicator).
Two identical type-approved BTEX Syntech Spectras GC955 chromatographs equipped with PIDs (Groningen, Netherlands) were tested in this work. These are widely used in European air pollution monitoring networks and were identified as analysers I and II. The analytical process is semi-continuous. While the GC-PID is analysing a sample, a new one is sampled and sent to the pre-concentration system. The air sampling system comprises a 35 mL capacity piston pump, and the suction operation is repeated five times producing a total sample volume of 175 mL in each cycle. The successive 35 mL samples of air flow to a pre-concentrator (consisting of a column filled with Tenax), which retains the organic compounds and releases the excess air. Once the five suction cycles are completed, the contaminants retained in the pre-concentrator undergo thermal desorption and are carried with Nitrogen 5.0 (99.999 % purity; Abelló Linde, Valencia, Spain) towards the chromatographic column. The column was an AT-5 capillary column (15 m length × 0.32 mm diameter) and was composed of silica with a film of adsorbent polymer (1 µm heliflex coating) ideal for substances with boiling points between 40 and 250 ∘C. The initial oven temperature was set at 50 ∘C and maintained for 3 min and then increased to 70 ∘C at 10 ∘C min−1. This temperature was maintained for 7 min before being reduced to 50 ∘C with a cooling rate of 10 ∘C min−1. The windows used to quantify benzene in analysers I and II were 176–212 and 148–182 s, respectively. Each measurement cycle (from the first aspiration of air to the final result of the detected concentration) lasts for 15 min.
2.2 Experimental methods
2.2.1 Experimental procedure to evaluate the potential interference of organic compounds according to Standard EN 14662:2005-3
A first set of experiments was carried out according to Standard EN 14662:2005-3 with analysers I and II for two different benzene nominal concentrations (0.5 and 40 µg m−3). The procedure consisted of generating a reference gas mixture of benzene in zero air with the desired concentration, which was measured with the GC-PID. Afterwards, the organic compounds were added from an independent gas cylinder and the analyser measurements were compared with the previous ones. The effect of the dilution produced in the concentration of benzene in the reference gas mixture when adding the interferents was taken into account in the calculations. For each test, six individual measurements were taken to obtain statistically significant data, using the arithmetic mean as the representative value. A similar test was also carried out at a nominal concentration of 5 µg m−3 benzene in zero air as this is the annual limit value of benzene concentrations in the air in the EU (European Commission, 2008).
According to Standard EN 14662:2005-3, the parameters used to evaluate the deviations caused by the interferents are the effect of organic compounds (, Eq. 2), the standard uncertainty (, Eq. 3) and the test value (Vtest, Eq. 4). In these equations, is the average concentration of benzene in the presence of organic compounds measured by the analyser (µg m−3) and Ca is the average concentration of benzene measured in the absence of organic compounds (µg m−3). We have also used the relative error (RE) of the measurements to compare the results (Eq. 5).
In order to ensure that the biases obtained in these and subsequent experiments were only due to the interfering compounds tested, sample and surrounding temperature, sample pressure, and voltage were kept constant during all experiments. A lack-of-fit test was performed in order to assess the accuracy of the readings. For this, after calibration of the analysers, several gas mixtures of benzene in the air with different concentrations ranging from 0 to 50 µg m−3 were measured. Relative differences between the readings and the reference concentrations were calculated and, in all cases, were below 10 %, much lower than the values reported in Sect. 3 due to the interference of TCM.
2.2.2 Experimental procedure to study the interference of TCM in benzene measurement
Due to the different nature of the interference of the organic compounds that reach the PID, separate studies should be carried out for those that positively (increasing) and negatively (decreasing) affect the measurements of benzene. As explained later, TCM causes the concentration of benzene to decrease, whereas the rest of the compounds act positively; thus, independent tests studying only the influence of TCM were performed.
To study the effect of TCM on the GC-PID measurements of benzene, subsequent tests were performed with Analyser I. This decision was supported by the similar behaviour observed for both analysers when carrying out the tests described in Sect. 2.2.1. In addition, a reproducibility test was carried out in the lab. Both analysers simultaneously measured a gas mixture containing 5 µg m−3 nominal benzene in zero air. The reproducibility (in µg m−3) was calculated as
where di is the i difference in readings between analysers I and II and n is the total number of measurements (six in our case). The value obtained was 0.067 µg m−3 when the average concentration of benzene in the reference gas mixture was 4.6 µg m−3, which means 1.5 % bias. This value was considered low enough to perform the subsequent tests just with just one analyser.
Analyser I was first calibrated with dynamic reference gas mixtures of benzene (Cp) with nominal concentrations of 0, 2.5, 5, 10, 20 and 40 µg m−3. Next, gas mixtures of benzene were prepared at the same concentrations but with the addition of TCM in nitrogen such that the final concentrations of TCM (CTCM) were 0.5, 1.0, 2.0 and 5.0 µg m−3. The measurements of the latter mixtures produced the benzene readings named as CaTCM. The TCM concentrations were selected due to its presence in urban areas at these levels (see Sect. 1). As before, Eq. (1) was used to calculate the flow rates of TCM and benzene in the different experiments. In all cases, each measurement was repeated six times.
3.1 Potential interference of organic compounds according to Standard EN 14662:2005-3
The results obtained when carrying out the tests for evaluating the interference of organic compounds according to Standard EN 14662:2005-3 are shown in Table 2. Also, the results of a similar test with a nominal concentration of benzene of 5 µg m−3 are included. As can be seen in Table 2, the mixture of organic compounds interfered significantly, causing errors close to 60 % for the highest concentrations of benzene in the two chromatographs tested. When the reference concentration of benzene used was 5 µg m−3 significant negative deviations from this value were also observed in the presence of the mixture of organic compounds.
Table 2Results obtained when conducting the test to evaluate the interference of organic compounds in benzene readings for analysers I and II. Nominal concentrations tested: 0.5 and 40 µg m−3 (according to Standard EN 14662:2005-3) and 5 µg m−3. Standard deviation of six measurements shown in parentheses.

A similar result (Locoge et al., 2010) was obtained with the same GC-PID and a gas mixture of 5 µg m−3 benzene in the air and 5 µg m−3 of each interfering substances in Table 1, according to EN 14662:2005-3. Benzene readings were 40 % lower than the expected value. The chromatographs obtained had four peaks. The first of them corresponded to 2-dimethylpentane, methylcyclopentane and 2,2,3-dimethylbutane; the second one to benzene, cyclohexane, 2-methylhexane and TCM; a third one to 3-ethylpentane; and a fourth one to n-heptane and trichloroethylene. Among the interferents of peak 2, only cyclohexane and 2-methylhexane increase the readings of benzene because their respective ionisation potentials (between 9.88 and 10.08 eV) are lower than the potential generated by the detector lamp (10.6 eV), and therefore the electric current in the detector increases, leading to an increase in the apparent concentration of benzene. However, TCM must exhibit a different behaviour as its ionisation potential (11.7 eV) is greater than that emitted by the lamp; therefore, it does not ionise and increase the intensity in the detector. It is evident that it acts inversely since it significantly decreases the apparent benzene concentration. Further tests were carried out to study the nature and the extent of this interference (Sect. 3.2).
3.2 Effect of TCM on benzene measurements
Table 3 gathers the results of the tests performed according to Sect. 2.2.2. It can be seen that the presence of TCM significantly decreases the readings of benzene with respect to the reference gas mixture concentrations (Cp). Moreover, the deviations increase with increasing TCM concentrations. Otherwise, for the same TCM concentration, the relative difference of the readings for increasing benzene concentrations remained practically constant. The minimum average deviation found was 27.3 % (2.74 SD) for TCM concentrations of 0.5 µg m−3. The maximum average deviation found was 68.5 % (2.78 SD) for TCM concentration of 5 µg m−3.
Table 3Average readings of benzene concentrations obtained with Analyser I when measuring benzene reference gas mixtures without TCM (Ca) and with TCM (CaTCM). Standard deviation of six measurements shown in parentheses.

Table 4Calibration lines of Analyser I obtained by linear regression (without TCM (Ca) and with TCM (CaTCM)). R2 is shown in brackets. The parameter 1−K is also shown.
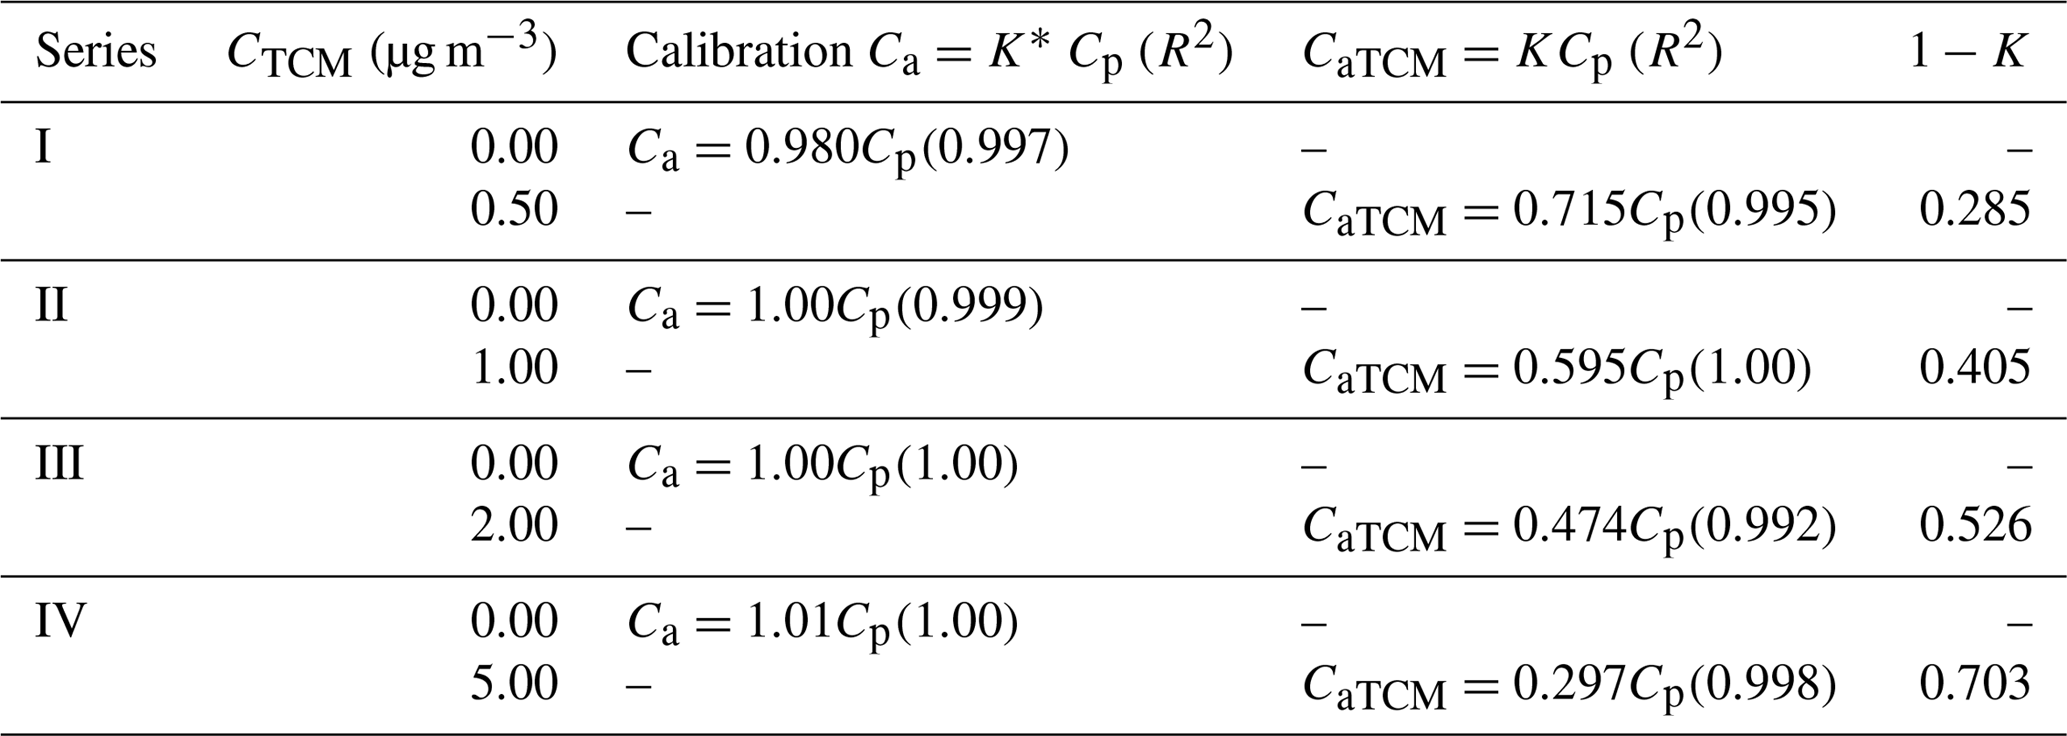
The experimental values of Ca and CaTCM were plotted versus Cp (Figs. 2 and 3). Linear relationships between Ca or CaTCM and Cp were found for each series (p < 0.001). All lines passed through the origin of coordinates, leading to the general equations represented by Eqs. (7) and (8):
where K* and K are the slopes of the respective straight lines. These slopes decrease with increasing TCM concentrations. Table 4 shows Eqs. (7) and (8) with the value of the corresponding parameter K* or K obtained experimentally for each conducted test. A decrease in K was observed as the concentration of the interferent increased.

Figure 2Calibration lines for Analyser I with and without TCM at different concentration levels.
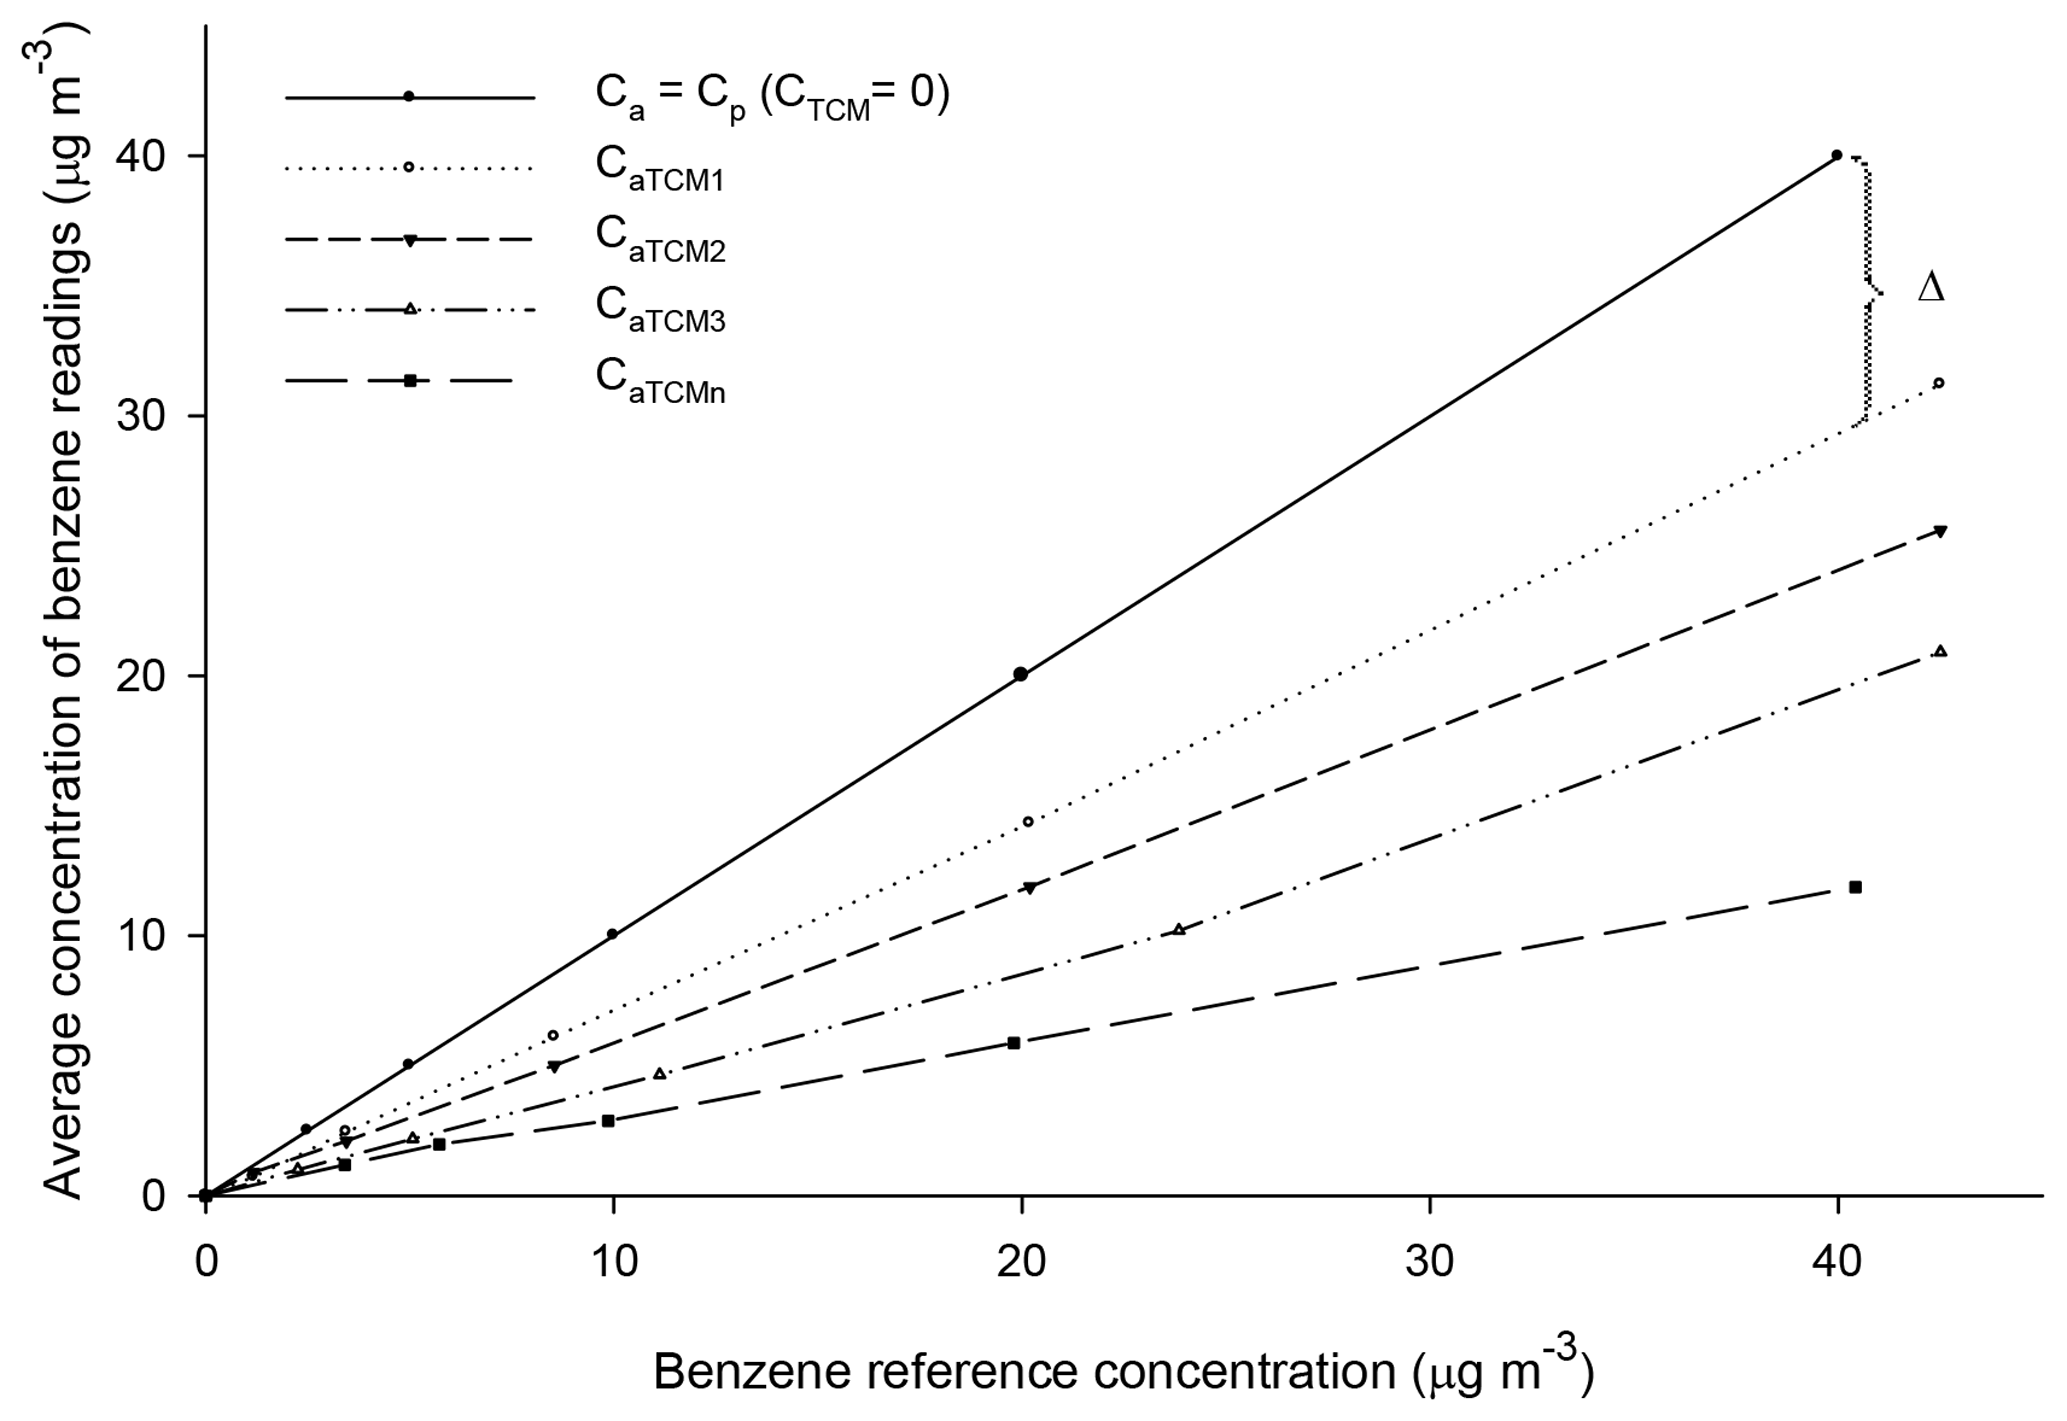
Figure 3A generic representation of benzene readings as a function of the concentration of benzene and TCM in the reference gas mixture.
An analysis of the analytical method was done in order to understand the nature of this interference. For a substance to act as an interfering agent, it must have a retention time in the chromatographic column within the interval of identification of benzene, so that both species reach the detector within this interval. If this applies, the interference causes an increase or decrease in the detector signal. When the chromatograph has a PID, one of the following can occur. (i) If any organic compound other than benzene is ionised by the radiation of the detector lamp, the electric current increases, which leads to an increase in the readings of benzene. For this to happen, the ionisation potential of the interferent must be lower than that associated with the radiation of the lamp. (ii) The interferent causes a decrease in the benzene signal, which can be due to several reasons. One of them is that the radiation of the detector lamp is absorbed to a greater or lesser extent by the interferent, and the remaining energy is insufficient to completely ionise the benzene. This phenomenon is known as a “quenching effect” (Chou, 1999). This is the nature of the interference of humidity in benzene measurements (Romero-Trigueros et al., 2017). The second reason is that the interferent absorbs (blocks) part of the formed ions that participate in the quantification of benzene, leading to a decrease in the detected concentration. This mechanism is known as a quenching effect via electron capture (Senum, 1981). As discussed below, TCM acts in this way.
To explain the behaviour of benzene in the PID, we have proposed the model shown in Fig. 4, which also serves as a basis to determine what happens in the presence of TCM; Fig. 5. When the gasified benzene (n, in molar units) leaves the column, dragged by the carrier gas, it accesses the PID where a fraction, F (≤1), is ionised by the radiation of the lamp, forming nF ionic couples (electrons and benzyl cations). This forms a mixture that produces an electric current when passing through the electrodes of the detector, which is shown as a peak, whose area is proportional to the concentration of benzene in the sample, given that F is practically constant within the range of concentrations tested, as demonstrated by the experimental results. The benzyl ions recover the electrons in the cathode and benzene is reformed, hence the non-destructive nature of the detector.
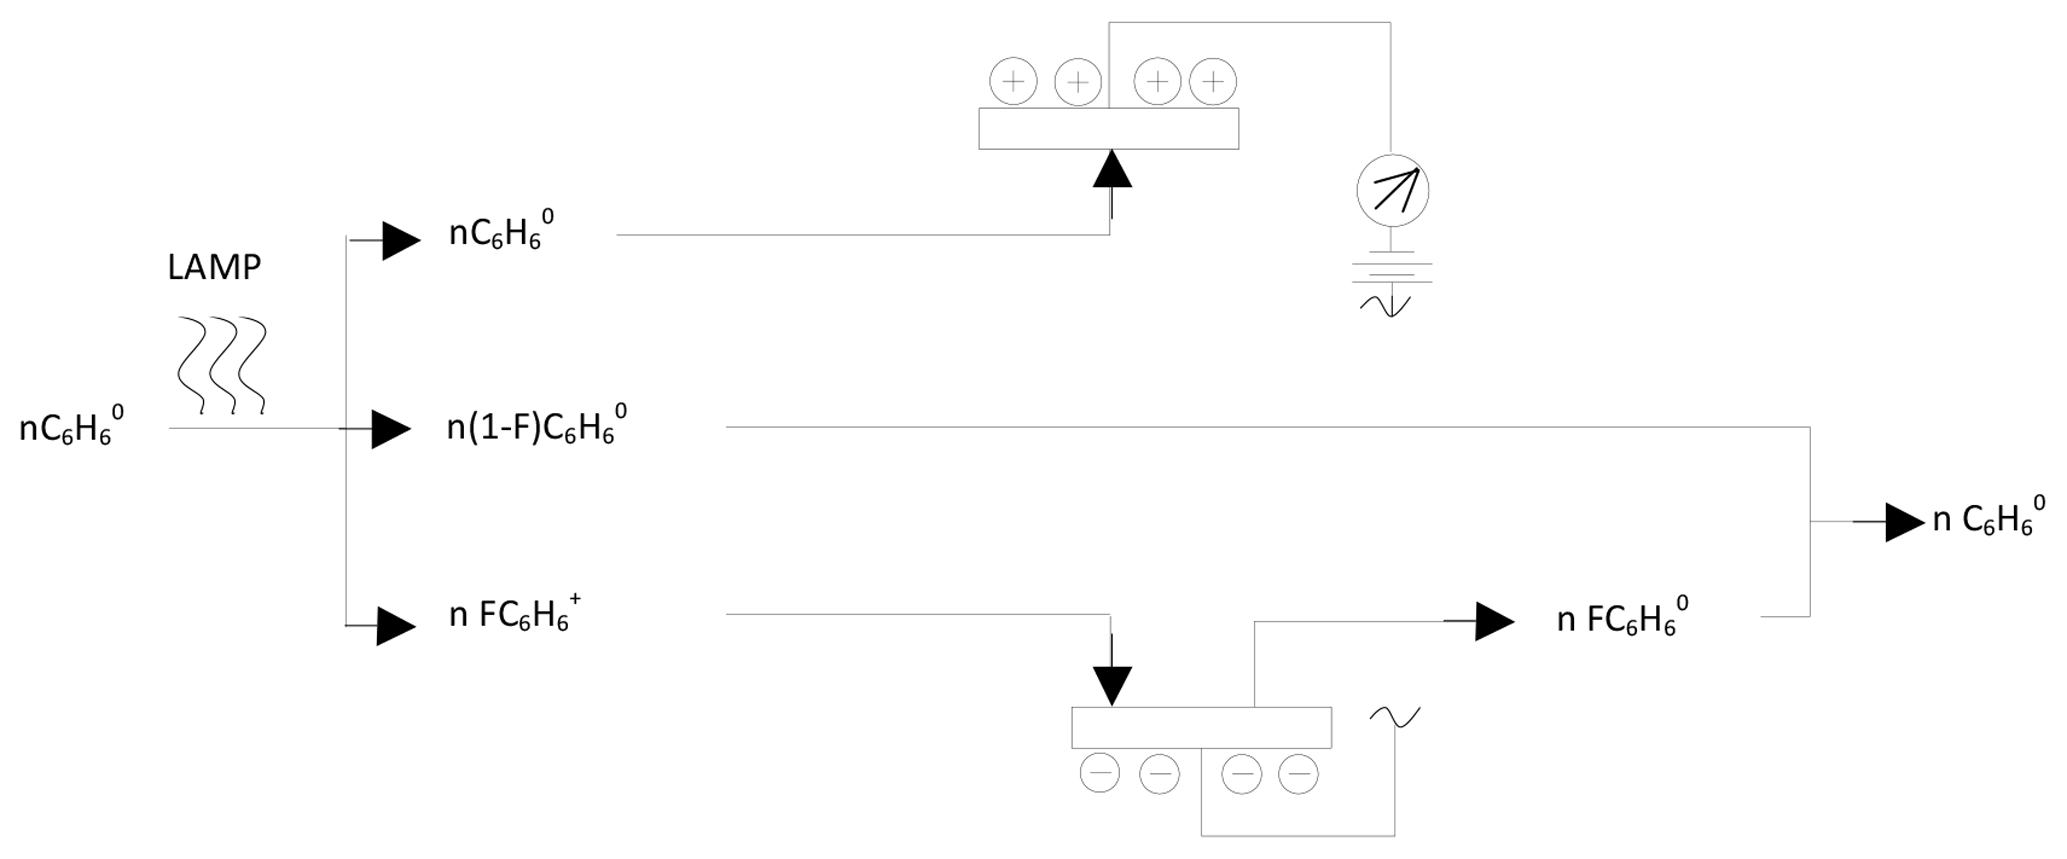
Figure 4Schematic of the behaviour of benzene in the PID of the chromatograph in absence of TCM.
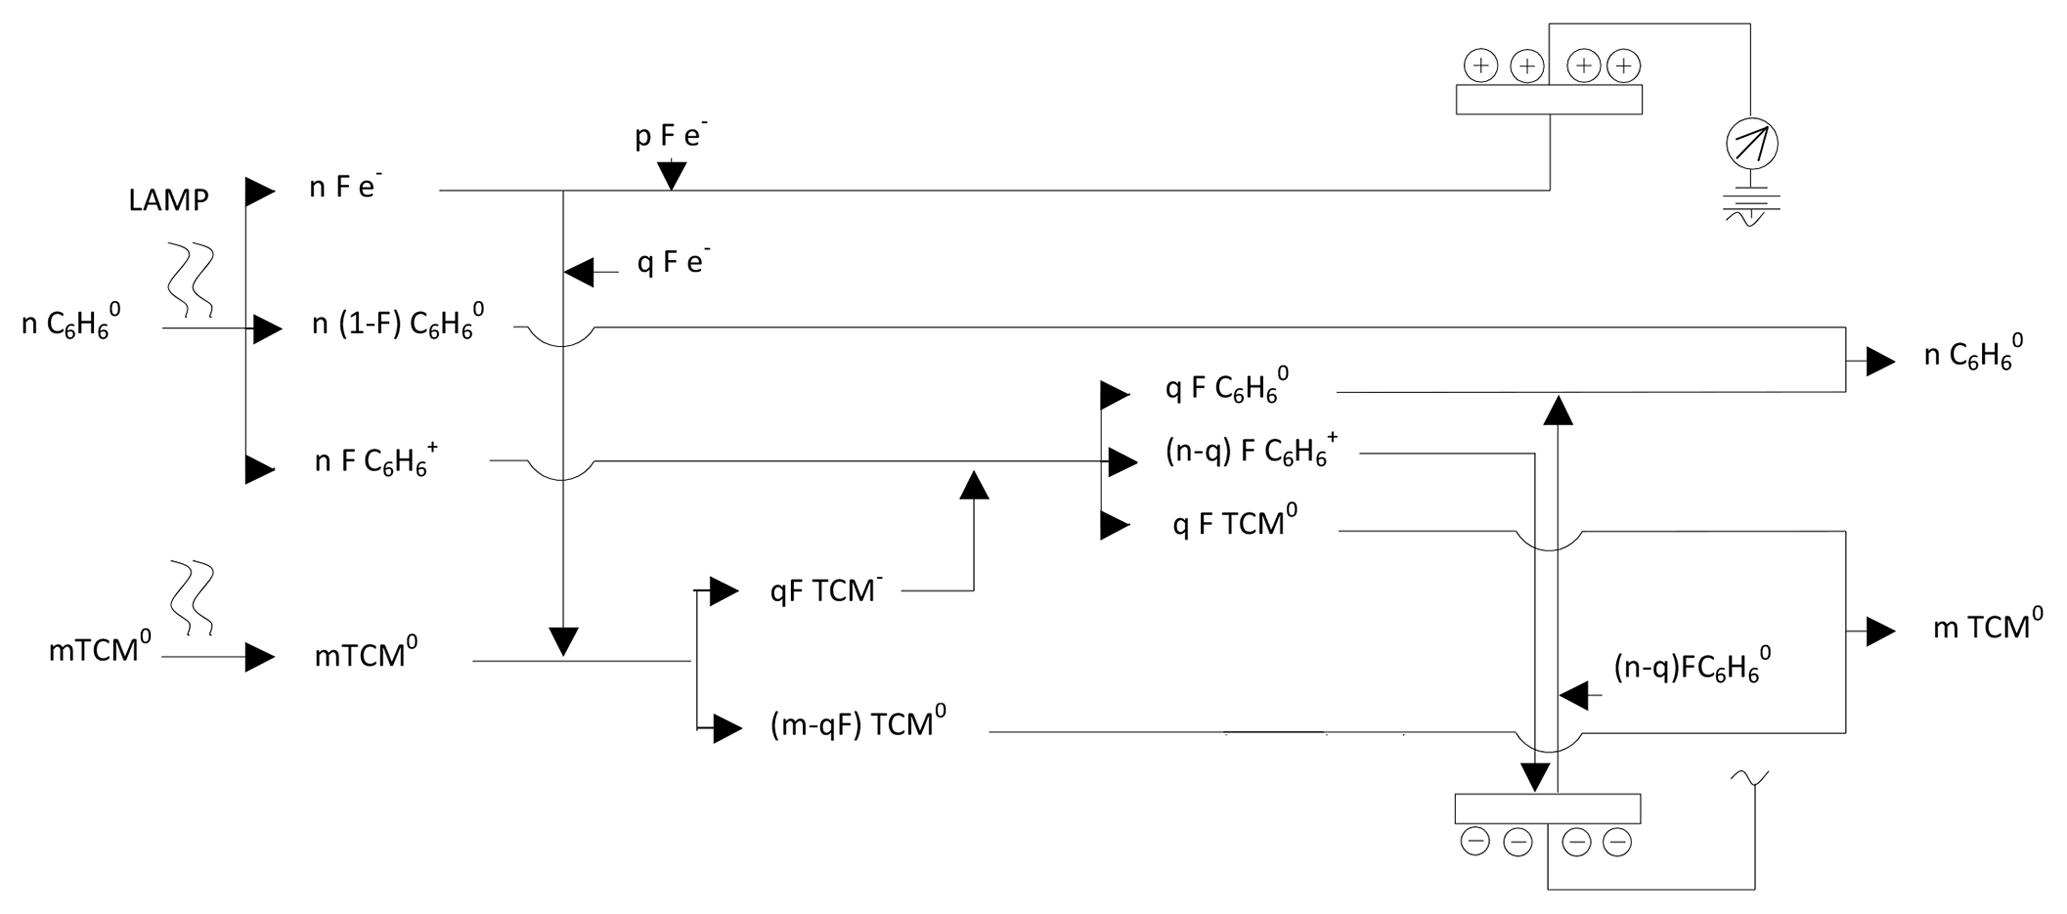
Figure 5Schematic of the behaviour of benzene and TCM when they interact simultaneously in the PID detector.
When an air sample, containing benzene (n moles) and TCM (m moles), accesses the PID, the lamp ionises a fraction F of benzene but does not act on the TCM since its ionisation potential is greater than that provided by the lamp. When the ionic mixture is formed, the mechanisms that take place are complex, given that the electrons formed by the benzene ionisation (nF) are distributed between two competing paths. One part (pF) is directed towards the anode of the detector and the other (qF) is retained by the TCM, given its relatively high electron affinity (2.2 eV) (Chen and Chen, 2004). Thus, the measurement in the detector (pF) depends on the electric fields configured by both systems and the relative amount of benzene (n) and TCM (m). This may cause one of the species to be limiting, which also affects the final distribution. Eventually, the system evolves as shown in Fig. 5, the electric circuit closes and the initial species are regenerated.
According to Fig. 4, the concentration of benzene read by the chromatograph in the absence of TCM (Ca) can be expressed by means of Eq. (9):
where Mb is the molecular mass of benzene, VT is the volume of the air sample and . When benzene and TCM simultaneously coexist, the measurements of benzene (CaTCM) for a given concentration of TCM follow the generic representation in Fig. 5. Equation (10) was deduced from our experiments (Fig. 3).
where Δ is the deviation of CaTCM from Cp.
As can be deduced from Figs. 2 and 3, Δ was proportional to Cp for each CTCM and was also dependent on CTCM. Based on the above, the following function was proposed:
Thus, based on Figs. 2 and 3 and Eqs. (9), (10) and (11), CaTCM can be expressed as follows:
From Eqs. (10) and (11),
Table 4 shows the values of (1−K) for each TCM concentration tested. The best fit (r2=0.988) is represented by Eq. (14):
From Eqs. (10), (12) and (14):
Finally, with Eq. (16), the RE of benzene measurements by GC-PID in the presence of TCM can be estimated for Analyser I:
Thus, for TCM concentrations of 0.7, 1.4 and 4.5 µg m−3 (levels that are currently found in urban areas), biases in benzene readings close to 34 %, 44 % and 70 %, respectively, may occur. These deviations are high and not acceptable if compared to the overall expanded uncertainty allowed in the legislation for benzene measurements (25 %).
As indicated previously, TCM was considered as a possible interfering contaminant to be evaluated according to Standard EN 14662:2005-3, but it was not included in the interferent list in its 2015 version. However, Sect. 8 of the current standard establishes that “some compounds, including carbon tetrachloride or butanol, may be present under site-specific conditions. In such cases, the responsibility for the proper determination of benzene falls on the network that operates the analyser by the appropriate choice of separation conditions (analytical column, temperature program of the column)”. However, technicians that operate air quality networks usually lack the knowledge and tools to choose the optimum conditions for the analysis. On the other hand, a correction of readings would require continuous measurements of TCM in the air and a knowledge of how TCM makes measurements deviate from their real value, which in turn, requires carrying out tests similar to those presented in this paper with dynamic dilution systems in controlled test atmospheres. This measure would not be easy to apply for economic and technical reasons, so the responsibility must not fall only on the network managers. It seems reasonable that the manufacturers of the equipment take actions for solving this problem – or, at least, for reducing the extent of the interference in their measurements – since they have the required technology and equipment. In any case, users of this type of equipment should be aware of the problem to try to minimise it. The discussion of this issue in the appropriate forum (e.g. the European Committee for Standardisation) also seems pivotal to reducing the uncertainty in benzene measurements by GC-PID in the presence of TCM concentrations.
The research described in this article has determined that TCM causes a significant interference in the measurement of benzene by GC-PID. This interference is negative; that is, readings of benzene are below their real ambient values, which may originate in a mismanagement of the air quality of a location with TCM present in its air relating to benzene.
The RE of the concentration of benzene measured as a function of the concentration of TCM (CTCM) has been obtained for Analyser I, and, presumably, other GC-PIDs will have similar expressions. Thus, for CTCM values of 0.7 µg m−3 (typical of urban areas) and 4.5 µg m−3 (in the vicinity of landfills), the REs in benzene measurements would be 34 % and 70 %, respectively, independently of the concentration of benzene. These values are much higher than the overall expanded uncertainty allowed for benzene measurements with automated analysers. Given the importance of this interference, a possible mechanism has been proposed to explain the phenomenon when benzene is measured in the presence and absence of TCM. According to the proposed model, TCM attracts part of the electrons produced in the ionisation of benzene; thus, the electric current measured in the detector is lower than it should be. This interference is different in nature from that produced by other interfering species and, consequently, should be assessed independently of them.
Interestingly enough, it is established in part 3 of the Standard EN 14662:2015 that the managers of the air quality monitoring network are responsible for determining the presence of TCM in the area where benzene is measured. If detected, they must act to eliminate the effect of the interferent. However, this approach would require continuous measurements of TCM in the air and a knowledge of how TCM makes measurements deviate from their real value, which in turn, requires carrying out tests similar to those presented in this paper with dynamic dilution systems in controlled test atmospheres. This may entail economic and technical issues so manufacturers of the chromatographs should try to solve this problem as they have greater technical and scientific capacity than network managers. In any case, all these issues should be discussed in the appropriate forum (e.g. the European Committee for Standardisation) in order to improve the uncertainty of benzene measurements and, thus, the management of air quality.
The data are available upon request to María Esther González (esthergd@um.es).
CRT carried out all the tests reported in this paper and the data process. MDM and EGF designed and developed the dynamic system used to generate the gas mixtures, designed the experimental methodology, and supervised the work. MEG prepared the paper and is the correspondence author.
The authors declare that they have no conflict of interest.
The authors would like to acknowledge the Consejería de Agua,
Agricultura y Medio Ambiente of the Comunidad Autónoma de la Región
de Murcia for its financial support and for the facilities to carry out this
work. Cristina Romero-Trigueros acknowledges the financial support from a postdoctoral training and development fellowship (20363/PD/17) of
Consejería de Empleo, Universidades y Empresa (CARM) by the
Fundación Séneca – Agencia de Ciencia y Tecnología de la
Región de Murcia.
Edited by: Pierre Herckes
Reviewed by: three anonymous referees
Atkinson, R.: Atmospheric chemistry of VOCs and NOx, Atmos. Environ., 34, 2063–2101, https://doi.org/10.1016/S1352-2310(99)00460-4, 2000.
ATSDR: Public Health Statement: Carbon Tetrachloride, available at: https://www.atsdr.cdc.gov/toxprofiles/tp30-c1-b.pdf (last access: 6 February 2019), 2005.
Bahadar, H., Mostafalou, S., and Abdollahi, M.: Current understandings and perspectives on non-cancer health effects of benzene: A global concern, Toxicol. Appl. Pharmacol., 276, 83–94, https://doi.org/10.1016/j.taap.2014.02.012, 2014.
Brosas-Montecastro, D.: Ambient air monitoring of hazardous volatile organic compounds in Seattle, Washinton neighborhoods: Trends and implications, PhD Thesis, Washington State University, USA, 86 pp., 2008.
CEN: EN 14662-1 Ambient air quality, Standard method for measurement of benzene concentrations, Pumped sampling followed by thermal desorption and gas chromatography, 2005a.
CEN: EN 14662-2 Ambient air quality, Standard method for measurement of benzene concentrations, Pumped sampling followed by solvent desorption and gas chromatography, 2005b.
CEN: EN 14662-3 Ambient air, Standard method for the measurement of benzene concentrations, Automated pumped sampling with in situ gas chromatography, 2005c.
CEN: EN 14662-4 Ambient air quality, Standard method for measurement of benzene concentrations, Diffusive sampling followed by thermal desorption and gas chromatography, 2005d.
CEN: EN 14662-5 Ambient air quality, Standard method for measurement of benzene concentrations, Diffusive sampling followed by solvent desorption and gas chromatography, 2005e.
CEN: EN 14662-3 Ambient air, Standard method for the measurement of benzene concentrations, Automated pumped sampling with in situ gas chromatography, 2015.
Chen, E. C. M. and Chen, E. S.: Thermal electron attachment to chloroalkanes and herschbach ionic morse potentials for carbon tetrachloride (CCl4), J. Phys. Chem. A, 108, 5069–5072, https://doi.org/10.1021/jp048976b, 2004.
Chou, J.: Hazardous gas monitors: A practical guide to selection, operation and applications, 1st edn., McGraw-Hill Professional, New York, USA, 1999.
D'Andrea, M. A. and Reddy, G. K.: Adverse Health Effects of Benzene Exposure Among Children Following a Flaring Incident at the British Petroleum Refinery in Texas City, Clin. Pediatr. (Phila)., 55, 219–227, https://doi.org/10.1177/0009922815594358, 2016.
Darrall, K. G., Figgins, J. A., Brown, R. D., and Phillips, G. F.: Determination of benzene and associated volatile compounds in mainstream cigarette smoke, Analyst, 123, 1095–1101, https://doi.org/10.1039/a708664d, 1998.
de Blas, M., Uria-Tellaetxe, I., Gomez, M. C., Navazo, M., Alonso, L., García, J. A., Durana, N., Iza, J., and Ramón, J. D.: Atmospheric carbon tetrachloride in rural background and industry surrounded urban areas in Northern Iberian Peninsula: Mixing ratios, trends, and potential sources, Sci. Total Environ., 562, 26–34, https://doi.org/10.1016/j.scitotenv.2016.03.177, 2016.
European Commission: Directive 2008/50/EC on ambient air quality and cleaner air for Europe, Off. J. Eur. Communities, 152, 1–43, available at: http://eur-lex.europa.eu/LexUriServ/LexUriServ.do?uri=OJ:L:2008:152:0001:0044:EN:PDF (last access: 6 February 2019), 2008.
European Commission: Directive 2009/33/EC – Clean and energy-efficient road transport vehicles, Off. J. Eur. Communities, 120, 5–12, available at: https://eur-lex.europa.eu/legal-content/EN/TXT/PDF/?uri=CELEX:32009L0033&from=EN (last access: 6 February 2019), 2009.
Graziosi, F., Arduini, J., Bonasoni, P., Furlani, F., Giostra, U., Manning, A. J., McCulloch, A., O'Doherty, S., Simmonds, P. G., Reimann, S., Vollmer, M. K., and Maione, M.: Emissions of carbon tetrachloride from Europe, Atmos. Chem. Phys., 16, 12849–12859, https://doi.org/10.5194/acp-16-12849-2016, 2016.
Guenther, A., Hewitt, C. N., Erickson, D., Fall, R., Geron, C., Graedel, T., Harley, P., Klinger, L., Lerdau, M., Mckay, W. A., Pierce, T., Scholes, B., Steinbrecher, R., Tallamraju, R., Taylor, J., and Zimmerman, P.: A global model of natural volatile organic compound emissions, J. Geophys. Res.-Atmos., 100, 8873–8892, https://doi.org/10.1029/94JD02950, 1995.
Hellén, H., Hakola, H., Haaparanta, S., Pietarila, H., and Kauhaniemi, M.: Influence of residential wood combustion on local air quality, Sci. Total Environ., 393, 283–290, https://doi.org/10.1016/j.scitotenv.2008.01.019, 2008.
ISO: ISO 6141 Gas analysis, Contents of certificates for calibration gas mixtures, 2000.
Ko, M. K. W., Newman, P. A., Reimann, S., and Strahan, S. E.: Stratosphere-troposphere processes and their role in climate, SPARC Report on the Lifetimes of Stratospheric Ozone-Depleting Substances, Their Replacements, and Related Species, available at: https://www.sparc-climate.org/fileadmin/customer/6_Publications/SPARC_reports_PDF/6_SPARC_LifetimeReport_Web.pdf (last access: 6 February 2019), 2013.
Locoge, N., Léonardis, T., and Mathé, F.: Analytical characteristics for benzene and VOC automatic measuring system: results from laboratory tests and field campaign, in 1st Workshop-AirMonTech, London, available at: https://www.airmontech.eu/fileadmin/airmontech/user/AAMG_2010-Presentations/1410_-_N_Locoge.pdf (last access: 6 February 2019), 2010.
Misztal, P. K., Hewitt, C. N., Wildt, J., Blande, J. D., Eller, A. S. D., Fares, S., Gentner, D. R., Gilman, J. B., Graus, M., Greenberg, J., Guenther, A. B., Hansel, A., Harley, P., Huang, M., Jardine, K., Karl, T., Kaser, L., Keutsch, F. N., Kiendler-Scharr, A., Kleist, E., Lerner, B. M., Li, T., Mak, J., Nölscher, A. C., Schnitzhofer, R., Sinha, V., Thornton, B., Warneke, C., Wegener, F., Werner, C., Williams, J., Worton, D. R., Yassaa, N., and Goldstein, A. H.: Atmospheric benzenoid emissions from plants rival those from fossil fuels, Sci. Rep., 5, 1–10, https://doi.org/10.1038/srep12064, 2015.
Neves, F. M., Kawano, C. Y., and Said, S.: Effect of benzene compounds from plants on the growth and hyphal morphology in Neurospora crassa, Braz. J. Microbiol., 36, 190–195, https://doi.org/10.1590/S1517-83822005000200016, 2005.
Penny, C., Vuilleumier, S., and Bringel, F.: Microbial degradation of tetrachloromethane: Mechanisms and perspectives for bioremediation, FEMS Microbiol. Ecol., 74, 257–275, https://doi.org/10.1111/j.1574-6941.2010.00935.x, 2010.
Romero-Trigueros, C., Doval Miñarro, M., Duperón, E. G., Marzal, F. J., and Ferradás, E. G.: Study of the effect of sample pressure on in situ BTEX chromatographs, Environ. Monit. Assess., 188, 1–8, https://doi.org/10.1007/s10661-016-5674-8, 2016.
Romero-Trigueros, C., Doval Miñarro, M., González Duperón, E., and González Ferradás, E.: Influence of sample temperature and environmental humidity on measurements of benzene in ambient air by transportable GC-PID, Atmos. Meas. Tech., 10, 4013–4022, https://doi.org/10.5194/amt-10-4013-2017, 2017.
Senum, G. I.: Quenching or enhancement of the response of the photoionization detector, J. Chromatogr. A, 205, 413–418, https://doi.org/10.1016/S0021-9673(00)82668-0, 1981.
Sherry, D., McCulloch, A., Liang, Q., Reimann, S., and Newman, P. A.: Current sources of carbon tetrachloride (CCl4) in our atmosphere, Environ. Res. Lett., 13, 024004, https://doi.org/10.1088/1748-9326/aa9c87, 2018.
Tassi, F., Venturi, S., Cabassi, J., Capecchiacci, F., Nisi, B., and Vaselli, O.: Volatile organic compounds (VOCs) in soil gases from Solfatara crater (Campi Flegrei, southern Italy): Geogenic source(s) vs. biogeochemical processes, Appl. Geochem., 56, 37–49, https://doi.org/10.1016/j.apgeochem.2015.02.005, 2015.
Tisserand, R. and Young, R.: 6 – The respiratory system, in: Essential Oil Safety (Second Edition), edited by: Tisserand, R. and Young, R., Churchill Livingstone, St. Louis, USA, 99–110, 2014.
Valeri, M., Barbara, F., Boone, C., Ceccherini, S., Gai, M., Maucher, G., Raspollini, P., Ridolfi, M., Sgheri, L., Wetzel, G., and Zoppetti, N.: CCl4 distribution derived from MIPAS ESA v7 data: intercomparisons, trend, and lifetime estimation, Atmos. Chem. Phys., 17, 10143–10162, https://doi.org/10.5194/acp-17-10143-2017, 2017.
Volkamer, R., Platt, U., and Wirtz, K.: Primary and Secondary Glyoxal Formation from Aromatics: Experimental Evidence for the Bicycloalkyl-Radical Pathway from Benzene, Toluene, and p-Xylene, J. Phys. Chem. A, 105, 7865–7874, https://doi.org/10.1021/jp010152w, 2001.
von Schneidemesser, E., Monks, P. S., and Plass-Duelmer, C.: Global comparison of VOC and CO observations in urban areas, Atmos. Environ., 44, 5053–5064, https://doi.org/10.1016/j.atmosenv.2010.09.010, 2010.
Wentworth, G. R., Aklilu, Y. A., Landis, M. S., and Hsu, Y. M.: Impacts of a large boreal wildfire on ground level atmospheric concentrations of PAHs, VOCs and ozone, Atmos. Environ., 178, 19–30, https://doi.org/10.1016/j.atmosenv.2018.01.013, 2018.