the Creative Commons Attribution 4.0 License.
the Creative Commons Attribution 4.0 License.
Cavity-enhanced photoacoustic sensor based on a whispering-gallery-mode diode laser
Yufeng Pan
Lei Dong
Hongpeng Wu
Weiguang Ma
Lei Zhang
Wangbao Yin
Liantuan Xiao
Suotang Jia
Frank K. Tittel
A cavity-enhanced photoacoustic (CEPA) sensor was developed based on an ultra-narrow linewidth whispering-gallery-mode (WGM) diode laser. A cavity-enhanced photoacoustic module (CEPAM) was designed to match the output beam from the WGM-diode laser, resulting in an increase in the excitation light power, which, in turn, significantly enhanced the photoacoustic signal amplitude. The results show that a signal gain factor of 166 was achieved, which is in excellent agreement with the power enhancement factor of 175 after considering the power transmissivity. The performance of the sensor was evaluated in terms of the detection sensitivity and linearity. A 1σ detection limit of 0.45 ppmV for C2H2 detection was obtained at atmospheric pressure with a 1 s averaging time.
- Article
(1239 KB) - Full-text XML
-
Supplement
(2306 KB) - BibTeX
- EndNote
Photoacoustic spectroscopy (PAS) is an important trace gas detection technique that is widely applied to atmospheric science, breath analysis and industrial process control (Siciliani et al., 2014; Wojtas et al., 2014; Yin et al., 2017a). In the PAS technique, modulated excitation light is selectively absorbed by a target gas and results in the generation of an acoustic wave by non-radiative energy relaxation processes. One of the unique PAS advantages is that its sensitivity is proportional to excitation laser power, and thus the performance of PAS sensors can be improved by increasing the excitation laser power. When a commercially available telecommunication diode laser is employed as an excitation light source, a commonly used method to increase the laser power is to use an erbium-doped fiber amplifier (EDFA) to boost the output optical power (Chen et al., 2018; He et al., 2018; Peng et al., 2009). For example, in 2015, Wu et al. (2015) demonstrated a quartz-enhanced photoacoustic spectroscopy (QEPAS) based H2S sensor operating at 1582 nm combined with an EDFA (Wu et al., 2015). With a ∼1.4 W optical excitation power and 67 s averaging time, the H2S detection sensitivity was reduced from several ppmV level down to 142 ppbV in N2, which is the best value for the H2S QEPAS sensors reported so far. Yin et al. (2017b) developed a conventional photoacoustic (CPA) sensor operating at the same wavelength for H2S detection in SF6 by means of an EDFA and a background-gas-induced high-Q photoacoustic cell (Yin et al., 2017b). A 1σ detection limit of 109 ppbV was achieved with a 1 s averaging time. An alternative method of achieving high power is to combine PAS with cavity-enhanced absorption spectroscopy (CEAS) (Hippler et al., 2010; Kachanov et al., 2013; Wojtas et al., 2017). In 2015, Patimisco et al. (2015) proposed an intra-cavity QEPAS (I-QEPAS) sensor for CO2 detection at 4.33 µm (Patimisco et al., 2015). A power enhancement factor of ∼240 was achieved with an intracavity power of ∼0.72 W, resulting in a minimum detection limit of 300 pptV at a total gas pressure of 50 mbar with a 20 s integration time.
Cavity-enhanced absorption spectroscopy (CEAS) is based on the use of optical resonant cavities in order to enhance light interaction with a gas species inside the cavity (Gherman and Romanini, 2002; He et al., 2018; Yi et al., 2016). In CEAS setups, a proper locking between the laser wavelength and the cavity resonance mode must be carried out via two approaches: (i) the cavity length is controlled by a piezo transducer (PZT) for the resonance mode to follow laser wavelength; and (ii) the length of the cavity is fixed, and the laser wavelength is locked to the cavity resonance mode. When the locking between the laser wavelength and the fundamental optical mode of the cavity is realized, the power inside the cavity will be enhanced significantly by a power enhancement factor G, and the value of G can be calculated according to Eq. (1):
where F represents the finesse of the optical cavity.
In this manuscript, we developed a cavity-enhanced photoacoustic (CEPA) sensor system for acetylene (C2H2) detection at 1530.98 nm based on an ultra-narrow linewidth WGM-diode laser. A Fabry–Perot (F–P) cavity with a finesse of 550 was designed. The laser wavelength was locked to the F–P cavity mode by a Pound–Drever–Hall (PDH) locking technique (Black, 2000; Drewer et al., 1983) since the WGM-diode laser linewidth is far narrower than that of the cavity mode. A differential photoacoustic cell with two electret condenser cylindrical microphones was designed to detect the photoacoustic signal. To enhance the photoacoustic signal, the photoacoustic cell was inserted between the two cavity mirrors. The performance of the CEPA sensor was compared with a CPA sensor without cavity and evaluated at different C2H2 concentration levels.
2.1 Characterization of ultra-narrow linewidth WGM-diode laser
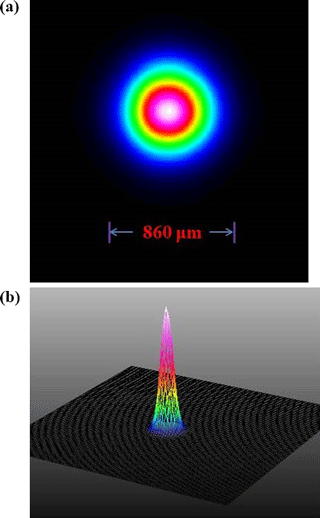
The portable WGM-diode laser (OEwaves, USA, OE4023-153160-PA02-FM100) has an ultra-narrow linewidth of <200 Hz for 10 µs and good tunability in the wavelength range of 1529 to 1532 nm with an output power of 4 mW after stabilizing. The laser frequency can be tuned mode hop-free over 50 GHz at a tuning rate of 1 GHz s−1 by changing the temperature of the laser internal resonator and over 1 GHz at a tuning rate of 40 MHz µs−1 by an external voltage to change the length of an internal piezoelectric crystal. Figure 1 shows the tunable wavelength range of the WGM-diode laser for seven different wavelength bands when the laser temperature was fixed and the internal piezoelectric crystal was changed by an external voltage. Due to the ∼1 GHz limit for each wavelength band, the tunable range cannot link up end-to-end. The laser beam was collimated by a fiber-coupled collimator (OZ Optics, Canada, HPUCO-T.3A-1550-P-2AS). The output beam quality from the collimator was evaluated by a scanning-slit optical beam profiler (THORLABS, USA, BP209-IR2/M). Figure 2a and b show the two-dimensional intensity distribution of the laser spot and the three-dimensional laser beam profile, respectively, at 15.2 cm from the collimator. The laser beam exhibits an excellent Gaussian fundamental mode with a spot size of 860 µm.
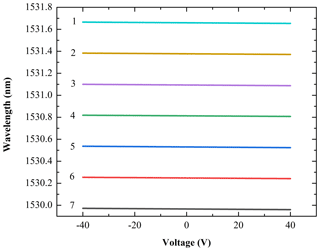
Figure 1Tunable wavelength range of the WGM-diode laser for seven different wavelength bands when the laser temperature was fixed and the internal piezoelectric crystal was changed by an external voltage.
2.2 Design of the cavity-enhanced photoacoustic module
A cavity-enhanced photoacoustic module (CEPAM) consists of a differential photoacoustic cell, a F–P cavity, and a gas chamber with a gas inlet and outlet. The differential photoacoustic cell was designed as shown in Fig. 3a, which resembles the well-known differential Helmholtz resonator (Starecki and Geras, 2014; Zeninari et al., 1999; Zheng et al., 2017). It has two identical 90 mm parallel tube-shaped channels with diameters of 8 mm as two acoustic resonators. Two buffer volumes with lengths of 10 mm and diameters of 20 mm connect to the two channels at both ends, thus making the two channels act as acoustic open–open resonators and create a total optical absorption length of 110 mm. This allows the beam from the WGM-diode laser to pass through the differential photoacoustic cell easily. When the laser intensity is modulated at the resonance frequency of the photoacoustic cell, a standing sound wave generated with the absorption of a target gas has its maximum acoustic pressure in the middle of the acoustic resonator. Hence, two selected electret condenser cylindrical microphones which have the same frequency response sensitivities are installed on the walls in the middle of each resonator to detect the acoustic pressure. The gas flow noise and external acoustic disturbances can be effectively suppressed by using a custom transimpedance differential preamplifier. The signal coming from the microphone located in the acoustic resonator not illuminated by the laser beam is subtracted from the one related to the microphone located in the excited resonator and the resulting signal is subsequently amplified. Therefore, the performance of the PAS cell is improved. The resonance frequency of the differential photoacoustic cell in air was experimentally determined to be f0=1781.0 Hz and the full width at half maximum (FWHM) of the frequency response curves (resonance width) was Δf=40 Hz, corresponding to a quality factor .
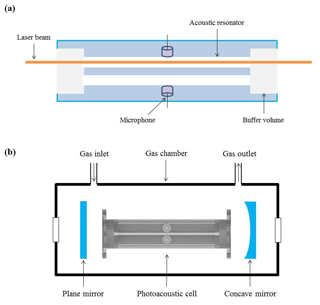
Figure 3(a) Schematic diagram of the differential photoacoustic cell. (b) Schematic diagram of the cavity-enhanced photoacoustic module (CEPAM).
Figure 3b illustrates the schematic of the CEPAM. The F–P cavity consists of a 25.4 mm plane mirror as the incident mirror and a 25.4 mm plane–concave mirror with a 1 m radius of curvature as the exit mirror. The two mirrors were coated with a high reflective coating of 0.995. The cavity length was 160 mm, which was longer than the 110 mm length of the differential photoacoustic cell. The designed differential photoacoustic cell was inserted between the two cavity mirrors as shown in Fig. 3b. A gas chamber made of polymethyl methacrylate with a gas inlet and outlet was fabricated and used to provide environmental stabilization of the cavity.
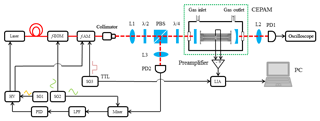
Figure 4Experimental setup of the CEPA sensor system: f-EOM, fiber-coupled electro-optic modulator; f-AM, fiber-coupled amplitude modulator; L1, mode-matching lens; λ∕2, half-wave plate; PBS, polarization beam splitter; λ∕4, quarter-wave plate; L2 and L3, focusing lenses; PD, photodiode detector; SG, function signal generator; LPF, low-pass filter; PID, proportional–integral–derivative controller; HV, high-voltage amplifier; LIA, lock-in amplifier; PC, personal computer.
The experimental setup of the CEPA sensor system is depicted in Fig. 4. A mode-matching lens (L1), a half-wave plate (λ∕2), a polarization beam splitter (PBS) and a quarter-wave plate (λ∕4) were placed in front of the cavity. Two focusing lenses (L2 and L3) were used to focus the transmitted and reflected lights from the cavity onto the photodiode detectors (PD1 and PD2) (THORLABS, USA, PDA10CF-EC), respectively. In order to achieve the mode matching, a ramp signal was generated by the first function signal generator (SG1) (Agilent, USA, Model 33500B) to scan the laser wavelength. The transmitted signal was detected by the PD1 and recorded by an oscilloscope (Tektronix, USA, DPO 2024). The second function signal generator (SG2) (Tektronix, USA, AFG 3102) generated two sine-wave signals with the same frequency (15 MHz) and an adjustable phase difference. One of them was applied to a fiber-coupled electro-optic modulator (f-EOM) (Keyang photonics, China, KY-PM-1550-10-PP-FA) to modulate the laser wavelength. Another was directed to the mixer (Mini-Circuits, USA, ZLW-1) and mixed with the reflected signal that was reflected by the PBS to the PD2. A low-pass filter with an upper cutoff frequency of 1 MHz (Stanford Research Systems, USA, Model SR560) was used after the output of the mixer to acquire a low-frequency signal as an error signal. The error signal was directed to a proportional–integral–derivative (PID) controller (Stanford Research Systems, USA, Model SIM960), which can provide a control signal to adjust the laser wavelength locking it to the cavity mode.
To sweep over a full cavity free-spectral range (FSR) of ∼0.9 GHz, a 10 Hz ramp signal was applied to the WGM-diode laser, as shown in Fig. 5a. The transmitted signal and the error signal were recorded using the oscilloscope as shown in Fig. 5b and c, respectively. Based on the FSR and the linewidth of the cavity (Δν) from Fig. 5b, the finesse F (FSR∕Δν) is 550. Therefore, a power enhancement factor G of 175 is obtained according to Eq. (1), which means that the detection sensitivity of PAS can be improved by 175 times.
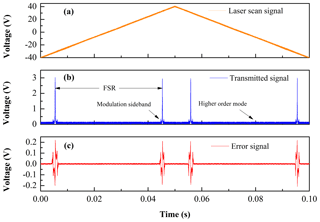
Figure 5(a) Laser scan signal. (b) Transmitted signal from the cavity. (c) Error signal from the low-pass filter following the mixer.
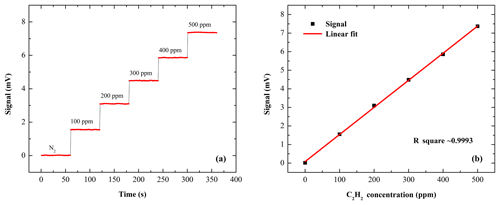
Figure 7(a) CEPA signal at the different C2H2 concentration levels. (b) Linearity of the CEPA sensor system.
To verify the improved performance of the CEPA sensor system based on the WGM-diode laser, a C2H2 absorption line located at 1530.98 nm with an intensity of cm molecule−1 was selected as a target line. The wavelength of the WGM-diode laser was tuned to the target line by means of a wavelength meter (HighFinesse, Germany, WS-6). The laser wavelength was locked to the cavity mode. In order to generate a photoacoustic signal, a fiber-coupled amplitude modulator (f-AM) (Photline Technologies, France, MX-LN-10) with a DC bias generated by a high-voltage amplifier (Piezomechanik GmbH, Germany, SVR 200-3) and a square wave of 50 % duty cycle generated by the SG3 (Tektronix, USA, AFG 3102), was employed to modulate the laser intensity before the laser beam entered the collimator. The f-AM can provide a DC extinction ratio of 20 dB, which can meet the requirement of the intensity modulation. The frequency of the square wave was 1781.0 Hz, corresponding to the resonance frequency of the differential photoacoustic cell. The loss of the f-EOM and the f-AM results in a final incident power of 0.7 mW in front of the F–P cavity. The photoacoustic signal from the differential preamplifier was fed into a lock-in amplifier (LIA) (Stanford Research Systems, USA, Model SR830), which demodulated the signal in the 1-f mode. The reference signal for the LIA was from the TTL signal output of SG3. A 12 dB/oct filter slope and a 1 s time constant were set for the LIA, corresponding to a detection bandwidth of Δf=0.25 Hz. The demodulated signal from the LIA was recorded by a personal computer and the data were processed with a LabVIEW software program. A certified 500 ppmV C2H2 gas cylinder was used. The different concentrations of C2H2∕N2 gas mixtures were produced by a gas dilution system (Environics Inc., USA, Model EN4040).
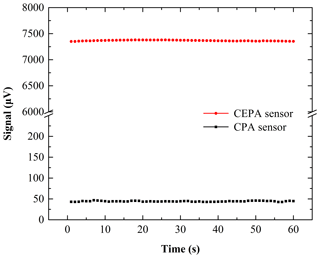
The CEPAM was first filled with 500 ppmV C2H2. The measurements were carried out at atmospheric pressure and room temperature. The signal amplitudes from the CEPA sensor system are shown in Fig. 6. As a comparison, the signal amplitudes from a CPA sensor without the F–P cavity are also shown in Fig. 6. The CEPA sensor effectively enhanced the signal amplitude from 44.3 to 7366.8 µV, corresponding to a signal gain factor of 166. Considering the ratio of the powers of incident and transmitted lights is ∼95 % for the F–P cavity, the power enhancement factor verified by PAS is 175, which is in excellent agreement with the anticipated value.
In order to evaluate the performance of the CEPA sensor system in terms of minimum detection limit and linearity, pure N2 and five different concentration levels of the C2H2∕N2 gas mixtures varying from 100 to 500 ppmV were fed into the CEPAM. The sensor system was operated at atmospheric pressure and at room temperature. Sixty data points of the CEPA signal were recorded continuously with a 1 s averaging time at each concentration level as shown in Fig. 7a. With pure N2, the 1σ noise level was found to be 6.6 µV. The scatter of consecutive measurements at a certain concentration level did not depend on the concentration and was in agreement with pure N2. For a 500 ppmV C2H2∕N2 gas mixture, a signal amplitude of 7366.8 µV was observed, and hence a signal-to-noise ratio (SNR) of 1110 can be achieved which corresponds to a minimum detection limit (1σ) of 0.45 ppmV. The plot in Fig. 7b is a representation of the same measurements after 60 sensor readings of each concentration step are averaged. This plot confirms the linearity of the sensor response to a concentration with a R2 value of >0.9993.
In 2017, Ma et al. (2017) used QEPAS technique to detect C2H2 and obtain a detection sensitivity of 33.2 ppb (Ma et al., 2017), which is 13 times better than this CEPA sensor. The possible reasons are the following. (1) The CEPA sensor employed the acetylene absorption line located at 6531.76 cm−1, which was different from the Yufei Ma line at 6534.37 cm−1. The line strength of 6531.76 cm−1 is ∼3 times lower than that of 6534.37 cm−1. (2) The cavity mode was not moved to the top of the absorption line. In this way, the C2H2 spectral wing was detected, which resulted in a sensitivity loss of ∼3 times. (3) The effective optical power in the optical cavity was 116 mW. But Ma et al. (2017) used an EDFA to boost the laser power to 1500 mW. In fact, the signal enhancement achieved from the cavity is more important in this research. A comparative detection limit can be expected after selecting the same absorption line and setting the cavity mode to the top of the absorption line.
The CEPA technique is very different from the CPA technique. It is true that the use of an optical cavity makes the sensor system more complicated. However, the CEPA technique has the potential to further improve the detect limit if a higher finesse cavity is employed since the detection sensitivity is proportional to the excitation optical power.
A CEPA sensor system based on a WGM-diode laser was demonstrated. The WGM-diode laser has an ultra-narrow linewidth and was used as the excitation source. A cavity-enhanced photoacoustic module was designed to enhance the laser power density inside the optical cavity and the photoacoustic cell, resulting in a signal gain factor of 166, when the laser wavelength was locked on the fundamental optical mode of the F–P cavity by a PDH-locking technique. The combination of the cavity-enhanced absorption spectroscopy and photoacoustic spectroscopy can improve the excitation light power effectively, leading to a significant gain of the photoacoustic signal amplitude. The use of the fiber-coupled elements and the WGM-diode laser have the potential to develop a compact CEPA sensor system with a higher detection sensitivity with respect to the CPA sensor system. A further improvement of the CEPA sensor system can be achieved by using a higher finesse cavity or a higher power laser source.
The supplement related to this article is available online at: https://doi.org/10.5194/amt-12-1905-2019-supplement.
Data used for this study can be found in the Supplement.
YP and LD contributed the central idea, analyzed the data, and wrote the initial draft of the paper. HW developed the idea of the study. The remaining authors contributed to refining the ideas, carrying out additional analyses and finalizing this paper.
The authors declare that they have no conflict of interest.
This article is part of the special issue “Advances in cavity-based techniques for measurements of atmospheric aerosol and trace gases”. It is not associated with a conference.
Lei Dong acknowledges support by the National Key R&D Program of China (2017YFA0304203), the National Natural Science Foundation of China (NSFC) (61622503, 61575113, 61805132, 11434007), the Changjiang Scholars and Innovative Research Team in University of Ministry of Education of China (IRT_17R70), the 111 project (D18001), the Outstanding Innovative Teams of Higher Learning Institutions of Shanxi, the Foundation for Selected Young Scientists Studying Abroad, Sanjin Scholar (2017QNSJXZ-04) and Shanxi “1331KSC”. Frank K. Tittel acknowledges support by the US National Science Foundation (NSF) ERC MIRTHE award and the Robert Welch Foundation (grant no. C0568).
This paper was edited by Weidong Chen and reviewed by two anonymous referees.
Black, E. D.: An introduction to pound–drever–hall laser frequency stabilization, Am. J. Phys., 69, 79–87, 2000.
Chen, K., Gong, Z., and Yu, Q.: Fiber-amplifier-enhanced resonant photoacoustic sensor for sub-ppb level acetylene detection, Sensor. Actuat. A Phys., 274, 184–188, 2018.
Drewer, R. W. P., Hall, J. L., Kowalski, F. V., Hough, J., Ford, F. M., Munley, A. J., and Ward, H.: Laser phase and frequency stabilization using an optical resonator, Appl. Phys. B, 31, 97–105, 1983.
Gherman, T. and Romanini, D.: Mode-locked cavity- enhanced absorption spectroscopy, Opt. Express, 10, 1033–1042, 2002.
He, Q., Zheng, C., Lou, M., Ye, W., Wang, Y., and Tittel, F. K.: Dual-feedback mid-infrared cavity-enhanced absorption spectroscopy for H2CO detection using a radio-frequency electrically-modulated interband cascade laser, Opt. Express, 26, 15436–15444, 2018.
He, Y., Ma, Y., Tong, Y., Yu, X., and Tittel, F. K.: HCN ppt-level detection based on a QEPAS sensor with amplified laser and a miniaturized 3D-printed photoacoustic detection channel, Opt. Express, 26, 9666–9675, 2018.
Hippler, M., Mohr, C., Keen, K. A., and Mcnaghten, E. D.: Cavity-enhanced resonant photoacoustic spectroscopy with optical feedback cw diode lasers: a novel technique for ultratrace gas analysis and high-resolution spectroscopy, J. Chem. Phys., 133, 044308, https://doi.org/10.1063/1.3461061, 2010.
Kachanov, A., Koulikov, S., and Tittel, F. K.: Cavity-enhanced optical feedback-assisted photo-acoustic spectroscopy with a 10.4 µm external cavity quantum cascade laser, Appl. Phys. B, 110, 47–56, 2013.
Ma, Y., He, Y., Zhang, L., Yu, X., Zhang, J., Sun, R., and Tittel, F. K.: Ultra-high sensitive acetylene detection using quartz-enhanced photoacoustic spectroscopy with a fiber amplified diode laser and a 30.72 kHz quartz tuning fork, Appl. Phys. Lett., 110, 031107, https://doi.org/10.1063/1.4974483, 2017.
Patimisco, P., Borri, S., Galli, I., Mazzotti, D., Giusfredi, G., Akikusa, N., Yamanishi, M., Scamarcio, G., Natale, P. D., and Spagnolo, V.: High finesse optical cavity coupled with a quartz-enhanced photoacoustic spectroscopic sensor, Analyst, 140, 736–743, 2015.
Peng, Y., Zhang, W., Li, L., and Yu, Q.: Tunable fiber laser and fiber amplifier based photoacoustic spectrometer for trace gas detection, Spectrochim Acta. A, 74, 924–927, 2009.
Siciliani, D. C. M., Viciani, S., Borri, S., Patimisco, P., Sampaolo, A., Scamarcio, G., Natale, P. D., D'Amato, F., and Spagnolo, V.: Widely-tunable mid-infrared fiber-coupled quartz-enhanced photoacoustic sensor for environmental monitoring, Opt. Express, 22, 28222–28231, 2014.
Starecki, T. and Geras, A.: Differential open photoacoustic helmholtz cell, Int. J. Thermophys., 35, 2259–2268, 2014.
Wojtas, J., Tittel, F. K., Stacewicz, T., Bielecki, Z., Lewicki, R., Mikolajczyk, J., Nowakowski, M., Szabra, D., Stefanski, P., and Tarka, J.: Cavity-Enhanced Absorption Spectroscopy and Photoacoustic Spectroscopy for Human Breath Analysis, Int. J. Thermophys., 35, 2215–2225, 2014.
Wojtas, J., Gluszek, A., Hudzikowski, A., and Tittel, F. K.: Mid-Infrared Trace Gas Sensor Technology Based on Intracavity Quartz-Enhanced Photoacoustic Spectroscopy, Sensors, 17, 513/1–513/9, 2017.
Wu, H., Dong, L., Zheng, H., Liu, X., Yin, X., Ma, W., Zhang, L., Yin, W., Jia, S., and Tittel, F. K.: Enhanced near-infrared QEPAS sensor for sub-ppm level H2S detection by means of a fiber amplified 1582 nm DFB laser, Sensor. Actuat. B, 221, 666–672, 2015.
Yi, H., Wu, T., Wang, G., Zhao, W., Fertein, E., Coeur, C., Gao, X., Zhang, W., and Chen, W.: Sensing atmospheric reactive species using light emitting diode by incoherent broadband cavity enhanced absorption spectroscopy, Opt. Express, 24, A781–A790, 2016.
Yin, X., Dong, L., Wu, H., Ma, W., Zhang, L., Yin, W., Xiao, L., Jia, S., and Tittel, F. K.: Highly sensitive SO2 photoacoustic sensor for SF6 decomposition detection using a compact mW-level diode-pumped solid-state laser emitting at 303 nm, Opt. Express, 25, 32581–32590, 2017a.
Yin, X., Dong, L., Wu, H., Ma, W., Zhang, L., Yin, W., Xiao, L., Jia, S., and Tittel, F. K.: Ppb-level H2S detection for SF6 decomposition based on a fiber-amplified telecommunication diode laser and a background-gas-induced high-Q photoacoustic cell, Appl. Phys. Lett., 111, 031109, https://doi.org/10.1063/1.4987008, 2017b.
Zeninari, V., Kapitanov, V. A., Courtois, D., and Ponomarev, Y. N.: Design and characteristics of a differential helmholtz resonant photoacoustic cell for infrared gas detection, Infrared Physics and Technology, 40, 1–23, 1999.
Zheng, H., Lou, M., Dong, L., Wu, H., Ye, W., Yin, X., Kim, C. S., Kim, M., Bewley, W. W., Merritt, C. D., Canedy, C. L., Warren, M. V., Vurgaftman, I., Meyer, J. R., and Tittel, F. K.: Compact photoacoustic module for methane detection incorporating interband cascade light emitting device, Opt. Express, 25, 16761–16770, 2017.


