the Creative Commons Attribution 4.0 License.
the Creative Commons Attribution 4.0 License.
 | 26 Mar 2019
Radiometric calibration of a non-imaging airborne spectrometer to measure the Greenland ice sheet surface
Christopher J. Crawford
Jeannette van den Bosch
Kelly M. Brunt
Milton G. Hom
John W. Cooper
David J. Harding
James J. Butler
Philip W. Dabney
Thomas A. Neumann
Craig S. Cleckner
Thorsten Markus
Methods to radiometrically calibrate a non-imaging airborne visible-to-shortwave infrared (VSWIR) spectrometer to measure the Greenland ice sheet surface are presented. Airborne VSWIR measurement performance for bright Greenland ice and dark bare rock/soil targets is compared against the MODerate resolution atmospheric TRANsmission (MODTRAN®) radiative transfer code (version 6.0), and a coincident Landsat 8 Operational Land Imager (OLI) acquisition on 29 July 2015 during an in-flight radiometric calibration experiment. Airborne remote sensing flights were carried out in northwestern Greenland in preparation for the Ice, Cloud, and land Elevation Satellite 2 (ICESat-2) laser altimeter mission. A total of nine science flights were conducted over the Greenland ice sheet, sea ice, and open-ocean water. The campaign's primary purpose was to correlate green laser pulse penetration into snow and ice with spectroscopic-derived surface properties. An experimental airborne instrument configuration that included a nadir-viewing (looking downward at the surface) non-imaging Analytical Spectral Devices (ASD) Inc. spectrometer that measured upwelling VSWIR (0.35 to 2.5 µm) spectral radiance () in the two-color Slope Imaging Multi-polarization Photon-Counting Lidar's (SIMPL) ground instantaneous field of view, and a zenith-viewing (looking upward at the sky) ASD spectrometer that measured VSWIR spectral irradiance (W m−2 nm−1) was flown. National Institute of Standards and Technology (NIST) traceable radiometric calibration procedures for laboratory, in-flight, and field environments are described in detail to achieve a targeted VSWIR measurement requirement of within 5 % to support calibration/validation efforts and remote sensing algorithm development. Our MODTRAN predictions for the 29 July flight line over dark and bright targets indicate that the airborne nadir-viewing spectrometer spectral radiance measurement uncertainty was between 0.6 % and 4.7 % for VSWIR wavelengths (0.4 to 2.0 µm) with atmospheric transmittance greater than 80 %. MODTRAN predictions for Landsat 8 OLI relative spectral response functions suggest that OLI is measuring 6 % to 16 % more top-of-atmosphere (TOA) spectral radiance from the Greenland ice sheet surface than was predicted using apparent reflectance spectra from the nadir-viewing spectrometer. While more investigation is required to convert airborne VSWIR spectral radiance into atmospherically corrected airborne surface reflectance, it is expected that airborne science flight data products will contribute to spectroscopic determination of Greenland ice sheet surface optical properties to improve understanding of their potential influence on ICESat-2 measurements.
- Article
(6970 KB) - Full-text XML
- BibTeX
- EndNote


Calibrated spectral radiance measurements from multispectral and imaging spectrometer instruments are a baseline requirement for producing geophysical data products that can be used to study Earth's land, ice, water, and atmospheric environments (Green, 1998; Green et al., 2006; King et al., 1996; Schaepman-Strub et al., 2006; Thome, 2001; Vane et al., 1993). Optical instrument calibration is based on a traceable radiance standard determined by the National Institute of Standards and Technology (NIST) in the United States, for example, where radiance measurements are collected from a stable illumination source in a controlled laboratory environment (Chrien et al., 1990; Schaepman and Dangel, 2000; Strobl et al., 1997; Tansock et al., 2015; Parr and Datla, 2001). Using this stable NIST-traceable source, periodic assessments of an optical instrument's response are made to monitor its long-term repeatability, mechanical functionality, and responsivity to variable light intensities. While radiometric calibration is fundamental to spectral instrument data acquisition, this is especially critical for missions bound for deployments in polar regions because the range of measured snow, ice, and liquid water surfaces spans the entire solar spectrum dynamic range. For airborne missions, precise and accurate pre-flight, in-flight, and post-flight calibration procedures are therefore of paramount importance to achieve targeted instrument stability and measurement requirements. Commitment to characterize instrumentation, instrument foreoptics, and supporting aircraft hardware during pre- and post-airborne mission timelines helps to produce remote sensing measurements in which uncertainty has been quantified and fully calibrated data products are available to support algorithm development and remote sensing science applications.
In this paper, we describe NIST-traceable laboratory, in-flight, and field radiometric calibration procedures necessary to obtain science-quality measurements from a visible-to-shortwave infrared (VSWIR) non-imaging airborne spectrometer. We used the MODerate resolution atmospheric TRANsmission (MODTRAN®) code version 6.0 (Berk et al., 2005) to assess the measurement performance of the airborne nadir-viewing spectrometer over bright Greenland ice and dark bare rock/soil targets during a 29 July 2015 in-flight radiometric calibration experiment. Prior to this Greenland campaign, MODTRAN's capability, usefulness, and performance with regard to Arctic and Greenland ice sheet airborne remote sensing science remained largely unrealized. Thus, application of MODTRAN radiative transfer in this paper to evaluate VSWIR remote sensing measurement performance is both forward thinking and advances atmospheric measurements and modeling for the Arctic region in particular. Two non-imaging airborne spectrometers were flown as a part of the Slope Imaging Multi-polarization Photon-Counting Lidar (SIMPL)/Advanced Visible Infrared Imaging Spectrometer-Next Generation (AVIRIS-NG) 2015 airborne campaign to northwest Greenland in July and August 2015 (Brunt et al., 2015). The nadir-viewing spectrometer's objective was to acquire non-imaging profile measurements of snow, ice, and liquid water radiance, and the zenith-viewing spectrometer's objective was to characterize sky conditions during nine science flights. Non-imaging profile measurements are defined as along-track radiance spectra of the surface directly below the aircraft within the airborne spectrometer's instantaneous field of view (IFOV). The campaign was conducted in support of the Ice, Cloud, and land Elevation Satellite 2 (ICESat-2) mission launched on 15 September 2018. ICESat-2, a follow-on laser altimeter mission to ICESat (Schutz et al., 2005; Zwally, 2002), will continue measurements of ice sheet elevation and change, sea ice thickness, ocean surface height, land topography, vegetation height and structure, and atmospheric clouds and aerosols. The Geoscience Laser Altimeter System (GLAS) (Abshire et al., 2005) on the ICESat mission used a traditional single-beam, near-infrared (NIR) (1064 nm), analog waveform method for the surface altimetry measurements. The Advanced Topographic Laser Altimeter System (ATLAS) (Abdalati and Zwally, 2010; Markus et al., 2017) on ICESat-2 will use a more efficient measurement producing multiple beams using a green (532 nm) micropulse, photon-counting approach.
In order to prepare for the ICESat-2 mission, the Greenland campaign was conducted to better understand how ATLAS will represent the height, roughness, and topography of snow and ice surfaces to determine the spatial extent, and potentially the depth, of meltwater on the ice sheet and sea ice surface. Four instruments were flown, two of which included non-imaging airborne spectrometers. While the dual non-imaging airborne spectrometer integration was considered experimental to the Greenland campaign's overall mission objective, this calibrated instrument configuration did provide a low-cost airborne payload because of its size, weight, and power to support ICESat-2's efforts to characterize green laser pulse penetration into snow and ice based on the known reliability to retrieve information on surface contaminants, grain size, and liquid water from VSWIR spectra. Furthermore, the radiometric calibration and traceability of VSWIR measurements acquired by the nadir-viewing spectrometer during airborne remote sensing flights reflect a unique contribution to Arctic and Greenland ice sheet remote sensing science by establishing standard calibration/validation practices for future airborne polar region campaigns.
The non-imaging airborne spectrometers and SIMPL (Dabney et al., 2010; Harding et al., 2011) were flown together on a National Aeronautics and Space Administration (NASA) Langley Research Center King Air (hereinafter UC-12B). SIMPL uses a micropulse, photon-counting, multi-beam measurement like that of ATLAS but provides added information about light scattering by using co-aligned green and NIR laser pulses and a measure of pulse depolarization. AVIRIS-NG (Hamlin et al., 2010) was flown on a King Air (C-12) operated by Dynamic Aviation. Snow radiative transfer modeling (Aoki et al., 2000; Bohren and Barkstrom, 1974; Libois et al., 2013, 2014; Painter and Dozier, 2004a; Picard et al., 2009; Warren, 1982; Wiscombe and Warren, 1980; Kokhanovsky and Zege, 2004) and VSWIR spectroscopy studies have shown that optical snow surface reflectivity is most sensitive to concentrations of light-absorbing particles (e.g., dust, soot, and black carbon containments) at visible wavelengths (Aoki et al., 2000; Dozier et al., 2009; Painter et al., 2007, 2009, 2013; Warren, 2013; Warren and Wiscombe, 1980), whereas effective snow surface grain size is a measure of melt state, which can be quantified by exploiting the position, depth and shape of spectral absorption by liquid water within near-infrared wavelengths (Clark and Roush, 1984; Dang et al., 2016; Dozier and Painter, 2004; Gardner and Sharp, 2010; Green et al., 2006; Libois et al., 2013, 2014; Nolin and Dozier, 2000; Painter et al., 1998, 2009; Warren et al., 2006; Wiscombe and Warren, 1980).
Because the ATLAS green laser pulses may penetrate into snow and ice, to a significant depth to cause surface height measurements to be biased low, the primary objective of the SIMPL/AVIRIS-NG 2015 Greenland campaign was to obtain the necessary remote sensing measurements to enable the ICESat-2 project to determine if green light depth of penetration, measured by SIMPL, is correlated with surface grain size, contaminant, and/or wetness properties determined using VSWIR spectra. A comparison of green laser pulse shape broadening caused by volume scattering in snow, ice, and liquid water, as compared to NIR pulses that only undergo surface scattering, provides the measurement of penetration depth. If that depth is correlated with any particular surface property, changes in those properties seasonally and/or interannually could potentially cause bias in rates of ice sheet elevation change from ICESat-2 retrievals. The nadir-viewing spectrometer optical head was mounted inside SIMPL and their IFOVs were aligned to ensure the spectroscopic and altimetry profile measurements were coincident, observing the same surface location at the same time through the same atmospheric column. AVIRIS-NG followed the SIMPL flight path at a higher altitude and trailing by about 15 min. Flying with AVIRIS-NG was important because its estimations of grain size, contaminant concentrations, and wetness are relatively mature and by imaging a swath, it provides information about the spatial variability of these surface properties.
The non-imaging airborne spectrometer integration on the UC-12B included a nadir-viewing spectrometer measuring upwelling spectral radiance (W m−2 sr−1 nm−1, where sr is the FOV full angle), and a zenith-viewing spectrometer measuring downwelling spectral irradiance (W m−2 nm−1). We predicted spectral radiance for the nadir-viewing spectrometer over bright Greenland ice and dark bare rock/soil targets using MODTRAN to determine whether airborne measurement performance was within the targeted 5 % requirement. MODTRAN inputs included a sub-Arctic summer (geographical–seasonal) model, Navy maritime aerosol profile, top-of-atmosphere (TOA) solar irradiance spectrum, CIMEL Sun photometer atmospheric measurements of aerosol optical depth and columnar water vapor as part of the AErosol RObotic Network (AERONET) (Holben et al., 1998), nadir-viewing spectrometer spectral response functions, and line-of-sight (LOS) geometries. For the MODTRAN-predicted measurement comparison, we selected flight segments from the 29 July in-flight radiometric calibration experiment that was intended to optimize the nadir-viewing spectrometer's visible–near-infrared (VNIR) integration time and shortwave infrared (SWIR) gains across the full solar spectrum dynamic range. Along the northern portion of the UC-12B 29 July flight line over the Greenland ice sheet interior, the Landsat 8 Operational Land Imager (OLI) acquired a coincident multispectral image.
We exploited this Landsat 8 OLI image acquisition by predicting TOA spectral radiance for OLI using identical MODTRAN parameterization as constructed for the nadir-viewing spectrometer. Because Landsat is a well-regarded standard for optical satellite remote sensing calibration/validation (Markham and Helder, 2012), we felt it was important to evaluate the nadir-viewing spectrometer's bright Greenland ice measurement performance along with Landsat 8 OLI as an additional comparison step. Landsat's capabilities to measure polar regions since the launch of Landsat 8 in February 2013 have been unprecedented because of onboard instrument performance and changes to its long-term acquisition plan that include imaging of all sunlit land and nearshore coastal regions greater than 5∘ solar elevation. Imaging higher latitudes and polar ice sheets in solar-reflected wavelengths is complicated by low solar illumination angles, surface bidirectional reflectance distribution function (BRDF) effects (Aoki et al., 2000; Hudson et al., 2006), and persistent cloudiness with cloud shadows cast on the ice sheet (Choi and Bindschadler, 2004; Hudson and Warren, 2007). Yet, because Landsat's orbital tracks converge at the poles, swath imaging side lap results in much higher temporal imaging frequency than tropical and middle latitude regions. Up until this Greenland campaign, Landsat 8 OLI's capability to measure Greenland ice sheet upwelling radiance had not been fully assessed, because for the first time in the Landsat mission's measurement history, Landsat 8 OLI does not saturate over homogenous bright targets at high latitudes due to substantially improved radiometry over prior instruments. Therefore, an important outcome of this paper is our ability to establish Landsat 8 OLI's radiometric performance over Greenland by comparing to MODTRAN-predicted upwelling radiance using the nadir-viewing airborne spectrometer's ice sheet apparent reflectance as the reference spectra.
The specific objectives of this paper are to (1) describe the non-imaging airborne spectrometer integration and NIST-traceable radiometric calibration procedures for pre-flight, in-flight, and post-flight time frames; (2) describe the equations necessary to calculate the nadir-viewing spectrometer ground IFOV footprint; (3) characterize downwelling spectral irradiance measurements to screen for cloud-contaminated data to support atmospheric compensation modeling for clear-sky observational conditions; and (4) compare the nadir-viewing spectrometer's measurement performance over bright Greenland ice and dark bare rock/soil targets against MODTRAN and a coincident Landsat 8 OLI image acquisition.
2.1 VSWIR spectrometer description
The non-imaging spectrometers belong to the Earth Sciences Division (Code 610) at NASA's Goddard Space Flight Center (GSFC). The nadir-viewing spectrometer is a full-range ASD FieldSpec Pro instrument maintained by the Code 618 Optics Laboratory. The zenith-viewing spectrometer is a full-range ASD FieldSpec 3 instrument maintained by the Code 618 Radiometric Calibration Laboratory (RCL). Both instruments have a VNIR detector (i.e., 350–1000 nm wavelength) with a silicon (Si) photodiode array and two SWIR detectors (i.e., SWIR1 1001–1800 and SWIR2 1801–2500 nm wavelengths) that are thermoelectrically cooled indium gallium arsenide (InGaAs) photodiodes. The spectral resolutions of VNIR and SWIR detectors are 3 and 10 nm, respectively. An order-sorting filter is applied to sample to a resolution of 1 nm.
2.2 VSWIR spectrometer integration with SIMPL
Both spectrometers were mounted and secured on aluminium racks within the UC-12B fuselage. The nadir-viewing spectrometer 1∘ foreoptic was mounted and secured within the SIMPL housing centered over a flat BK7 optical window. The fiber-optic cable was connected to the nadir-viewing spectrometer, and a parallel port cable was used to communicate with the instrument control laptop. The zenith-viewing spectrometer remote cosine receptor was mounted on top of the aircraft in an external enclosure with a flat BK7 optical window. A remote cosine receptor is a diffuser foreoptic that transmits incoming irradiance from an 180∘ hemispherical view. The enclosure, referred to hereinafter as the “OrangeCan”, was mounted in a zenith position and bolted and sealed to the aircraft roof to maintain cabin pressure during flight. The fiber-optic cable was connected to the zenith-viewing spectrometer through a small communication port, and an Ethernet cable was used to communicate with the instrument control laptop.
The IFOV alignment between SIMPL and the nadir-viewing spectrometer 1∘ foreoptic was confirmed using a ground test procedure in an aircraft hangar with low light conditions. The SIMPL downward-directed laser beams were turned to a horizontal path and directed at a white reference target. The SIMPL laser transmitter produces four laser beams that are distributed perpendicular to the aircraft flight direction. The locations of the four visible green laser spots on the target were identified. The center of the nadir-viewing spectrometer FOV was determined by translating a white light source across the target, with its pointing direction parallel to the laser beams. The FOV center position was established by real-time observation of the spectrometer's peak response to the light source. At the nominal flight altitude of 2500 m above ground level (m a.g.l.), the 1∘ foreoptic IFOV produces a 44 m diameter ground sampling footprint. The SIMPL 0.4∘ spread of the beams and 0.007∘ beam divergence produces 0.3 m diameter ground spots distributed 20 m cross-track. We determined that the beams are located at the trailing edge of the nadir-viewing spectrometer's IFOV with the footprints displaced approximately 10 m to the right of the IFOV center.
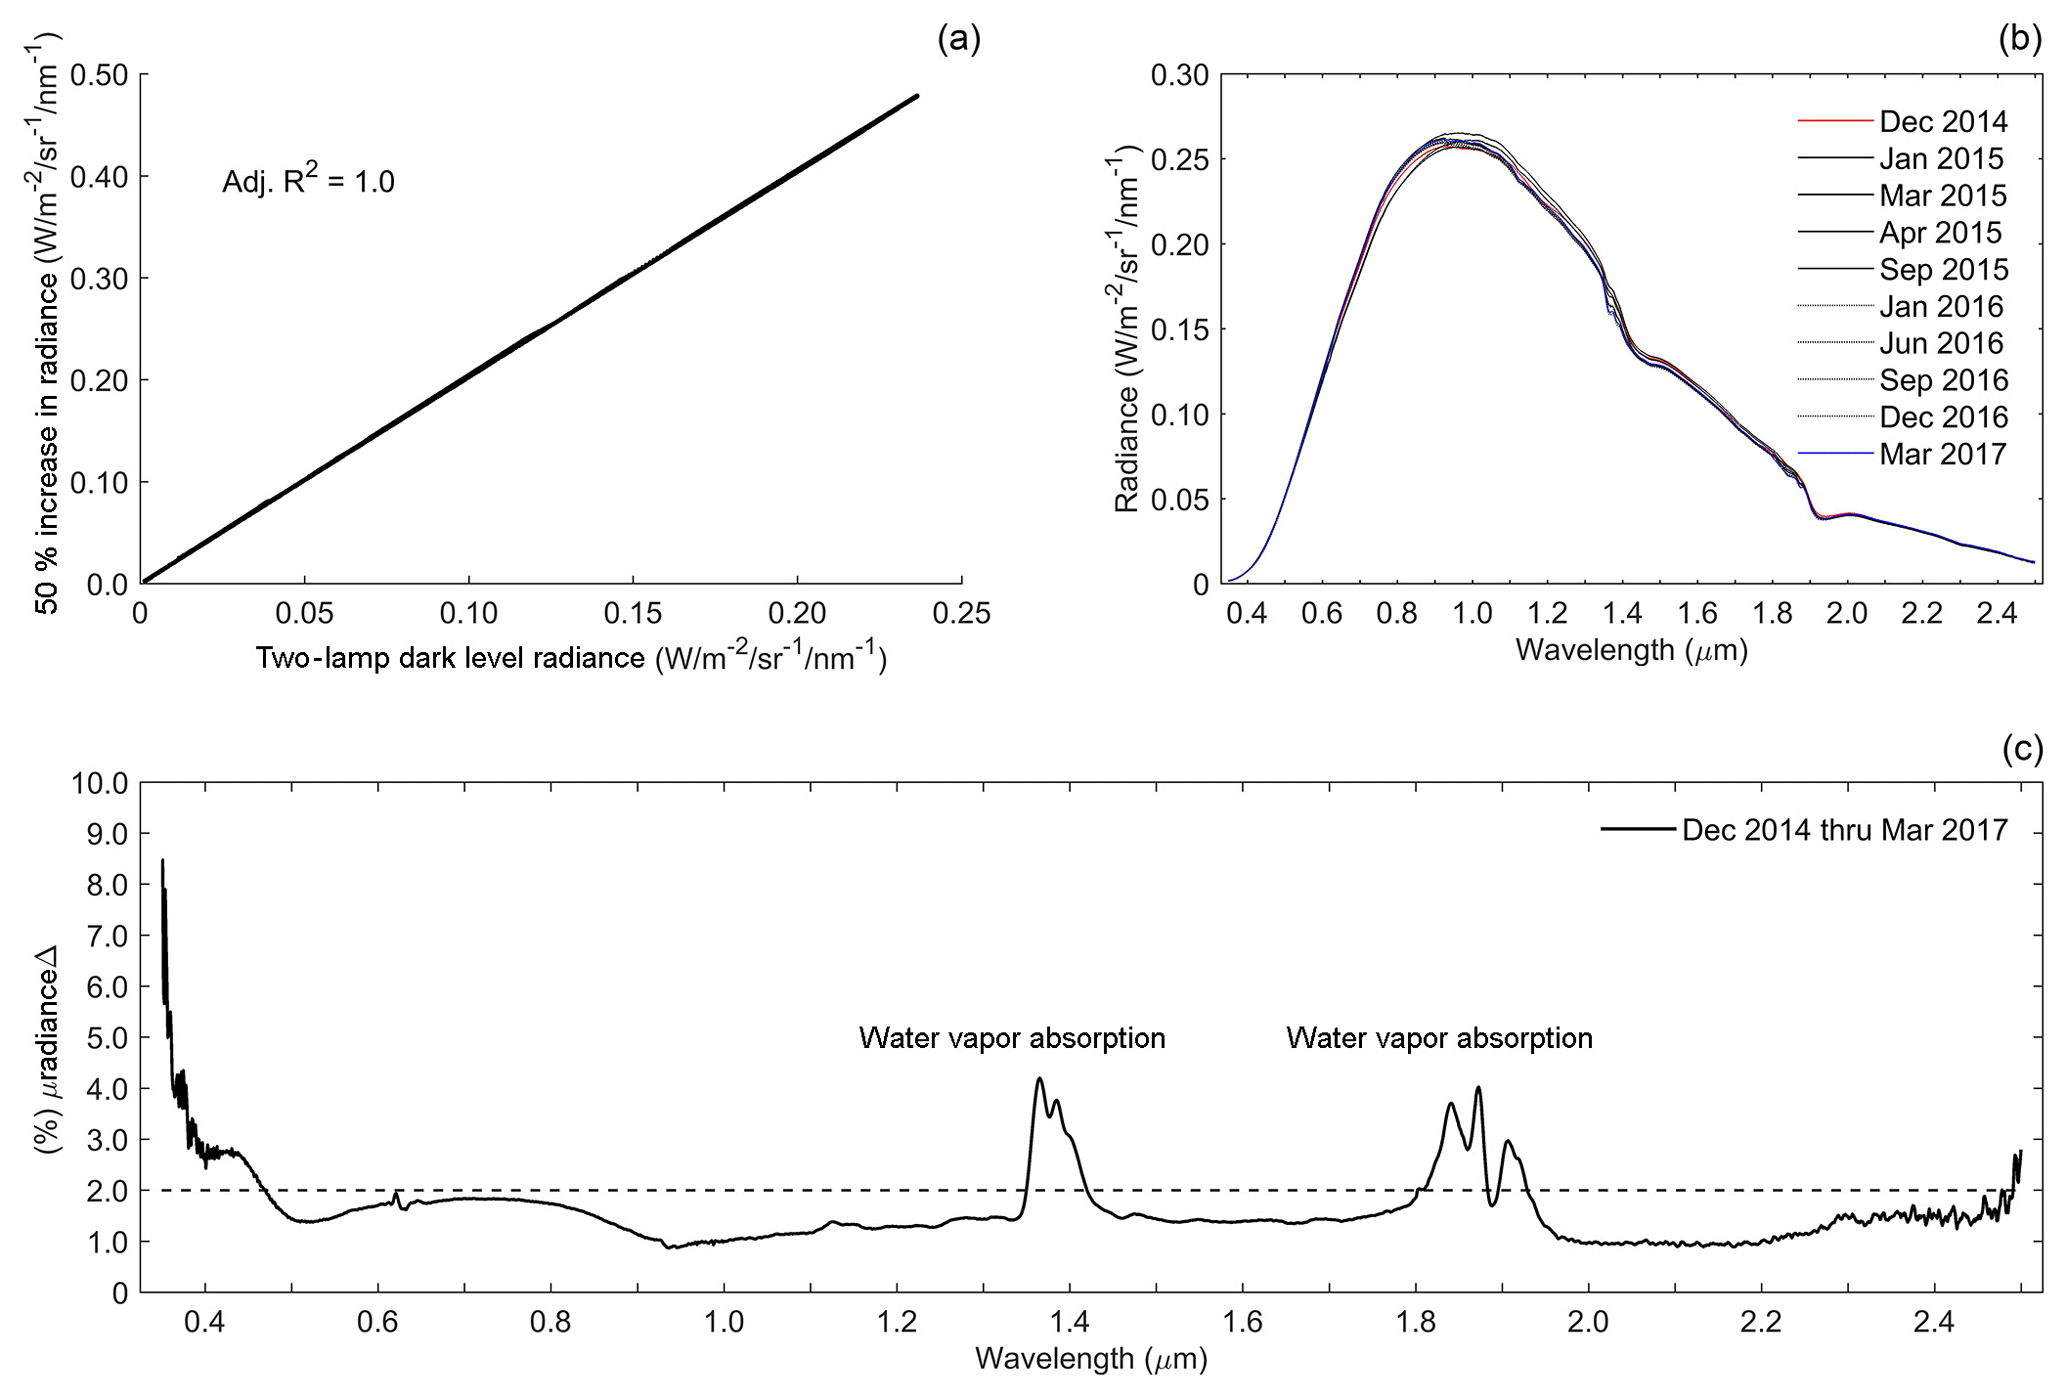
Figure 1Laboratory calibration of the nadir-viewing spectrometer using the NIST-traceable source. Panel (a) shows the linear test result using a least-square fit between the NIST-traceable-source two-lamp dark level output and the 50 % increase described in the text for the 0.35 to 2.5 µm wavelength range. Panel (b) shows the output (two-lamp dark level) from the NIST-traceable source during the nadir-viewing spectrometer repeatability checks. Panel (c) summarizes the nadir-viewing spectrometer's stability by wavelength over a ∼2.5-year period. The dotted line signifies the achieved stability requirement.
2.3 VSWIR spectrometer measurements
Instrument control laptops for both spectrometers required manual operation to initialize the appropriate instrument control software. The spectroscopic measurement interval for both nadir- and zenith-viewing spectrometers was set to 1 s (i.e., fastest programmable measurement time), and the integration time for the VNIR detector and gain setting for SWIR1 and SWIR2 detectors remained fixed for all nine science flights that included a dark current subtraction during each flight. The scan time for SWIR1 and SWIR2 detectors is ∼220 ms; thus, the total time between measurements included the VNIR integration time, SWIR1 and SWIR1 scan time, and file save time. The VSWIR measurements were time tagged and recorded at a temporal integration interval of ∼1 s and an along-track length scale of ∼100 m.
Nadir- and zenith-viewing measurements during each flight were stored as 16 bit raw digital counts for the 0.35 to 2.5 µm VSWIR spectral range. Raw counts from both spectrometers were converted to upwelling spectral radiance and downwelling spectral irradiance using calibration coefficients. Parabolic corrections were applied to splice together VNIR, SWIR1, and SWIR2 measurements from each detector. Each upwelling spectral radiance and downwelling spectral irradiance measurement had a Universal Time Coordinated (UTC) timestamp that was synchronized with Applanix GPS time and geolocation during flight.
3.1 Pre-flight laboratory calibration procedures
3.1.1 Nadir-viewing spectrometer
The nadir-viewing spectrometer linearity and repeatability tests were conducted using a NIST-traceable source in NASA's Goddard Space Flight Center Code 618 Optics Laboratory. The NIST-traceable source in this paper is defined as lamps plus integrating sphere. To check the spectrometer's linearity, the baseline response for the VNIR detector integration time and the SWIR1/2 detector gains was optimized to the NIST-traceable-source two-lamp dark level output radiance. Next, the VNIR integration time and SWIR1/2 gains were increased by 50 % to mimic an increase in the two-lamp dark level output radiance. Figure 1a shows the linearity test result for the nadir-viewing spectrometer. Bare-fiber (25∘ IFOV) measurements were captured from the NIST-traceable-source output where the fiber-optic tip was centered in front of the integrating sphere aperture. To assess the spectrometer's repeatability over time, bare-fiber NIST-traceable-source measurements were periodically captured using identical procedures as the linearity test (Fig. 1b). The nadir-viewing spectrometer's stability was determined to be less than 2 % for VNIR, SWIR1, and SWIR2 detectors for pre- and post-flight time frames (Fig. 1c). Spectral calibration of the nadir-viewing spectrometer's VNIR and SWIR1/2 detectors is routinely conducted using mercury and argon signatures with a resulting wavelength precision of better than 2 % of the 1 nm sampling resolution.
3.1.2 Zenith-viewing spectrometer
The zenith-viewing spectrometer linearity test was conducted using the same procedures as the nadir-viewing spectrometer (Fig. 2a). Prior to aircraft integration, ASD Inc. conducted routine instrument maintenance and spectral calibration checks on the zenith-viewing spectrometer. The zenith-viewing spectrometer was determined to be stable, with a wavelength precision of better than 2 % of the 1 nm sampling resolution. Although longer-term information on zenith-viewing spectrometer repeatability was unavailable, a cross-calibration between nadir- and zenith-viewing spectrometer bare-fiber NIST-traceable-source output radiance indicated that the between-spectrometer response difference was within 2 % for wavelengths between 0.5 and 2.0 µm (Fig. 2b and c).
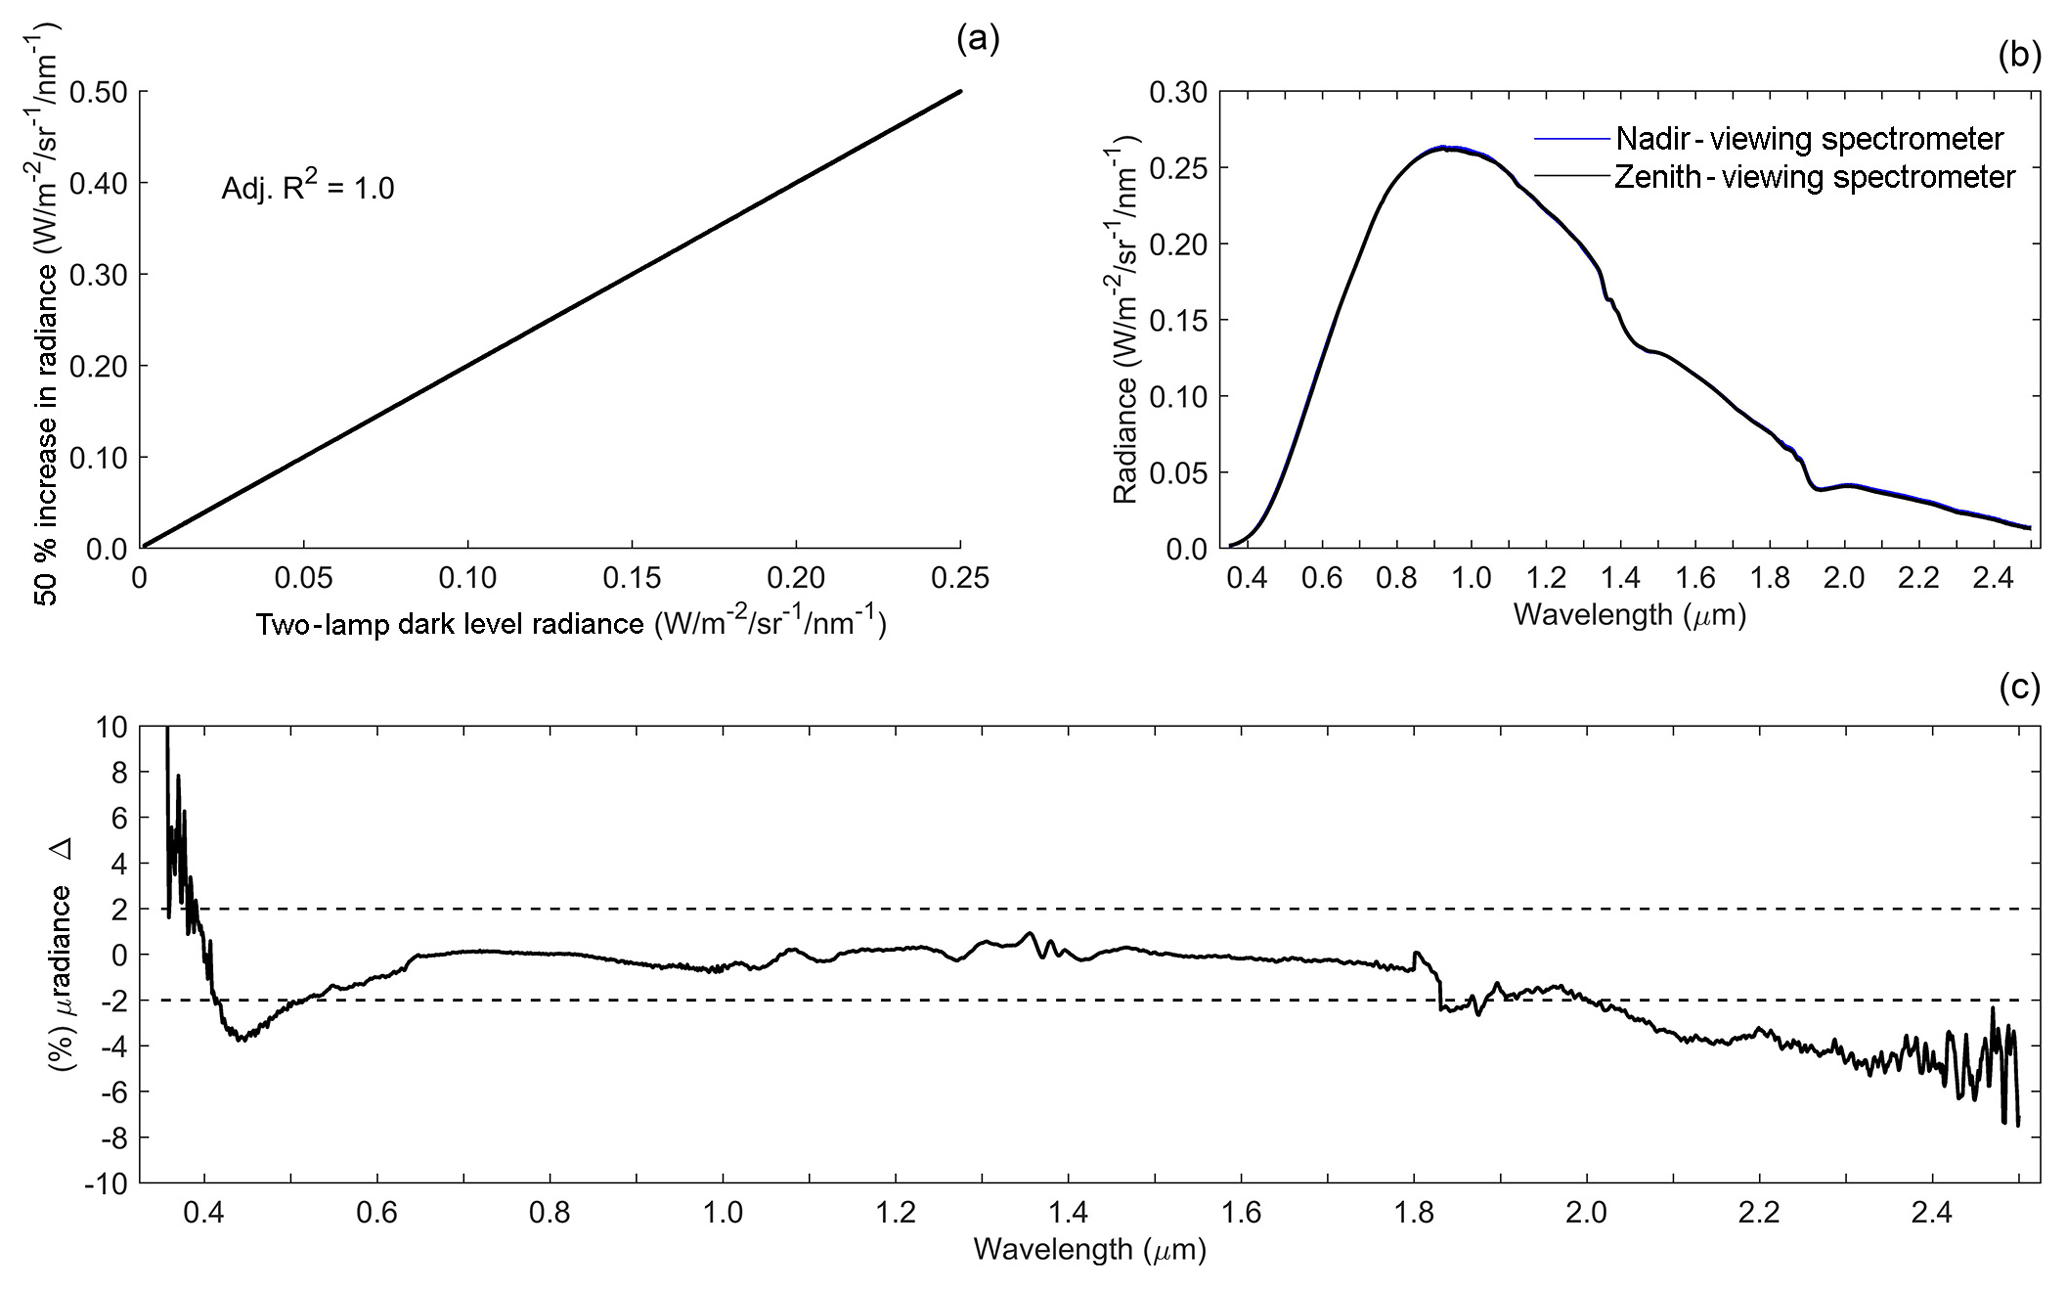
Figure 2Laboratory cross-calibration of the nadir- and zenith-viewing spectrometers using the NIST-traceable source. Panel (a) shows the zenith-viewing spectrometer linearity test result, and panel (b) shows the cross-calibration using the NIST-traceable-source output. Panel (c) summarizes the difference in response between nadir- and zenith-viewing spectrometers relative to the achieved stability requirement (dotted lines).
3.1.3 Optical window transmission and measurement requirements
Optical window light transmittance is wavelength dependent. The BK7 optical window, procured from Esco Optics, was mounted in the OrangeCan right above the remote cosine receptor optic. We measured BK7 window transmittance using the nadir-viewing spectrometer and the NIST-traceable source. The optical window was mounted and centered in front of the integrating sphere aperture. The spectrometer fiber-optic tip was mounted and placed in front of the optical window. We captured NIST-traceable-source measurements at the top, right, bottom, left, and center window positions to fully assess transmission. We averaged optical window measurements and compared with window-free NIST-traceable-source radiance to derive wavelength-dependent radiance loss due to window transmissivity (Fig. 3a and b). The nadir-viewing spectrometer BK7 optical window for the UC-12B aircraft was procured from Cosmo Optics Inc. Transmittance for this optical window was determined to be greater than 90 % for wavelengths between 0.34 and 2.2 µm per manufacture material specifications. Because of a compressed timeline during aircraft instrument integration for this airborne mission, we were unable to transport the laboratory NIST-traceable source to measure the transmittance of the UC-12B BK7 optical window. Based on this experience, aircraft optical window measurements should be acquired prior to and/or during aircraft instrument integration as a standard practice.
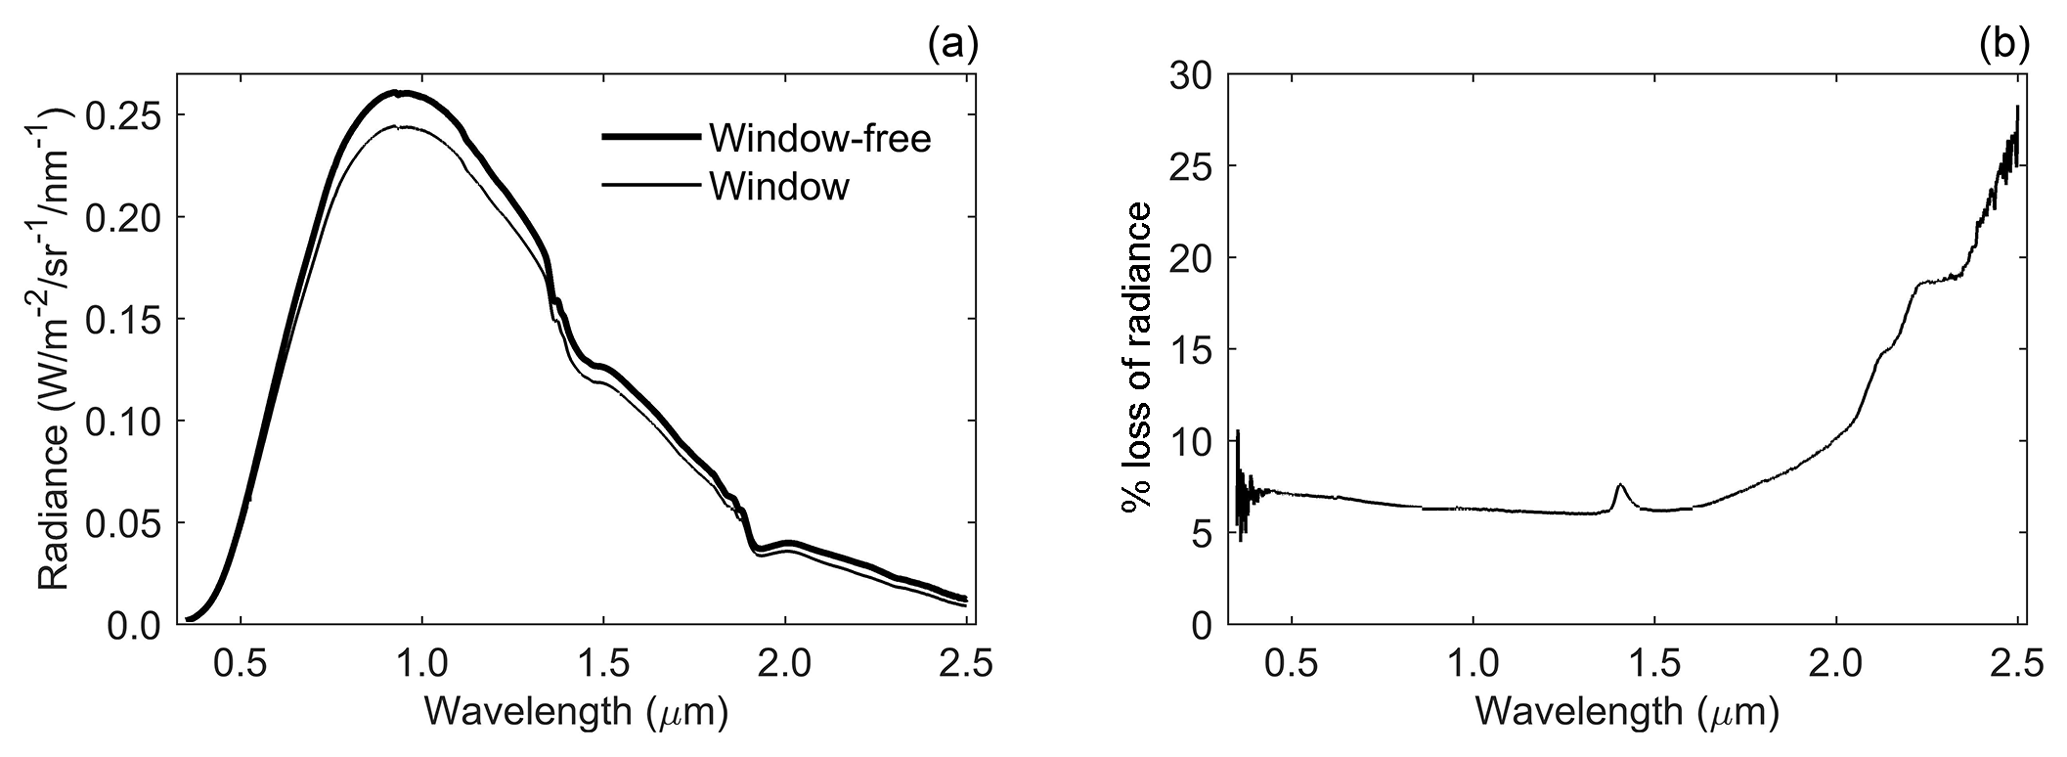
Figure 3A measure of light transmission through the BK7 optical window mounted within the OrangeCan. Panel (a) shows the NIST-traceable-source output with and without the optical window. Panel (b) summarizes wavelength-dependent radiance loss due to window transmissivity.
Based on the optical window transmission specifications and measurements described above, these uncertainties provided a baseline for upwelling (downwelling) spectral radiance (irradiance) requirements because the stability of both nadir- and zenith-viewing spectrometers was determined to be less than 2 % and more certain than optical window transmission uncertainties. Upwelling spectral radiance measurement uncertainty for wavelengths between 0.4 and 2.0 µm was determined to be within ±5 % (total uncertainty of 10 % or less) for the nadir-viewing spectrometer looking through the BK7 optical window procured from Cosmo Optics Inc. Downwelling spectral irradiance measurement uncertainty for wavelengths between 0.4 and 2.0 µm was determined to be within ±4 % (total uncertainty of 8 % or less) for the zenith-viewing spectrometer based on laboratory measurements shown in Fig. 3b and looking through the OrangeCan BK7 optical window procured from Esco Optics. For both nadir- and zenith-viewing spectrometers, measurement uncertainty for wavelengths between 2.0 and 2.5 µm was between ±5 and ±13 %, and primarily attributable to radiance loss due to optical window transmissivity. We chose not to correct for optical window transmission because the laboratory uncertainties were within the targeted measurement requirement.
3.2 In-flight calibration procedures
3.2.1 Nadir-viewing spectrometer
The 29 July flight over the Greenland ice sheet interior was used for an in-flight radiometric calibration of the nadir-viewing spectrometer. The range of measured snow, ice, and liquid water surfaces during this calibration flight covered the full-reflected solar spectrum dynamic range from bright Greenland ice with coarse snow grains, to darker bare rock/soil, to dark open-ocean water. The in-flight radiance calibration was designed to optimize the VNIR detector integration time and SWIR1/2 detector gain settings. We chose to optimize the nadir-viewing spectrometer over interior Greenland ice with a probable dry snow layer while under near-clear-sky solar illumination conditions to avoid spectral radiance saturation when flying across strong snow, ice, and liquid water surface gradients. This in-flight radiometric calibration allowed us to constrain the upper limits of upwelling spectral radiance over bright Greenland ice within the LOS, while recovering as much low-radiance signal as possible over dark land and ocean targets under similar atmospheric and solar illumination conditions.
Even though the nadir-viewing spectrometer was mounted with a nadir IFOV and the UC-12B was in a stable horizontal position during flight, we note two specific in-flight caveats that are inherent to airborne measurements. First, in-flight inclination can subtly impact the nadir-viewing geometry in that it can be difficult to determine exactly how short-term atmospheric turbulence and/or aircraft positional change influences the BRDF of the measured surface anisotropy within the IFOV. The SIMPL instrument aboard the UC-12B recorded inclination during flight and could be used to constrain this measurement artifact in a post-processing mode. We determined this to not be significant relative to the spectral radiance measurement requirement discussed in Sect. 3.1.3.
Second, snow and ice surfaces have an anisotropic signature dominated by forward scattering (Aoki et al., 2000; Leshkevich and Deering, 1990; Painter and Dozier, 2004b; Schaepman-Strub et al., 2006) and can also be highly specular during melt (Leshkevich and Deering, 1990; Mullen and Warren, 1988). If the aircraft heading (azimuth) is generally perpendicular to the direct path solar principal plane, then airborne-measured snow and ice radiances will be minimally affected by the angular scattering bias. However, if the aircraft heading is parallel or near parallel to the solar principal plane, then either a BRDF correction must be applied or caution must be exerted prior to interpreting measured radiances. Flying underneath homogenous cloud layers results in an isotropic assumption where surface scattering is not dependent on direction (Hudson and Warren, 2007).
3.2.2 Zenith-viewing spectrometer
In-flight radiometric calibration of the zenith-viewing spectrometer was also conducted during the 29 July flight. Direct and diffuse sky irradiance can be highly variable along a given flight line and can span clear-sky to white-sky conditions with single and/or multi-layered cloud layers. In this near-polar geography and seasonal period of snow and ice melt with expansive open water, low solar illumination angles, and large energy fluxes between the surface and lower atmosphere result in dynamically changing measurement conditions over relatively short spatiotemporal scales. During the 29 July flight, the zenith-viewing spectrometer VNIR detector integration time and SWIR1/2 detector gain settings were optimized to avoid irradiance saturation when flying above, in between, and below cloud layers. Collecting zenith spectral irradiance during flight allowed for characterization of sky conditions to screen for flight data contaminated by clouds as well as additional measurement information to support atmospheric compensation modeling. Flying in an atmosphere with broken cloud cover presents challenging observational conditions to assess VSWIR spectrometer measurement performance because the solar irradiance light field changes quickly. Diffuse scattering contributions from complex cloud geometries can either increase upwelling radiance over bright, highly reflective snow and ice surfaces, or can decrease upwelling radiance from shadowing. Our interest in measuring solar irradiance was to identify flight line segments where we could assume clear-sky illumination conditions within the nadir-viewing spectrometer's LOS.
During instrument integration into the UC-12B aircraft, it became evident that the zenith OrangeCan design on the top of the aircraft would exclude directly transmitted spectral irradiance at low illumination angles. During the 29 July flight, it was verified that the remote cosine receptor optic did not receive directly transmitted spectral irradiance as would be the case at incident angles during all nine science flights. Based on this spectral irradiance measurement limitation, we removed the OrangeCan from the top of the UC-12B aircraft while on the Thule Air Base tarmac once the aircraft returned from its daily flight line. Removing the OrangeCan from the top of the aircraft enabled the flight team to quantify its impact on direct and diffuse spectral irradiance measurements. This problem is addressed in Sect. 3.3.2 and 3.3.3.
In addition to the OrangeCan's impact on in-flight measured spectral irradiance, we note another observational caveat that is tied to the imperfect cosine response of the remote cosine receptor. Horizontal positional change of the UC-12B resulting from atmospheric turbulence and/or pitch, yaw, and roll maneuvers would result in a hemispherical spectral irradiance measurement bias, especially for the directly transmitted irradiance. Under clear-sky or white-sky conditions, it may be possible to assess how horizontal changes in the UC-12B aircraft influenced in-flight spectral irradiance measurements in a post-processing mode. We deemed this to be negligible relative to the spectral irradiance measurement requirement because directly transmitted irradiance was excluded. Even though aircraft altitude was relatively stable during flight, we note that changes in aircraft altitude did impact measured spectral irradiance by changing the solar zenith angle of illumination. Nevertheless, the zenith position of the OrangeCan was only intended as a point of reference for sky conditions during flight.
3.3 Post-flight laboratory and field calibration procedures
3.3.1 Nadir-viewing spectrometer IFOV characterization
A NIST-traceable source in NASA's Goddard Space Flight Center Code 618 RCL clean room was used to measure the nadir-viewing spectrometer 1∘ foreoptic point spread function (PSF). A sliding optical rail in millimeter increments was mounted on a laboratory table parallel to the integrating sphere aperture. The 1∘ foreoptic was mounted and aligned on the sliding optical rail at a distance of 101.5 cm from the 1∘ aperture to the integrating sphere aperture. Sliding from left to right in parallel (i.e., equivalent to cross-track vignetting; Chrien et al., 1990) to the integrating sphere aperture, radiance measurements were captured in 1 mm increments. The measurement technique involved starting in an occulted left position, sliding the 1∘ aperture across the integrating sphere output to measure the width of the 1∘ radiance response, and then finishing in an occulted right position (Fig. 4a and b). Using Eq. (1), PSF in-IFOV and near-IFOV scale factors (sf) can be computed:
where the in−IFOVPSFsf excludes left and right edge aperture measurements (to the nearest millimeter), and near−IFOVPSFsf includes left and right edge aperture measurements (to the nearest millimeter). The 1∘ aperture width excluding edges was measured at 26.5 cm, and the 1∘ aperture width including edges was measured 26.9 cm. The integrating sphere aperture width is 25 cm. Using the in−IFOVPSFsf = 1.5 cm and near−IFOVPSFsf = 1.9 cm, the ground sampling footprint for the nadir-viewing spectrometer can be approximated with Eq. (2):
where IFOVground is in meters, in−IFOVPSFsf or near−IFOVPSFsf is in meters (converted from centimeters), and SIMPL AltitudeAGL is the distance from the sensor to the surface in meters.
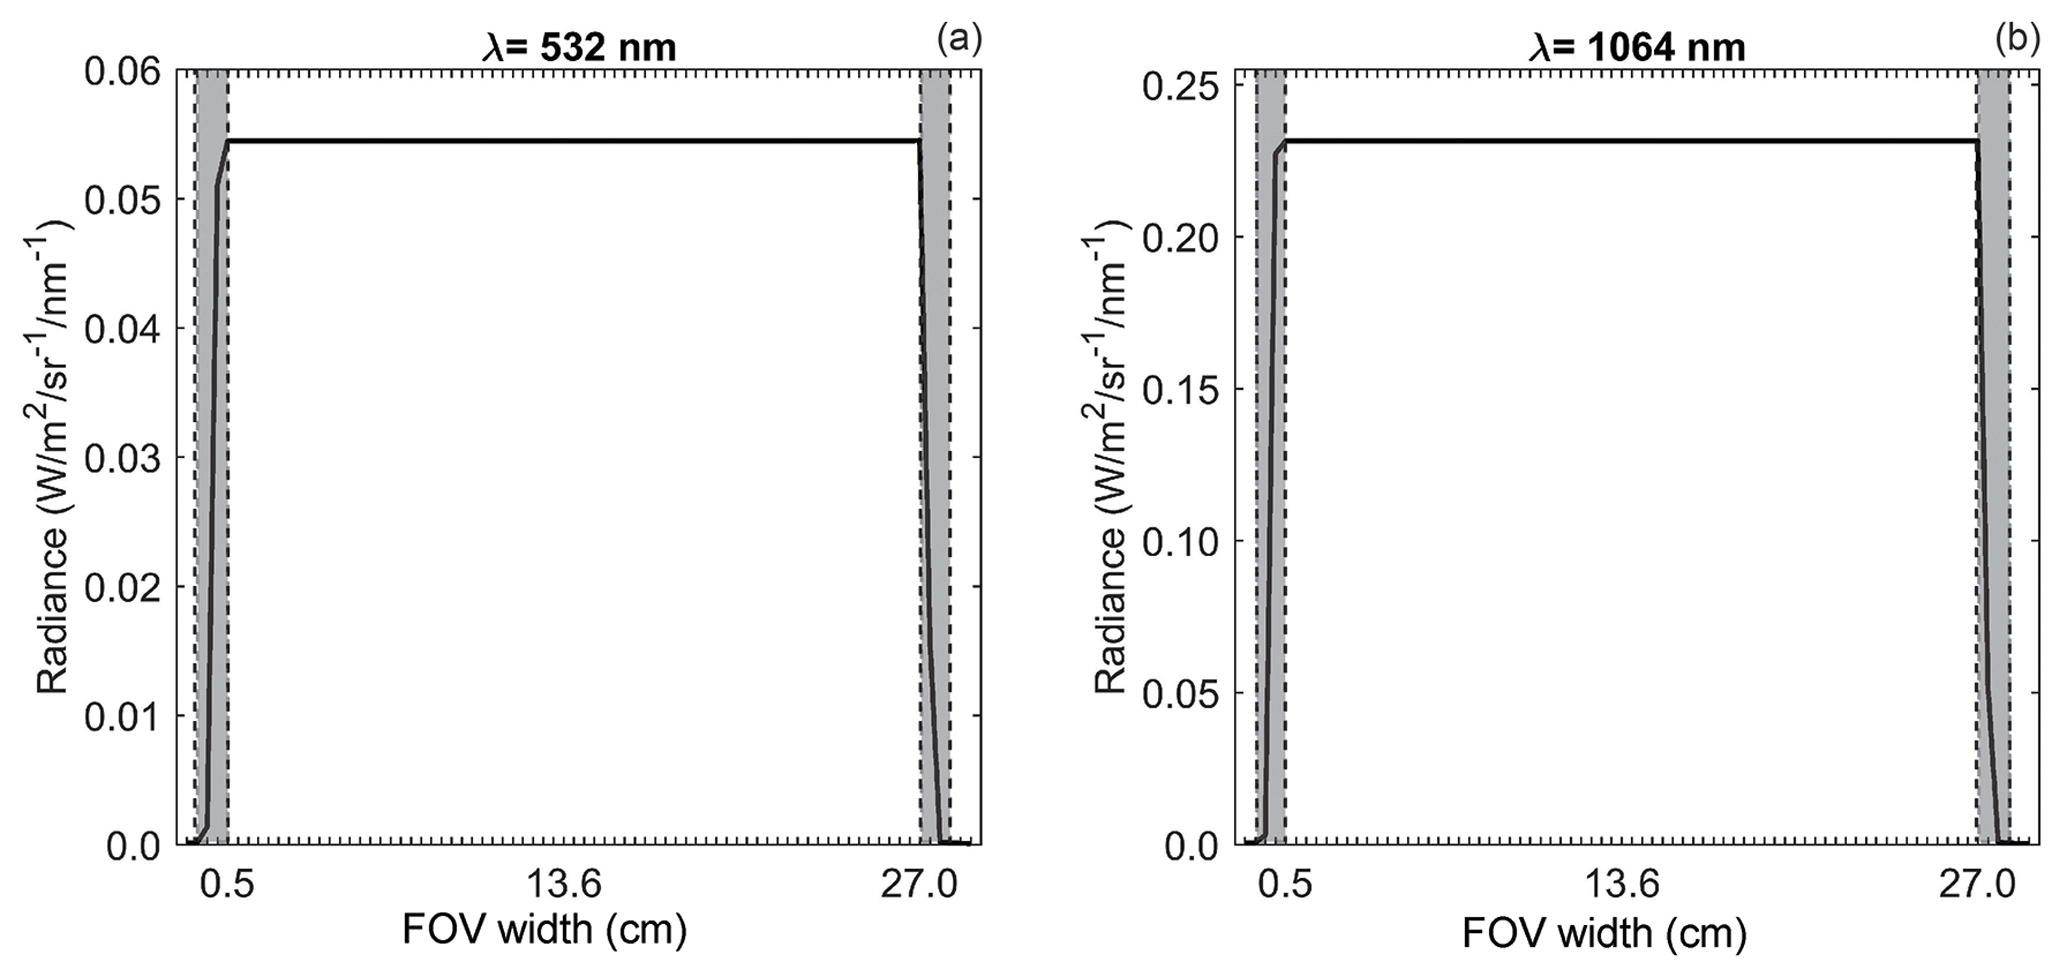
Figure 4Laboratory characterization of the nadir-viewing 1∘ foreoptic lens point spread function and IFOV using the NIST-traceable-source output. Results from green (a) and NIR (b) wavelengths at which SIMPL operates were used to summarize in-IFOV (thick black line within the dotted line boundaries) and near-IFOV widths (grey regions within the dotted lines).
3.3.2 Zenith-viewing spectrometer remote cosine receptor characterization
The zenith hemispherical irradiance response for the remote cosine receptor optic was measured in NASA's Goddard Space Flight Center Code 618 RCL clean room using a 1000 W NIST-traceable point source in dark conditions. Reflective stray light from any surface other than the point source in the clean room was blocked off with additional dark materials. The point source was mounted on a laboratory table directly behind a rectangular-shaped bevel to constrain illumination rays. The remote cosine receptor optic was secured to a rotating mount with an angular resolution of 1∘. Point-source irradiance measurements were captured with the remote cosine receptor optic placed inside the OrangeCan with the BK7 optical window as well as without the OrangeCan. This procedure was intended to repeat spectral irradiance measurements collected during the airborne mission, and to quantify the OrangeCan's impact on the zenith hemispherical irradiance measurements in a controlled laboratory environment.

Figure 5Laboratory characterization of the zenith-viewing remote cosine receptor optic using a NIST-traceable point source. Green (a) and NIR (b) wavelengths at which SIMPL operates were used to summarize the OrangeCan's impact on the remote cosine receptor optic IFOV and measured irradiance.
Point-source irradiance measurements for the remote cosine receptor optic without OrangeCan obstruction were captured in 5∘ angular increments from 0 to 180∘. OrangeCan remote cosine receptor measurements were captured in 1∘ angular increments from 0 to 180∘. The OrangeCan's impact on the remote cosine receptor response is shown in Fig. 5a and b. We determined that the IFOV of the OrangeCan remote cosine receptor optic mounted in a zenith position on top of the aircraft was 102∘ (to the nearest degree). Thus, for solar zenith angles lower than 51∘, the directly transmitted component of spectral irradiance was not received by the zenith-viewing spectrometer remote cosine receptor optic during either the calibration flight or the nine science flights.
3.3.3 Remote cosine receptor field experiment
The objective of the remote cosine receptor field experiment was to determine how the spectral irradiance measurements collected in a zenith position with the OrangeCan's 102∘ FOV could be useful for characterizing sky conditions during each flight. On 15 December 2015, we conducted a verification experiment on the roof of Building 33 at NASA Goddard Space Flight Center. The exact roof location was adjacent to the AERONET calibration site (https://aeronet.gsfc.nasa.gov/, last access: 13 July 2016, 38.99250∘ N, 76.83983∘ W) and provided an unobstructed hemispherical IFOV. We used both spectrometers deployed during the airborne mission to coincidentally collect hemispherical-sky and OrangeCan-sky remote cosine receptor measurements mounted on level tripods side by side at a temporal sampling frequency of 1 s.
Given the known limitation that the OrangeCan remote cosine receptor optic could not receive the directly transmitted component of spectral irradiance at solar zenith angles lower than 51∘, we wanted to mimic the solar illumination geometry and both direct and diffuse-sky conditions under plausible measurement scenarios during the airborne flights. Thus, four hemispherical-sky illumination scenarios were evaluated: (1) direct clear sky and diffuse clear sky; (2) direct clear sky and diffuse cloud sky; (3) direct cloud sky and diffuse clear sky; and (4) direct cloud sky and diffuse cloud sky. Direct cloud sky indicates when clouds are fully obstructing the direct path. Both hemispherical-sky and OrangeCan-sky remote cosine receptor measurements were collected during the temporal window of 04:00 to 10:00 UTC. We monitored variable solar illumination conditions and periodically photographed direct and diffuse-sky scenes to complement remote cosine receptor measurements. We selected hemispherical-sky and OrangeCan-sky remote cosine receptor measurements for each illumination scenario described above. The raw counts were converted to spectral irradiance using calibration coefficients. The coincident (within 1 min) hemispherical-sky and OrangeCan-sky remote cosine receptor measurements accompanying each photographed scenario were summarized using averaging.

Figure 6Remote cosine receptor field experiment results from 15 December 2015. Four separate solar illumination scenarios are represented with coincident hemispherical-sky and OrangeCan-sky spectral irradiance measurements. Average spectral irradiance for each scenario was calculated using 1 s measurement sampling for local time and solar zenith angle (SZA) shown. Solar illumination conditions along the directly transmitted path and zenith diffuse-sky are shown on the right with photographs. Note: the amount of irradiance is dependent on the temporal proximity to solar noon, which on 15 December 2015 was 11:51 EST.
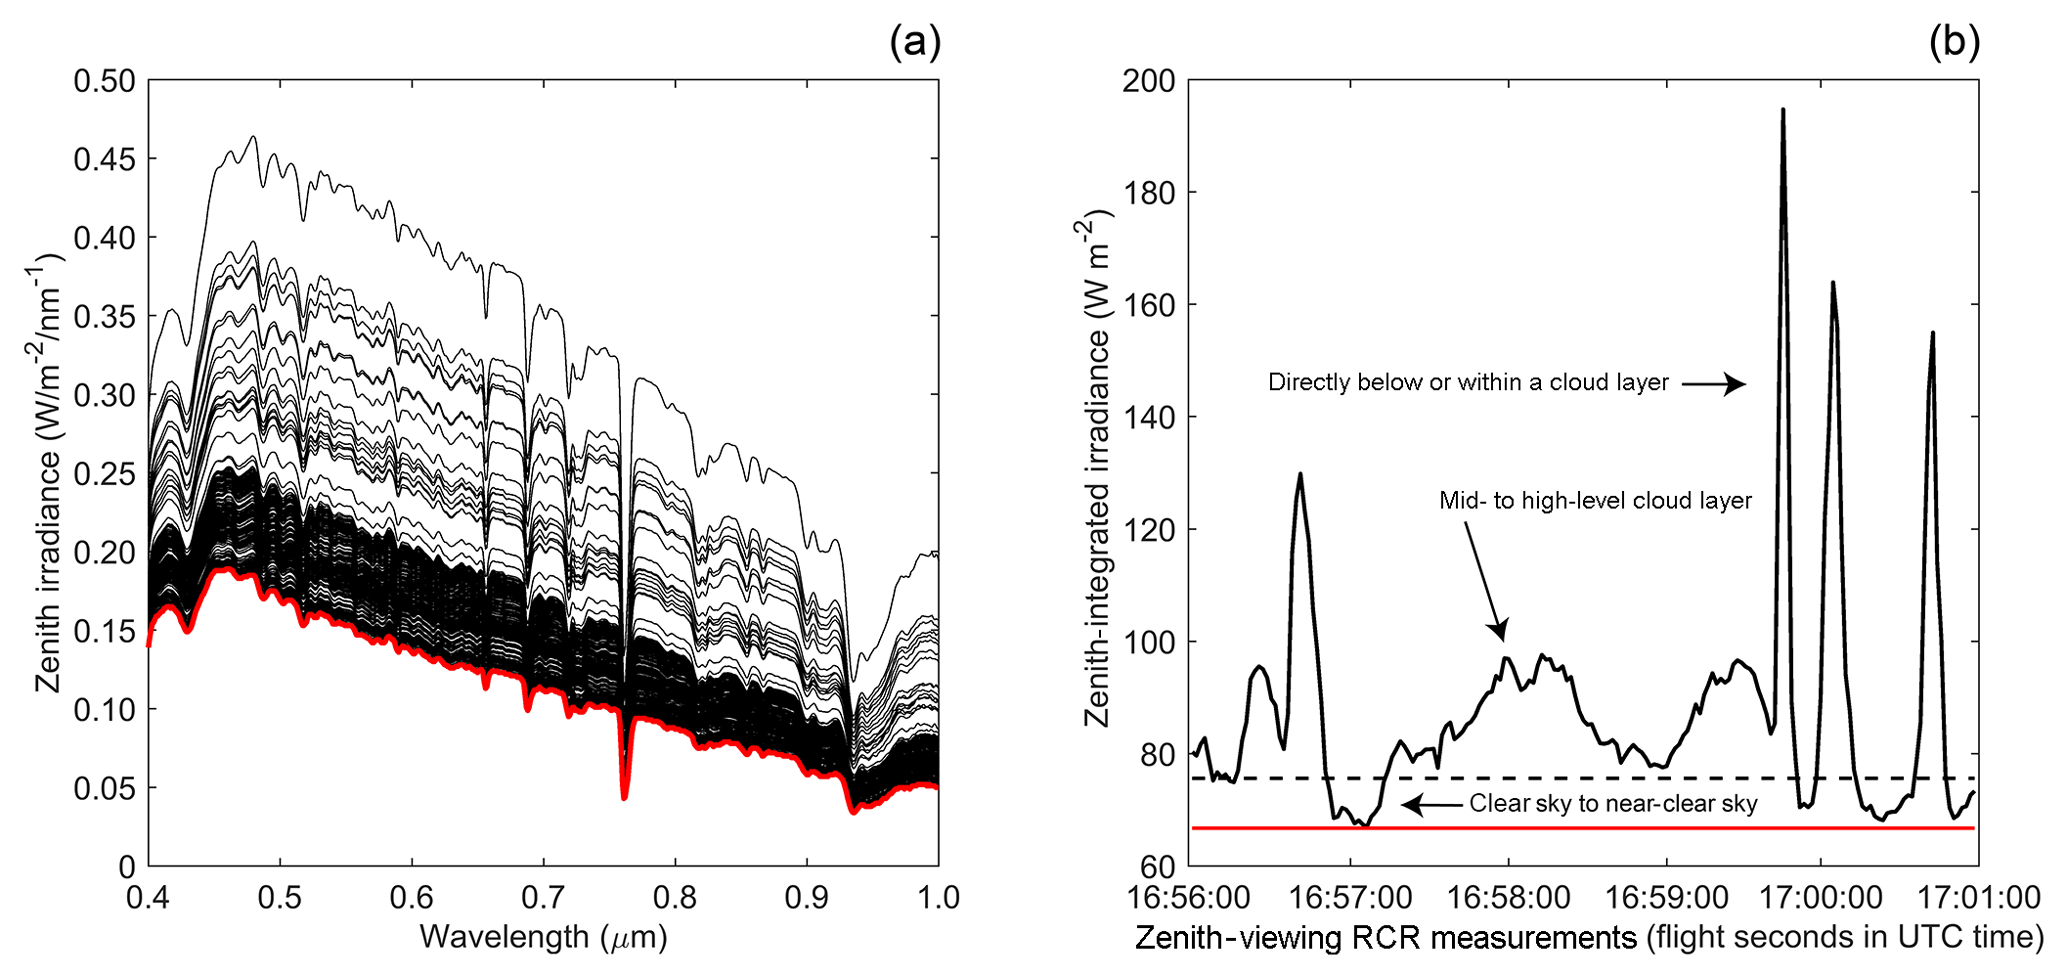
Figure 7Example zenith remote cosine receptor irradiance measurements for a 29 July flight segment. Panel (a) shows zenith irradiance measurements from 0.4 to 1.0 µm. The black lines indicate variability in instantaneous in-flight irradiance for a 5 min flight segment. The thick red line signifies the baseline minimum irradiance received, a condition that represents diffuse clear sky to near-clear sky as verified with Fig. 6 results. Panel (b) shows zenith-integrated irradiance (i.e., sum function) from 0.4 to 1.0 µm for the same 5 min flight segment. The thick black line indicates temporal variance in zenith-integrated irradiance, a measure of sky conditions above the UC-12B aircraft. The dotted line signifies the computed mode (most frequently occurring condition) of zenith-integrated irradiance, an indicator of sky condition stability. The red line serves as the minimum zenith-integrated irradiance baseline. Using the temporal variance in zenith-integrated irradiance, the mode value, and the minimum value, variable sky conditions during flight can be classified and the nadir-viewing spectrometer measurements can be filtered for cloud contamination.
Our hemispherical-sky/OrangeCan-sky remote cosine receptor comparison shown in Fig. 6 indicates that the OrangeCan-sky spectral irradiance measurements from airborne flights can be exploited to characterize diffuse sky conditions, whether clouds or clear sky. Our analysis of sky condition scenarios indicates that when clouds are passing above the zenith-mounted OrangeCan, the remote cosine receptor spectral irradiance response increases appreciably when compared to the diffuse clear-sky response. Our interpretation of this spectral irradiance response is that clouds are diffusing light directly above (whether on ground or in flight) where photons undergo multiple scattering within and between single and/or multi-layered cloud strata. In the absence of the directly transmitted component of spectral irradiance, the diffuse OrangeCan-sky response can be used only to characterize zenith sky conditions during each flight (Fig. 7a and b). At a minimum, zenith-measured sky conditions from the zenith-viewing spectrometer during flight can inform appropriate selection of clear-sky airborne measurements from the nadir-viewing spectrometer.
4.1 Radiative transfer methodology
For comparison of model-predicted and airborne-measured radiance, a surface reflectance spectrum coincident with the time of the aircraft overflight is required as an input to MODTRAN (Green et al., 1993, 1998; Slater et al., 1987; Thome, 2001; Thompson et al., 2015). This surface reflectance spectrum is combined with real-time atmospheric measurements, namely aerosol optical depth and columnar water vapor, to parameterize MODTRAN-predicted radiance for the airborne spectrometer. Another technique is to model apparent airborne surface reflectance using radiative transfer and then rescale to ground reflectance using an empirical line correction (Gao et al., 1993; Moran et al., 2001; Smith and Milton, 1999). For the SIMPL/AVIRIS-NG 2015 Greenland campaign, no ground or ship campaign occurred over the Greenland ice sheet or sea ice, which were the primary measurement targets of interest. Logistical challenges and cost prevented ground deployment on the Greenland ice sheet or ship deployment on the open ocean for purposes of acquiring in situ ground measurements. However, on 14 August 2015, a calibration/validation experiment was conducted on the tarmac at Thule Air Base where both UC-12B and Dynamic Aviation aircraft carrying the non-imaging airborne spectrometers and AVIRIS-NG flew near simultaneously, acquiring measurements over dark asphalt. Our initial focus in this paper is to document the traceable radiometric calibration methods for deployment of the airborne spectrometers aboard the UC-12B aircraft, and to assess the nadir-viewing spectrometer's measurement performance over bright and dark Greenland targets during the in-flight radiometric calibration experiment. We plan to compare the nadir-viewing spectrometer's measurement performance against AVIRIS-NG for the Thule Air Base calibration/validation experiment but reserve that effort for future investigation.
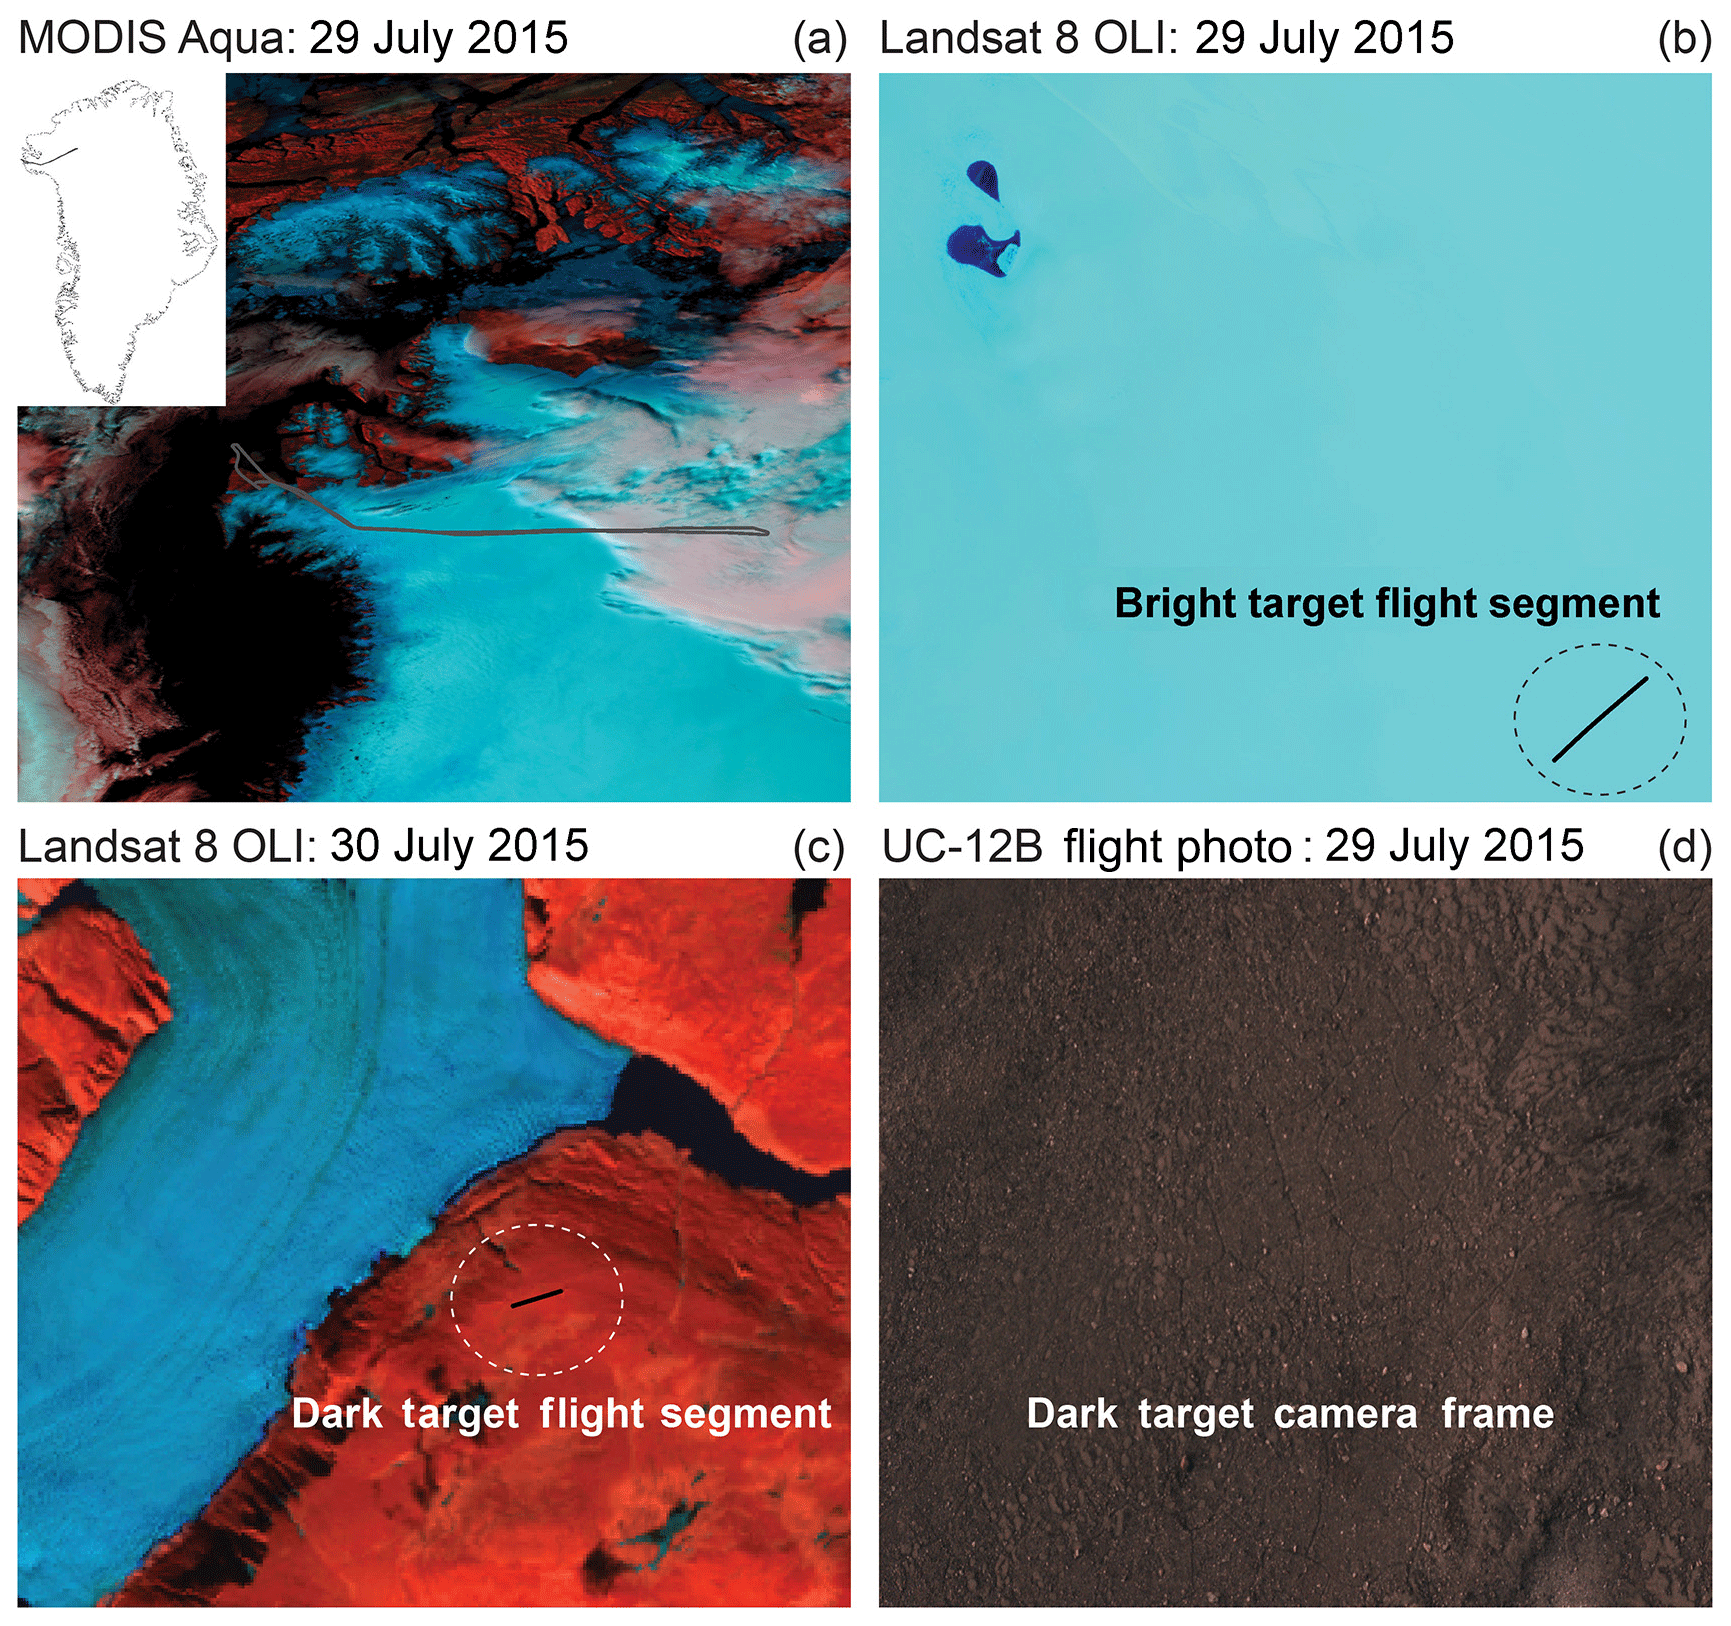
Figure 8The 29 July flight line showing bright and dark target MODTRAN comparison segments for the nadir-viewing spectrometer. Panel (a) shows a MODIS Aqua image (false color SWIR, NIR, green composite) with the UC-12B flight line (grey line). Panel (b) shows a Landsat 8 OLI image (false color SWIR, NIR, green composite) with the bright Greenland ice target flight segment (black line within the black dotted circle). Panel (c) shows a Landsat 8 OLI image (false color SWIR, NIR, green composite) with the dark bare rock/soil target flight segment (black line within the white dotted circle). Panel (d) shows a UC-12B high-resolution visible camera image (true color red, green, and blue composite) frame of the dark bare rock/soil target flight segment. Note: high-resolution visible camera images were acquired over Greenland ice during the campaign science flights.
Given our ground campaign constraints, we developed an alternative comparison method to assess measurement performance based on MODTRAN along with a coincident Landsat 8 OLI image acquisition. This alternative method involved selecting two independent flight line segments over homogenous bright Greenland ice (Fig. 8a and b) and dark bare rock/soil (Fig. 8c and d) targets using both high-resolution camera images and the Landsat 8 OLI images. As an additional check for these dark and bright target segments, we used the zenith-viewing irradiance measurements to confirm that variance in measured nadir-viewing spectrometer radiance was not contaminated by broken cloud cover during these flight segments. To reduce uncertainty in MODTRAN predictions, knowledge about the surface reflectance is required to partition light scattering and absorption within the spectrometer's LOS. As described above, we did not measure ground reflectance during the in-flight radiometric calibration experiment. Thus, our alternative was to use airborne apparent reflectance from the nadir-viewing spectrometer as an input to MODTRAN (Fig. 9).
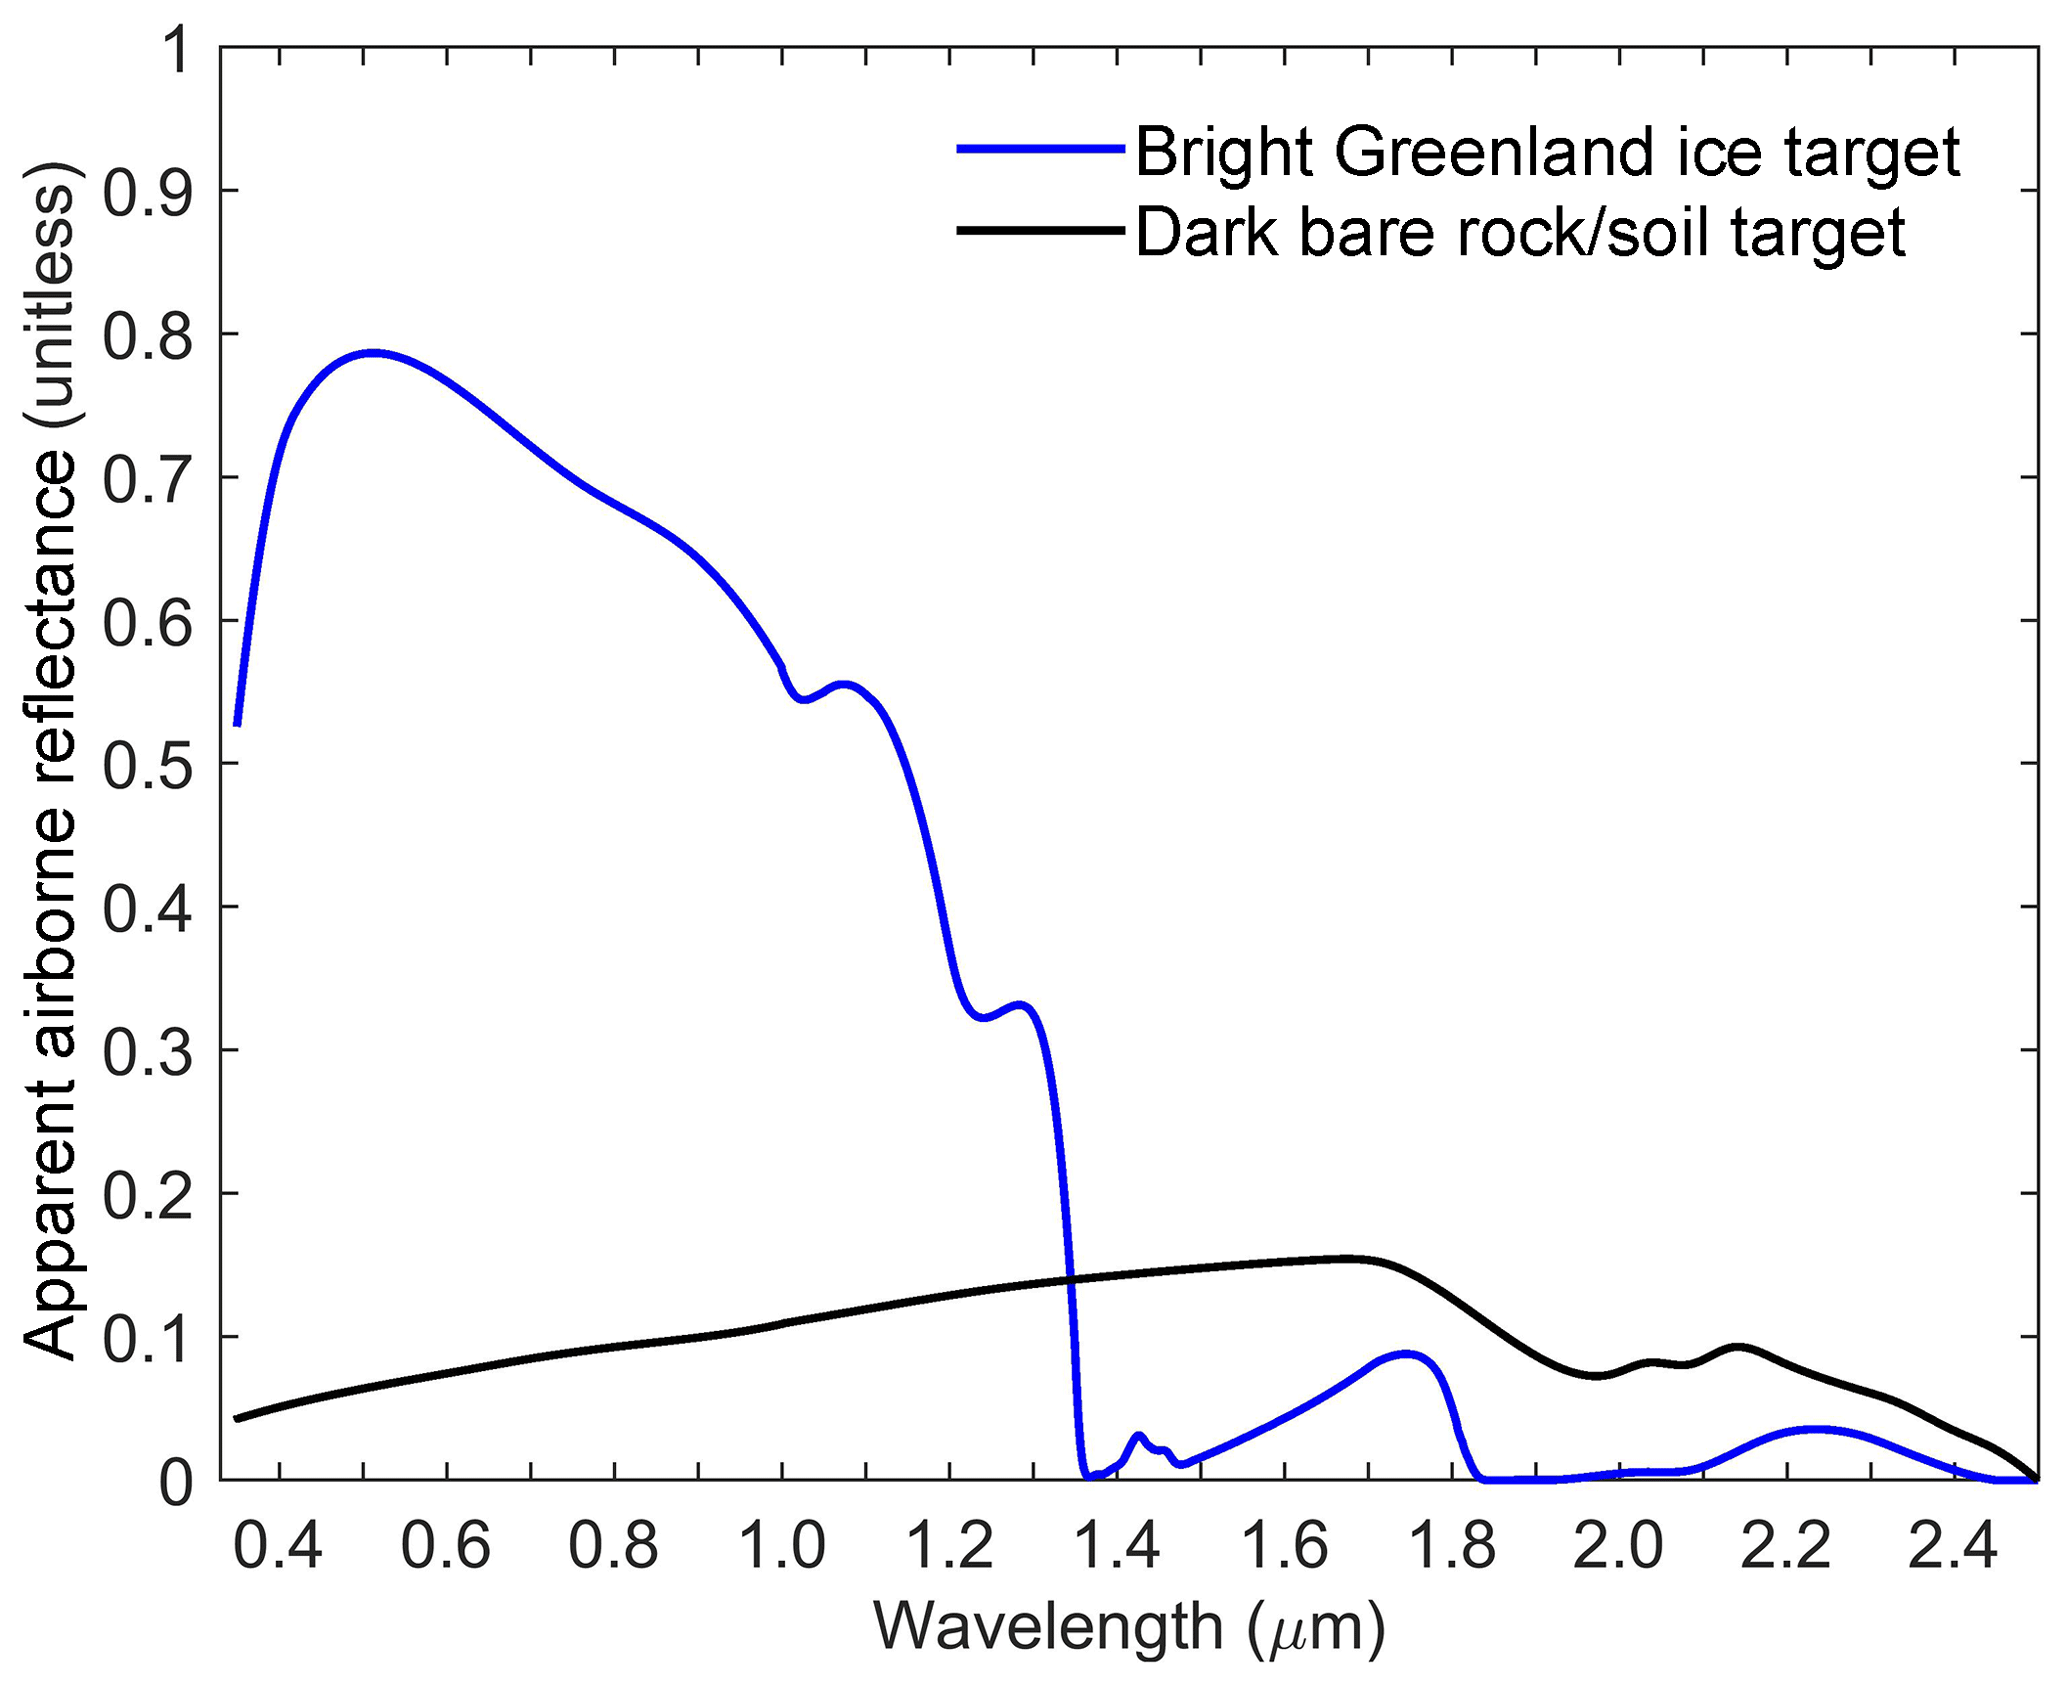
Figure 9Apparent reflectance spectra for bright and dark absolute in-flight targets measured with the nadir-viewing spectrometer.
Airborne spectrometer-measured radiances include atmospheric path radiances due to Rayleigh and aerosol scattering and surface-reflected solar radiances. Because we did not measure ground reflectance, the airborne nadir-viewing radiances for the bare rock/soil and Greenland ice (dark and bright) targets were converted to apparent reflectance (e.g., Tanré et al., 1990; Gao et al., 1993) to compare MODTRAN-predicted radiances with airborne-measured radiances. The definition of apparent reflectance can be described as
where θ0 is the solar zenith angle, ϕ0 the solar azimuth angle, θ the sensor zenith angle, ϕ the sensor azimuth angle, λ wavelength, Lobs the radiance measured at the sensor, F0 the solar flux at the top of the atmosphere when the solar zenith angle is equal to zero, and μ0 the cosine of the solar zenith angle.
Using the formulation of Tanré et al. (1990), the apparent reflectance at the sensor is defined as the reflectivity of the atmosphere and surface system , which can be approximately expressed by
where is the path reflectance, td is downward scattering transmittance, tu is upward scattering transmittance, s is spherical albedo of the atmosphere, and Tg the total gaseous transmittance in the Sun-surface-sensor path. Assumptions made regarding Eq. (4) include Lambertian surfaces and negligible adjacency effects.
The first term in the bracket, , represents the contribution from atmospheric scattering to the measured apparent reflectance. The second term in the bracket, , represents the contribution from surface reflection to the measured apparent reflectance. The term Tg contains the absorption bands of all atmospheric gases affecting the wavelength range from 0.4 to 2.5 µm (i.e., H2O, O3, CO2, O2, CH4, NO2, N2, CO).
The atmospheric scattering and gaseous absorption processes are treated as two independent processes in Eq. (4). The coupling effects are considered small in regions where the atmospheric gaseous absorptions are weak and in regions where the scattering effects are small; therefore, the coupling effects between the two processes are neglected as the scattering and absorption processes occur simultaneously in the real atmosphere.
Solving Eq. (4) for the desired quantity, surface reflectance (ρ), and simplifying the notations for relevant quantities gives
MODTRAN is used to simulate the atmospheric quantities (Tg, , td, tu, s). Assuming a horizontal Lambertian surface, the reflectance, ρ, can then be retrieve from the measured radiance, Lobs, using Eqs. (3) and (5).
4.2 Airborne prediction with MODTRAN
Water vapor and aerosols are the two most important attenuation factors affecting downward and upward atmospheric transmittance of spectral radiance along the directly transmitted path and LOS. The nadir-viewing radiances were compared against MODTRAN6-predicted (Berk et al., 2017) spectral radiances for both the bright and dark targets. Predicting spectral radiance for bright and dark targets along the 29 July flight line required atmospheric aerosol and columnar water vapor measurements from a variety of sources. The northwestern portion of the Greenland ice sheet is quite remote, with sparse ground instrumentation to parameterize MODTRAN, especially towards the Greenland interior. On the coast at the Thule Air Base, there is an AERONET site with a CIMEL maintained by NASA Goddard Space Flight Center. The CIMEL measurements provided spectral aerosol optical depth, aerosol extinction coefficients, and columnar water vapor (Giles et al., 2019) as the source of atmospheric information. We also used carbon dioxide and water vapor measurements from the Atmospheric Infrared Sounder (AIRS) and MODerate resolution Imaging Spectrometer (MODIS) Terra and Aqua instruments.
MODTRAN has four core model components, i.e., (1) a geographical and seasonal atmosphere model, (2) radiation transport of aerosol and clouds, (3) LOS geometry, and (4) spectral range and resolution, that are required to model atmospheric conditions (Berk et al., 2016). The following options were selected: the sub-Arctic summer model atmosphere; correlated-k algorithm to initialize radiation transport at a spectral resolution of 0.1 cm−1; the Kurucz 2005 TOA solar irradiance reference spectrum (Kurucz, 2005); the Navy maritime aerosol model weighted for stronger coastal than continental influence; and meteorological range based on the CIMEL-retrieved aerosol extinction coefficient at 550 nm. Other parameters included ozone and carbon dioxide concentrations along with columnar water vapor content (g cm−2) from atmospheric measurements on 29 July described above.
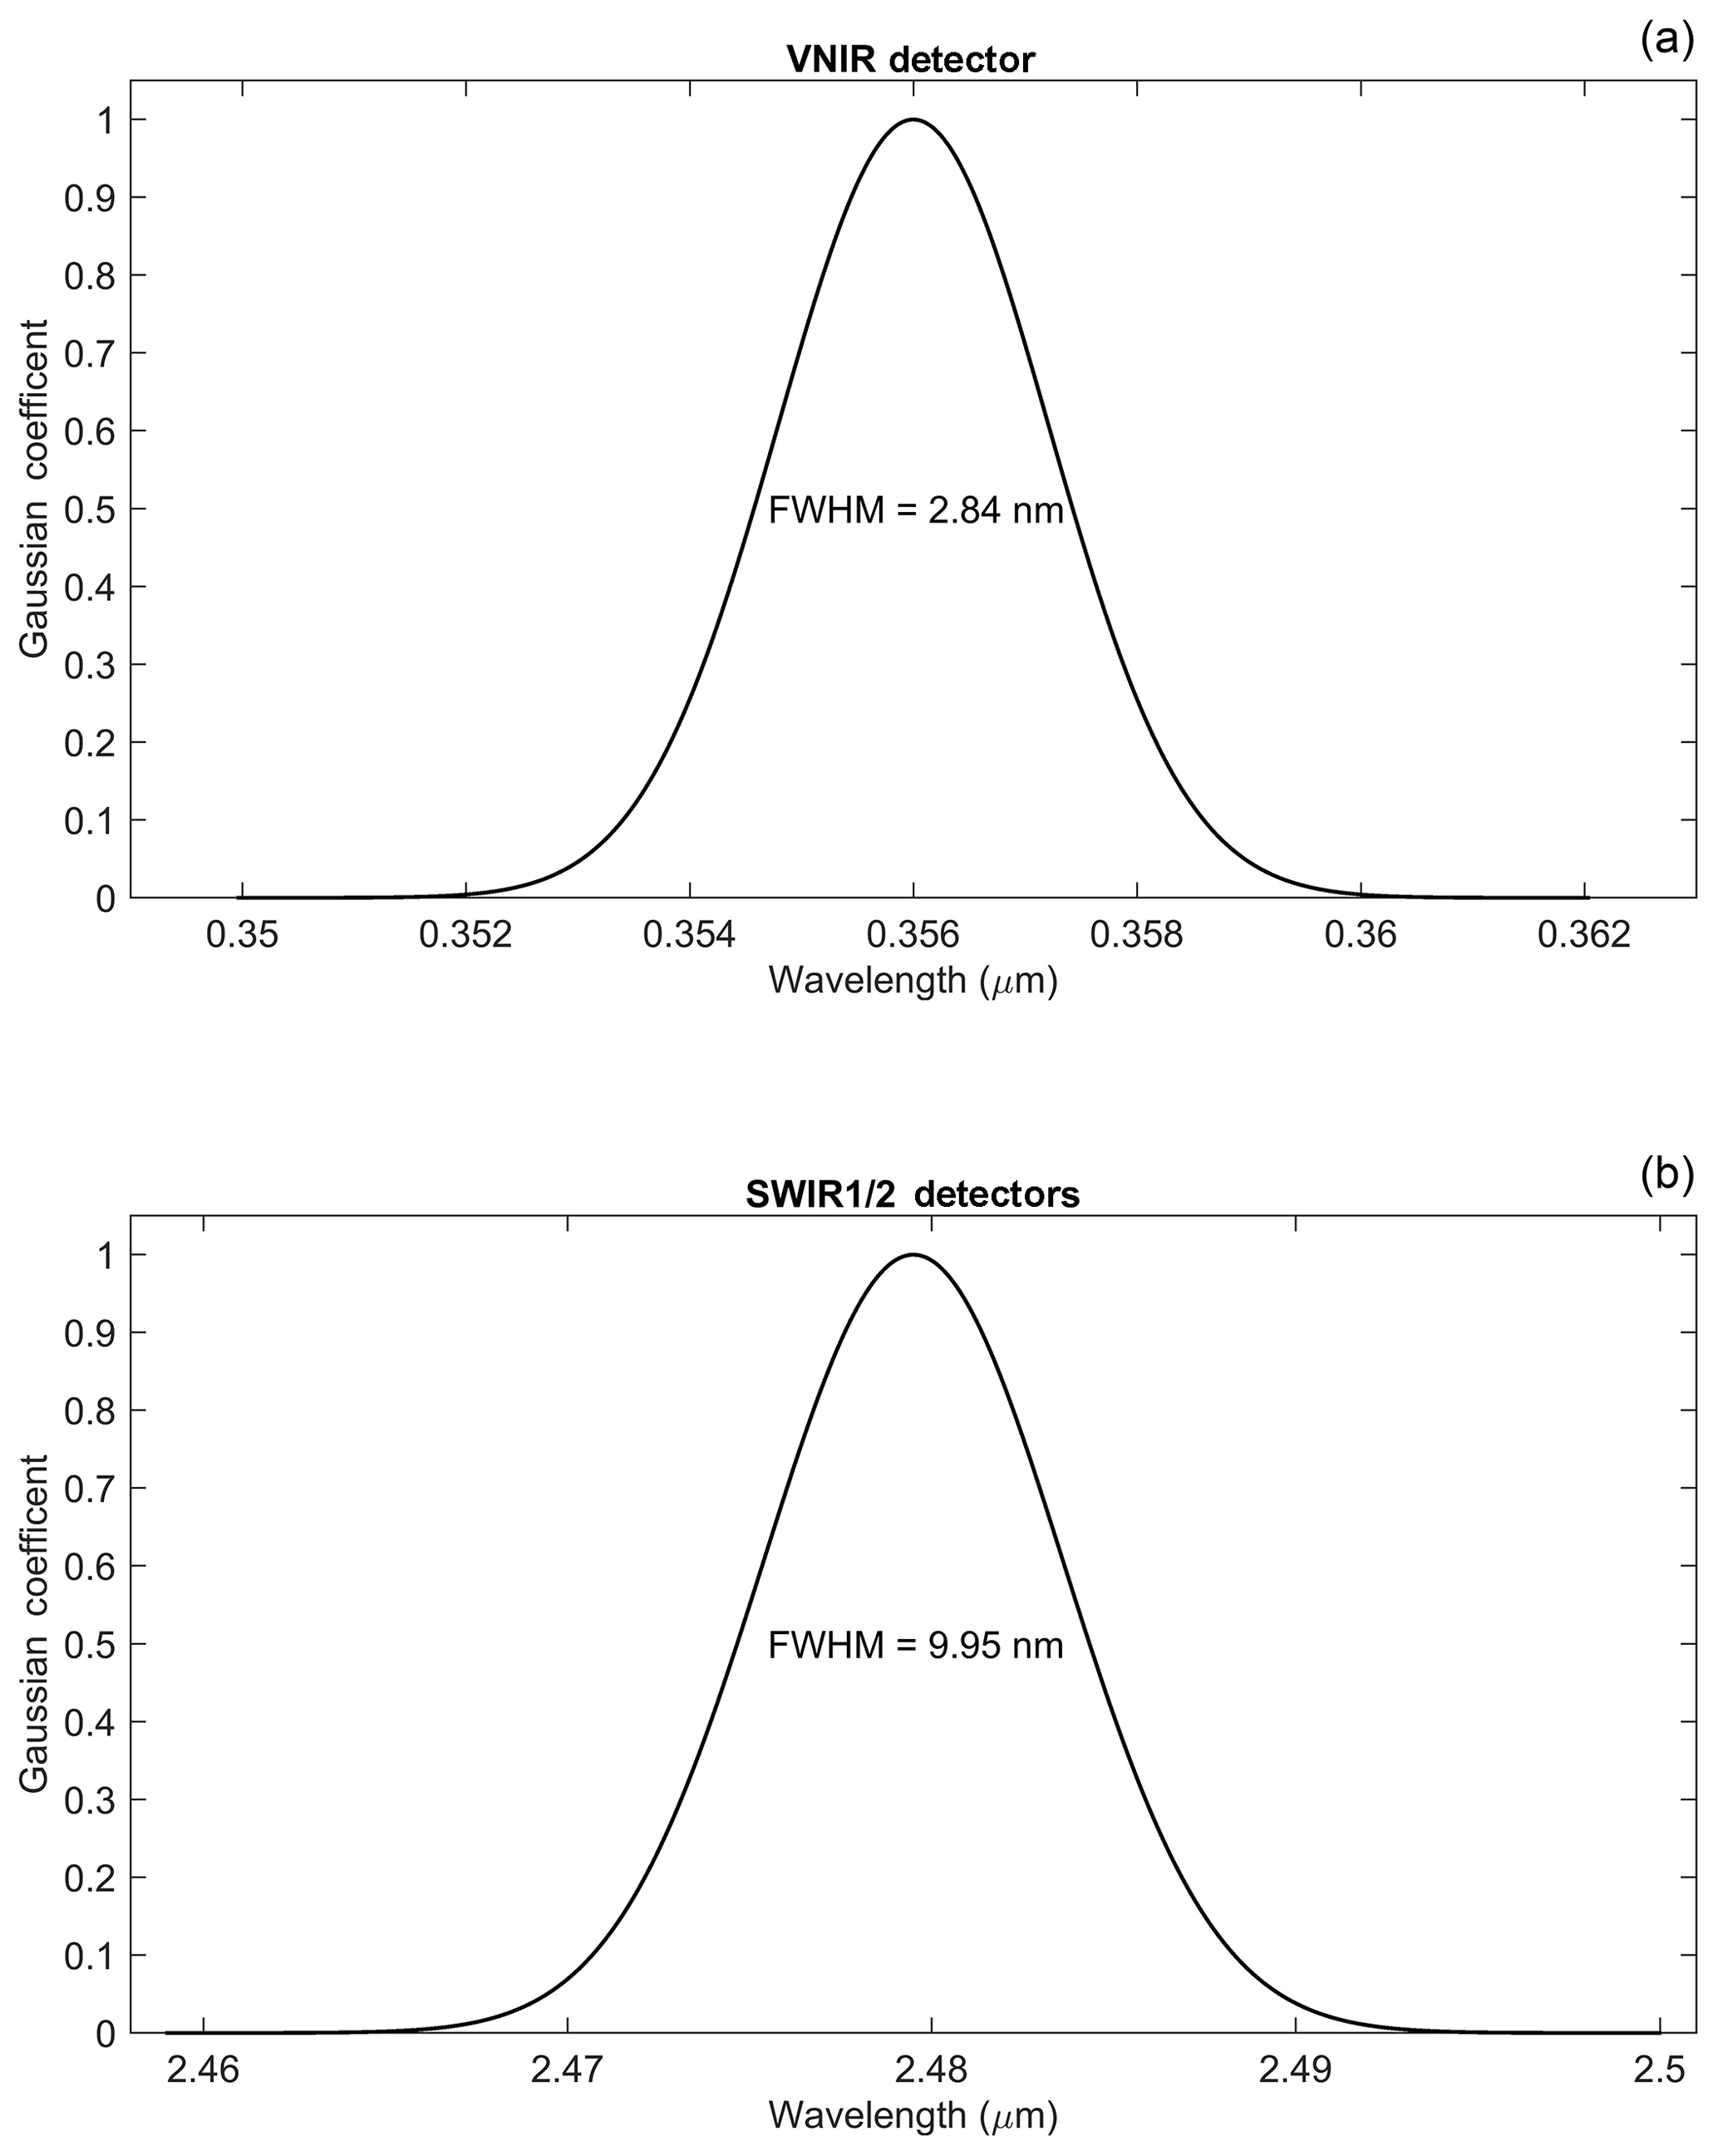
Figure 10Gaussian spectral response functions for the airborne nadir-viewing spectrometer. Panel (a) shows the VNIR detector spectral response, and panel (b) shows the SWIR1/2 detector spectral response. Note: FWHM refers to full-width half-maximum response to a filter value of 1.0 on the center wavelength.
The LOS geometry was determined using the UC-12B aircraft flight altitude (based on the navigation file), an observer zenith angle of 180∘, and the ground altitude was extracted from the Greenland Ice Mapping Project (GIMP) digital elevation model (Howat et al., 2014). The Julian day and in-flight start time for data acquisition was used to initialize the solar illumination geometry parameters that included observer latitude and solar zenith angle. Finally, we convolved MODTRAN output radiances into VSWIR channels using a Gaussian full-width half-maximum (FWHM) filter centered on 1 nm wavelengths from 0.35 to 2.5 µm. The spectral response functions for the nadir-viewing spectrometer VNIR and SWIR detectors are shown in Fig. 10a and b.
4.2.1 Dark and bright target predictions
MODTRAN assumes the atmosphere to be horizontally homogeneous – at some point the assumption starts to break down. Regarding water vapor, we can quantify that breaking point with the geodetic distance from the Thule Air Base CIMEL to the dark and bright targets. Each target presented a different set of challenges during the comparison process. Along Greenland's ice margin, glacial moraines and bedrock are composed of rock and soil mixtures commonly lacking surface homogeneity. Fortunately, the dark target location is only 54.22 km from the Thule Air Base CIMEL. The water vapor and aerosol retrievals coincident with the time of the airborne measurement acquisition were used to parameterize MODTRAN. However, the atmospheric conditions prevailing over the bright Greenland ice target were even more challenging to model due to the geodetic distance of 150.35 km from the Thule Air Base CIMEL. While the CIMEL-retrieved aerosol loadings appeared to be indicative of the Greenland ice target, the water vapor was not. Additionally, for satellite image data, it can be difficult to partition aerosol scattering from bright snow and ice surface scattering because atmospheric aerosols have relatively low reflectance by comparison (Istomina et al., 2011), and therefore we did not attempt to use satellite aerosol retrievals.
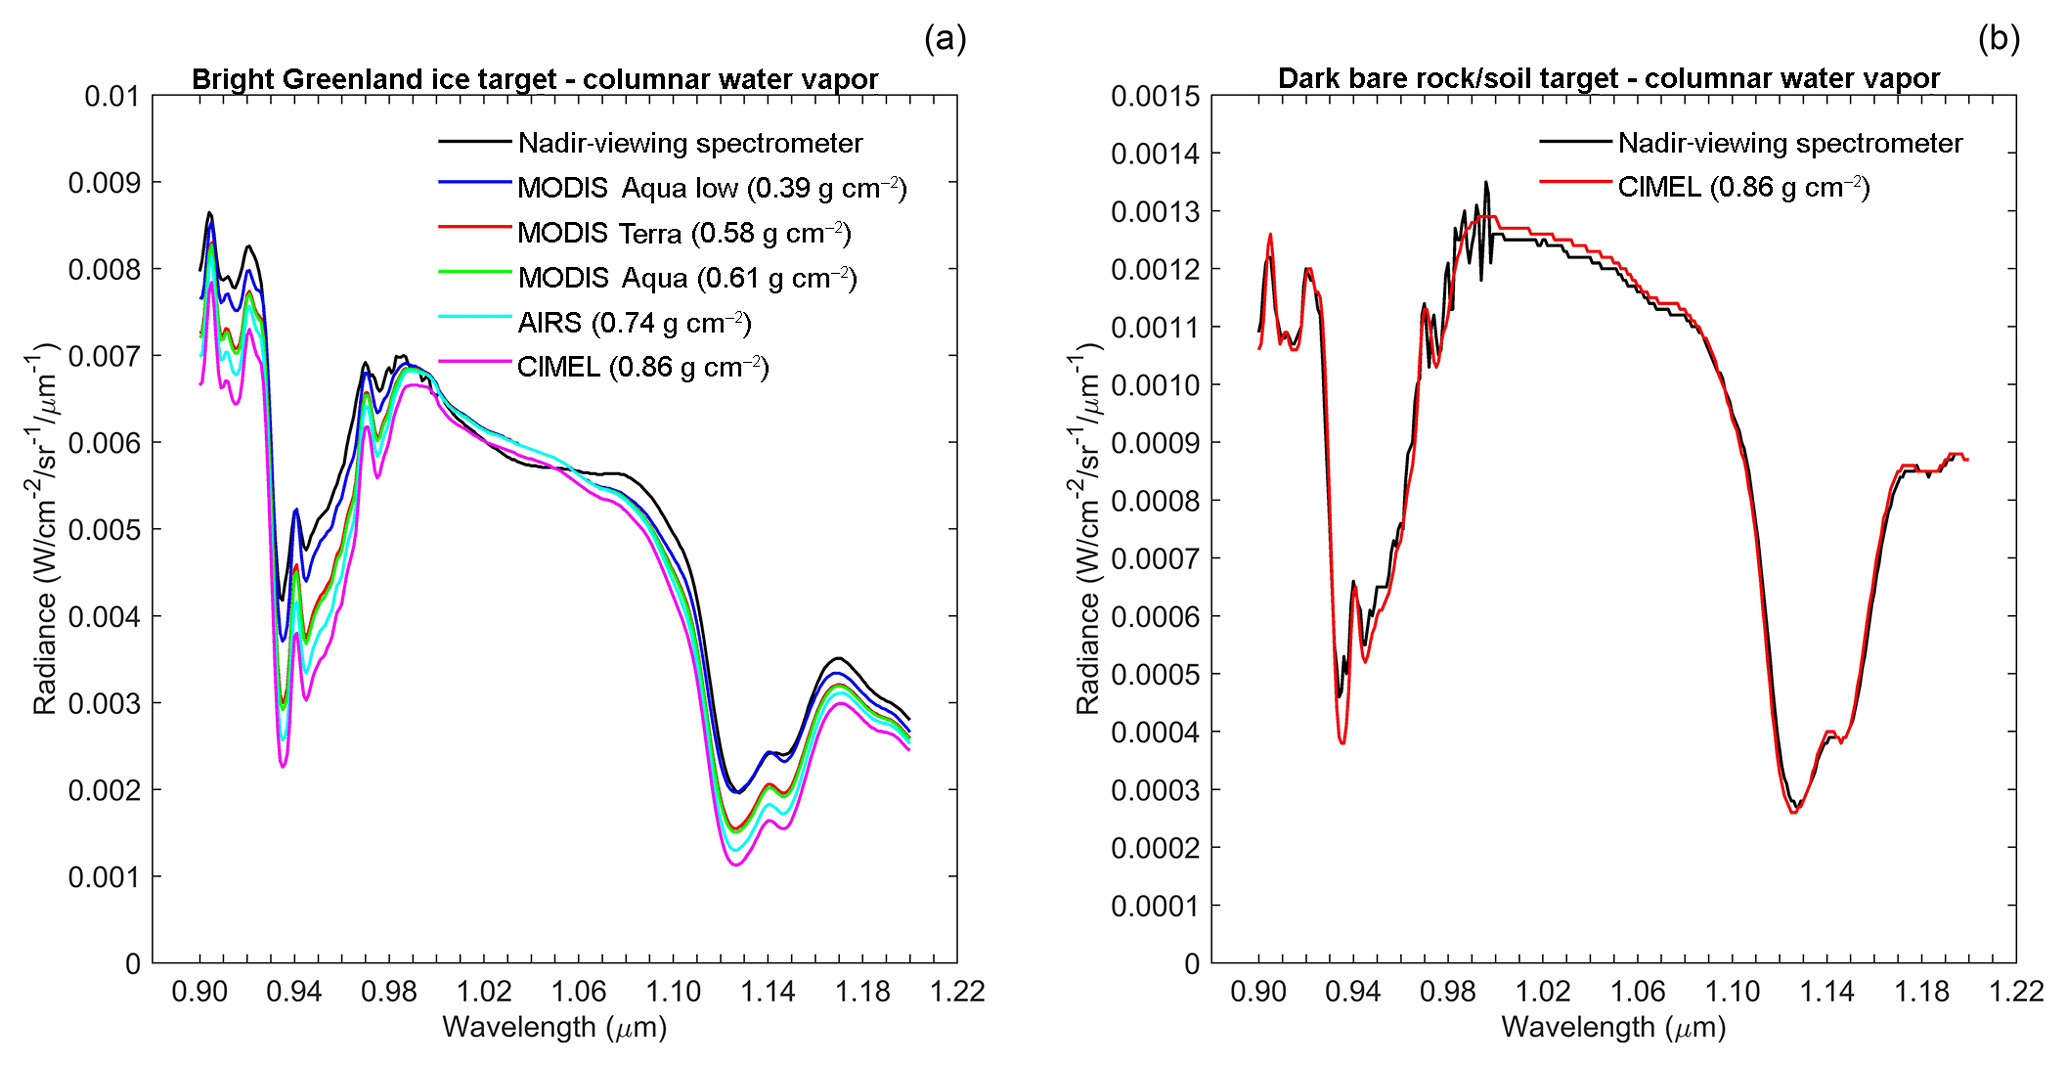
Figure 11The airborne nadir-viewing spectrometer's measurement sensitivities to columnar water vapor for bright Greenland ice (a) and dark bare rock/soil (b) targets. A variety of satellite columnar water vapor data products were evaluated for the bright Greenland ice target due to the remoteness of the flight line segment and its proximity to the Thule Air Base CIMEL.
We did not consider applying a nonlinear least-squares spectral fitting algorithm of the water vapor absorption features of the VSWIR bright Greenland ice radiance spectra as we are in the process of validating the nadir-viewing spectrometer; instead, we chose well-calibrated satellite sensor retrievals for a scientific, transparent approach. Water vapor is an initial atmospheric condition that can be spatially variable across coastal to inland gradients, particularly during the Greenland summertime melt period when surface-to-atmosphere latent heat fluxes are strong. Thus, we opted to exploit a range of water vapor measurements (Table 1) over the Greenland interior to evaluate MODTRAN's sensitivities to critical absorption features (Fig. 11a and b). At 67∘ N, the spatial footprint of the 1∘ × 1∘ gridded daily MODIS L3 Aqua water vapor product (Platnick et al., 2015) is approximately 44 km spatial resolution. The “low mean” appeared to best fit our data.
Table 1Input satellite and AERONET water vapor products for MODTRAN predictions of bright Greenland ice for the nadir-viewing spectrometer.
* Refers to distance to bright Greenland ice target.
4.2.2 Landsat 8 OLI prediction with MODTRAN
As described earlier in the paper, Landsat 8 OLI's orbital tracks converge towards the poles, and for northwestern Greenland, that results in considerable imaging swath side lap during the sunlit summer season. On 29 July, a coincident image for World Reference System-2 (WRS-2) Path 26 Row 05 was acquired over the Greenland ice sheet interior during the UC-12B flight. We identified the overlapping region where the bright Greenland ice target flight segment intersected with the Landsat 8 OLI Collection 1 image data (available at https://doi.org/10.5066/F71835S6). Using the UC-12B Applanix data and aircraft navigation information, we identified the closest Landsat 8 OLI pixels that corresponded to the nadir-viewing VSWIR spectra along the bright Greenland ice flight segment. Using the bright Greenland ice MODTRAN parameterization for the nadir-viewing spectrometer, we predicted TOA spectral radiance for Landsat 8 OLI using solar illumination geometry, swath LOS imaging geometry, relative spectral response functions, and the bright Greenland ice apparent reflectance spectra. There was no discernible cloud contamination for Landsat 8 OLI pixels. We rescaled Landsat 8 OLI digital counts to TOA spectral radiance using radiance-based calibration coefficients contained within the image metadata. Finally, we compared MODTRAN-predicted Landsat 8 OLI TOA spectral radiances for the bright Greenland ice target with observed Landsat 8 OLI TOA spectral radiances. The comparison was based on the average radiance from 24 nadir-viewing VSWIR spectra and 24 Landsat 8 OLI pixels.
A method to radiometrically calibrate, deploy, and assess measurement performance of a non-imaging airborne spectrometer to measure the Greenland ice sheet surface has been presented. This NIST-traceable calibration included traceable laboratory, in-flight, and field procedures to fully characterize spectrometers, their foreoptics, and their measurements. The nadir-viewing spectrometer's stability was determined to be within 2 % using a NIST-traceable source, and well within the targeted 5 % spectral radiance requirement for the airborne mission. The point spread function and IFOV footprint of the nadir-viewing spectrometer's 1∘ foreoptic was measured to enable direct comparison to SIMPL's green and NIR polarimetric lidar measurements, AVIRIS-NG's VSWIR measurements, and other on-orbit satellite measurements such as Landsat, for example. The 29 July in-flight radiometric calibration experiment over Greenland bright and dark targets proved to be invaluable for optimizing the nadir-viewing spectrometer's measurement capabilities during the airborne campaign, as well as evaluating in-flight measurement performance across the full solar spectrum dynamic range using MODTRAN and atmospheric measurements from both ground and satellite instruments. The main objective of measuring spectral irradiance with a zenith-viewing spectrometer and remote cosine receptor optic was to characterize in-flight sky conditions. Even though the zenith-mounted OrangeCan on top of the UC-12B aircraft limited the hemispherical IFOV, these measurements are useful for screening out cloud-contaminated flight data that will expedite identification of clear-sky VSWIR data that can be used to address airborne mission objectives.
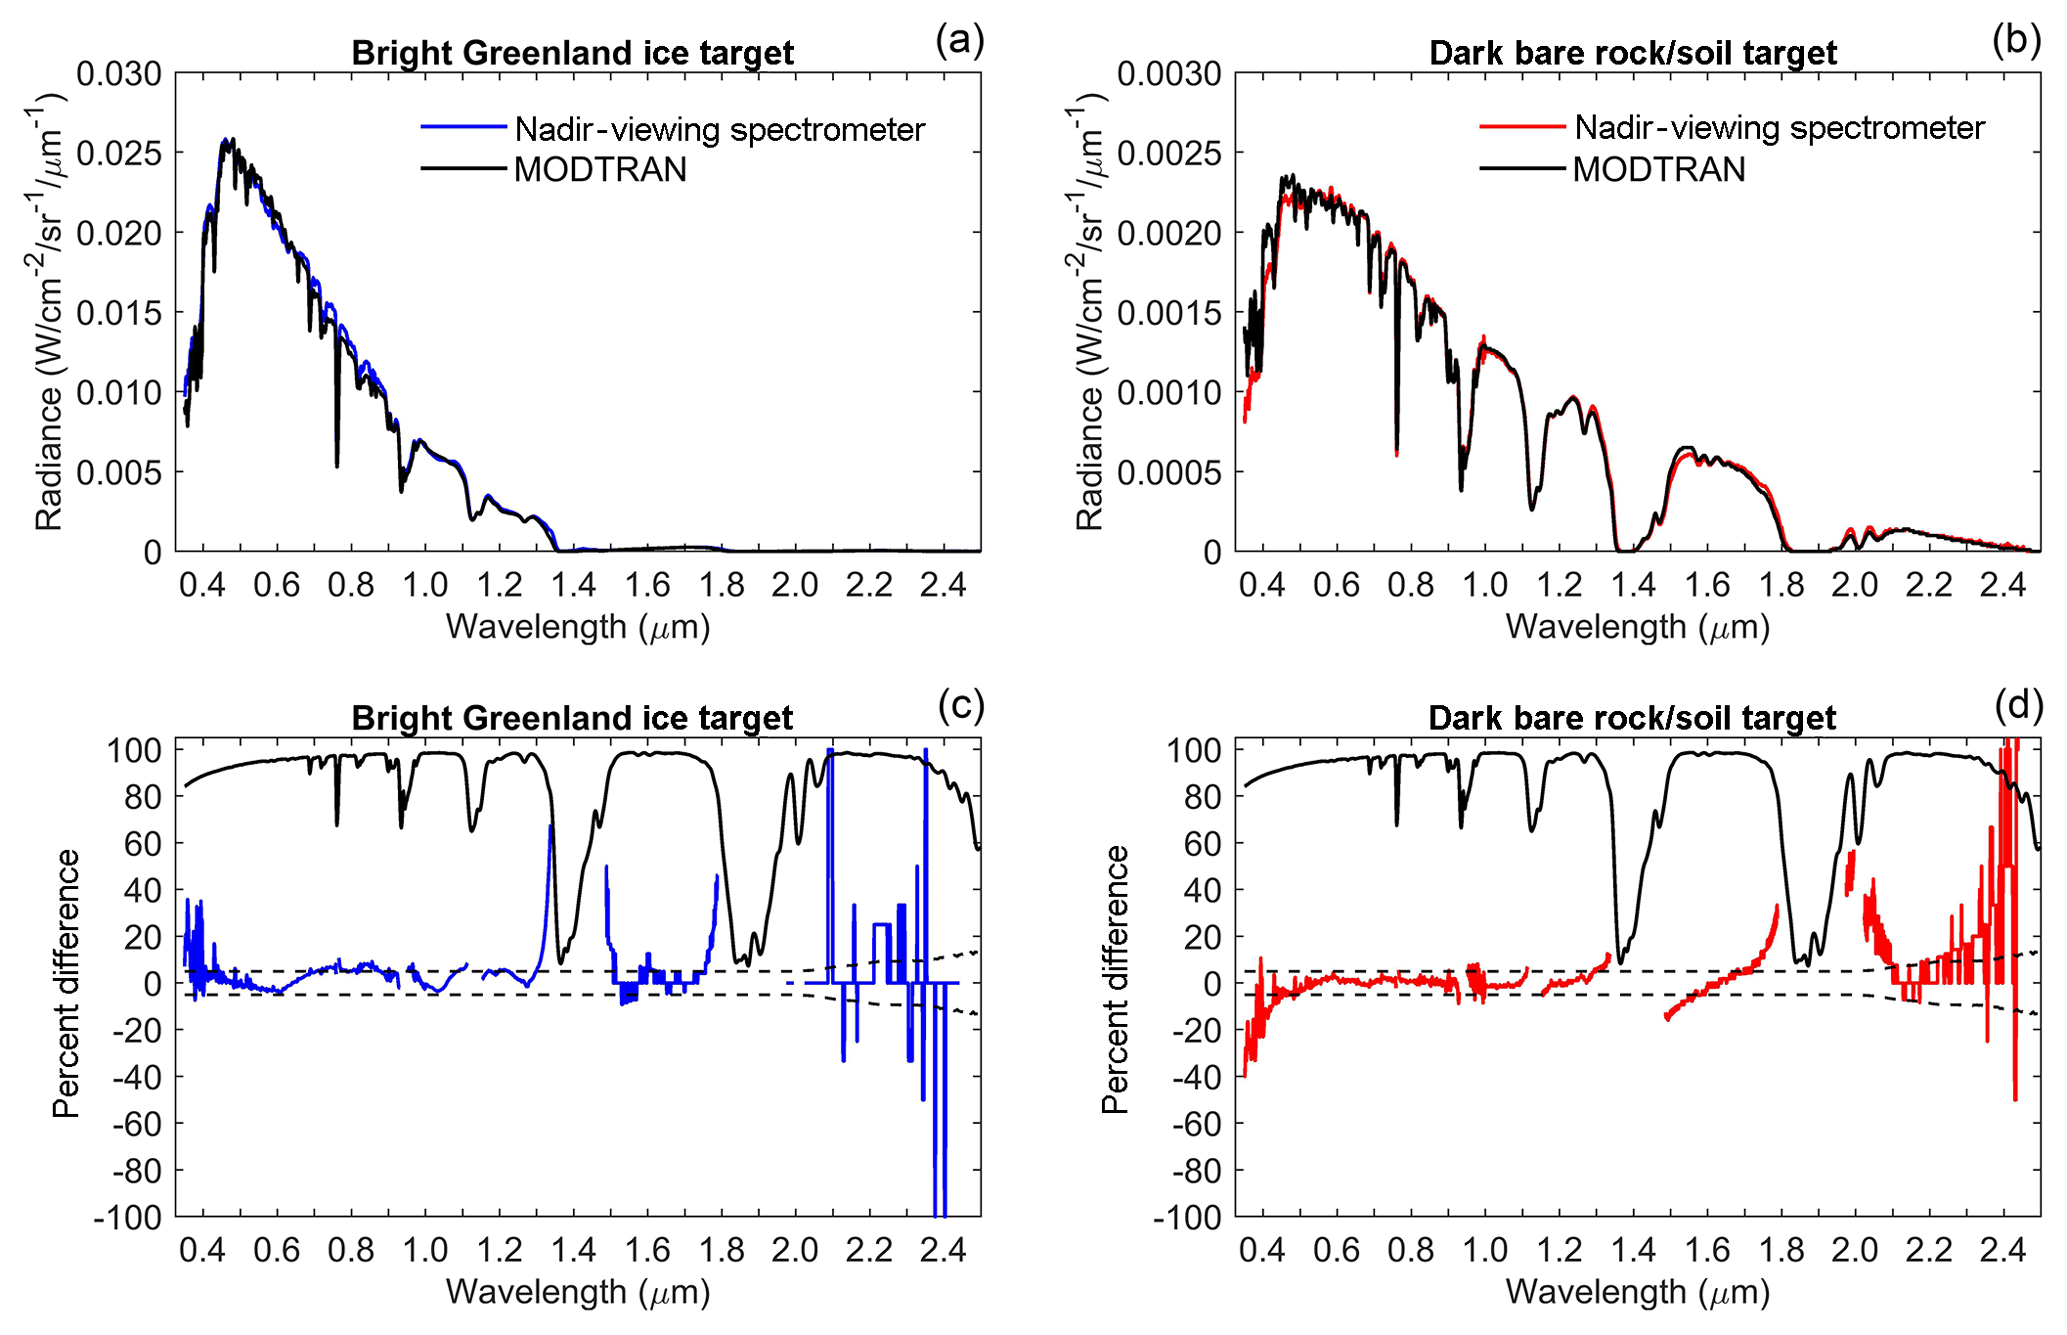
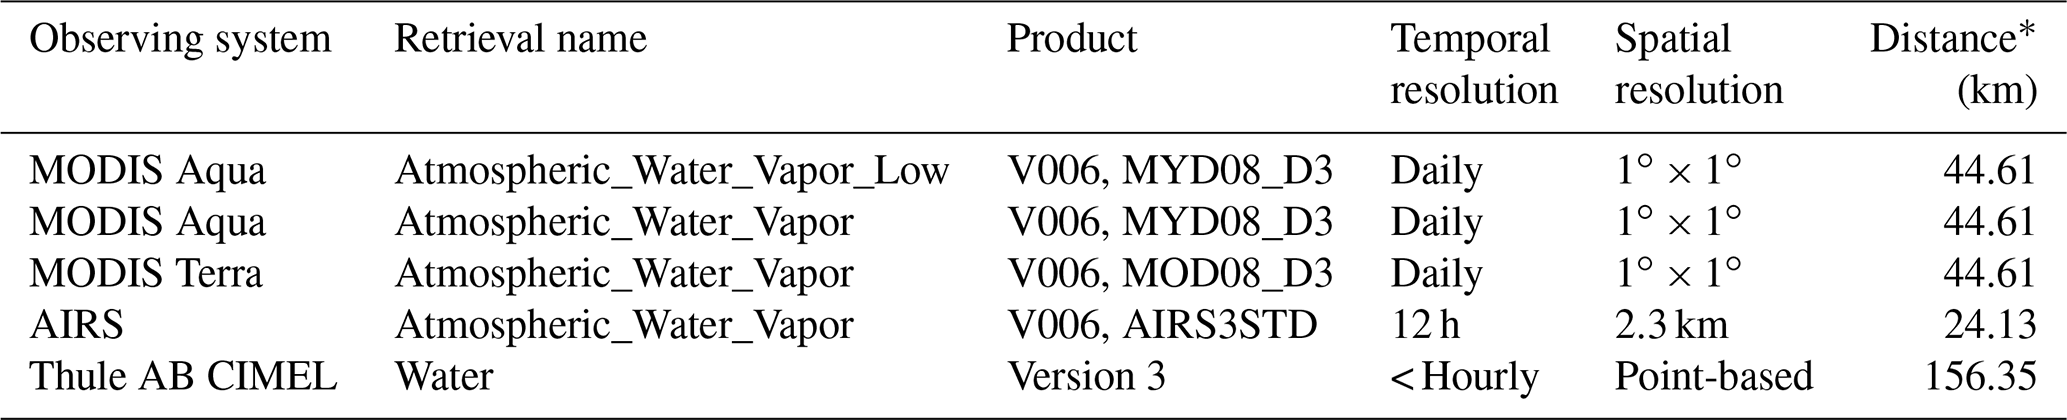
Figure 12The airborne nadir-viewing spectrometer's measurement performance for bright and dark targets as compared against MODTRAN. Panel (a) shows a comparison between predicted and measured radiance for bright Greenland ice. Panel (b) shows a predicted verse measured comparison for dark bare rock/soil. Panel (c) describes the percent difference, i.e., percent difference = (measured–predicted)∕predicted, between predicted and measured nadir-viewing spectrometer radiance for bright Greenland ice (blue line). The percent difference for the dark bare rock/soil target is shown in panel (c). The dotted and top thick black lines on panels (c) and (d) signify the measurement requirement and predicted atmospheric transmittance, respectively. The nadir-viewing spectrometer's measurement performance beyond 2.0 µm is subject to noise created by UC-12B BK-7 window transmission, and low to relatively low SWIR radiances for both bright and dark targets.
With no ground calibration/validation in situ measurements on the Greenland ice sheet, or ship campaign on the open ocean, we had to develop an alternative approach to compare the nadir-viewing spectrometer's measurement performance against an atmospheric radiative transfer model. By identifying homogenous bright Greenland ice and dark bare rock/soil flight segments on 29 July, we were able to assess airborne measurement performance with MODTRAN over both low- and high-radiance targets (e.g., Moran et al., 1995) under similar atmospheric and solar illumination conditions. We used apparent airborne reflectance spectra for both bright and dark targets to predict spectral radiance for the nadir-viewing spectrometer (Fig. 12a and b), and then compared predictions with measured spectral radiance (e.g., Green, 2001; Slater et al., 1987; Thome, 2001; Vane et al., 1993). Our MODTRAN predictions indicate that the nadir-viewing spectrometer VNIR and SWIR1 detectors measured bright Greenland ice with an average uncertainty between 2.5 % and 4.7 % for VSWIR wavelengths with greater than 80 % atmospheric transmittance (Fig. 12c). For dark bare rock/soil, the nadir-viewing spectrometer VNIR and SWIR1 detectors' measurement uncertainty was between 0.6 % and 1.2 % on average (Fig. 12d). As stated earlier, UC-12B optical window transmission beyond 2.0 µm was more uncertain and was evident when evaluating the SWIR2 detector data. For bright Greenland ice and dark bare rock/soil, the nadir-viewing spectrometer's measurement uncertainty for the SWIR2 detector was on average 4.3 % and 19.7 %, respectively (Fig. 12c and d).
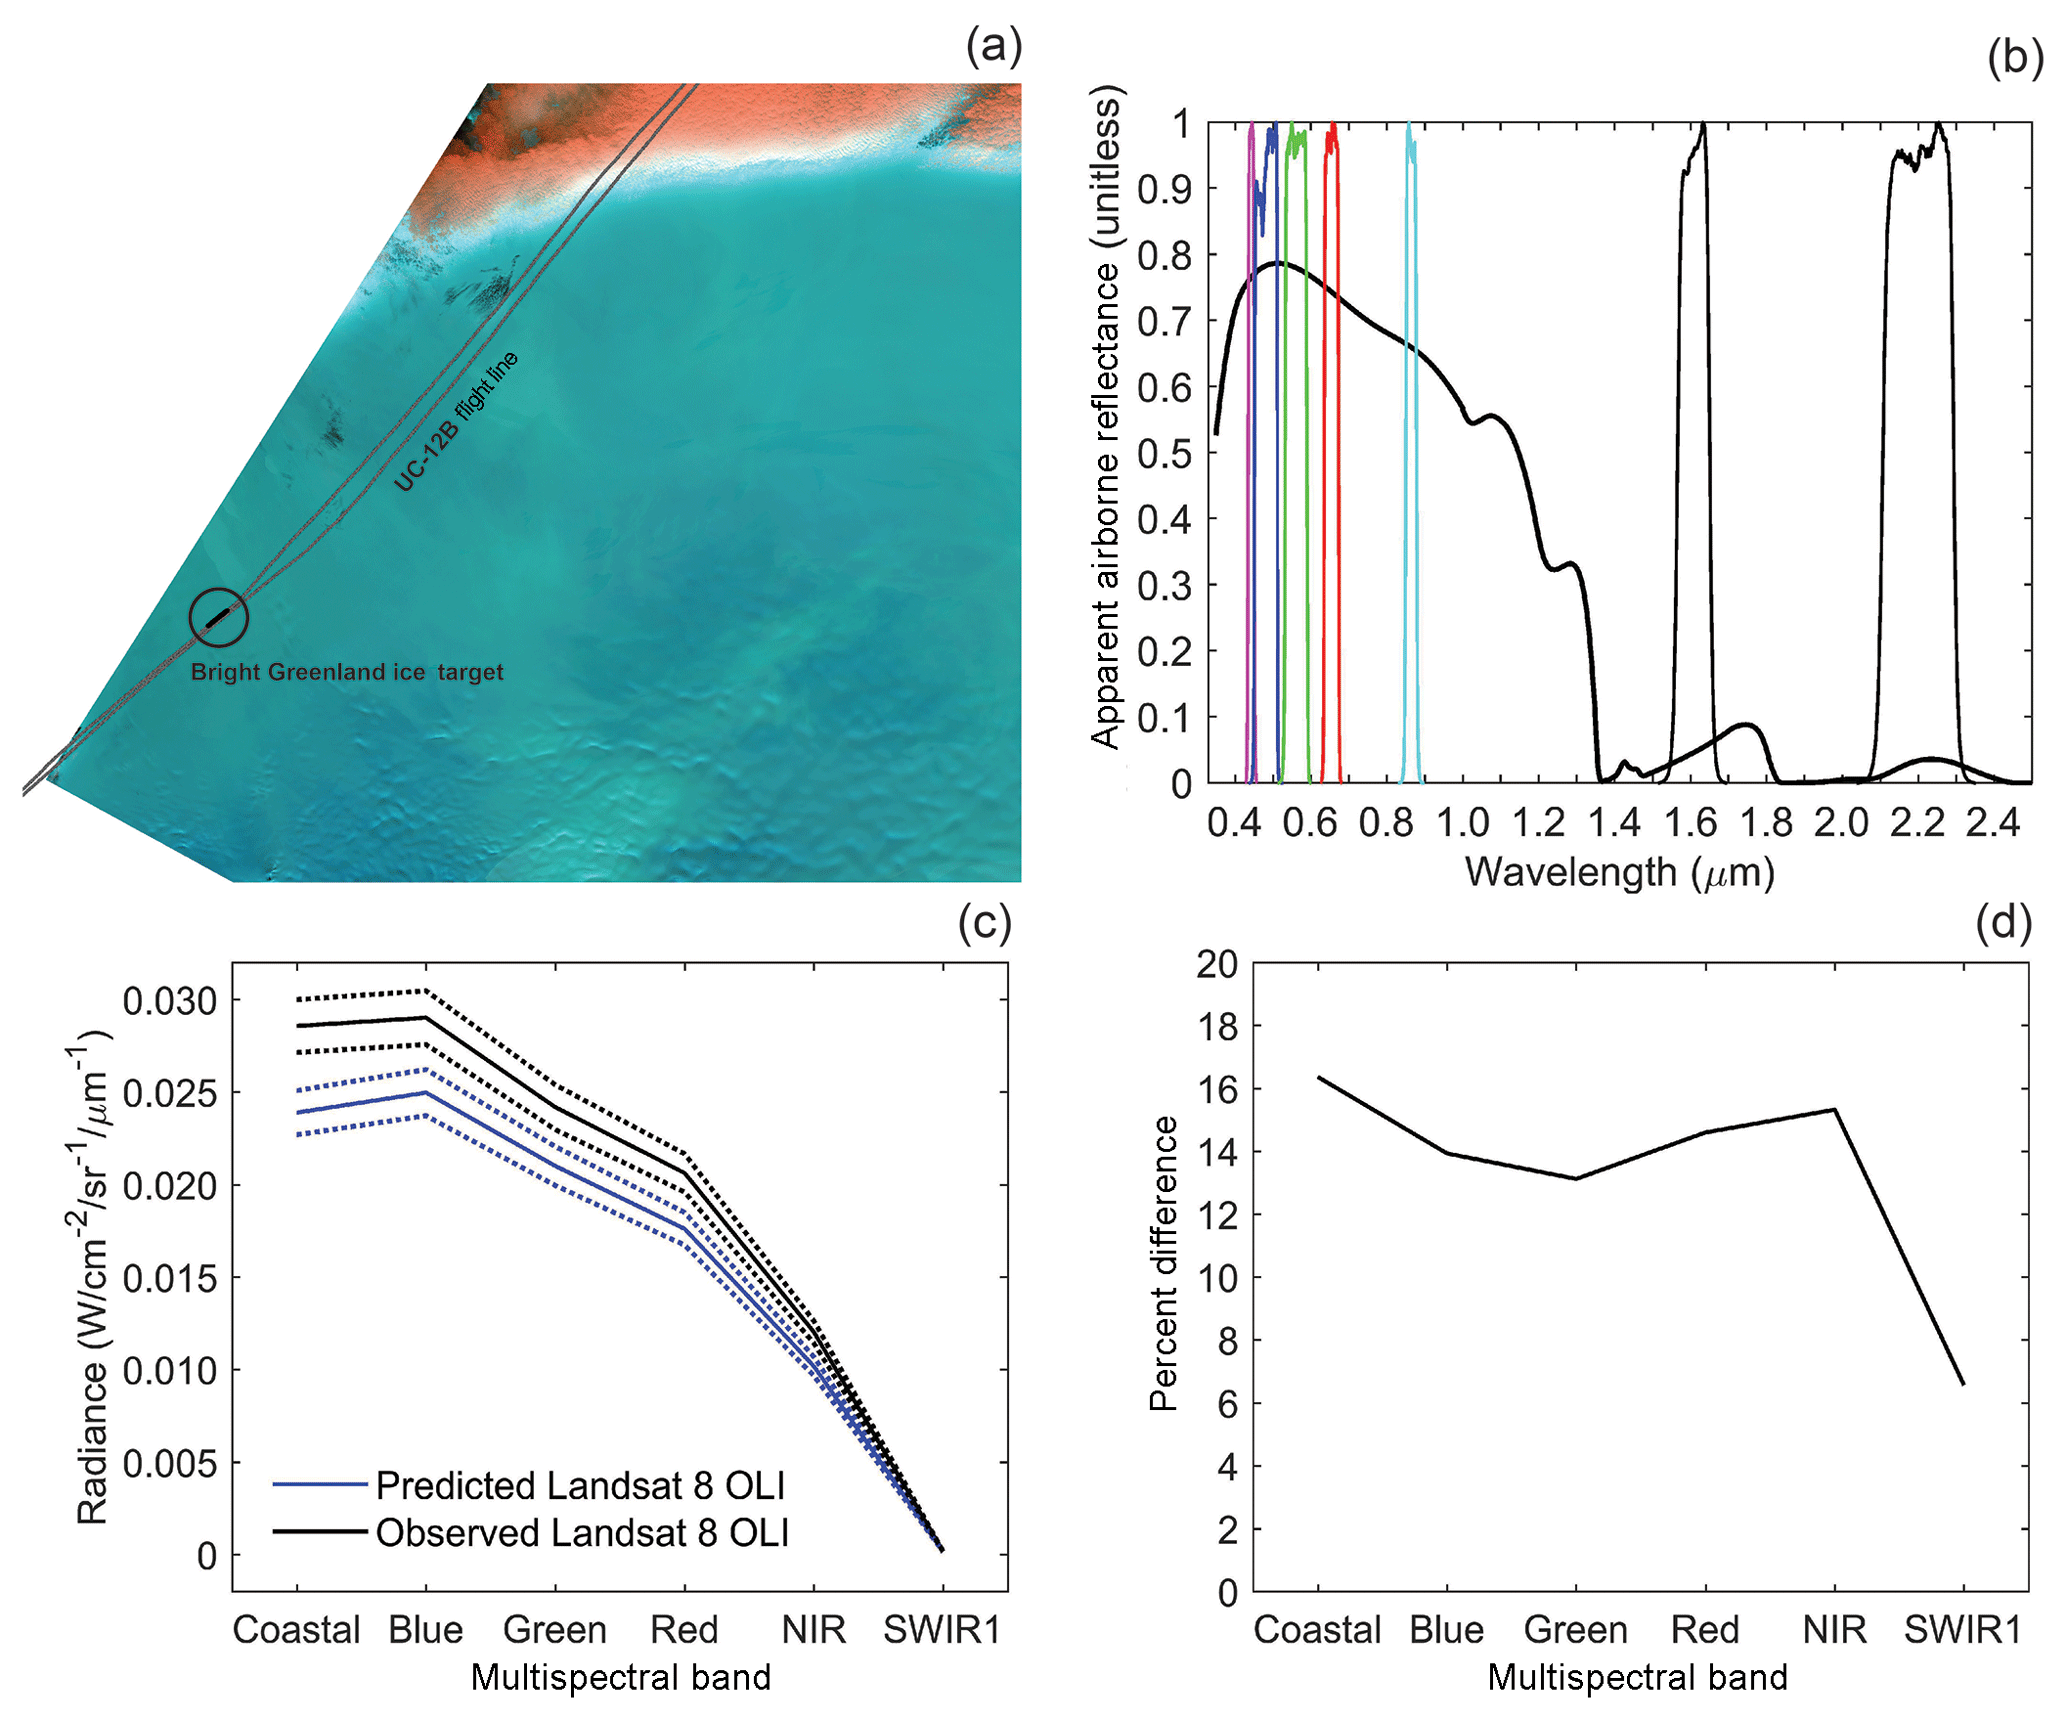
Figure 13MODTRAN-predicted radiance for coincident Landsat 8 OLI imaging of the bright Greenland ice target using the nadir-viewing spectrometer apparent reflectance spectrum. Panel (a) shows the Landsat 8 OLI image acquisition on 29 July 2015 with the bright Greenland ice target (black line within the black circle) and the UC-12B flight line (grey line). Panel (b) shows Landsat 8 OLI's visible, NIR, and SWIR1/2 relative spectral response functions plotted over the bright Greenland ice target apparent reflectance spectrum. Panel (c) is the comparison of convolved predicted and measured Landsat 8 OLI radiance for the bright Greenland ice target using the average of 24 airborne Greenland ice spectra and the average of 24 closest Landsat pixels. The dotted lines indicate the within 5 % measurement requirement for both Landsat 8 OLI (absolute calibration) and the airborne nadir-viewing spectrometer (relative calibration). Panel (d) is the percent difference (percent difference = (measured–predicted)∕measured) between predicted and measured Landsat 8 OLI radiance. Note: radiance for Landsat 8 OLI was not predicted for the SWIR2 relative spectral response function based on UC-12B BK-7 window transmission uncertainty beyond 2.0 µm.
MODTRAN predictions for assessing airborne spectrometer measurement performance are, in part, dependent on the quality of the surface reflectance spectra and availability of atmospheric measurements near the target measurement performance location. Fortunately, for this airborne campaign, baseline atmospheric measurements were accessible via the Thule Air Base CIMEL as part of AERONET. It is clear that spatial proximity to a CIMEL matters in terms of in-flight atmospheric aerosols and columnar water vapor concentrations because we observed less measurement uncertainty for the closer dark bare rock/soil target when compared to the bright Greenland ice target much further away. Interestingly, we found that the nadir-viewing VSWIR spectra for bright Greenland ice in the interior were much more sensitive to columnar water vapor concentrations than aerosols. This result caused us to evaluate the nadir-viewing spectrometer's measurement sensitivities to a variety of input satellite atmospheric water vapor products. Narrowing in on 0.94 and 1.13 µm water vapor absorption lines uncovered the spread in satellite-retrieved daily atmospheric water vapor over the Greenland interior. We were able to identify that the MODIS Aqua low mean atmospheric water vapor product is most suitable to ingest when processing the UC-12B science flight data for MODTRAN-based atmospheric compensation. The daily MODIS Aqua overpass times generally align well with UC-12B flight times during airborne science flights. The MODIS Aqua low mean atmospheric water vapor retrievals are designed to partition columnar water vapor concentrations between the surface and 680 mbar (see details at https://modis-atmosphere.gsfc.nasa.gov/documentation/collection-6.1, last access: 12 February 2018), which is within the atmosphere boundary layer.
As an additional airborne spectrometer performance comparison over the Greenland ice sheet, we used a Landsat 8 OLI coincident image acquired within ∼3 min of the UC-12B bright Greenland ice target flight segment (Fig. 13a). We predicted Landsat 8 OLI TOA spectral radiance using MODTRAN with the following parameters: solar illumination geometry, OLI viewing geometry, the same atmospheric inputs used for the airborne nadir-viewing spectrometer assessment, OLI relative spectral response functions (Fig. 13b), and the apparent airborne reflectance spectrum for bright Greenland ice (Fig. 13b). By comparing MODTRAN-predicted and measured Landsat 8 OLI TOA spectral radiance (Fig. 13c), we found that Landsat 8 OLI is measuring between 6 % and 16 % more TOA spectral radiance from the Greenland ice sheet with VNIR and SWIR1 spectral bands than was predicted with the nadir-viewing spectrometer's apparent airborne reflectance spectrum (Fig. 13d). It is important to note that Landsat 8 OLI's pixel-level LOS imaging is highly accurate over Greenland due to spacecraft geolocation (Storey et al., 2014), and that we accounted for cross-track imaging effects in MODTRAN using NIR spectral band LOS geometry.
Landsat 8 OLI is a well-characterized instrument on both pre- and post-launch timescales with exceptional on-orbit performance since 2013 (Markham et al., 2014; Morfitt et al., 2015). Routine onboard diffuser, lunar, and vicarious calibrations, over midlatitude pseudo-invariant calibration sites in particular, are conducted to track OLI's instrument performance and degradation while in orbit (Helder et al., 2010, 2013; Mishra et al., 2014). We speculate that differences between predicted and measured Landsat 8 OLI TOA spectral radiance over the Greenland ice sheet presented in this paper are possibly a byproduct of both techniques used to derive OLI gain coefficients over midlatitude desert sites with stable dry atmospheres, and VNIR differences between the Kurucz and Chance Kurucz (ChKur) reference TOA solar irradiance spectrums (Chance and Spurr, 1997; Kurucz, 2005) used for airborne spectrometer and Landsat 8 OLI radiometric calibration/validation. Nevertheless, more investigation is required, and looking ahead, Greenland and Antarctic ice sheets need to receive expanded calibration/validation consideration when characterizing and monitoring on-orbit satellite instrument performance, as has been attempted for other Earth observing systems (Cao et al., 2010; Six et al., 2004). The airborne method of calibration/validation presented here, including the rigorous laboratory NIST-traceable radiometric calibration, is put forth as an option to augment polar ice sheet calibration/validation.
Landsat 8 OLI's capabilities to measure Greenland and Antarctic ice sheets has advanced since 2013 thanks to revisions in its higher latitude and polar image frequency (Fahnestock et al., 2016). While Landsat 8 OLI measurements are providing new insights and applications for polar ice sheet science, specifically superglacial lake and ice velocity mapping (Alley et al., 2018; Gardner et al., 2018; Pope et al., 2016), results from this study suggest that the Greenland ice sheet surface may be less reflective than what is currently being measured by Landsat 8 OLI at TOA. Thus, Landsat 8 OLI reflectance-based interpretations of ice sheet surface properties and change should remain cautious until additional measurement validation is undertaken. We anticipate that airborne VSWIR measurements acquired over Arctic and Antarctic domains, as demonstrated during this airborne campaign, offer a cost-effective approach to validate medium-resolution atmospherically corrected products from Landsat class instruments well above ±60∘ latitude while also supporting algorithm development to derive higher-level information products on cryospheric surface properties and conditions.
It has been suggested that optical remote sensing instruments must be able to measure the ice sheet surface at an uncertainty of 2 % or less to distinguish between the presence of light-absorbing constituents and other factors controlling VSWIR ice sheet albedo (Warren, 2013). For airborne and on-orbit satellite instruments, this stringent of a measurement requirement demands careful instrument radiometric calibration and characterization and could remain difficult to achieve for polar atmospheres because of atmospheric measurement uncertainty and the ability to compensate for such effects. One strategy for future optical satellite instrument design is to address aerosol and columnar water vapor effects along with VSWIR surface retrieval uncertainties over polar regions by requiring an expanded set of measurements in spectral regions where atmospheric scattering and absorption dominate the VSWIR remote sensing signal. Requiring these atmospheric measurements would offer the capability to retrieve atmospheric parameters directly from the remote sensing measurement itself, rather than ingesting ancillary data from other sources with different spatial resolutions and temporal sampling frequencies.
This initial effort to describe and document the traceable laboratory radiometric calibration and in-flight measurement performance of the non-imaging airborne spectrometer configuration flown as part of the SIMPL/AVIRIS-NG 2015 Greenland campaign indicates that the nadir-viewing spectrometer was able to achieve its targeted VSWIR measurement requirement for the airborne mission when compared against MODTRAN. Compared to instruments with a spectral resolution greater than or equal to 10 nm, the 1 nm spectral resolution of these airborne VSWIR snow and ice measurements may more effectively isolate the exact wavelength center where green light depth of penetration and surface contaminants interact, and where the depth, area, and asymmetry of near-infrared liquid water absorption can be inverted into a measure of surface grain size while also detecting the presence of liquid water. As a result, airborne VSWIR data products from UC-12B science flights are of sufficient radiometric traceability and quality to evaluate green laser pulse penetration into Greenland snow and ice, and to compare with other VSWIR remote sensing measurements acquired during the airborne mission time frame.
Raw, unprocessed airborne VSWIR data from the 29 July 2015 calibration flight are available upon request.
CJC was the non-imaging airborne VSWIR spectrometer principal scientist. He was responsible for the calibration, acquisition, processing, analysis, and interpretation of the airborne VSWIR measurements, and analysis and interpretation of the Landsat 8 OLI data. He is the US Geological Survey Landsat deputy project scientist and drafted this paper. JvdB led the MODTRAN radiative transfer modeling and AERONET analysis, and contributed to manuscript text. KMB was the airborne mission principal lead and project manager, is the NASA ICESat-2 calibration/validation lead, and contributed to the manuscript text. MGH was the lead optical engineer for laboratory calibration of the VSWIR spectrometer. JWC was the lead optical engineer for the laboratory characterization of VSWIR spectrometer optics. DJH was the SIMPL principal investigator and contributed to manuscript text. JJB was the senior optical calibration scientist and provided direction to the airborne VSWIR spectrometer principal scientist. PWD was the SIMPL instrument scientist and directed the airborne VSWIR spectrometer integration with SIMPL. CSC was the lead aircraft integration engineer. TAN is the NASA ICESat-2 deputy project scientist, and TM is the NASA ICESat-2 project scientist. TM and TAN provided direction and support for the airborne mission from the NASA ICESat-2 project office.
The authors declare that they have no conflict of interest.
The ICESat-2 Project Science Office supported the SIMPL/AVIRIS-NG 2015 Greenland campaign and Christopher Crawford's radiometric calibration work as part of a NASA Cooperative Agreement to the University of Maryland's Earth System Science Interdisciplinary Center. The MODTRAN and Landsat 8 components of this work were supported by a U.S. Geological Survey science support services contract to the Arctic Slope Regional Corporation (ASRC) Federal InuTeq as part of Christopher Crawford's USGS-NASA Landsat Science Team research.
We would like to extend our grateful thanks for the generous contributions of the following people: NASA Goddard Space Flight Center Code 610 personnel for providing the VSWIR spectrometers, instrument calibration, and optics laboratory support resources; the SIMPL and AVIRIS-NG instrument teams and the pilots and ground crews of UC-12B and Dynamic Aviation; Brent Holben and the AERONET team at Goddard Space Flight Center for providing and processing the Thule Air Base CIMEL measurements; Rose Dominguez at NASA Ames Research Center for processing the UC-12B Applanix flight data; Robert O. Green at the Jet Propulsion Laboratory for his recommendation to characterize the 1∘ foreoptic point spread function for the nadir-viewing spectrometer. We thank the anonymous reviewers for their helpful and constructive comments during manuscript preparation. Any use of trade, firm, or product names is for descriptive purposes only and does not imply endorsement by the U.S. Government.
This paper was edited by Alexander Kokhanovsky and reviewed by three anonymous referees.
Abdalati, W. and Zwally, H. J.: The ICESat-2 laser altimetry mission, Proc. IEEE, 98, 735–751, 2010.
Abshire, J. B., Sun, X., Riris, H., Sirota, J. M., McGarry, J. F., Palm, S., Yi, D., and Liiva, P.: Geoscience laser altimeter system (GLAS) on the ICESat mission: on-orbit measurement performance, Geophys. Res. Lett., 32, https://doi.org/10.1029/2005GL024028, 2005.
Alley, K. E., Scambos, T. A., Anderson, R. S., Rajaram, H., Pope, A., and Haran, T. M.: Continent-wide estimates of Antarctic strain rates from Landsat 8-derived velocity grids, J. Glaciol., 64, 321–332, https://doi.org/10.1017/jog.2018.23, 2018.
Aoki, T., Fukabori, M., Hachikubo, A., Tachibana, Y., and Nishio, F.: Effects of snow physical parameters on spectral albedo and bidirectional reflectance of snow surface, J. Geophys. Res.-Atmos., 105, 10219–10236, https://doi.org/10.1029/1999jd901122, 2000.
Berk, A., Anderson, G. P., Acharya, P. K., Bernstein, L. S., Muratov, L., Lee, J., Fox, M., Adler-Golden, S. M., Chetwynd, J. H., Hoke, M. L., Lockwood, R. B., Gardner, J. A., Cooley, T. W., Borel, C. C., and Lewis, P. E.: MODTRAN 5: a reformulated atmospheric band model with auxiliary species and practical multiple scattering options: update, SPIE Proceedings, 5806, 662–667, 2005.
Bohren, C. F. and Barkstrom, B. R.: Theory of optical-properties of snow, J. Geophys. Res., 79, 4527–4535, https://doi.org/10.1029/JC079i030p04527, 1974.
Brunt, K. M., Neumann, T. A., and Markus, T.: SIMPL/AVIRIS-NG Greenland 2015 Flight Report, 17977, 2015.
Cao, C. Y., Uprety, S., Xiong, J., Wu, A. S., Jing, P., Smith, D., Chander, G., Fox, N., and Ungar, S.: Establishing the Antarctic Dome C community reference standard site towards consistent measurements from Earth observation satellites, Can. J. Remote Sens., 36, 498–513, 2010.
Chance, K. V. and Spurr, R. J. D.: Ring effect studies: Rayleigh scattering, including molecular parameters for rotational Raman scattering, and the Fraunhofer spectrum, Appl. Opt., 36, 5224–5230, https://doi.org/10.1364/ao.36.005224, 1997.
Choi, H. and Bindschadler, R.: Cloud detection in Landsat imagery of ice sheets using shadow matching technique and automatic normalized difference snow index threshold value decision, Remote Sens. Environ., 91, 237–242, https://doi.org/10.1016/j.rse.2004.03.007, 2004.
Chrien, T. G., Green, R. O., and Eastwood, M. L.: Accuracy of the spectral and radiometric laboratory calibration of the Airborne Visible/Infrared Imaging Spectrometer, Proc. Imaging Spectroscopy of the Terrestrial Environment, SPIE, 1298, 37–49, 1990.
Clark, R. N. and Roush, T. L.: Reflectance spectroscopy: Quantitative analysis techniques for remote sensing applications, J. Geophys. Res.-Sol. Ea., 89, 6329–6340, https://doi.org/10.1029/JB089iB07p06329, 1984.
Dabney, P., Harding, D., Abshire, J., Huss, T., Jodor, G., Machan, R., Marzouk, J., Rush, K., Seas, A., Shuman, C. A., Sun, X., Valett, S., Vasilyev, A., Yu, A., and Zheng, Y.: The slope imaging multi-polarization photon-counting lidar: an advanced technology airborne laser altimeter, Proceedings of the International Geoscience Remote Sensing Symposium, 25–30 July 2010, Honolulu, HI, USA, 2010.
Dang, C., Fu, Q., and Warren, S. G.: Effect of snow grain shape on snow albedo, J. Atmos. Sci., 73, 3573–3583, https://doi.org/10.1175/jas-d-15-0276.1, 2016.
Dozier, J. and Painter, T. H.: Multispectral and hyperspectral remote sensing of alpine snow properties, Annu. Rev. Earth Planet. Sci., 32, 465–494, https://doi.org/10.1146/annurev.earth.32.101802.120404, 2004.
Dozier, J., Green, R. O., Nolin, A. W., and Painter, T. H.: Interpretation of snow properties from imaging spectrometry, Remote Sens. Environ., 113, 25–37, https://doi.org/10.1016/j.rse.2007.07.029, 2009.
Fahnestock, M., Scambos, T., Moon, T., Gardner, A., Haran, T., and Klinger, M.: Rapid large-area mapping of ice flow using Landsat 8, Remote Sens. Environ., 185, 84–94, https://doi.org/10.1016/j.rse.2015.11.023, 2016.
Gao, B. C., Heidebrecht, K. B., and Goetz, A. F. H.: Airbone imaging spectrometry derivation of scaled surface reflectances from AVIRIS data, Remote Sens. Environ., 44, 165–178, https://doi.org/10.1016/0034-4257(93)90014-O, 1993.
Gardner, A. S. and Sharp, M. J.: A review of snow and ice albedo and the development of a new physically based broadband albedo parameterization, J. Geophys. Res.-Earth Surf., 115, 15, https://doi.org/10.1029/2009jf001444, 2010.
Gardner, A. S., Moholdt, G., Scambos, T., Fahnstock, M., Ligtenberg, S., van den Broeke, M., and Nilsson, J.: Increased West Antarctic and unchanged East Antarctic ice discharge over the last 7 years, The Cryosphere, 12, 521–547, https://doi.org/10.5194/tc-12-521-2018, 2018.
Giles, D. M., Sinyuk, A., Sorokin, M. G., Schafer, J. S., Smirnov, A., Slutsker, I., Eck, T. F., Holben, B. N., Lewis, J. R., Campbell, J. R., Welton, E. J., Korkin, S. V., and Lyapustin, A. I.: Advancements in the Aerosol Robotic Network (AERONET) Version 3 database – automated near-real-time quality control algorithm with improved cloud screening for Sun photometer aerosol optical depth (AOD) measurements, Atmos. Meas. Tech., 12, 169–209, https://doi.org/10.5194/amt-12-169-2019, 2019.
Green, R. O.: Spectral calibration requirement for Earth-looking imaging spectrometers in the solar-reflected spectrum, Appl. Opt., 37, 683–690, https://doi.org/10.1364/ao.37.000683, 1998.
Green, R. O.: Atmospheric water vapor sensitivity and compensation requirement for Earth-looking imaging spectrometers in the solar-reflected spectrum, J. Geophys. Res.-Atmos., 106, 17443–17452, https://doi.org/10.1029/2000jd900799, 2001.
Green, R. O., Conel, J. E., Helmlinger, M., van den Bosch, J., Chovit, C., and Chrien, T.: Inflight calibration of AVIRIS in 1992 and 1993, Fourth Annual JPL Airborne Geoscience Workshop, Pasadena, California, Publication 93-26, 1993.
Green, R. O., Eastwood, M. L., Sarture, C. M., Chrien, T. G., Aronsson, M., Chippendale, B. J., Faust, J. A., Pavri, B. E., Chovit, C. J., Solis, M., Olah, M. R., and Williams, O.: Imaging spectroscopy and the airborne visible/Infrared imaging spectrometer (AVIRIS), Remote Sens. Environ., 65, 227–248, https://doi.org/10.1016/S0034-4257(98)00064-9, 1998.
Green, R. O., Painter, T. H., Roberts, D. A., and Dozier, J.: Measuring the expressed abundance of the three phases of water with an imaging spectrometer over melting snow, Water Resour. Res., 42, https://doi.org/10.1029/2005WR004509, 2006.
Hamlin, L., Green, R., Mouroulis, P., Eastwood, M., McCubbin, I., Wilson, D., Randall, D., Dudik, M., and Paine, C.: Imaging spectrometer science measurements for terrestrial ecology: AVIRIS and the Next Generation AVIRIS characteristics and development status, NASA Earth Science Technology Conference, 22 June 2010, Pasadena, CA, 2010.
Harding, D., Dabney, P., Valett, S., Yu, A., Vasilyev, A., and Kelly, A.: Airborne polarimetric, two-color laser altimeter measurements of lake ice cover: a pathfinder for NASA's ICESat-2 spaceflight mission, Proceedings of the International Geoscience Remote Sensing Symposium, Vancover, Canada, 24–29 July 2011, Vancouver, Canada, 2011.
Helder, D. L., Basnet, B., and Morstad, D. L.: Optimized identification of worldwide radiometric pseudo-invariant calibration sites, Can. J. Remote Sens., 36, 527–539, 2010.
Helder, D., Thome, K. J., Mishra, N., Chander, G., Xiong, X. X., Angal, A., and Choi, T.: Absolute Radiometric Calibration of Landsat Using a Pseudo Invariant Calibration Site, IEEE T. Geosci. Remote, 51, 1360–1369, https://doi.org/10.1109/tgrs.2013.2243738, 2013.
Holben, B. N., Eck, T. F., Slutsker, I., Tanre, D., Buis, J. P., Setzer, A., Vermote, E., Reagan, J. A., Kaufman, Y. J., Nakajima, T., Lavenu, F., Jankowiak, I., and Smirnov, A.: AERONET – A federated instrument network and data archive for aerosol characterization, Remote Sens. Environ., 66, 1–16, https://doi.org/10.1016/s0034-4257(98)00031-5, 1998.
Howat, I. M., Negrete, A., and Smith, B. E.: The Greenland Ice Mapping Project (GIMP) land classification and surface elevation data sets, The Cryosphere, 8, 1509–1518, https://doi.org/10.5194/tc-8-1509-2014, 2014.
Hudson, S. R. and Warren, S. G.: An explanation for the effect of clouds over snow on the top-of-atmosphere bidirectional reflectance, J. Geophys. Res.-Atmos., 112, 11, https://doi.org/10.1029/2007jd008541, 2007.
Hudson, S. R., Warren, S. G., Brandt, R. E., Grenfell, T. C., and Six, D.: Spectral bidirectional reflectance of Antarctic snow: Measurements and parameterization, J. Geophys. Res.-Atmos., 111, 19, https://doi.org/10.1029/2006jd007290, 2006.
Istomina, L. G., von Hoyningen-Huene, W., Kokhanovsky, A. A., Schultz, E., and Burrows, J. P.: Remote sensing of aerosols over snow using infrared AATSR observations, Atmos. Meas. Tech., 4, 1133–1145, https://doi.org/10.5194/amt-4-1133-2011, 2011.
King, M. D., Menzel, W. P., Grant, P. S., Myers, J. S., Arnold, G. T., Platnick, S. E., Gumley, L. E., Tsay, S.-C., Moeller, C. C., Fitzgerald, M., Brown, K. S., and Osterwisch, F. G.: Airborne scanning spectrometer for remote sensing of cloud, aerosol, water vapor, and surface properties, J. Atmos. Ocean. Tech., 13, 777–794, https://doi.org/10.1175/1520-0426(1996)013<0777:ASSFRS>2.0.CO;2, 1996.
Kokhanovsky, A. A. and Zege, E. P.: Scattering optics of snow, Appl. Opt., 43, 1589–1602, https://doi.org/10.1364/ao.43.001589, 2004.
Kurucz, R. L.: New atlases for solar flux, irradiance, central intensity, and limb intensity, Memorie della Società Astronomica Italiana Supplement, 8, 189, 2005.
Leshkevich, G. A. and Deering, D. W.: Diurnal patterns of the bi-directional reflectance of fresh-water ice, Ann. Glaciol., 14, 153–157, 1990.
Libois, Q., Picard, G., France, J. L., Arnaud, L., Dumont, M., Carmagnola, C. M., and King, M. D.: Influence of grain shape on light penetration in snow, The Cryosphere, 7, 1803–1818, https://doi.org/10.5194/tc-7-1803-2013, 2013.
Libois, Q., Picard, G., Dumont, M., Arnaud, L., Sergent, C., Pougatch, E., Sudul, M., and Vial, D.: Experimental determination of the absorption enhancement parameter of snow, J. Glaciol., 60, 714–724, https://doi.org/10.3189/2014JoG14J015, 2014.
Markham, B. L. and Helder, D. L.: Forty-year calibrated record of earth-reflected radiance from Landsat: A review, Remote Sens. Environ., 122, 30–40, https://doi.org/10.1016/j.rse.2011.06.026, 2012.
Markham, B., Barsi, J., Kvaran, G., Ong, L., Kaita, E., Biggar, S., Czapla-Myers, J., Mishra, N., and Helder, D.: Landsat-8 Operational Land Imager radiometric calibration and stability, Remote Sens., 6, 12275–12308, https://doi.org/10.3390/rs61212275, 2014.
Markus, T., Neumann, T., Martino, A., Abdalati, W., Brunt, K., Csatho, B., Farrell, S., Fricker, H., Gardner, A., Harding, D., Jasinski, M., Kwok, R., Magruder, L., Lubin, D., Luthcke, S., Morison, J., Nelson, R., Neuenschwander, A., Palm, S., Popescu, S., Shum, C. K., Schutz, B. E., Smith, B., Yang, Y. K., and Zwally, J.: The Ice, Cloud, and land Elevation Satellite-2 (ICESat-2): Science requirements, concept, and implementation, Remote Sens. Environ., 190, 260–273, https://doi.org/10.1016/j.rse.2016.12.029, 2017.
Mishra, N., Helder, D., Angal, A., Choi, J., and Xiong, X. X.: Absolute calibration of optical satellite sensors using Libya 4 pseudo invariant calibration site, Remote Sens., 6, 1327–1346, https://doi.org/10.3390/rs6021327, 2014.
Moran, M. S., Jackson, R. D., Clarke, T. R., Qi, J., Cabot, F., Thome, K. J., and Markha, B. L.: Reflectance factor retrieval from Landsat TM and SPOT HRV data for bright and dark targets, Remote Sens. Environ., 52, 218–230, https://doi.org/10.1016/0034-4257(95)00035-Y, 1995.
Moran, M. S., Bryant, R., Thome, K., Ni, W., Nouvellon, Y., Gonzalez-Dugo, M. P., Qi, J., and Clarke, T. R.: A refined empirical line approach for reflectance factor retrieval from Landsat-5 TM and Landsat-7 ETM+, Remote Sens. Environ., 78, 71–82, https://doi.org/10.1016/S0034-4257(01)00250-4, 2001.
Morfitt, R., Barsi, J., Levy, R., Markham, B., Micijevic, E., Ong, L., Scaramuzza, P., and Vanderwerff, K.: Landsat-8 Operational Land Imager (OLI) Radiometric Performance On-Orbit, Remote Sens., 7, 2208–2237, https://doi.org/10.3390/rs70202208, 2015.
Mullen, P. C. and Warren, S. G.: Theory of the optical properties of lake ice, J. Geophys. Res.-Atmos., 93, 8403–8414, https://doi.org/10.1029/JD093iD07p08403, 1988.
Nolin, A. W. and Dozier, J.: A hyperspectral method for remotely sensing the grain size of snow, Remote Sens. Environ., 74, 207–216, https://doi.org/10.1016/s0034-4257(00)00111-5, 2000.
Painter, T. H., Roberts, D. A., Green, R. O., and Dozier, J.: The effect of grain size on spectral mixture analysis of snow-covered area from AVIRIS data, Remote Sens. Environ., 65, 320–332, https://doi.org/10.1016/S0034-4257(98)00041-8, 1998.
Painter, T. H. and Dozier, J.: Measurements of the hemispherical-directional reflectance of snow at fine spectral and angular resolution, J. Geophys. Res.-Atmos., 109, D18115, https://doi.org/10.1029/2003jd004458, 2004a.
Painter, T. H. and Dozier, J.: The effect of anisotropic reflectance on imaging spectroscopy of snow properties, Remote Sens. Environ., 89, 409–422, https://doi.org/10.1016/j.rse.2003.09.007, 2004b.
Painter, T. H., Barrett, A. P., Landry, C. C., Neff, J. C., Cassidy, M. P., Lawrence, C. R., McBride, K. E., and Farmer, G. L.: Impact of disturbed desert soils on duration of mountain snow cover, Geophys. Res. Lett., 34, 6, https://doi.org/10.1029/2007gl030284, 2007.
Painter, T. H., Rittger, K., McKenzie, C., Slaughter, P., Davis, R. E., and Dozier, J.: Retrieval of subpixel snow covered area, grain size, and albedo from MODIS, Remote Sens. Environ., 113, 868–879, https://doi.org/10.1016/j.rse.2009.01.001, 2009.
Painter, T. H., Seidel, F. C., Bryant, A. C., Skiles, S. M., and Rittger, K.: Imaging spectroscopy of albedo and radiative forcing by light-absorbing impurities in mountain snow, J. Geophys. Res.-Atmos., 118, 9511–9523, https://doi.org/10.1002/jgrd.50520, 2013.
Parr, A. C. and Datla, R. U.: NIST role in radiometric calibrations for remote sensing programs at NASA, NOAA, DOE and DOD, in: Calibration and Characterization of Satellite Sensors and Accuracy of Derived Physical Parameters, edited by: Tsuchiya, K., Advances in Space Research-Series, 1, Elsevier Science Bv, Amsterdam, 59–68, 2001.
Picard, G., Arnaud, L., Domine, F., and Fily, M.: Determining snow specific surface area from near-infrared reflectance measurements: Numerical study of the influence of grain shape, Cold Reg. Sci. Technol., 56, 10–17, https://doi.org/10.1016/j.coldregions.2008.10.001, 2009.
Platnick, S., Hubanks, P., Meyer, K., and King, M. D.: MODIS atmosphere L3 monthly product (08_L3), NASA MODIS Adaptive Processing System, Goddard Space Flight Center, https://doi.org/10.5067/MODIS/MYD08_M3.006, 2015.
Pope, A., Scambos, T. A., Moussavi, M., Tedesco, M., Willis, M., Shean, D., and Grigsby, S.: Estimating supraglacial lake depth in West Greenland using Landsat 8 and comparison with other multispectral methods, The Cryosphere, 10, 15–27, https://doi.org/10.5194/tc-10-15-2016, 2016.
Schaepman-Strub, G., Schaepman, M. E., Painter, T. H., Dangel, S., and Martonchik, J. V.: Reflectance quantities in optical remote sensing – definitions and case studies, Remote Sens. Environ., 103, 27–42, https://doi.org/10.1016/j.rse.2006.03.002, 2006.
Schaepman, M. E. and Dangel, S.: Solid laboratory calibration on a nonimaging spectroradiometer, Appl. Opt., 39, 3754–3764, 2000.
Schutz, B. E., Zwally, H. J., Shuman, C. A., Hancock, D., and DiMarzio, D. P.: Overview of the ICESat mission, Geophys. Res. Lett., 32, L21S01, https://doi.org/10.1029/2005GL024009, 2005.
Six, D., Fily, M., Alvain, S., Henry, P., and Benoist, J. P.: Surface characterisation of the Dome Concordia area (Antarctica) as a potential satellite calibration site, using Spot 4/Vegetation instrument, Remote Sens. Environ., 89, 83–94, https://doi.org/10.1016/j.rse.2003.10.006, 2004.
Slater, P. N., Biggar, S. F., Holm, R. G., Jackson, R. D., Mao, Y., Moran, M. S., Palmer, J. M., and Yuan, B.: Reflectance- and radiance-based methods for the in-flight absolute calibration of multispectral sensors, Remote Sens. Environ., 22, 11–37, https://doi.org/10.1016/0034-4257(87)90026-5, 1987.
Smith, G. M. and Milton, E. J.: The use of the empirical line method to calibrate remotely sensed data to reflectance, Int. J. Remote Sens., 20, 2653–2662, https://doi.org/10.1080/014311699211994, 1999.
Storey, J., Choate, M., and Lee, K.: Landsat 8 Operational Land Imager on-orbit geometric calibration and performance, Remote Sens., 6, 11127–11152, https://doi.org/10.3390/rs61111127, 2014.
Strobl, P., Mueller, A. A., Schlaepfer, D., and Schaepman, M. E.: Laboratory calibration and inflight validation of the Digital Airborne Imaging Spectrometer DAIS, Proc. Algorithms for Multispectral and Hyperspectral Imagery III, SPIE, 7915, 225–236, 1997.
Tanré, D., Deroo, C., Duhaut, P., Herman, M., Morcrette, J. J., Perbos, J., and Deschamps, P. Y.: Description of a computer code to simulate the satellite signal in the solar spectrum: the 5S code, Int. J. Remote Sens., 11, 659–668, 1990.
Tansock, J., Bancroft, D., Butler, J., Cao, C., Datla, R., Hansen, S., Helder, D., Kacker, R., Latvakoski, H., Mlynczak, M., Murdock, T., Peterson, J., Pollock, D., Russell, R., Scott, D., Seamons, J., Stone, T., Thurgood, A., Williams, R., Xiong, X., and Yoon, H.: Guidelines for radiometric calibration of electro-optical instruments for remote sensing, U.S. Department of Commerce, National Institute of Standards and Technology, HB 157, 1–145, https://doi.org/10.6028/NIST.HB.157, 2015.
Thome, K. J.: Absolute radiometric calibration of Landsat 7 ETM+ using the reflectance-based method, Remote Sens. Environ., 78, 27–38, https://doi.org/10.1016/S0034-4257(01)00247-4, 2001.
Thompson, D. R., Gao, B.-C., Green, R. O., Roberts, D. A., Dennison, P. E., and Lundeen, S. R.: Atmospheric correction for global mapping spectroscopy: ATREM advances for the HyspIRI preparatory campaign, Remote Sens. Environ., 167, 64–77, https://doi.org/10.1016/j.rse.2015.02.010, 2015.
Vane, G., Green, R. O., Chrien, T. G., Enmark, H. T., Hansen, E. G., and Porter, W. M.: Airbone imaging spectrometry the airborne visible/infrared imaging spectrometer (AVIRIS), Remote Sens. Environ., 44, 127–143, https://doi.org/10.1016/0034-4257(93)90012-M, 1993.
Warren, S. G.: Optical-properties of snow, Rev. Geophys., 20, 67–89, https://doi.org/10.1029/RG020i001p00067, 1982.
Warren, S. G.: Can black carbon in snow be detected by remote sensing?, J. Geophys. Res.-Atmos., 118, 779–786, https://doi.org/10.1029/2012jd018476, 2013.
Warren, S. G. and Wiscombe, W. J.: A model for the spectral albedo of snow, II: Snow containing atmospheric aerosols, J. Atmos. Sci., 37, 2734–2745, https://doi.org/10.1175/1520-0469(1980)037<2734:amftsa>2.0.co;2, 1980.
Warren, S. G., Brandt, R. E., and Grenfell, T. C.: Visible and near-ultraviolet absorption spectrum of ice from transmission of solar radiation into snow, Appl. Opt., 45, 5320–5334, https://doi.org/10.1364/ao.45.005320, 2006.
Wiscombe, W. J. and Warren, S. G.: A model for the spectral albedo of snow, 1, pure snow, J. Atmos. Sci., 37, 2712–2733, https://doi.org/10.1175/1520-0469(1980)037<2712:amftsa>2.0.co;2, 1980.
Zwally, H. J.: ICESat's laser measurements of polar ice, atmosphere, ocean, and land, J. Geodynam., 34, 405–445, 2002.