the Creative Commons Attribution 4.0 License.
the Creative Commons Attribution 4.0 License.
 | 02 Apr 2019
Effect of dry or wet substrate deposition on the organic volume fraction of core–shell aerosol particles
Hansol D. Lee
Chathuri P. Kaluarachchi
Elias S. Hasenecz
Jonic Z. Zhu
Eduard Popa
Elizabeth A. Stone
Alexei V. Tivanski
Understanding the impact of sea spray aerosol (SSA) on the climate and atmosphere requires quantitative knowledge of their chemical composition and mixing states. Furthermore, single-particle measurements are needed to accurately represent large particle-to-particle variability. To quantify the mixing state, the organic volume fraction (OVF), defined as the relative organic volume with respect to the total particle volume, is measured after generating and collecting aerosol particles, often using deposition impactors. In this process, the aerosol streams are either dried or kept wet prior to impacting on solid substrates. However, the atmospheric community has yet to establish how dry versus wet aerosol deposition influences the impacted particle morphologies and mixing states. Here, we apply complementary offline single-particle atomic force microscopy (AFM) and bulk ensemble high-performance liquid chromatography (HPLC) techniques to assess the effects of dry and wet deposition modes on the substrate-deposited aerosol particles' mixing states. Glucose and NaCl binary mixtures that form core–shell particle morphologies were studied as model systems, and the mixing states were quantified by measuring the OVF of individual particles using AFM and compared to the ensemble measured by HPLC. Dry-deposited single-particle OVF data positively deviated from the bulk HPLC data by up to 60 %, which was attributed to significant spreading of the NaCl core upon impaction with the solid substrate. This led to underestimation of the core volume. This problem was circumvented by (a) performing wet deposition and thus bypassing the effects of the solid core spreading upon impaction and (b) performing a hydration–dehydration cycle on dry-deposited particles to restructure the deformed NaCl core. Both approaches produced single-particle OVF values that converge well with the bulk and expected OVF values, validating the methodology. These findings illustrate the importance of awareness in how conventional particle deposition methods may significantly alter the impacted particle morphologies and their mixing states.
- Article
(3517 KB) - Full-text XML
-
Supplement
(735 KB) - BibTeX
- EndNote


The chemical composition of the ocean and sea surface microlayer (SSML) directly affects the mixing states of sea spray aerosol (SSA), which is generated by film and jet drops (Prather et al., 2013; Jacobson, 2001; Vignati et al., 2010; de Leeuw et al., 2011; Wang et al., 2017). Typically existing as submicrometer-sized aerosols with inorganic core encased by organic shell (core–shell), their heterogeneous mixing states derive directly from the complex variety of organic, inorganic, and biological species in the SSML and ocean water (Cochran et al., 2017; Ault et al., 2013). Nascent SSAs affect the Earth's climate and atmosphere through radiative forcing, directly by scattering and absorbing solar radiation, and indirectly by acting as cloud condensation or ice nuclei (Lee et al., 2017b; Haywood and Boucher, 2000; Jacobson, 2001); however, their chemical and biological complexity that control the mixing state hinder our ability to accurately predict their climate cooling abilities (Lee et al., 2017a, b). Uncertainty in the mixing state, even with the knowledge of the chemical composition, may produce erroneous predictions of cloud activation from individual particles (Ault and Axson, 2017).
Thus, with relatively recent single-particle methodology developments, SSA-relevant aerosol chemical compositions and ensuing physicochemical properties can be characterized (Laskina et al., 2015; Ault et al., 2013; Cochran et al., 2017; Estillore et al., 2017; Prather et al., 2013; Morris et al., 2015, 2016; Schill et al., 2014; Laskin et al., 2012; Chi et al., 2015).
Bulk offline measurements provide quantitative information on elemental, molecular, and organic functional group composition (O'Dowd et al., 2004; Facchini et al., 2008; Jayarathne et al., 2016; Russell et al., 2010; Quinn et al., 2014). Quantitative bulk ensemble techniques sample large particle numbers; however, they cannot provide individual particle specificity, which is crucial when studying submicrometer-sized aerosol particles that display large particle-to-particle variability. For example, single-particle level studies are well suited to study ice nucleation because only 1 out of 106 particles form ice clouds that cool the Earth (DeMott et al., 2016). Therefore, single-particle techniques such as electron microscopy or atomic force microscopy (AFM) are highly attractive because they offer imaging capabilities with nanometer-level spatial resolution on substrate-deposited individual particles. Additionally, AFM measurements can be performed under controlled relative humidity (RH), while producing high-resolution 3-D height and phase images, and directly measuring viscoelastic properties of materials (Lee et al., 2017a, b). In this regard, simultaneous acquisition of the 3-D height and phase images over individual particles can be used to quantify their mixing states or organic volume fraction (OVF). OVF measurements require quantification of the phase-separated organic component and the total particle volumes, which can be determined for individual particles using Eq. (1):
where OVFparticle is the individual particle organic volume fraction, and Vtotal, Vorg, and Vinorg are the volumes of the total particle, organic shell, and inorganic core, respectively. Previously, a similar methodology was used without systematic validation, to report upper-limit approximations of OVFparticle for mixtures of NaCl, glucose, and laminarin (Estillore et al., 2017). In this work, the goal was to provide a quantitative validation of the methodology.
SSAs are typically collected on substrates via laboratory generation or during a field study, then are either dried to a relatively low RH (ca. 20 %–35 %, dry deposition) or kept wet at relatively high RH (> 75 %, wet deposition) prior to being sent to an impactor for substrate deposition (Ovadnevaite et al., 2017; Facchini et al., 1999; Lee et al., 2017a). Despite the extensive use of both methods for single-particle analysis, the aerosol community has yet to quantify the effect of dry or wet deposition on experimentally determined particle morphologies and ensuing physicochemical properties. On the one hand, wet deposition may cause splattering of particles, in which organic volume is lost and thus underestimated. On the other hand, dry deposition may cause physical deformation of particles upon impaction on a hard substrate, possibly introducing a source of error.
Here, we address two questions: what are the effects of dry and wet substrate deposition on atmospherically relevant, phase-separated aerosol particle morphologies? And how does this affect the assessment of mixing state by single-particle OVF measurements? To answer these questions, we chose glucose and sodium chloride (NaCl) as a model of a core–shell particle, at two molar ratios (ca. 1:2 and 1:8 M) and applied single-particle AFM and bulk ensemble liquid chromatography techniques. Glucose is a good model system because of available data on the relationship between RH and viscosity as well as its ability to access solid, semisolid, and liquid phase states at subsaturated RH (Lee et al., 2017b; Song et al., 2016). NaCl and glucose mixtures also produce core–shell particles, with solid–semisolid phase separation evident in AFM phase imaging. Unlike liquid–liquid phase separation, to the best of our knowledge, parameterization to predict a solid–semisolid or solid–liquid phase separation does not yet exist (Bertram et al., 2011; You et al., 2013, 2014; Krieger et al., 2012; Song et al., 2012). Both chemical systems are highly relevant to SSA, with glucose contributing up to 5.2 % and 14.4 % of the total organic mass of PM2.5 and PM10–2.5 SSA, respectively (Jayarathne et al., 2016). Further, both glucose and NaCl are surface-inactive species; thus OVF is not expected to be size-dependent (Cochran et al., 2017). In the following sections, we begin by introducing the observed core–shell morphology of phase-separated binary component particles using AFM. Next, quantified OVF results for 1:2 (M) and 1:8 (M) glucose : NaCl are discussed under dry and wet deposition conditions. Finally, an experimental approach to restructure the dry-deposited particles by performing a hydration and dehydration cycle is introduced and validated.
2.1 Particle generation
Glucose and sodium chloride (NaCl) were purchased from TCI and Fisher Chemical, with 98 % and 99 % purity, respectively. Both were dissolved without additional purification in ultrapure water (> 18 MΩ cm), to generate 0.1 M glucose solutions for mixtures and 0.1 M NaCl solutions for pure NaCl. From each solution, corresponding particles were generated using a custom-made bubbler system with 1∕2 in. corrugated stainless steel or Teflon tubing and Swage connections (Cochran et al., 2016). For dry deposition, the particle stream was sent to two diffusion dryers used to maintain approximately 20 % RH (70 cm length, created in house) and to a mixing chamber with 26 L min−1 clean air bypass. For wet deposition, the diffusion dryers were removed and the 26 L min−1 dry air bypass was sent through ultrapure water to achieve ∼80 % RH in the mixing chamber.
2.2 Sample collection
Particles were substrate-deposited using a Micro Orifice Uniform Deposit Impactor (MOUDI) (MSP, Inc., Model 110) on hydrophobically treated silicon wafers (Ted Pella, Inc.) (Lee et al., 2017a). The substrate was cleaned with ethanol and high-purity N2 gas (99.998 %) prior to use. High-performance liquid chromatography (HPLC) samples were collected on 47 mm Teflon filters (PALL Life Sciences). Prior to sample collection, field blanks were obtained before each experiment (a total of three).
2.3 AFM imaging
Molecular force probe 3-D AFM (Asylum Research, Santa Barbara, CA) was used for particle imaging at ambient temperature (20–25 ∘C) and pressure. The microscope permits (sub)nanometer-level spatial resolution and 1 pN force resolution (Binnig et al., 1986; Santos et al., 2011; Gan, 2009; Gerber, 2017). A custom-made humidity cell was used to control the RH (∼3 %–97 %) (Lee et al., 2017a). Silicon nitride AFM tips (MikroMasch, Model NSC35) with nominal spring constant range of 5–16 N m−1 were used to image particles. Prior to imaging, the humidity cell RH value of 25 %–35 % was maintained for at least 10 min, to allow the particles to reach equilibrium with the surrounding humid air in the cell. This time frame is reasonable given the diffusive nature of water transport within a particle, which is dependent on the particle size (Grayson et al., 2017; Lu et al., 2014). AC mode was used to image individual particles and collect information on their 3-D height and phase. The Igor Pro particle analysis tool was used to calculate the core and total particle volume (see Supplement for details). The single-particle data of organic volume fraction and volume equivalent diameter are both shown with a mean value and error bar, which represents 2 standard deviations.
2.4 Bulk ensemble measurements
Teflon substrates were extracted by 10 min mechanical stirring, 30 min sonication, and an additional 10 min of mechanical stirring into 5.00 mL ultrapure water. Extracts were filtered via a 0.45 µm polypropylene Whatman filter and analyzed via HPLC (Jayarathne et al., 2016; Rathnayake et al., 2016). Glucose content was quantified using high-performance anion exchange chromatography (ICS-5000, Dionex) with pulsed amperometric detection using a Dionex MA1 guard and analytical columns. Sodium and chloride content were quantified using HPLC with conductivity detection as previously described (Jayarathne et al., 2016). The bulk organic volume fraction data, which were converted from mass-based HPLC measurements to volume using the densities of glucose and sodium chloride, are shown with a mean value and error bar, which represents propagated analytical uncertainty (see Supplement). We note that the mention of bulk measurements in the text is solely dedicated to describing the measurements performed using HPLC.
3.1 Morphology of phase-separated binary component particles
After generation of glucose and NaCl mixture particles using the dry and wet deposition methods outlined above, AFM imaging was used to obtain the 3-D height and phase images and validate a “core–shell” morphology for two different molar fractions (Fig. 1). Images do not show changes of morphology from the core–shell, but instead the core is more evident under wet deposition. Here, RH was maintained at a constant range of 25 %–35 % throughout the imaging experiment, to minimize “phase bleeding” and water uptake (Fig. S1 in the Supplement). In this work, phase bleeding describes an instance in which the viscosity of the two phase-separated materials is too similar at a given RH, and therefore the phase contrast between organic and inorganic components is relatively weak in the AFM images. A high phase contrast image aids in correctly differentiating the core and shell phase boundaries. For this particular system, a dramatic increase in phase bleeding is evident below 25 % RH, due to a significant increase in the glucose viscosity as it becomes more solid-like, which closely resembles the NaCl viscosity at this RH value (Fig. S1) (Song et al., 2016). Since phase imaging inherently relies on measuring differences in tip–sample interactions originating from different viscoelastic properties, lowering the RH will further converge the two different viscosities of organic and inorganic components together, lessening the accuracy of the core and shell phase boundary determination. Although higher RH values would produce less phase bleeding, significant particle water uptake will also introduce erroneous OVF values, due to an increase in particle volume from water uptake. For chemical systems with a discrete deliquescence point, such as ∼75 % RH for NaCl, the upper limit RH value is clear. However, for chemical systems that continually uptake water, such as glucose, the lack of discrete deliquescence point complicates the matter (Lee et al., 2017a). The value of 25 % RH was thus used for the measurements of OVF because growth in size from water uptake was measured to be less than 1.03 or merely 3 % growth while showing excellent phase contrast (Lee et al., 2017a). Other chemical systems may also have optimum RH ranges that minimize water uptake while allowing for clear distinction of the core and shell. Further discussion of the environmental conditions for phase imaging is provided in the Supplement.
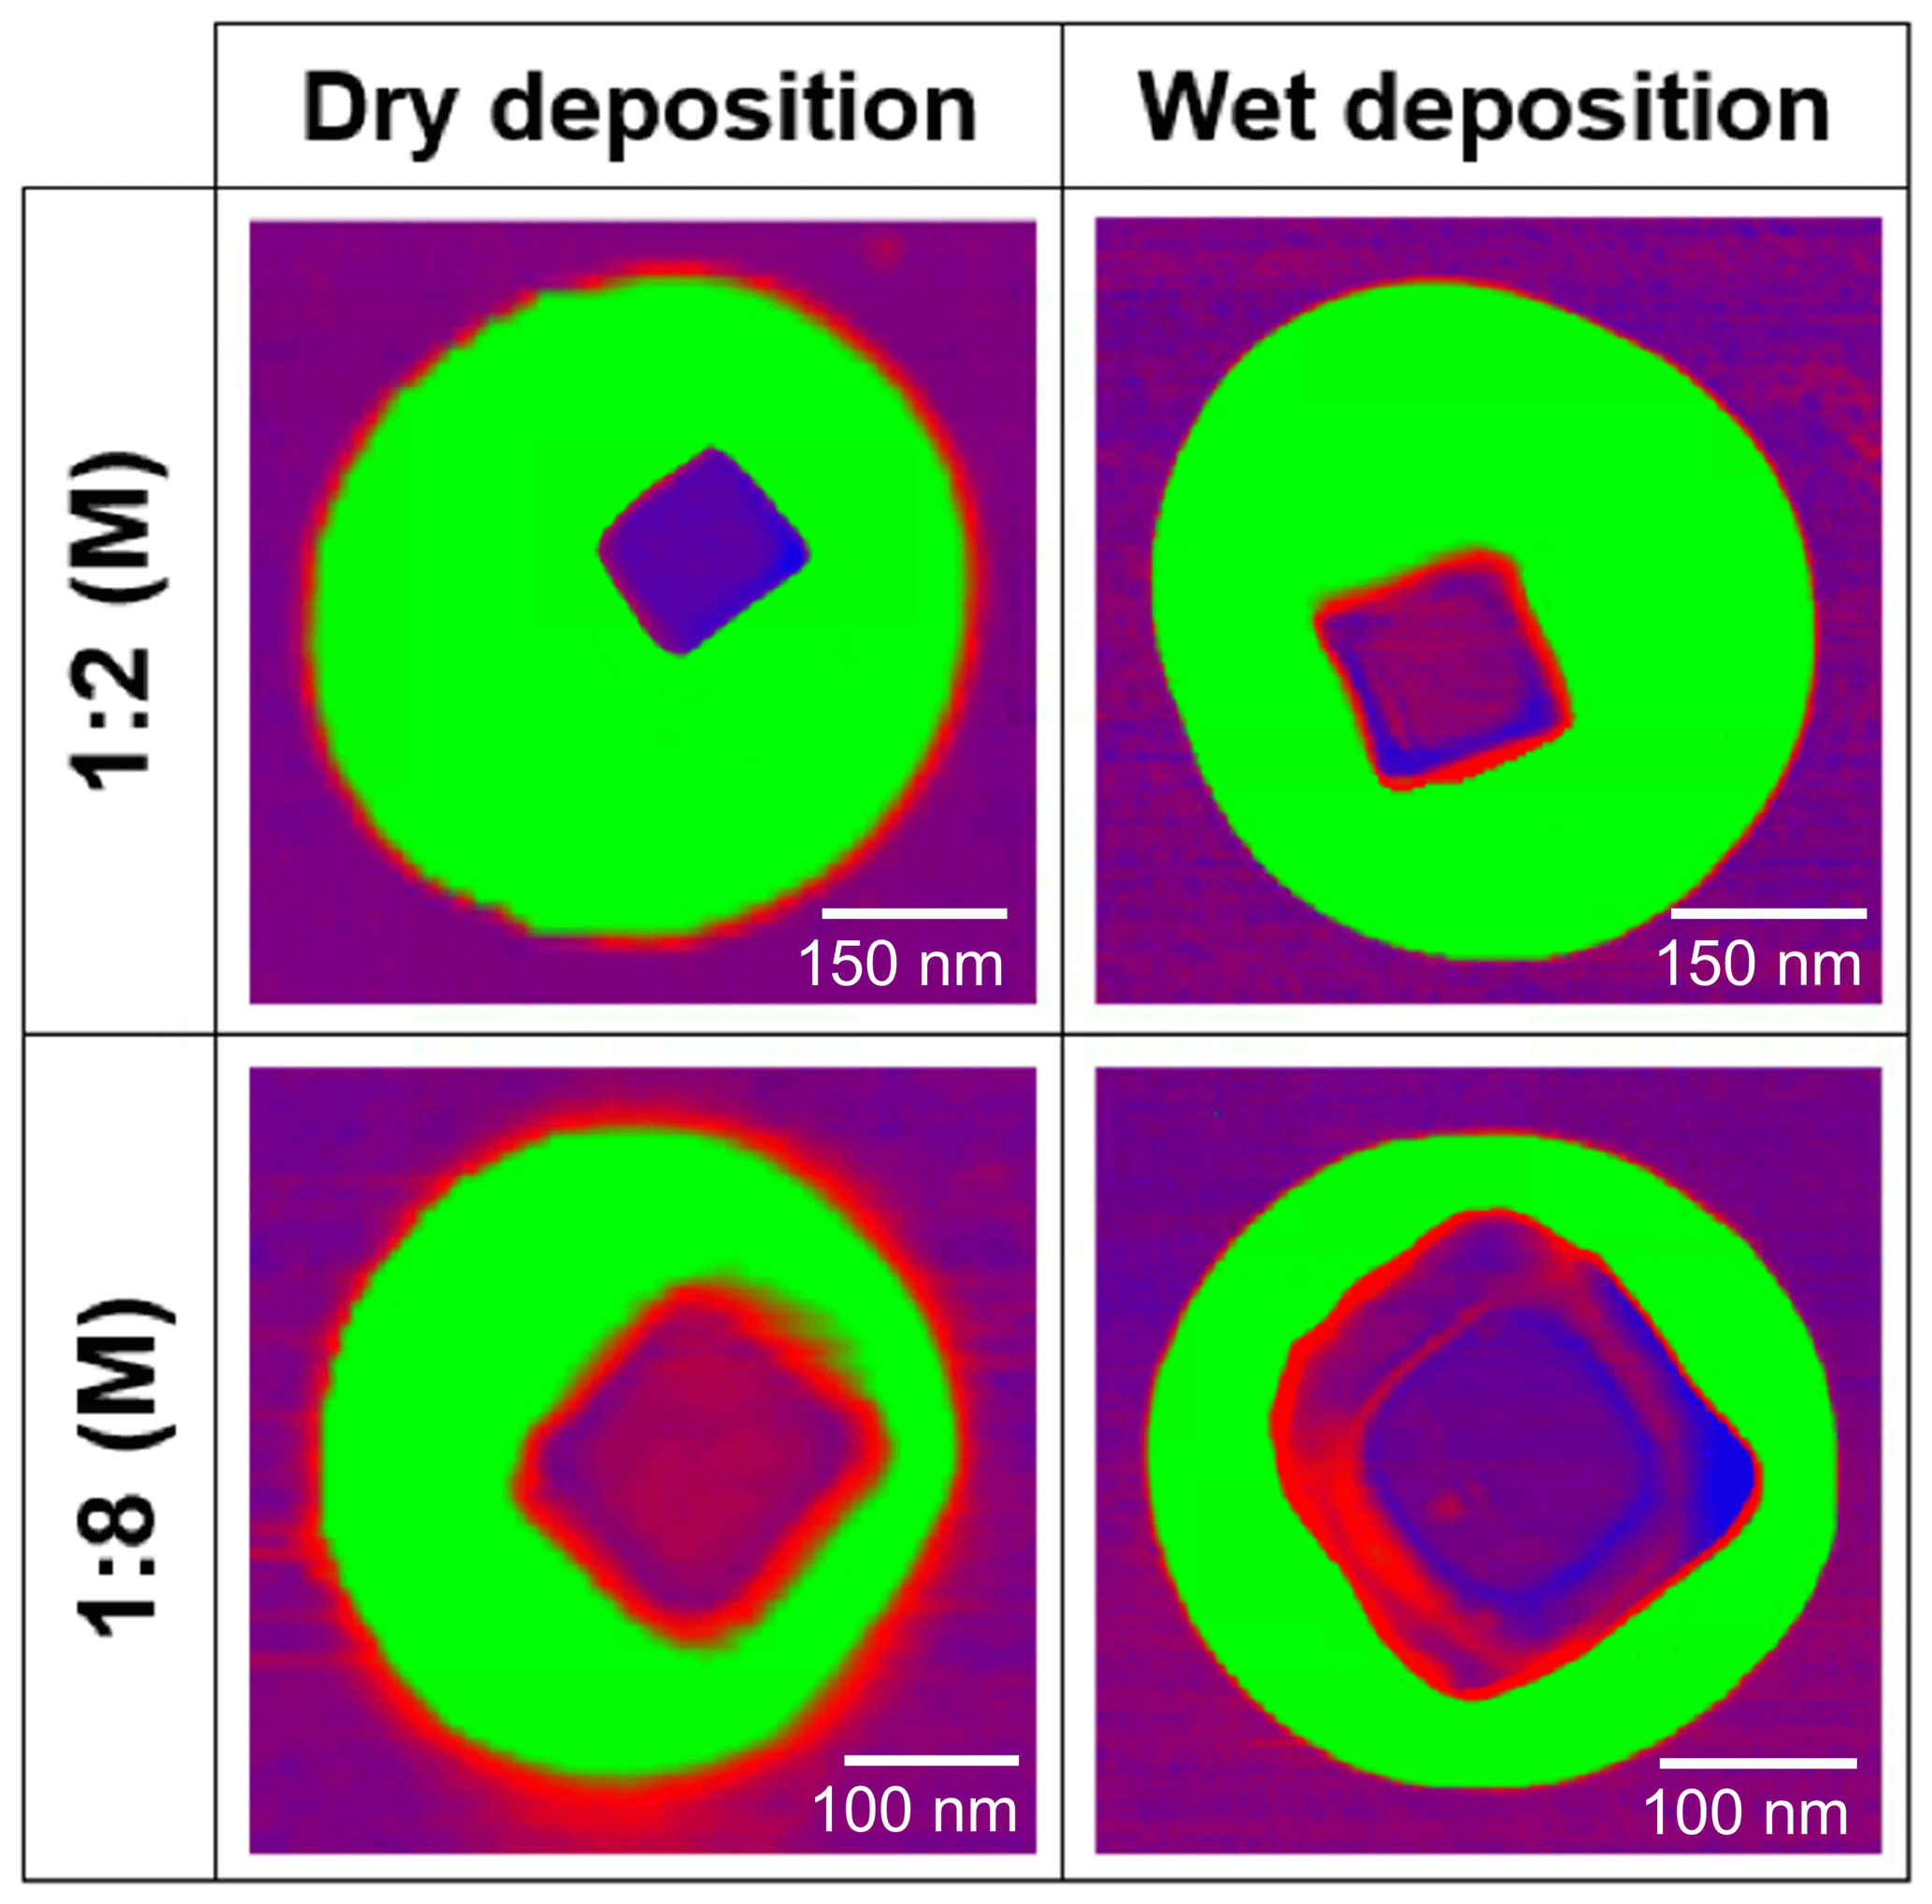
Figure 1AFM phase images of glucose : NaCl particles at 25 %–35 % RH. The green and violet/red colors represent the organic and inorganic components of the particles, respectively.
3.2 OVF measurements on 1:8 (M) glucose : NaCl
From Fig. 1, a phase imaging mask of the area was used to identify the boundary of the inorganic core and the organic shell, which was used to quantify the inorganic core and the total particle volumes, the difference of which is organic volume (masks shown in Fig. S2). The area mask is then transferred onto the 3-D image, and the OVF is quantified using Eq. (1). We note that this methodology assumes that (a) the areas of the top and bottom of the core are nearly identical and that (b) no organic material is present below the core. Below, we will show that the first assumption fails, under dry deposition conditions.
Figure 2a shows OVF versus volume-equivalent diameter data on individual 1:8 (M) glucose : NaCl mixture particles from dry and wet deposition modes. The dotted black line is the expected OVF value. Volume-equivalent diameter was quantified by relating the volume of the sphere to the diameter (Morris et al., 2016). Bulk OVF (OVFbulk) was calculated from the masses of glucose and NaCl, determined by their respective densities (Eq. S1 in the Supplement). More information on the expected OVF, calculated from the measured organic and inorganic mole fractions from the bulk solution measurements, can be found in the Supplement (Eq. S5). The grey shaded area represents ±10 % deviation from the mean as a reference. In agreement with our expectations, the bulk OVF data do not show any size dependence and instead show good overlap with the expected values. Also, the bulk data shown here were wet-deposited, but no significant differences between dry and wet deposition were observed in OVFbulk (Fig. S3). For this mixture, the single-particle AFM OVF of dry-deposited particles shows a significant, positive deviation away from the expected and bulk OVF values. In fact, the deviation is nearly 60 % higher than the expected value. But, there is no clearly evident size dependence on measured OVF. Similarly, wet-deposited particles also do not show size dependence but instead show excellent overlap with the expected and bulk OVF values. Moreover, contrary to our concerns outlined in the beginning, the wet-deposited particles were individual with well-resolved core–shell morphology without any evidence of spattering.
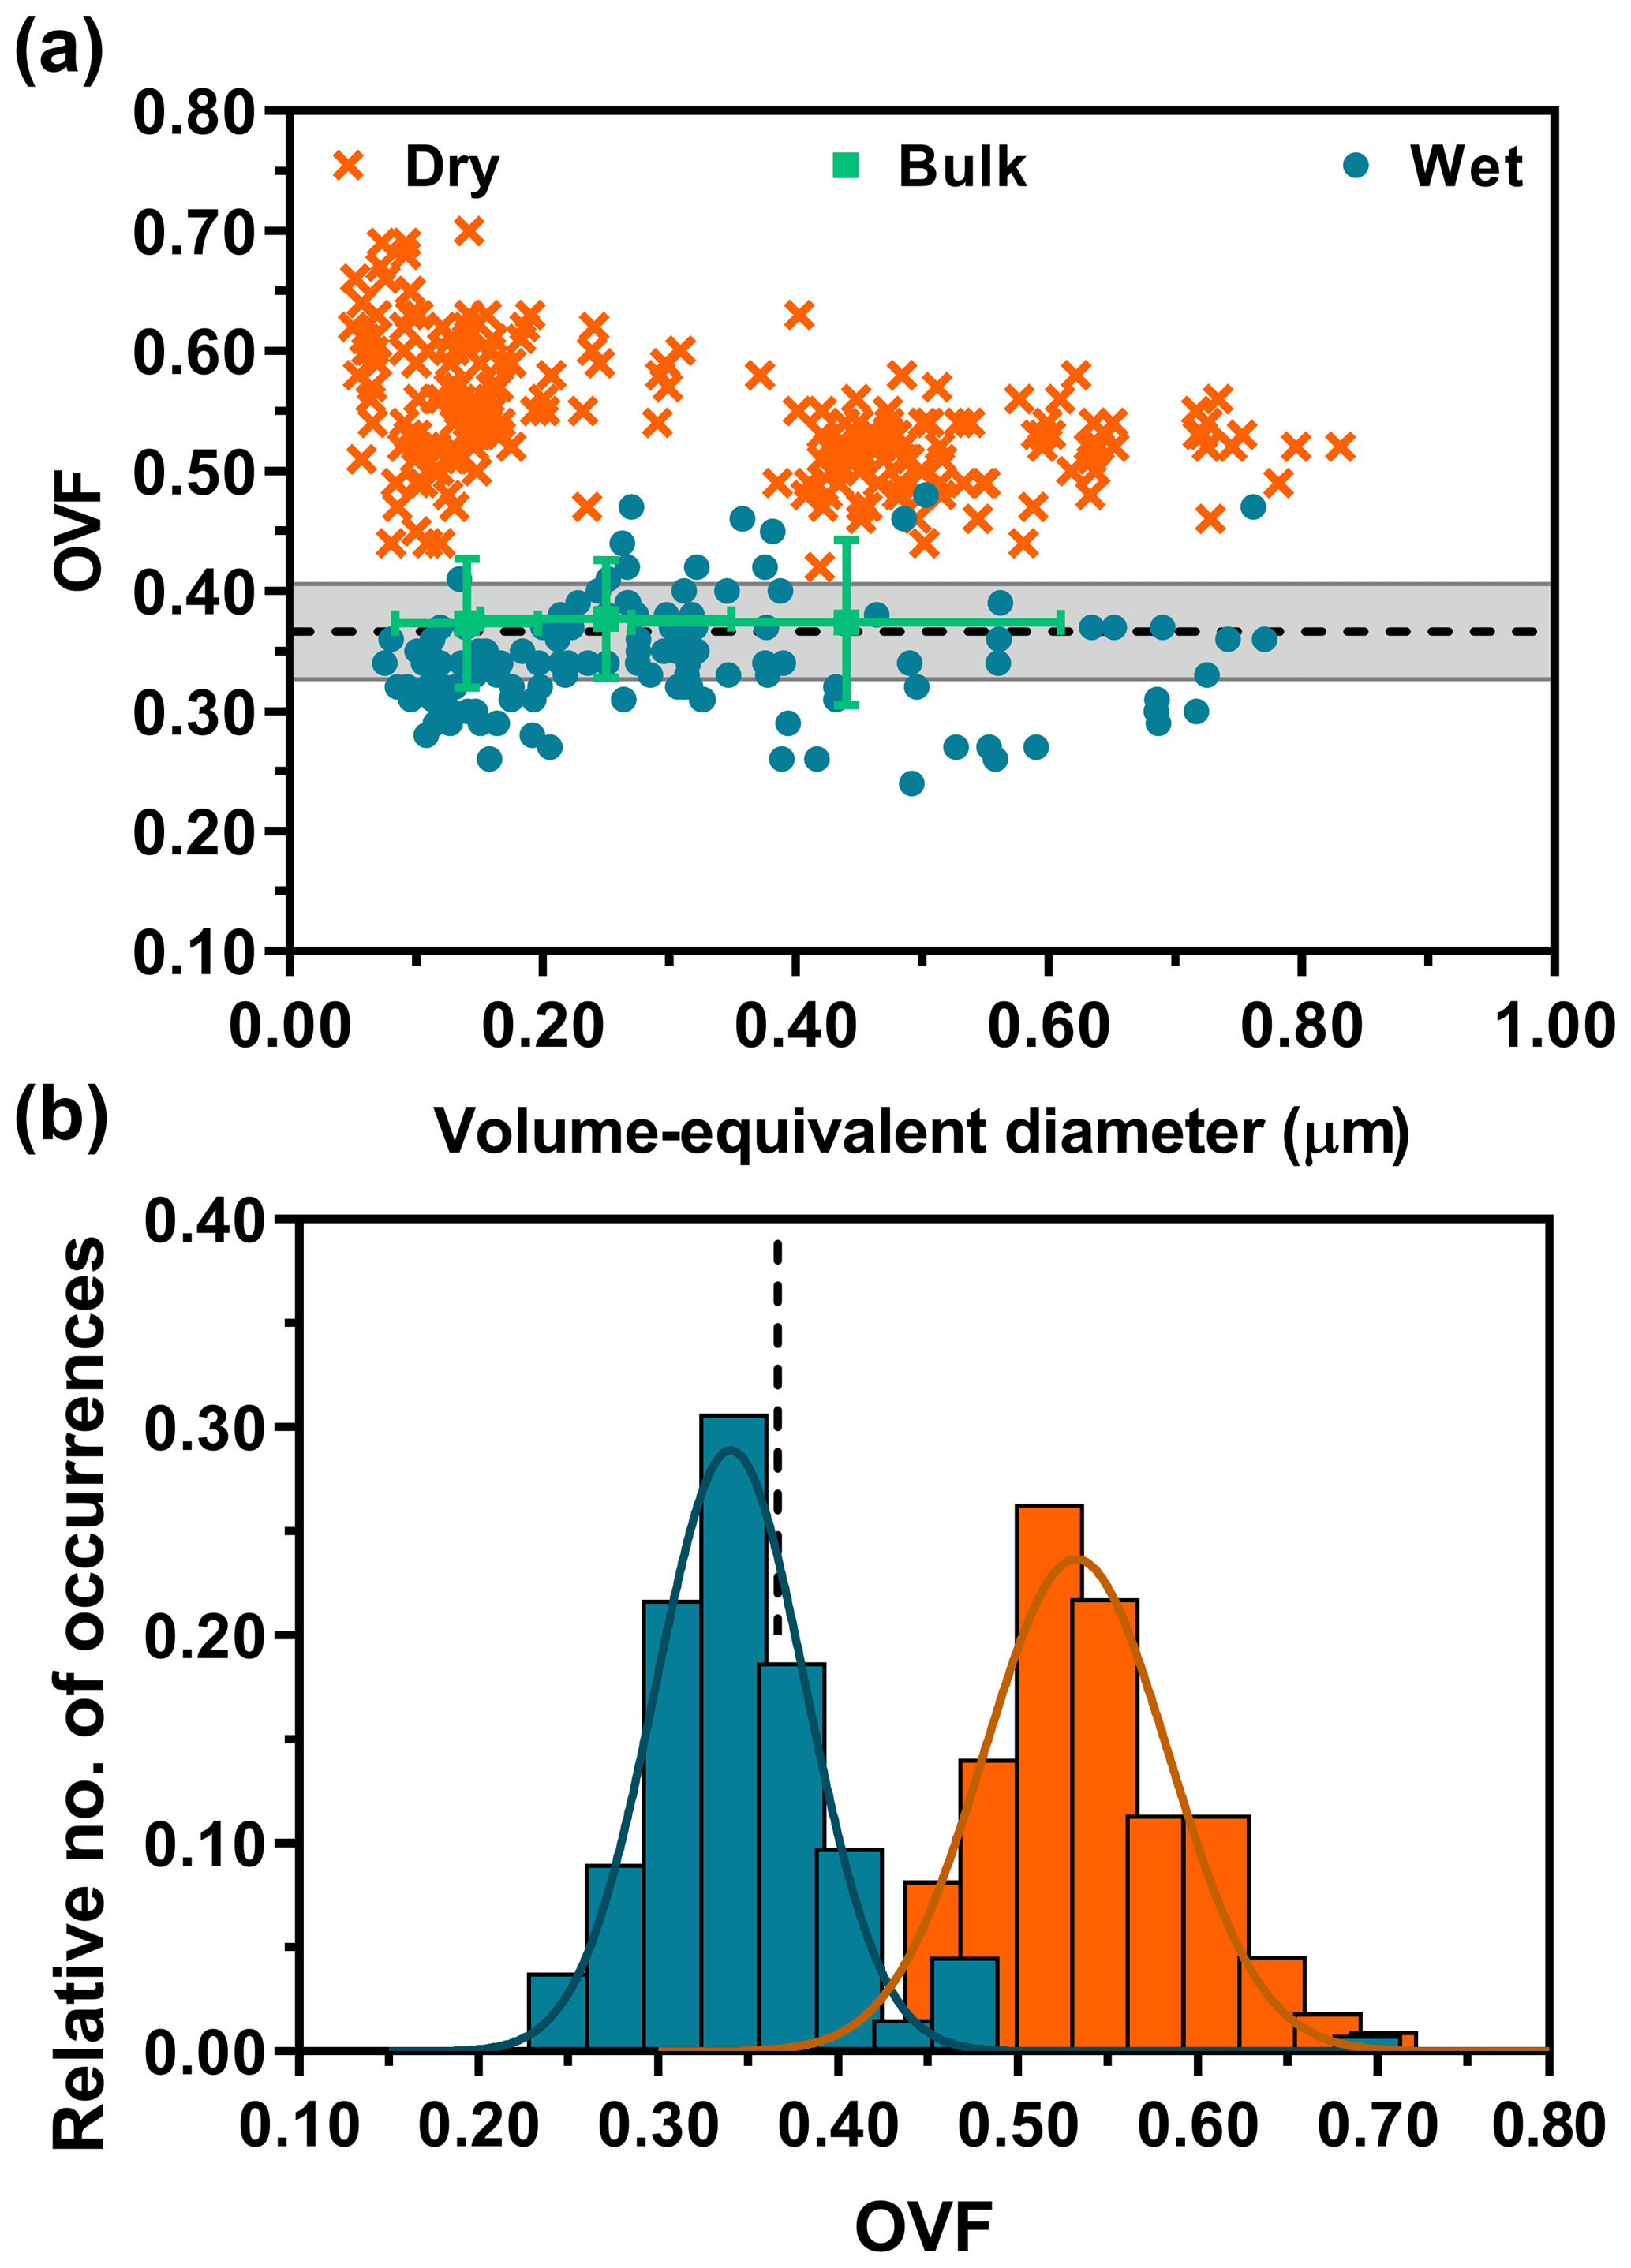
Figure 2AFM single-particle OVF values (dry deposition: dark orange crosses, wet deposition: blue dots) versus volume-equivalent diameter for 1:8 (M) glucose : NaCl (a). The bulk OVF data (green squares) are shown with x-axis and y-axis error bars, obtained from the MOUDI size cutoff range and total experimental propagated error, respectively. Expected OVF value (black dotted line) is measured and calculated from bulk solution mixing ratios with known densities of solutes, assuming ±10 % error (grey shaded region). AFM OVF histograms (same color legend schemes retained from above) are collected over individual particles (b). Gaussian function fits are shown by the colored lines, yielding the most probable OVF values and corresponding standard deviations.
To better illustrate the differences in measured OVF means and variance from dry- and wet-deposited particles, statistical comparisons of sample means were performed from constructed histograms (Fig. 2b). We note the histograms were obtained by combining individual particle data from all size ranges as no clear size dependence was observed. The probability distribution functions are shown as the colored solid lines. The distribution of OVF data from dry-deposited particles showed mean and standard deviation values of 0.53±0.05 (n=222). Wet-deposited particles yielded mean and standard deviation values of 0.34±0.04 (n=134). As a reference, the expected OVF and standard deviation is 0.37±0.04, constructed assuming 10 % deviation from the mean. Overall, the histograms show that wet-deposited particle data overlapped well with the expected and bulk values, in sharp contrast to dry-deposited particles that yielded nearly 60 % deviation. The deviation of OVF is likely due to significant spreading of the core but also contributed to by the 3 % contribution of water in the organic volume calculation and potential organic layer that is hidden underneath the core. Thus, OVFs measured from dry-deposited particles and wet-deposited particles were compared with a two-tailed t test, which demonstrated that these two datasets are significantly different (p < 0.0001; see Supplement).
To briefly recap, OVF data from dry-deposited 1:8 (M) glucose and NaCl particles showed strong deviations, whereas the wet-deposited particles showed excellent overlap with the predicted OVF values. In the beginning, we introduced the drawbacks of performing dry and wet deposition methods. For dry deposition, the particle morphology may deform due to a violent impaction with the substrate, which may introduce errors when performing OVF measurements that rely on assumptions on the shape of the core. If so, the OVF overestimation, or analogously core volume underestimation from single-particle analysis, can be explained by the core spreading upon impaction. Under dry deposition conditions, the solid NaCl core encased by glucose can spread underneath the glucose shell from the impaction, which is not detected in AFM phase imaging that probes the very surface of the particle. This effect is expected to produce an artificially higher OVF. Below, we investigate this phenomenon further.
3.3 Evidence of dry-deposited NaCl spreading
To determine the extent of NaCl spreading upon impaction, pure NaCl was dry-deposited under the same conditions as the previous glucose and NaCl mixture. Figure 3a shows an AFM 3-D height image of dry-deposited NaCl. The transition from purple and red to green indicates a gradient of height. The morphology-deforming effects of the dry deposition and impaction are evident, where the top of the particle shows round, not sharp edges. Also, the bottom of the particle has a significantly greater area than the top of the particle. This is more evident in Fig. 3b, in which a cross section of the particle is shown (denoted by dashed red line). For illustrative purposes, the expected cross-sectional area of NaCl, assuming no spreading, is shown by a striped green area. In comparison to when there is no spreading, which should produce top and bottom areas that are identical in distance, the axis shows direction-dependent spreading of nearly 300 nm that would not be considered when it is encased in organic matter, and OVF is quantified. To validate that the observed data are attributed largely due to the NaCl particle spreading, Eq. (S9) was derived, which shows that at least 120 nm of the 300 nm observed spreading is directly due, not to the tip-shape convolution, but to the particle spreading (see Supplement). Here, we note that the extent of spreading may be in part due to a relatively high flow rate of 30 L min−1 for the MOUDI system, which gives rise to high inertial force on the particle upon impaction onto the hard substrate, resulting in particle deformation. Thus, it is expected that other particle deposition methods with lower flow rate may result in lesser extent of spreading for the impacted particle. After the spreading was confirmed, the effectiveness of wet deposition was tested on a different mixture ratio of glucose and NaCl.

Figure 3AFM 3-D height image of a dry-deposited NaCl particle (a). The NaCl particle cross section (b) that was measured (dashed red line) compared to the estimated, when assuming a cubic particle shape with no spreading (striped green region). The difference between the red and green lines corresponds to an underestimation of the NaCl core volume when significant spreading occurs.
3.4 OVF measurements on 1:2 (M) glucose : NaCl
Figure 4a shows OVF versus volume-equivalent diameter data on individual 1:2 (M) glucose : NaCl mixture particles deposited dry and wet. In comparison to the bulk results, AFM OVF data from dry-deposited particles show size dependence at approximately 300 nm in volume-equivalent diameter. To better illustrate this, we represent the sample set of dry-deposited particles below this arbitrary size by a lighter shade of orange. Also, positive deviation away from the expected and bulk OVF values is observed with increasing particle size. Since bulk OVF results do not display any size dependence, the apparent size dependence of AFM OVF values for dry-deposited particles underscores the complex nature of how the morphology of solid particles changes as a result of impaction, thus introducing artificial dependence that prevents accurate reflection of mixing states of air-suspended particles. Contrary to dry-deposited particles, however, AFM OVF data from wet-deposited particles do not show size dependence, with excellent overlap with the expected and bulk OVF values. Moreover, similar to the 1:8 (M) mixture, the particles were also individual and did not show any evidence of spattering.

Figure 4AFM single-particle OVF values (dry deposition: light and dark orange crosses, wet deposition: blue dots) versus volume-equivalent diameter for 1:2 (M) glucose : NaCl (a). The dry deposition is shown in two colors to distinguish the dataset that exhibits apparent size dependence. The bulk OVF data (green squares) are shown with x-axis and y-axis error bars, obtained from the MOUDI size cutoff range and propagated analytical uncertainty, respectively. Expected OVF value (black dotted line) is measured and calculated with bulk solution mixing ratios with known densities of solutes, assuming ±10 % error (grey shaded region). AFM OVF histograms (same color legend schemes retained from above) are collected over individual particles (b). Gaussian function fits are shown by the colored lines, yielding the most probable OVF values and corresponding standard deviations.
To better illustrate the differences in measured AFM OVF sample means and variance from dry- and wet-deposited particles, histograms were constructed (Fig. 4b). The OVF data distribution from dry-deposited particles showed mean and standard deviation values of 0.64±0.08 (n=138) for particles less than 300 nm in size and 0.82±0.04 (n=89) for particles greater than 300 nm in size. Wet-deposited particles showed mean and standard deviation values of 0.71±0.07 (n=146). As a reference, the expected OVF and standard deviation is 0.71±0.07, again constructed assuming 10 % deviation from the mean. Overall, the histograms show that wet-deposited particle data overlapped nearly perfectly with the expected and bulk values, in comparison to dry-deposited particles. To confirm this statistically, the same Student's t test methodology was employed, which demonstrated that these two datasets are significantly different (p < 0.0001; see Supplement).
3.5 Restructuring dry-deposited particles by hydration–dehydration cycle and potential implications on hygroscopicity
In certain situations, wet deposition may not be feasible. Therefore, an experimental approach was developed to restructure the previously dry-deposited particles through water uptake (Fig. 5). Figure 5a shows two phase images of the same dry-deposited particle. The images were taken at 25 % RH, prior to the hydration–dehydration cycle (hyd–deh cycle) on the left and after the cycle on the right. The color schemes of a green organic shell and violet/red inorganic core remain the same as Fig. 1. After dry deposition, the particles were initially kept at near 3 % RH, until imaging at 25 % RH. Then, the humidity was increased to > 80 % RH which resulted in deliquescence of the particle and phase transition to liquid phase, confirmed by observing the drastic droplet size increase (Morris et al., 2016). The RH was then slowly decreased back to 25 % RH over ca. 10 min, resulting in the dehydration of the particle. Data show that after the hyd–deh cycle, more of the inorganic core is clearly evident in AFM phase imaging, which can now be taken into account in volume calculations.

Figure 5AFM phase images of the same particle at 25 % RH, before and after hydration–dehydration cycle (a). AFM OVF histograms for 1:8 (M) glucose : NaCl collected over individual particles (b). The red bars indicate particles before the cycle. The blue bars indicate the same particles after the cycle. Gaussian function fits are shown by the colored lines, yielding the most probable OVF values and corresponding standard deviations. The expected value is shown as the dashed black line.
From the quantified OVF before and after the hyd–deh cycle, histograms were constructed (Fig. 5b). The distribution of OVF data before the cycle showed mean and standard deviation values of 0.51±0.02 (n=28). Particles after the cycle showed mean and standard deviation values of 0.38±0.07 (n=40). The expected OVF and standard deviation is 0.37±0.04. Thus, the hyd–deh cycle effectively lowered the OVF value of the same particle to be closer to that of the expected value. To confirm this statistically, the same Student's t test methodology was employed (see Supplement). Analysis showed that the particles after the cycle were within the 99.9 % confidence interval of the expected value, whereas the particles before the cycle were outside of the range. Furthermore, this experiment confirms the original hypothesis that the core spreading upon dry impaction produces erroneous OVF values, which can be remedied either by performing wet deposition or dry deposition with the subsequent hyd–deh cycle. However, we note that this methodology relies on water uptake and the phase transition from a solid into a liquid and then back to a solid state. At the moment, this approach cannot be readily used on systems that do not undergo solid to liquid phase transitions. Moreover, the particle must have core–shell morphology, but given this limitation, it could still be used to probe multicomponent core–shell particles, such as nascent SSA with more than five different organic components residing within the particle (Cochran et al., 2017).
The importance of accurate organic volume fraction measurements on a single-particle basis can be understood from the perspective of hygroscopicity, or ability of particles to uptake water and act as cloud condensation nuclei. The hygroscopic properties of particles are strongly linked to their chemical composition, where surface-inactive inorganic species such as NaCl typically uptake significantly more water than organic species such as fatty acids (Estillore et al., 2017; Ruehl and Wilson, 2014; Petters and Kreidenweis, 2007). Hygroscopicity is quantified through a parameter κ, where NaCl has a high κ of ca. 1.3 and lipopolysaccharide has a low κ of ca. 0.038 (Schill et al., 2015; Ruehl et al., 2010). The κ values are then used to predict the critical supersaturation of aerosols that potentially grow into clouds, in models such as κ-Köhler theory (Ovadnevaite et al., 2017; Ruehl et al., 2016; Seinfeld et al., 2016; Schill et al., 2015; Morris et al., 2015; Ruehl and Wilson, 2014; Petters and Kreidenweis, 2007).
Importantly, recent works have identified the role of particle mixing states in the hygroscopicity parameter κ (Schill et al., 2015). For a binary internal mixture, the κ was predicted from volume mixing, with , where εi is the volume fraction for each chemical component, εglucose= OVF, and OVF. Thus, using a κ of 1.3 for NaCl and 0.15 for glucose, we evaluated how the previously observed 60 % deviation seen from organic volume fraction measurements (OVF of 0.53 and 0.37 for dry- and wet-deposited particles) on 1:8 (M) glucose : NaCl would propagate to the predicted κmix (Petters and Kreidenweis, 2007; Ruehl et al., 2010). Our data show that resulting κmix, dry was 0.69 and κmix, wet was 0.87, which is more than 20 % underestimation of κmix that could contribute a significant source of error when using the erroneous κ value in climate models. Therefore, this illustrates the necessity for accurate OVF measurements on a single-particle basis, to prevent introducing errors in theoretical models that rely on accurate information on the hygroscopicity of aerosols.
In summary, offline single-particle AFM and bulk ensemble HPLC techniques were used to assess dry and wet deposition effects on the generated and impacted aerosol particles' mixing states that display core–shell morphology. It was tested by quantifying the organic volume fraction of model binary component mixture particles composed of glucose and NaCl at two different molar ratios. For both 1:2 (M) and 1:8 (M) glucose : NaCl mixtures studied here, the measured single-particle OVF from dry deposition showed positive deviations away from the expected values. In the case of 1:2 (M) glucose : NaCl particles, even an artificial OVF size dependence was observed. The positive deviation was found to originate from the inorganic core spreading, resulting in overestimation the volume of the core. However, performing wet deposition on the same mixtures produced single-particle OVF values that converged well with the expected values, with extremely strong statistical significance. Furthermore, data showed that performing a hydration–dehydration cycle on previously dry-deposited particles effectively forced core restructuring through solid to liquid to solid phase transitions, also reproducing accurate single-particle OVF measurements. This particular approach is useful for studies that cannot perform wet deposition but for which the accurate particle morphology is still required. In the future, an analytical study to further test the dry versus wet deposition methods will be performed on increasingly complex mixtures of organic and inorganic systems, including surface-active species. Overall, our findings provide implications of aerosol generation on accurately identifying the mixing state of individual, phase-separated particles. Specifically, the 60 % deviation in OVF was propagated to the be more than 20 % deviation in the predicted hygroscopicity parameter, which is critical for the atmospheric community and climate predicting models that heavily rely on accurate information on the hygroscopicity of aerosols.
The dataset supporting this paper is hosted by the UCSD Library Digital Collections (https://doi.org/10.6075/J04M92SF; Lee et al., 2019).
The supplement related to this article is available online at: https://doi.org/10.5194/amt-12-2033-2019-supplement.
The project directors were EAS and AVT. Experiments were conducted by HDL, CPK, ESH, and EP. Data analysis was conducted by HDL, CPK, ESH, and ZZ. HDL, ESH, EAS, and AVT wrote the paper.
The authors declare that they have no conflict of interest.
This work was supported by the National Science Foundation (NSF) through the NSF Center for Aerosol Impacts on Chemistry of the Environment under grant no. CHE 1801971. HDL was partially supported by a University of Iowa Graduate College Summer Fellowship. Any opinions, findings, and conclusions or recommendations expressed in this material are those of the authors and do not necessarily reflect the views of the National Science Foundation.
This paper was edited by Mingjin Tang and reviewed by three anonymous referees.
Ault, A. P. and Axson, J. L.: Atmospheric Aerosol Chemistry: Spectroscopic and Microscopic Advances, Anal. Chem., 89, 430–452, https://doi.org/10.1021/acs.analchem.6b04670, 2017.
Ault, A. P., Moffet, R. C., Baltrusaitis, J., Collins, D. B., Ruppel, M. J., Cuadra-Rodriguez, L. A., Zhao, D. F., Guasco, T. L., Ebben, C. J., Geiger, F. M., Bertram, T. H., Prather, K. A., and Grassian, V. H.: Size-Dependent Changes in Sea Spray Aerosol Composition and Properties with Different Seawater Conditions, Environ. Sci. Technol., 47, 5603–5612, https://doi.org/10.1021/es400416g, 2013.
Bertram, A. K., Martin, S. T., Hanna, S. J., Smith, M. L., Bodsworth, A., Chen, Q., Kuwata, M., Liu, A., You, Y., and Zorn, S. R.: Predicting the relative humidities of liquid-liquid phase separation, efflorescence, and deliquescence of mixed particles of ammonium sulfate, organic material, and water using the organic-to-sulfate mass ratio of the particle and the oxygen-to-carbon elemental ratio of the organic component, Atmos. Chem. Phys., 11, 10995–11006, https://doi.org/10.5194/acp-11-10995-2011, 2011.
Binnig, G., Quate, C. F., and Gerber, C.: Atomic Force Microscope, Phys. Rev. Lett., 56, 930–933, https://doi.org/10.1103/PhysRevLett.56.930, 1986.
Chi, J. W., Li, W. J., Zhang, D. Z., Zhang, J. C., Lin, Y. T., Shen, X. J., Sun, J. Y., Chen, J. M., Zhang, X. Y., Zhang, Y. M., and Wang, W. X.: Sea salt aerosols as a reactive surface for inorganic and organic acidic gases in the Arctic troposphere, Atmos. Chem. Phys., 15, 11341–11353, https://doi.org/10.5194/acp-15-11341-2015, 2015.
Cochran, R. E., Jayarathne, T., Stone, E. A., and Grassian, V. H.: Selectivity Across the Interface: A Test of Surface Activity in the Composition of Organic-Enriched Aerosols from Bubble Bursting, J. Phys. Chem. Lett., 7, 1692–1696, https://doi.org/10.1021/acs.jpclett.6b00489, 2016.
Cochran, R. E., Laskina, O., Trueblood, J. V., Estillore, A. D., Morris, H. S., Jayarathne, T., Sultana, C. M., Lee, C., Lin, P., Laskin, J., Laskin, A., Dowling, J. A., Qin, Z., Cappa, C. D., Bertram, T. H., Tivanski, A. V., Stone, E. A., Prather, K. A., and Grassian, V. H.: Molecular Diversity of Sea Spray Aerosol Particles: Impact of Ocean Biology on Particle Composition and Hygroscopicity, Chem, 2, 655–667, https://doi.org/10.1016/j.chempr.2017.03.007, 2017.
de Leeuw, G., Andreas, E. L., Anguelova, M. D., Fairall, C. W., Lewis, E. R., O'Dowd, C., Schulz, M., and Schwartz, S. E.: Production Flux of Sea Spray Aerosol, Rev. Geophys., 49, RG2001, https://doi.org/10.1029/2010RG000349, 2011.
DeMott, P. J., Hill, T. C. J., McCluskey, C. S., Prather, K. A., Collins, D. B., Sullivan, R. C., Ruppel, M. J., Mason, R. H., Irish, V. E., Lee, T., Hwang, C. Y., Rhee, T. S., Snider, J. R., McMeeking, G. R., Dhaniyala, S., Lewis, E. R., Wentzell, J. J. B., Abbatt, J., Lee, C., Sultana, C. M., Ault, A. P., Axson, J. L., Martinez, M. D., Venero, I., Santos-Figueroa, G., Stokes, M. D., Deane, G. B., Mayol-Bracero, O. L., Grassian, V. H., Bertram, T. H., Bertram, A. K., Moffett, B. F., and Franc, G. D.: Sea spray aerosol as a unique source of ice nucleating particles, P. Natl. Acad. Sci. USA, 113, 5797–5803, https://doi.org/10.1073/pnas.1514034112, 2016.
Estillore, A. D., Morris, H. S., Or, V. W., Lee, H. D., Alves, M. R., Marciano, M. A., Laskina, O., Qin, Z., Tivanski, A. V., and Grassian, V. H.: Linking hygroscopicity and the surface microstructure of model inorganic salts, simple and complex carbohydrates, and authentic sea spray aerosol particles, Phys. Chem. Chem. Phys., 19, 21101–21111, https://doi.org/10.1039/C7CP04051B, 2017.
Facchini, M. C., Mircea, M., Fuzzi, S., and Charlson, R. J.: Cloud albedo enhancement by surface-active organic solutes in growing droplets, Nature, 401, 257–259, https://doi.org/10.1038/45758, 1999.
Facchini, M. C., Rinaldi, M., Decesari, S., Carbone, C., Finessi, E., Mircea, M., Fuzzi, S., Ceburnis, D., Flanagan, R., Nilsson, E. D., de Leeuw, G., Martino, M., Woeltjen, J., and O'Dowd, C. D.: Primary submicron marine aerosol dominated by insoluble organic colloids and aggregates, Geophys. Res. Lett., 35, L17814, https://doi.org/10.1029/2008gl034210, 2008.
Gan, Y.: Atomic and subnanometer resolution in ambient conditions by atomic force microscopy, Surf. Sci. Rep., 64, 99–121, https://doi.org/10.1016/j.surfrep.2008.12.001, 2009.
Gerber, C.: Atomic Force Microscopy (AFM) the Ultimate Nano Toolkit, Sci. Adv. Mater., 9, 55–55, https://doi.org/10.1166/sam.2017.3018, 2017.
Grayson, J. W., Evoy, E., Song, M., Chu, Y., Maclean, A., Nguyen, A., Upshur, M. A., Ebrahimi, M., Chan, C. K., Geiger, F. M., Thomson, R. J., and Bertram, A. K.: The effect of hydroxyl functional groups and molar mass on the viscosity of non-crystalline organic and organic-water particles, Atmos. Chem. Phys., 17, 8509–8524, https://doi.org/10.5194/acp-17-8509-2017, 2017.
Haywood, J. and Boucher, O.: Estimates of the direct and indirect radiative forcing due to tropospheric aerosols: A review, Rev. Geophys., 38, 513–543, 2000.
Jacobson, M. Z.: Global direct radiative forcing due to multicomponent anthropogenic and natural aerosols, J. Geophys. Res.-Atmos., 106, 1551–1568, https://doi.org/10.1029/2000jd900514, 2001.
Jayarathne, T., Sultana, C. M., Lee, C., Malfatti, F., Cox, J. L., Pendergraft, M. A., Moore, K. A., Azam, F., Tivanski, A. V., Cappa, C. D., Bertram, T. H., Grassian, V. H., Prather, K. A., and Stone, E. A.: Enrichment of Saccharides and Divalent Cations in Sea Spray Aerosol During Two Phytoplankton Blooms, Environ. Sci. Technol., 50, 11511–11520, https://doi.org/10.1021/acs.est.6b02988, 2016.
Krieger, U. K., Marcolli, C., and Reid, J. P.: Exploring the complexity of aerosol particle properties and processes using single particle techniques, Chem. Soc. Rev., 41, 6631–6662, https://doi.org/10.1039/c2cs35082c, 2012.
Laskin, A., Moffet, R. C., Gilles, M. K., Fast, J. D., Zaveri, R. A., Wang, B. B., Nigge, P., and Shutthanandan, J.: Tropospheric chemistry of internally mixed sea salt and organic particles: Surprising reactivity of NaCl with weak organic acids, J. Geophys. Res.-Atmos., 117, D15302, https://doi.org/10.1029/2012jd017743, 2012.
Laskina, O., Morris, H. S., Grandquist, J. R., Estillore, A. D., Stone, E. A., Grassian, V. H., and Tivanski, A. V.: Substrate-Deposited Sea Spray Aerosol Particles: Influence of Analytical Method, Substrate, and Storage Conditions on Particle Size, Phase, and Morphology, Environ. Sci. Technol., 49, 13447–13453, https://doi.org/10.1021/acs.est.5b02732, 2015.
Lee, H. D., Estillore, A. D., Morris, H. S., Ray, K. K., Alejandro, A., Grassian, V. H., and Tivanski, A. V.: Direct Surface Tension Measurements of Individual Sub-Micrometer Particles Using Atomic Force Microscopy, J. Phys. Chem. A, 121, 8296–8305, https://doi.org/10.1021/acs.jpca.7b04041, 2017a.
Lee, H. D., Ray, K. K., and Tivanski, A. V.: Solid, Semisolid, and Liquid Phase States of Individual Submicrometer Particles Directly Probed Using Atomic Force Microscopy, Anal. Chem., 89, 12720–12726, https://doi.org/10.1021/acs.analchem.7b02755, 2017b.
Lee, H. D., Kaluarachchi, C. P., Hasenecz, E. S., Zhu, Z., Popa, E., Stone, E. A., and Tivanski, A. V.: Data from: Dry versus Wet? Implication on Aerosol Impaction and Organic Volume Fraction. In Center for Aerosol Impacts on Chemistry of the Environment (CAICE), UC San Diego Library Digital Collections, https://doi.org/10.6075/J0GH9G3H, 2019.
Lu, J. W., Rickards, A. M. J., Walker, J. S., Knox, K. J., Miles, R. E. H., Reid, J. P., and Signorell, R.: Timescales of water transport in viscous aerosol: measurements on sub-micron particles and dependence on conditioning history, Phys. Chem. Chem. Phys., 16, 9819–9830, https://doi.org/10.1039/c3cp54233e, 2014.
Morris, H., Grassian, V., and Tivanski, A.: Humidity-dependent surface tension measurements of individual inorganic and organic submicrometre liquid particles, Chem. Sci., 6, 3242–3247, https://doi.org/10.1039/c4sc03716b, 2015.
Morris, H. S., Estillore, A. D., Laskina, O., Grassian, V. H., and Tivanski, A. V.: Quantifying the Hygroscopic Growth of Individual Submicrometer Particles with Atomic Force Microscopy, Anal. Chem., 88, 3647–3654, https://doi.org/10.1021/acs.analchem.5b04349, 2016.
O'Dowd, C. D., Facchini, M. C., Cavalli, F., Ceburnis, D., Mircea, M., Decesari, S., Fuzzi, S., Yoon, Y. J., and Putaud, J. P.: Biogenically driven organic contribution to marine aerosol, Nature, 431, 676–680, https://doi.org/10.1038/nature02959, 2004.
Ovadnevaite, J., Zuend, A., Laaksonen, A., Sanchez, K. J., Roberts, G., Ceburnis, D., Decesari, S., Rinaldi, M., Hodas, N., Facchini, M. C., Seinfeld, J. H., and Dowd, C. O.: Surface tension prevails over solute effect in organic-influenced cloud droplet activation, Nature, 546, 637–641, https://doi.org/10.1038/nature22806, 2017.
Petters, M. D. and Kreidenweis, S. M.: A single parameter representation of hygroscopic growth and cloud condensation nucleus activity, Atmos. Chem. Phys., 7, 1961–1971, https://doi.org/10.5194/acp-7-1961-2007, 2007.
Prather, K. A., Bertram, T. H., Grassian, V. H., Deane, G. B., Stokes, M. D., DeMott, P. J., Aluwihare, L. I., Palenik, B. P., Azam, F., Seinfeld, J. H., Moffet, R. C., Molina, M. J., Cappa, C. D., Geiger, F. M., Roberts, G. C., Russell, L. M., Ault, A. P., Baltrusaitis, J., Collins, D. B., Corrigan, C. E., Cuadra-Rodriguez, L. A., Ebben, C. J., Forestieri, S. D., Guasco, T. L., Hersey, S. P., Kim, M. J., Lambert, W. F., Modini, R. L., Mui, W., Pedler, B. E., Ruppel, M. J., Ryder, O. S., Schoepp, N. G., Sullivan, R. C., and Zhao, D. F.: Bringing the ocean into the laboratory to probe the chemical complexity of sea spray aerosol, P. Natl. Acad. Sci. USA, 110, 7550–7555, https://doi.org/10.1073/pnas.1300262110, 2013.
Quinn, P. K., Bates, T. S., Schulz, K. S., Coffman, D. J., Frossard, A. A., Russell, L. M., Keene, W. C., and Kieber, D. J.: Contribution of sea surface carbon pool to organic matter enrichment in sea spray aerosol, Nat. Geosci., 7, 228–232, https://doi.org/10.1038/Ngeo2092, 2014.
Rathnayake, C. M., Metwali, N., Baker, Z., Jayarathne, T., Kostle, P. A., Thorne, P. S., O'Shaughnessy, P. T., and Stone, E. A.: Urban enhancement of PM10 bioaerosol tracers relative to background locations in the Midwestern United States, J. Geophys. Res.-Atmos., 121, 5071–5089, https://doi.org/10.1002/2015jd024538, 2016.
Ruehl, C. R. and Wilson, K. R.: Surface Organic Mono layers Control the Hygroscopic Growth of Submicrometer Particles at High Relative Humidity, J. Phys. Chem. A, 118, 3952–3966, https://doi.org/10.1021/jp502844g, 2014.
Ruehl, C. R., Chuang, P. Y., and Nenes, A.: Aerosol hygroscopicity at high (99 to 100 %) relative humidities, Atmos. Chem. Phys., 10, 1329–1344, https://doi.org/10.5194/acp-10-1329-2010, 2010.
Ruehl, C. R., Davies, J. F., and Wilson, K. R.: An interfacial mechanism for cloud droplet formation on organic aerosols, Science, 351, 1447–1450, 2016.
Russell, L. M., Hawkins, L. N., Frossard, A. A., Quinn, P. K., and Bates, T. S.: Carbohydrate-like composition of submicron atmospheric particles and their production from ocean bubble bursting, P. Natl. Acad. Sci. USA, 107, 6652–6657, https://doi.org/10.1073/pnas.0908905107, 2010.
Santos, S., Barcons, V., Christenson, H. K., Font, J., and Thomson, N. H.: The Intrinsic Resolution Limit in the Atomic Force Microscope: Implications for Heights of Nano-Scale Features, Plos One, 6, e23821, https://doi.org/10.1371/journal.pone.0023821, 2011.
Schill, G. P., De Haan, D. O., and Tolbert, M. A.: Heterogeneous Ice Nucleation on Simulated Secondary Organic Aerosol, Environ. Sci. Technol., 48, 1675–1682, https://doi.org/10.1021/es4046428, 2014.
Schill, S. R., Collins, D. B., Lee, C., Morris, H. S., Novak, G. A., Prather, K. A., Quinn, P. K., Sultana, C. M., Tivanski, A. V., Zimmermann, K., Cappa, C. D., and Bertram, T. H.: The Impact of Aerosol Particle Mixing State on the Hygroscopicity of Sea Spray Aerosol, Acs Central Sci., 1, 132–141, https://doi.org/10.1021/acscentsci.5b00174, 2015.
Seinfeld, J. H., Bretherton, C., Carslaw, K. S., Coe, H., DeMott, P. J., Dunlea, E. J., Feingold, G., Ghan, S., Guenther, A. B., Kahn, R., Kraucunas, I., Kreidenweis, S. M., Molina, M. J., Nenes, A., Penner, J. E., Prather, K. A., Ramanathan, V., Ramaswamy, V., Rasch, P. J., Ravishankara, A. R., Rosenfeld, D., Stephens, G., and Wood, R.: Improving our fundamental understanding of the role of aerosol-cloud interactions in the climate system, P. Natl. Acad. Sci. USA, 113, 5781–5790, https://doi.org/10.1073/pnas.1514043113, 2016.
Song, M., Marcolli, C., Krieger, U. K., Zuend, A., and Peter, T.: Liquid-liquid phase separation in aerosol particles: Dependence on O:C, organic functionalities, and compositional complexity, Geophys. Res. Lett., 39, L19801, https://doi.org/10.1029/2012gl052807, 2012.
Song, Y. C., Haddrell, A. E., Bzdek, B. R., Reid, J. P., Barman, T., Topping, D. O., Percival, C., and Cai, C.: Measurements and Predictions of Binary Component Aerosol Particle Viscosity, J. Phys. Chem. A, 120, 8123–8137, https://doi.org/10.1021/acs.jpca.6b07835, 2016.
Vignati, E., Facchini, M. C., Rinaldi, M., Scannell, C., Ceburnis, D., Sciare, J., Kanakidou, M., Myriokefalitakis, S., Dentener, F., and O'Dowd, C. D.: Global scale emission and distribution of sea-spray aerosol: Sea-salt and organic enrichment, Atmos. Environ., 44, 670–677, 2010.
Wang, X. F., Deane, G. B., Moore, K. A., Ryder, O. S., Stokes, M. D., Beall, C. M., Collins, D. B., Santander, M. V., Burrows, S. M., Sultana, C. M., and Prather, K. A.: The role of jet and film drops in controlling the mixing state of submicron sea spray aerosol particles, P. Natl. Acad. Sci. USA, 114, 6978–6983, https://doi.org/10.1073/pnas.1702420114, 2017.
You, Y., Renbaum-Wolff, L., and Bertram, A. K.: Liquid-liquid phase separation in particles containing organics mixed with ammonium sulfate, ammonium bisulfate, ammonium nitrate or sodium chloride, Atmos. Chem. Phys., 13, 11723–11734, https://doi.org/10.5194/acp-13-11723-2013, 2013.
You, Y., Smith, M. L., Song, M. J., Martin, S. T., and Bertram, A. K.: Liquid-liquid phase separation in atmospherically relevant particles consisting of organic species and inorganic salts, Int. Rev. Phys. Chem., 33, 43–77, https://doi.org/10.1080/0144235x.2014.890786, 2014.