the Creative Commons Attribution 4.0 License.
the Creative Commons Attribution 4.0 License.
 | 07 May 2019
Preparation of primary standard mixtures for atmospheric oxygen measurements with less than 1 µmol mol−1 uncertainty for oxygen molar fractions
Shigeyuki Ishidoya
Nobuhiro Matsumoto
Takuro Watanabe
Takuya Shimosaka
Shohei Murayama
Precise monitoring of changes in atmospheric O2 levels was implemented by preparing primary standard mixtures with less than 1 µmol mol−1 standard uncertainty for O2 molar fractions. In this study, these mixtures were crafted in 10 L high-pressure aluminium alloy cylinders using a gravimetric method in which unknown uncertainty factors were theoretically determined and subsequently reduced. Molar fractions of the constituents (CO2, Ar, O2, and N2) in the primary standard mixtures were mainly resolved using masses of the respective source gases (CO2, Ar, O2, and N2) that had been filled into the cylinders. To precisely determine the masses of the source gases, the difference in mass of the cylinder before and after filling the respective source gas was calculated by comparison with an almost identical reference cylinder. Although the masses of the cylinders filled with the source gas with respect to the reference cylinder tended to deviate in relation to temperature differences between the source-gas-filled cylinder and surrounding air, the degree of the deviation could be efficiently reduced by measuring the two cylinders at the exact same temperature. The standard uncertainty for the cylinder mass obtained in our weighing system was determined to be 0.82 mg. The standard uncertainties for the O2 molar fractions in the primary standard mixtures ranged from 0.7 to 0.8 µmol mol−1. Based on the primary standard mixtures, the annual average molar fractions of atmospheric O2 and Ar in 2015 at Hateruma island, Japan, were found to be 209339.1±1.1 and 9334.4±0.7 µmol mol−1, respectively. The molar fraction for atmospheric Ar was in agreement with previous reports.
- Article
(1288 KB) - Full-text XML
- Companion paper
- BibTeX
- EndNote


Observation of atmospheric O2 molar fractions provides important information about the global carbon cycle (Keeling and Shertz, 1992; Bender et al., 1996; Keeling et al., 1996, 1998a; Stephens et al., 1998; Battle et al., 2000; Manning and Keeling, 2006). For example, long-term observation allows the estimation of land biotic and oceanic CO2 uptake (Manning and Keeling, 2006; Tohjima et al., 2008; Ishidoya et al., 2012a, b). Various measurement techniques have been developed for this purpose, including the utilization of interferometry (Keeling et al., 1998b), mass spectrometry (Bender et al., 1994; Ishidoya et al., 2003; Ishidoya and Murayama, 2014), a paramagnetic technique (Manning et al., 1999; Aoki et al., 2018; Ishidoya et al., 2017), a vacuum-ultraviolet absorption technique (Stephens et al., 2003), gas chromatography (Tohjima, 2000), and a method utilizing fuel cells (Stephens et al., 2007; Goto et al., 2013). In all these cases, calibration using standard mixtures is required to precisely determine the relationship between the analysis output and O2 molar fractions obtained.
Molar fractions of O2 and Ar are commonly expressed as functions of the O2∕N2 and Ar∕N2 ratios relative to an arbitrary reference (Keeling and Shertz, 1992; Keeling et al., 2004) in per meg (1 per meg is equal to ):
In these equations, n depicts the amount of each substance, and the subscripts “sam” and “ref” refer to sample air and reference air, respectively. As the O2 and Ar molar fractions in air are 20.946 % and 0.943 %, respectively, a respective change of 4.8 and 107 per meg in δ(O2∕N2) and δ(Ar∕N2) corresponds to a change of 1 µmol mol−1 in molar fractions of O2 and Ar.
Reported peak-to-peak amplitudes of seasonal cycles and trends in atmospheric δ(O2∕N2) were within the range of 50–150 per meg (10–30 µmol mol−1 for O2 molar fractions) and −20 per meg yr−1 (−4 µmol mol−1 yr−1 for O2 molar fractions; Keeling et al., 1993; Battle et al., 2000; van der Laan-Luijkx et al., 2013). To monitor these slight variations, the development of primary standard mixtures with standard uncertainty of 5 per meg for O2∕N2 ratios (1 µmol mol−1 for O2 molar fractions) or less (Keeling et al., 1993; WMO, 2016) is required. In this study, the primary O2 standard mixture with the recommended uncertainty of 5 per meg (1 µmol mol−1) or less is hereafter referred to as a highly precise O2 standard mixture (HPO).
In general, standard mixtures need to be prepared in which molar fractions of the greenhouse gas species, such as CO2, CH4, and N2O, are stable enough during the observation period to enable monitoring of long-term changes in atmospheric molar fractions of their species. For this purpose, it is indispensable to establish methods for determining absolute molar fractions of greenhouse gases in the standard mixtures with required precision. Approved primary standard mixtures exist for CO2, CH4, and N2O, prepared by manometry (Zhao et al., 1997) or gravimetry (Tanaka et al., 1983; Matsueda et al., 2004; Dlugokencky et al., 2005; Hall et al., 2007). However, preparing an HPO is challenging, since it is necessary to prepare it with the relative uncertainty of less than one-fifth of that for the CO2 molar fraction in the CO2 standard mixture. Since there is no common scale for atmospheric O2 observation, such as the ratio of O2∕N2 determined using HPOs, each laboratory has employed reference air determined using its own reference scale instead of a universal scale. This reference scale is determined based on O2∕N2 ratios in primary standard mixtures filled in high-pressure cylinders and is considered to be sufficiently stable during the observation period (e.g. Keeling et al., 1998b; Tohjima et al., 2008; Ishidoya et al., 2012b). However, there are many deterioration risks of the O2∕N2 ratio in aluminium cylinders used for reference air and the primary standard mixtures. These include fractionations of O2 and N2 induced by pressure, temperature, and water vapour gradients (Keeling et al., 1998b); adsorption–desorption of the constituents on the inner surface (Leuenberger et al., 2015); and permeation or leakage of the constituents from or through the valve (Sturm et al., 2004; Keeling et al., 2007). In order to avoid these risks, the cylinders are handled in accordance with certain best practices, including orienting cylinders horizontally to minimize thermal and gravitational fractionation (Keeling et al., 2007; Leuenberger et al., 2015).
Although causes behind the fractionation should be sufficiently described by now, the effects of permeation and adsorption–desorption have not been completely understood on the long-term scale. To enable comparison of O2∕N2 values reported based on reference air with the difference scale directly, an independent development of primary standard mixtures with standard uncertainty of 5 per meg (1 µmol mol−1) or less is needed. In a pioneering study, Tohjima et al. (2005) first prepared primary standard mixtures for the atmospheric O2 measurement based on a gravimetric method. The standard uncertainties for the O2∕N2 ratio (the O2 molar fraction) were noted at 15.5 per meg (2.9 µmol mol−1), which was larger than the required standard uncertainty of 5 per meg (1 µmol mol−1) or less. Since the 2.9 µmol mol−1 standard uncertainty recorded by Tohjima et al. (2005) was significantly larger than the gravimetrically expected value of 1.6 µmol mol−1, it was suggested that there are unknown factors exerting influence on the mass results of cylinders.
Taking these facts into consideration, in this study we set out to develop a new gravimetric method to prepare an HPO by scientifically understanding the unknown uncertainty factors in the cylinder mass measurement. Our laboratory has built upon the weighing system proposed by Matsumoto et al. (2004), in which gravimetry was used to prepare standard mixtures. Although this system allows accurate mass measurements with a standard uncertainty of 2.6 mg, this proves to be insufficient for preparing an HPO. A new mass comparator with better repeatability was recently introduced to the weighing system. In the present study, we theoretically identified the unknown factors and presented an improved means of minimizing them. The standard uncertainties for molar fractions of all constituents in HPOs, prepared using these improved means, are discussed. Moreover, the molar fractions of all constituents in the HPOs were validated by comparing the gravimetric value with the measured values of the CO2 mole fraction, Ar∕N2 ratio, and O2∕N2 ratio. In order to validate the scale of O2∕N2 ratio at the National Institute of Advanced Industrial Science and Technology (AIST) determined using the HPOs prepared in this study, the annual average of O2∕N2 ratios in 2015 at Hateruma island (24∘03′ N, 123∘49′ E; Japan) obtained from our measurements of air samples was preliminarily compared with the annual average of O2∕N2 ratios in 2015 at Hateruma island on scale of the National Institute for Environmental Studies (NIES) determined by Tohjima et al. (2005, 2008). Additionally, the molar fractions for atmospheric Ar and O2 in air samples were determined using the HPOs and compared with previously reported values.
2.1 Preparation of the highly precise O2 standard mixtures
Eleven HPOs were prepared in 10 L aluminium alloy cylinders (Luxfer Gas Cylinders, UK), with a diaphragm valve (G-55, Hamai Industries Limited, Japan) with polychlorotrifluoroethylene (PCTFE) as sealant in accordance with ISO 6142-1:2015. Pure CO2 (> 99.998 %, Nippon Ekitan Corporation, Japan), pure Ar (G1-Grade, 99.9999 %, Japan Fine Products, Japan), pure O2 (G1-Grade, 99.99995 %, Japan Fine Products, Japan), and pure N2 (G1-Grade, 99.99995 %, Japan Fine Products, Japan) were used as source gases to prepare the HPOs. The value of δ13C in pure CO2 (which was adjusted to the atmospheric level) was −8.92 ‰ relative to the Vienna Pee Dee Belemnite (VPDB). Impurities in the source gases were identified and quantified using gas chromatography with a thermal conductivity detector for N2, O2, CH4, and H2 in pure CO2, and gas chromatography with a mass spectrometer for O2 and Ar in pure N2 and N2 in pure O2. A Fourier transform infrared spectrometer was used for detection of CO2, CH4, and CO in pure N2, O2, and Ar. A galvanic cell-type O2 analyser was employed to quantify O2 in pure Ar. A capacitance-type moisture meter measured H2O in pure CO2, and a cavity ring-down-type moisture meter measured H2O in pure N2, O2, and Ar.
Primarily, standard mixtures of CO2 in Ar were prepared by combining pure CO2 and pure Ar using a gravimetric method. The molar ratios of CO2 to Ar were close to the atmospheric molar ratio of CO2 (400 or 420 µmol mol−1) to Ar (9340 µmol mol−1). The 10 L aluminium cylinder was used to prepare the HPO after evacuation by a turbomolecular pump. The source gases were filled on the order of the mixtures of CO2 in Ar, pure O2, and pure N2 in a filling room where the temperature was controlled at 23±1 ∘C and humidity was not regulated. The mass of the CO2 in the Ar standard mixture filled was determined by the difference in the mass of the cylinder before and after filling with the mixture. The masses of the filled pure O2 and N2 were treated in the same manner. The final pressure in the cylinder was 12 MPa, and masses of the individual gases were approximately 18 g of CO2 in the Ar standard mixture, 300 g of pure O2, and 1000 g of pure N2.
2.2 Weighing procedure for a cylinder
The masses obtained for the cylinders were determined using the same weighing system as reported by Matsumoto et al. (2004), except for the mass comparator. The mass comparator used in the study of Matsumoto et al. was replaced with a new mass comparator (XP26003L, Mettler Toledo, Switzerland), which had a maximum capacity of 26.1 kg, a sensitivity of 1 mg, and a linearity of 20 mg. In this study, a cylinder whose mass was measured is hereafter referred to as a “sample cylinder”. Mass measurement for sample cylinders was performed in a weighing room where temperature and humidity were controlled at 26±0.5 ∘C and 48±1 %, respectively. The temperature, humidity, and atmospheric pressure surrounding our weighing system were measured using a USB connectable logger (TR-73, T and D Corporation, Japan).
Mass measurements of the sample cylinder were conducted with respect to an almost identical reference cylinder aiming to reduce any influence exerted by zero-point drifts, sensitivity issues associated with the mass comparator, changes in buoyancy acting on the cylinder, and/or adsorption effects on the cylinder surface due to the presence of water vapour (Alink and Van der Veen, 2000; Milton et al., 2011). This is carried out according to several consecutive weighing operations in the ABBA order sequence, where “A” and “B” denote the reference cylinder and the sample cylinder, respectively. The process of loading and unloading the cylinders was automated. One complete cycle of the ABBA sequence required 5 min. The “mass reading” recorded by our weighing system was given as the difference between both cylinders mass readings, which was obtained by subtracting the reference cylinder reading from the sample cylinder reading.
Because the output of mass comparators is generally known to be non-linear, there is a tendency to underestimate or overestimate mass readings for the sample cylinders in our weighing system. This is because the relation between the output of mass comparators and the mass of artefacts tends to be different among various scale ranges. To reduce the influence of this non-linearity, sample cylinders were weighed only when the difference in readings between the sample and reference cylinders was less than 500 mg. This was achieved by placing standard weights on a weighing pan alongside the sample or reference cylinder. Any mass differences obtained in our weighing system took into account the masses and buoyancies of the standard weights. The masses of the standard weights were traceable to the International System of Units. The standard uncertainties of the masses were 0.25, 0.045, 0.028, 0.022, 0.018, 0.014, 0.011, and 0.0090 mg for the 500, 100, 50, 20, 10, 5, 2, and 1 g weights, respectively.
Temperatures of the sample and reference cylinders were alternately measured by a thermocouple-type thermometer with a resolution of 0.1 K (TX1001 digital thermometer, probe-90030, Yokogawa Test and Measurement Corporation, Tokyo, Japan) before and after weighing of the cylinders.
2.3 Determination procedure of isotopic abundances for O and N
Each HPO was prepared using pure O2 from two 48 L cylinders and pure N2 from three or four 48 L cylinders as source gases. The isotopic abundances (16O, 17O, 18O, 14N, and 15N) for pure O2 and N2 may be different between cylinders, resulting in abundance differences among each HPO. The averaged values of isotopic abundances in pure O2 (two cylinders) and pure N2 (three or four cylinders) used for the respective HPOs were calculated based on the ratios of 18O∕16O, 17O∕16O, and 15N∕14N in the HPOs. These were calculated using the equations 18O∕16O = × (18O∕16O)ref, 17O∕16O = × (17O∕16O)ref, and 15N∕14N = × (15N∕14N)ref. The terms δ(17O∕16O), δ(18O∕16O), and δ(15N∕14N), which were determined by a mass spectrometer (Delta-V, Thermo Fisher Scientific Inc., USA), represent the deviation from the corresponding atmospheric value (Ishidoya and Murayama, 2014). The isotopic ratios of δ(17O∕16O), δ(18O∕16O), and δ(15N∕14N) were approximately equal to those of δ(17O16O∕16O16O), δ(18O16O∕16O16O), and δ(15N14N∕14N14N), since 17O17O∕16O16O, 18O18O∕16O16O, and 15N15N∕14N14N tended to be much less than 17O16O∕16O16O, 18O16O∕16O16O, and 15N14N∕14N14N. Values of (18O∕16O)ref, (17O∕16O)ref, and (15N∕14N)ref refer to ratios of 18O∕16O, 17O∕16O, and 15N∕14N in reference air. In the present study, natural air in a 48 L aluminium cylinder (cylinder no. CRC00045), equipped with a diaphragm valve (G-55, Hamai Industries Limited, Japan), was used as reference air on the AIST scale (hereafter referred to AIST reference air). The AIST reference air was prepared in 2011 by filling natural air into the cylinder to a pressure of about 13 MPa after drying cryogenically by using a highly efficient water trap at the dew point temperature lower than −80 ∘C (Ishidoya and Murayama, 2014). It has been confirmed that the δ(O2∕N2) on the AIST scale is higher by several hundred per meg than that on the Scripps Institution of Oceanography (SIO) scale (e.g. Manning and Keeling, 2006) by reflecting the difference of the filling years of the respective references for AIST and SIO scales (Ishidoya et al., 2016). The corresponding atmospheric values shown in Table 1 were used as the ratios of (17O∕16O)ref, (18O∕16O)ref, and (15N∕14N)ref, as isotopic abundances in the troposphere are considered to be constant (Junk and Svec, 1958; Baertschi, 1976; Li et al., 1988; Barkan and Luz, 2005). Because differences between isotopic ratios of N2, O2, and Ar in the AIST reference air and air samples at Hateruma were small enough to be negligible, their fractionations due to preparation of the AIST reference air are ignored.
Table 1Isotopic composition and atomic masses of pure oxygen and pure nitrogen used to prepare highly precise O2 standard mixtures (HPOs).
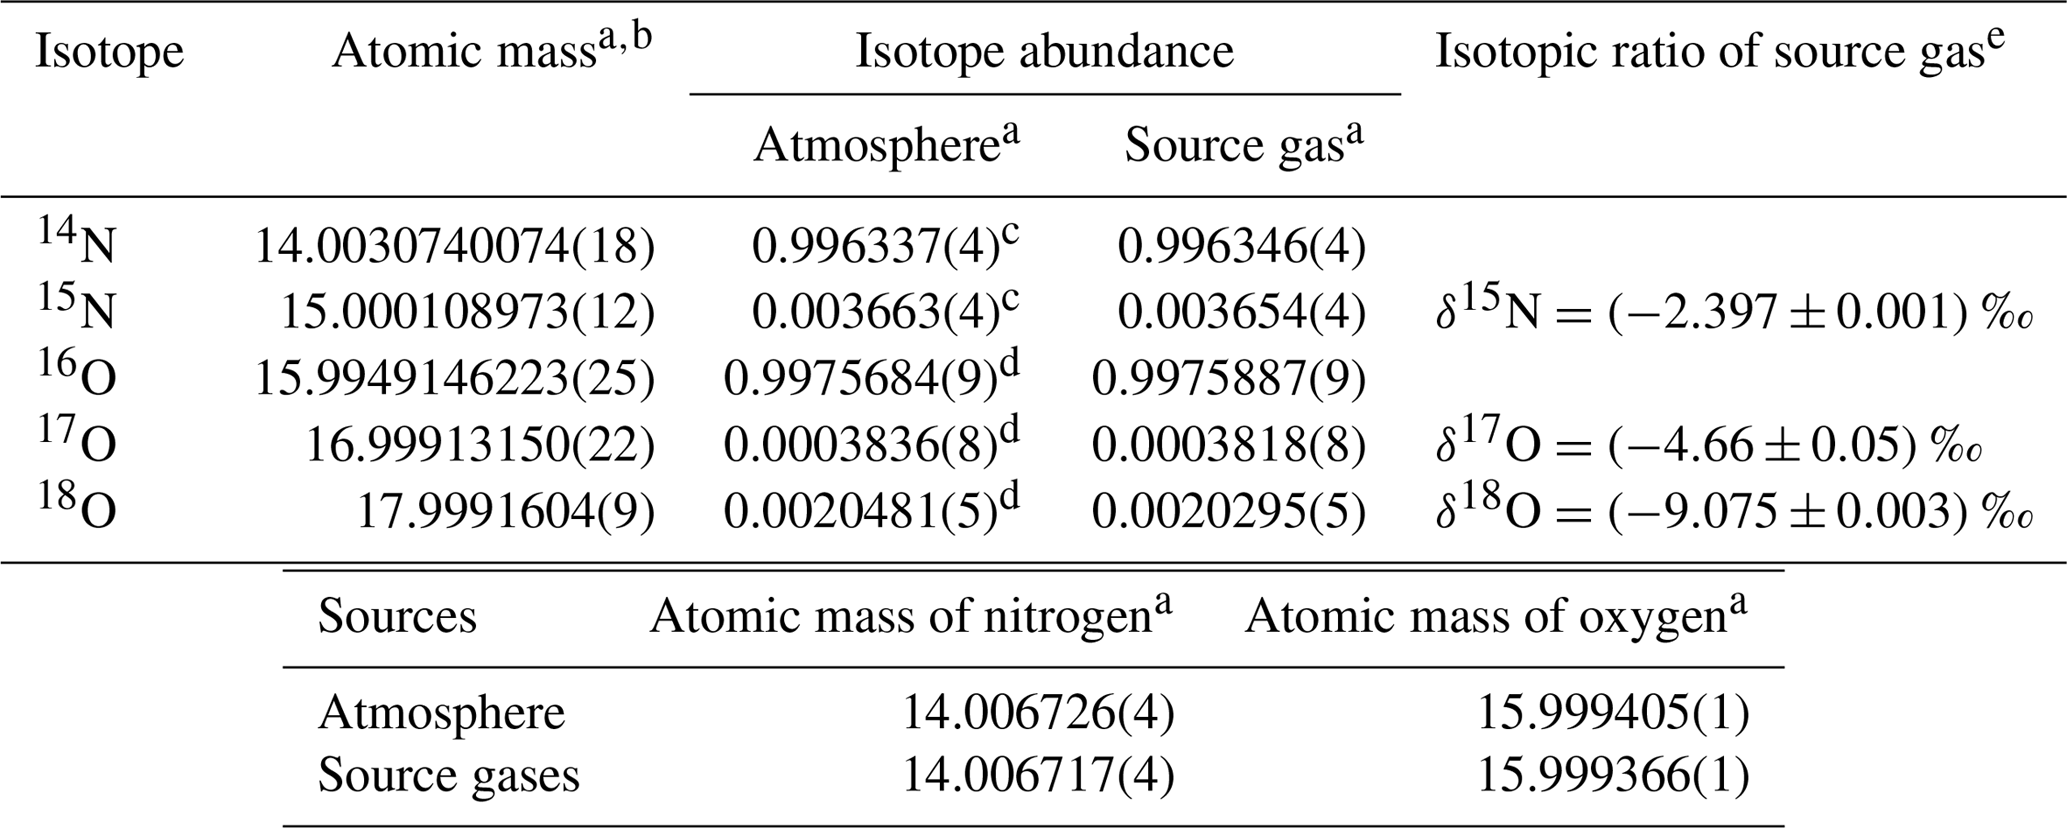
a Numbers in the parentheses represent the standard uncertainty in the last digits. b Atomic mass and the standard uncertainty as determined by De Laeter et al. (2003). c Abundance of the isotope and the standard uncertainty as determined using calculations for the absolute 15N∕14N ratio obtained by Junk and Svec (1958). d Abundance of the isotope and the standard uncertainty were calculated using and ‰ vs. the Vienna Standard Mean Ocean Water (VSMOW) scale as determined by Barkan and Luz (2005). The absolute isotopic ratio for the VSMOW and the standard uncertainty were determined by Li et al. (1988) for 17O∕16O and Baertschi (1976) for 18O∕16O. e Isotopic ratio is defined as the difference in the corresponding atmospheric value (AIST reference air) measured using a mass spectrometer. Numbers following the symbol ± denote the standard uncertainty.
2.4 Analytical methods
In this study, a mass spectrometer was used to determine O2∕N2 and Ar∕N2 ratios in the HPOs. A cavity ring-down spectrometer was used to examine consistency among molar fractions of CO2 in the HPOs. In this section, we describe the analytical methods and relationships between the absolute O2∕N2 (Ar∕N2) ratios and the mass-spectrometry-based isotopic ratios.
2.4.1 Evaluations of O2∕N2 and Ar∕N2 ratios in highly precise O2 standard mixtures and natural air
Ratios of O2∕N2 and Ar∕N2 in the HPOs were validated by comparison of gravimetrically calculated values with the measured values obtained by the mass spectrometer (Delta-V, Thermo Fisher Scientific Inc., USA). The mass spectrometer was adjusted to measure ion beam currents for masses 28 (14N14N), 29 (15N14N), 32 (16O16O), 33 (17O16O), 34 (18O16O), 36 (36Ar), 40 (40Ar), and 44 (12C16O16O) simultaneously. Isotopic ratios of δ(15N14N∕14N14N), δ(17O16O∕16O16O), δ(18O16O∕16O16O), δ(16O16O∕14N14N), δ(36Ar∕40Ar), and δ(40Ar∕14N14N) were determined against the AIST reference air using the mass spectrometer. In our prepared HPOs, the ratios of δ(O2∕N2)HPO_grav and δ(Ar∕N2)HPO_grav, comprised of all isotopes of O2, N2, and Ar and gravimetrically calculated, are not equal to the isotopic ratios of δ(16O16O∕14N14N)HPO_meas and δ(40Ar∕14N14N)HPO_meas measured by the mass spectrometer. This is because the isotopic ratios in source gases are different from the corresponding atmospheric values. The subscripts “HPO_grav” and “HPO_meas” hereafter refer to the gravimetric value and the measured value in the HPO. Thus, mass-spectrometry-based isotopic ratios need to be converted to values equivalent to the δ(O2∕N2)HPO_grav ratio and the δ(Ar∕N2)HPO_grav ratio. The values of δ(O2∕N2)HPO_meas and δ(Ar∕N2)HPO_meas were calculated using mass-spectrometry based on isotopic ratios 15N14N∕14N14N, 17O16O∕16O16O, 18O16O∕16O16O, 36Ar∕40Ar, and 38Ar∕40Ar as depicted in Eqs. (3) and (4). Isotopic species of 17O17O, 18O17O, 18O18O, and 15N15N were negligible because the abundance of these species was very small:
The values of 15N14N∕14N14N, 17O16O∕16O16O, and 18O16O∕16O16O in the HPOs and the AIST reference air were calculated using isotope abundances of O and N determined by the procedure described in Sect. 2.3 (Table 1). The 36Ar∕40Ar ratio of pure Ar filled in the HPOs was calculated using the equation 36Ar∕40Ar = [δ(36Ar∕40Ar)HPO_meas+1] × (36Ar∕40Ar)ref. The δ(36Ar∕40Ar)HPO_meas value was determined by mass spectrometry of the HPOs. The (36Ar∕40Ar)ref value obtained was the atmospheric value 36Ar∕40Ar because isotopic abundances of Ar in the AIST reference air were equal to those of the atmospheric value. The value of 38Ar∕40Ar in the HPOs and the AIST reference air, which could not be measured, was assumed to be 38Ar∕40Ar , taken from previous reports as the atmospheric values. Deviations of respective abundances of 38Ar from the atmospheric value were considered to be less than the uncertainty of the atmospheric value for 38Ar. The atmospheric values of isotopic abundances for Ar were reported in an IUPAC technical report (Böhlk, 2014).
On the other hand, the absolute O2∕N2 ratio in the AIST reference air was calculated by substituting the (O2∕N2)HPO_grav in the HPOs and the δ(O2∕N2)HPO_meas for (O2∕N2)sam and for δ(O2∕N2) in Eq. (1). The absolute Ar∕N2 ratio in the AIST reference air was calculated in same manner (see the Sect. 5.3).
2.4.2 Measurements of CO2 in highly precise O2 standard mixtures
Molar fractions of CO2 in HPOs were verified using a cavity ring-down spectrometer (G2301, Picarro Inc., USA) equipped with a multi-port valve (Valco Instruments Co. Inc., USA) for gas introduction and a mass flow controller (SEC-N112, 100SCCM, Horiba STEC, Co., Ltd, Japan). The cavity ring-down spectrometer was calibrated by three primary standard gases (364.50±0.14, 494.04±0.14, and 500.32±0.14 µmol mol−1) that had been prepared from pure CO2 and purified air (G1 grade, Japan Fine Products, Japan) in accordance with ISO 6142-1:2015. The individual standard gases were continuously measured for 30 min, respectively, and the data from the last 10 min were used. The pure CO2 was the same as the source gas used for preparation of the HPOs.
As previously mentioned, there are several unknown factors that influence mass readings obtained for sample cylinders. Identifying and minimizing these unknown factors is discussed in this section.
3.1 Factors for causing deviations of mass readings
Generally, mass readings of a sample cylinder obtained from a mass comparator tend to vary due to numerous factors such as buoyancy, adsorption–desorption, and thermal effects. The buoyancy effect is caused by changes in the density of the surrounding air due to variations in ambient temperature, humidity, and pressure. The adsorption effect can greatly influence mass readings of a sample cylinder by adsorption and desorption of water vapour from surrounding ambient air on the external surface of a sample cylinder (Alink et al., 2000; Mizushima, 2004, 2007; Milton et al., 2011). The thermal effect is related to temperature gradients between a sample cylinder and the surrounding ambient air (Gläser, 1990, 1999; Mana et al., 2002; Gläser and Borys, 2009; Schreiber et al., 2015), which is able to change the weight force of the sample cylinder through frictional forces exerted on the vertical surface of a sample cylinder and pressure forces on the horizontal surface. Both the frictional and pressure forces are caused by the upward or downward flow of air that is heated or cooled, respectively, by the sample cylinder.
When the ABBA technique is employed for mass measurements under identical experimental conditions, the deviations of the mass readings due to the factors described above become negligible because they are equally exerted on both the sample and the reference cylinder. In fact, the buoyancy effect could be cancelled by adopting the ABBA technique in our mass measurements (see Sect. 4.3.1). On the other hand, the identical experimental conditions tend to be disturbed by the temperature change on the sample cylinder surface by adiabatic compression of the source gases and by the temperature difference between the filling room and the weighing room. Mass readings of the sample cylinder deviate from true values when thermal effects due to a change in the sample cylinder surface temperature are exerted independently and at varying degrees on the sample and reference cylinders. Moreover, the amount of water adsorbed on the sample cylinder surface can also be influenced by humidity if the level in the filling room is different from that in the weighing room. This non-uniformity of temperatures, and the water amount between the sample cylinder surface and the surrounding ambient air, is assumed to be the main contributor of uncertainties in obtained mass readings of the sample cylinder (Matsumoto et al., 2008). In order to identify and minimize the contribution to the non-uniformity, we examined the equilibrium of both humidity and temperature for the surface of the sample cylinder used in this study before carrying out any measurement.
3.2 Identifying and minimizing unknown uncertainty factors
Equilibrium in the temperature and the water amount between the sample cylinder surface and its surrounding ambient air is considered to be achieved by placing the sample cylinder on our weighing system for an appropriate duration of time before the mass reading. Here, the equilibrium between the reference cylinder surface and its surrounding ambient air is always achieved, as the reference cylinder is permanently left on the weighing system. The equilibrium for the sample cylinder is easily disturbed by the processes of its evacuation and filling of the source gases. To quantify the appropriate time interval needed to restore equilibrium, the mass readings of the sample cylinder were recorded after the evacuation and after the filling. These values were plotted against the time elapsed after evacuation and filling (Fig. 1). The surface temperature of the sample cylinder recorded after the evacuation was 2 K lower, while the temperatures recorded after the filling for CO2 in the Ar standard mixture, pure O2, and pure N2 were −0.7, 1, and 6 K higher than those of the reference cylinder, respectively. In this experiment, the equilibria were considered to be achieved when the standard deviation of the mass readings remained constant for 2 or more hours with the repeatability value of < 0.82 mg (see in Sect. 4.3.1). Interestingly, the mass readings recorded after the evacuation and filling for CO2 in Ar mixture tended to decrease as time elapsed, while those after filling with pure O2 and N2 gases tended to increase. Deviations in mass readings had some connection with the temperature difference between the reference and sample cylinders. The results imply that warmer cylinders appear to be lighter.
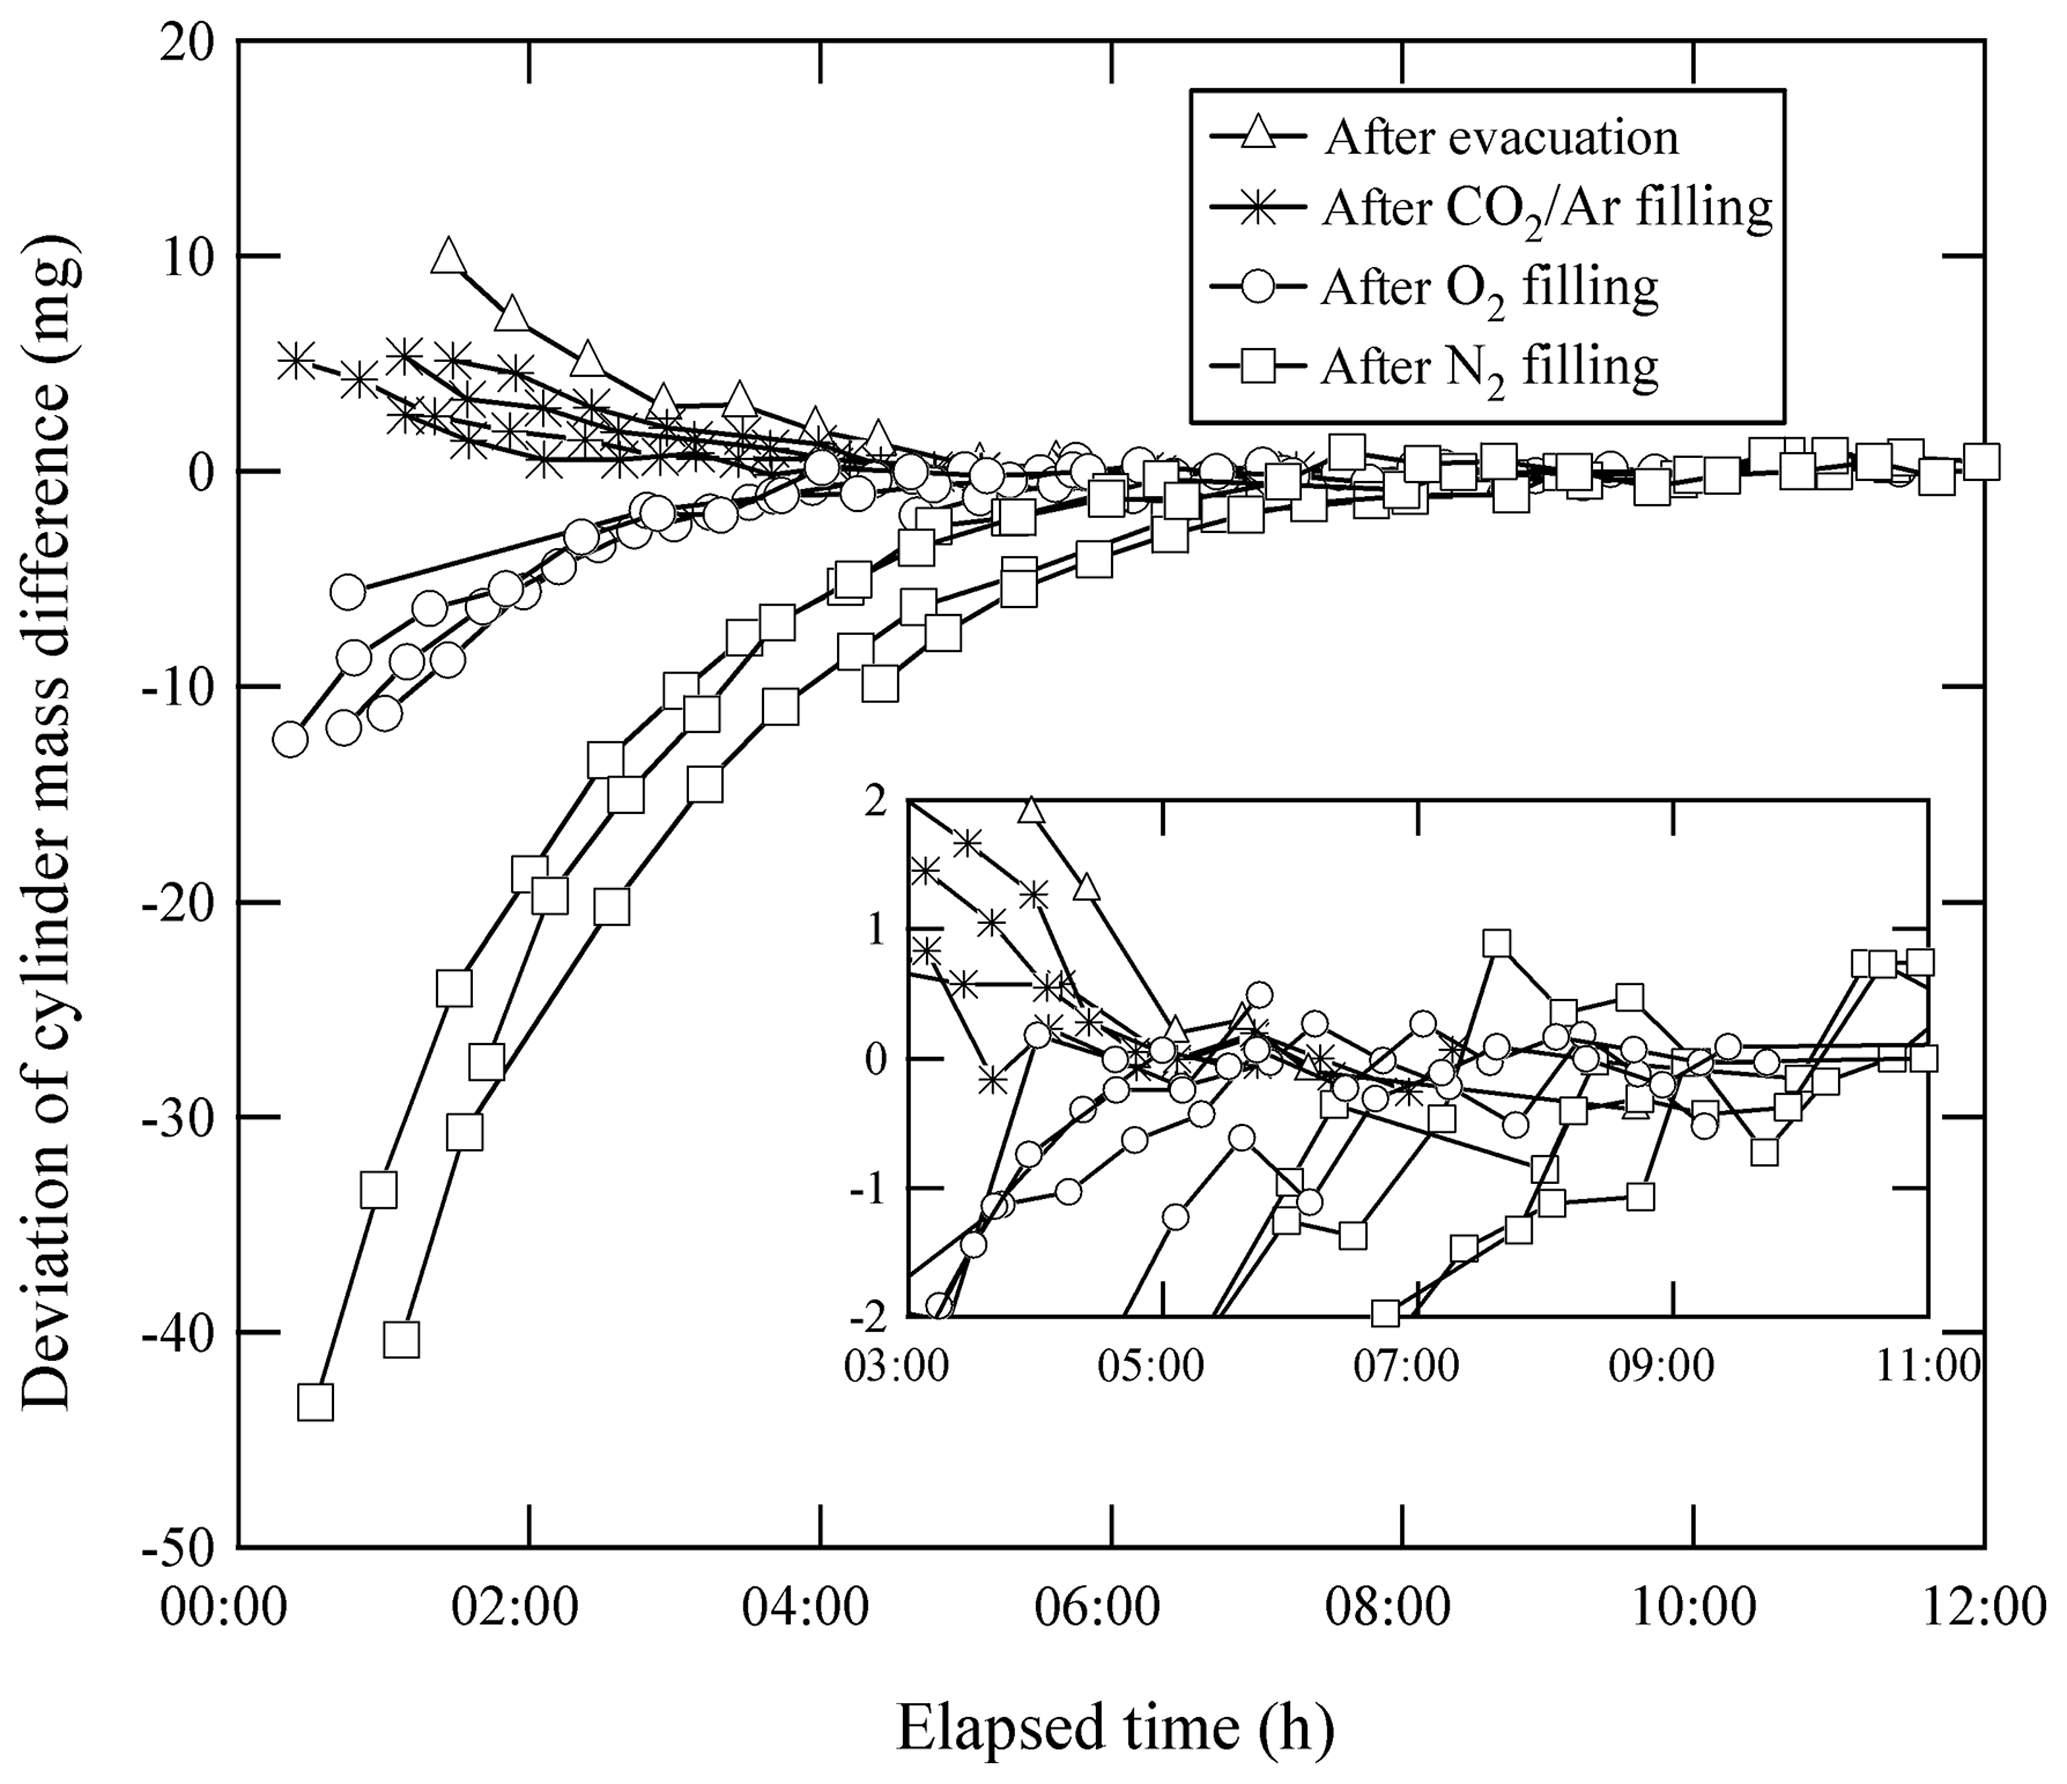
Figure 1Changes in mass readings of sample cylinders plotted against the time elapsed after evacuation of the cylinder and filling of source gases. The mass readings were obtained using the weighing system. Deviation of the mass reading is expressed as the change in amount from the equilibrium value, which was defined as the mass reading when the standard deviation of the values remained constant for 2 or more hours.
Appropriate time intervals were defined as the time elapsed from the evacuation or the filling time to the point of re-achieving equilibrium. This time interval was noted as 5 h after complete evacuation. Time intervals required after filling with relevant gases were different depending on the filled gas species to some extent. For the CO2 in Ar mixture, equilibria were achieved in 3 to 5 h, while 4 to 5 h were required for O2 equilibration, and 7 to 9 h were required for N2. These intervals indicate that preparation of a single HPO requires several days. To determine the mass of the sample cylinder in as little time as possible, a clear indicator for carrying out mass measurement is needed.
As described above, the deviations in mass readings are considered to have some relation with the temperature differences in the sample and reference cylinders. Therefore, we proceeded to examine this relationship to understand whether the temperature difference can be the indicator. The closed squares shown in Fig. 2 indicate that the deviation of mass readings was proportional to temperature differences. This deviation rate was determined to be −14.3 mg K−1. Although the results indicate that a temperature difference of 0.1 K causes a deviation of 1.4 mg, the deviation in the recorded mass readings ensures the repeatability value of 0.82 mg that is achieved by reducing the temperature difference to below 0.06 K. By conducting measurements of the cylinder temperature using the thermocouple-type thermometer and ensuring that the mass readings were taken when the temperature of both cylinders were the same, we were able to reduce the deviation contributing to the mass readings.
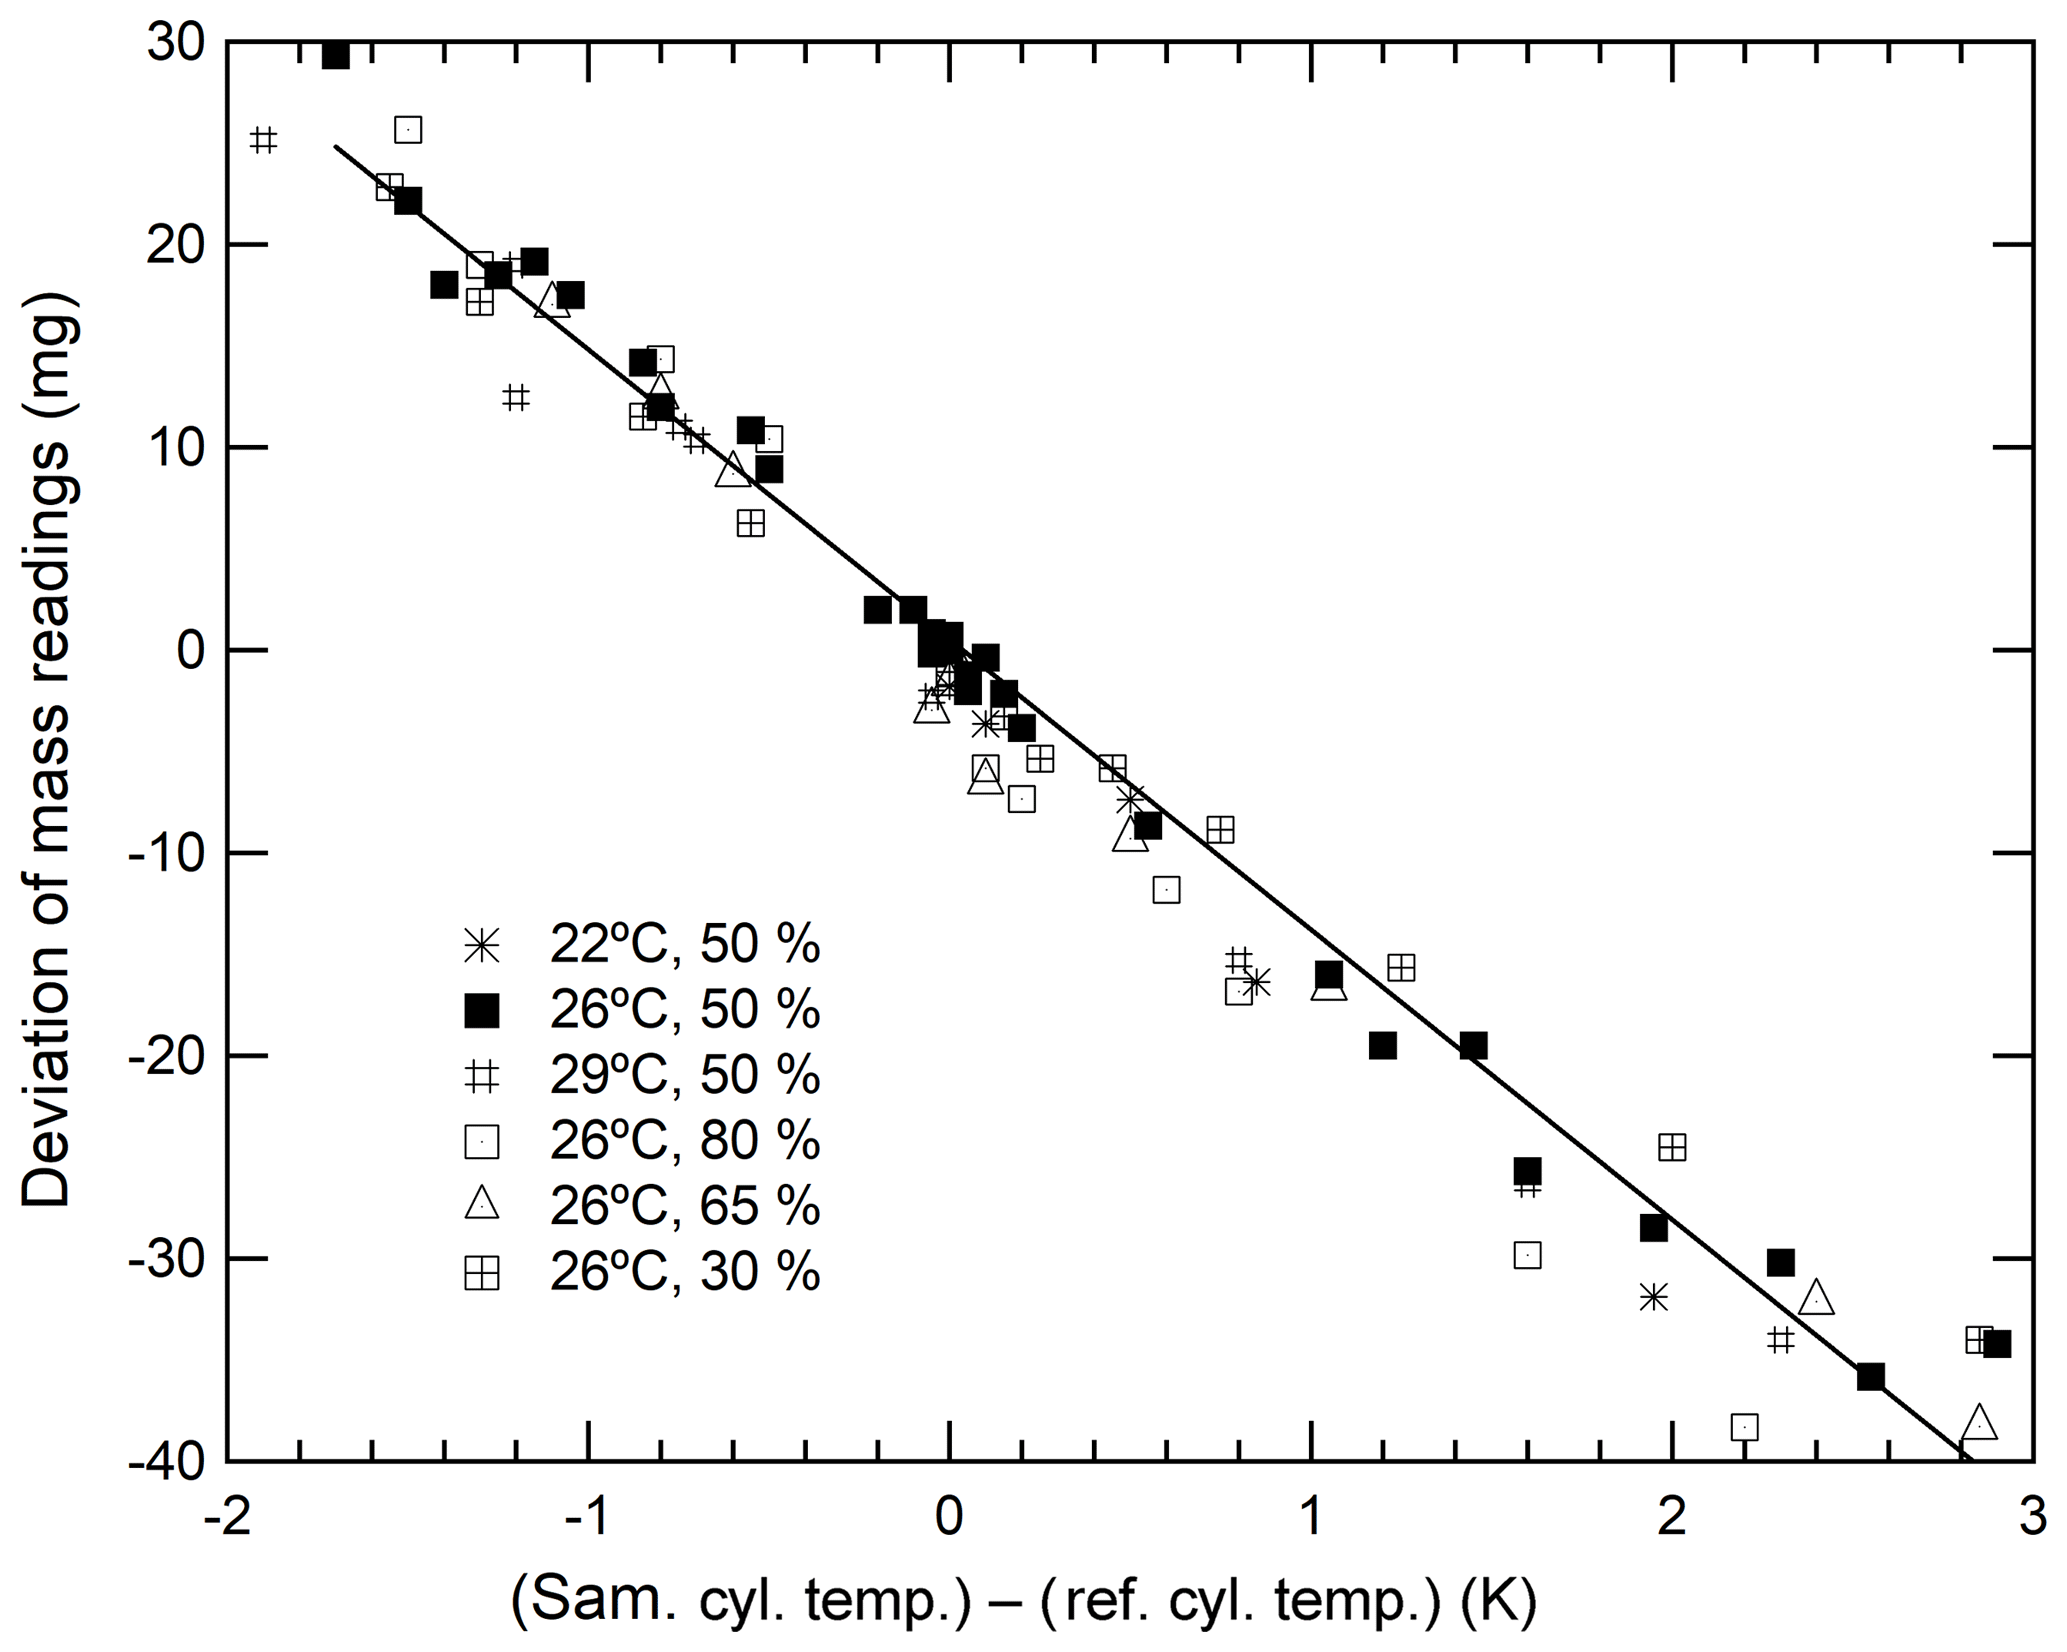
Figure 2Changes in the mass readings observed for sample cylinders plotted against temperature differences obtained under various conditions (a temperature range from 22 to 29 ∘C and a humidity range from 30 % to 80 %.)
To validate the proposed weighing procedure, the reproducibility of mass readings obtained after disturbing the equilibrium was measured. Hence, the mass reading sequence after a cooling or heating cycle of the cylinders was examined. Figure 3 illustrates the results in which four heating cycles (numbers 1 to 4) and four cooling cycles (numbers 5 to 8) were conducted. In this experiment, temperatures of the cooled or heated cylinder were 1 to 3 K lower or 10 to 20 K higher than those of the reference cylinder, respectively. When mass readings were recorded after ensuring equal temperatures of both the sample and reference cylinders, no difference in mass readings recorded after the cooling and heating cycles was detected. The reproducibility of mass readings was estimated to be 0.44 mg with regards to the standard deviation of the mass readings shown in Fig. 3. The fact that reproducibility was lower than the repeatability value validated the weighing procedure. The contributions to mass readings by non-equilibrium conditions were negligible using the established weighing procedure.
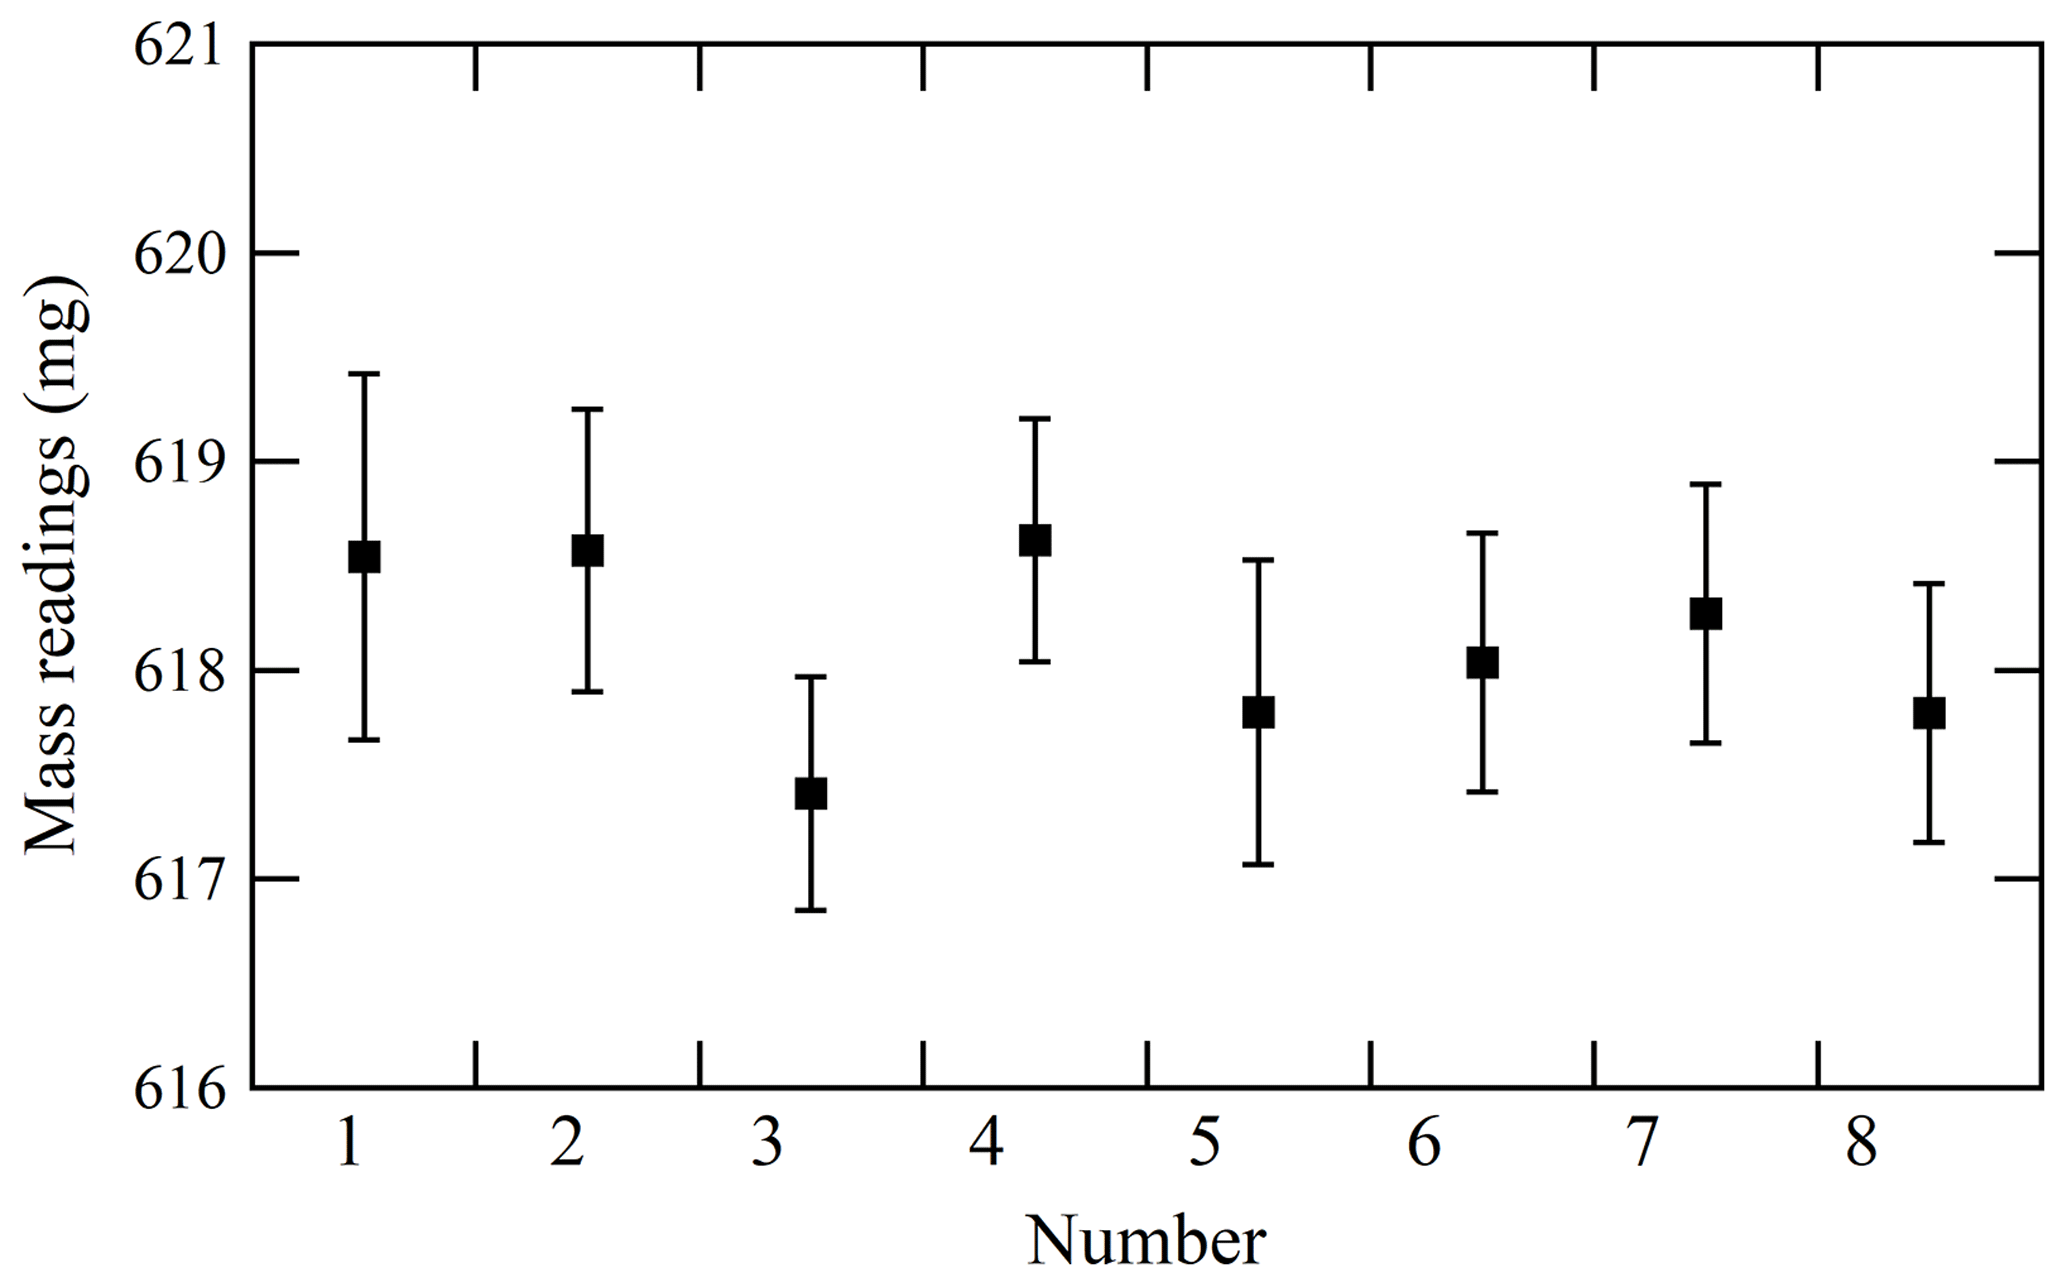
Figure 3Reproducibility of mass readings obtained for the sample cylinder after cylinders had been heated at 40 ∘C (numbers 1 to 4) or cooled at 23 ∘C (numbers 5 to 8). The error bars represent the standard uncertainty.
It is difficult to determine whether deviations in mass readings recorded for sample cylinders were caused by thermal or adsorption effects simply by analysing these results. This is because both effects are related to temperature fluctuations. However, the thermal effect influenced the slope of the calibration function solely through temperature differences, whereas the adsorption–desorption effect influenced the slope of the calibration function via a combination of both ambient temperature and humidity. This is because the adsorbed or desorbed amounts of water on the surface of both cylinders are highly dependent on the cylinder temperature and humidity of the surrounding ambient air. To determine which of these effects contributed the most to the deviations, the relationship between the deviations and temperature differences was investigated under various conditions in the weighing room. Humidity was stringently controlled at 30 %, 50 %, 65 %, and 80 %, whereas temperature levels were maintained at 22, 26, and 29 ∘C. As shown in Fig. 2, the slope neither depended on the humidity nor temperature. These results indicate that the dominant factor of deviations in mass readings was rather an effect of thermal gradients than adsorption because the deviations depended on the temperature difference only. Therefore, we focussed on minimizing the impact of any thermal gradient in further experiments.
In this section, we discuss any uncertainty factors associated with molar fractions of constituents in the HPOs. The gravimetric molar fraction (yk) of the constituent k (CO2, Ar, O2, and N2) was calculated using the molar mass (Mi) and the molar fraction (xi,j) of the constituent i (CO2, Ar, O2, N2, and impurities) in the filled source gas j (CO2 in the Ar standard mixture, pure O2, and pure N2). Additionally, mass (mj) of the source gases filled into the sample cylinder was incorporated into Eq. (5) in accordance with ISO 6142-1:2015:
In this equation, r and q represent the number of source gases j and constituents i, respectively, while xk,j is the molar fraction of the constituent k in the source gas j. Uncertainties (u(yk)) associated with the gravimetric molar fraction were calculated according to the law of propagation:
In this equation, u(A) depicts the standard uncertainty for A. Gravimetric molar fractions of the constituent k and their associated uncertainty in the molar fractions for the HPOs prepared in this study were calculated using Eqs. (5) and (6), and they are listed in Table 2. The standard uncertainties for the constituents N2, O2, Ar, and CO2 were 0.8–1.0, 0.7–0.8, 0.6–0.7, and 0.03 µmol mol−1, respectively. Table 3 lists the contribution of the purity of the source gases, molar masses of the constituents, and masses of the source gases to the gravimetric molar fraction. These correspond to the square root of the first, second, and third terms found in Eq. (6). Uncertainty factors in the gravimetric molar fractions in the HPOs were mainly those of the mass for the source gases filled into the sample cylinder. Contributions from other sources of uncertainty were negligible. Purity of the source gases and molar masses of the constituents i, as well as the masses of the source gases and their associated standard uncertainties, are described in Sect. 4.1, 4.2, and 4.3.
Table 2Gravimetric values of N2, O2, and CO2 molar fractions alongside (O2∕N2)HPO_grav, (Ar∕N2)HPO_grav, δ(O2∕N2)HPO_grav, and δ(Ar∕N2)HPO_grav, and the measured values of CO2 molar fractions in HPOs.
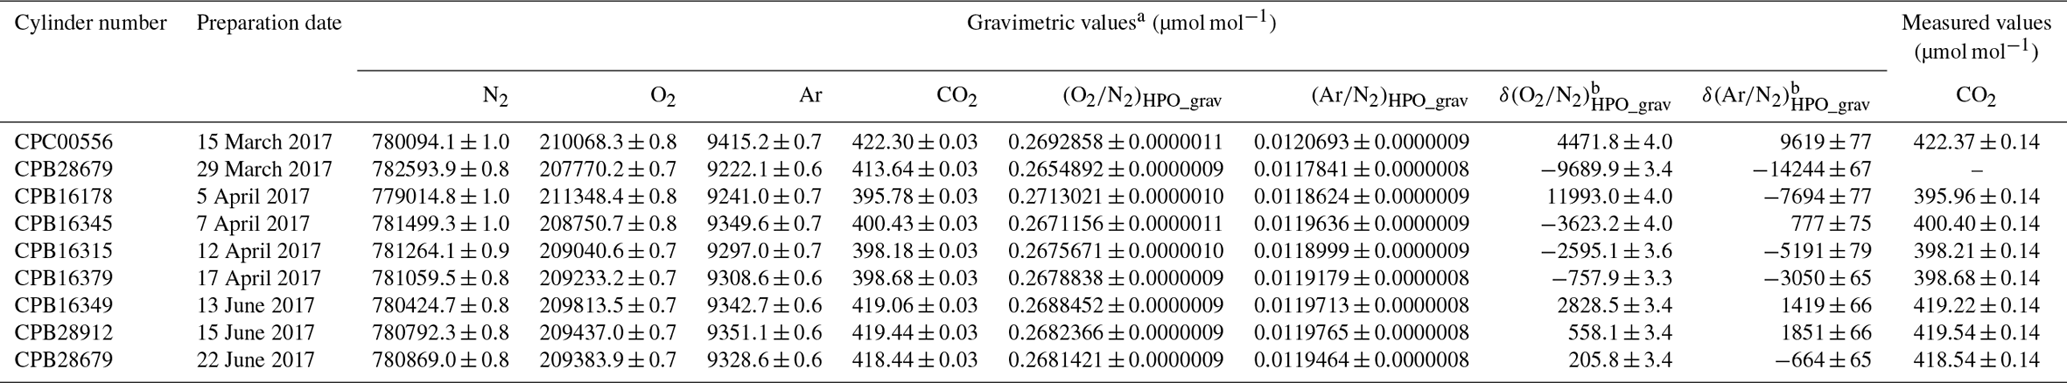
a Numbers following the symbol ± denote the standard uncertainty. b Values were calculated using the absolute O2∕N2 and Ar∕N2 ratio in AIST reference air as described in Sect. 5.1.
4.1 Purity of source gas
Pure O2, N2, Ar, and CO2 were used as source gases to prepare the HPOs. Molar fractions of impurities presented in source gases and their associated standard uncertainties were determined based on the primary standard gases prepared in accordance with ISO 6142-1:2015. When the molar fraction of impurity h was under its detection limit (Lh), the molar fraction (xh) and standard uncertainty (u(xh,j)) of h in the source gas j were calculated using the equations and . The calculated values for the impurities and purities of the source gases are listed in Table 4.
4.2 Molar masses of constituents
Molar masses (Mi) of the constituents were calculated using most recent atomic masses and isotopic abundances reported by the IUPAC. However, IUPAC values for atomic masses of O and N have large standard uncertainties because they reflect variability present in individual isotopic abundances of natural terrestrial matter. Using IUPAC values, standard uncertainties for N2 and O2 molar fractions in the HPOs were calculated to be 4 µmol mol−1. In addition, atmospheric values of their isotopic abundances could not be used for calculating molar masses of the source gases even though pure O2 and N2 were produced from air. This is because isotopically abundant O and N in pure O2 and N2 tend to deviate from the corresponding atmospheric value during the production process. Therefore, the isotopic abundances of O and N in HPOs were precisely determined using mass spectrometry. Their isotopic abundance and associated standards of uncertainty are shown in Table 1. The difference of isotopic abundances of O and N between respective HPOs was negligible.
Based on the isotopic abundances obtained in this study and the atomic masses of O and N in the filled source gases, pure O2 and N2 were determined with relative standard uncertainties of 0.000029 % and 0.000006 %, respectively. It was shown that the uncertainty in molar masses is negligible (Table 3). Although the grade and supplier of the pure O2 and N2 used in this study were the same as those of the source gases used by Tohjima et al. (2005), the atomic masses (15.999366(1) for O and 14.006717(4) for N) obtained for the two elements were different from reported values of Tohjima et al. (2005; 15.999481(8) for O and 14.006677(4) for N). These differences resulted in a deviation of 0.4 µmol mol−1 and 1.2 µmol mol−1 for O2 and N2, respectively. Since these results infer that the ratios of O and N isotopes change with production time, the isotopic abundances of O and N in the source gases have to be precisely determined whenever HPOs are prepared using different pure O2 and N2. On the other hand, standard uncertainties in the atomic mass presented in an IUPAC technical report by De Laeter et al. (2003) were sufficient for further use in the case of Ar and CO2 as source gases.
Table 3Typical contribution of each source of uncertainty (including the mass of the source gas, molar mass, and purity) to the standard uncertainties obtained for the molar fractions of N2, O2, Ar, and CO2 in the HPO.
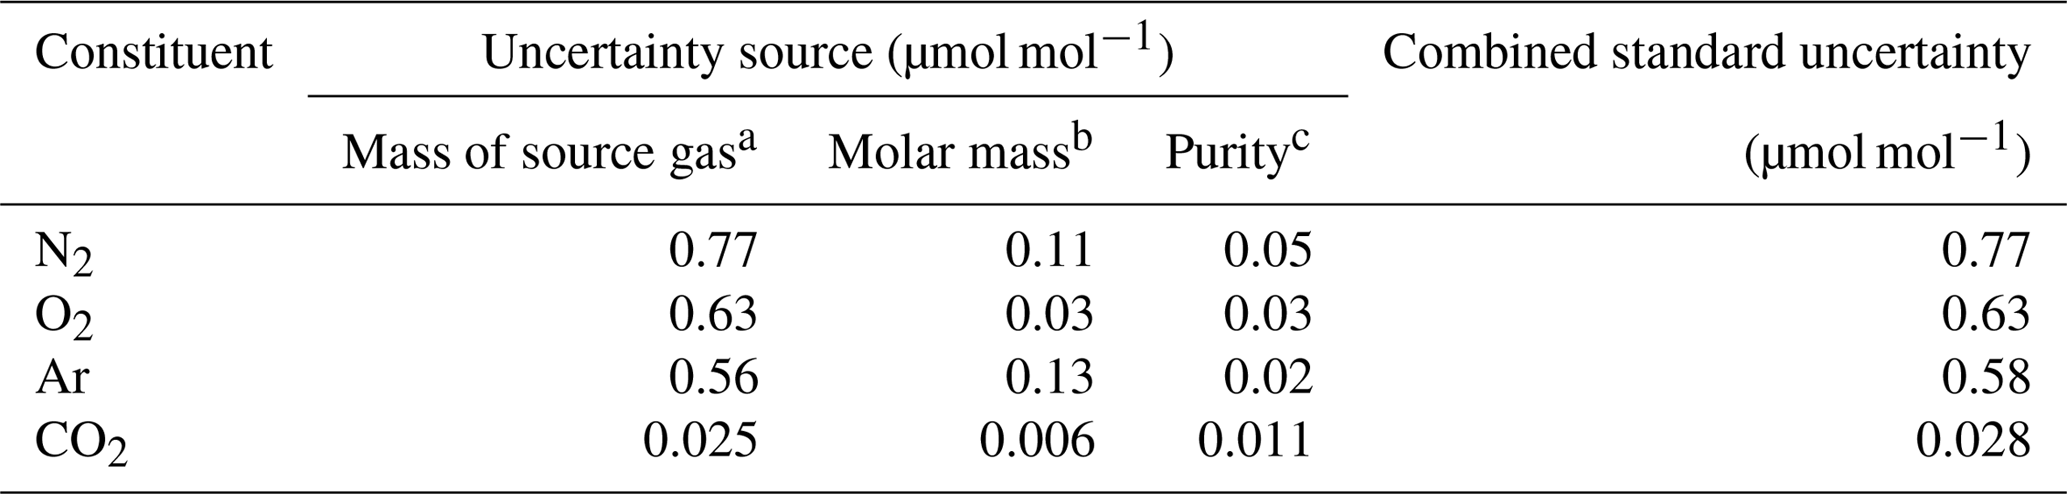
a The values were calculated in the procedure described in Sect. 4.3. b The values were calculated in the procedure described in Sect. 4.2. c The values were calculated in the procedure described in Sect. 4.1.
Table 4Impurities in source gases for preparation of HPOs.

Numbers following the symbol ± denote the standard uncertainty. “–” represents the constituents which were not measured.
4.3 Determining the masses of the filled gases
Masses of individual gases that were filled into the sample cylinders were calculated using the mass difference before and after the filling. The standard uncertainty of the obtained mass was calculated by combining standard uncertainties of mass readings of the sample cylinder before and after filling each gas. To determine uncertainty in mass reading of the sample cylinder, three factors were evaluated, i.e. the repeatability u(mrep) of the mass readings, permeation u(mgas permeate) of the source gases during weighing, and buoyancy change u(mbuoyancy) due to the expansion of the cylinder. The standard uncertainties (u(mcyl)) were defined according to Eq. (7):
These factors are discussed in detail in Sect. 4.3.1, 4.3.2, and 4.3.3. The standard uncertainties of masses for the individual filled gases were 1.2 mg, regardless of the gas species.
4.3.1 Repeatability of mass readings
The repeatability of mass readings was evaluated by continuous mass measurement of sample cylinders using the ABBA technique over 3 d. This is because preparation of a single HPO requires 3 d. Mass readings were recorded after the sample cylinder was left on the weighing system for at least a week. Air density was likewise measured for 3 d by carefully monitoring temperature, humidity, and pressure changes in ambient air (Fig. 4). Our findings indicate that the mass readings remain stable during the 3 d experiment. The standard deviation of mass readings (0.82 mg) is represented as repeatability u(mrep). The fact that the mass readings were not affected by changes in the air density also indicates that buoyancy issues influencing the sample cylinder were cancelled out by changes simultaneously affecting the reference cylinder.
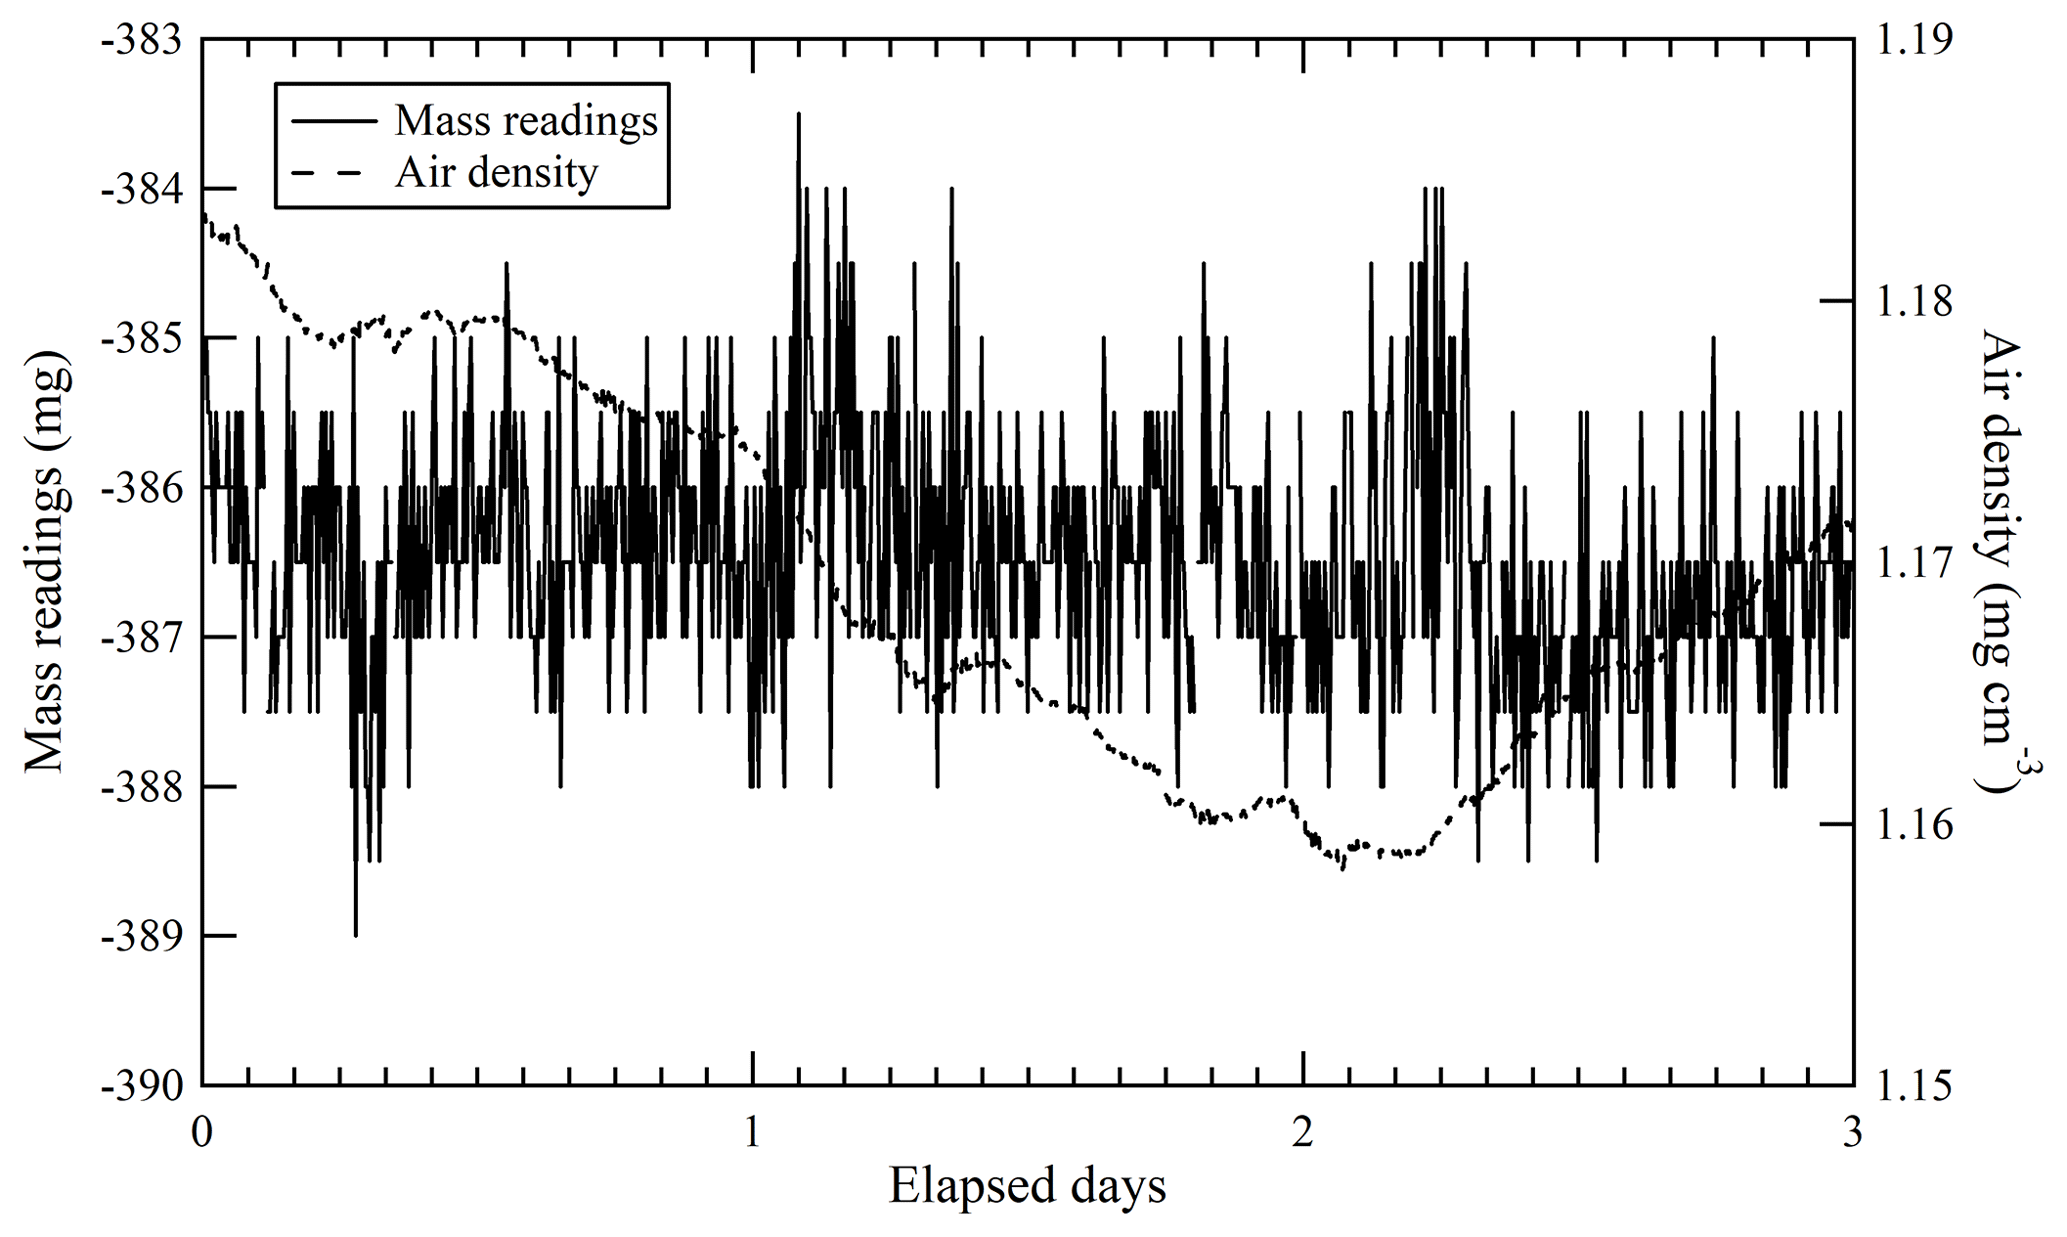
Figure 4Repeatability of mass readings obtained for the sample cylinders and ambient air density for 3 d. Solid and dashed lines represent mass readings and ambient air density, respectively.
4.3.2 Permeation of source gases during weighing
All of the cylinders used in this study have diaphragm valves, which were joined to the cylinders via pipe fittings and sealed with Teflon tape. The seal of diaphragm valves was made from PCTFE, through which gases tend to permeate quite slowly (Sturm, 2004). Since permeation of the source gases during weighing the sample cylinders resulted in evaluation error of the masses for the source gases, we examined the permeability of purified air by monitoring mass of the sample cylinder filled with purified air at a pressure of 8 MPa. The changes in mass readings were measured for over 4 months. From these results, it was determined that the permeability was 0.013 mg d−1. This effect was considered to be negligible because it is much lower than the repeatability. Therefore, the contribution of permeability (u(mgas permeate)) to the standard uncertainty calculations (u(mcyl)) was ignored. On the other hand, the amount of air permeating from the sample cylinder during the course of a year was calculated to be about 4.7 mg. This quantity may cause changes in the composition of the HPO if the mixture is kept for extended periods of time, since the gas permeability depends on the gas species (Sturm, 2004).
4.3.3 Buoyancy effect of cylinder expansion
Oh et al. (2013) reported that volume in the 10 L aluminium cylinders linearly increases with an increase in internal pressure, and volume expansion was determined to be 24±2 mL when the pressure difference in the sample cylinders was 12 MPa. Tohjima et al. (2005) likewise reported a volume expansion of 22±4 mL when the pressure difference was 10 MPa. In this study, we adopted a volume expansion of the sample cylinders that was 55±5 mL, measured by a cylinder supplier, when the pressure difference was 25 MPa. Compared to the expansion rate with respect to pressure variations reported by Oh (2013; 2.0±0.2 mL MPa−1) and Tohjima (2005; 2.2±0.4 mL MPa−1), the expansion rate of the sample cylinders used in this study was determined to be 2.2±0.2 mL MPa−1. The pressure difference recorded before and after filling with source gases was 0.12, 2.5, and 9.4 MPa for CO2 in the Ar standard mixture, pure O2, and pure N2, respectively. These pressure differences were subsequently used to calculate buoyancy effects, which were reported as 0.3, 6.4, and 23.9 mg for CO2 in the Ar standard mixture, pure O2, and pure N2, respectively. In turn, these buoyancy effects caused changes in the gravimetric molar fraction of +0.5 and −0.5 µmol mol−1 for O2 and N2, respectively. The final mass readings were corrected to take these changes into account. The standard uncertainties u(mbuoyancy) in linear expansion were considered to be negligible.
The O2 molar fractions in the HPOs deviate from gravimetric values with deviation of the molar fractions of other constituents. In this section, the molar fractions of all constituents were validated. The gravimetric and measured values for the CO2 molar fractions were compared, along with the values of δ(Ar∕N2)HPO_grav, δ(Ar∕N2)HPO_meas, δ(O2∕N2)HPO_grav, and δ(O2∕N2)HPO_meas, to validate the molar fractions of Ar, O2, and N2 in the HPOs. Table 5 shows the δ(O2∕N2)HPO_meas and δ(Ar∕N2)HPO_meas values calculated using Eqs. (3) and (4) as well as the values for δ(15N14N∕14N14N)HPO_meas, δ(17O16O∕16O16O)HPO_meas, δ(18O16O∕16O16O)HPO_meas, δ(16O16O∕14N14N)HPO_meas, δ(36Ar∕40Ar)HPO_meas, and δ(38Ar∕40Ar)HPO_meas.
Table 5δ(15N14N∕14N14N)HPO_meas, δ(17O16O∕16O16O)HPO_meas, δ(18O16O∕16O16O)HPO_meas, δ(16O16O∕14N14N)HPO_meas, δ(36Ar∕40Ar)HPO_meas, and δ(40Ar∕14N14N)HPO_meas measured by the mass spectrometer. δ(O2∕N2)HPO_meas and δ(Ar∕N2)HPO_meas are calculated using Eqs. (3) and (4), and differences between δ(O2∕N2)HPO_meas and δ(16O16O∕14N14N)HPO_meas are also shown.

These values are on the AIST scale, i.e. determined against AIST reference air and are given in per meg. Numbers following the symbol ± denote the standard uncertainty.
5.1 Determining the absolute (O2∕N2) and (Ar∕N2) ratios in AIST reference air
The absolute (O2∕N2)HPO_grav and (Ar∕N2)HPO_grav ratios, as well as the δ(O2∕N2)HPO_meas and δ(Ar∕N2)HPO_meas values of the HPOs, are listed in Tables 2 and 5. Using these values, the absolute ratios for O2∕N2 and Ar∕N2 in AIST reference air were 0.2680929±0.0000016 and 0.0119542±0.0000009, respectively. On the AIST scale, these values corresponded to δ(O2∕N2) =0 and δ(Ar∕N2) =0. Associated standard uncertainties were determined with regards to the law of propagation of uncertainty.
The HPOs prepared in this study did not include minor components of Ne, He, Kr, CH4, H2, and N2O which are present in air samples. Therefore, the variation in the δ(15N14N∕14N14N), δ(17O16O∕16O16O), δ(18O16O∕16O16O), δ(16O16O∕14N14N), δ(36Ar∕40Ar), and δ(40Ar∕14N14N) values obtained by the measurement of mass spectrometry was examined when molar fractions of Ne change from 0 to 500 µmol mol−1. Consequently, the isotopic ratios did not change significantly depending on Ne. Since abundance of Ne is highest in minor components, the changes of the molar fractions of other minor components also might fail to affect the isotopic ratios measured in this study.
5.2 CO2 molar fractions and Ar∕N2 ratio
Three primary standard gases were used to measure CO2 molar fractions in HPOs. Table 2 illustrates the gravimetric and measured values and associated standard uncertainties. The CO2 molar fractions in the cylinder labelled CPB28679, which had been prepared on 29 March 2017, were not measured. Differences between the gravimetric and measured values (obtained by subtracting the measured value from gravimetric value) were found to range from −0.17 to 0.03 µmol mol−1. The gravimetric values were in line with the measured values, both being within the accepted levels of uncertainty.
From these results, mass of the CO2 in the Ar standard mixture which we evaluated was considered to be validated. Figure 5 shows the plot of the δ(Ar∕N2)HPO_meas values relative to the δ(Ar∕N2)HPO_grav values as well as the residuals of the δ(Ar∕N2)HPO_meas values that had been estimated using the best fitted line by the least-squares method. The standard deviation of the residuals was 78 per meg. This standard deviation represents a scatter in the (Ar∕N2)HPO_grav values, since the standard uncertainty for δ(Ar∕N2)HPO_meas was much smaller than the obtained standard deviation (Ishidoya and Murayama, 2014). The standard uncertainties for δ(Ar∕N2)HPO_grav values ranged from 65 to 77 per meg. Standard uncertainties were comparable to the standard deviations obtained for the residuals, supporting the validity of uncertainty calculations for the constituents, Ar and N2.
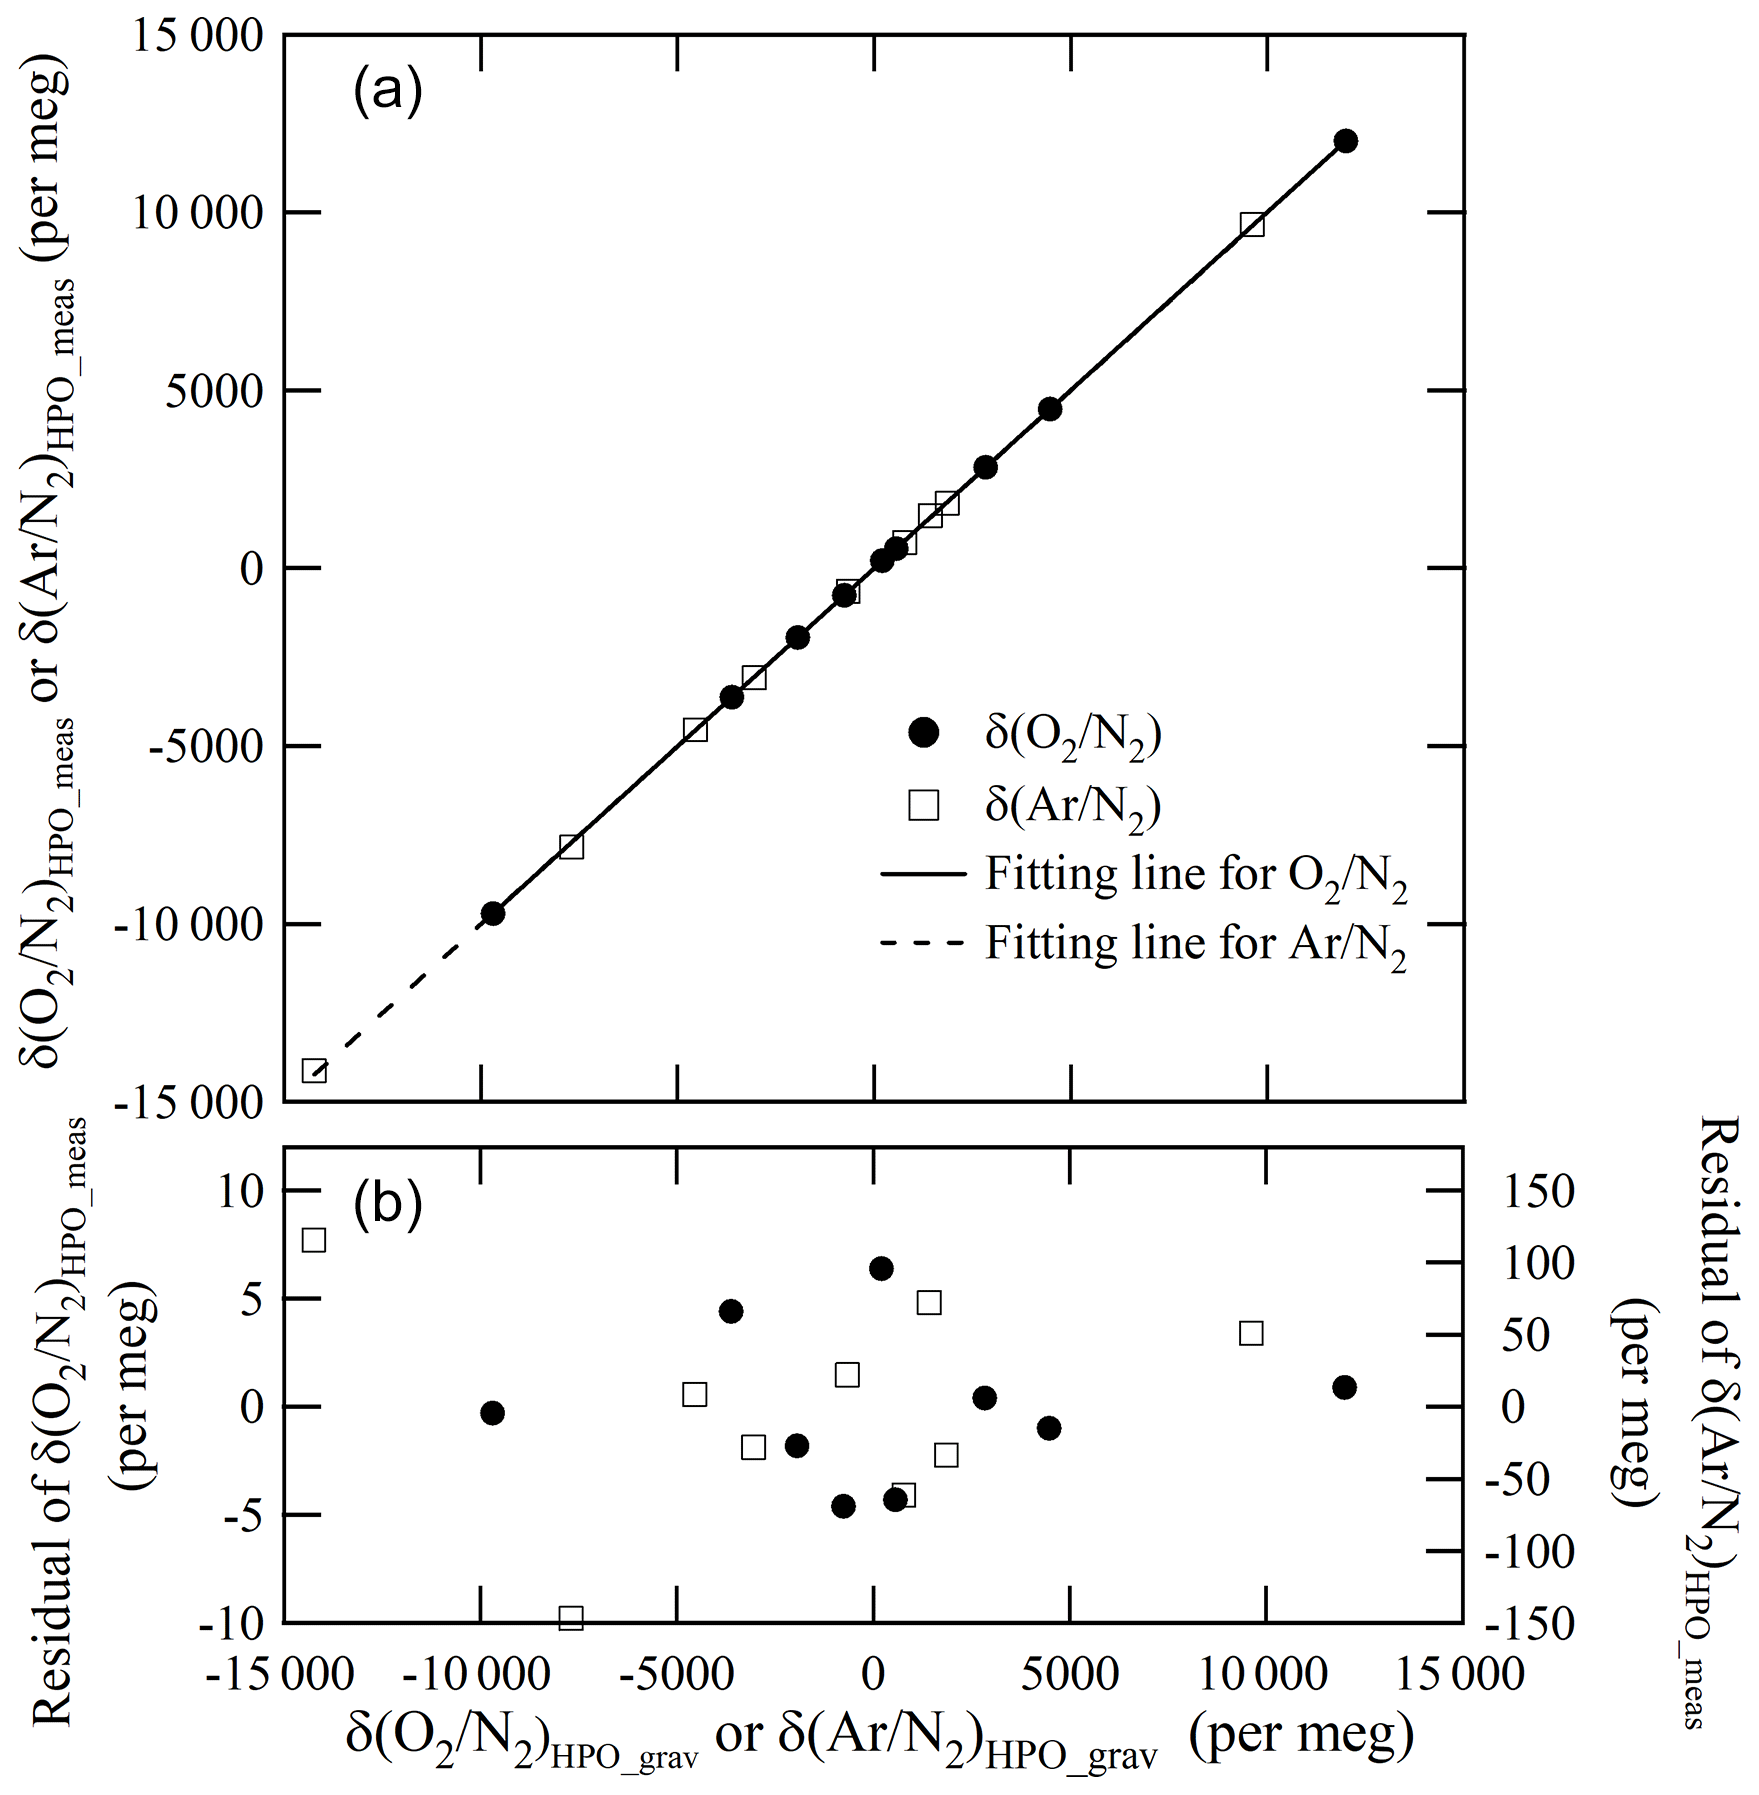
Figure 5Relationship between δ(O2∕N2)HPO_grav and δ(Ar∕N2)HPO_meas on the AIST scale (a). Fitting residuals δ(O2∕N2)HPO_meas and δ(Ar∕N2)HPO_meas are likewise shown (b).
5.3 O2∕N2 ratio
Figure 5 shows a plot of the δ(O2∕N2)HPO_meas values listed in Table 5 against the δ(O2∕N2)HPO_grav values listed in Table 2 as well as residuals from the fitted line by the least-squares method. The slope of the fitted line was determined to be 1.00162±0.00029, which indicated that the discrepancy between change rates of the δ(O2∕N2)HPO_meas values and the δ(O2∕N2)HPO_grav values was within 0.16 %. The standard deviation of the residuals was 3.6 per meg, which proved to be in line with the standard uncertainties for the corresponding gravimetric values, since the standard uncertainties for the values of δ(O2∕N2)HPO_grav ranged from 3.2 to 4.0 per meg. The agreement with the gravimetric and measured values reinforced the idea that the method for calculating the uncertainties of the constituents, O2 and N2, was proper and accurate. On the other hand, the δ(O2∕N2)HPO_meas values were lower than their δ(16O16O∕14N14N)HPO_meas counterparts by 18.2 to 27.1 per meg (Table 5), and differences were larger than the standard uncertainties obtained for both values. This means that the δ(O2∕N2) values in the HPOs should be expressed by δ(O2∕N2)HPO_meas rather than δ(16O16O∕14N14N)HPO_meas.
The O2∕N2 ratio of gases delivered from the cylinders may differ from the gravimetric O2∕N2 ratio by either homogeneous or inhomogeneous fractionation (Leuenberger et al., 2015; Langenfelds et al., 2005; Keeling et al., 2004). In this study, we used the same type of valves and cylinders as in the study of Tohjima et al. (2005). Tohjima et al. examined changes in the O2∕N2 ratio of the HPOs by releasing the inner air into a room at a flow rate of 8 mL min−1 and found that the fractionation of O2 and N2 during air release was negligible. Therefore, we chose not to evaluate fractionation in this study.
To confirm the consistency of the results obtained using the HPOs, we preliminarily compared O2∕N2 ratios on both the AIST and NIES scale using the annual average of δ(O2∕N2) values in the air sample from Hateruma island collected from January to December in 2015. Additionally, the molar fractions of atmospheric O2 and Ar were determined based on the HPOs and then compared with previously reported values to confirm consistency of the results.
6.1 Comparison between O2∕N2 ratios on the AIST and NIES scales
We observed the atmospheric δ(O2∕N2) by analysing air samples collected at Hateruma island from January to December in 2015. For the air samples, we confirmed that the isotopic ratios of N2 and O2 did not differ significantly from the atmospheric values, so we regard the δ(16O16O∕14N14N) value measured by the mass spectrometer as being equivalent to δ(O2∕N2) in Eq. (1). Twice a month, the air samples were collected in two Pyrex glasses arranged in series (one for AIST and the other for NIES). Using these air samples, we determined that the annual average of δ(O2∕N2) in 2015 on the AIST scale was per meg. The number following the symbol ± denotes the standard uncertainty of the measurement. Using Eq. (1), the δ(O2∕N2) value on the AIST scale was then converted to the absolute O2∕N2 ratio by utilizing the absolute ratio of O2∕N2 in AIST reference air determined in Sect. 5.1. In 2015, the absolute O2∕N2 ratio on Hateruma island was 0.2680761±0.0000018. This value can be converted to the corresponding δ(O2∕N2) value on the NIES scale using Eq. (1), since the absolute O2∕N2 ratio in NIES reference air was reported to be 0.2681708 by Tohjima et al. (2005). The converted δ(O2∕N2) value, which is expressed as δ(O2∕N2)NIES on AIST in the following descriptions, was found to be per meg on the NIES scale. The uncertainty expresses the 95% confidence interval.
On the other hand, the annual average of δ(O2∕N2) in Hateruma island in 2015 measured by NIES on the NIES scale was per meg (Yasunori Tohjima, personal communication, 2018). The number following the symbol ± denotes the standard uncertainty of the measurement (Tohjima et al., 2008). The δ(O2∕N2) value is expressed as δ(O2∕N2)NIES on NIES. There was a difference of 41 per meg between both values of δ(O2∕N2)NIES on AIST and δ(O2∕N2)NIES on NIES. This difference falls outside of the 95 % confidence interval. The disagreement between δ(O2∕N2)NIES on AIST and δ(O2∕N2)NIES on NIES suggests that there are some inconsistencies between the gravimetric methods developed by Tohjima et al. (2005) and this study. Additionally, other sources of error may exist (e.g. difference between instruments, sampling method, and introduction method). Therefore, a direct comparison of the O2∕N2 ratio or the O2 molar fraction between the AIST and NIES scales, by a round-robin experiment of the HPOs developed in this study, is required sometime in the near future to quantify the differences in absolute values and span of each gravimetric scale.
6.2 Determination of atmospheric O2 and Ar molar fractions and comparison with previous data
The molar fractions for atmospheric O2 and Ar were determined based on δ(O2∕N2) and δ(Ar∕N2) values for air samples taken at Hateruma island in 2015. The δ(O2∕N2) and δ(Ar∕N2) values were −62.8 and −62.8 per meg, respectively. Using the (O2∕N2)ref and (Ar∕N2)ref ratios for AIST reference air, the δ(O2∕N2) and δ(Ar∕N2) values were used to calculate the O2∕N2 and Ar∕N2 ratios using Eqs. (1) and (2). In 2015, the calculated O2∕N2 and Ar∕N2 ratios for samples from Hateruma island were 0.2680761±0.0000018 and 0.0119534±0.0000009, respectively. The molar fractions of O2 and Ar ( and xAr) were calculated using the aforementioned O2∕N2 and Ar∕N2 ratios by using the equations below:
In these two equations, K is the sum of N2, O2, and Ar molar fractions in the air samples and was estimated to be 999567.8±0.1 µmol mol−1. To obtain this value, the molar fractions of Ne (18.18 µmol mol−1), He (5.24 µmol mol−1), CH4 (1.82 µmol mol−1), Kr (1.14 µmol mol−1), H2 (0.52 µmol mol−1), N2O (0.32 µmol mol−1), CO (0.15 µmol mol−1), and Xe (0.09 µmol mol−1), reported by Tohjima et al. (2005), and CO2 (404.7 µmol mol−1) in 2015 were used. The CO2 molar fraction was the average CO2 molar fraction measured using a mass spectrometer. The calculated O2 and Ar molar fractions were 209339.1±1.1 and 9334.4±0.7 µmol mol−1, respectively. Standard uncertainties were estimated in accordance with the law of propagation of uncertainties. In 2000, Tohjima et al. (2005) reported the atmospheric Ar molar fraction of 9333.2±2.1 µmol mol−1 (2005), whereas the value reported for air samples collected on South Korea's Anmyeon Island in 2002 and at Niwot Ridge in 2001 was 9332±3 µmol mol−1 (Park et al., 2004). Hence, our values for atmospheric Ar were in line with previous reports.
In this study, we demonstrated that the deviation of mass readings of the sample cylinders is susceptible to temperature differences between the sample and reference cylinders. The contribution degree of the temperature difference was −14.3 mg K−1. Our results also indicate that variations in mass readings due to temperature difference could be reduced to negligible levels by obtaining mass readings at thermal equilibrium. A long time is required to reach thermal equilibrium. Since the variations mainly depend on temperature differences rather than factors related to the adsorption phenomena (e.g. the temperature of the cylinder and/or the humidity of ambient air), it was thus concluded that the variations in mass readings were influenced solely by thermal effects.
We developed a preparation technique for the production of HPOs with atmospheric levels of CO2, Ar, O2, and N2. To determine the O2 molar fractions with standard uncertainties of less than 1 µmol mol−1, repeatability in measuring the mass readings of the sample cylinders was determined to be 0.82 mg. The impact of leakage or permeation of the source gases through the cylinder valve, as well as change in buoyancy, such as the expansion of the cylinder as a factor of the cylinder inner pressure, was evaluated. Additionally, the molar masses of the source gases, pure O2, and pure N2 were determined based on the abundance of their isotopes. The gravimetrically calculated standard uncertainties were in good agreement with the standard deviation for the corresponding measured values. This indicates that the uncertainty calculations of the gravimetric values for constituents performed in this study were accurate and valid.
Based on the HPOs prepared in this study, we determined molar fractions of atmospheric Ar and O2 at Hateruma island in 2015. These values were 9334.4±0.7 and 209339.1±1.1 µmol mol−1 for Ar and O2, respectively. The atmospheric Ar molar fraction was in line with the values reported by Park (9332±3 µmol mol−1) and Tohjima (9333.2±2.1 µmol mol−1; Park et al., 2004; Tohjima et al., 2005).
This article is part of the special issue “The 10th International Carbon Dioxide Conference (ICDC10) and the 19th WMO/IAEA Meeting on Carbon Dioxide, other Greenhouse Gases and Related Measurement Techniques (GGMT-2017) (AMT/ACP/BG/CP/ESD inter-journal SI)”. It is a result of the 10th International Carbon Dioxide Conference, Interlaken, Switzerland, 21–25 August 2017.
The data presented in this article are available upon request to Nobuyuki Aoki (aoki-nobu@aist.go.jp).
The authors declare that they have no conflict of interest.
This study was partly supported by funding from the Global Environment Research Coordination System from the Ministry of the Environment, Japan. We express our gratitude to Noritsugu Tsuda, Nobukazu Oda, and Fujio Shimano of the Global Environmental Forum and Yasunori Tohjima of the National Institute for Environmental Studies for their cooperation in collecting air samples at Hateruma island.
This paper was edited by Markus Leuenberger and reviewed by three anonymous referees.
Aoki, N. and Shimosaka, T.: Development of an analytical system based on a paramagnetic oxygen analyzer for atmospheric oxygen variations, Anal. Sci., 34, 487–493, 2018.
Alink, A. and Van der Veen, A. M.: Uncertainty calculations for the preparation of primary gas mixtures, Metrologia, 37, 641–650, 2000.
Baertschi, P.: Absolute 18O content of standard mean ocean water, Earth Planet. Sc. Lett., 31, 341–344, 1976.
Barkan, E. and Luz, B.: High precision measurements of 17O/16O and 18O∕16O ratios in H2O, Rapid Commun. Mass Sp., 19, 3737–3742, 2005.
Battle, M., Bender, M. L., Tans, P. P., White, J. W. C., Ellis, J. T., Conway, T., and Francey, R. J.: Global carbon sinks and their variability inferred from atmospheric O2 and 13C, Science, 287, 2467–2470, 2000.
Bender, M. L., Tans, P. P., Ellis, J. T., Orchard, J., and Habfast, K.: High precision isotope ratio mass spectrometry method for measuring the O2∕N2 ratio of air, Geochim. Cosmochim. Ac., 58, 4751–4758, 1994.
Bender, M. L., Ellis, J. T., Tans, P. P., Francey, R., and Lowe, D.: Variability in the O2∕N2 ratio of southern hemisphere air 1991–1994: Implications for the carbon cycle, Global Biogeochem. Cy., 10, 9–21, 1996.
Böhlk, J. K.: Variation in the terrestrial isotopic composition and atomic weight of argon (IUPAC Technical Report), Pure Appl. Chem., 86, 1421–1432, 2014.
De Laeter, J. R., Böhlke, J. K., De Bièfre, P., Hidaka, H., Peiser, H. S., Rosman, K. J. R., and Taylor P. D. P.: Atomic weights of the elements: Review 2000 (IUPAC Technical Report), Pure Appl. Chem., 75, 683–800, 2003.
Dlugokencky, E. J., Myers, R. C., Lang, P. M., Masarie, K. A., Crotwell, A. M., Thoning, K. W., Hall, B. D., Elkins, J. W., and Steele, L. P.: Conversion of NOAA atmospheric dry air CH4 molar fractions to a gravimetrically prepared standard scale, J. Geophys. Res., 110, D18306, https://doi.org/10.1029/2005JD006035, 2005.
Gläser, M.: Response of apparent mass to thermal gradients, Metrologia, 27, 95–100, 1990.
Gläser, M.: Change of the apparent mass of weights arising from temperature difference, Metrologia, 36, 183–197, 1999.
Gläser, M. and Borys, M.: Precision mass measurements, Rep. Prog. Phys., 72, 126101, https://doi.org/10.1088/0034-4885/72/12/126101, 2009.
Goto, D., Morimoto, S., Ishidoya, S., Ogi, A., Aoki, S., and Nakazawa, T.: Development of a high precision continuous measurement system for the atmospheric O2∕N2 ratio and its application at Aobayama, Sendai, Japan, J. Meteorol. Soc. Jpn., 91, 179–192, 2013.
Hall, B. D., Dutton, G. S., and Elkins J. W.: The NOAA nitrous oxide standard scale for atmospheric observations, J. Geophys. Res., 112, D09305, https://doi.org/10.1029/2006JD007954, 2007.
Ishidoya, S. and Murayama, S.:, Development of a new high precision continuous measuring system for atmospheric O2∕N2 and Ar∕N2 and its application to the observation in Tsukuba, Japan, Tellus B, 66, 22574, https://doi.org/10.3402/tellusb.v66.22574, 2014.
Ishidoya, S., Aoki, S., and Nakazawa T.: High precision measurements of the atmospheric O2∕N2 ratio on mass spectrometer, J. Meteorol. Soc. Jpn., 81, 127–140, 2003.
Ishidoya, S., Morimoto, S., Aoki, S., Taguchi, S., Goto, D., Murayama, S., and Nakazawa, T.: Oceanic and terrestrial biospheric CO2 uptake estimated from atmospheric potential oxygen observed at Ny-Ålesund, Svalbard, and Syowa, Antarctica, Tellus B, 64, 18924, https://doi.org/10.3402/tellusb.v64i0.18924, 2012a.
Ishidoya, S., Aoki, S., Goto, D., Nakazawa, T., Taguchi, S., and Patra, P. K.: Time and space variations of the O2∕N2 ratio in the troposphere over Japan and estimation of global CO2 budget, Tellus B, 64, 18964, https://doi.org/10.1034/j.1600-0889.1993.t01-2-00004.x, 2012b.
Ishidoya, S., Uchida, H., Sasano, D., Kosugi, N., Taguchi, S., Ishii, M., Morimoto, S., Tohjima, Y., Nishino, S., Murayama, S., Aoki, S., Ishijima, K., Fujita, R., Goto, D., and Nakazawa, T.: Ship observations of Atmospheric Potential Oxygen and regional air-sea O2 flux in the Northern North Pacific and the Arctic Ocean, Tellus B, 68, 29972, https://doi.org/10.3402/tellusb.v68.29972, 2016.
Ishidoya, S., Tsuboi, K., Murayama, S., Matsueda, H., Aoki, N., Shimosaka, T., Kondo, H., and Saito, K.: Development of a continuous measurement system for atmospheric O2∕N2 ratio using a paramagnetic analyzer and its application on Minamitorishima Island, Japan, SOL, 13, 230–234, 2017.
ISO 6142-1:2015: Gas Analysis-Preparation of Calibration Gas Mixtures-Part 1: Gravimetric Method for Class I Mixtures, International Organization for Standardization, ISO 6142–1:2015.
Junk, G. A. and Svec, H. J.: The absolute abundance of the nitrogen isotopes in the atmosphere and compressed gas from various sources, Geochim. Cosmochim. Ac., 14, 234–243, 1958.
Keeling, R. F. and Shertz, S. R.: Seasonal and interannual variations in atmospheric oxygen and implications for the global carbon cycle, Nature, 358, 723–727, 1992.
Keeling, R. F., Bender, M. L., and Tans, P. P.: What atmospheric oxygen measurements can tell us about the global carbon cycle, Global Biogeochem. Cy., 7, 37–67, 1993.
Keeling, R. F., Piper, S. C., and Heimann, M.: Global and hemispheric CO2 sinks deduced from changes in atmospheric O2 concentration, Nature, 381, 218–221, 1996.
Keeling, R. F., Stephens, B. B., Najjar, R. G., Doney, S. C., Archer, D., and Heimann, M.: Seasonal variations in the atmospheric O2∕N2 ratio in relation to the kinetics of air-sea gas exchange, Global Biogeochem. Cy., 12, 141–163, 1998a.
Keeling, R. F., Manning, A. C., McEvoy, E. M., and Shertz, S. R.: Methods for measuring changes in atmospheric O2 concentration and their application in southern hemisphere air, J. Geophys. Res., 103, 3381–3397, 1998b.
Keeling, R. F., Blaine, T. Paplawsky, B, Katz, L., Atwood, C., and Brockwell, T.: Measurement of changes in atmospheric Ar∕N2 ratio using a rapid-switching, single-capillary mass spectrometer system, Tellus B, 56, 322–338, 2004.
Keeling, R. F., Manning, A. C., Paplawsky, W. J., and Cox, A.: On the long-term stability of reference gases for atmospheric O2∕N2 and CO2 measurements, Tellus B, 59, 3–14, 2007.
Langenfelds, R. L., Van der Schoot, M. V., Francey, R. J., Steele, L. P., Schmidt, M., and Mukai, H.: Modigication of air standard composition by diffusive and surface processes, J. Geophys. Res.-Atmos., 110, D13307, doi:10.101029/2004JD0055482, 2005.
Leuenberger, M. C., Schibig, M. F., and Nyfeler, P.: Gas adsorption and desorption effects on cylinders and their importance for long-term gas records, Atmos. Meas. Tech., 8, 5289–5299, https://doi.org/10.5194/amt-8-5289-2015, 2015.
Li, W., Ni, B., Jin, D., and Chang, T. L.: Measurement of the absolute abundance of oxygen–17 in V–SMOW, Kexue Tnbao, 33, 1610–1613, 1988.
Mana, G., Palmisano, C., Perosino, A., Pettorruso, S., Peuto, A., and Zosi, G.: Convective forces in high precision mass measurements, Meas. Sci. Technol., 13, 13–20, 2002.
Manning, A. C., Keeling, R. F., and Severinghaus, J. P.: Precise atmospheric oxygen measurements with a paramagnetic oxygen analyzer, Global Biogeochem. Cy., 13, 1107–1115, 1999.
Manning, A. C. and Keeling, R. F.: Global oceanic and land biotic carbon sinks from the Scripps atmospheric oxygen flask sampling network, Tellus B, 58, 95–116, 2006.
Matsueda, H., Sawa, Y., Wada, A., Inoue, H. Y., Suda, K., and Hirano, Y.: Methane standard gases for atmospheric measurements at the MRI and JMA, Pap. Meteorol. Geophys., 54, 91–113, 2004.
Matsumoto, N., Watanabe, T., Maruyama, M., Horimoto, Y., Maeda, T., and Kato, K.: Development of mass measurement equipment using an electronic mass-comparator for gravimetric preparation of reference gas mixtures, Metrologia, 41, 178–188, 2004.
Matsumoto, N., Shimosaka, T, Watanabe, T., and Kato, K.: Evaluation of error sources in a gravimetric technique for preparation of a reference gas mixture (carbon dioxide in synthetic air), Anal. Bioanal Chem., 391, 2061–2069, https://doi.org/10.1007/s00216-008-2107-8, 2008.
Milton, M. J. T., Vargha, G. M., and Brown, A. S.: Gravimetric methods for the preparation of standard gas mixtures, Metrologia, 48, R1–R9, 2011.
Mizushima, S.: Determination of the amount of gas adsorption on SiO2∕Si(100) surfaces to realize precise mass measurement, Metrologia, 41, 137–144, 2004.
Mizushima, S.: The improvement of the adsorption characteristics of stainless steel surfaces by sputter–deposited films, Metrologia, 44, 161–166, 2007.
Oh, S. H., Kim, B. M., and Kang, N.: Evaluation of changes in cylinder volume due to gas filling and subsequent release, Metrologia, 50, 318–324, 2013.
Park, S. Y., Kim, J. S., Lee, J. B., Esler, M. B., Davis, R. S., and Wielgosz, R. I.: A redetermination of the argon content of air for buoyancy corrections in mass standard comparisons, Metrologia, 41, 387–395, 2004.
Schreiber, M., Emran, M. S., Fröhlich, T., Schumacher, J., and Thess, A.: Quantification of free convection effects on 1 kg mass standard, Metrologia, 52, 835–841, 2015.
Stephens, B. B., Keeling, R. F., Heimann, M., Six, K. D., Mumane, R., and Caldeira, K.: Testing global ocean carbon cycle models using measurements of atmospheric O2 and CO2 concentration, Global Biogeochem. Cy., 12, 213–230, 1998.
Stephens, B. B., Keeling, R. F., and Paplawsky, W. J.: Shipboard measurements of atmospheric oxygen using a vacuum-ultraviolet absorption technique, Tellus B, 55, 857–878, https://doi.org/10.3402/tellusb.v55i4.16386, 2003.
Stephens, B. B., Bakwin, P. S., Tans, P. P., Teclaw, R. M., and Baumann, D.: Application of a differential fuel-cell analyzer for measuring atmospheric oxygen variations, J. Atmos. Ocean. Tech., 24, 82–94, 2007.
Sturm, P., Leuenberger, M., Sirignano, C., Neubert, R. E. M., Meiger, H. A. J., Langenfelds, R., Brand, W. A., and Tohjima, Y.: Permeation of atmospheric gases through polymer O-rings used in flasks for air sampling, J. Geophys. Res., 109, D04309, https://doi.org/10.1029/2003JD004073, 2004.
Tanaka, M., Nakazawa, T., and Aoki, S.: High quality measurements of the concentration of atmospheric carbon dioxide, J. Meteorol. Soc. Jpn., 61, 678–685, 1983.
Tohjima, Y.: Method for measuring changes in the atmospheric O2∕N2 ratio by a gas chromatograph equipped with a thermal conductivity detector, J. Geophys. Res., 105, 14575–14584, 2000.
Tohjima, Y., Machida, T., Watai, T., Akama, I., Amari, T., and Moriwaki, Y.: Preparation of gravimetric standards for measurements of atmospheric oxygen and reevaluation of atmospheric oxygen concentration, J. Geophys. Res., 110, D1130, https://doi.org/10.1029/2004JD005595, 2005.
Tohjima, Y., Mukai, H., Nojiri, Y., Yamagishi, H., and Machida, T.: Atmospheric O2∕N2 measurements at two Japanese sites: Estimation of global oceanic and land biotic carbon sinks and analysis of the variations in atmospheric potential oxygen (APO), Tellus B, 60, 213–225, 2008.
van der Laan-Luijkx, I. T., van der Laan, S., Uglietti, C., Schibig, M. F., Neubert, R. E. M., Meijer, H. A. J., Brand, W. A., Jordan, A., Richter, J. M., Rothe, M., and Leuenberger, M. C.: Atmospheric CO2, δ(O2∕N2) and δ13CO2 measurements at Jungfraujoch, Switzerland: results from a flask sampling intercomparison program, Atmos. Meas. Tech., 6, 1805–1815, https://doi.org/10.5194/amt-6-1805-2013, 2013.
WMO: 18th WMO/IAEA Meeting on Carbon Dioxide, Other Greenhouse Gases and Related Tracers Measurement Techniques (GGMT-2015), GAW Report, No. 229, 2016.
Zhao, C. L., Tan, P., and Thoning, K. W.: A high precision manometric system for absolute calibration of CO2 in dry air, J. Geophys. Res., 102, 5885–5894, 1997.
- Abstract
- Introduction
- Materials and methods
- Identifying and minimizing unknown factors of uncertainty
- Evaluation of uncertainty factors for the O2 standard mixtures
- Validation of the constituents in the highly precise O2 standard mixtures
- Comparison with previous values
- Conclusion
- Special issue statement
- Data availability
- Competing interests
- Acknowledgements
- Review statement
- References