the Creative Commons Attribution 4.0 License.
the Creative Commons Attribution 4.0 License.
 | 28 May 2019
First high-resolution BrO column retrievals from TROPOMI
Sora Seo
Andreas Richter
Anne-Marlene Blechschmidt
Ilias Bougoudis
John Philip Burrows
For more than 2 decades, satellite observations from instruments such as GOME, SCIAMACHY, GOME-2, and OMI have been used for the monitoring of bromine monoxide (BrO) distributions on global and regional scales. In October 2017, the TROPOspheric Monitoring Instrument (TROPOMI) was launched on board the Copernicus Sentinel-5 Precursor platform with the goal of continuous daily global trace gas observations with unprecedented spatial resolution. In this study, sensitivity tests were performed to find an optimal wavelength range for TROPOMI BrO retrievals under various measurement conditions. From these sensitivity tests, a wavelength range for TROPOMI BrO retrievals was determined and global data for April 2018 as well as for several case studies were retrieved. Comparison with GOME-2 and OMI BrO retrievals shows good consistency and low scatter of the columns. The examples of individual TROPOMI overpasses show that due to the better signal-to-noise ratio and finer spatial resolution of 3.5×7 km2, TROPOMI BrO retrievals provide good data quality with low fitting errors and unique information on small-scale variabilities in various BrO source regions such as Arctic sea ice, salt marshes, and volcanoes.
- Article
(10877 KB) - Full-text XML
- BibTeX
- EndNote


Bromine monoxide (BrO) plays an important role in atmospheric chemistry. In the lower stratosphere, it is involved in chain reactions that deplete ozone (Wennberg et al., 1994), and bromine in the troposphere changes the oxidizing capacity through the destruction of ozone, which is a primary precursor of atmospheric oxidation in the troposphere (von Glasow et al., 2004). In particular, large amounts of BrO are often observed in the polar boundary layer during springtime, known as “bromine explosion”, and lead to severe tropospheric ozone depletion by autocatalytic reactions (McConnell et al., 1992; Simpson et al., 2007). In addition to polar sea ice regions, enhanced BrO concentrations were also detected over salt lakes/marshes (Hebestreit et al., 1999; Tas, 2005; Hörmann et al., 2016), in the marine boundary layer (Leser et al., 2003; Sander et al., 2003; Saiz-Lopez et al., 2004), and in volcanic plumes (Bobrowski et al., 2003; Theys et al., 2009; Schönhardt et al., 2017).
To understand the formation of BrO and the various chemical reactions involving halogen oxides in the troposphere, BrO observations have been carried out by in situ chemical ionization mass spectrometry (CIMS) (Liao et al., 2011; Choi et al., 2012), ground-based differential optical absorption spectroscopy (DOAS) measurements such as long-path DOAS (LP-DOAS) (Hönninger et al., 2004; Liao et al., 2011; Stutz et al., 2011), and multi-axis DOAS (MAX-DOAS) (Hönninger et al., 2004; Frieß et al., 2011; Zhao et al., 2016). Using ground-based measurements, the diurnal variation in and vertical distribution of BrO can be investigated with high temporal resolution in specific source regions (Hönninger et al., 2004; Hendrick et al., 2007). However, ground-based measurements with localized spatial coverage are limited in observing large-scale BrO explosion events and long-range transport of BrO plumes. This can be overcome by satellite measurements having extensive spatial coverage albeit at coarse spatial resolution and limited temporal sampling.
Since the launch in 1995 of the Global Ozone Monitoring Experiment (GOME) on ERS-2, a series of UV–visible spectrometers on board satellites including SCIAMACHY, GOME-2, and OMI have been used to monitor the global distribution of BrO columns and large-scale BrO events over time. The first global observations of BrO were retrieved from the measurements of GOME and large-scale tropospheric BrO plumes in the polar sea ice region were detected (Wagner and Platt, 1998; Richter et al., 1998; Chance, 1998). SCIAMACHY, which followed GOME, not only measured BrO columns but also vertical profiles of BrO in the stratosphere from limb measurements (Rozanov et al., 2005; Kuhl et al., 2008). The higher-spatial-resolution data of GOME-2 and OMI have been successfully used to monitor daily global distribution as well as BrO emissions from various source regions such as volcanoes (Theys et al., 2009; Hörmann et al., 2013; Schönhardt et al., 2017), salt lakes (Hörmann et al., 2016), and polar sea ice regions (Begoin et al., 2010; Salawitch et al., 2010; Theys et al., 2011; Sihler et al., 2012; Blechschmidt et al., 2016; Suleiman et al., 2019). However, OMI's coverage has been reduced since 2008 due to the so-called “row anomaly”, which is the result of a physical obstruction of the instrument, and currently the anomaly effect extends over about 50 % of the sensor's viewing positions (Torres et al., 2018). This reduced viewing ability affects the observation of emission events as well as the accuracy of the long-term time series. Existing satellite BrO time series can potentially be extended with data from the TROPOspheric Monitoring Instrument (TROPOMI) on board the Copernicus Sentinel-5 Precursor platform, which was launched in October 2017 for a mission of 7 years (Veefkind et al., 2012).
In this study, we present retrievals of BrO column amounts from TROPOMI observations on global and regional scales. This retrieval uses an optimized and adapted DOAS retrieval algorithm developed for earlier satellite missions. The aim of this study is a first demonstration of the feasibility of these new BrO retrievals on TROPOMI data, investigation of their precision, and the comparison to data from other satellites. Therefore, the focus is on slant columns and simple vertical columns, determined using a geometric approximation for the air mass factor. Stratospheric correction schemes and more sophisticated air mass factor calculations accounting for factors such as presence of clouds, varying surface albedo, and surface altitude are not used in this study. In order to determine the best retrieval window, sensitivity tests were performed for various measurement scenarios by a systematic investigation of retrieval results in different retrieval wavelength intervals in Sect. 3. TROPOMI BrO columns were assessed by comparison with those from the two existing satellite instruments, GOME-2B and OMI, with the consistency of the set of measurements being investigated. In addition, some examples of interesting cases in the TROPOMI BrO data are identified and described for different source regions, such as the Arctic sea ice, salt lakes, and volcanoes.
TROPOMI is a push-broom imaging spectrometer which was launched on board the European Space Agency (ESA) Sentinel-5 Precursor (S-5P) satellite in October 2017 (Veefkind et al., 2012). The instrument has a large swath of 2600 km providing daily global coverage with high spatial resolution of currently 3.5×7 km2 at nadir. TROPOMI has spectral bands in the ultraviolet (UV), visible (VIS), near-infrared (NIR), and shortwave infrared (SWIR) ranges, which allows it to monitor key atmospheric constituents such as O3, NO2, SO2, CO, CH4, HCHO, aerosols, clouds, and various other trace gases. Compared to previous satellites, TROPOMI has prominent advantages in extended spectral band range and higher spatial resolution. From the eight spectral bands of TROPOMI, band 3 data covering a spectral range of 320–405 nm with the spectral resolution of 0.5 nm and sampling of 0.20 nm per pixel (McMullan and van der Meulen, 2013) have been used for this BrO retrieval.
The retrieval algorithm for BrO uses the differential optical absorption spectroscopy (DOAS) technique (Platt and Stutz, 2008) as applied for space application (Burrows et al., 2011). The concept of DOAS is to separate the wavelength-dependent extinction signal into two components, the low-frequency and the high-frequency part. The absorption by atmospheric gases is identified from their higher-frequency structures of absorption cross sections in spectral space and the low-frequency parts are treated as a closure term fitted by a low-order polynomial. The absorber concentration integrated along the light path, the slant column density (SCD), is determined assuming the Beer–Lambert law is applicable.
BrO SCD retrievals are typically performed within the wavelength range from 320 to 364 nm which covers nine absorption peaks of BrO. In this spectral region, interferences with O3 (Serdyuchenko et al., 2014), NO2 (Vandaele et al., 1998), HCHO (Meller and Moortgat, 2000), SO2 (Bogumil et al., 2003), OClO (Kromminga et al., 2003), and O4 (Thalman and Volkamer, 2013) can be found. Thus, not only the absorption cross section of BrO (Wilmouth et al., 1999; Fleischmann et al., 2004) but also those of these related molecules are included in the BrO retrieval. In addition to the absorption cross sections of interfering species, a synthetic Ring spectrum calculated using the SCIATRAN model (Vountas et al., 1998) is included to account for the effect of rotational Raman scattering and a linear intensity offset used as an additional closure term. All absorption cross sections are convoluted with TROPOMI's row and wavelength-dependent slit function.
3.1 Sensitivity test of retrieval fitting intervals
For the retrieval of a weak absorber such as BrO, the selection of the optimal fitting wavelength window is one of the most important things in the DOAS retrieval process (Vogel et al., 2013; Alvarado et al., 2014). The optimal fitting window is a retrieval wavelength range that maximizes the differential absorption structures for the trace gas of interest while minimizing interferences of other gases. In general, larger fitting windows can improve the quality of DOAS retrievals by using more spectral points, but at the same time, they can increase the noise and bias resulting from interfering signals with other absorbers and wavelength-dependent light path lengths. Smaller fitting windows allow the fit to better compensate for errors caused by interferences of other absorption gases, but can also lead to increased cross correlation between reference absorption cross sections and higher noise. Thus, finding a compromise for a fitting window that avoids the disadvantages as well as making the best use of the advantages from the retrieval wavelength interval is important to yield the best quality DOAS retrieval result.
In this study, a sensitivity test of the wavelength interval on DOAS BrO retrievals was performed by evaluating the BrO SCDs and fitting rms values in many different wavelength ranges. In addition, the scatter of the slant columns was also investigated over a clean background region. Vogel et al. (2013) conducted a detailed study of the influence of the wavelength interval on the quality of DOAS retrievals based on a novel method and visualization of the results as contour plots. They applied this technique to a theoretical study of BrO retrievals for stratospheric BrO and BrO in volcanic plumes by using synthetic spectra, modeling zenith-sky DOAS measurements of stratospheric BrO and tropospheric measurements of volcanic plumes. In this way, effects of different wavelength intervals on DOAS retrievals and appropriate spectral ranges for different study cases could be easily identified from visualized maps. A similar systematic approach was taken in this study. However, one important objective of this study is the investigation of the TROPOMI BrO retrieval results for various measurement cases and the identification of the overall best fitting window for TROPOMI BrO measurements. Therefore, sensitivity tests were performed for different BrO emission scenarios using real satellite data to identify a spectral region with the best BrO results and the fewest interference problems. The different measurement scenarios selected are enhanced BrO plumes in the Arctic sea ice region, BrO plumes over a salt marsh, BrO enhancements in volcanic plumes, and clear and cloudy scenes over the Pacific background region. The selected scenarios have very different BrO amounts, slant columns of interfering species, solar zenith angle, temperatures, and geographical conditions. The influence of variations in the parameters for these different cases is included, thereby enabling an optimal fitting window to be identified for application in a global BrO retrieval. The selected regions and dates for the different scenarios are summarized in Table 1. The sensitivity tests were performed over a wide range of retrieval wavelength intervals, which have start limits of 320–338 nm and end limits of 342–364 nm with an interval step of 0.2 nm (Fig. 1). This retrieval wavelength interval can contain up to nine absorption peaks, always including at least the strongest absorption peak of BrO at 338–342 nm.
Apart from the retrieval wavelength range, other DOAS fit parameters were kept constant to isolate the effect of the retrieval wavelength range on the resulting BrO SCDs. The reference absorption cross sections used in this sensitivity test include not only BrO but also the interfering species as discussed in Sect. 3. Also, a row-dependent daily earthshine radiance spectrum taken as the average of measurements over the Pacific region was used as a reference background spectrum to minimize across-track variability. In this sensitivity test, a polynomial of the order of 4 was used and kept constant, which is problematic for small fitting windows for which a lower-order polynomial might have been more appropriate, but changing the polynomial degree within the sensitivity test would have introduced another level of uncertainty. The DOAS retrieval technique is based on linear least-squares fitting of spectra by minimizing the fitting residuals (chi-square values).
Table 1Geographical and time information for the different scenarios of the sensitivity tests in Sect. 3.1.

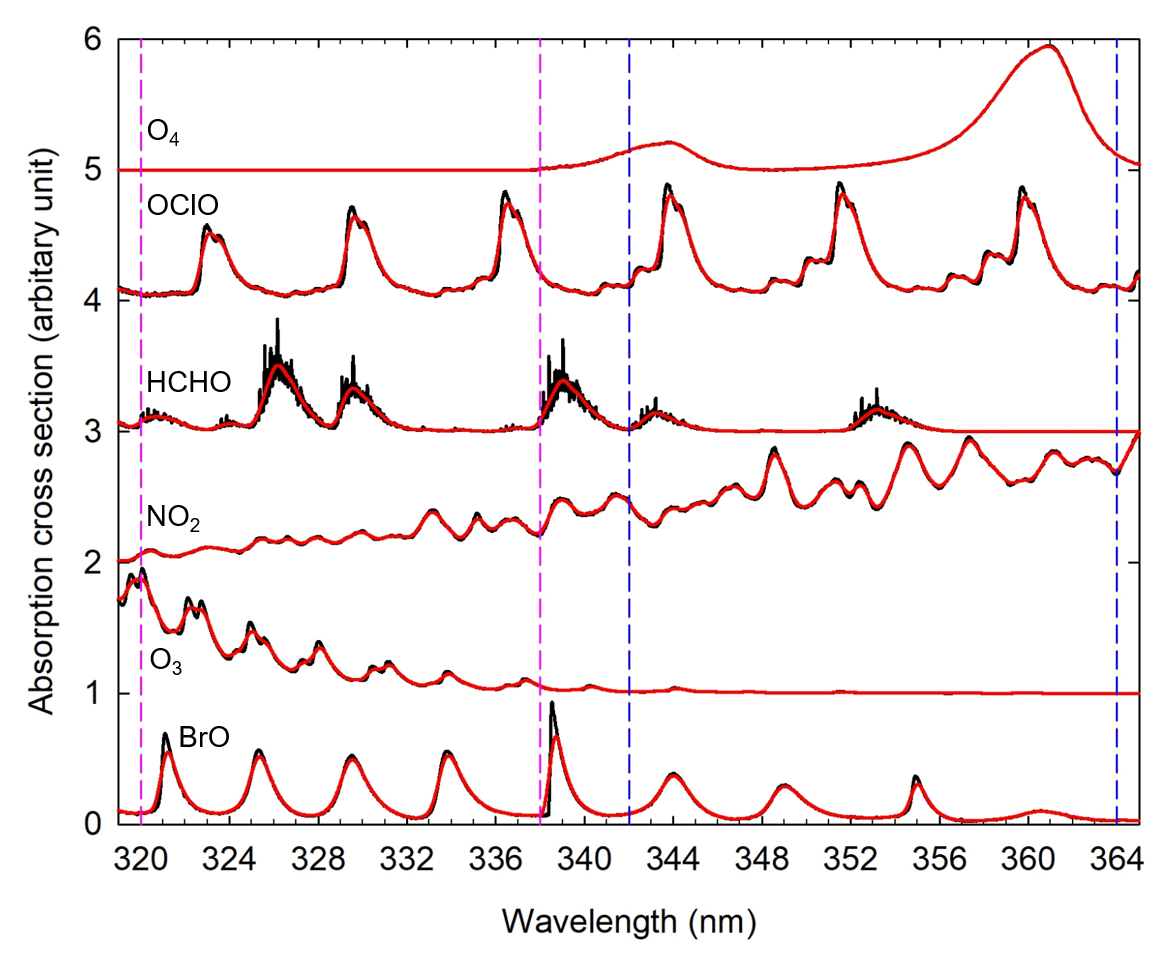
Figure 1Reference absorption cross sections used in the sensitivity test of DOAS BrO retrieval. The spectra have been scaled to the order of 1 for presentation purposes. Black lines are the original cross sections and red lines are absorption cross sections convolved with the TROPOMI slit function (TROPOMI ISRF calibration key data v1.0.0). Pink vertical dashed lines indicate start wavelength ranges and blue lines end wavelength ranges of fitting windows for this sensitivity test.
3.1.1 BrO retrievals over the polar sea ice region
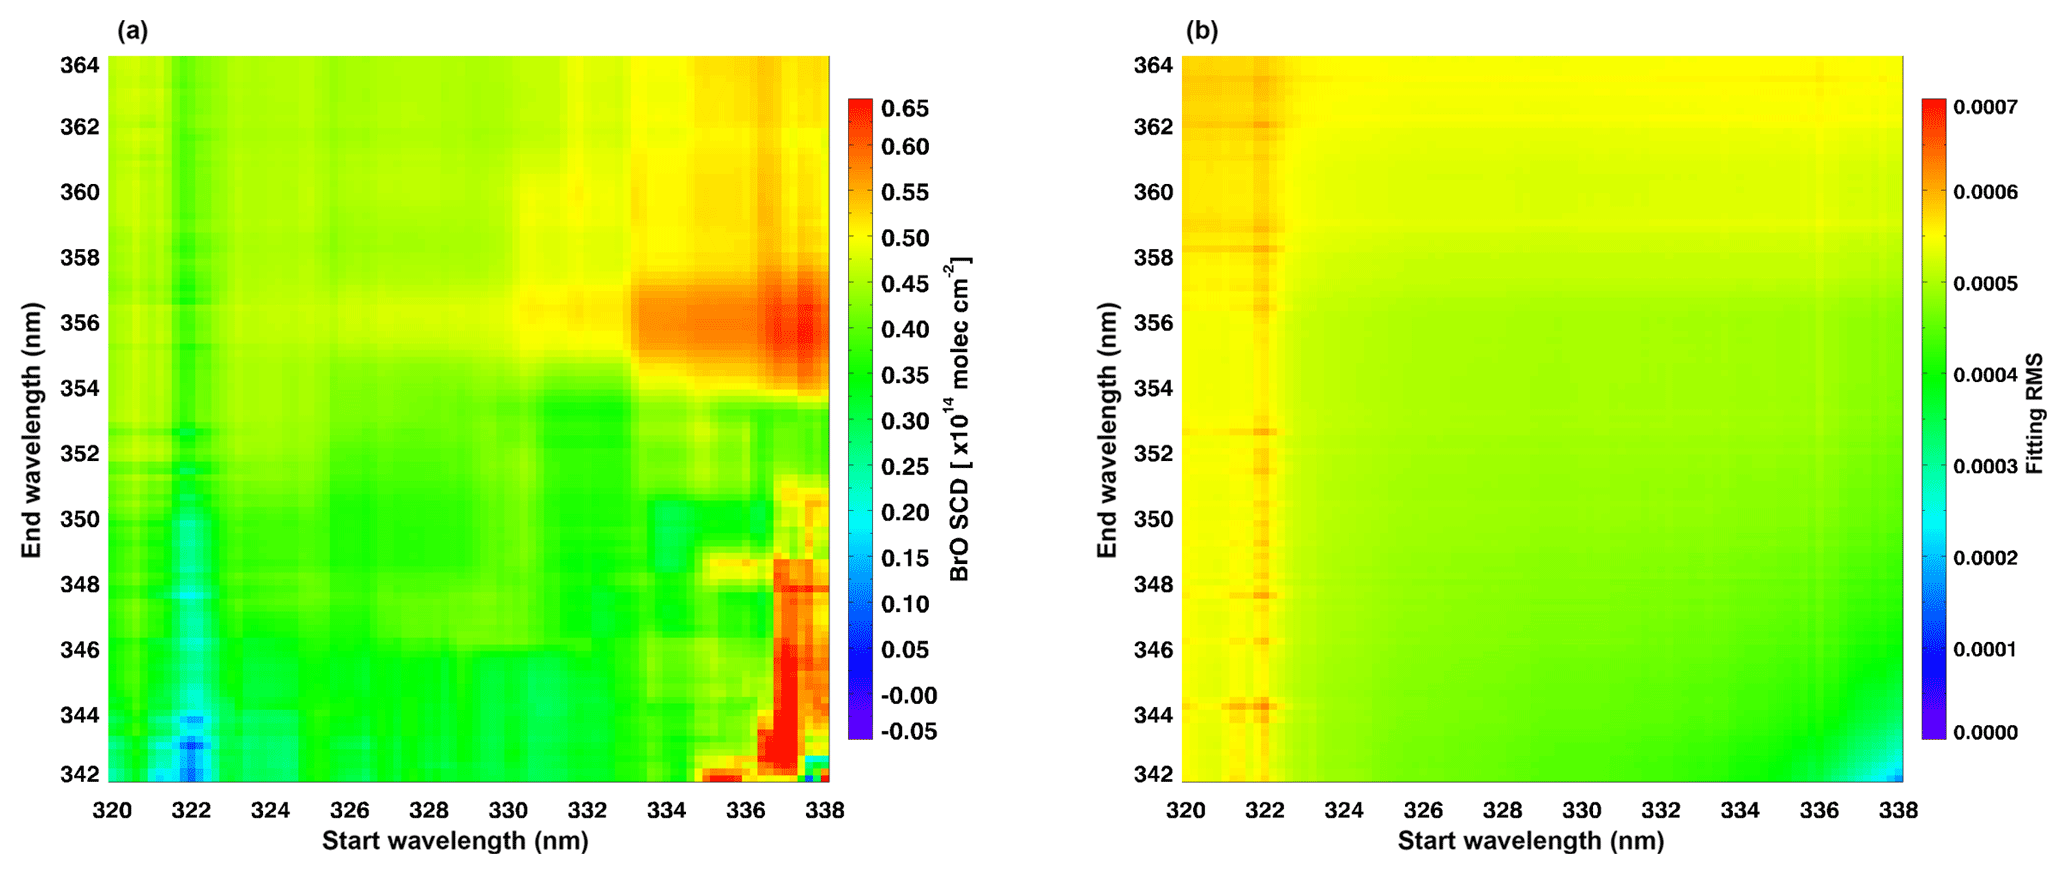
Satellite observations have shown large-scale BrO plumes (1000s of km) occurring over polar sea ice regions in spring, which indicates that this area is one of the most important BrO source regions (Simpson et al., 2007; Begoin et al., 2010). Thus, one of the retrieval wavelength interval sensitivity tests was performed for one BrO explosion event in the Arctic. The results are shown in Fig. 2, where each pixel corresponds to the mean of the retrieval results from a particular fitting wavelength interval taken over the first region in Table 1 and is displayed on a color-coded scale. As can be seen in Fig. 2, negative BrO SCDs with relatively high fitting rms values are found in general for BrO fitting windows with start wavelengths below 327 nm and end wavelengths below roughly 352 nm. These unphysical negative SCDs and high fitting rms values may be attributed to interferences of other absorbers, which have strong absorption structures at shorter wavelengths, in particular O3, which has a maximum at high latitudes in the spring season (Monks, 2000; Aliwell et al., 2002). This can potentially be improved by introducing additional ozone cross sections, which attempt to account for effects arising from changes in the light path with wavelength (Puķīte et al., 2010) (see Appendix A).
Also, the map of mean BrO SCDs shows a strong gradient near start wavelengths of 333.4 nm. As shown in Fig. 1, strong absorption features of O3 are located at a shorter wavelength range than 333.4 nm, which indicates that the sudden increase in BrO SCDs at the corresponding wavelength is likely due to the interference of gases other than O3. In order to find the gas that interferes the most with the BrO retrieval, we investigated the retrieved SCDs maps of other reference gases used in this DOAS retrieval test and found that HCHO has a sharp change in SCDs in the vicinity of 333.4 nm similar to BrO with anticorrelations of both gases (Fig. 3). This implies that HCHO has a significant interference in the DOAS BrO retrieval at the wavelength range with a start limit of ∼333.4 nm. Thus, to further examine the potential HCHO interference on the BrO retrieval, we performed additional sensitivity tests in the same way as before but excluding the HCHO absorption cross section for the Arctic BrO measurement scenario where very low HCHO columns are expected. The mean relative difference between BrO SCDs retrieved including the HCHO cross section (S1) and those retrieved without including HCHO (S2) is defined as
(see Fig. 3). Exclusion of the HCHO absorption cross section leads to reduction of the retrieved BrO SCDs at start limits above ∼333 nm and in the range of start limits <325 nm and end limits <351 nm, while an increase in BrO SCDs is observed mostly at the wavelength range with a start limit below ∼333 nm. The pattern of variations in the retrieved BrO SCDs changes at the wavelength range between start limits of 333 and 333.4 nm where a strong absorption peak is present in BrO, while it is absent in HCHO. Possible artifacts in the DOAS BrO retrieval caused by a spectral cross correlation between BrO and HCHO were also identified in Theys et al. (2011) and Vogel et al. (2013). From this sensitivity test for the polar BrO measurement scenario, we can confirm that the main issues impacting the accuracy of the DOAS BrO retrievals are the influence of the strong O3 absorptions at a shorter wavelength range <327 nm and potential interferences between BrO and HCHO absorptions. In consequence, we should choose a wavelength range that avoids strong O3 absorption features as well as minimizing the interference between BrO and HCHO to obtain the most accurate BrO retrieval results.

Figure 2Color-coded means of (a) BrO SCDs and (b) fitting rms values retrieved over the selected Arctic sea ice region for a BrO explosion event using TROPOMI measurements at different wavelength intervals.

Figure 3Color-coded means of (a) HCHO SCDs and (b) relative difference between BrO SCDs retrieved including the HCHO absorption cross section and those without HCHO for the Arctic BrO measurement scenario.
3.1.2 BrO retrievals over a salt marsh
In addition to polar sea ice regions, salt lakes and marshes are important BrO source regions. The selected study region (see Table 1), Rann of Kutch, is known as one of the strongest natural sources of reactive bromine compounds and has been monitored by satellite measurements for long-term variations in BrO columns (Hörmann et al., 2016). In order to determine the appropriate DOAS fitting wavelength range for BrO retrievals over salt marshes, the sensitivity test was performed in the same way as for the polar event. As shown in Fig. 4, BrO retrieval results in the salt marsh show relatively high fitting rms values at shorter wavelengths below 322 nm, but unlike for BrO retrievals in the Arctic sea ice region (Fig. 2), no negative values are found for BrO SCDs. This is because the interference of O3 is smaller in this midlatitude region scenario than in the polar region where the influence of O3 absorption is large. In general, high BrO SCDs with low fitting errors are shown in the evaluation wavelength range at start limits of 333–338 nm and end limits of 354–364 nm. This behavior is similar to the appropriate retrieval wavelength range in the previous polar BrO sensitivity test results.
3.1.3 BrO retrievals in a volcanic plume
Volcanic eruptions emit various gases into the atmosphere and BrO is often also detected in volcanic plumes (Bobrowski et al., 2003). The selected volcanic BrO retrieval scenario is a small-scale BrO plume emitted by volcanic activity at Ambae. In the sensitivity test for volcanic BrO, an SO2 absorption cross section was added to the general DOAS BrO retrieval settings due to high SO2 concentrations expected in the volcanic plume. If we use a retrieval wavelength interval with start wavelengths below 323 nm included or narrow fitting windows less than 8 nm wide, negative BrO SCDs and high fitting rms values are found, as can be seen in Fig. 5. These features may be attributed to the SO2 interference at shorter wavelengths and the increase in cross correlation between BrO and other absorption gases, in particular SO2 (Fig. 6). Relatively higher fitting rms values are also found in the retrieval wavelength intervals extending to longer wavelengths (>358 nm). This is attributed to the impact of the Ring effect, i.e., the in-filling of Fraunhofer lines resulting from high aerosol loads and or the formation of clouds after the volcanic eruption (Theys et al., 2009) (see Fig. 6).
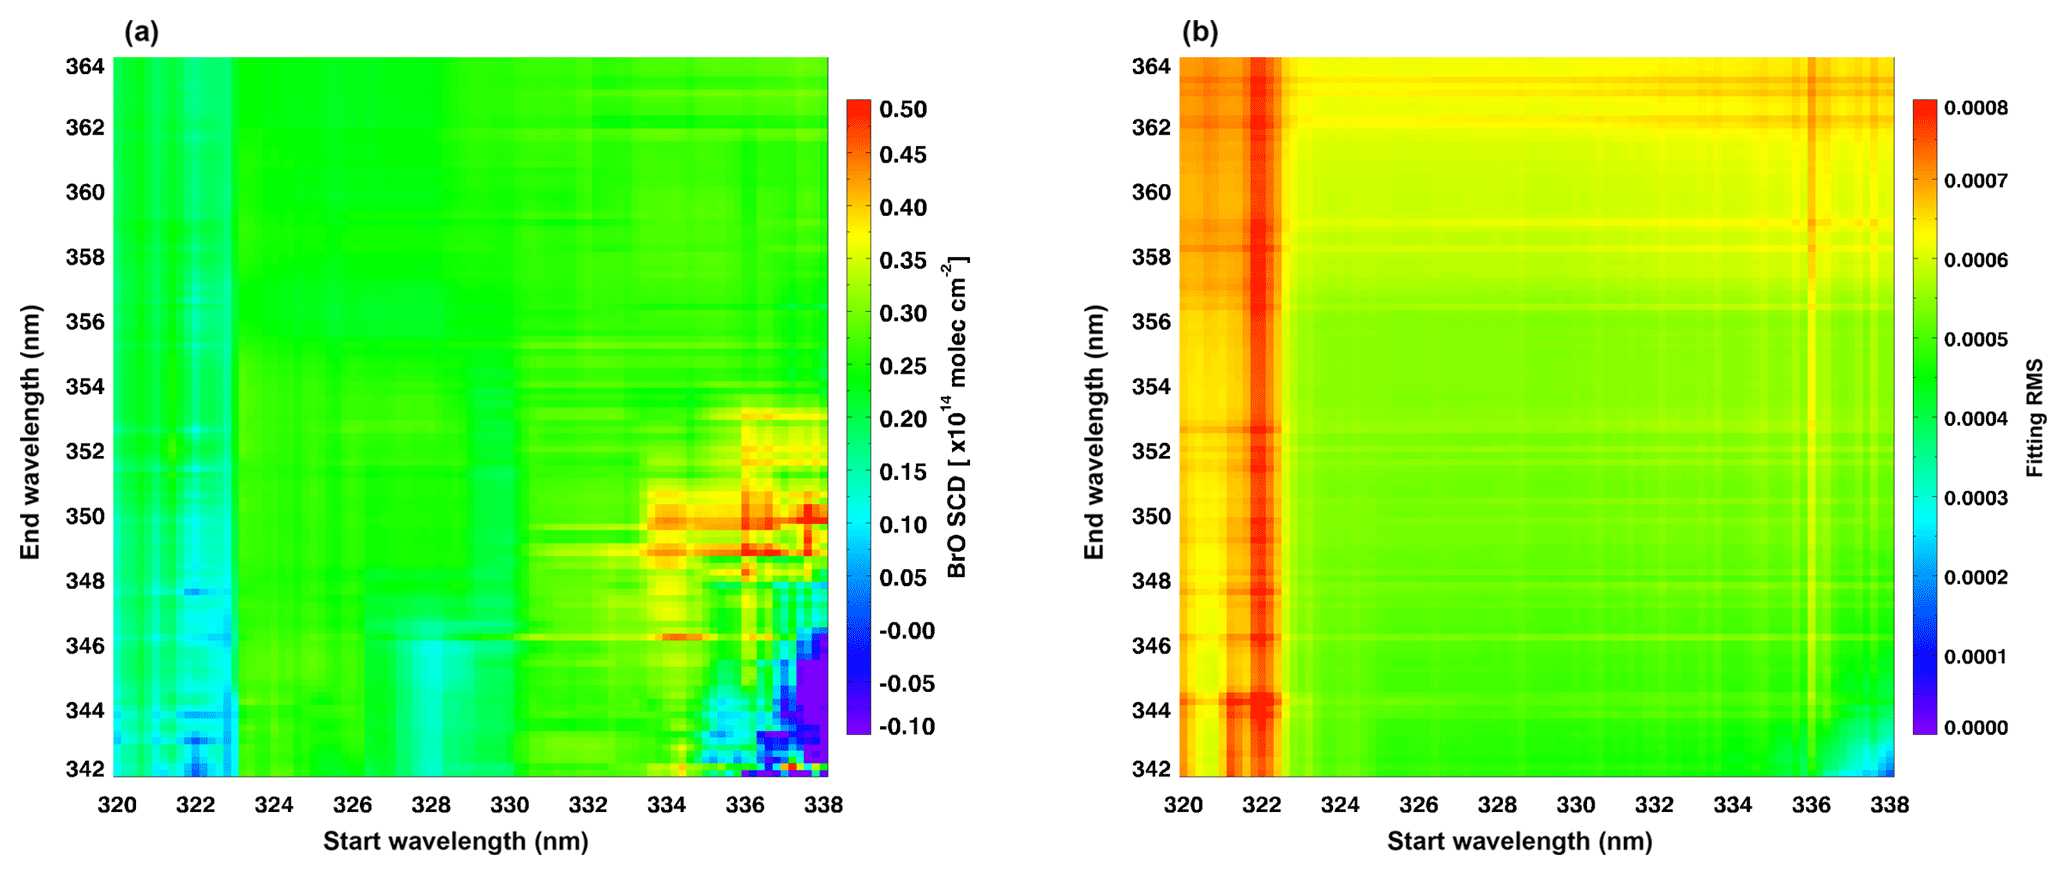
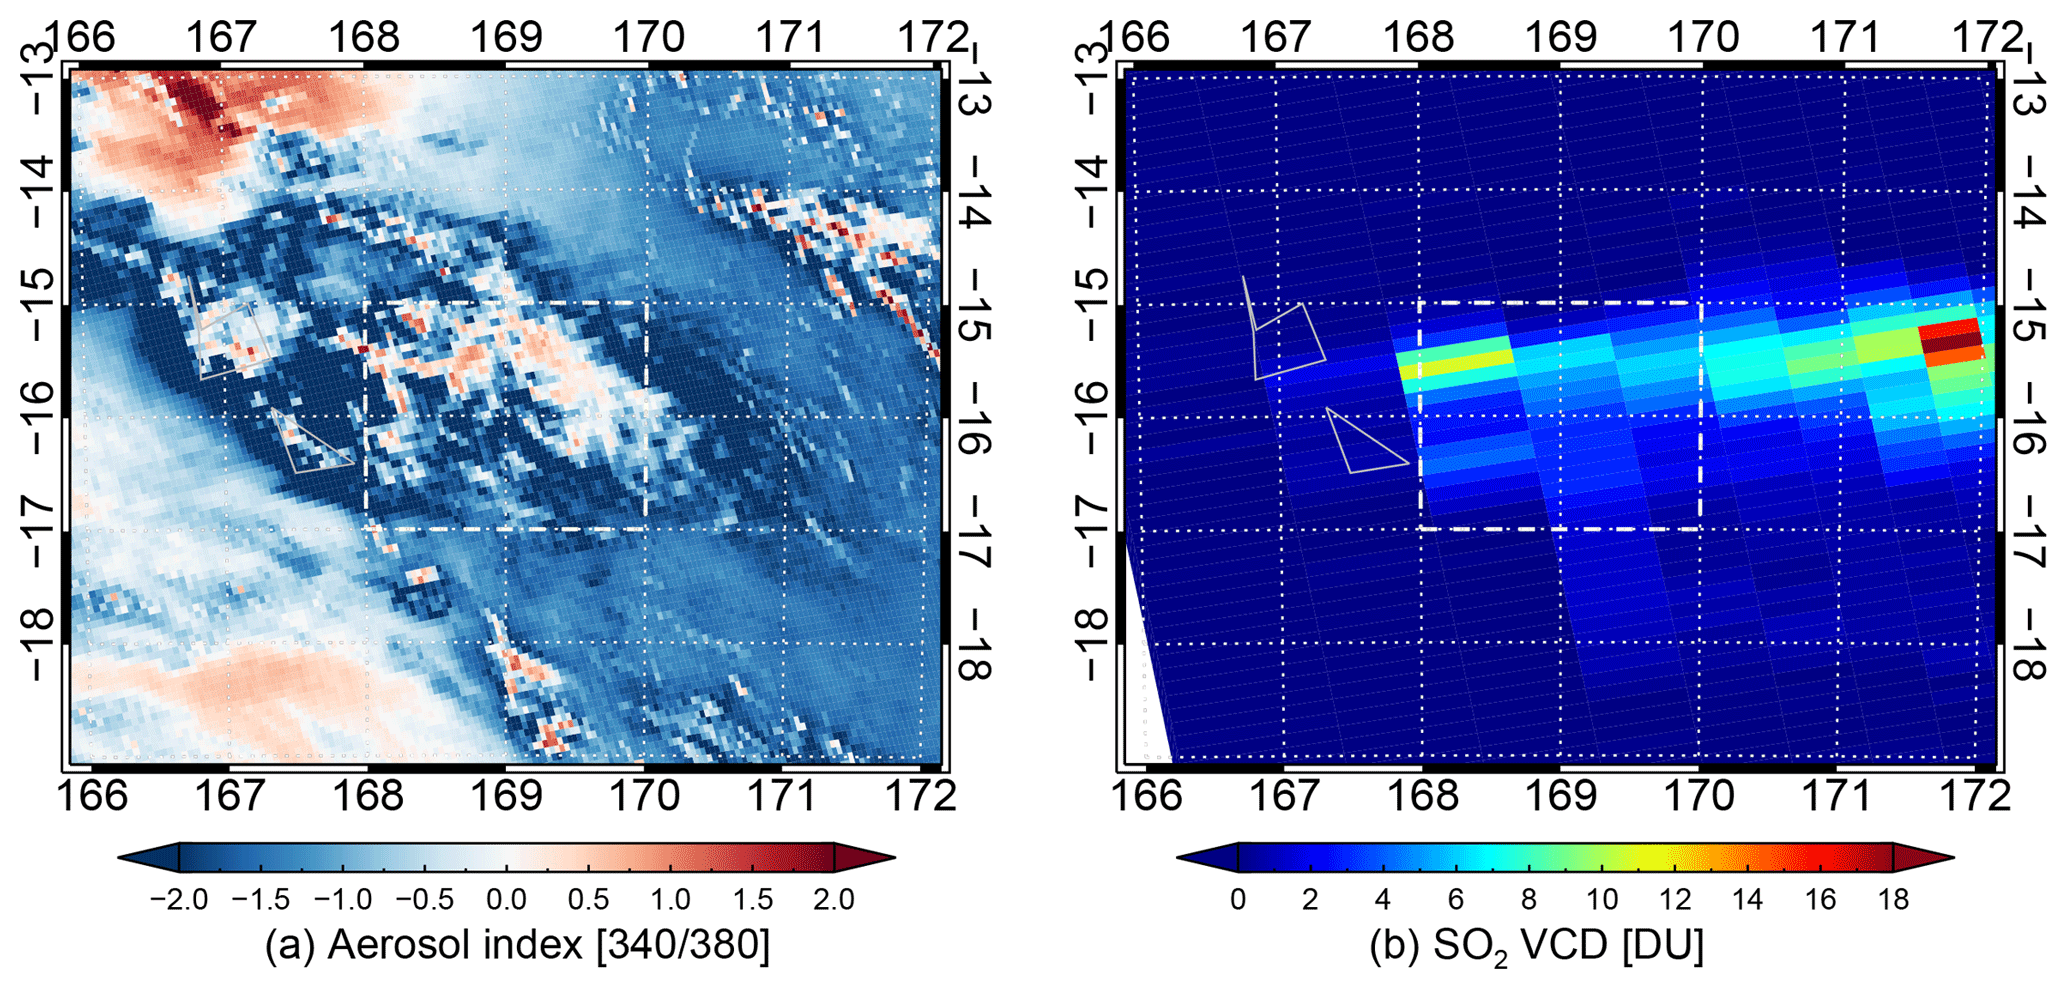
Figure 6(a) TROPOMI UV aerosol index (340/380 nm) from the operational Level 2 product and (b) OMI SO2 vertical columns (DU) from the column amount SO2 TRM (mid-troposphere) of the operational OMSO2 product for a volcanic BrO measurement scenario. The domain used for the sensitivity test is indicated by a gray dashed box.
3.1.4 BrO retrievals over clear scenes in the Pacific background region
The effect of different wavelength intervals on the BrO retrieval was also tested for the case of a clear scene in the Pacific background region without strong BrO sources and clouds. As this area is located within the background region used for the mean background spectrum, the BrO SCD should be minimal. As shown in Fig. 7a, in most of the retrieval wavelength intervals, retrieved BrO SCDs are in fact close to the detection limit. Retrieval wavelength intervals having a start wavelength smaller than 330 nm yield overestimations of SCDs, while retrieval wavelength intervals which start at wavelengths longer than 333.4 nm show mainly underestimations. In addition to the mean of the retrieved BrO SCDs, the root-mean-square error (RMSE) of the BrO SCDs in the clear background measurement scenario was also computed for each retrieval wavelength interval (Fig. 7c). The RMSE value represents the scatter of the BrO SCDs around the true BrO SCD, and thus a lower RMSE value indicates a better retrieval result with reduced uncertainty on the slant column. As can be seen in Fig. 7c, wider fitting windows show lower RMSEs, while more narrow fitting windows show higher RMSEs in general. This is reasonable because if the fitting window is extended, we can exploit more spectral points in the retrieval and improve the quality of the columns from more available information (Richter et al., 2011). However, this advantage is reduced by the increasing importance of interfering species, which is the reason for the increased RMSEs for fitting windows starting between 321 and 323 nm. In the BrO fitting rms map, the values change abruptly at the wavelength of 322.6 nm, and high fit errors occur at wavelengths <322.6 nm. This reduced fitting quality in the short wavelength range is attributed to the influence of absorption by stratospheric O3.
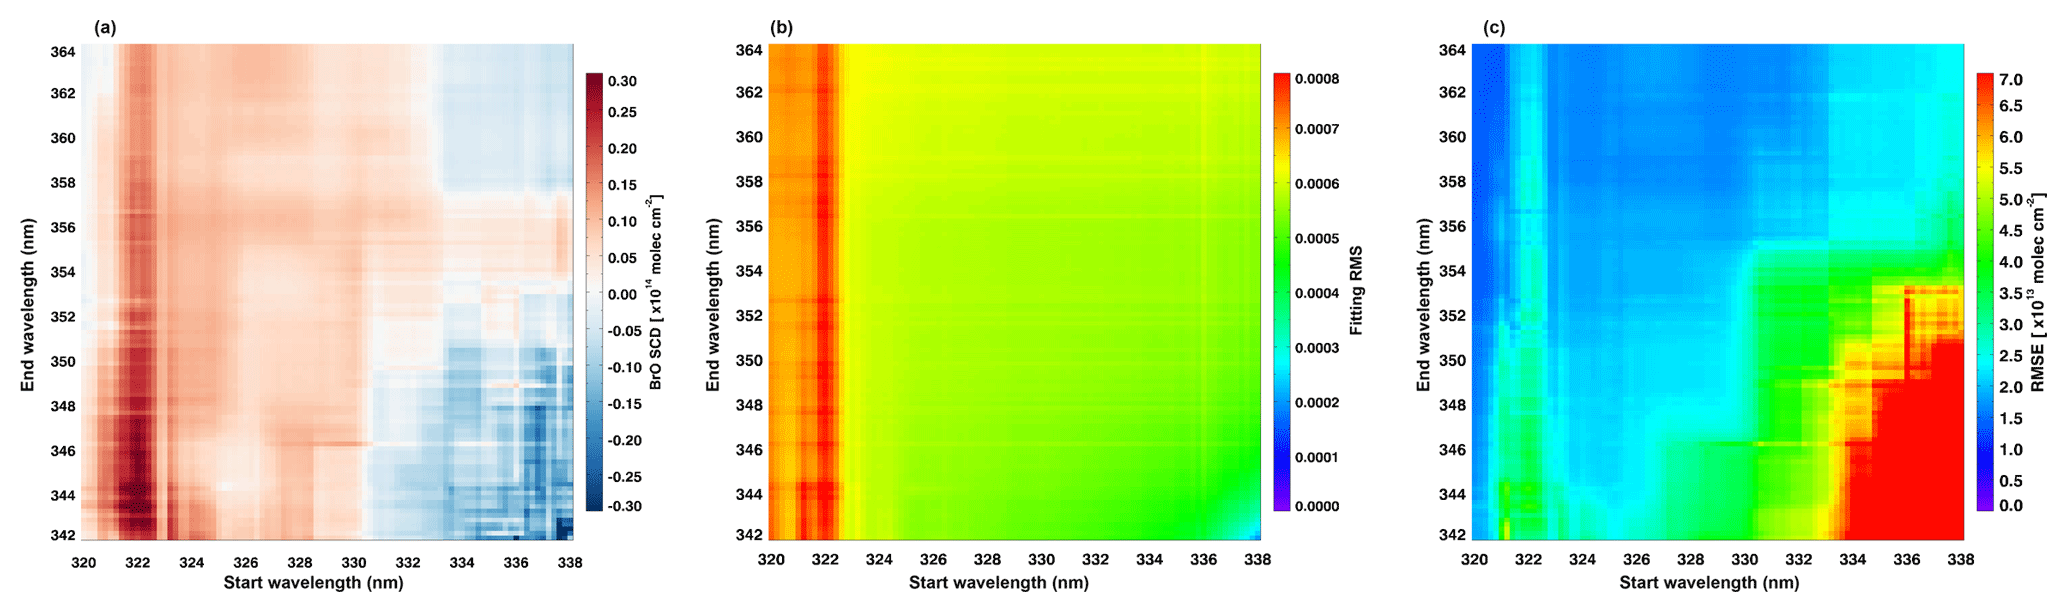
Figure 7Mean values of (a) BrO SCDs, (b) fitting rms values, and (c) root-mean-square deviation of BrO SCDs retrieved over the clear part of the scene in the Pacific background region using TROPOMI measurements at different wavelength intervals.
3.1.5 BrO retrievals over cloudy scenes in the Pacific background region
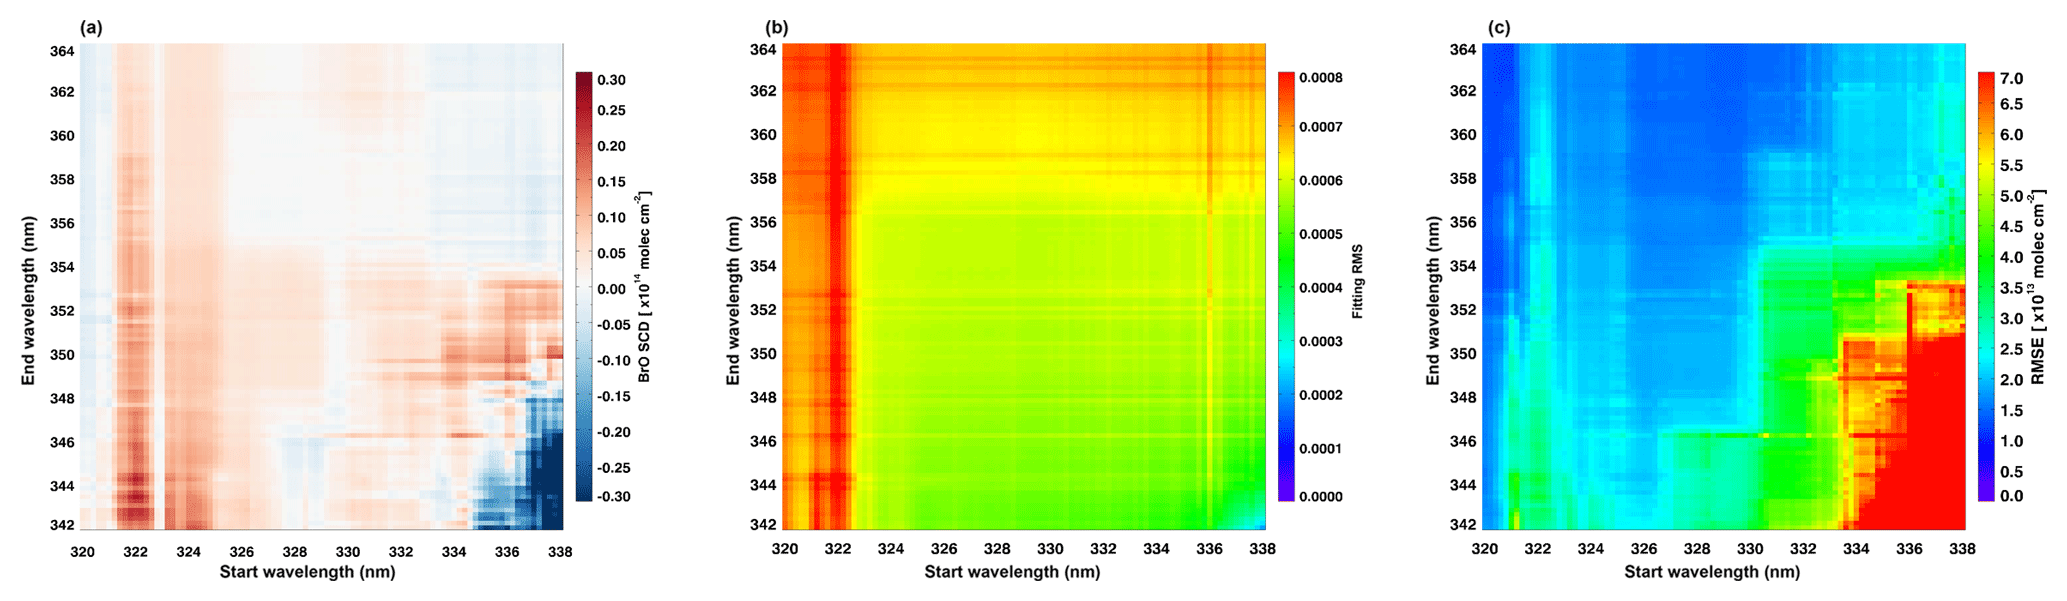
In order to investigate the effects of cloud on the retrieval of BrO at different evaluation wavelength ranges, a cloudy area was selected in the Pacific background region and the sensitivity test was performed in the same way as in Sect. 3.1.4. Figure 8 shows the means of retrieved BrO SCDs, root-mean-square errors of BrO SCDs, and fitting rms values for the measurement scenario of cloudy scenes over the background region. The retrieved BrO SCDs in the cloudy scene are closer to the true value (0) than in the clear scene measurement scenario. In addition, the RMSEs for the cloudy sky measurement scenario are lower than for the clear sky case, but the variation pattern of RMSEs as a function of the retrieval wavelength interval is similar. Both fewer over- and underestimations of the BrO SCDs and smaller deviations from the true BrO indicate lower uncertainties on the cloudy sky BrO SCDs. This is expected because clouds are bright compared to the dark ocean surface and thus the instrument receives a much larger signal. However, cloud effects are complex in DOAS retrievals using UV–vis measurements and the sensitivity depends on cloud properties such as cloud fraction, thickness, and top height (Burrows et al., 2011; Theys et al., 2011). The dependence of the retrieved BrO SCDs on the Ring effect due to the presence of clouds is also shown in the map of fitting rms values (Fig. 8b). Unlike the fitting rms variations in the cloud-free condition (Fig. 7b), the cloudy sky measurement scenarios show relatively higher fitting rms values at wavelengths longer than 358 nm, in agreement with the findings for the volcanic plume.
3.1.6 Selection of optimal fitting window
In the previous sections, the influence of the retrieval wavelength interval on the DOAS BrO retrieval was tested for different measurement scenarios. Based on these test results, we can determine the best fitting window for TROPOMI BrO retrievals for global analysis as well as for the primary BrO source regions. The optimal retrieval fitting windows can be defined as those wavelength intervals which show higher BrO signals with lower fitting residuals in the BrO source regions, while the BrO SCDs should be minimal with narrow distributions of SCDs over the clean Pacific background region. The test for polar BrO retrievals showed unphysical values in wavelength intervals including lower wavelengths smaller than 327 nm due to strong O3 interferences. The effect of SO2 interference with strong absorptions at lower wavelengths was also confirmed in the volcanic BrO measurement scenario. Their interfering influences are reduced at longer wavelengths as overall absorption cross section structures decrease; thus retrieval wavelength intervals with a start limit above 327 nm are preferred to avoid the strong dependency on the lower wavelength limit. In addition to O3 and SO2 absorptions at shorter wavelengths, HCHO can also interfere in DOAS BrO retrievals through anticorrelation between the two gases, especially at ∼333 nm. This potential artifact may be attributed to the cross correlation caused by the absorption band shape of BrO and HCHO, and it is necessary to find a retrieval wavelength interval that minimizes possible errors caused by the BrO–HCHO cross correlation. In the case of DOAS retrievals over the cloudy background region and the volcanic plume, higher fitting errors were found in the wavelength intervals extending beyond 362 nm because of imperfect correction of the Ring effect and possibly also poorer fitting of O4 related to the temperature dependency of the cross section. While minimizing these sources of uncertainty on the retrieval, the range of reasonable BrO SCDs and low retrieval errors for all measurement scenarios are observed in the wavelength range of start limits of 334–338 nm and end limits of 358–362 nm. Finally, the fitting window 334.6–358 nm was selected for TROPOMI BrO retrievals with other retrieval parameters set as shown in Table 2, by comparing fit residuals and SCD distributions for the remaining fitting windows. Figure 9 shows a spectral fitting example of a pixel from orbit 2207 on 17 March 2018 passing over the Arctic sea ice region (72.55∘ N, 200.40∘ E in Fig. 12c). The larger BrO SCD of 4.72×10¹⁴ molecules cm−2 was retrieved with relative small fitting error of 6.2 %. Although the choice of the optimal fitting window may seem arbitrary to some degree, the analysis of several different relevant scenarios for many possible combinations of fitting windows described above demonstrates that this is an overall robust selection. However, further studies are needed to address the remaining challenges identified through the sensitivity tests, in particular the possible spectral cross correlation of BrO with HCHO around the selected fitting window.
Table 2DOAS settings used for the BrO slant column retrievals and instrumental intercomparison.
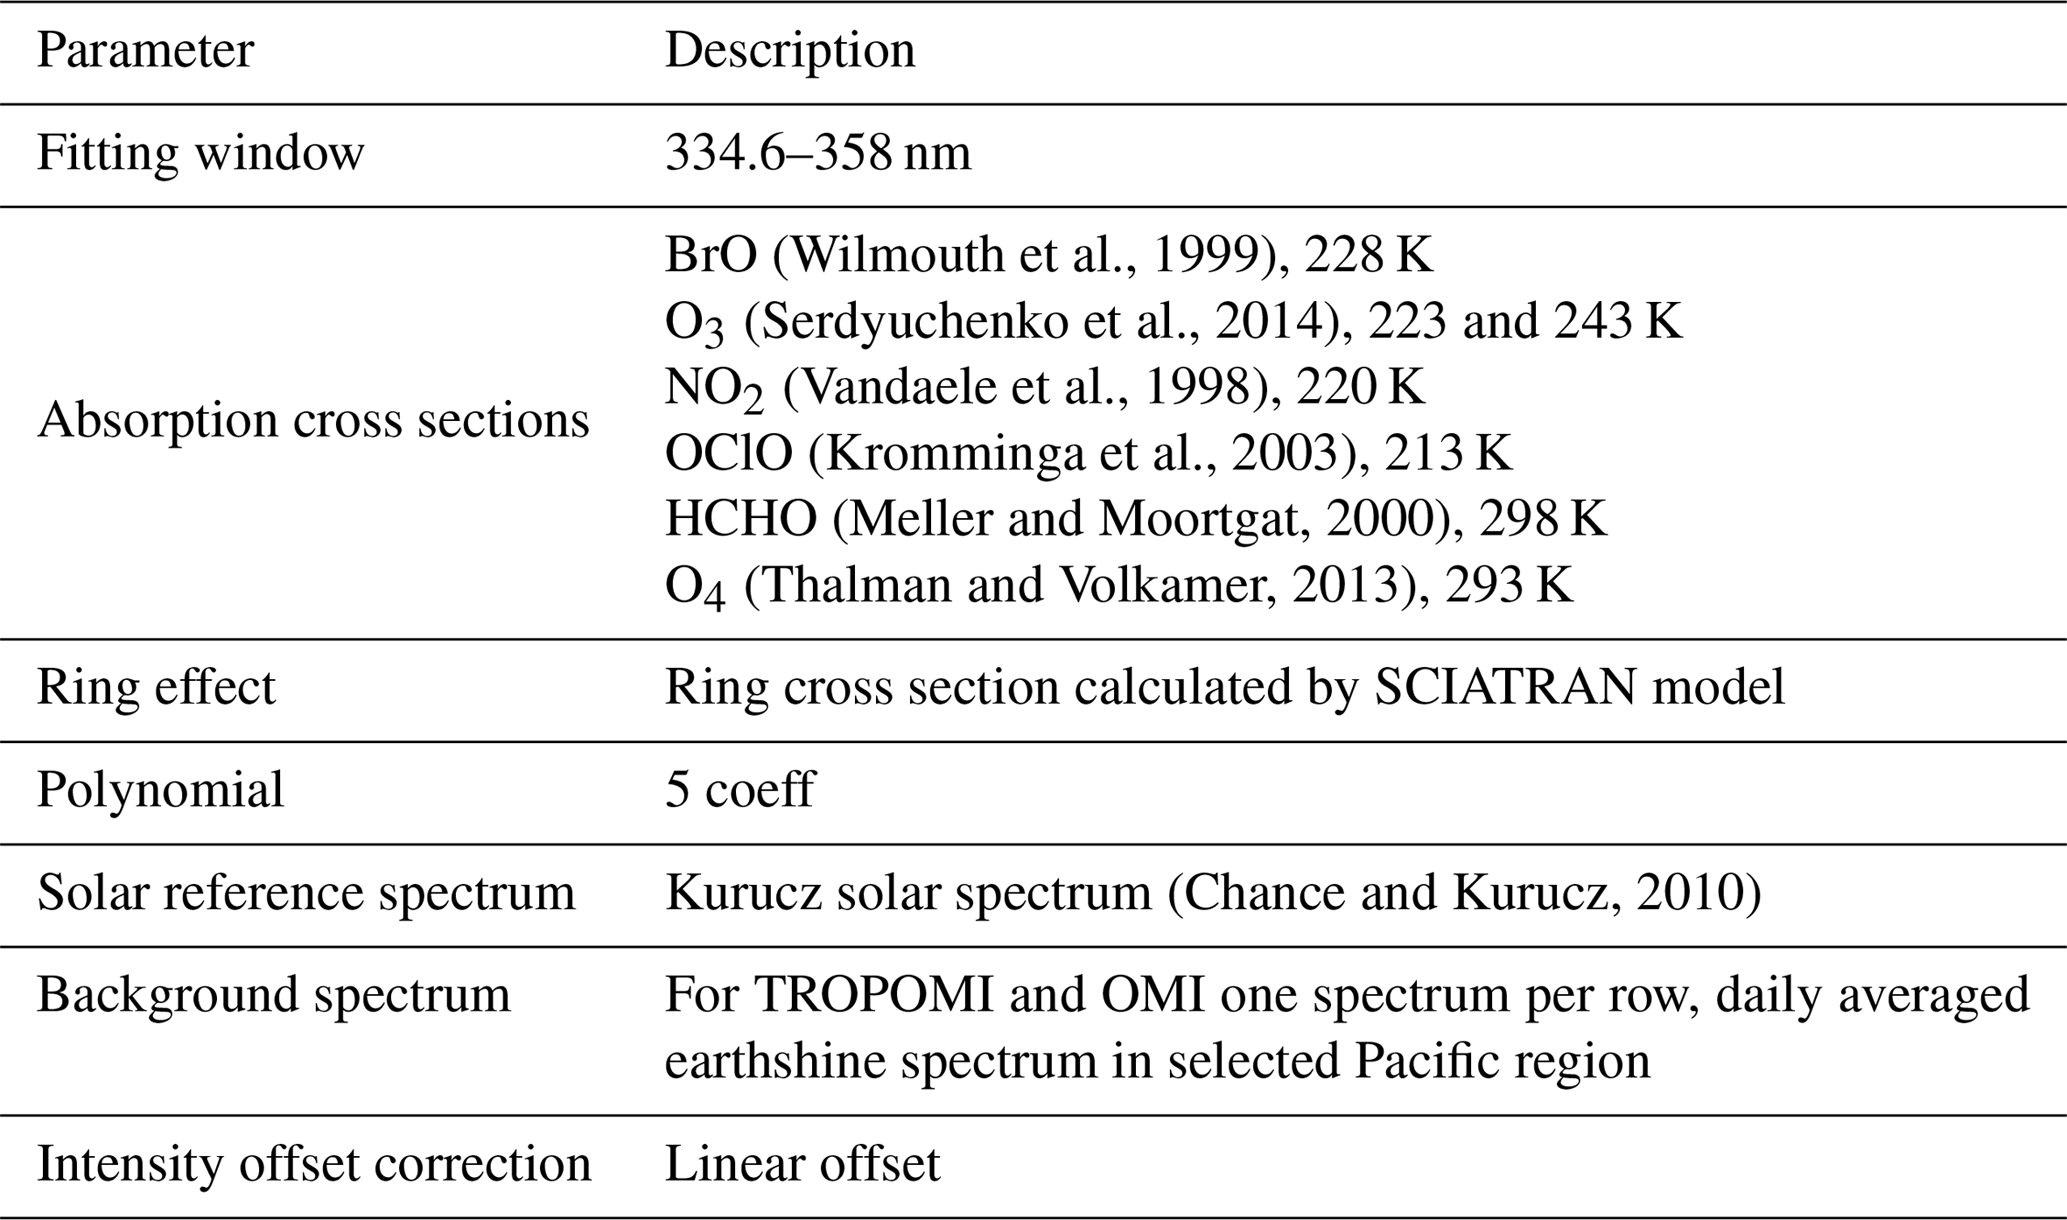
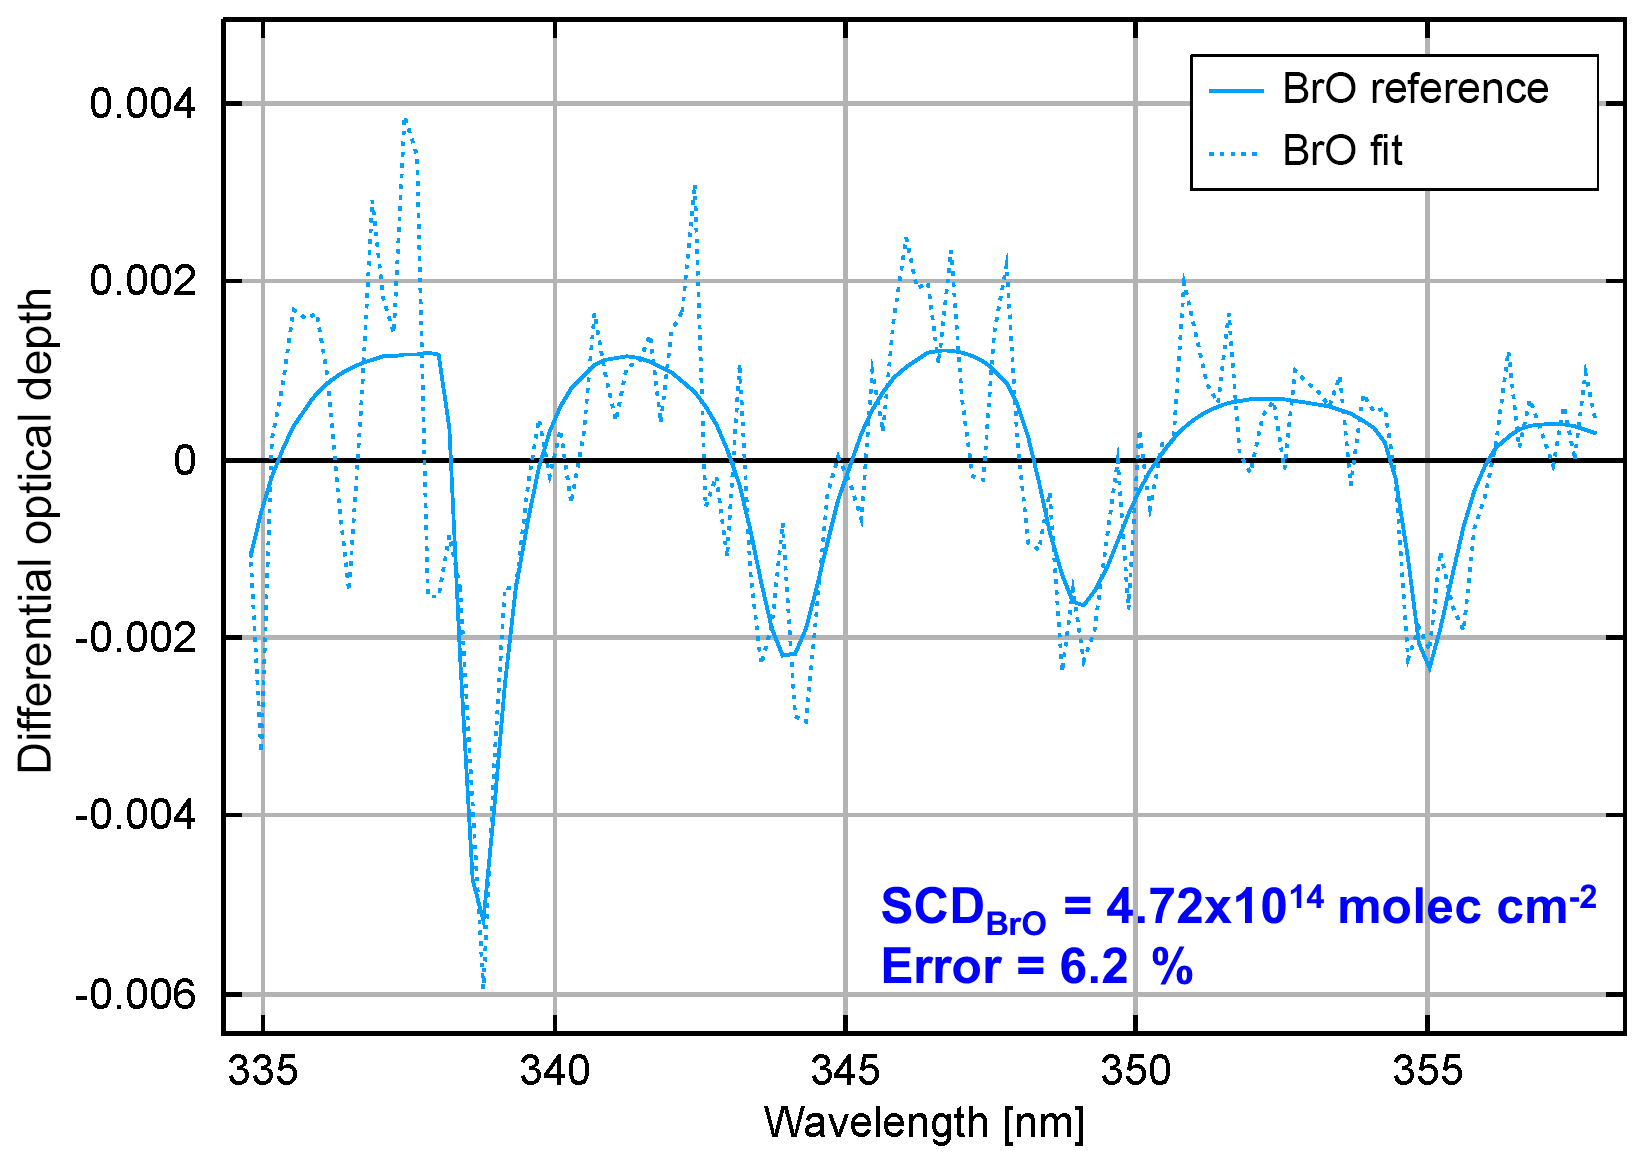
Figure 9Example of a BrO fit result applying DOAS settings of Table 2 in the Arctic BrO measurement case. The dashed line shows fit results including the fitting residual and the solid line is the reference spectrum scaled according to the fit result.
3.2 Destriping and offset correction
TROPOMI is an imaging spectrometer operating in push-broom configuration where one direction of the two-dimensional charge-coupled device (CCD) detector is used for the wavelength axis and the other for the across-track image of the instrument's 2600 km wide field of view. This is similar in concept to OMI but with 450 instead of 60 spatial rows at much higher spatial resolution (Veefkind et al., 2012). In this instrument configuration, across-track variability can appear as stripes in trace gas columns due to small variations between the rows which are not completely compensated for by lv1 calibration. Indeed, OMI has shown this across-track striping problem (Boersma et al., 2007) and explicit destriping is applied in many OMI products. In TROPOMI data, stripes are also apparent in some trace gas maps when using solar irradiance measurements as background. Two different approaches can be carried out to correct for this: either the across-track variability is determined on a daily basis over a region with minimal variability in trace gas columns and subtracted from all retrieved slant columns, or irradiance background spectra are replaced by averages of nadir observations taken over a reference region. In this study, the second approach is used and daily row-dependent mean radiances measured over a selected Pacific region (30∘ S–30∘ N, 150–240∘ E) are used as background spectrum. This approach can effectively remove across-track stripes, but the retrieved differential BrO SCDs have to be corrected for the viewing angle dependency of the column over the reference region. Here, BrO SCDs were normalized to an assumed background level of a BrO vertical column density (VCD) of 3.5×10¹³ molecules cm−2 over the Pacific background as suggested by previous studies (Richter et al., 2002; Sihler et al., 2012) using a two-step approach (see Fig. 10). First, an offset value for normalization of the differential BrO SCDs is determined as the mode of the Gaussian distribution of differences between the differential SCDs in the reference sector and the normalized SCDs estimated by multiplying the background VCD and a geometric air mass factor defined as . In a second step, this offset value is modified for each row depending on the viewing zenith angle (VZA) to account for variations in the BrO air mass factor. The normalized SCDs are finally calculated by subtracting the VZA-dependent offset values from the measured SCDs.
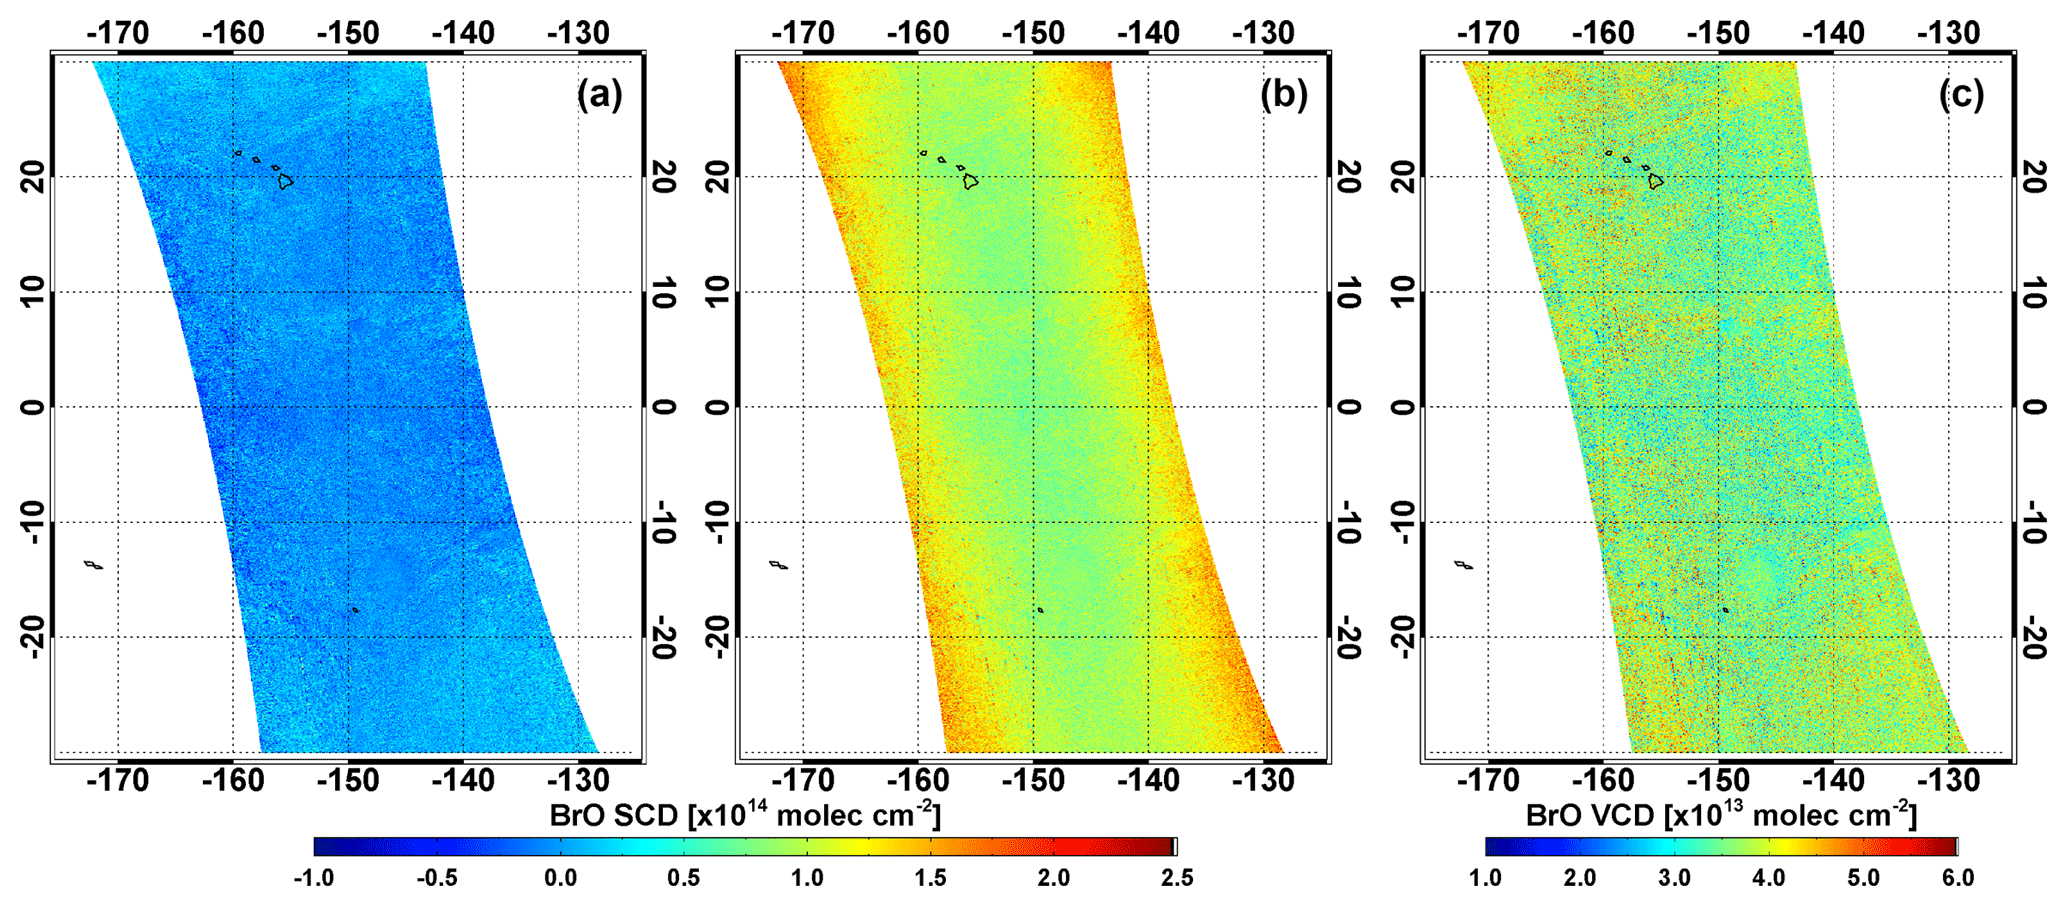
Figure 10Illustration showing destriping and offset correction steps described in Sect. 3.2 using TROPOMI orbit 2207 on 17 March 2018. (a) BrO SCDs retrieved by daily row-dependent mean radiances in the Pacific reference sector as background spectrum for the across-track correction, (b) offset-corrected BrO SCDs treated by applying the normalization approach including the VZA dependency on the BrO SCDs, and (c) BrO VCDs computed by dividing the offset-corrected BrO SCDs by geometric AMFs.
4.1 Global distribution of BrO
Applying the retrieval settings described in Table 2, BrO vertical columns have been computed from TROPOMI, OMI, and GOME-2B Level 1 spectra. It should be noted that BrO VCDs were calculated using geometrical air mass factors and data for solar zenith angles larger than 85∘ and chi-square values greater than 0.01 were excluded. For OMI, ground/atmospheric scenes affected by the row anomaly were also excluded by using the OMI XTrackQualityFlags. The data in rows 42 to 45 were additionally ignored because it was apparent from the BrO SCDs that they were affected by the row anomaly although they were not marked as bad pixels. No cloud screening was applied. Figure 11 shows the global distributions of the monthly averaged BrO total vertical columns from the three satellites for April 2018. The spatial distributions of BrO columns show a good consistency in spite of the differences in instrument resolution and overpass times. High BrO values are shown in the northern high-latitude region because of tropospheric bromine explosions over the Arctic sea ice during springtime as discussed in previous studies (Richter et al., 2002; Simpson et al., 2007; Begoin et al., 2010), whereas BrO values are low in the tropics and midlatitudes where BrO columns are primarily of stratospheric origin. Relatively higher BrO values are found in the subpolar and Antarctic region compared to tropics and midlatitudes. This might reflect real BrO column increases but could at least partially be related to the use of geometric air mass factors (AMFs), which do not consider the effects of surface albedo and clouds. The number of photons detected at the satellite is larger over bright surface areas than over dark surface areas. Therefore, the use of a simple AMF which does not consider the sensitivity to surface albedo can underestimate BrO vertical columns over dark surfaces such as the ocean in comparison to high-surface-albedo regions such as the Antarctic region, north of Russia and Canada. In addition to the surface albedo, clouds also affect signals detected at the satellite. The light path length and intensity are significantly changed by the cloud top height, cloud thickness, and cloud fraction. Using an AMF that does not take into account the cloud effects can therefore result in errors in the computed vertical columns, as can be seen from the slightly higher BrO VCDs in the subpolar regions where cyclones are frequently observed due to the subpolar low-pressure system (Fig. 11). Consequently, an improved AMF reflecting the sensitivity of surface albedo, cloud properties, and BrO vertical profile should be calculated to obtain more accurate vertical column densities (Theys et al., 2011; Sihler et al., 2012), and this will be investigated in detail in a follow-up study using surface albedo and cloud information from the operational satellite products as they become available.
To assess the random noise of the BrO retrievals for the different instruments, distributions of SCDs and retrieval fitting rms values over a clean Pacific region (10∘ S–10∘ N, 150–260∘ E) were analyzed for April 2018. Here, differential BrO SCDs without the background offset correction were used for more clear interpretation. As shown in Fig. 11b, all three satellite BrO SCD distributions show nearly Gaussian shape and are centered around zero with full width at half maximums (FWHMs) of 0.50, 0.80, and 0.79×10¹⁴ molecules cm−2 for TROPOMI, GOME-2B, and OMI, respectively. However, while TROPOMI and GOME-2B columns are symmetrically distributed close to the detection limit, OMI data are slightly shifted towards positive values. The latter is attributed to be a consequence of systematic biases caused by the relatively lower quality of Level 1b radiance due to the instrument degradation. TROPOMI shows the smallest scatter of BrO SCDs, with OMI and GOME-2B having about 60 % larger FWHMs. TROPOMI retrievals also show by far the smallest mode of the fitting rms distributions, demonstrating the excellent signal-to-noise ratio per pixel even at the unprecedented small footprint.
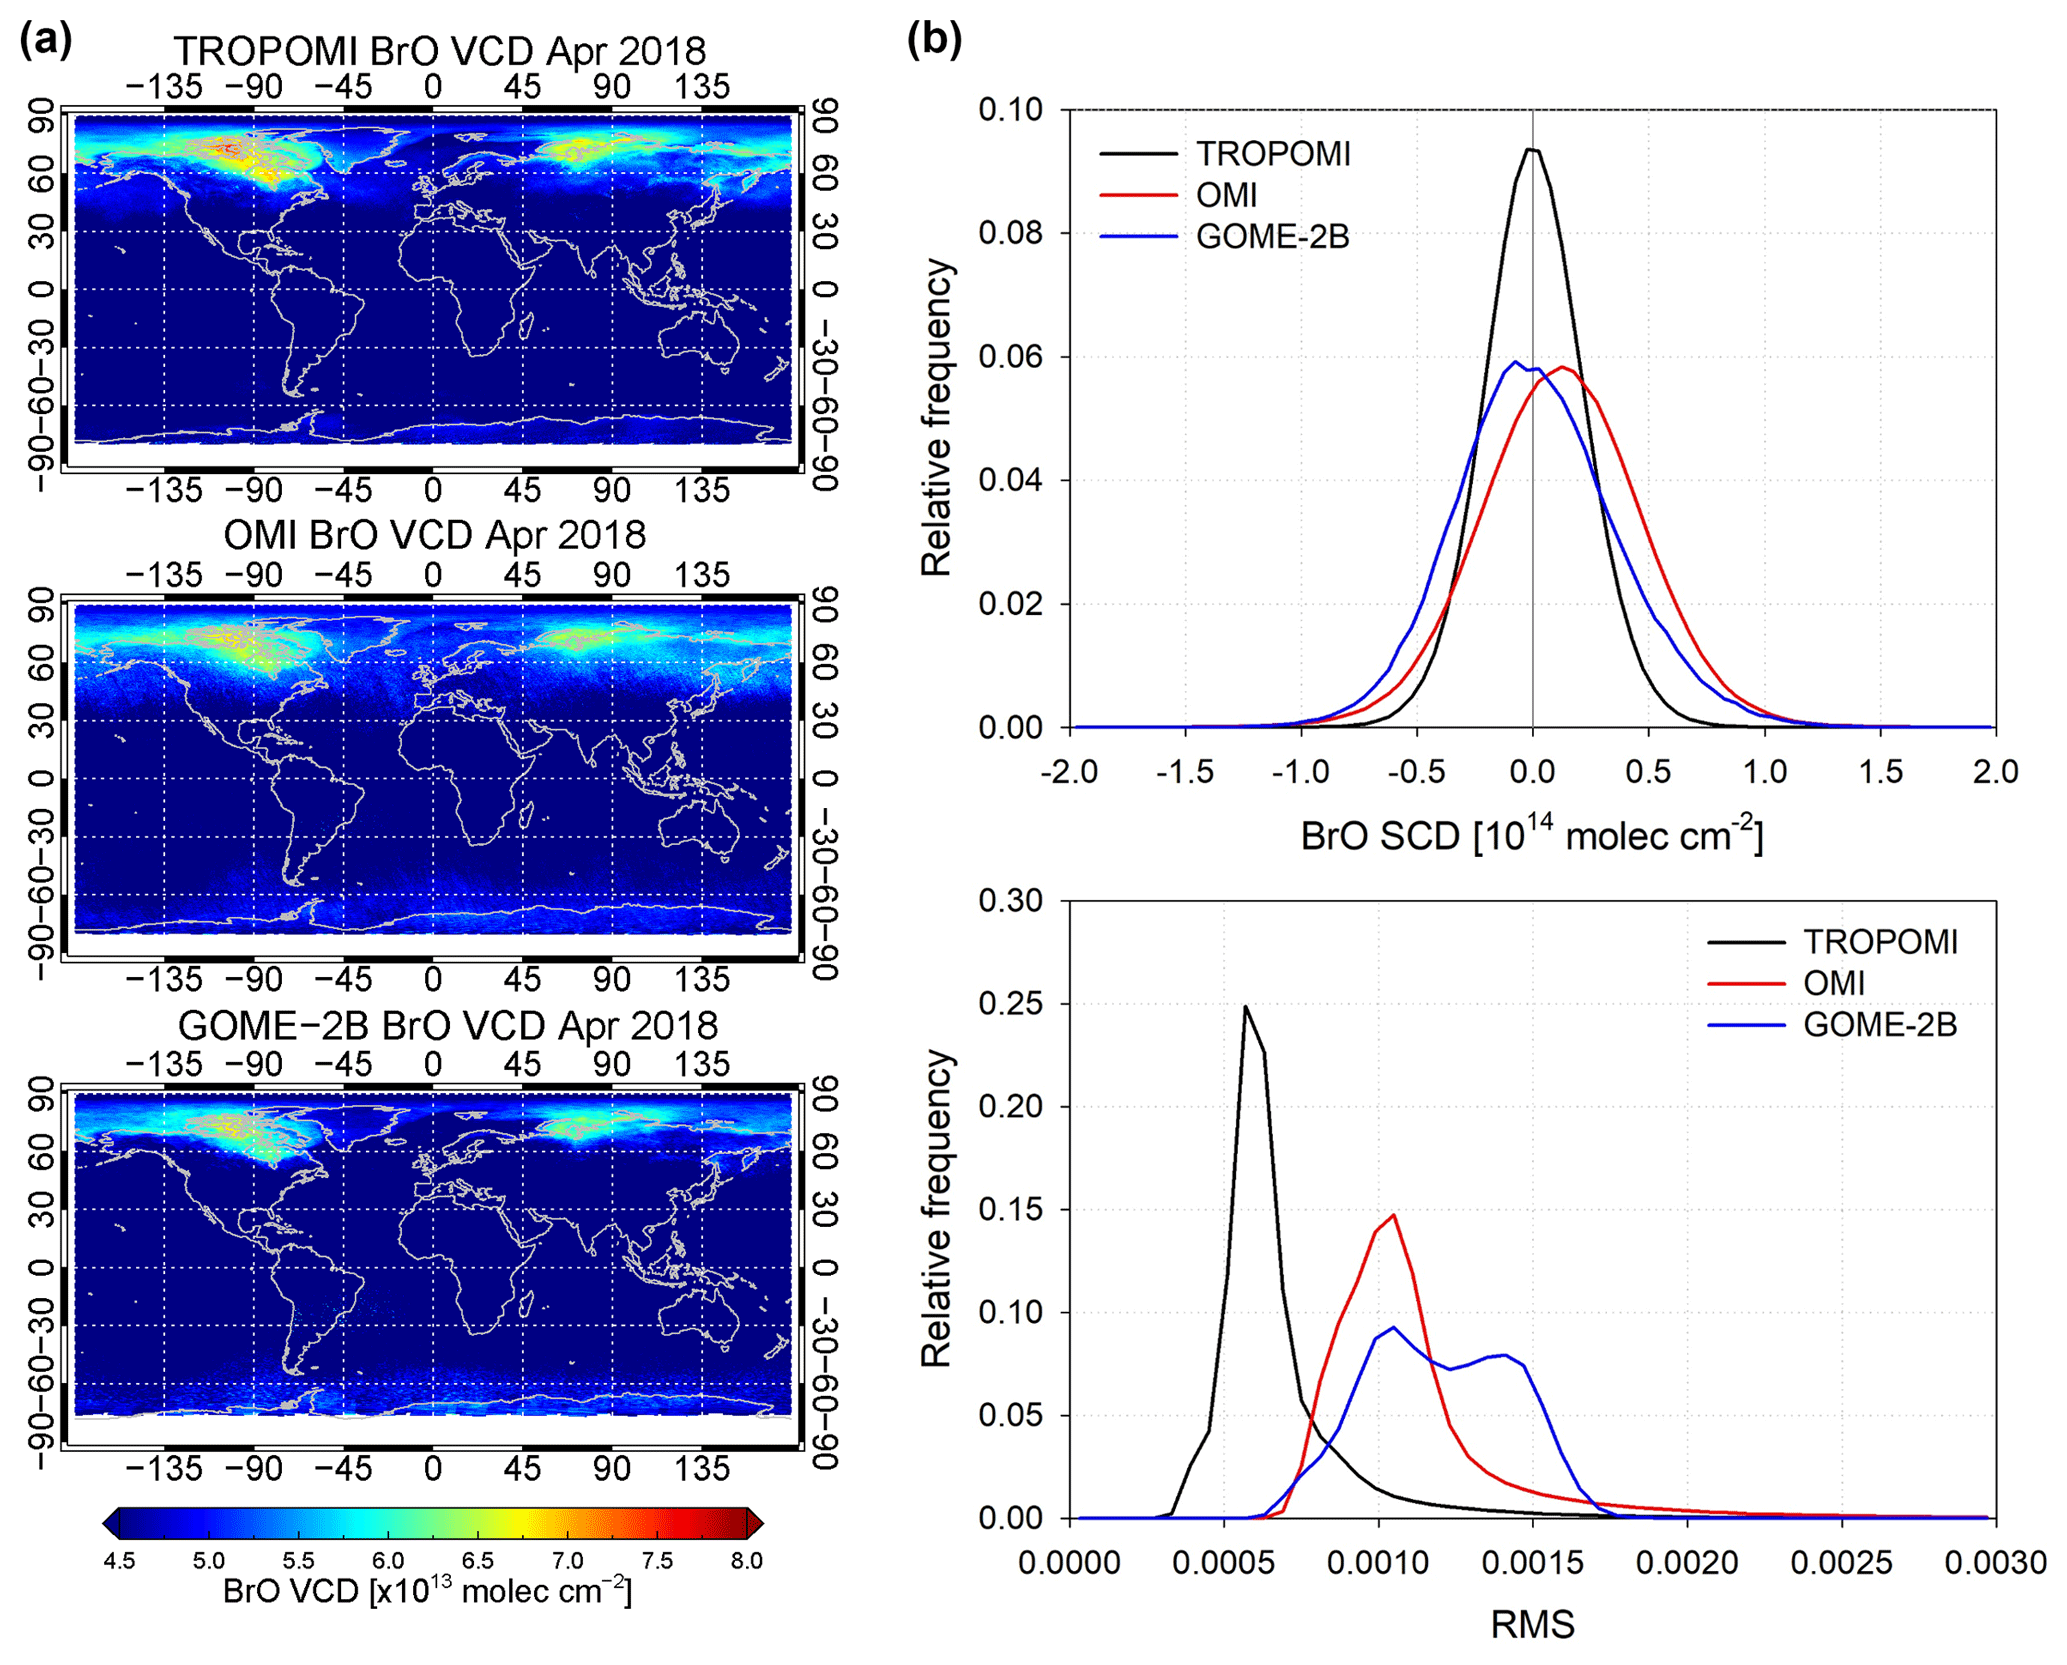
Figure 11(a) Global distributions of monthly mean BrO vertical columns retrieved from TROPOMI, OMI, and GOME-2B measurements for April 2018. Data with a solar zenith angle lower than 85∘ were used, and in the case of OMI data, only data not affected by the row anomaly were included. (b) Distribution of BrO SCDs and fitting rms values over a clean equatorial Pacific region (10∘ S–10∘ N, 150–260∘ E) for the same study period.
4.2 Comparison to OMI and GOME-2B retrievals
To evaluate the consistency of TROPOMI BrO retrievals with those from other satellites, a comparison of BrO satellite retrievals was performed using GOME-2B and OMI retrievals obtained by applying the same retrieval setting (Table 2) to Level 1b data. However, for the comparison of different satellite retrievals, several things have to be considered. First of all, the three satellites have different spatial resolution, 40×80 km2 for GOME-2B, up to 13×24 km2 for OMI, and 3.5×7 km2 for TROPOMI. To establish a relationship between different satellite values with different pixel sizes, a spatial coupling of the different data sets is required. Here, the higher-spatial-resolution TROPOMI data were averaged based on a grid of lower spatial resolution. Each GOME-2 and OMI BrO measurement was compared to the averaged TROPOMI BrO that lay within the distance of 0.3 and 0.1∘ from their center of pixels, respectively. In addition to different pixel sizes, the effect of different overpass times between satellites should be considered. TROPOMI, which has an ascending orbit with a local Equator crossing time of 13:30 LT, shows a different overpassing time than GOME-2B, which has a descending node equatorial crossing time at 09:30 LT, whereas it has a similar afternoon overpassing time to OMI. Although having a similar overpassing time on the ascending node to TROPOMI, recent OMI data provide only limited data due to the loss of spatial coverage with the expansion of the row anomaly, especially in the middle and east across-track segments of the orbit (Torres et al., 2018). This led to a difficulty in utilizing orbits having similar measurement times for the two satellite instruments.
Figure 12a shows a scatter plot comparison between TROPOMI and OMI BrO VCDs, and Fig. 12b compares TROPOMI and GOME-2B BrO VCDs. As mentioned before, BrO VCDs were converted from SCDs by dividing geometric AMFs. The comparison was performed for enhanced BrO plumes in the Arctic sea ice region on 17 March 2018 (Fig. 12c). Despite the different spatial resolutions and measurement times of the instruments, TROPOMI BrO shows good agreements with both OMI and GOME-2B BrO with correlations of 0.84 and 0.84 and slopes of 0.89 and 0.72, respectively. This good agreement and consistency of TROPOMI data with previous satellite sensors suggest that these data could be used to extend the existing long-term data set of space-based BrO observations, in particular for tropospheric BrO explosion events.
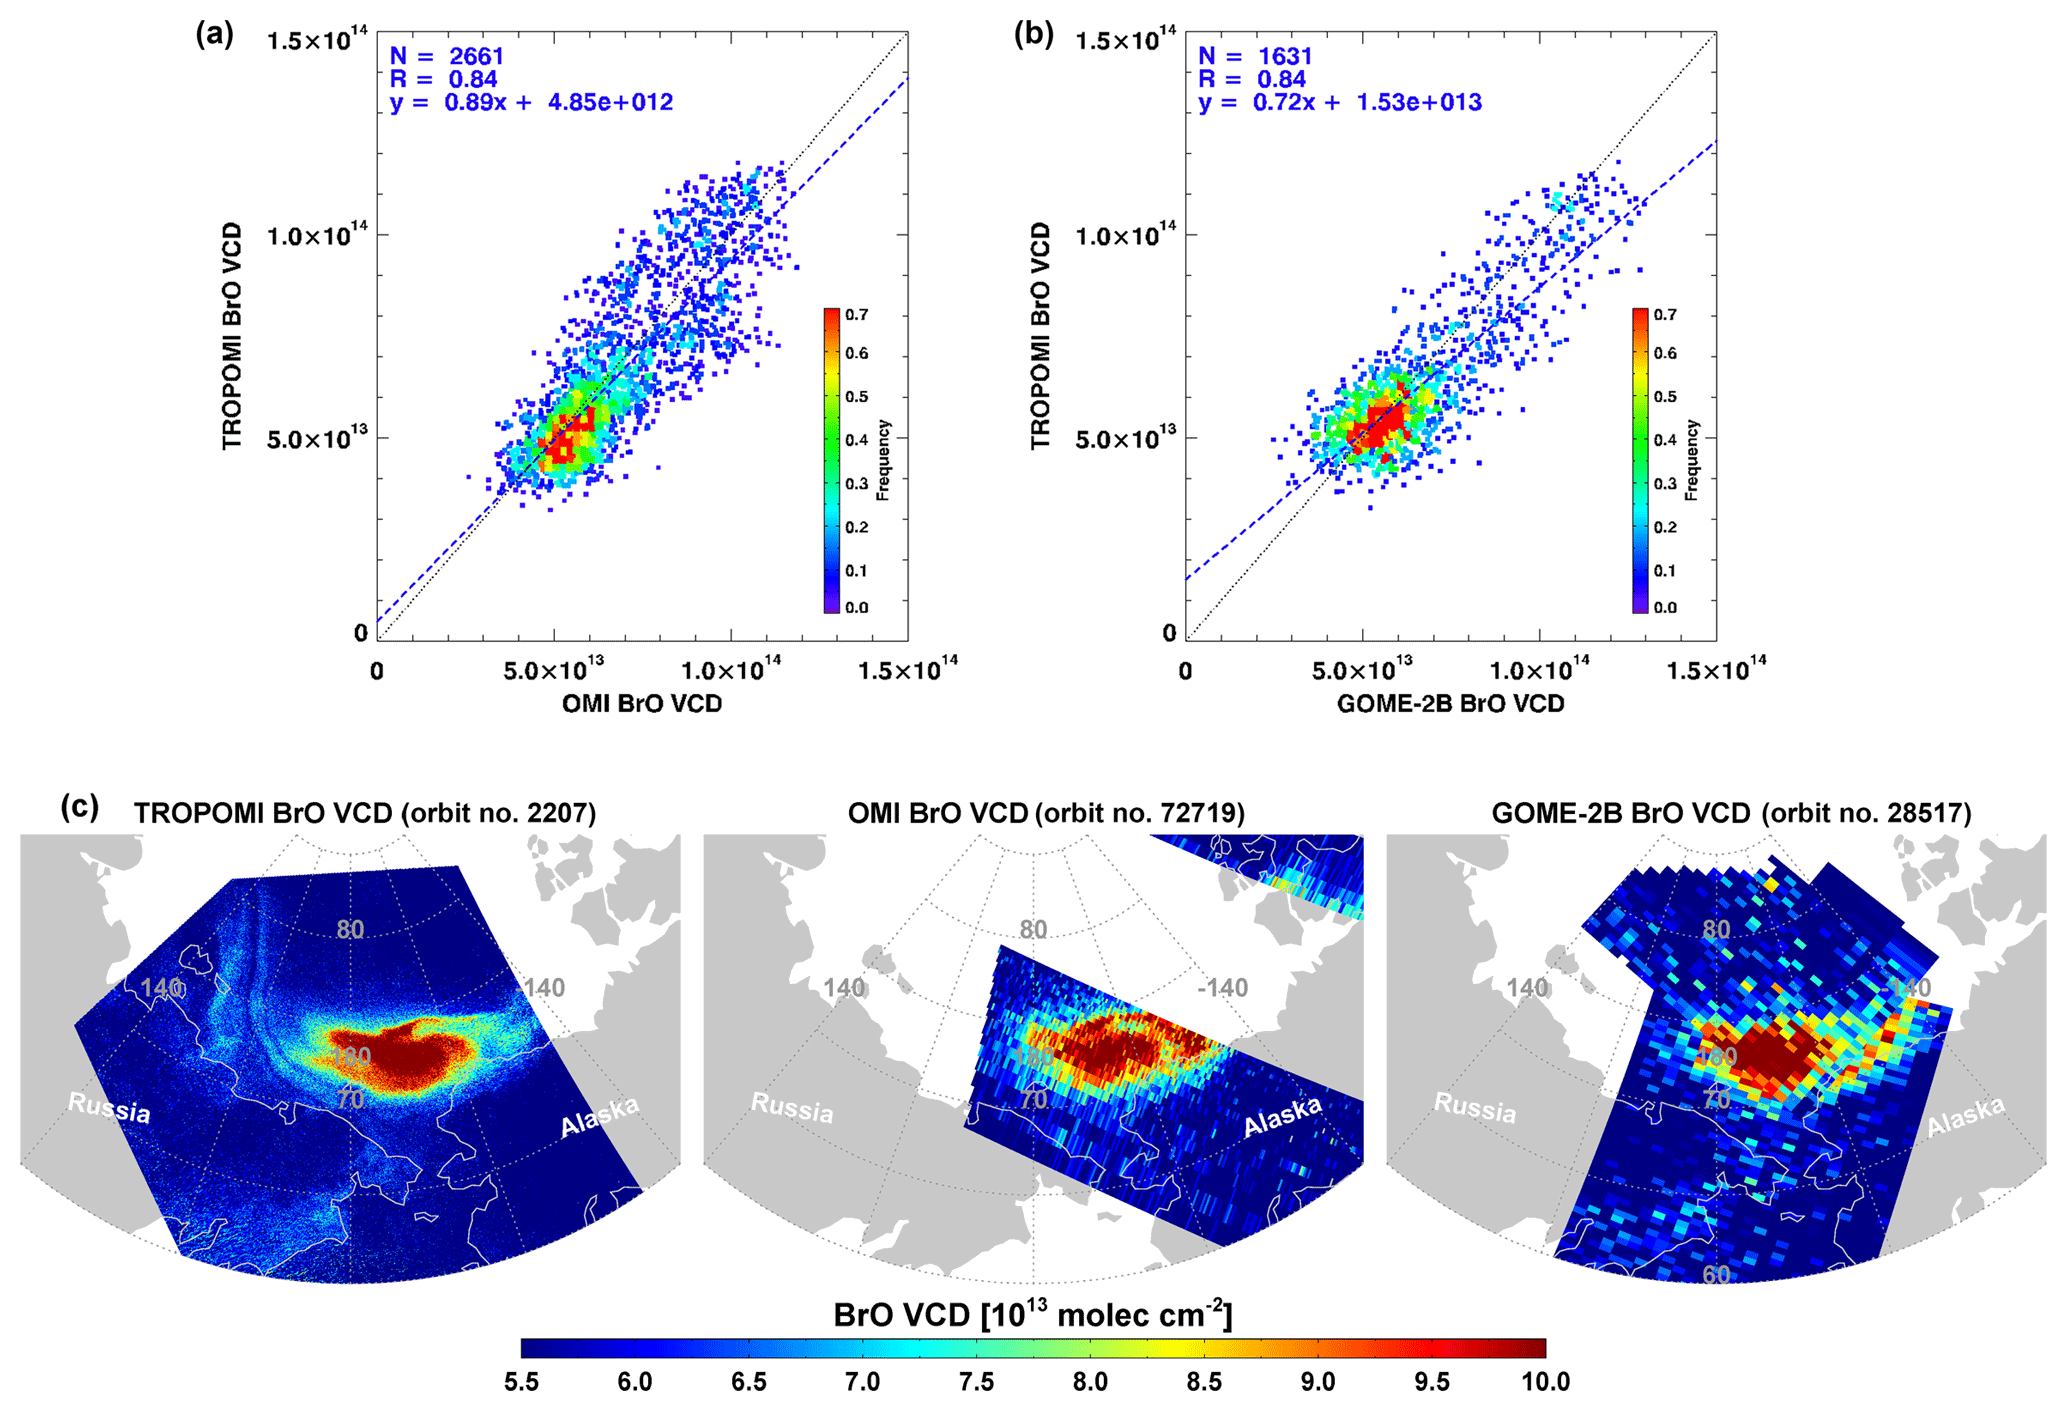
Figure 12Scatter plots of (a) TROPOMI and OMI BrO vertical columns and (b) TROPOMI and GOME-2B BrO vertical columns in (c) the selected region of enhanced BrO plumes on 17 March 2018.
4.3 BrO observations in tropospheric source regions
4.3.1 BrO plumes over Arctic sea ice
Explosive enhancements of BrO in the troposphere taking place in the polar boundary layer during spring have been reported from ground-based measurements and satellite observations (Hönninger et al., 2004; Begoin et al., 2010; Choi et al., 2012). As an illustration of the signature of such events in TROPOMI data, Fig. 13 presents maps of the TROPOMI, OMI, and GOME-2 measurements of total column BrO on 10 April 2018. A small compact BrO enhancement as well as a long BrO plume extending along the coastline can be identified in the figures. The long and thin enhanced BrO plume near the coastline is prominent in the map of TROPOMI, while it can hardly be discerned in the OMI and GOME-2B maps. For the OMI retrievals, a significant part of the scene is missing because of filtering for pixels affected by the row anomaly. The GOME-2B orbit shown was taken about 1 h before the TROPOMI and OMI measurement times but the BrO plumes are detected in similar locations and have a size comparable to in the TROPOMI data. However, the details of the spatial distribution and plume shape cannot be confirmed due to the lower spatial resolution of GOME-2.
Another example of a BrO explosion event case is shown in Fig. 14. A relatively narrow and long shape of enhanced BrO over the Beaufort Sea can be found in all three satellite maps. As discussed for the previous example, TROPOMI data with the high spatial resolution of 3.5×7 km2 yield a more detailed view of the BrO explosion event compared to OMI and GOME-2B. The enhanced BrO plumes appear around open leads and sea ice cracks shown as slightly darker areas in the matching MODIS image (arrows pointing at examples). In particular, the elevated BrO around the Banks Island and the eastern Beaufort Sea (70–77∘ N, −140 to −120∘ E) could be significantly linked to open leads since frost flowers and sea salt aerosols, which act as the source of reactive bromine, can be formed in such areas (Simpson et al., 2007). Also, opening of sea ice leads can locally create enhanced vertical mixing and uplifting of bromine sources. However, the analysis of the long enhanced BrO plume from the coast of Alaska towards the north should be cautious. The MODIS image composed of the 7-2-1 bands can distinguish clouds (as white) from the sea ice (as sky blue), and this image shows that the shape of the enhanced BrO plume is similar to that of clouds. Convective clouds can be formed around open leads due to the supply of water vapor and enhanced vertical mixing, but computed BrO enhancement over clouds may have an error because of the use of AMFs, which do not consider the effects of clouds. In spite of this uncertainty, the enhancement of vertical columns by up to 4×10¹³ molecules cm−2 compared to the surrounding values indicates that open leads could be associated with the BrO enhancement. Small-scale BrO explosion events around open leads or polynyas can be better investigated with the high-spatial-resolution TROPOMI data and will be the topic of a follow-up study.
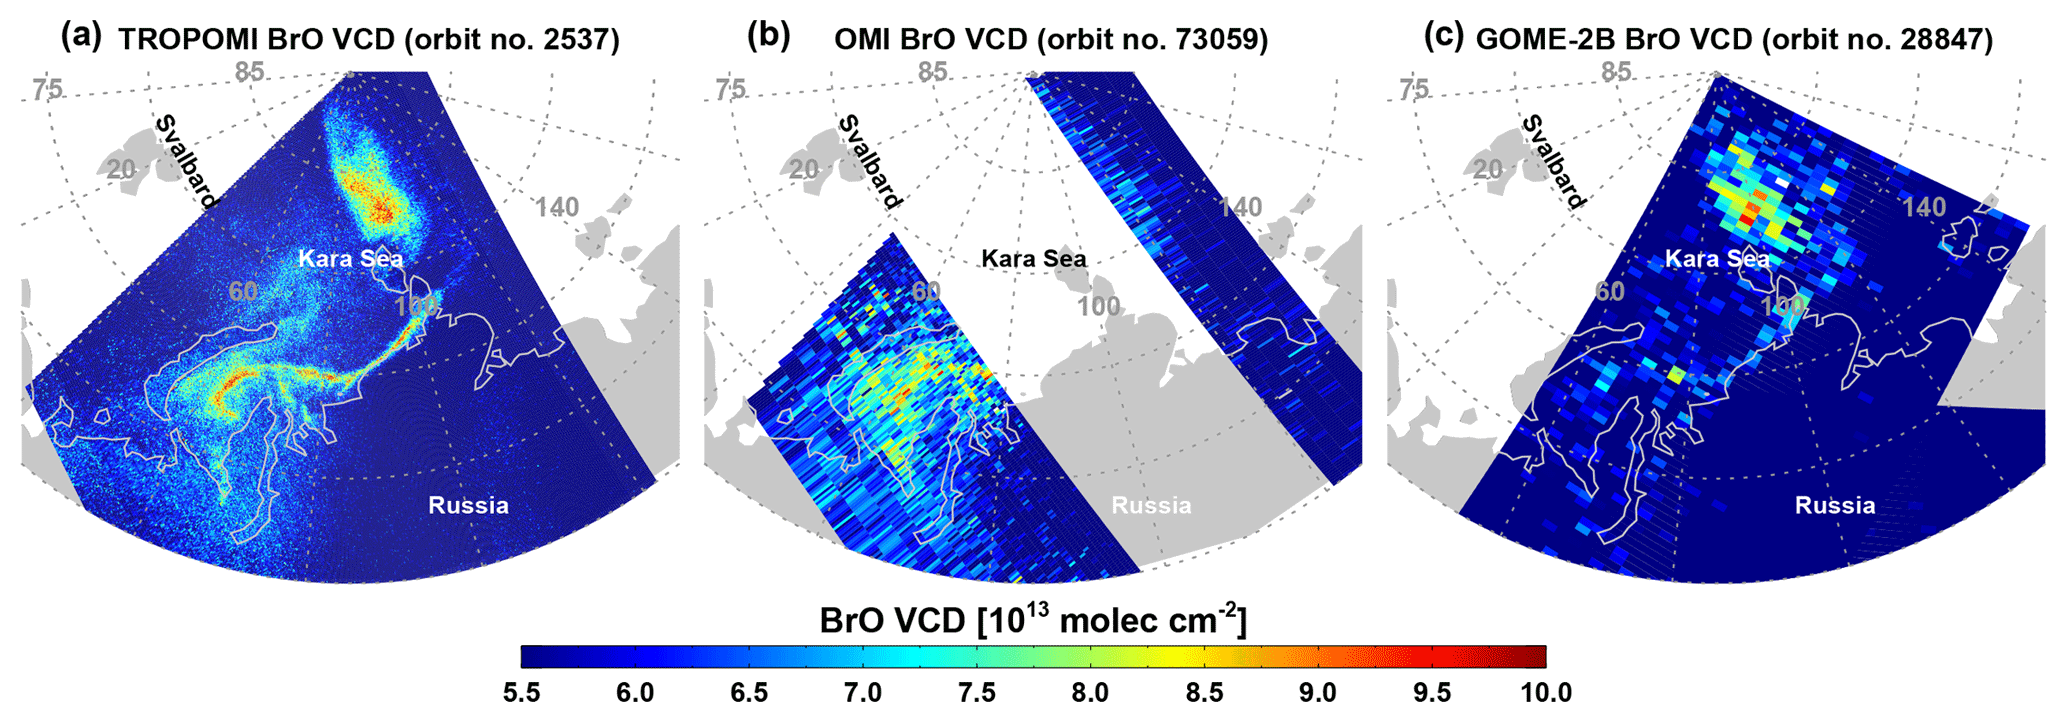
Figure 13BrO geometric vertical columns observed over the Arctic sea ice region on 10 April 2018 by (a) TROPOMI, (b) OMI, and (c) GOME-2B.
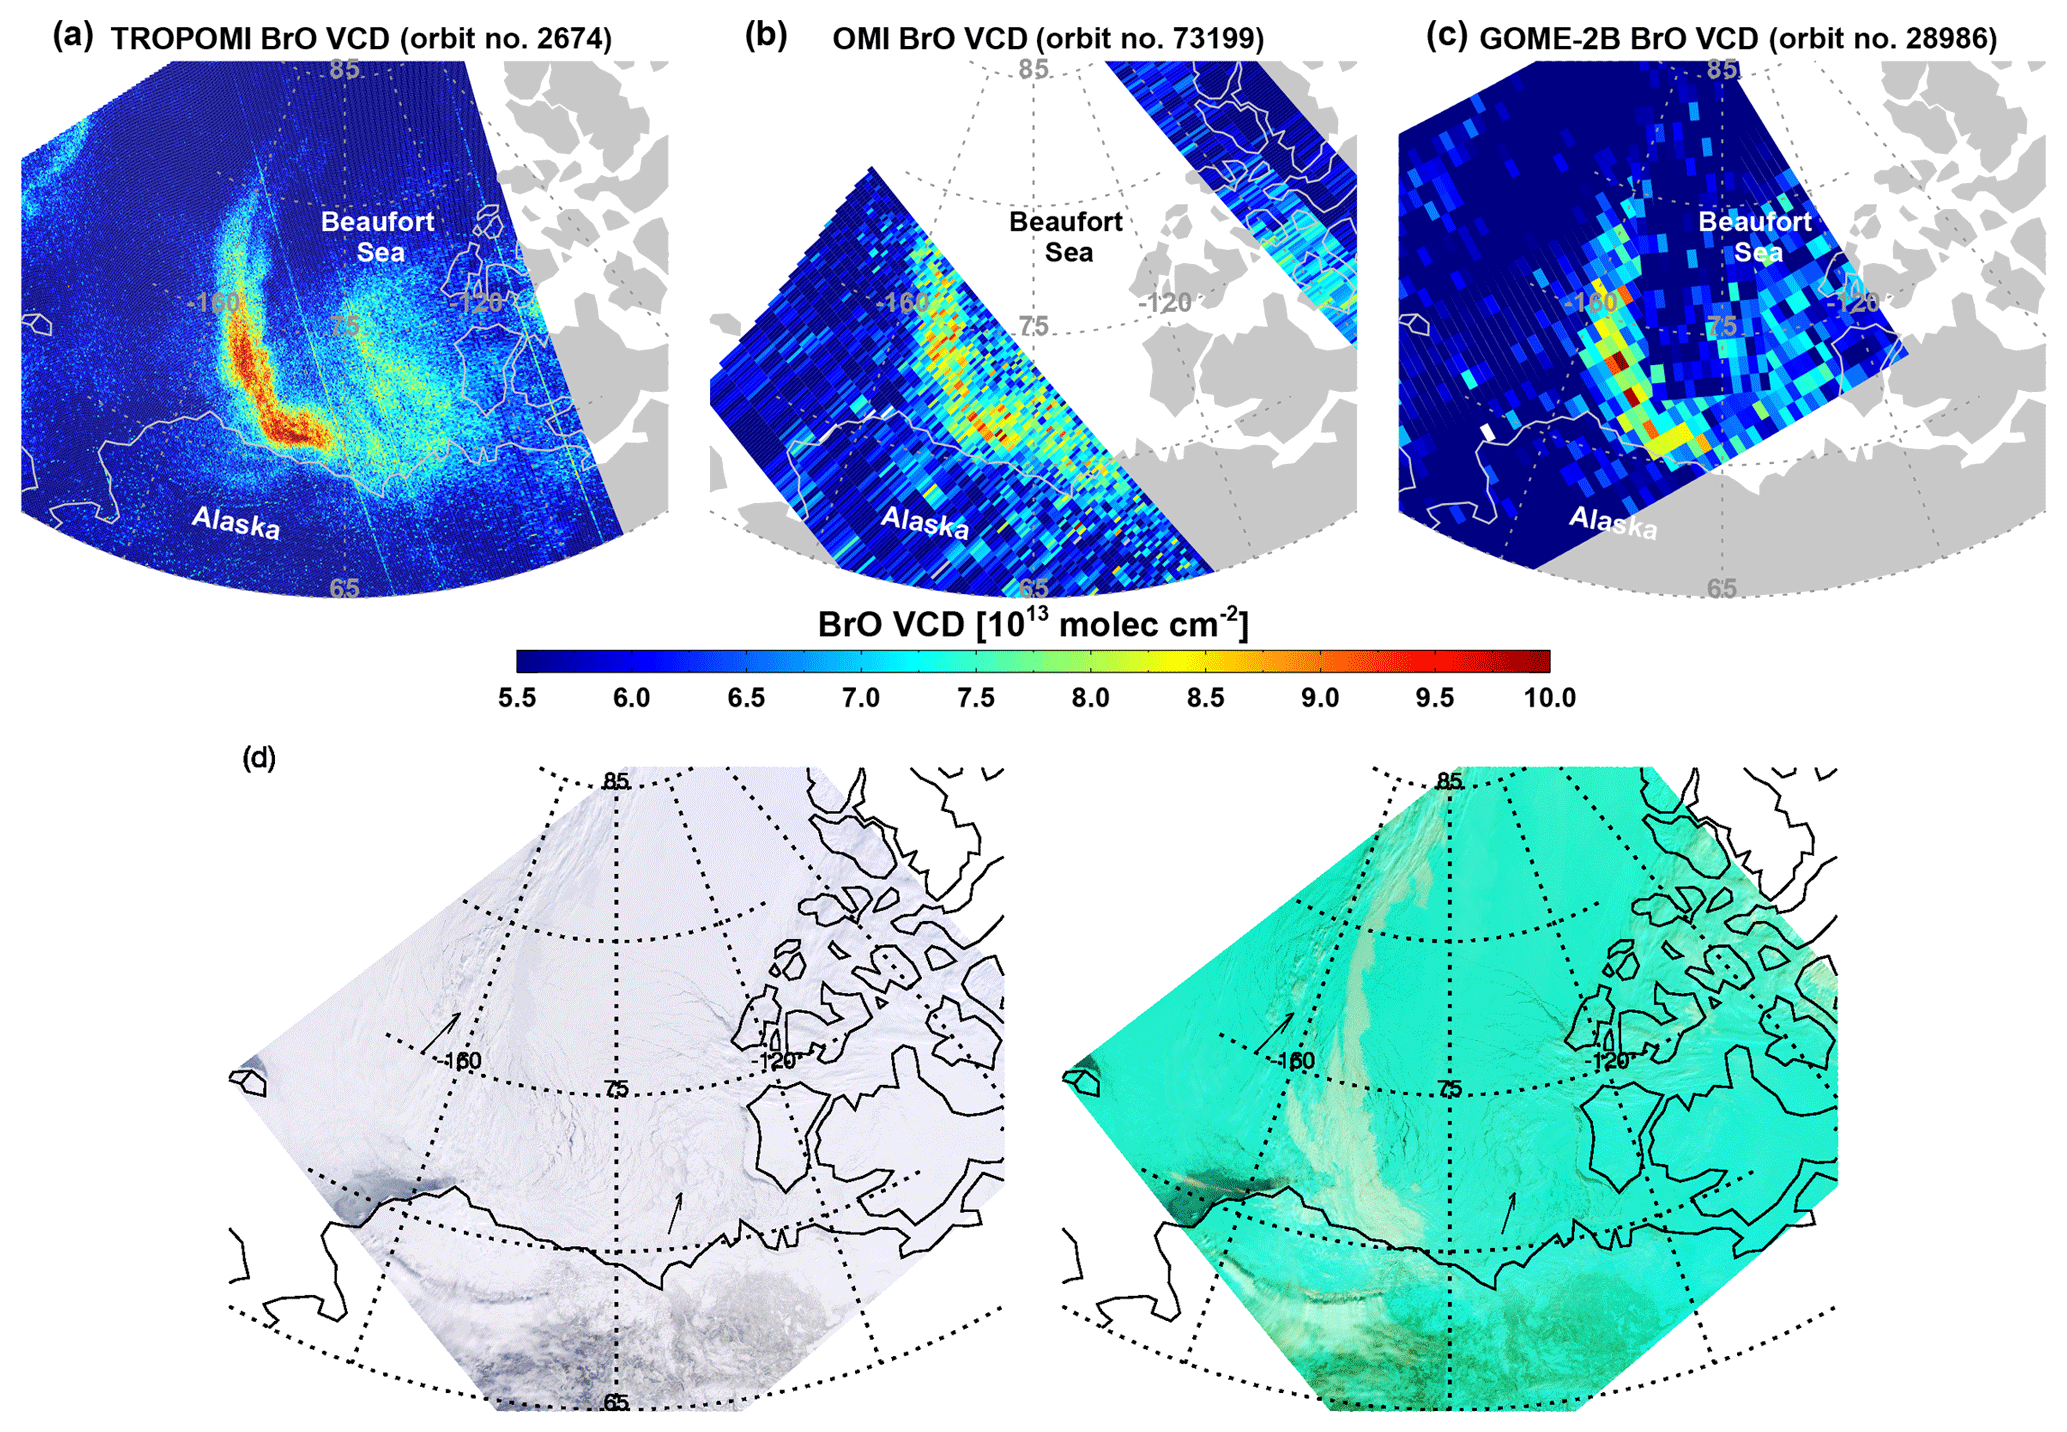
Figure 14BrO geometric vertical columns observed over the Arctic sea ice region on 19 April 2018 from (a) TROPOMI, (b) OMI, and (c) GOME-2B. (d) MODIS true color image (left) and image using combinations of 7-2-1 bands (right) from the Aqua satellite for the same scene on the same day. Leads are slightly darker in the MODIS image as indicated by the arrows.
4.3.2 BrO plumes over a salt lake/salt marsh
Salt lakes are one of the strongest and most localized natural sources of reactive bromine. Consequently, BrO amounts over multiple salt lakes and marshes have been investigated with ground-based DOAS instruments and satellites. High BrO concentrations with peak mixing ratios of 86 ppt at the Dead Sea were observed by long-path DOAS measurements in 1997 (Hebestreit et al., 1999), followed by studies of the diurnal cycle of BrO and the relationships between BrO and O3 and meteorological factors in the Dead Sea region (Matveev et al., 2001; Tas, 2005). BrO over salt lakes was also studied using satellite measurements. Chance (2006) showed BrO enhancement over the Great Salt Lake using OMI measurements and Hörmann et al. (2016) found a typical annual BrO formation cycle over the Rann of Kutch seasonal salt marsh using long-term GOME-2 and OMI data.
The release of reactive bromine and enhanced BrO plumes over the Rann of Kutch salt marsh are also readily detected by TROPOMI data. Daily mean BrO VCDs over the Rann of Kutch area for TROPOMI and OMI, and MODIS true color images for the time period from 11 April to 14 April 2018 are shown in Fig. 15. It should be noted that the AMFs used in this work do not consider surface albedo and cloud effects, and therefore BrO VCDs may be overestimated over the bright salt marsh. BrO enhancements of up to 4.5×10¹³ molecules cm−2 over background values are detected as hot spots in both satellites. However, as can be seen in Fig. 15, TROPOMI data show BrO plumes and small-scale variabilities much more clearly with more spatial details than OMI data. In the case of OMI data, BrO plumes are detected by only a few pixels, whereas TROPOMI can detect the same plumes by hundreds of data points (∼150 pixels). This illustrates that TROPOMI data will facilitate in-depth studies of localized small-scale BrO events for multiple salt lakes and marshes.
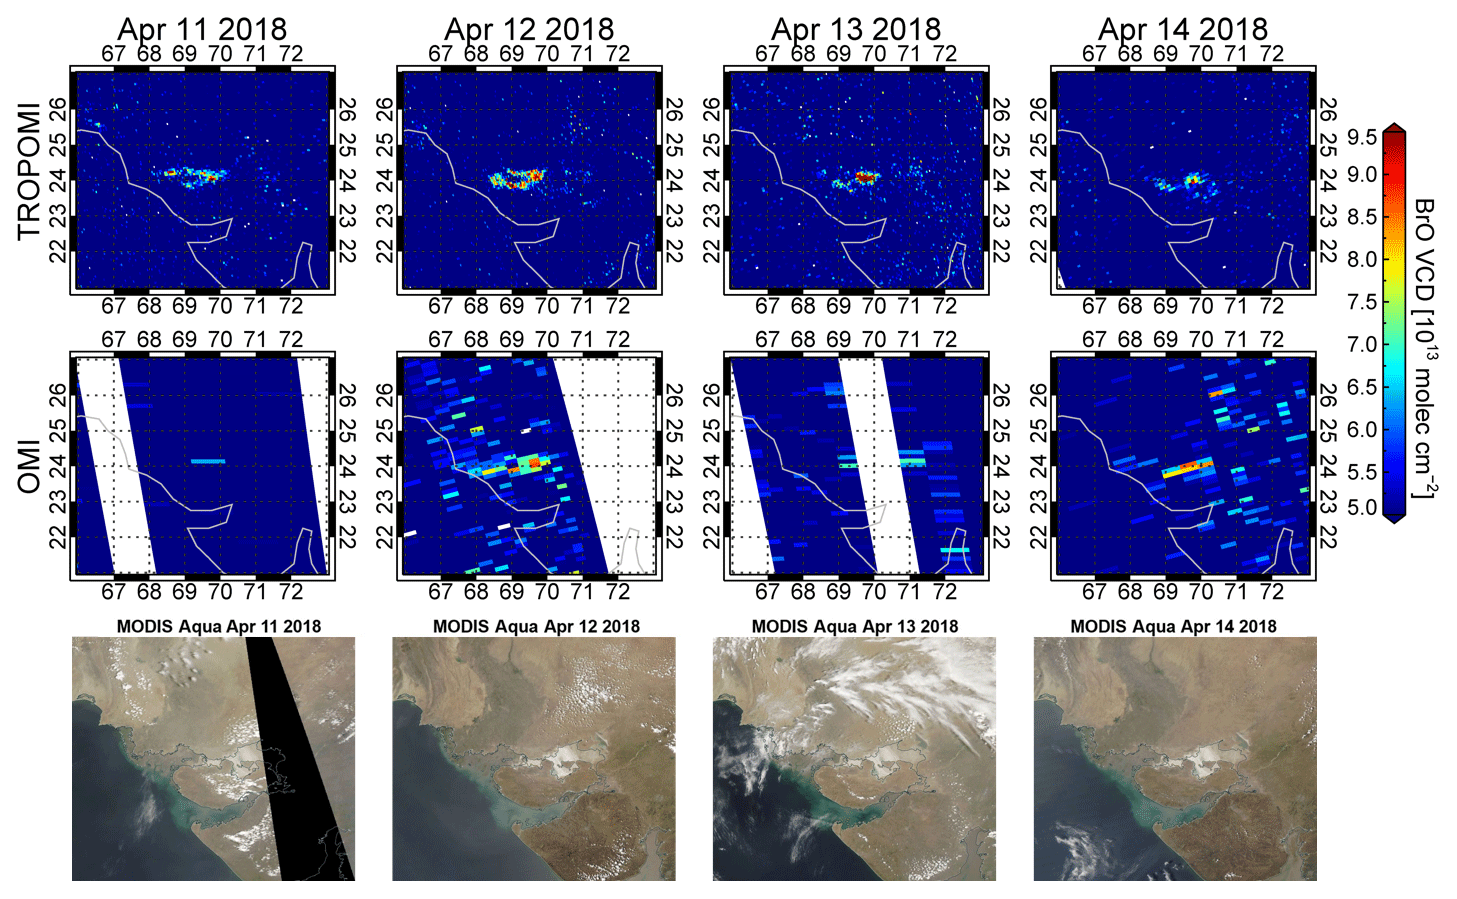
Figure 15Daily BrO geometric vertical columns (1013 molecules cm−2) over the Rann of Kutch salt marsh on 11, 12, 13, and 14 April 2018 from TROPOMI (top row) and OMI (middle row) measurements as well as MODIS Aqua true color images over the study region for the same days (bottom row).
4.3.3 BrO enhancements in volcanic plumes
Explosive volcanic eruptions lead to the formation of BrO in the troposphere and lower stratosphere. The detections of BrO in volcanic plumes has been reported by ground-based DOAS measurements for several volcanoes (Bobrowski et al., 2003; Oppenheimer et al., 2006; Boichu et al., 2011). In addition to ground-based measurements, BrO in a volcanic plume was first detected in GOME-2 satellite data after the eruption of the Kasatochi volcano by Theys et al. (2009). Following the first satellite volcanic BrO detection, Hörmann et al. (2013) investigated 64 volcanic plumes and BrO∕SO2 ratios using GOME-2. Schönhardt et al. (2017) found not only volcanic BrO but also IO emissions using SCIAMACHY and GOME-2 measurements.
Not surprisingly, volcanic plumes containing BrO are also detected in TROPOMI data. Figure 16 shows the plume over the Indonesian island of Bali after volcanic activity at Mount Agung on 29 November 2017. Enhanced BrO values of up to 8.5×10¹³ and dispersion of plumes by the wind towards the southwest were detected by both TROPOMI and OMI. These volcanic BrO plumes are associated with enhanced SO2 values as identified from the NASA operational OMI product (ColumnAmountSO2_TRM in OMSO2 version 3 product) with a positive correlation between the species. As shown in Fig. 16, monitoring of BrO emissions and their relationship to other gases from volcanic activities is possible with TROPOMI data at higher spatial resolution and improved sensitivity, which suggests that more detailed analysis of volcanic BrO will be possible in the future.
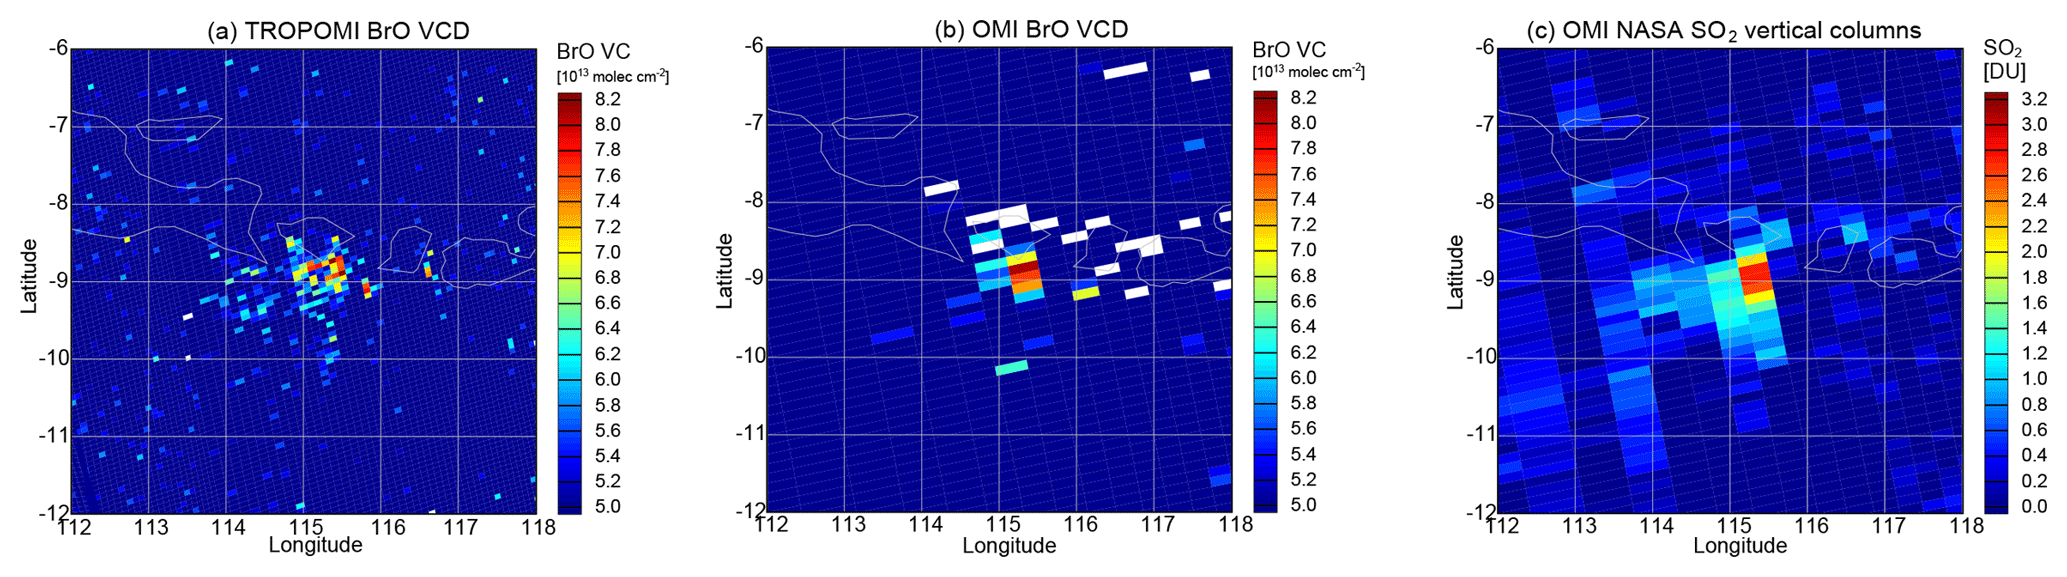
Figure 16Volcanic BrO vertical columns (1013 molecules cm−2) on 29 November 2017 after volcanic eruptions at Mount Agung on the Indonesian island of Bali observed by (a) TROPOMI and (b) OMI. (c) Volcanic SO2 vertical columns (DU) from the column amount SO2 TRM (mid-troposphere) of the NASA operational OMSO2 product (https://disc.gsfc.nasa.gov/datasets/OMSO2_V003/summary, last access: 23 May 2019).
Adapting and optimizing the DOAS retrieval developed for earlier satellite missions, a first BrO column retrieval for measurements of TROPOMI, the new spaceborne instrument launched on the European Sentinel 5 Precursor satellite in October 2017, was developed. One of the most important factors in the DOAS retrieval is the wavelength interval selected as the fitting window with the objective being to maximize the differential absorption structures of the specific gas of interest and minimize the influence of other interfering signals. However, finding the optimal retrieval wavelength interval is not straightforward as instrumental factors as well as viewing conditions and study area can impact the results. Similar to the approach by Vogel et al. (2013), color-coded maps of DOAS retrieval results obtained by systematically varying the retrieval wavelength interval were created for various observation scenarios on TROPOMI data to determine the optimal retrieval wavelength interval for BrO. Negative BrO SCDs, large deviations from the expected BrO SCDs, and high fitting errors occur at shorter wavelengths when strong absorption structures of O3 and SO2 are included. The sensitivity of BrO retrieval to HCHO was also found by showing anticorrelation between two gases. At wavelengths longer than 362 nm, poorer results were found in the cloudy scene and volcanic plume measurement scenario, presumably due to the wavelength dependency of the Ring effect and imperfect fitting of O4. Based on the information gathered from the sensitivity tests for different measurement scenarios, 334.6–358 nm was selected as the optimal wavelength range for TROPOMI BrO retrievals for most of the possible measurement situations. This fitting window yields reliable BrO retrieval results with small fitting errors, but future studies on quantitative assessments and cross correlations between BrO and all the interfering absorbers are encouraged to further improve retrieval results. As imaging instruments such as TROPOMI often show across-track offsets in the retrieved columns, the DOAS BrO retrieval has to include a destriping method. In this study, row-specific daily averaged earthshine radiances from a Pacific background area are used as reference spectrum in the DOAS fitting procedure and a post-processing offset correction is applied to convert the resulting differential slant columns to absolute slant columns. Conversion to vertical columns is achieved in this study by using a simple geometric air mass factor.
As a first consistency test, TROPOMI BrO columns were compared with OMI and GOME-2 data on both global and regional scales. TROPOMI BrO retrievals show good agreements with OMI and GOME-2B BrO columns with high correlation coefficients (slopes of the regression lines) of 0.84 (0.89) and 0.84 (0.72) for enhanced BrO plumes in the Arctic sea ice region. Global maps of monthly BrO columns also agree well between the three instruments. In addition to the good consistency of TROPOMI BrO retrievals with other satellite products, TROPOMI shows excellent performances with much smaller fitting rms values and lower random scatter of BrO columns than OMI and GOME-2B. More small-scale hot spots can be identified in greater detail by TROPOMI with its improved signal-to-noise ratio and the excellent spatial resolution. Thus, studies on small-scale BrO events in specific source regions where comparatively lower-spatial-resolution satellite sensors such as GOME, SCIAMACHY, GOME-2, and OMI provide only limited information and may even fail to detect the small-scale plume will be enabled by TROPOMI data.
In spite of the overall good performance of BrO retrievals on TROPOMI data, poor BrO spectral fits are sometimes found over inhomogeneous reflectance scenes such as fractional clouds and ice shelves due to inhomogeneous slit illumination. This inhomogeneous scene effect on the DOAS retrieval should be corrected to obtain more accurate retrieval results. In this demonstration study, a simplified air mass factor and no stratospheric correction were applied because the main purpose of this study is to find the optimal DOAS retrieval settings for BrO that reduce systematic biases by minimizing effects of interfering absorbers and to assess the consistency with previous satellite results. However, for future quantitative studies of tropospheric BrO explosion events, stratospheric correction and improved air mass factor calculation taking into account the observation conditions are essential. In particular, investigation and evaluation of high-resolution input data applicable to the unprecedented small footprint of TROPOMI should be performed, which will be a subject of further work. In addition to the satellite intercomparisons shown here, validation with ground-based measurements is needed for more detailed assessment of the quality of TROPOMI BrO columns. Judging from the examples evaluated in this study, BrO columns from TROPOMI will contribute relevant high-resolution information to many future studies exploring the halogen chemistry in the atmosphere.
The sensitivity test results and monthly mean BrO VCD retrieved from TROPOMI, OMI, and GOME-2B (April 2018) presented in this publication can be found at http://www.iup.uni-bremen.de/doas/data/bro/s5p/seo_2019/ (last access: 27 May 2019). The underlying data of the figures are available upon request (contact persons are Sora Seo and Andreas Richter).
To investigate the possibility of a DOAS fit improvement for the polar BrO measurement scenario by applying the Taylor series approach (Puķīte et al., 2010), we performed an additional sensitivity test. The test was conducted in the same way and with the same measurement scenario as described in Sect. 3.1.1, but two pseudo cross sections of O3 at 223 K ( and ) were added to the standard DOAS settings. The reason for choosing the lower-temperature O3 cross section is that this temperature is closer to the polar lower stratospheric temperature in spring. These two fitting parameters are terms derived by a Taylor series expansion to account for the wavelength dependency of the SCD, which results from changes in light path distribution with wavelength and absorption strength (Puķīte et al., 2010). Puķīte et al. (2010) demonstrated that the application of the Taylor series approach to strong absorber O3 leads to an improvement for the fit of the weaker absorber BrO in the UV range of limb measurements.
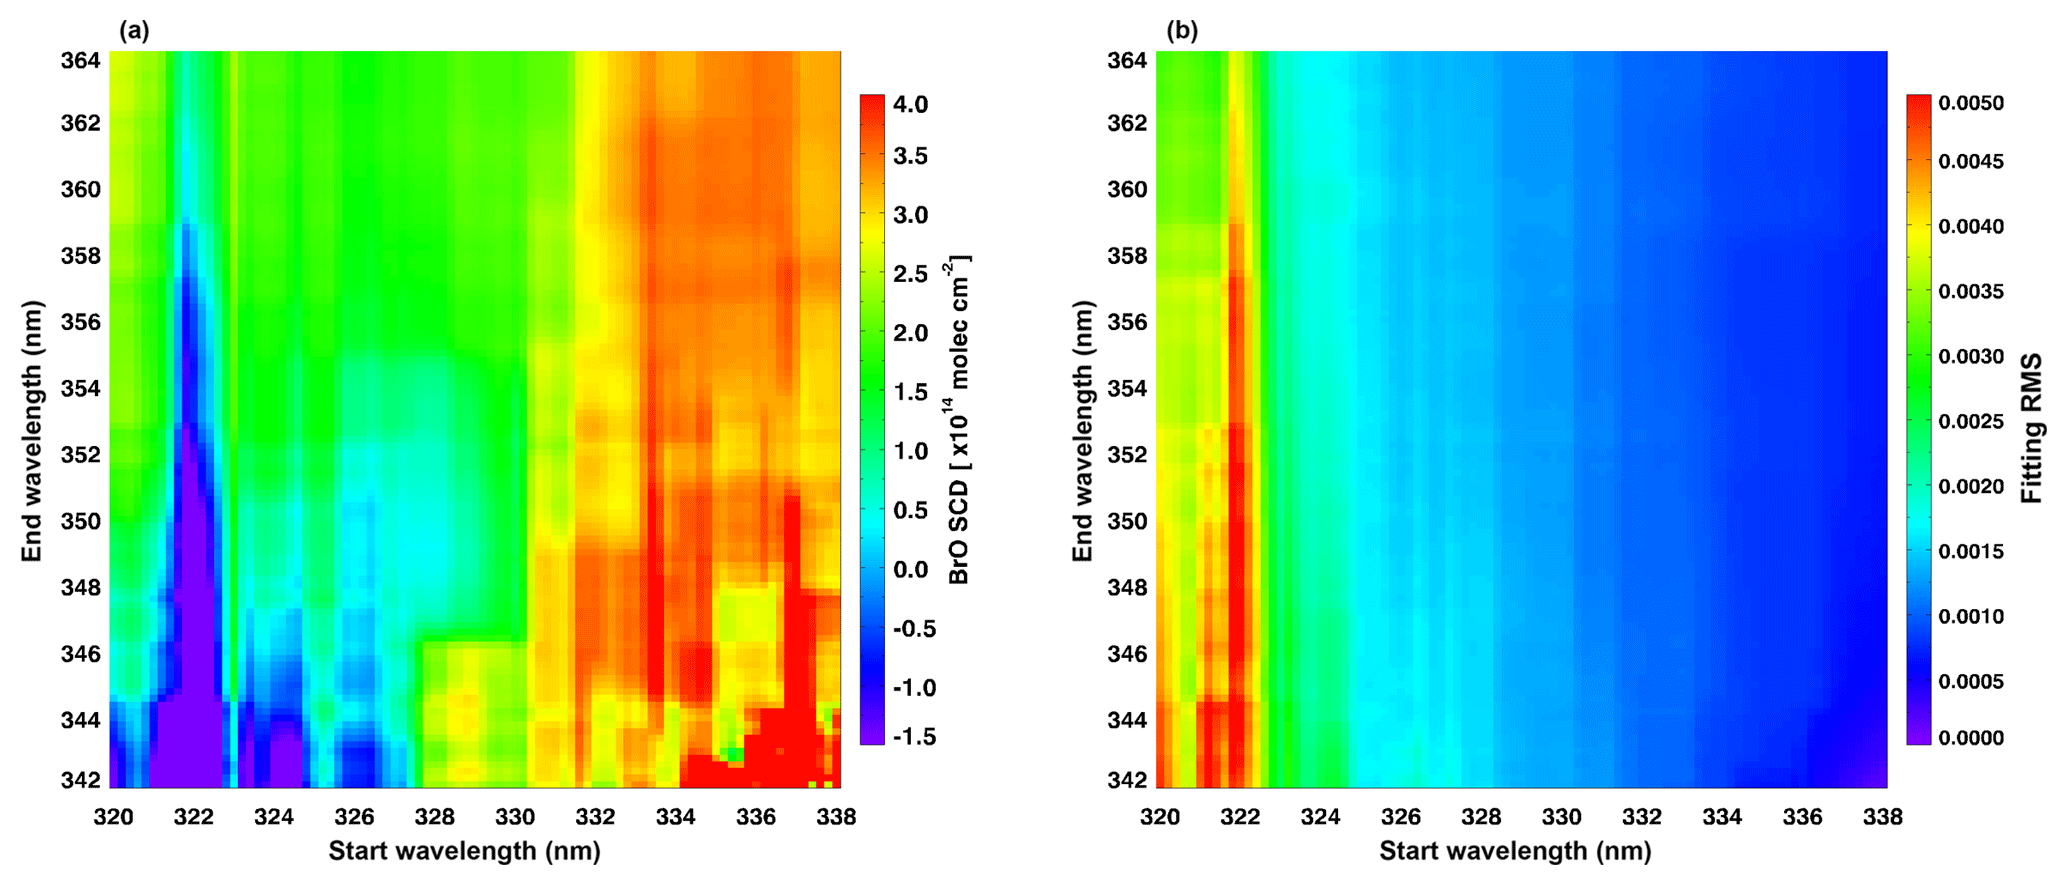
Figure A1Color-coded means of (a) BrO SCDs and (b) fitting rms values retrieved when including the Taylor series approach for O3 in the DOAS analysis.
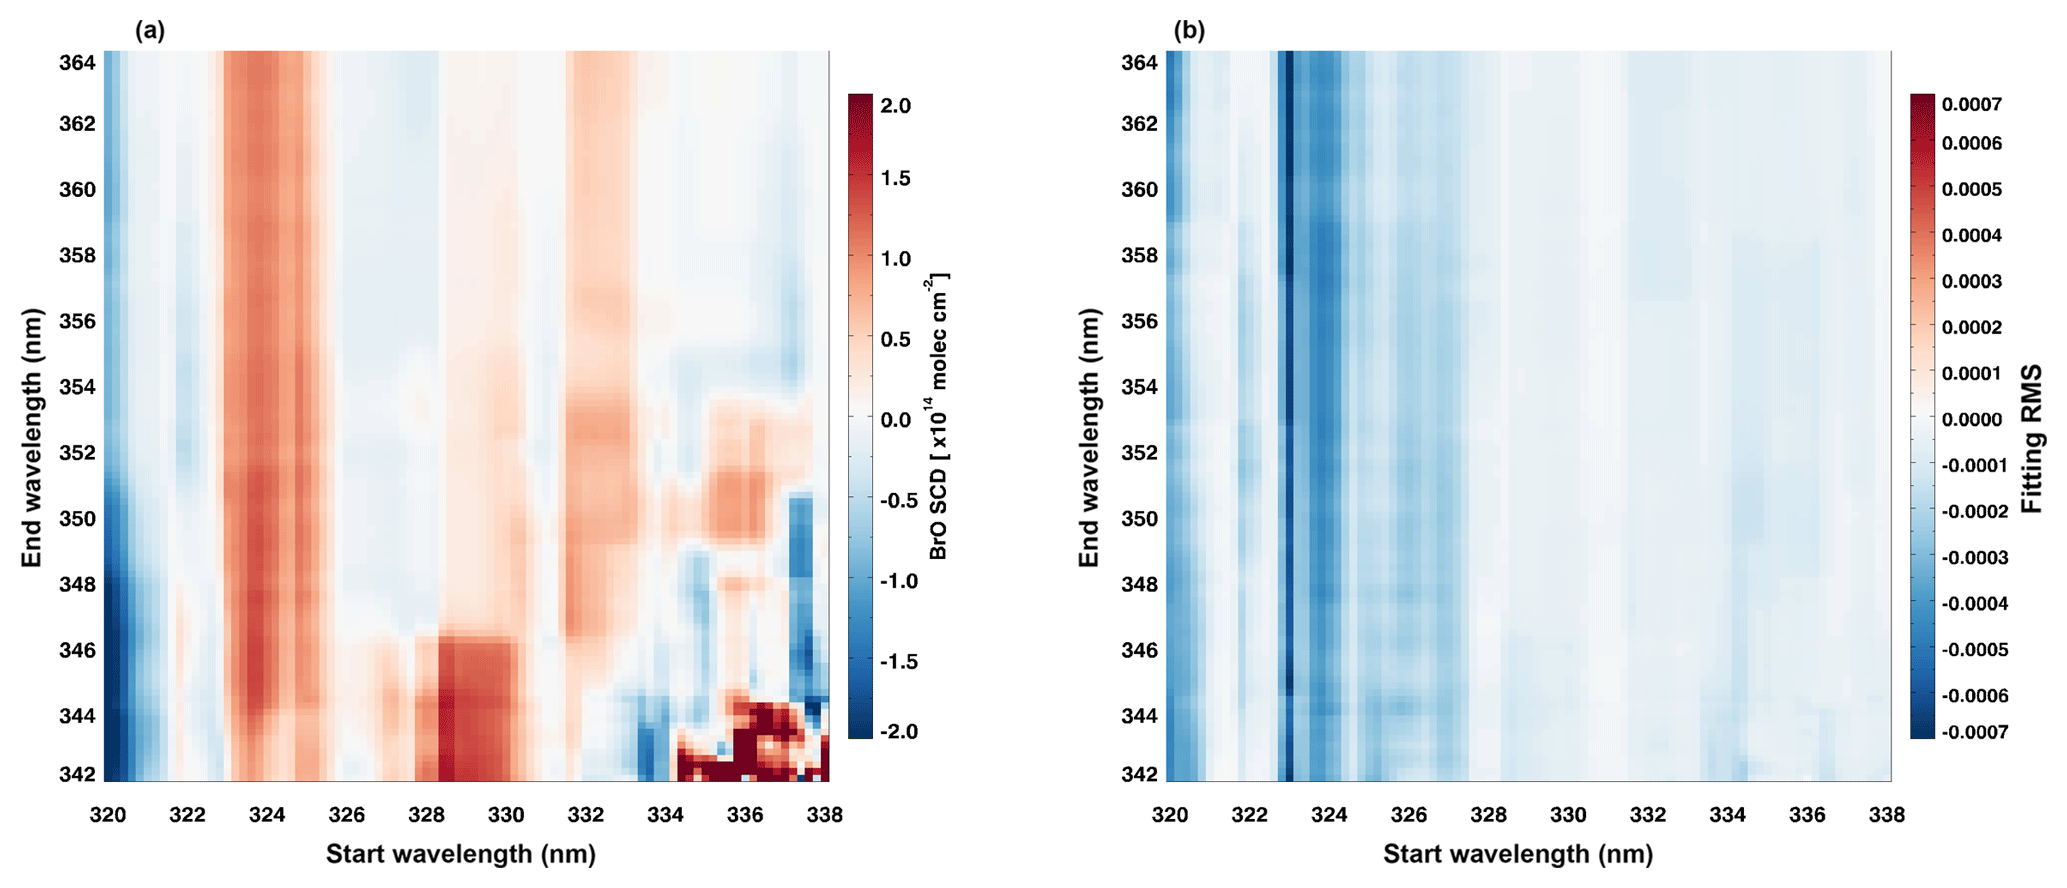
Figure A2Color-coded means of differences for (a) BrO SCDs and (b) fitting rms values between analyses including the Taylor series approach (see Fig. A1) and the standard DOAS (see Fig. 2 in Sect. 3.1.1).
Figure A1 shows BrO retrieval results obtained with the DOAS settings including the Taylor series approach for the TROPOMI polar BrO measurement scenario. Compared with the standard retrieval results (Fig. 2 in Sect. 3.1.1), BrO retrieval results applying the Taylor series approach show reduced fitting rms values across the whole retrieval wavelength range (see Fig. A2b). In particular, fitting results at wavelength ranges with a start limit between 323 and 327.6 nm where negative BrO SCDs and high fitting errors occurred due to strong O3 interference are significantly improved as BrO SCDs increased by molecules cm−2 and fitting errors decreased by ∼32 %. Also, the abrupt changes of BrO SCDs around 333 nm of start wavelength and wavelength range with start limits of 335–337.6 nm and end limits of 349–353.6 nm are moderated by use of the Taylor series expansion for O3. These sensitivity test results using TROPOMI nadir measurements clearly demonstrate that introducing the Taylor series approach for O3 results in an improvement of the DOAS fit. However, as is also clear from Fig. A1, not all of the problems at low wavelengths apparent in Fig. 2 are solved by including the Puķīte terms.
For the fitting window selected in this study (334.6–358 nm), the application of the Taylor series approach for O3 does not significantly affect BrO retrieval results compared with the standard DOAS retrieval. However, as can be seen from Fig. A2, effects of the Taylor series expansion for O3 on the BrO SCD retrieval vary depending on the retrieval wavelength interval. The strength of absorption and the slant path of scattered light in the atmosphere vary considerably with wavelength, and thus the degree of improvement by the Taylor series approach for O3 in the BrO retrieval is also different depending on the fitting wavelength range. Therefore, it is necessary to evaluate the improvement of the SCD retrieval by the Taylor series approach with respect to standard DOAS retrieval according to the fitting window selected. Moreover, we showed only sensitivity test results applying the Taylor series expansion of the lower temperature O3 cross section to TROPOMI polar BrO measurements in this section, but note that the effect of the Taylor series approach may be different for different trace gas cross sections, temperature, and measurement scenarios.
SS, AR, AMB, IB, and JPB were active in designing the study and analyzing results. SS performed the sensitivity tests and carried out data analysis. All authors discussed the results and commented on the paper.
The authors declare that they have no conflict of interest.
This article is part of the special issue “TROPOMI on Sentinel-5 Precursor: first year in operation (AMT/ACPT inter-journal SI)”. It is not associated with a conference.
Parts of this study were funded through the University of Bremen, the DLR project 50EE1618, and the SFB/TR 172 “ArctiC Amplification: Climate Relevant Atmospheric and SurfaCe Processes, and Feedback Mechanisms (AC)3” in sub-project C03 by the DFG. GOME-2 lv1 data were provided by EMETSAT, and OMI lv1 and lv2 data were provided by NASA. Copernicus Sentinel-5P lv1 data from 2018 were used in this study. Sentinel-5 Precursor is a European Space Agency (ESA) mission implemented on behalf of the European Commission (EC). The TROPOMI payload is a joint development by ESA and the Netherlands Space Office (NSO). The Sentinel-5 Precursor ground segment development has been funded by ESA and with national contributions from the Netherlands, Germany, Belgium, and UK.
The article processing charges for this open-access publication were covered by the University of Bremen.
This paper was edited by Diego Loyola and reviewed by two anonymous referees.
Aliwell, S. R., Van Roozendael, M., Johnston, P. V., Richter, A., Wagner, T., Arlander, D. W., Burrows, J. P., Fish, D. J., Jones, R. L., Tornkvist, K. K., Lambert, J. C., Pfeilsticker, K., and Pundt, I.: Analysis for BrO in zenith-sky spectra: An intercomparison exercise for analysis improvement, J. Geophys. Res.-Atmos., 107, 4199, https://doi.org/10.1029/2001jd000329, 2002.
Alvarado, L. M. A., Richter, A., Vrekoussis, M., Wittrock, F., Hilboll, A., Schreier, S. F., and Burrows, J. P.: An improved glyoxal retrieval from OMI measurements, Atmos. Meas. Tech., 7, 4133–4150, https://doi.org/10.5194/amt-7-4133-2014, 2014.
Begoin, M., Richter, A., Weber, M., Kaleschke, L., Tian-Kunze, X., Stohl, A., Theys, N., and Burrows, J. P.: Satellite observations of long range transport of a large BrO plume in the Arctic, Atmos. Chem. Phys., 10, 6515–6526, https://doi.org/10.5194/acp-10-6515-2010, 2010.
Blechschmidt, A.-M., Richter, A., Burrows, J. P., Kaleschke, L., Strong, K., Theys, N., Weber, M., Zhao, X., and Zien, A.: An exemplary case of a bromine explosion event linked to cyclone development in the Arctic, Atmos. Chem. Phys., 16, 1773–1788, https://doi.org/10.5194/acp-16-1773-2016, 2016.
Bobrowski, N., Honninger, G., Galle, B., and Platt, U.: Detection of bromine monoxide in a volcanic plume, Nature, 423, 273–276, https://doi.org/10.1038/nature01638, 2003.
Boersma, K. F., Eskes, H. J., Veefkind, J. P., Brinksma, E. J., van der A, R. J., Sneep, M., van den Oord, G. H. J., Levelt, P. F., Stammes, P., Gleason, J. F., and Bucsela, E. J.: Near-real time retrieval of tropospheric NO2 from OMI, Atmos. Chem. Phys., 7, 2103–2118, https://doi.org/10.5194/acp-7-2103-2007, 2007.
Bogumil, K., Orphal, J., Homann, T., Voigt, S., Spietz, P., Fleischmann, O. C., Vogel, A., Hartmann, M., Kromminga, H., Bovensmann, H., Frerick, J., and Burrows, J. P.: Measurements of molecular absorption spectra with the SCIAMACHY pre-flight model: instrument characterization and reference data for atmospheric remote-sensing in the 230–2380 nm region, J. Photochem. Photobio. A, 157, 167–184, https://doi.org/10.1016/s1010-6030(03)00062-5, 2003.
Boichu, M., Oppenheimer, C., Roberts, T. J., Tsanev, V., and Kyle, P. R.: On bromine, nitrogen oxides and ozone depletion in the tropospheric plume of Erebus volcano (Antarctica), Atmos. Environ., 45, 3856–3866, https://doi.org/10.1016/j.atmosenv.2011.03.027, 2011.
Burrows, J. P., Platt, U., and Borrell, P.: The remote sensing of tropospheric composition from space, Springer Science & Business Media, Heidelberg, Germany, 2011.
Chance, K.: Analysis of BrO measurements from the Global Ozone Monitoring Experiment, Geophys. Res. Lett., 25, 3335–3338, https://doi.org/10.1029/98gl52359, 1998.
Chance, K.: Spectroscopic measurements of tropospheric composition from satellite measurements in the ultraviolet and visible: Steps toward continuous pollution monitoring from space, in: Remote Sensing of the Atmosphere for Environmental Security, Springer, the Netherlands, 1–25, 2006.
Chance, K. and Kurucz, R.: An improved high-resolution solar reference spectrum for earth's atmosphere measurements in the ultraviolet, visible, and near infrared, J. Quant. Spectrosc. Ra., 111, 1289–1295, 2010.
Choi, S., Wang, Y., Salawitch, R. J., Canty, T., Joiner, J., Zeng, T., Kurosu, T. P., Chance, K., Richter, A., Huey, L. G., Liao, J., Neuman, J. A., Nowak, J. B., Dibb, J. E., Weinheimer, A. J., Diskin, G., Ryerson, T. B., da Silva, A., Curry, J., Kinnison, D., Tilmes, S., and Levelt, P. F.: Analysis of satellite-derived Arctic tropospheric BrO columns in conjunction with aircraft measurements during ARCTAS and ARCPAC, Atmos. Chem. Phys., 12, 1255–1285, https://doi.org/10.5194/acp-12-1255-2012, 2012.
Fleischmann, O. C., Hartmann, M., Burrows, J. P., and Orphal, J.: New ultraviolet absorption cross-sections of BrO at atmospheric temperatures measured by time-windowing Fourier transform spectroscopy, J. Photochem. Photobio. A, 168, 117–132, 2004.
Frieß, U., Sihler, H., Sander, R., Pöhler, D., Yilmaz, S., and Platt, U.: The vertical distribution of BrO and aerosols in the Arctic: Measurements by active and passive differential optical absorption spectroscopy, J. Geophys. Res., 116, D00R04, https://doi.org/10.1029/2011JD015938, 2011.
Hebestreit, K., Stutz, J., Rosen, D., Matveiv, V., Peleg, M., Luria, M., and Platt, U.: DOAS measurements of tropospheric bromine oxide in mid-latitudes, Science, 283, 55–57, https://doi.org/10.1126/science.283.5398.55, 1999.
Hendrick, F., Van Roozendael, M., Chipperfield, M. P., Dorf, M., Goutail, F., Yang, X., Fayt, C., Hermans, C., Pfeilsticker, K., Pommereau, J.-P., Pyle, J. A., Theys, N., and De Mazière, M.: Retrieval of stratospheric and tropospheric BrO profiles and columns using ground-based zenith-sky DOAS observations at Harestua, 60∘ N, Atmos. Chem. Phys., 7, 4869–4885, https://doi.org/10.5194/acp-7-4869-2007, 2007.
Hönninger, G., Leser, H., Sebastian, O., and Platt, U.: Ground-based measurements of halogen oxides at the Hudson Bay by active longpath DOAS and passive MAX-DOAS, Geophys. Res. Lett., 31, L04111, https://doi.org/10.1029/2003GL018982, 2004.
Hörmann, C., Sihler, H., Bobrowski, N., Beirle, S., Penning de Vries, M., Platt, U., and Wagner, T.: Systematic investigation of bromine monoxide in volcanic plumes from space by using the GOME-2 instrument, Atmos. Chem. Phys., 13, 4749–4781, https://doi.org/10.5194/acp-13-4749-2013, 2013.
Hörmann, C., Sihler, H., Beirle, S., Penning de Vries, M., Platt, U., and Wagner, T.: Seasonal variation of tropospheric bromine monoxide over the Rann of Kutch salt marsh seen from space, Atmos. Chem. Phys., 16, 13015–13034, https://doi.org/10.5194/acp-16-13015-2016, 2016.
Kromminga, H., Orphal, J., Spietz, P., Voigt, S., and Burrows, J. P.: New measurements of OClO absorption cross-sections in the 325–435 nm region and their temperature dependence between 213 and 293 K, J. Photochem. Photobio. A, 157, 149–160, https://doi.org/10.1016/s1010-6030(03)00071-6, 2003.
Kuhl, S., Puķīte, J., Deutschmann, T., Platt, U., and Wagner, T.: SCIAMACHY limb measurements of NO2, BrO and OClO. Retrieval of vertical profiles: Algorithm, first results, sensitivity and comparison studies, Adv. Space Res., 42, 1747–1764, https://doi.org/10.1016/j.asr.2007.10.022, 2008.
Leser, H., Honninger, G., and Platt, U.: MAX-DOAS measurements of BrO and NO2 in the marine boundary layer, Geophys. Res. Lett., 30, 1537, https://doi.org/10.1029/2002gl015811, 2003.
Liao, J., Sihler, H., Huey, L., Neuman, J., Tanner, D., Friess, U., Platt, U., Flocke, F. M., Orlando, J. J., Shepson, P. B., Beine, H. J., Weinheimer, A. J., Sjostedt, S. J., Nowak, J. B., Knapp, D. J., Staebler, R. M., Zheng, W., Sander, R., Hall, S. R., and Ullmann, K.: A comparison of Arctic BrO measurements by chemical ionization mass spectrometry and long path-differential optical absorption spectroscopy, J. Geophys. Res., 116, D00R02, https://doi.org/10.1029/2010JD014788, 2011.
Matveev, V., Peleg, M., Rosen, D., Tov-Alper, D. S., Hebestreit, K., Stutz, J., Platt, U., Blake, D., and Luria, M.: Bromine oxide – ozone interaction over the Dead Sea, J. Geophys. Res.-Atmos., 106, 10375–10387, https://doi.org/10.1029/2000jd900611, 2001.
McConnell, J. C., Henderson, G. S., Barrie, L., Bottenheim, J., Niki, H., Langford, C. H., and Templeton, E. M. J.: Photochemical bromine production implicated in Arctic boundary layer ozone depletion, Nature, 355, 150–152, https://doi.org/10.1038/355150a0, 1992.
McMullan, K. and van der Meulen, W.: SENTINEL-5 PRECURSOR SYSTEM, ESA Living Planet Symposium, 9–13 September 2013, Edinburgh, UK, 140, 2013.
Meller, R. and Moortgat, G. K.: Temperature dependence of the absorption cross sections of formaldehyde between 223 and 323 K in the wavelength range 225–375 nm, J. Geophys. Res.-Atmos., 105, 7089–7101, https://doi.org/10.1029/1999jd901074, 2000.
Monks, P. S.: A review of the observations and origins of the spring ozone maximum, Atmos. Environ., 34, 3545–3561, https://doi.org/10.1016/s1352-2310(00)00129-1, 2000.
Oppenheimer, C., Tsanev, V. I., Braban, C. F., Cox, R. A., Adams, J. W., Aiuppa, A., Bobrowski, N., Delmelle, P., Barclay, J., and McGonigle, A. J. S.: BrO formation in volcanic plumes, Geochim. Cosmochim. Ac., 70, 2935–2941, https://doi.org/10.1016/j.gca.2006.04.001, 2006.
Platt, U. and Stutz, J.: Differential absorption spectroscopy, in: Differential Optical Absorption Spectroscopy, Springer, Heidelberg, Germany, 135–174, 2008.
Puķīte, J., Kühl, S., Deutschmann, T., Platt, U., and Wagner, T.: Extending differential optical absorption spectroscopy for limb measurements in the UV, Atmos. Meas. Tech., 3, 631–653, https://doi.org/10.5194/amt-3-631-2010, 2010.
Richter, A., Wittrock, F., Eisinger, M., and Burrows, J. P.: GOME observations of tropospheric BrO in northern hemispheric spring and summer 1997, Geophys. Res. Lett., 25, 2683–2686, https://doi.org/10.1029/98gl52016, 1998.
Richter, A., Wittrock, F., Ladstatter-Weissenmayer, A., and Burrows, J. P.: GOME measurements of stratospheric and tropospheric BrO, in: Remote Sensing of Trace Constituents in the Lower Stratosphere, Troposphere and the Earth's Surface: Global Observations, Air Pollution and the Atmospheric Correction, edited by: Burrows, J. P. and Takeucki, N., Adv. Space Res., 11, 1667–1672, 2002.
Richter, A., Begoin, M., Hilboll, A., and Burrows, J. P.: An improved NO2 retrieval for the GOME-2 satellite instrument, Atmos. Meas. Tech., 4, 1147–1159, https://doi.org/10.5194/amt-4-1147-2011, 2011.
Rozanov, A., Bovensmann, H., Bracher, A., Hrechanyy, S., Rozanov, V., Sinnhuber, M., Stroh, F., and Burrows, J. P.: NO2 and BrO vertical profile retrieval from SCIAMACHY limb measurements: Sensitivity studies, in: Atmospheric Remote Sensing: Earth's Surface, Troposphere, Stratosphere and Mesosphere – I, edited by: Burrows, J. P. and Eichmann, K. U., Adv. Space Res., 5, 846–854, 2005.
Saiz-Lopez, A., Plane, J. M. C., and Shillito, J. A.: Bromine oxide in the mid-latitude marine boundary layer, Geophys. Res. Lett., 31, L03111, https://doi.org/10.1029/2003gl018956, 2004.
Salawitch, R. J., Canty, T., Kurosu, T., Chance, K., Liang, Q., da Silva, A., Pawson, S., Nielsen, J. E., Rodriguez, J. M., Bhartia, P. K., Liu, X., Huey, L. G., Liao, J., Stickel, R. E., Tanner, D. J., Dibb, J. E., Simpson, W. R., Donohoue, D., Weinheimer, A., Flocke, F., Knapp, D., Montzka, D., Neuman, J. A., Nowak, J. B., Ryerson, T. B., Oltmans, S., Blake, D. R., Atlas, E. L., Kinnison, D. E., Tilmes, S., Pan, L. L., Hendrick, F., Van Roozendael, M., Kreher, K., Johnston, P. V., Gao, R. S., Johnson, B., Bui, T. P., Chen, G., Pierce, R. B., Crawford, J. H., and Jacob, D. J.: A new interpretation of total column BrO during Arctic spring, Geophys. Res. Lett., 37, L21805, https://doi.org/10.1029/2010gl043798, 2010.
Sander, R., Keene, W. C., Pszenny, A. A. P., Arimoto, R., Ayers, G. P., Baboukas, E., Cainey, J. M., Crutzen, P. J., Duce, R. A., Hönninger, G., Huebert, B. J., Maenhaut, W., Mihalopoulos, N., Turekian, V. C., and Van Dingenen, R.: Inorganic bromine in the marine boundary layer: a critical review, Atmos. Chem. Phys., 3, 1301–1336, https://doi.org/10.5194/acp-3-1301-2003, 2003.
Schönhardt, A., Richter, A., Theys, N., and Burrows, J. P.: Space-based observation of volcanic iodine monoxide, Atmos. Chem. Phys., 17, 4857–4870, https://doi.org/10.5194/acp-17-4857-2017, 2017.
Serdyuchenko, A., Gorshelev, V., Weber, M., Chehade, W., and Burrows, J. P.: High spectral resolution ozone absorption cross-sections – Part 2: Temperature dependence, Atmos. Meas. Tech., 7, 625–636, https://doi.org/10.5194/amt-7-625-2014, 2014.
Sihler, H., Platt, U., Beirle, S., Marbach, T., Kühl, S., Dörner, S., Verschaeve, J., Frieß, U., Pöhler, D., Vogel, L., Sander, R., and Wagner, T.: Tropospheric BrO column densities in the Arctic derived from satellite: retrieval and comparison to ground-based measurements, Atmos. Meas. Tech., 5, 2779–2807, https://doi.org/10.5194/amt-5-2779-2012, 2012.
Simpson, W. R., von Glasow, R., Riedel, K., Anderson, P., Ariya, P., Bottenheim, J., Burrows, J., Carpenter, L. J., Frieß, U., Goodsite, M. E., Heard, D., Hutterli, M., Jacobi, H.-W., Kaleschke, L., Neff, B., Plane, J., Platt, U., Richter, A., Roscoe, H., Sander, R., Shepson, P., Sodeau, J., Steffen, A., Wagner, T., and Wolff, E.: Halogens and their role in polar boundary-layer ozone depletion, Atmos. Chem. Phys., 7, 4375–4418, https://doi.org/10.5194/acp-7-4375-2007, 2007.
Stutz, J., Thomas, J. L., Hurlock, S. C., Schneider, M., von Glasow, R., Piot, M., Gorham, K., Burkhart, J. F., Ziemba, L., Dibb, J. E., and Lefer, B. L.: Longpath DOAS observations of surface BrO at Summit, Greenland, Atmos. Chem. Phys., 11, 9899–9910, https://doi.org/10.5194/acp-11-9899-2011, 2011.
Suleiman, R. M., Chance, K., Liu, X., González Abad, G., Kurosu, T. P., Hendrick, F., and Theys, N.: OMI total bromine monoxide (OMBRO) data product: algorithm, retrieval and measurement comparisons, Atmos. Meas. Tech., 12, 2067–2084, https://doi.org/10.5194/amt-12-2067-2019, 2019.
Tas, E., Peleg, M., Matveev, V., Zingler, J., and Luria, M.: Frequency and extent of bromine oxide formation over the Dead Sea, J. Geophys. Res., 110, D11304, https://doi.org/10.1029/2004JD005665, 2005.
Thalman, R. and Volkamer, R.: Temperature dependent absorption cross-sections of O-2-O-2 collision pairs between 340 and 630 nm and at atmospherically relevant pressure, Phys. Chem. Chem. Phys., 15, 15371–15381, https://doi.org/10.1039/c3cp50968k, 2013.
Theys, N., Van Roozendael, M., Dils, B., Hendrick, F., Hao, N., and De Mazière, M.: First satellite detection of volcanic bromine monoxide emission after the Kasatochi eruption, Geophys. Res. Lett., 36.3, L03809, https://doi.org/10.1029/2008gl036552, 2009.
Theys, N., Van Roozendael, M., Hendrick, F., Yang, X., De Smedt, I., Richter, A., Begoin, M., Errera, Q., Johnston, P. V., Kreher, K., and De Mazière, M.: Global observations of tropospheric BrO columns using GOME-2 satellite data, Atmos. Chem. Phys., 11, 1791–1811, https://doi.org/10.5194/acp-11-1791-2011, 2011.
Torres, O., Bhartia, P. K., Jethva, H., and Ahn, C.: Impact of the ozone monitoring instrument row anomaly on the long-term record of aerosol products, Atmos. Meas. Tech., 11, 2701–2715, https://doi.org/10.5194/amt-11-2701-2018, 2018.
Vandaele, A. C., Hermans, C., Simon, P. C., Carleer, M., Colin, R., Fally, S., Merienne, M. F., Jenouvrier, A., and Coquart, B.: Measurements of the NO2 absorption cross-section from 42 000 cm−1 to 10 000 cm−1 (238–1000 nm) at 220 K and 294 K, J. Quant. Spectrosc. Ra., 59, 171–184, https://doi.org/10.1016/s0022-4073(97)00168-4, 1998.
Veefkind, J. P., Aben, I., McMullan, K., Förster, H., de Vries, J., Otter, G., Claas, J., Eskes, H. J., de Haan, J. F., Kleipool, Q., van Weele, M., Hasekamp, O., Hoogeveen, R., Landgraf, J., Snel, R., Tol, P., Ingmann, P., Voors, R., Kruizinga, B., Vink, R., Visser, H., and Levelt, P. F.: TROPOMI on the ESA Sentinel-5 Precursor: A GMES mission for global observations of the atmospheric composition for climate, air quality and ozone layer applications, Remote Sens. Environ., 120, 70–83, https://doi.org/10.1016/j.rse.2011.09.027, 2012.
Vogel, L., Sihler, H., Lampel, J., Wagner, T., and Platt, U.: Retrieval interval mapping: a tool to visualize the impact of the spectral retrieval range on differential optical absorption spectroscopy evaluations, Atmos. Meas. Tech., 6, 275–299, https://doi.org/10.5194/amt-6-275-2013, 2013.
von Glasow, R., von Kuhlmann, R., Lawrence, M. G., Platt, U., and Crutzen, P. J.: Impact of reactive bromine chemistry in the troposphere, Atmos. Chem. Phys., 4, 2481–2497, https://doi.org/10.5194/acp-4-2481-2004, 2004.
Vountas, M., Rozanov, V. V., and Burrows, J. P.: Ring effect: Impact of rotational Raman scattering on radiative transfer in earth's atmosphere, J. Quant. Spectrosc. Ra., 60, 943–961, https://doi.org/10.1016/s0022-4073(97)00186-6, 1998.
Wagner, T. and Platt, U.: Satellite mapping of enhanced BrO concentrations in the troposphere, Nature, 395, 486–490, https://doi.org/10.1038/26723, 1998.
Wennberg, P. O., Cohen, R. C., Stimpfle, R. M., Koplow, J. P., Anderson, J. G., Salawitch, R. J., Fahey, D. W., Woodbridge, E. L., Keim, E. R., Gao, R. S., Webster, C. R., May, R. D., Toohey, D. W., Avallone, L. M., Proffitt, M. H., Loewenstein, M., Podolske, J. R., Chan, K. R., and Wofsy, S. C.: Removal of stratospheric O3 by radicals - in-situ measurements of OH, HO2, NO, NO2, ClO, and BrO, Science, 266, 398–404, https://doi.org/10.1126/science.266.5184.398, 1994.
Wilmouth, D. M., Hanisco, T. F., Donahue, N. M., and Anderson, J. G.: Fourier Transform Ultraviolet Spectroscopy of the Transition of BrO, J. Phys. Chem. A, 103, 8935–8945, https://doi.org/10.1021/jp991651o, 1999.
Zhao, X., Strong, K., Adams, C., Schofield, R., Yang, X., Richter, A., Friess, U., Blechschmidt, A. M., and Koo, J. H.: A case study of a transported bromine explosion event in the Canadian high arctic, J. Geophys. Res.-Atmos., 121, 457–477, https://doi.org/10.1002/2015jd023711, 2016.
- Abstract
- Introduction
- S-5P TROPOMI instrument
- BrO retrieval
- Results
- Conclusions
- Data availability
- Appendix A: Improvement of the BrO retrieval with the Puķīte Taylor series approach
- Author contributions
- Competing interests
- Special issue statement
- Acknowledgements
- Financial support
- Review statement
- References