the Creative Commons Attribution 4.0 License.
the Creative Commons Attribution 4.0 License.
 | 12 Jul 2019
Method to retrieve cloud condensation nuclei number concentrations using lidar measurements
Wangshu Tan
Gang Zhao
Yingli Yu
Jian Li
Ling Kang
Chunsheng Zhao
Determination of cloud condensation nuclei (CCN) number concentrations at cloud base is important to constrain aerosol–cloud interactions. A new method to retrieve CCN number concentrations using backscatter and extinction profiles from multiwavelength Raman lidars is proposed. The method implements hygroscopic enhancements of backscatter and extinction with relative humidity to derive dry backscatter and extinction and humidogram parameters. Humidogram parameters, Ångström exponents, and lidar extinction-to-backscatter ratios are then linked to the ratio of CCN number concentration to dry backscatter and extinction coefficient (ARξ). This linkage is established based on the datasets simulated by Mie theory and κ-Köhler theory with in-situ-measured particle size distributions and chemical compositions. CCN number concentration can thus be calculated with ARξ and dry backscatter and extinction. An independent theoretical simulated dataset is used to validate this new method and results show that the retrieved CCN number concentrations at supersaturations of 0.07 %, 0.10 %, and 0.20 % are in good agreement with theoretical calculated values. Sensitivity tests indicate that retrieval error in CCN arises mostly from uncertainties in extinction coefficients and RH profiles. The proposed method improves CCN retrieval from lidar measurements and has great potential in deriving scarce long-term CCN data at cloud base, which benefits aerosol–cloud interaction studies.
- Article
(2158 KB) - Full-text XML
-
Supplement
(4354 KB) - BibTeX
- EndNote


Anthropogenic activities have caused an increase in atmospheric aerosols, and some of the aerosol particles affect the climate by serving as cloud condensation nuclei (CCN). CCN in clouds can modify cloud-forming processes and cloud microphysical properties (Rosenfeld et al., 2014). Although numerous impacts of aerosol–cloud interactions on radiative forcing (McCoy et al., 2017; Zhou et al., 2017), precipitation (Xu et al., 2017; Fan et al., 2018), cloud electrification (Wang et al., 2018), and severe weather or hazards (Fu et al., 2017) have been discovered, constraining the relationships between aerosols and clouds is still a big challenge (Seinfeld et al., 2016). Lacking the knowledge of aerosol–cloud interactions limits our ability to estimate climate forcing caused by aerosols (Boucher et al., 2013).
Aerosol CCN supersaturation activation spectrum is one of the most critical parameters to quantify aerosol–cloud interactions (Schmale et al., 2018). Despite the fact that a large number of CCN number concentrations near ground have been measured worldwide (Tao et al., 2018a), ground-measured CCN may not represent CCN at cloud base that alter clouds directly. Obtaining CCN near cloud base becomes a crucial issue. Cloud base CCN can be measured in situ on aircraft platforms, but airborne measurements have the limitations of huge costs and discontinuity. Satellites have difficulty observing CCN at cloud base because clouds can obscure aerosol signals beneath them. Rosenfeld et al. (2016) have proposed an alternative approach for satellites to retrieve CCN concentrations using clouds as CCN chambers; however, employing CCN concentrations derived with this strategy limits our exploration of the relationship between CCN concentrations and cloud droplet concentrations in the natural environment. So far, CCN concentrations at cloud base are scarce for aerosol–cloud interaction studies.
Ground-based lidars can continuously provide optical properties of aerosol particles from ground up to cloud base (Mattis et al., 2016; Li et al., 2019), suggesting great potential in deriving CCN concentrations near cloud base. Ghan and Collins (2004) propose a simple method to infer CCN profiles with the combination of surface in situ CCN and aerosol optical measurements. The method is only applicable when the boundary layer is well mixed from surface to cloud base (Ghan et al., 2006). Mamouri and Ansmann (2016) investigate the potential of single-wavelength polarization lidar to retrieval CCN for three aerosol types (desert, nondesert continental, and marine). The polarization lidar can separate desert and nondesert by means of the particle linear depolarization ratio. Based on datasets from multiyear AErosol RObotic NETwork (AERONET) observations, valid relationships are found between particle extinction coefficients, and number concentrations of particles with dry radius larger than 50 nm (for nondesert and marine) and 100 nm (for desert). CCN concentrations at different supersaturations are parameterized with the particle number concentration derived from extinction profiles according to aerosol types. The consideration of the hygroscopicity of ambient particles is empirical. In addition, single-wavelength lidar also lacks sufficient information to quantify particle number concentration, which will bring large uncertainty on CCN retrieval.
Multiwavelength Raman lidars (MWRLs) have been increasingly used to detect aerosol vertical distributions in recent years. The principle of MWRLs allows independent retrieval of particle backscatter (β) and extinction coefficients (α), which provides more information about particle microphysical properties (Müller et al., 2016). The 3β+2α MWRL systems (backscatter coefficients at 355, 532, and 1064 nm and extinction coefficients at 355 and 532 nm) have been widely recommended to derive particle microphysical properties (Burton et al., 2016). Existing approaches to retrieve CCN using MWRLs are based on microphysical inversion techniques. Lv et al. (2018) build a lookup table based on AERONET datasets to retrieve particle number size distributions from backscatter and extinction profiles. Then assumed activation critical diameters according to aerosol type classification together with the retrieved optically equivalent particle size distributions are utilized to calculate CCN concentrations. It is worth noting that most of the foregoing methods implement crude particle type classification to determine particle hygroscopicity.
There are three major challenges in CCN concentration retrieval with lidars. The first is the conversion of lidar-derived optical properties into particle number concentrations. High uncertainties of retrieved particle number concentrations could be an important source of CCN retrieval error. The second one is the determination of particle hygroscopicity in order to evaluate the ability of particles to participate as CCN. Particle hygroscopicity, which is highly related to chemical composition and the aging/coating effect, is found to cause nonnegligible variations in cloud droplet activation (Hudson, 2007; Zhang et al., 2017). The last is the influence of high relative humidity (RH) near clouds. Aerosol particles are likely to be humidified in the ambient environment, and the consequent changes in optical properties make CCN retrieval more challenging. Most studies working on CCN retrieval with MWRLs mainly focus on deriving particle number concentrations, but seldom commence to solve the issue of hygroscopicity.
In recent years, several aerosol hygroscopic studies based on lidar measurements have been carried out (Fernández et al., 2018; Lv et al., 2017; Bedoya-Velásquez et al., 2018). Backscatter and extinction enhancement factors can be derived with lidar measurements and RH profiles. The enhancement factor, which is associated with both particle size and hygroscopicity (Kuang et al., 2017), is defined as
where fξ is the enhancement factor of the optical property ξ (backscatter or extinction) at a specific light wavelength λ and RH, and RHref is the reference RH value. Many studies manifest that lidar-derived enhancement factors are in good agreement with in situ measurements (Wulfmeyer and Feingold, 2000; Pahlow et al., 2006; Fernández et al., 2015; Rosati et al., 2016). Feingold and Morley (2003) demonstrate that the extent of backscatter and extinction enhancements hints at the ability of particles to serve as CCN. Tao et al. (2018b) use in-situ-measured light-scattering enhancement factors to predict NCCN at 0.07 % supersaturation, and the result shows strong consistency with the CCN counter.
In this paper, a new method to retrieve CCN number concentrations for 3β+2α MWRL systems is proposed. Different from the foregoing approaches which use AERONET datasets, we use in-situ-measured microphysical and chemical data in this study. Theoretical simulations based on in situ measurements are carried out to seek the relationship between CCN number concentrations and lidar-derived optical properties. The simulation implements κ-Köhler theory (Petters and Kreidenweis, 2007) to describe particle hygroscopic growth and activation processes. Mie theory (Bohren and Huffman, 2007) is utilized to calculate particle backscatter and extinction coefficients from in-situ-measured aerosol microphysical and chemical properties. The enhancements of backscatter and extinction with RH are introduced to quantify particle hygroscopicity instead of using empirical estimation according to aerosol type classification. The new method is applicable to well-mixed aerosol layers. We take datasets in the North China Plain (NCP) as an example of this method. The NCP is influenced by heavy and complex pollution, which shows strong characteristics of continental aerosols. Mineral dust and marine particles are not considered in this study.
The paper is structured as follows. The filed campaign and in situ measurements are introduced in Sect. 2.1. Section 2.2 briefly introduces the simulations to calculate CCN number concentrations, backscatter, and extinction coefficients from in-situ-measured microphysical and chemical data. The new CCN retrieval method for MWRLs is described in Sect. 3.1 in detail. Sensitivity of the method to the systematic and random errors of backscatter, extinction, and RH is tested in Sect. 3.2. Results and discussions are given in Sect. 4. Section 5 summarizes the paper.
Since it is not easy to accumulate large datasets of simultaneous measurements of lidar and aircraft, ground-measured aerosol microphysical and chemical data are used to simulate lidar-derived backscatter and extinction coefficients and corresponding CCN number concentrations. The simulations are based on κ-Köhler theory and Mie theory. The required datasets include particle number size distribution (PNSD), black carbon (BC) mass concentrations (mBC), mixing state of BC-containing particles, and size-resolved hygroscopicity. The simulation results are used to establish and validate the new retrieval method.
2.1 Datasets of aerosol microphysical and chemical properties
In-situ-measured aerosol properties were collected from five field campaigns at three different measurement sites in the NCP. The measurement sites are located at Wuqing (39∘23′ N, 117∘01′ E, 7.4 m a.s.l.) in Tianjin, Xianghe (39∘45′ N, 116∘58′ E, 36 m a.s.l.), and Wangdu (38∘40′ N, 115∘08′ E, 51 m a.s.l.) in Hebei Province. The specific locations, topographical information, and pollution status of these measurement sites are shown in Fig. S1 in the Supplement. These three sites all lie inside the polluted NCP region and are highly representative of the polluted background (Xu et al., 2011; Bian et al., 2018; Sun et al., 2018). Time periods, measured parameters, and corresponding instruments of the individual campaign are listed in Table 1.
Table 1Locations, time periods, parameters, and instruments of five field campaigns.
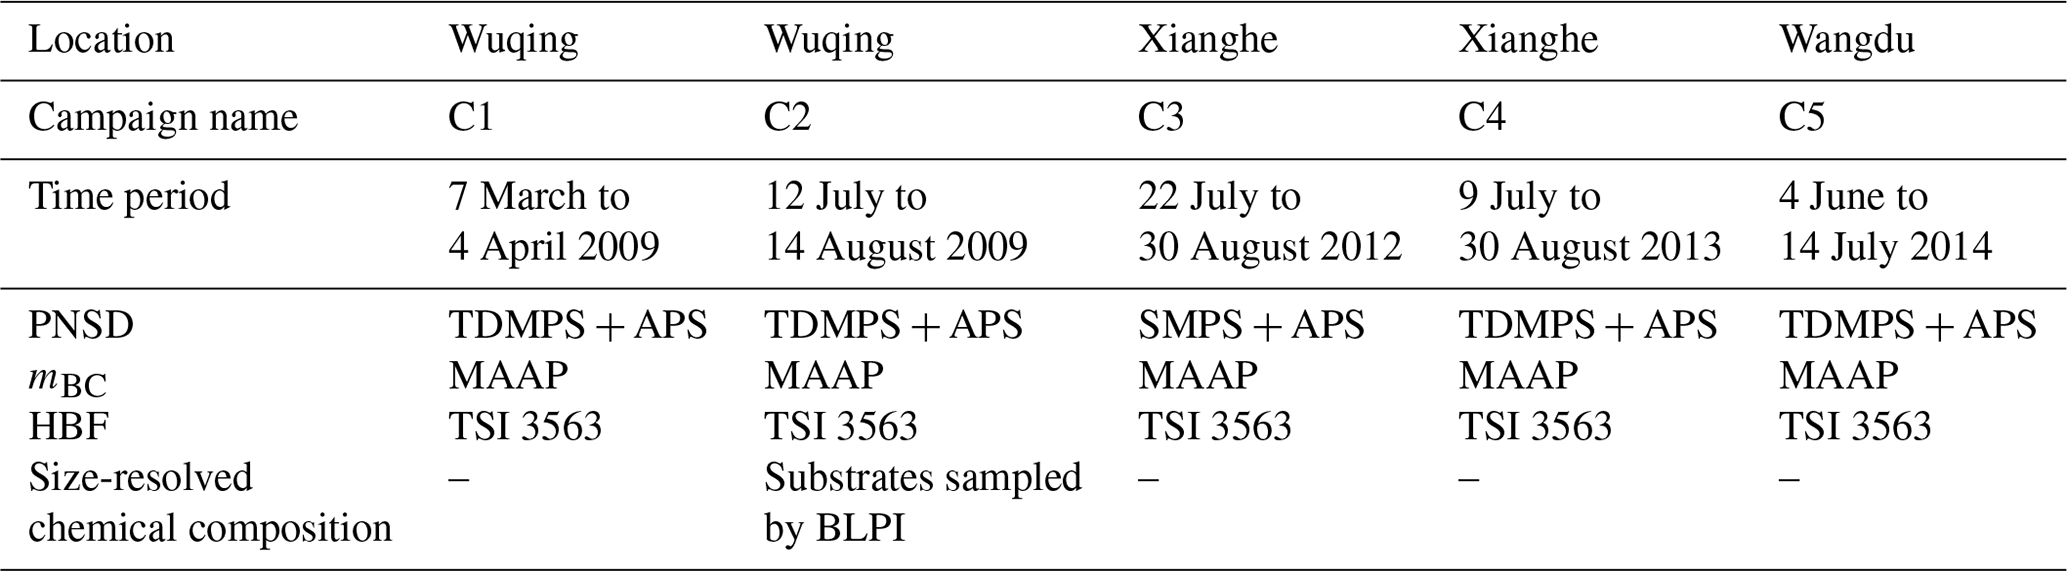
During these field campaigns, except measurement for size-resolved chemical compositions, ambient particles were drawn in through a PM10 inlet (16.67 L min−1), passed through a silica gel diffusion drier, and then were split into different instruments. All instruments were operated at RH less than 30 %.
The particle number size distributions (PNSDs) were measured with the combination of a twin differential mobility particle sizer (TDMPS, IfT, Leipzig, Germany) or a scanning mobility particle size spectrometer (SMPS) and an aerodynamic particle sizer (APS, TSI, Inc., Shoreview, MN USA, model 3320 or model 3321). The statistical information about the measured PNSDs is shown in Fig. 1a. The peaks of the PNSDs are at about 100 nm (diameter in log scale), which shows strong characteristics of continental aerosols.
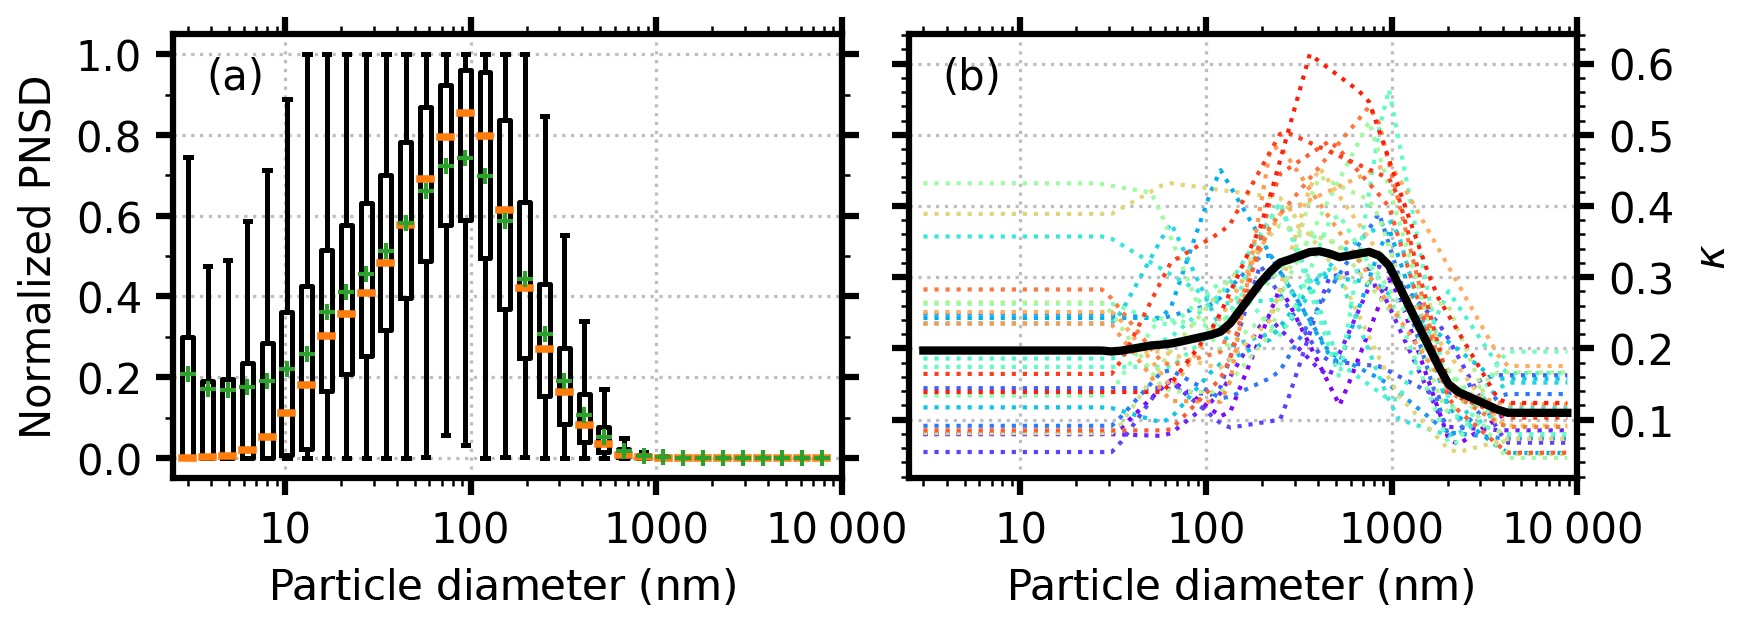
Figure 1(a) Box plot of particle number size distributions (PNSDs) in the datasets from five field campaigns. Each PNSD is normalized by its maximum value at the peak diameter. Green markers “+” represent the mean value of each diameter. The boxes extend from the lower to upper quartile values, with orange lines at the median. The whiskers extend from the box to the minimum–maximum values or extend from the box by 1.5 times the interquartile range. The flyers are not shown in the plot. (b) A total of 25 typical size-resolved κ distributions. Each dotted line with color represents one size-resolved κ distribution. The solid black line represents the mean value of the size-resolved κ distributions.
The black carbon (BC) mass concentrations (mBC) were measured by a multi-angle absorption photometer (MAAP, Thermo, Inc., Waltham, MA USA, model 5012). As for mixing states of BC, BC and other non-absorbing compositions were found to be both externally mixed and core–shell mixed during the campaigns (Ma et al., 2012). The mass fraction of externally mixed BC (rext) is defined to quantify the mixing states of BC:
where mext_BC is the mass concentration of externally mixed BC. According to Ma et al. (2012), rext can be retrieved from hemispheric backscattering fractions (HBFs) measured by an integrating nephelometer (TSI, Inc., Shoreview, MN USA, model 3563).
Size-resolved chemical compositions all come from campaign C2. The size-resolved aerosol sampling was carried out with a 10-stage Berner low-pressure impactor (BLPI). Chemical species including inorganic ions (, Na+, K+, Mg2+, Ca2+, , , Cl−), elemental carbon, organic carbon, water-soluble organic carbon, and some other species such as dicarboxylic acids were analyzed from sample substrates. After transforming the ambient wet aerodynamic diameters into dry volume-equivalent diameters, size-resolved κ distributions were derived from measured size-resolved chemical compositions. The chemical compositions are found to be size dependent during campaign C2, especially the mass fraction of organic matter (Liu et al., 2014). A total of 25 typical size-resolved κ distributions in the NCP are given in Fig. 1b. The measured size-resolved κ distributions vary a lot and cover a wide range of aerosol hygroscopicity (Kuang et al., 2018). More details about the measurements can be found in Liu et al. (2014).
2.2 Datasets of CCN number concentrations and lidar-derived optical properties
In-situ-measured aerosol properties mentioned above are utilized to calculate CCN number concentrations and particle backscatter and extinction coefficients based on κ-Köhler theory and Mie theory. For each simultaneously measured PNSD, mBC, and rext (16 183 sets of data), simulations are carried out with every one of the 25 size-resolved κ distributions.
CCN number concentrations can be calculated with PNSD and size-resolved κ distributions based on the κ-Köhler equation. Petters and Kreidenweis (2007) introduce the κ-Köhler equation to describe the relationship between particle or droplet diameter D and critical supersaturation ratio (SS) or RH with a single hygroscopic parameter κ:
where Ddry is particle dry diameter, σs∕a is the surface tension of the solution–air interface, Mw is the molecular weight of water, R is the universal gas constant, T is temperature, and ρw is the density of water. For a specific supersaturation, critical activation diameter can be derived with the κ-Köhler equation using size-resolved κ distributions. CCN number concentrations can thereby be calculated by integrating number concentrations of particles larger than the critical diameter. CCN number concentrations at the supersaturations of 0.07 %, 0.10 %, 0.20 %, 0.40 %, and 0.80 % are accordingly simulated. The selected supersaturation ratios are widely used in CCN measurements.
Particle backscatter and extinction can be calculated with PNSD, mBC, and rext using Mie models. Mie theory can solve light-scattering problems of homogeneous and coated spherical particles. Without the consideration of mineral dust, using the Mie model is quite reasonable because particles are likely to be spherical near clouds where the RH could be relatively high. When simulating particle backscatter and coefficients, PNSD, mBC, rext, and the complex refractive index are needed. PNSD at different RHs can be calculated with the κ-Köhler equation as well. The refractive indices of BC, the non-absorbing component, and pure water are set to be 1.8+0.54i (Ma et al., 2012), (Wex et al., 2002), and , respectively. Backscatter coefficients (355, 532, and 1064 nm) and extinction coefficients (355 and 532 nm) at dry conditions and RH from 60 % to 90 % are simulated with an interval of 1 %.
The simulations are introduced in detail in Sect. S3 in the Supplement. The new method and all the analyses in this paper are based on the Mie-model-simulated datasets, and all the simulations mentioned above are implemented.
3.1 Method to retrieve CCN number concentrations using MWRL
3.1.1 Overview
An optically related CCN activation ratio, ARξ, is introduced to bridge the gap between CCN and lidar-derived optical properties. ARξ is the ratio between CCN number concentration and backscatter or extinction coefficient, which can be expressed as
where NCCN is the CCN number concentration, and Naerosol is the total number concentration of aerosol particles. ARξ can be divided into two parts: one is the ratio of CCN to the total particles, which is the origin definition of CCN activation ratio; the other is the ratio of total number concentration to backscatter or extinction at dry conditions. Bulk CCN activation ratio is related to particle size distribution and hygroscopicity, and the relationship between particle number concentration and optical properties is mainly controlled by size distribution. Therefore, ARξ could be quantified with size and hygroscopicity information. The key point of our method is to seek parameters that can indicate size and hygroscopicity of particles from lidar measurement and use these parameters to estimate ARξ. In addition, deriving backscatter and extinction coefficients at dry conditions is also important.
A schematic diagram of the method to retrieve CCN number concentration is shown in Fig. 2.
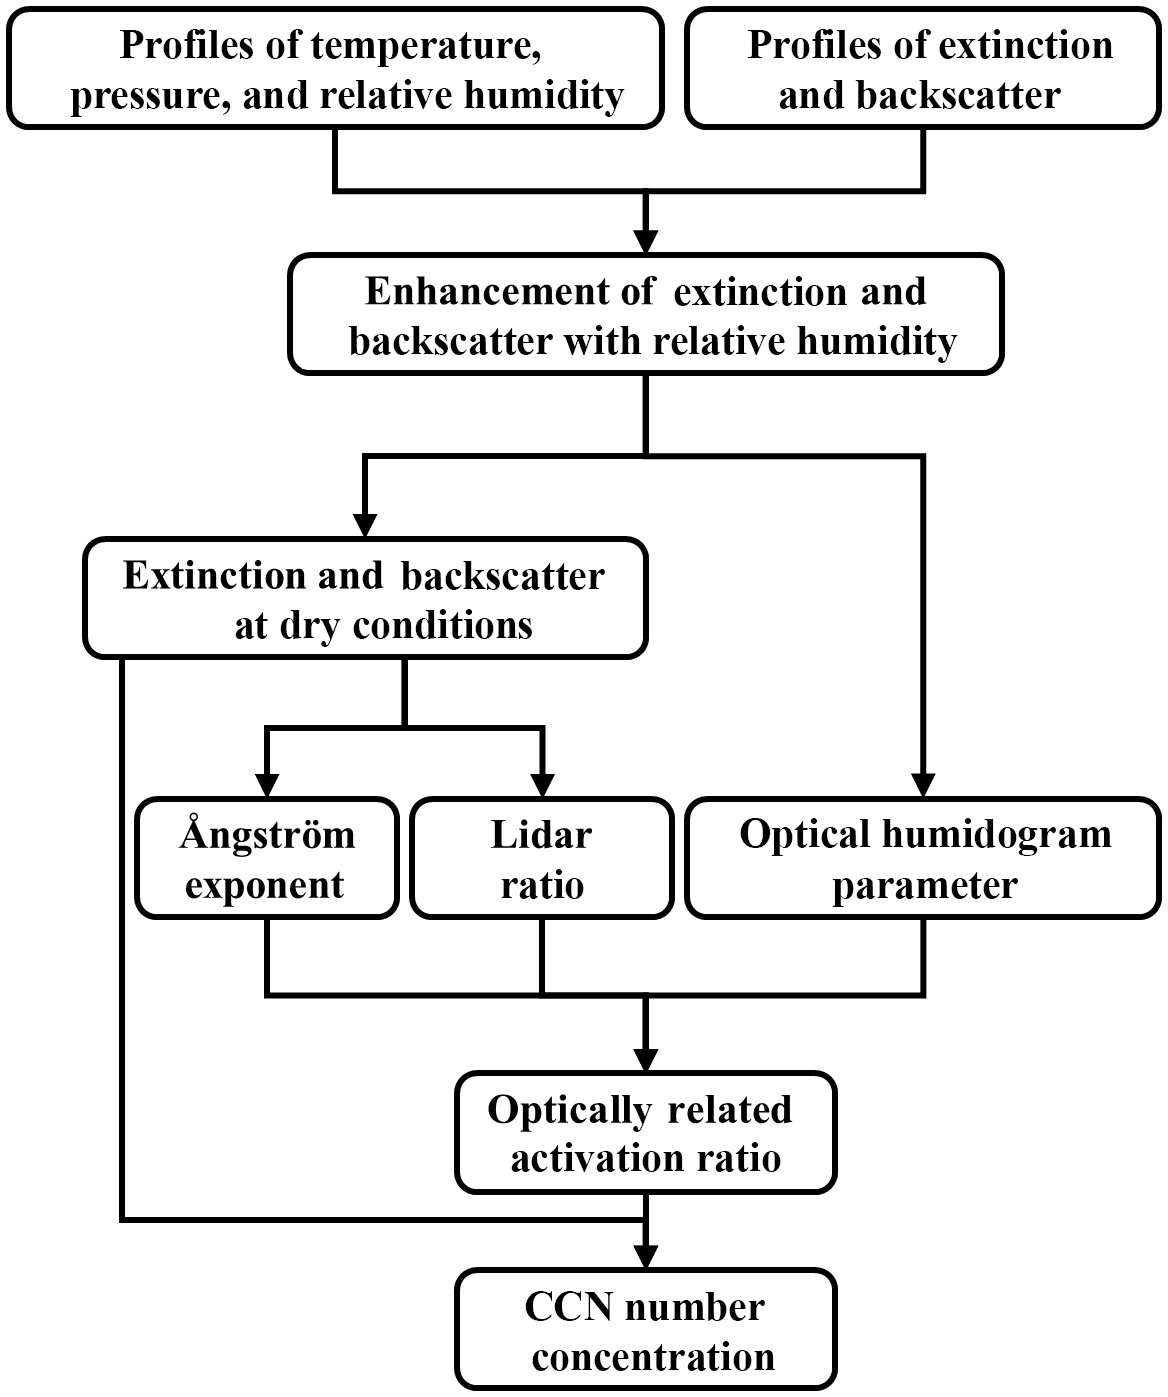
Figure 2Schematic diagram of newly proposed method to retrieve cloud condensation nuclei number concentrations using multiwavelength Raman lidar.
Firstly, enhancement of backscatter and extinction coefficients with RH (also called humidogram) is derived from lidar measurements and additional ancillary data (i.e. pressure, temperature, RH profiles). Humidogram parameter which can indicate particle hygroscopicity can be fitted from humidograms with parameterization equation. Particle dry backscatter and extinction can also be inferred from the humidograms. This step is applied to all the 3β+2α parameters. The approaches to select appropriate hygroscopic layers and fit humidogram parameters, dry backscatter, and dry extinction are described in Sect. 3.1.2.
Then, Ångström exponent (å) and lidar extinction-to-backscatter ratio (lidar ratio, sa) are calculated from inferred dry backscatter and extinction coefficients. Extinction-related Ångström exponent (åα) is the most commonly used parameter to reveal information about the predominant size of aerosols. Generally speaking, a smaller åα represents more large particles. Similarly, backscatter-related Ångström exponent (åβ) is often employed in lidar analysis (Fernández et al., 2015), and particle backscatter coefficients of different wavelengths have also been proven to have a valid Ångström exponent relationship (Komppula et al., 2012). Ångström exponent of dry backscatter and extinction coefficients (åξ) between two wavelengths can be derived using Eq. (5):
where the subscripts 1 and 2 represent different wavelengths. Another widely used parameter to express aerosol characteristics in lidar studies is the particle lidar extinction-to-backscatter ratio (lidar ratio, sa), which is defined as the ratio of extinction coefficient to backscatter coefficient at a specific light wavelength:
As is shown in Eq. (6), lidar ratio is determined by the scattering phase function at 180∘ P(π) and the single-scattering albedo ω. P(π) is mainly influenced by particle size and ω indicates the content and mixing state of light-absorbing components. Lidar ratio is often utilized in aerosol type classification and is proven to be very sensitive to particle sizes (Zhao et al., 2017). The lidar ratio can provide information on particle type and also serve as a proxy for particle hygroscopicity. Therefore, lidar ratio of dry particles could be a reliable parameter to estimate ARξ.
Next, åξ, sa, and humidogram parameters are utilized to estimate ARξ. ARξ of all the 3β+2α parameters is calculated. Statistical relationships among humidogram parameters åξ, sa, and ARξ are used in our new method. The estimation of ARξ is introduced in Sect. 3.1.3 in detail. The implementation of åξ and sa is quite similar to the microphysical inversion process for particle size distribution retrieval. Microphysical inversion is a physics-based approach but will bring large uncertainties in retrieving particle number concentrations. Constraining ARξ directly with a statistical relationship is a much more simple and straightforward way.
Finally, after ARξ values of backscatter and extinction at different wavelengths are derived, CCN number concentration can be calculated by multiplying ARξ by the corresponding ξdry. The average value of CCN concentrations calculated by different ξdry is the final retrieval result.
3.1.2 Derivation of humidogram parameters, dry backscatter, and dry extinction from lidar measurement
A constraint needs to be satisfied when quantifying the enhancements of backscatter and extinction coefficients with lidar measurements. The selected vertical layers must be well-mixed, so we can guarantee that the variations in particle backscatter and extinction coefficients are caused by different RH and not by various aerosol types or loads. Atmospheric vertical homogeneity is fulfilled if the layer has little variability of virtual potential temperature profile and water vapor mixing ratio profile (Lv et al., 2017). Additional analyses can also be considered to evaluate vertical mixing of air masses, such as backward trajectory, horizontal wind velocities at different altitude, or the third moment of the frequency distribution of vertical wind velocities (Bedoya-Velásquez et al., 2018).
Once vertical homogeneity is ensured, physical and chemical properties at dry conditions can be assumed to be uniform in the selected layer, and the number concentrations are proportional to air molecule number density. Accordingly, the relative variations in particle backscatter and extinction coefficients against different RHs can be achieved after normalizing the backscatter and extinction coefficients with air molecule number density.
Humidogram parameterization is needed to find a representative parameter for the relationship between enhancement factor and RH. Unlike in-situ-controlled RH measurements, there is no such generic reference RH for dry conditions for lidar measurements to derive enhancement factor. Inferring backscatter and extinction coefficients at dry conditions (ξdry) is also an important issue in CCN retrieval. Therefore, humidogram parameterization of lidar-derived optical properties should combine ξdry and fξ(RH,λ) together.
Many equations to parameterize enhancement factors have been proposed by previous studies (Titos et al., 2016). Two one-parameter equations are selected to test their performance on estimating ξdry and representing particle hygroscopic growth characteristics. The first equation is the most commonly used one initially introduced by Kasten (1969):
where the exponent γξ is the fitting parameter and describes the hygroscopic behavior of the particles; the other equation is proposed based on physical understanding by Brock et al. (2016), which has been reported to have better performance in describing light-scattering enhancement factor than Eq. (7) (Yu et al., 2018):
where κξ is the fitting parameter and shows significant correlation with bulk hygroscopic parameter κ (Kuang et al., 2017). Here, Eqs. (7) and (8) are denoted as the γ equation and κ equation, respectively. With given backscatter and extinction at different RHs, ξdry and γξ or κξ can be fitted simultaneously by means of least squares.
Comparisons between the performances of the γ equation and κ equation on inferring backscatter and extinction at dry conditions are carried out to select a better parameterization. Four RH ranges (60 %–90 %, 60 %–70 %, 70 %–80 %, and 80 %–90 %) are selected. The fitted ξdry values are compared with the ξdry calculated by the Mie model. The slopes of linear regressions, determination coefficients (R2), and relative errors are listed in Table 2. Apparently, the κ equation has a better performance than the γ equation for all RH ranges. Inferring ξdry with the γ equation will underestimate by about 10 %–30 %. It is consistent with the finding of Haarig et al. (2017) that the γ equation does not hold for RH lower than 40 %. The bias of backscatter is found to be larger than the bias of extinction.
Table 2Slopes of linear regressions, determination coefficients (R2), and relative errors (RE) between Mie-model-simulated particle dry backscatter or extinction coefficients and those inferred from humidogram functions. A total of 404 575 pairs of the simulations from the in situ dataset are used. The REs are given in the form of mean value ± 1 standard deviation.

The RH range of humidogram equations also influences the fitting results. Table 2 shows the fitted ξdry values have larger bias when the value of RH increases. The fitted humidogram parameters γξ and κξ from different RH ranges are compared to each other, and the results are displayed in Table 3. Parameterization equations are not always perfect for the whole RH range, so humidogram parameters fitted with various RH ranges can be different. If γξ and κξ are used to represent hygroscopic behavior of particles, more careful attention should be paid to the RH ranges.
Table 3Slopes of linear regressions and determination coefficients (R2) between γξ and κξ fitted from RH range 60 %–90 % and those fitted from limited RH ranges (60 %–70 %, 70 %–80 %, and 80 %–90 %).

Based on the comparisons above, Eq. (8) (κ equation) is selected as our humidogram equation to derive ξdry and κξ. The RH range for parameter fitting used is fixed to 60 %–90 % in the following method.
3.1.3 Estimation of ARξ
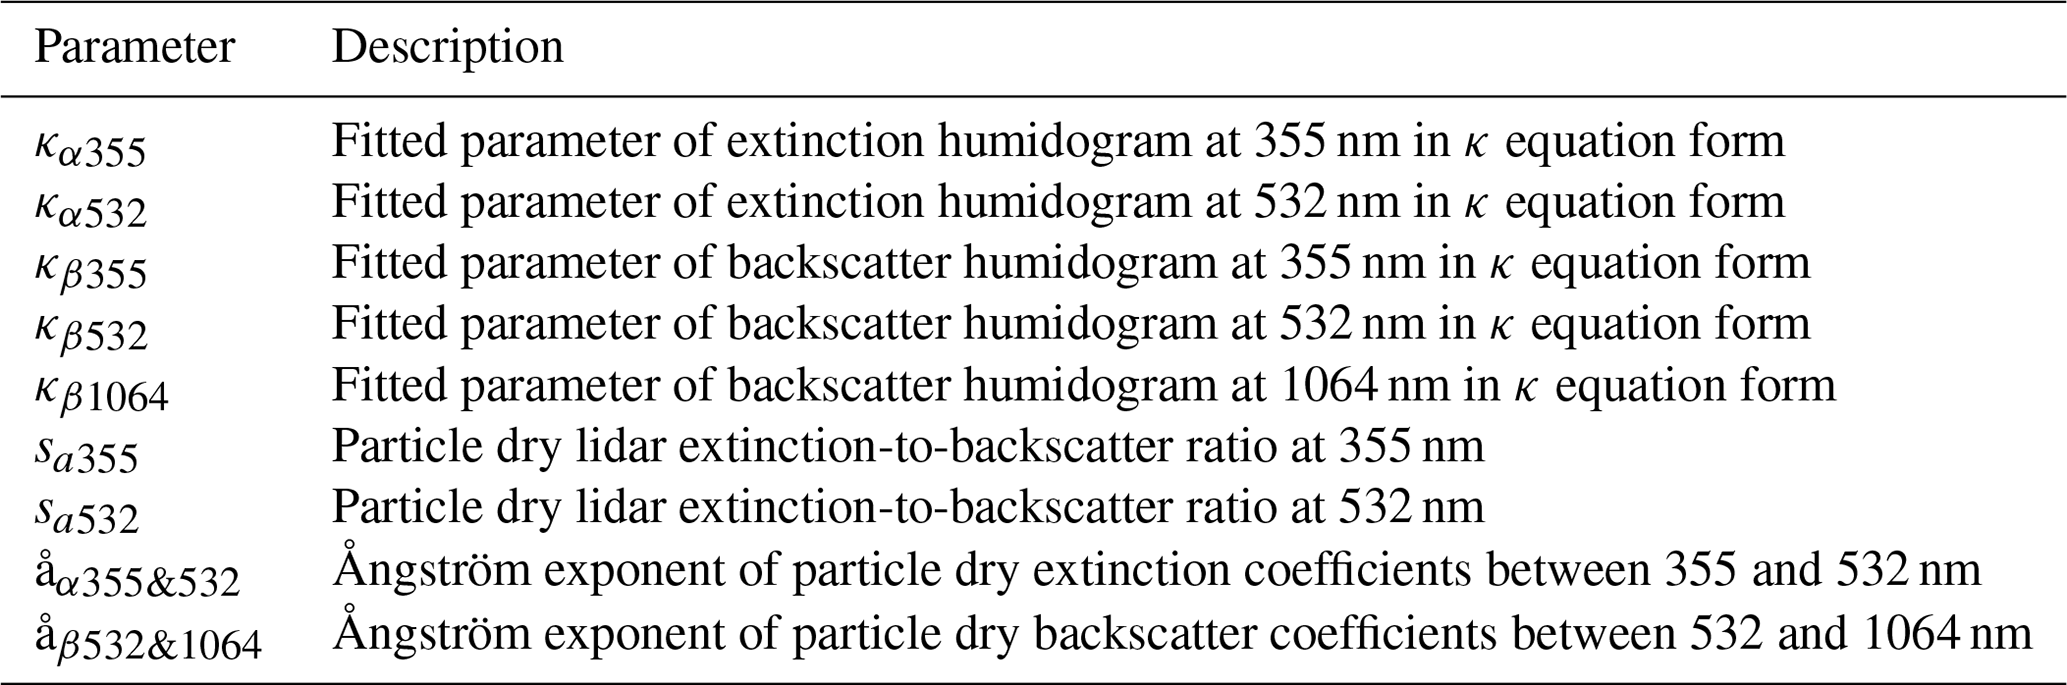
Ångström exponents, lidar ratios, and optical humidogram parameters κξ are used to estimate the optically related activation ratio ARξ. Concerning that the Ångström exponents and lidar ratios are not independent of each other (any parameter can be calculated from other parameters), we reduce the number of parameters to a sufficient number to represent all the information. The selected nine parameters are listed in Table 4. One possible way to seek the relationship between the nine parameters and ARξ is to build a lookup table, but too many input parameters would make the lookup table too large to build and operate.
Table 4Lidar-derived parameters for predicting optically related CCN activation ratio ARξ.
In the past few decades, machine learning has been a field that has developed rapidly, which experiences a very wide range of applications (Grange et al., 2018). Compared to traditional statistical methods, many machine learning techniques are nonparametric and do not need to fulfill many assumptions required for statistical methods (Immitzer et al., 2012). Random forest (RF) is an ensemble decision tree machine learning method that can be used for regression. (Breiman, 2001; Tong et al., 2003). In addition to the free restraints on input parameters and assumptions, RF also has the advantage of being able to explain and investigate the learning process (Kotsiantis, 2013). The Python module RandomForestRegressor from the Python Scikit-Learn library (http://scikit-learn.org/stable/modules/generated/sklearn.ensemble.RandomForestRegressor.html, last access: 18 December 2018) is utilized as the RF model. The nine parameters in Table 4 are the input parameters for the RF model, and the ARξ values of 3β+2α are the output parameters.
Some tuning parameters required by the RF model need to be specified by users. Experiments are made to determine the optimal values of the tuning parameters. Experiment results are showed in Fig. S7 in the Supplement and the detailed settings of the RF model are listed in Table S2 in the Supplement. In this case, the results are rather insensitive to the tuning parameters. Data simulated with datasets measured from campaigns C1–C4 are utilized as the training data, and those from C5 are used as test data.
3.2 Sensitivity test
Both systematic and random errors exist in lidar-retrieved backscatter and extinction coefficients (Mattis et al., 2016). Systematic errors in backscatter and extinction can come from instrumentation setup, data processing method, and retrieval algorithm. Sensitivity test is carried out to test the impact of systematic errors of backscatter and extinction on CCN retrieval. Errors in backscatter or extinction influence the value of Ångström exponents and lidar ratios. The errors of individual backscatter or extinction are considered to be independent, though systematic errors of different parameters are related. The systematic errors are given in the range of −20 % to 20 % with an interval of 2 %. In each test, the error is only applied to one parameter, and other parameters are error-free.
RH is another crucial factor in this new method to retrieve CCN. Profiles of RH derived by remote-sensing techniques are also influenced by errors. At present, RH profiles are usually obtained with the combination of temperature from microwave radiometer and water vapor mixing ratio from MWRL. Both measurements can cause systematic and random errors in RH (Bedoya-Velásquez et al., 2018). Errors in RH will influence the values of ξdry and κξ, which in turn influence all the nine input parameters. Systematic errors ranging from −10 % to 10 % in intervals of 1 % are considered for RH.
Random errors in observations can be reduced by temporal averaging but cannot be eliminated. The influence of random errors in backscatter, extinction, and RH on CCN retrieval are investigated with the Monte Carlo method. Three sets of sensitivity tests for random errors are conducted. Errors obeying Gaussian distribution are generated randomly with the mean value of zero. The standard deviation of Gaussian distribution is fixed at 10 % for backscatter and extinction, and the standard deviation of RH is set to be 5 %, 10 %, and 20 % for each test. The procedure is repeated 2000 times. All the 80 575 sets of data from campaign C5 are used for sensitivity test.
4.1 Supersaturations for lidar CCN retrieval
CCN number concentrations are related to supersaturations. Critical diameters of each supersaturations calculated with 25 size-resolved κ distributions are shown in Fig. 3a. Most of the critical diameters at a supersaturation of 0.07 % are larger than 200 nm, while critical diameters at a supersaturation of 0.80 % are around 50 nm. Suitable supersaturations for lidar CCN retrieval depend on the ability of lidar optical properties to provide information about number and hygroscopicity of CCN-related sizes.
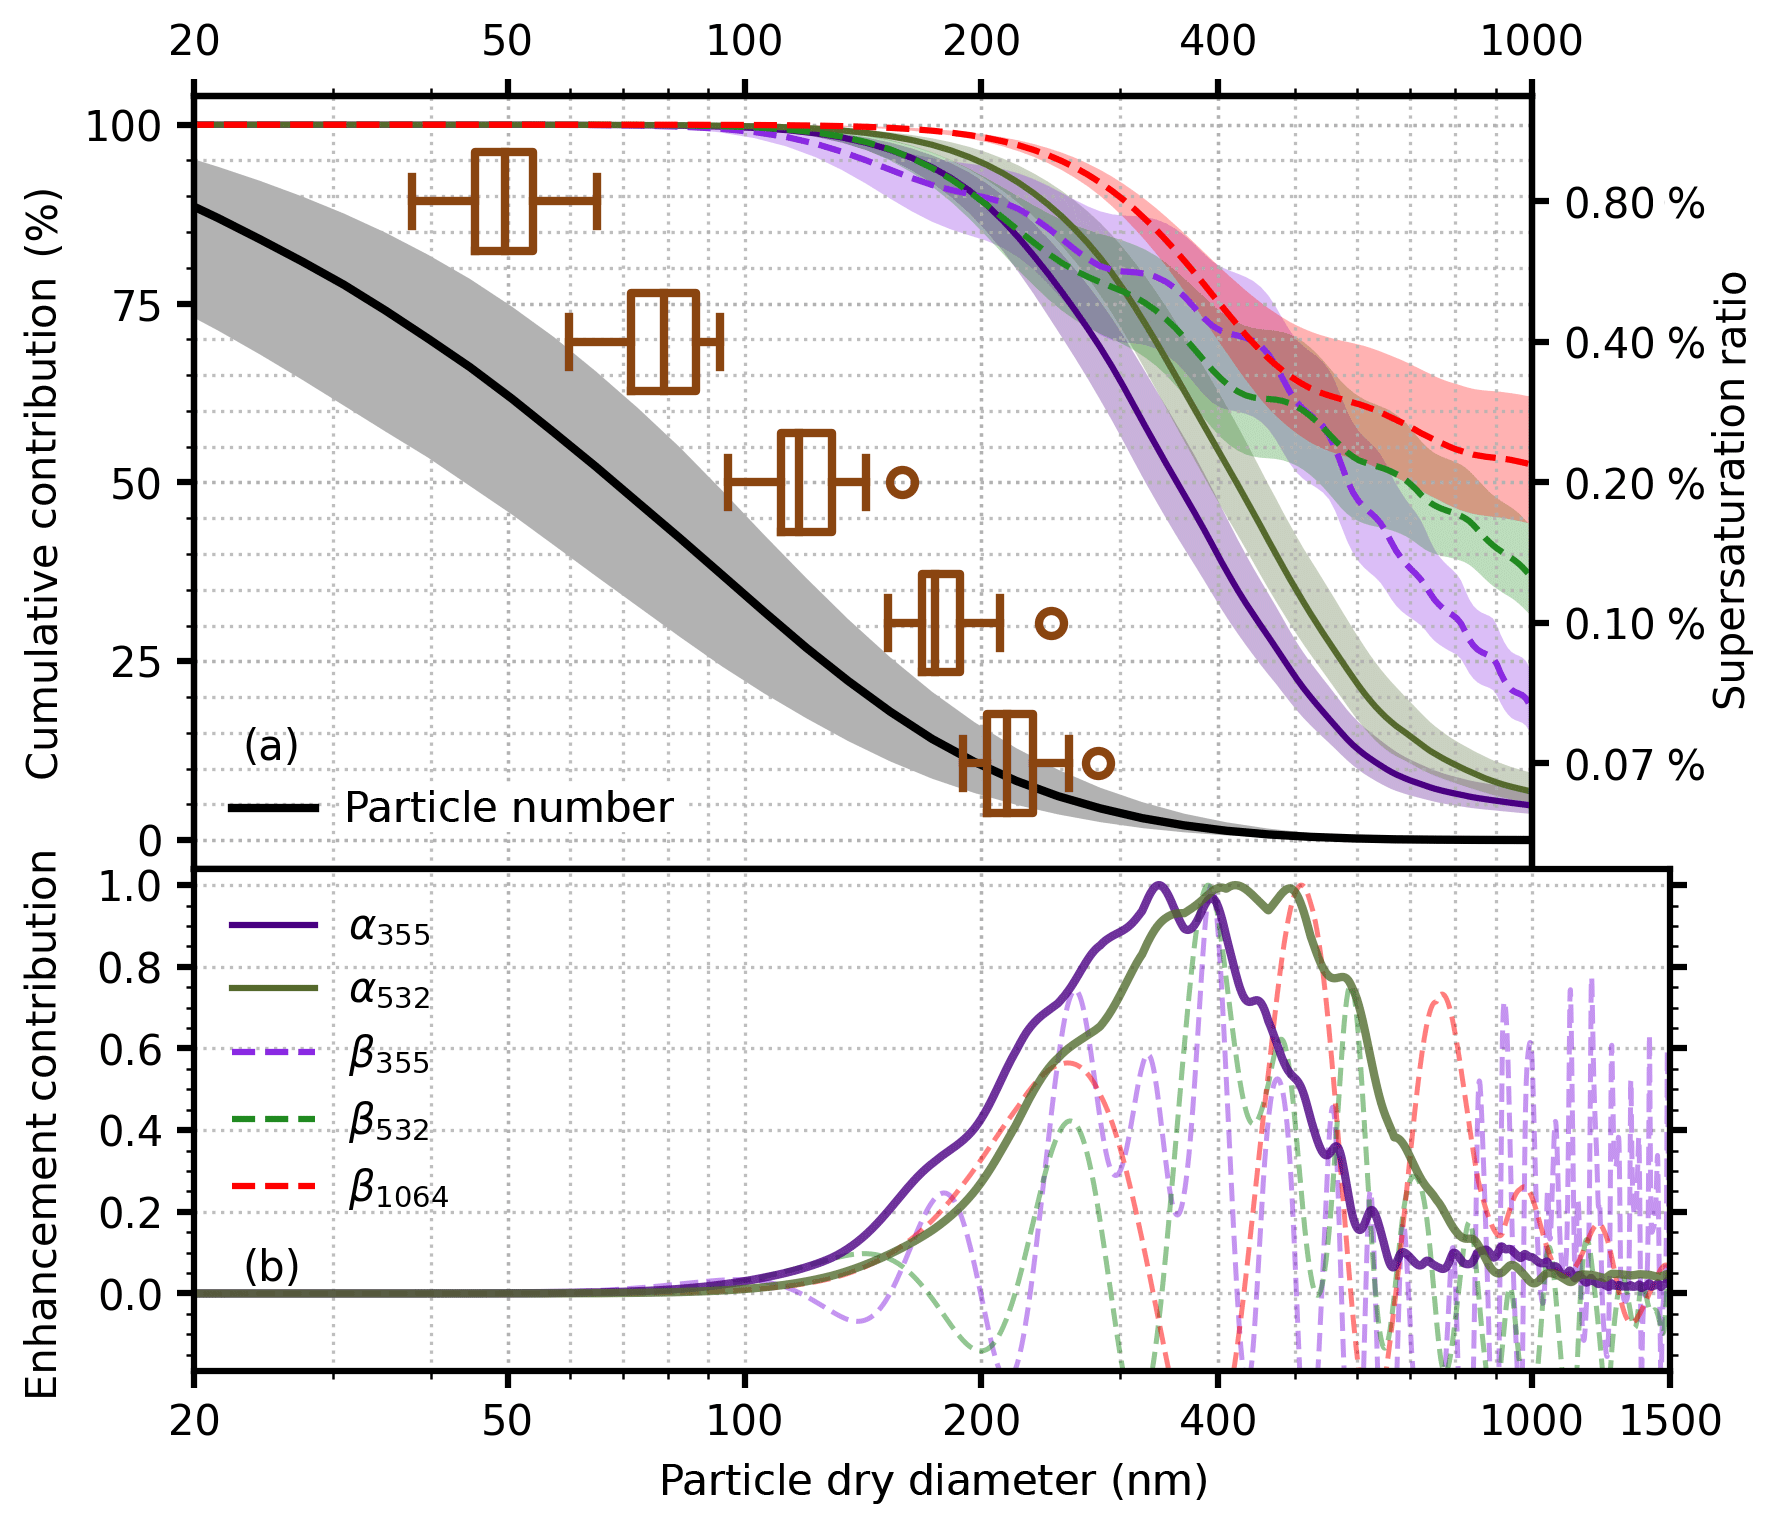
Figure 3(a) Cumulative contributions (accumulate from large particle size to small particle size) of particle number concentrations (measured), dry particle backscatter coefficients (simulated), and dry particle extinction coefficients (simulated). The solid and dashed lines represent the median values of five field campaigns, and the shadows cover from the lower to upper quartile values. The box plots in brown contain statistical information about critical diameter of each supersaturation condition (right y axis). The boxes extend from the lower to upper quartile values, with lines at the median. The whiskers extend from the box to the minimum–maximum values or extend from the box by 1.5 times the interquartile range. The markers “o” are the flyers. (b) Normalized size-resolved enhancement contributions when relative humidity increases from 60 % to 90 %, which are theoretically calculated by the mean particle number size distribution, the mean black carbon mass concentration (4.717 µg m−3), the mean mass ratio of externally mixed black carbon (0.664 %), and the mean size-resolved κ distribution.
Size cumulative contributions of particle number of all measured particle size distribution and corresponding calculated backscatter and extinction at dry conditions are also displayed in Fig. 3a. As the cumulative contributions of particle number suggest, particles with diameter less than 100 nm dominate particle number concentrations (over 65 %). However, most backscatter and extinction come from particles larger than 200 nm (around 90 %) and almost 100 % come from particles larger than 100 nm. If critical diameter is small, dry backscatter and extinction are insensitive to particle diameters that contribute to most CCN concentrations.
Size-resolved enhancement contributions of backscatter and extinction are calculated to discuss hygroscopicity-sensitive size of optical enhancement factor measurement. The enhancement contribution is defined as the difference between optical cross sections of RH at 90 % and 60 %, and represents the proportion of each size to the enhancement in backscatter or extinction. As is shown in Fig. 3b, the contributions of the extinction enhancements are concentrated in the diameters within 200 to 700 nm, and extinction enhancement at 355 nm is related to smaller particles than that at 532 nm. Similar to particle number, particles with diameters smaller than 100 nm contribute little to the enhancements of both backscatter and extinction.
Figure 3b also shows that different κξ values are sensitive to the hygroscopicity of different size. Size-dependent hygroscopicity is important to estimate CCN rather than bulk hygroscopicity information, especially for different supersaturation conditions. One humidogram may indicate the bulk hygroscopicity, but it is the hygroscopicity of small particles that influences CCN number concentrations most. Using κξ of all the 3β+2α values can provide some information about the hygroscopicity of small particles.
Comparing sensitive size of optical properties and critical diameters at different supersaturations, 3β+2α MWRL systems have potential to retrieve CCN number concentrations at supersaturations smaller than 0.20 %. It is not recommended to estimate CCN concentrations using lidar data at supersaturations larger than 0.40 %.
4.2 CCN number concentrations retrieved with error-free data
With error-free data as input, the model-predicted extinction-related activation ratio at 532 nm (ARα532) and the retrieved CCN number concentrations at supersaturations of 0.07 %, 0.10 %, and 0.20 % are compared to the theoretical calculated values. A total of 80 575 pairs of data calculated from campaign C5 are used for verification. The retrieval results are displayed in Fig. 4. The values ARα532 at a specific supersaturation are distributed in a wide range and can span over an order of magnitude, indicating that the relationship between CCN and optical parameters is very complex. According to Fig. 4, all data points are distributed almost evenly on both sides of the 1:1 line and the relative errors of most points are within 20 %. The determination coefficients (R2) of CCN concentrations are all larger than 0.97, and the results do not show obvious systematic deviations. The retrieval errors are found to grow with supersaturation. Retrieval results for higher supersaturations (i.e. 0.40 % and 0.80 %) are displayed in Fig. S8 in the Supplement. There are larger errors for supersaturations of 0.40 % and 0.80 %. Only 47.76 % of the retrieved CCN number concentrations at a supersaturation of 0.80 % have relative errors less than 20 %. The results demonstrate again that lidars may not be sufficient enough to retrieve CCN number concentrations at supersaturations lager than 0.40 %.

Figure 4Comparison of the theoretical calculated extinction-related CCN activation ratio at 532 nm (true AR) and the model-predicted extinction-related CCN activation ratios at 532 nm (retrieved AR) at supersaturations of (a) 0.07 %, (c) 0.10 %, and (e) 0.20 %, and comparison of the theoretical calculated CCN number concentrations (true CCN number concentration) and the retrieved CCN number concentrations at supersaturations of (b) 0.07 %, (d) 0.10 %, and (f) 0.20 %. A total of 80 575 pairs of data calculated from campaign C5 are used. The solid line is the 1:1 line, and the dashed lines are 20 % relative difference lines. Colors represent the relative density of the data points normalized by the maximum data density of each panel. The relative error shown in the figure is mean value ± 1 standard deviation.
4.3 Importance of size-related and hygroscopicity-related parameters
RF models can evaluate the importance of features (input parameters) by calculating the mean decrease impurity (MDI) for each feature among all the trees in the forest. The MDIs and corresponding standard deviations of each parameter at different supersaturations are shown in Fig. 5. Importance of the nine input parameters varies with supersaturations. For 0.07 % and 0.10 %, κα355 and κβ1064 are the two most important parameters, showing the impact of hygroscopicity on the relationship between CCN and optical properties. For 0.20 %, åα355&532 becomes much more important. Among the nine input parameters, κξ values are denoted as hygroscopicity-related parameters, and åξ values are denoted as size-related parameters. In particular, sa can be regarded as a parameter related to both size and hygroscopicity. As is shown in Fig. 5, hygroscopicity-related parameters, especially κα355, κβ1064, and sa532, play crucial roles in retrieving CCN. Size-related parameters have already been proven to be vital in retrieving CCN; however, humidogram parameters κξ have not been implemented in previous methods. CCN concentrations retrieved with and without κξ are compared to show the importance of κξ. When retrieving CCN without κξ, the RF model is also trained with datasets from campaigns C1–C4, but the input data only contain Ångström exponents and lidar ratios. The retrieved CCN concentrations are all compared with datasets from campaign C5, and the results are listed in Table 5. R2 of retrieved CCN decreases from 0.991 to 0.887 for supersaturations of 0.07 %, from 0.992 to 0.857 for 0.10 %, and from 0.973 to 0.785 for 0.20 %. Retrieval errors also increase overwhelmingly, and there are significant positive systematic biases. Parameters which are derived from backscatter and extinction enhancements, κξ, are indispensable parameters in CCN retrieval.
Table 5Slopes of linear regressions, determination coefficients (R2), and relative errors (RE) between theoretical calculated CCN number concentrations and CCN number concentrations retrieved with and without κξ as input parameter. The relative errors are given in the form of mean value ± 1 standard deviation.
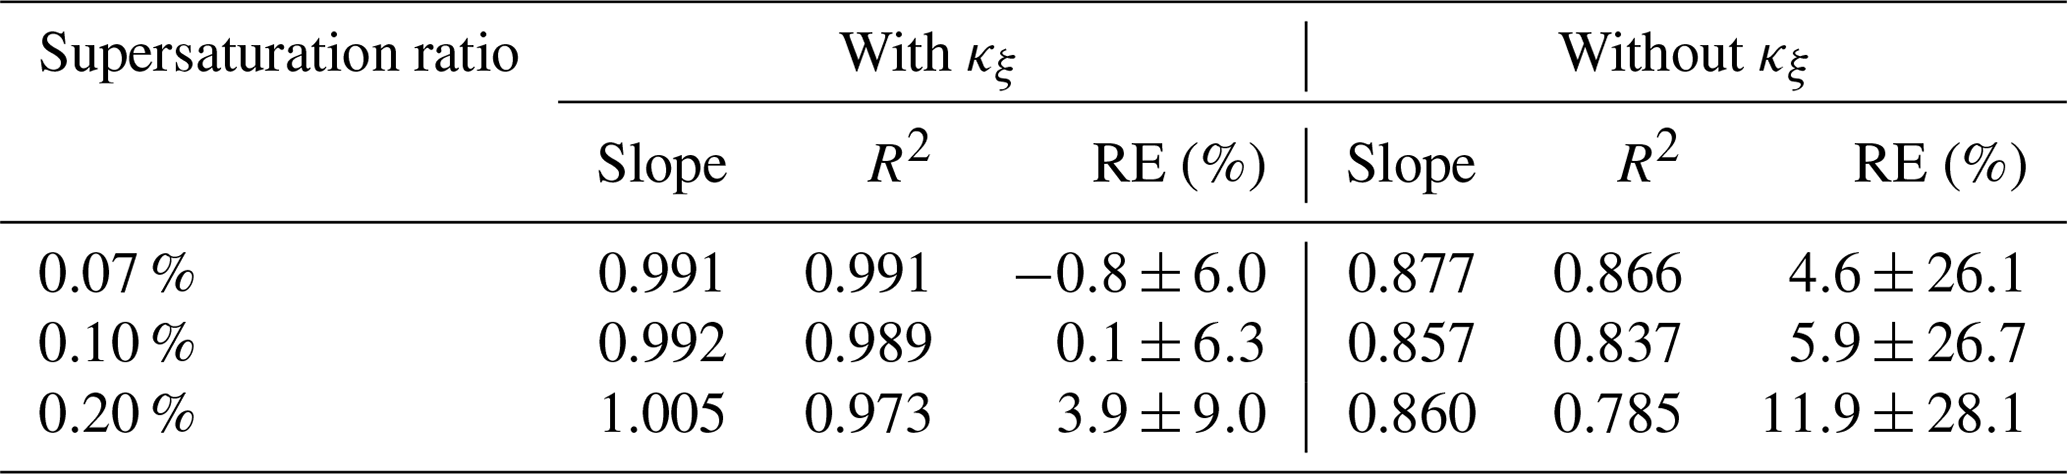
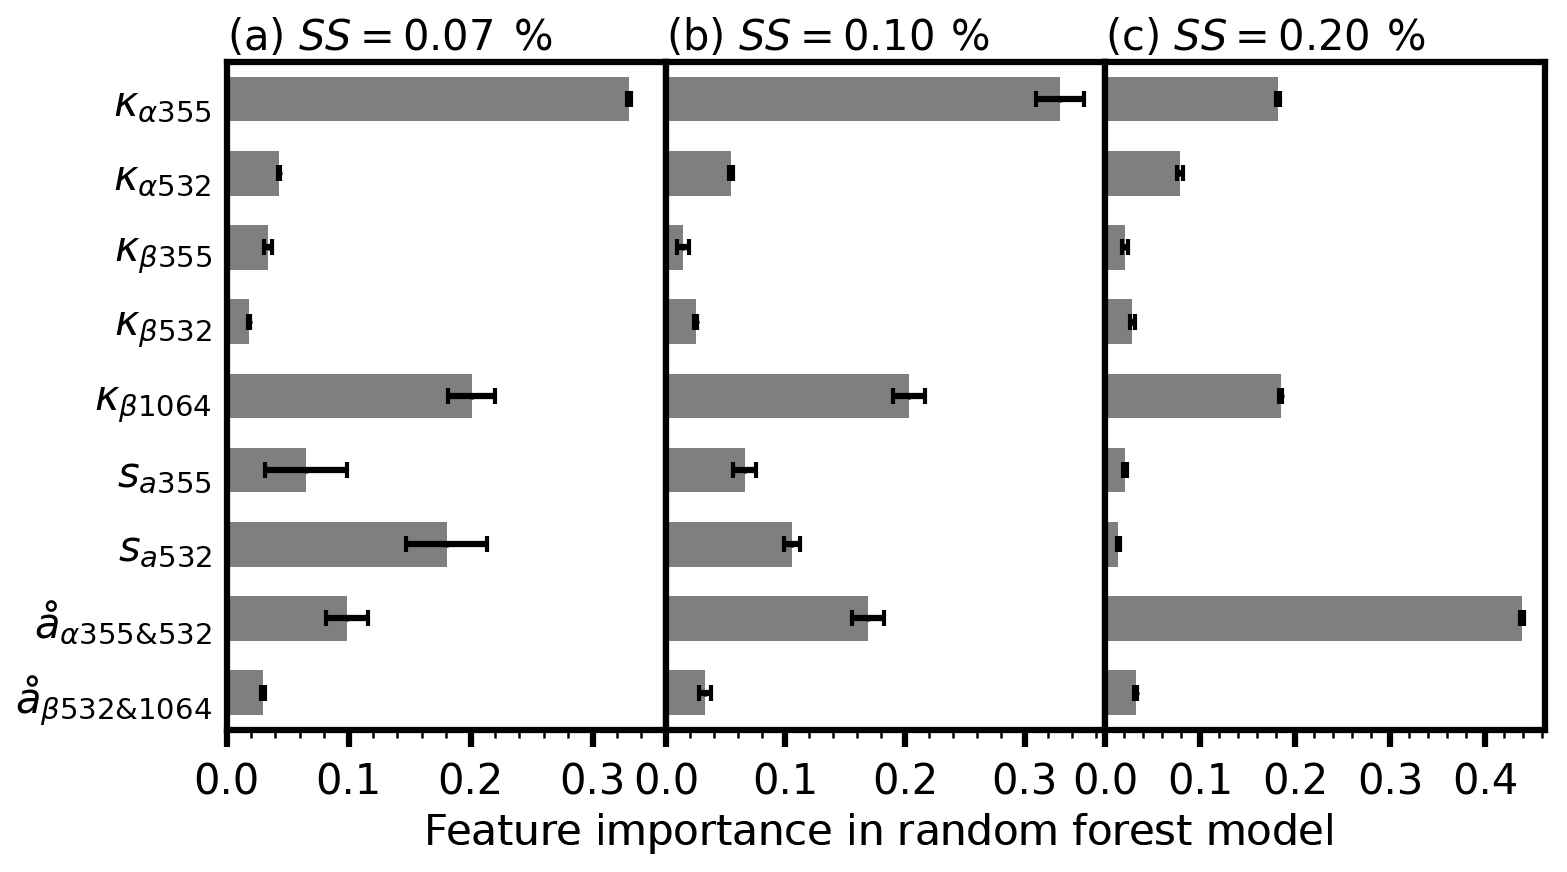
Figure 5Importance of each feature (input parameter) output by the random forest model for predicting optically related CCN activation ratios at supersaturations of (a) 0.07 %, (b) 0.10 %, and (c) 0.20 %. The values of feature importance indicate the decrease in impurity for each feature. The length of the bar represents the mean values among all trees and the error bars give the standard deviations.
4.4 Impact of systematic and random error on CCN retrieval
Figure 6 shows the relative errors of CCN retrieved with systematic errors in backscatter and extinction. Errors of retrieved CCN increase as errors of backscatter and extinction increase, and higher supersaturations are more affected by errors of optical parameters. Errors in extinction coefficients at 355 nm (α355) influence the retrieval results most. On average, a positive relative error of 20 % in α355 will cause about a 20 % overestimate in CCN number concentrations for supersaturation of 0.07 %, about a 40 % overestimate for 0.10 %, and about a 60 % overestimate for 0.20 %. A negative error of 20 % in α355 will underestimate CCN concentrations, and the degree of impact is slightly smaller than the positive error. Errors in extinction coefficient at 532 nm (α532) and at 355 nm have the opposite effect on retrieval error. Errors in α532 do not show a significant impact at supersaturations of 0.07 % and 0.10 %, but an overwhelming effect is found at supersaturations of 0.20 %. It is interesting to note that the errors in backscatter coefficients do not affect the results much. However, in practical applications of MWRLs, the errors in extinction are always much larger than the errors of backscatter. If the error of retrieved CCN concentrations needs to be limited to 20 % at a supersaturation of 0.20 %, the errors of retrieved extinction coefficients should to be controlled within 5 %.
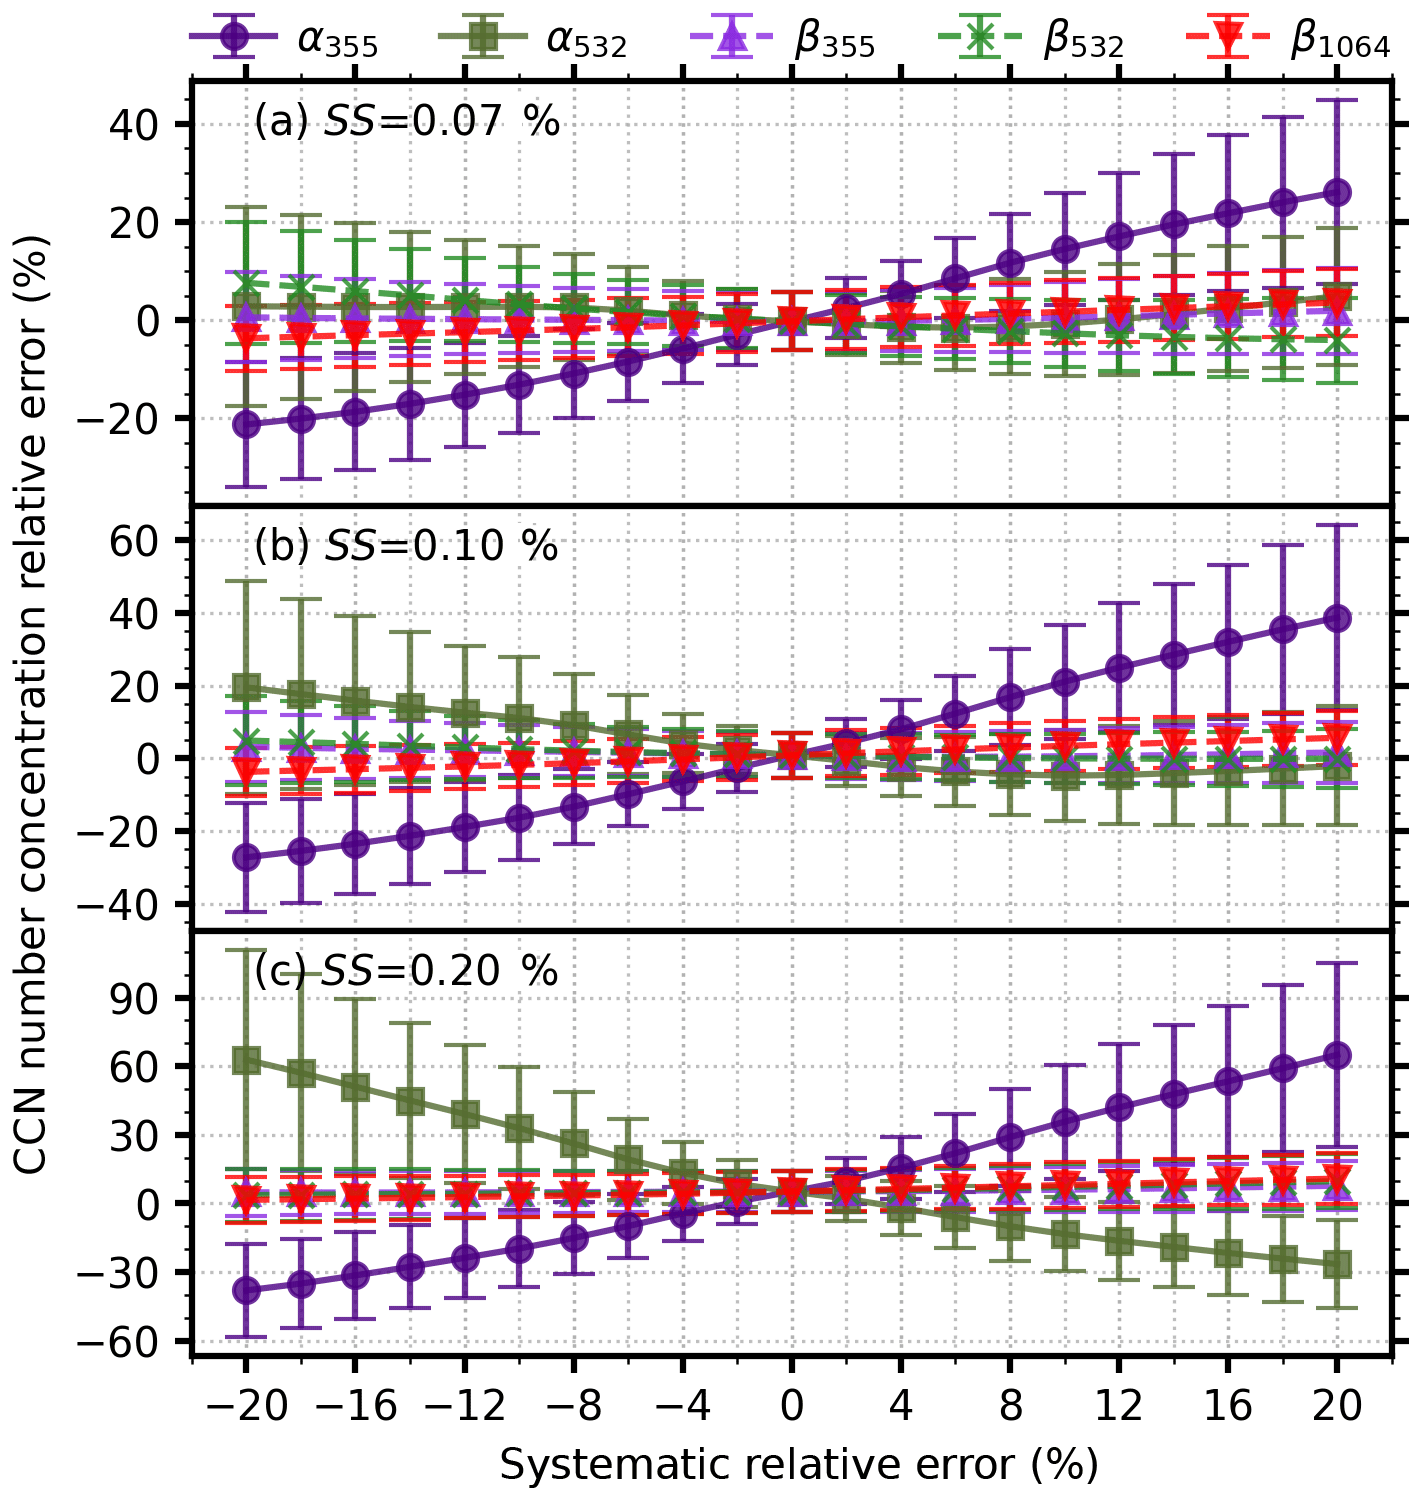
Figure 6Relative errors in retrieved CCN number concentrations at supersaturations of (a) 0.07 %, (b) 0.10 %, and (c) 0.20 % as a function of systematic errors in backscatter or extinction. The markers are the mean values, and the error bars denote the standard deviations.
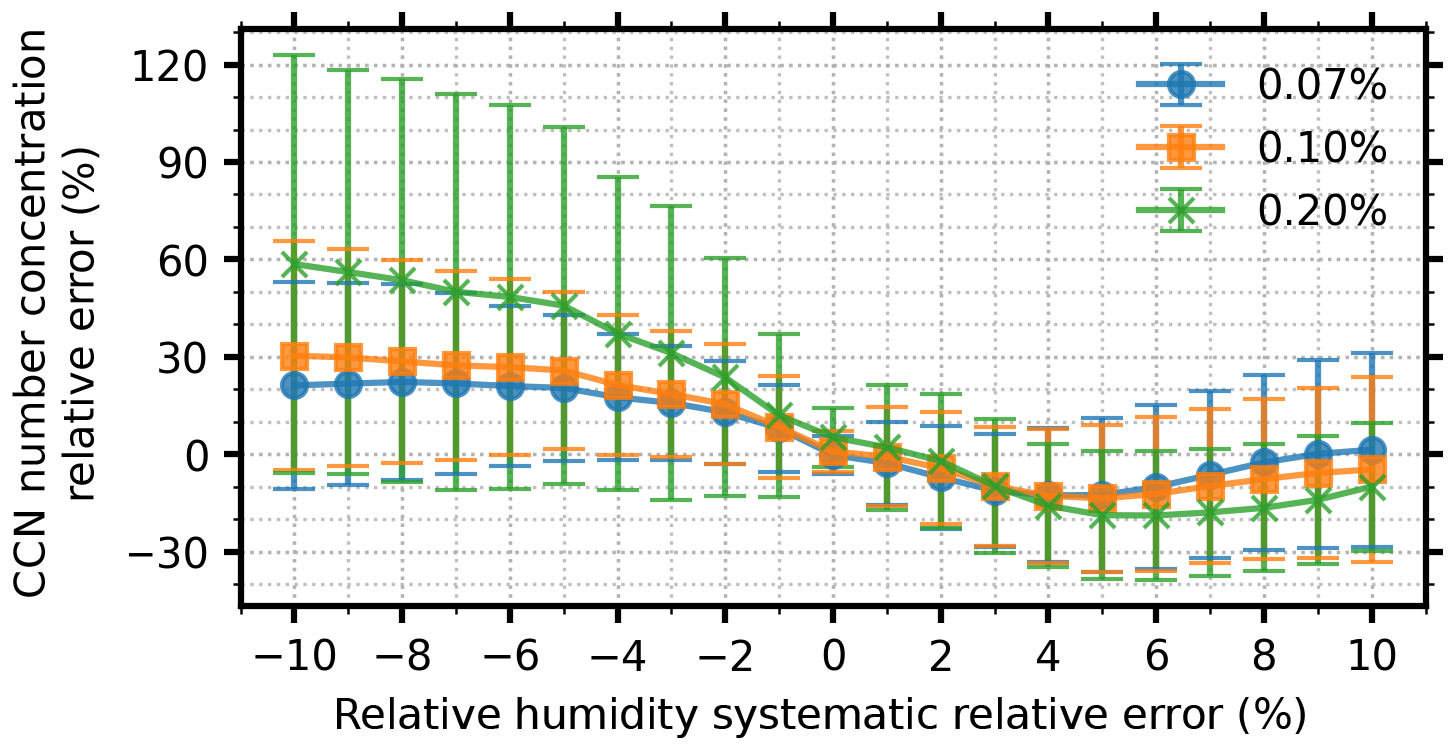
Figure 7Relative errors in retrieved CCN number concentrations at supersaturations of 0.07 %, 0.10 %, and 0.20 % as a function of systematic errors in relative humidity. The markers are the mean values, and the error bars denote the standard deviations.
The test result of systematic error in RH is shown in Fig. 7. When RH has a negative systematic error, CCN concentrations are overestimated, and the extent of overestimation increases as the error increases. A negative error of 10 % in RH will overestimate CCN at supersaturations at 0.20 % by about 60 % on average, and the standard deviation is over 60 %. Effects of positive errors in RH are much smaller than negative errors but more complex. The standard deviations of retrieval relative error increase with RH error, and the extreme value of the mean retrieval error appears at the RH error of 5 %. Underestimating RH will cause much more errors than overestimation. Great care should be paid to RH profiles if enhancements of backscatter and extinction with RH are utilized.
Table 6Mean and 1 standard deviation (SD) values (mean ± SD) of relative errors in retrieved CCN number concentrations at different supersaturations with different random error conditions. The uncertainty of backscatter and extinction coefficients of all the tests is 10 %, and the uncertainties of relative humidity are 5 %, 10 %, and 20 %.
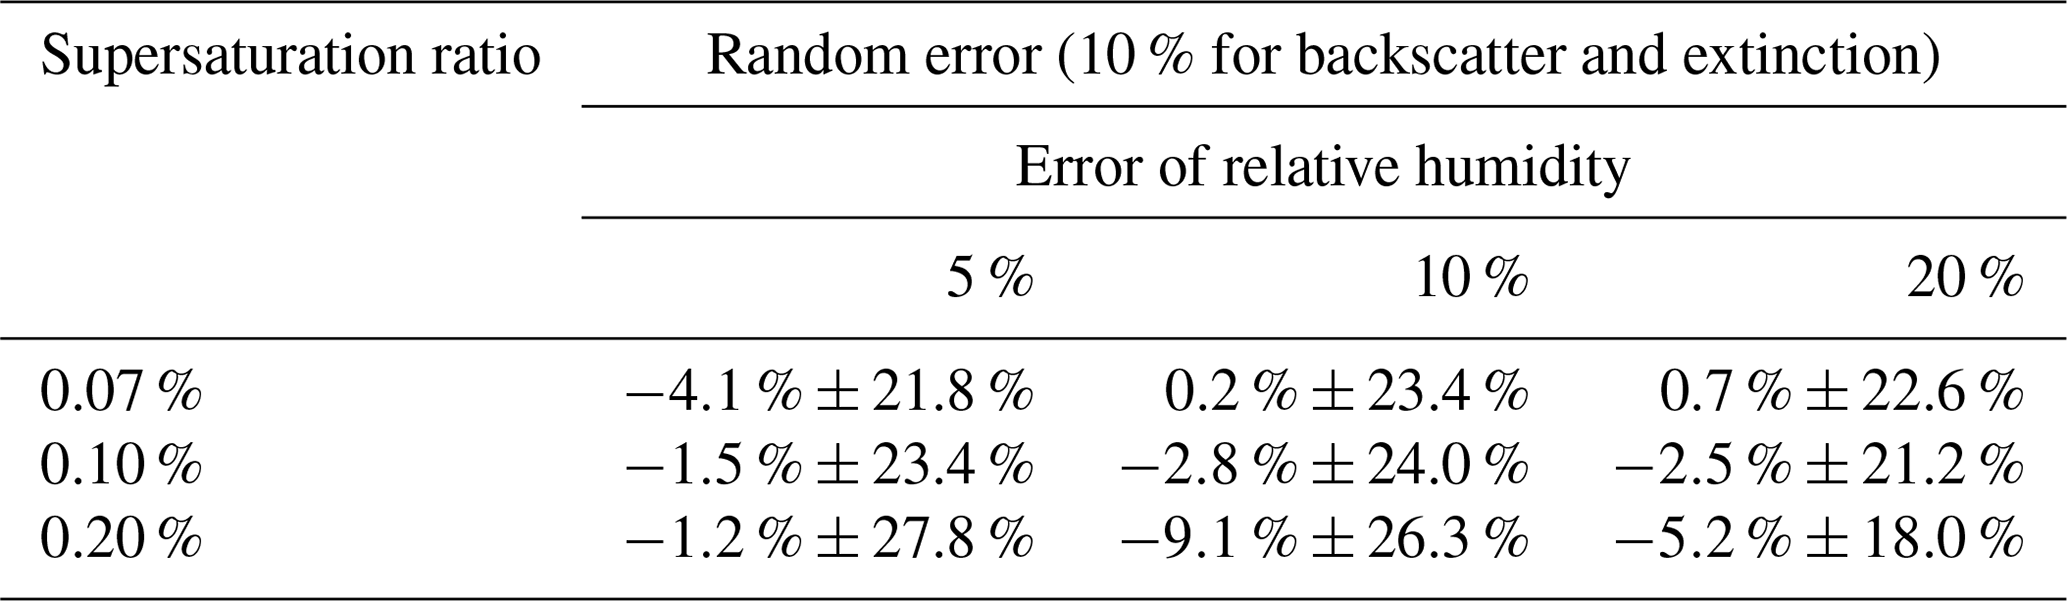
The relative error of retrieved CCN with random errors is presented in Table 6. The retrieval error does not change significantly as the random error of RH increases. For all the conditions that are tested, the mean values of relative error are below or near zero, and the standard deviations are within 18 %–28 %. The impact of random errors on the nine input parameters is also evaluated and is shown in Fig. 8. Random errors will underestimate κξ by 30 %–35 % on average for 5 % RH error, 80 %–85 % for 10 % RH error, and 90 %–95 % for 20 % RH error. sa355 , sa532, and åβ532&1064 are likely to be overestimated. As the random error of RH grows, the absolute relative error of input parameters will become larger.
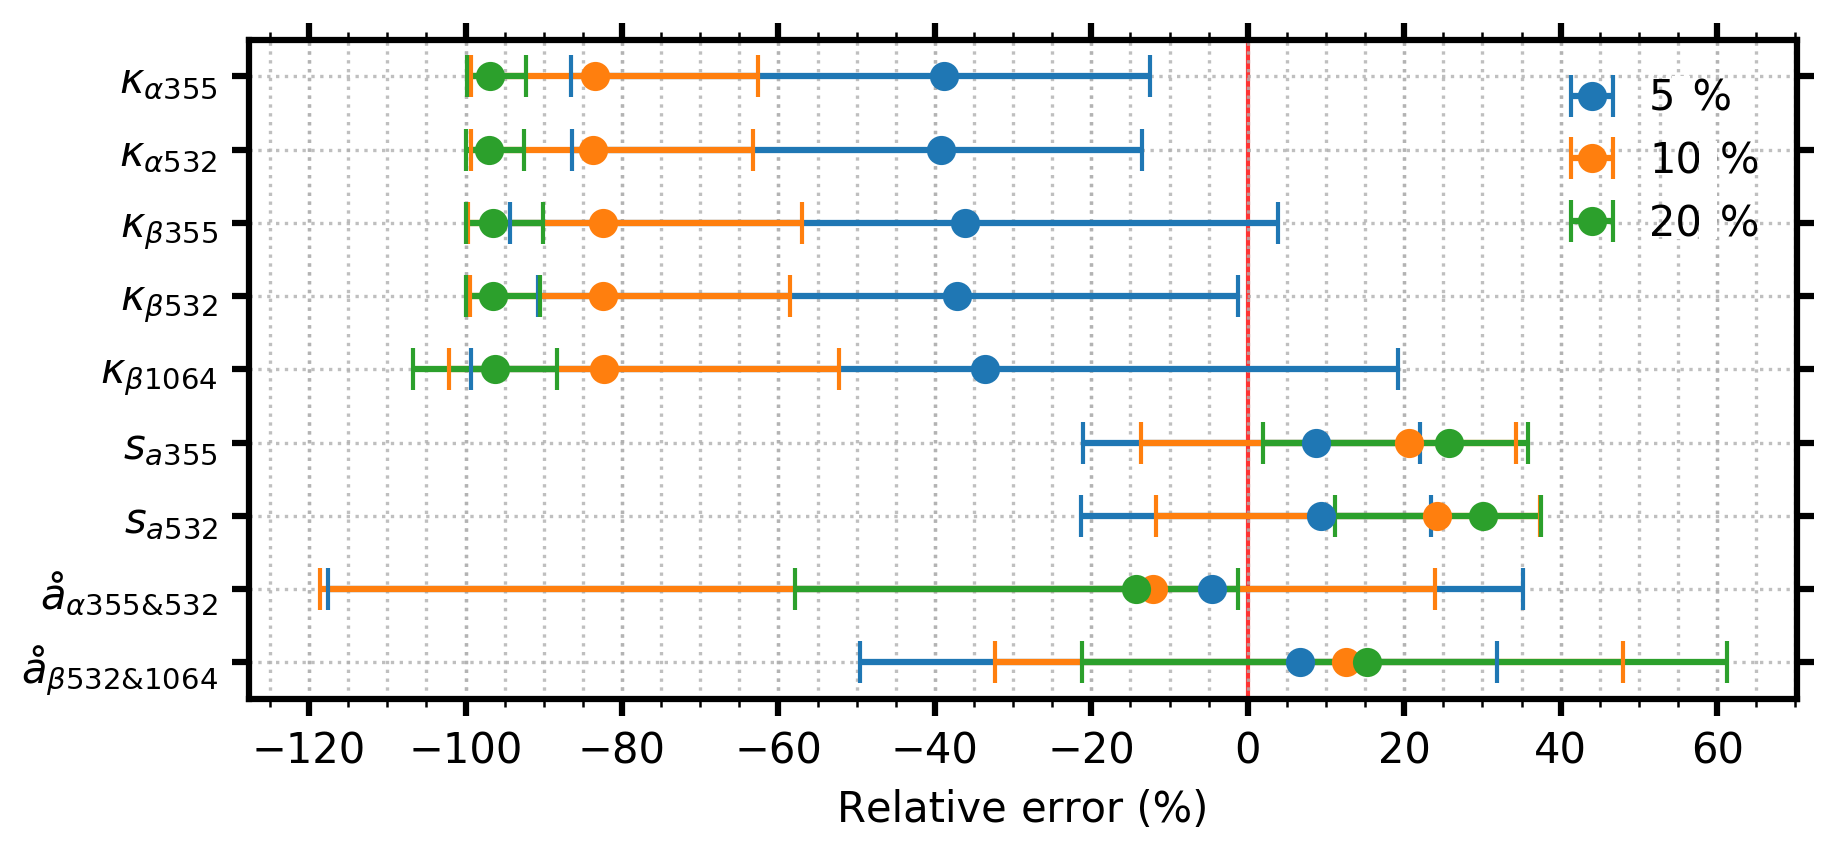
Figure 8Relative errors in fitted and calculated parameters with 10 % random errors for backscatter and extinction and 5 % (blue), 10 % (orange), and 20 % (green) random error for relative humidity. The dots are the median values, and the error bars denote the 5th and 95th percentiles. The dashed red line marks the position of zero.
CCN number concentration at cloud base is a crucial and scarce parameter to constrain the relationship between aerosols and clouds. A new method to retrieve CCN number concentrations using backscatter and extinction coefficients from MWRL measurements is proposed. Enhancements of backscatter and extinction coefficients with RH are implemented to derive dry backscatter and extinction ξdry and humidogram parameter κξ. The ratio of CCN number concentration to dry backscatter or extinction coefficient ARξ, which is estimated by κξ, Ångström exponents, and lidar ratios, is introduced to retrieve CCN number concentrations.
The method is established and verified by theoretical simulations using Mie theory and κ-Köhler theory with in-situ-measured particle size distributions, mixing states, and chemical compositions. The values of ARξ are found to have large variations due to different size distributions and hygroscopicity. Theoretical analyses show that optical properties provided by current 3β+2α MWRL systems basically contain size distribution and hygroscopicity information of particles with diameters larger than 100 nm, which only fits the critical diameters for supersaturations lower than 0.20 %. Accordingly, CCN number concentrations at supersaturations of 0.07 %, 0.10 %, and 0.20 % are retrieved. The performance of the new method is evaluated with error-free data, and CCN number concentrations at all three supersaturations are in good agreement with theoretical calculated values.
Sensitivity tests are carried out to show the influence of systematic and random errors of lidar-derived optical properties and auxiliary RH profiles on CCN retrieval. Systematic errors in extinction coefficients and RH are found to have a large impact on error in retrieved CCN. Parameters fitted from backscatter and extinction enhancements (i.e. ξdry and κξ) are significantly influenced by RH. The uncertainty of RH profiles derived by remote-sensing techniques is a major problem in CCN retrieval. Optical properties near cloud base from lidar measurements are always influenced by high RH. Thus, transforming backscatter and extinction coefficients at ambient RH to dry conditions is a must for CCN retrieval, and accurate RH profiles are in high demand.
The importance of humidogram parameters κξ is demonstrated by comparing the error of CCN concentration retrieved with and without κξ. Neglecting hygroscopicity information contained in backscatter and extinction enhancements will bring huge errors to CCN retrieval by lidars. The performance of two parameterization schemes for backscatter and extinction humidograms is evaluated. The κ equation shows better performance on inferring dry backscatter and extinction than the γ equation. The κ equation, therefore, is recommended to describe the hygroscopic behaviors of the backscatter and extinction coefficients from lidar measurements. The fitted hygroscopic parameters are found to be sensitive to fitting RH range when the RH range is limited and relatively high (between 60 % and 90 %). This is an extreme essential problem for current research for aerosol hygroscopicity with lidar measurements. Great care should be paid to the RH range when evaluating the hygroscopic growth of the lidar-related optical properties.
It should be noted that the theoretical analyses in this paper are based on datasets of continental aerosols, and the implementation of Mie theory also limits the scope of the results. The results can be applied in the North China Plain but are not fit for sea salt and mineral dust. Studies with datasets of other aerosol types should be carried out in the future. Although the applicability of this new method is limited by large uncertainties in RH profiles, comparison between real measured MWRL data and airborne in situ measurement should also be conducted.
This work furthers our understanding of the relationship between CCN and aerosol optical properties and providing an optional way to retrieve CCN number concentration profiles from lidar measurements. The newly proposed method has the potential to provide long-term CCN at cloud base for aerosol–cloud interaction studies.
All of the datasets from field measurement and the corresponding simulated datasets can be obtained from the repository with the doi https://doi.org/10.5281/zenodo.3255086 (Tan et al., 2019).
The supplement related to this article is available online at: https://doi.org/10.5194/amt-12-3825-2019-supplement.
CZ and CL determined the main goal of this study. WT and GZ designed the methods. WT carried them out and prepared the paper with contributions from all co-authors.
The authors declare that they have no conflict of interest.
This research has been supported by the National Key R&D Program of China (grant nos. 2016YFC0202004 and 2017YFC0209904) and the National Natural Science Foundation of China (grant nos. 41375008, 41590872, 9154400001, and 41527807).
This paper was edited by Ulla Wandinger and reviewed by two anonymous referees.
Bedoya-Velásquez, A. E., Navas-Guzmán, F., Granados-Muñoz, M. J., Titos, G., Román, R., Casquero-Vera, J. A., Ortiz-Amezcua, P., Benavent-Oltra, J. A., de Arruda Moreira, G., Montilla-Rosero, E., Hoyos, C. D., Artiñano, B., Coz, E., Olmo-Reyes, F. J., Alados-Arboledas, L., and Guerrero-Rascado, J. L.: Hygroscopic growth study in the framework of EARLINET during the SLOPE I campaign: synergy of remote sensing and in situ instrumentation, Atmos. Chem. Phys., 18, 7001–7017, https://doi.org/10.5194/acp-18-7001-2018, 2018.
Bian, Y., Zhao, C., Xu, W., Kuang, Y., Tao, J., Wei, W., Ma, N., Zhao, G., Lian, S., Tan, W., and Barnes, J. E.: A novel method to retrieve the nocturnal boundary layer structure based on CCD laser aerosol detection system measurements, Remote Sens. Environ., 211, 38–47, https://doi.org/10.1016/j.rse.2018.04.007, 2018.
Bohren, C. F. and Huffman, D. R.: Absorption and Scattering by an Arbitrary Particle, in: Absorption and Scattering of Light by Small Particles, Wiley-VCH Verlag GmbH, Weinheim, 57–81, 2007.
Boucher, O., Randall, D., Artaxo, P., Bretherton, C., Feingold, G., Forster, P., Kerminen, V.-M., Kondo, Y., Liao, H., Lohmann, U., Rasch, P., Satheesh, S. K., Sherwood, S., Stevens, B., and Zhang, X. Y.: Clouds and Aerosols, in: Climate Change 2013: The Physical Science Basis, Contribution of Working Group I to the Fifth Assessment Report of the Intergovernmental Panel on Climate Change, edited by: Stocker, T. F., Qin, D., Plattner, G.-K., Tignor, M., Allen, S. K., Boschung, J., Nauels, A., Xia, Y., Bex, V., and Midgley, P. M., Cambridge University Press, Cambridge, United Kingdom and New York, NY, USA, 571–658, 2013.
Breiman, L.: Random Forests, Mach. Learn., 45, 5–32, https://doi.org/10.1023/a:1010933404324, 2001.
Brock, C. A., Wagner, N. L., Anderson, B. E., Attwood, A. R., Beyersdorf, A., Campuzano-Jost, P., Carlton, A. G., Day, D. A., Diskin, G. S., Gordon, T. D., Jimenez, J. L., Lack, D. A., Liao, J., Markovic, M. Z., Middlebrook, A. M., Ng, N. L., Perring, A. E., Richardson, M. S., Schwarz, J. P., Washenfelder, R. A., Welti, A., Xu, L., Ziemba, L. D., and Murphy, D. M.: Aerosol optical properties in the southeastern United States in summer – Part 1: Hygroscopic growth, Atmos. Chem. Phys., 16, 4987–5007, https://doi.org/10.5194/acp-16-4987-2016, 2016.
Burton, S. P., Chemyakin, E., Liu, X., Knobelspiesse, K., Stamnes, S., Sawamura, P., Moore, R. H., Hostetler, C. A., and Ferrare, R. A.: Information content and sensitivity of the 3β+2α lidar measurement system for aerosol microphysical retrievals, Atmos. Meas. Tech., 9, 5555–5574, https://doi.org/10.5194/amt-9-5555-2016, 2016.
Fan, J., Rosenfeld, D., Zhang, Y., Giangrande, S. E., Li, Z., Machado, L. A. T., Martin, S. T., Yang, Y., Wang, J., Artaxo, P., Barbosa, H. M. J., Braga, R. C., Comstock, J. M., Feng, Z., Gao, W., Gomes, H. B., Mei, F., Pöhlker, C., Pöhlker, M. L., Pöschl, U., and de Souza, R. A. F.: Substantial convection and precipitation enhancements by ultrafine aerosol particles, Science, 359, 411–418, https://doi.org/10.1126/science.aan8461, 2018.
Feingold, G. and Morley, B.: Aerosol hygroscopic properties as measured by lidar and comparison with in situ measurements, J. Geophys. Res.-Atmos., 108, 4327, https://doi.org/10.1029/2002JD002842, 2003.
Fernández, A. J., Apituley, A., Veselovskii, I., Suvorina, A., Henzing, J., Pujadas, M., and Artíñano, B.: Study of aerosol hygroscopic events over the Cabauw experimental site for atmospheric research (CESAR) using the multi-wavelength Raman lidar Caeli, Atmos. Environ., 120, 484–498, https://doi.org/10.1016/j.atmosenv.2015.08.079, 2015.
Fernández, A. J., Molero, F., Becerril-Valle, M., Coz, E., Salvador, P., Artíñano, B., and Pujadas, M.: Application of remote sensing techniques to study aerosol water vapour uptake in a real atmosphere, Atmos. Res., 202, 112–127, https://doi.org/10.1016/j.atmosres.2017.11.020, 2018.
Fu, S., Deng, X., Li, Z., and Xue, H.: Radiative effect of black carbon aerosol on a squall line case in North China, Atmos. Res., 197, 407–414, https://doi.org/10.1016/j.atmosres.2017.07.026, 2017.
Ghan, S. J. and Collins, D. R.: Use of In Situ Data to Test a Raman Lidar–Based Cloud Condensation Nuclei Remote Sensing Method, J. Atmos. Ocean. Tech., 21, 387–394, https://doi.org/10.1175/1520-0426(2004)021<0387:uoisdt>2.0.co;2, 2004.
Ghan, S. J., Rissman, T. A., Elleman, R., Ferrare, R. A., Turner, D., Flynn, C., Wang, J., Ogren, J., Hudson, J., Jonsson, H. H., VanReken, T., Flagan, R. C., and Seinfeld, J. H.: Use of in situ cloud condensation nuclei, extinction, and aerosol size distribution measurements to test a method for retrieving cloud condensation nuclei profiles from surface measurements, J. Geophys. Res.-Atmos., 111, D05S10, https://doi.org/10.1029/2004jd005752, 2006.
Grange, S. K., Carslaw, D. C., Lewis, A. C., Boleti, E., and Hueglin, C.: Random forest meteorological normalisation models for Swiss PM10 trend analysis, Atmos. Chem. Phys., 18, 6223–6239, https://doi.org/10.5194/acp-18-6223-2018, 2018.
Haarig, M., Ansmann, A., Gasteiger, J., Kandler, K., Althausen, D., Baars, H., Radenz, M., and Farrell, D. A.: Dry versus wet marine particle optical properties: RH dependence of depolarization ratio, backscatter, and extinction from multiwavelength lidar measurements during SALTRACE, Atmos. Chem. Phys., 17, 14199–14217, https://doi.org/10.5194/acp-17-14199-2017, 2017.
Hudson, J. G.: Variability of the relationship between particle size and cloud-nucleating ability, Geophys. Res. Lett., 34, L08801, https://doi.org/10.1029/2006GL028850, 2007.
Immitzer, M., Atzberger, C., and Koukal, T.: Tree Species Classification with Random Forest Using Very High Spatial Resolution 8-Band WorldView-2 Satellite Data, Remote Sens., 4, 2661–2693, https://doi.org/10.3390/rs4092661, 2012.
Kasten, F.: Visibility forecast in the phase of pre-condensation, Tellus, 21, 631–635, https://doi.org/10.3402/tellusa.v21i5.10112, 1969.
Komppula, M., Mielonen, T., Arola, A., Korhonen, K., Lihavainen, H., Hyvärinen, A.-P., Baars, H., Engelmann, R., Althausen, D., Ansmann, A., Müller, D., Panwar, T. S., Hooda, R. K., Sharma, V. P., Kerminen, V.-M., Lehtinen, K. E. J., and Viisanen, Y.: Technical Note: One year of Raman-lidar measurements in Gual Pahari EUCAARI site close to New Delhi in India – Seasonal characteristics of the aerosol vertical structure, Atmos. Chem. Phys., 12, 4513–4524, https://doi.org/10.5194/acp-12-4513-2012, 2012.
Kotsiantis, S. B.: Decision trees: a recent overview, Artif. Intell. Rev., 39, 261–283, https://doi.org/10.1007/s10462-011-9272-4, 2013.
Kuang, Y., Zhao, C., Tao, J., Bian, Y., Ma, N., and Zhao, G.: A novel method for deriving the aerosol hygroscopicity parameter based only on measurements from a humidified nephelometer system, Atmos. Chem. Phys., 17, 6651–6662, https://doi.org/10.5194/acp-17-6651-2017, 2017.
Kuang, Y., Zhao, C. S., Zhao, G., Tao, J. C., Xu, W., Ma, N., and Bian, Y. X.: A novel method for calculating ambient aerosol liquid water content based on measurements of a humidified nephelometer system, Atmos. Meas. Tech., 11, 2967–2982, https://doi.org/10.5194/amt-11-2967-2018, 2018.
Li, J., Li, C., Guo, J., Li, J., Tan, W., Kang, L., Chen, D., Song, T., and Liu, L.: Retrieval of aerosol profiles by Raman lidar with dynamic determination of the lidar equation reference height, Atmos. Environ., 199, 252–259, https://doi.org/10.1016/j.atmosenv.2018.11.048, 2019.
Liu, H. J., Zhao, C. S., Nekat, B., Ma, N., Wiedensohler, A., van Pinxteren, D., Spindler, G., Müller, K., and Herrmann, H.: Aerosol hygroscopicity derived from size-segregated chemical composition and its parameterization in the North China Plain, Atmos. Chem. Phys., 14, 2525–2539, https://doi.org/10.5194/acp-14-2525-2014, 2014.
Lv, M., Liu, D., Li, Z., Mao, J., Sun, Y., Wang, Z., Wang, Y., and Xie, C.: Hygroscopic growth of atmospheric aerosol particles based on lidar, radiosonde, and in situ measurements: Case studies from the Xinzhou field campaign, J. Quant.Spectrosc. Ra., 188, 60–70, https://doi.org/10.1016/j.jqsrt.2015.12.029, 2017.
Lv, M., Wang, Z., Li, Z., Luo, T., Ferrare, R., Liu, D., Wu, D., Mao, J., Wan, B., Zhang, F., and Wang, Y.: Retrieval of Cloud Condensation Nuclei Number Concentration Profiles From Lidar Extinction and Backscatter Data, J. Geophys. Res.-Atmos., 123, 6082–6098, https://doi.org/10.1029/2017jd028102, 2018.
Ma, N., Zhao, C. S., Müller, T., Cheng, Y. F., Liu, P. F., Deng, Z. Z., Xu, W. Y., Ran, L., Nekat, B., van Pinxteren, D., Gnauk, T., Müller, K., Herrmann, H., Yan, P., Zhou, X. J., and Wiedensohler, A.: A new method to determine the mixing state of light absorbing carbonaceous using the measured aerosol optical properties and number size distributions, Atmos. Chem. Phys., 12, 2381–2397, https://doi.org/10.5194/acp-12-2381-2012, 2012.
Mamouri, R.-E. and Ansmann, A.: Potential of polarization lidar to provide profiles of CCN- and INP-relevant aerosol parameters, Atmos. Chem. Phys., 16, 5905–5931, https://doi.org/10.5194/acp-16-5905-2016, 2016.
Mattis, I., D'Amico, G., Baars, H., Amodeo, A., Madonna, F., and Iarlori, M.: EARLINET Single Calculus Chain – technical – Part 2: Calculation of optical products, Atmos. Meas. Tech., 9, 3009–3029, https://doi.org/10.5194/amt-9-3009-2016, 2016.
McCoy, D. T., Bender, F. A. M., Mohrmann, J. K. C., Hartmann, D. L., Wood, R., and Grosvenor, D. P.: The global aerosol-cloud first indirect effect estimated using MODIS, MERRA, and AeroCom, J. Geophys. Res.-Atmos., 122, 1779–1796, https://doi.org/10.1002/2016JD026141, 2017.
Müller, D., Böckmann, C., Kolgotin, A., Schneidenbach, L., Chemyakin, E., Rosemann, J., Znak, P., and Romanov, A.: Microphysical particle properties derived from inversion algorithms developed in the framework of EARLINET, Atmos. Meas. Tech., 9, 5007–5035, https://doi.org/10.5194/amt-9-5007-2016, 2016.
Pahlow, M., Feingold, G., Jefferson, A., Andrews, E., Ogren, J. A., Wang, J., Lee, Y. N., Ferrare, R. A., and Turner, D. D.: Comparison between lidar and nephelometer measurements of aerosol hygroscopicity at the Southern Great Plains Atmospheric Radiation Measurement site, J. Geophys. Res. Atmos., 111, D05S15, https://doi.org/10.1029/2004JD005646, 2006.
Petters, M. D. and Kreidenweis, S. M.: A single parameter representation of hygroscopic growth and cloud condensation nucleus activity, Atmos. Chem. Phys., 7, 1961–1971, https://doi.org/10.5194/acp-7-1961-2007, 2007.
Rosati, B., Herrmann, E., Bucci, S., Fierli, F., Cairo, F., Gysel, M., Tillmann, R., Größ, J., Gobbi, G. P., Di Liberto, L., Di Donfrancesco, G., Wiedensohler, A., Weingartner, E., Virtanen, A., Mentel, T. F., and Baltensperger, U.: Studying the vertical aerosol extinction coefficient by comparing in situ airborne data and elastic backscatter lidar, Atmos. Chem. Phys., 16, 4539–4554, https://doi.org/10.5194/acp-16-4539-2016, 2016.
Rosenfeld, D., Andreae, M. O., Asmi, A., Chin, M., de Leeuw, G., Donovan, D. P., Kahn, R., Kinne, S., Kivekäs, N., Kulmala, M., Lau, W., Schmidt, K. S., Suni, T., Wagner, T., Wild, M., and Quaas, J.: Global observations of aerosol-cloud-precipitation-climate interactions, Rev. Geophys., 52, 750–808, https://doi.org/10.1002/2013RG000441, 2014.
Rosenfeld, D., Zheng, Y., Hashimshoni, E., Pohlker, M. L., Jefferson, A., Pohlker, C., Yu, X., Zhu, Y., Liu, G., Yue, Z., Fischman, B., Li, Z., Giguzin, D., Goren, T., Artaxo, P., Barbosa, H. M., Poschl, U., and Andreae, M. O.: Satellite retrieval of cloud condensation nuclei concentrations by using clouds as CCN chambers, P. Natl. Acad. Sci. USA, 113, 5828–5834, https://doi.org/10.1073/pnas.1514044113, 2016.
Schmale, J., Henning, S., Decesari, S., Henzing, B., Keskinen, H., Sellegri, K., Ovadnevaite, J., Pöhlker, M. L., Brito, J., Bougiatioti, A., Kristensson, A., Kalivitis, N., Stavroulas, I., Carbone, S., Jefferson, A., Park, M., Schlag, P., Iwamoto, Y., Aalto, P., Äijälä, M., Bukowiecki, N., Ehn, M., Frank, G., Fröhlich, R., Frumau, A., Herrmann, E., Herrmann, H., Holzinger, R., Kos, G., Kulmala, M., Mihalopoulos, N., Nenes, A., O'Dowd, C., Petäjä, T., Picard, D., Pöhlker, C., Pöschl, U., Poulain, L., Prévôt, A. S. H., Swietlicki, E., Andreae, M. O., Artaxo, P., Wiedensohler, A., Ogren, J., Matsuki, A., Yum, S. S., Stratmann, F., Baltensperger, U., and Gysel, M.: Long-term cloud condensation nuclei number concentration, particle number size distribution and chemical composition measurements at regionally representative observatories, Atmos. Chem. Phys., 18, 2853–2881, https://doi.org/10.5194/acp-18-2853-2018, 2018.
Seinfeld, J. H., Bretherton, C., Carslaw, K. S., Coe, H., DeMott, P. J., Dunlea, E. J., Feingold, G., Ghan, S., Guenther, A. B., Kahn, R., Kraucunas, I., Kreidenweis, S. M., Molina, M. J., Nenes, A., Penner, J. E., Prather, K. A., Ramanathan, V., Ramaswamy, V., Rasch, P. J., Ravishankara, A. R., Rosenfeld, D., Stephens, G., and Wood, R.: Improving our fundamental understanding of the role of aerosol-cloud interactions in the climate system, P. Natl. Acad. Sci. USA, 113, 5781–5790, https://doi.org/10.1073/pnas.1514043113, 2016.
Sun, T., Che, H., Qi, B., Wang, Y., Dong, Y., Xia, X., Wang, H., Gui, K., Zheng, Y., Zhao, H., Ma, Q., Du, R., and Zhang, X.: Aerosol optical characteristics and their vertical distributions under enhanced haze pollution events: effect of the regional transport of different aerosol types over eastern China, Atmos. Chem. Phys., 18, 2949–2971, https://doi.org/10.5194/acp-18-2949-2018, 2018.
Tan, W., Zhao, G., Yu, Y., Li, C., Li, J., Kang, L., and Zhao, C.: Dataset for “Method to retrieve cloud condensation nuclei number concentrations using lidar measurements”, Data set, Atmospheric Measurement Techniques, Zenodo, https://doi.org/10.5281/zenodo.3255086, 2019.
Tao, J., Zhao, C., Ma, N., and Kuang, Y.: Consistency and applicability of parameterization schemes for the size-resolved aerosol activation ratio based on field measurements in the North China Plain, Atmos. Environ., 173, 316–324, https://doi.org/10.1016/j.atmosenv.2017.11.021, 2018a.
Tao, J., Zhao, C., Kuang, Y., Zhao, G., Shen, C., Yu, Y., Bian, Y., and Xu, W.: A new method for calculating number concentrations of cloud condensation nuclei based on measurements of a three-wavelength humidified nephelometer system, Atmos. Meas. Tech., 11, 895–906, https://doi.org/10.5194/amt-11-895-2018, 2018b.
Titos, G., Cazorla, A., Zieger, P., Andrews, E., Lyamani, H., Granados-Muñoz, M. J., Olmo, F. J., and Alados-Arboledas, L.: Effect of hygroscopic growth on the aerosol light-scattering coefficient: A review of measurements, techniques and error sources, Atmos. Environ., 141, 494–507, https://doi.org/10.1016/j.atmosenv.2016.07.021, 2016.
Tong, W., Hong, H., Fang, H., Xie, Q., and Perkins, R.: Decision Forest:? Combining the Predictions of Multiple Independent Decision Tree Models, J. Chem. Inf. Comp. Sci., 43, 525ßß531, https://doi.org/10.1021/ci020058s, 2003.
Wang, Q., Li, Z., Guo, J., Zhao, C., and Cribb, M.: The climate impact of aerosols on the lightning flash rate: is it detectable from long-term measurements?, Atmos. Chem. Phys., 18, 12797–12816, https://doi.org/10.5194/acp-18-12797-2018, 2018.
Wex, H., Neusüß, C., Wendisch, M., Stratmann, F., Koziar, C., Keil, A., Wiedensohler, A., and Ebert, M.: Particle scattering, backscattering, and absorption coefficients: An in situ closure and sensitivity study, J. Geophys. Res.-Atmos., 107, LAC4-1-LAC4-18, https://doi.org/10.1029/2000JD000234, 2002.
Wulfmeyer, V. and Feingold, G.: On the relationship between relative humidity and particle backscattering coefficient in the marine boundary layer determined with differential absorption lidar, J. Geophys. Res.-Atmos., 105, 4729–4741, https://doi.org/10.1029/1999JD901030, 2000.
Xu, W. Y., Zhao, C. S., Ran, L., Deng, Z. Z., Liu, P. F., Ma, N., Lin, W. L., Xu, X. B., Yan, P., He, X., Yu, J., Liang, W. D., and Chen, L. L.: Characteristics of pollutants and their correlation to meteorological conditions at a suburban site in the North China Plain, Atmos. Chem. Phys., 11, 4353–4369, https://doi.org/10.5194/acp-11-4353-2011, 2011.
Xu, X., Guo, X., Zhao, T., An, X., Zhao, Y., Quan, J., Mao, F., Gao, Y., Cheng, X., Zhu, W., and Wang, Y.: Are precipitation anomalies associated with aerosol variations over eastern China?, Atmos. Chem. Phys., 17, 8011–8019, https://doi.org/10.5194/acp-17-8011-2017, 2017.
Yu, Y., Zhao, C., Kuang, Y., Tao, J., Zhao, G., Shen, C., and Xu, W.: A parameterization for the light scattering enhancement factor with aerosol chemical compositions, Atmos. Environ., 191, 370–377, https://doi.org/10.1016/j.atmosenv.2018.08.016, 2018.
Zhang, F., Wang, Y., Peng, J., Ren, J., Collins, D., Zhang, R., Sun, Y., Yang, X., and Li, Z.: Uncertainty in Predicting CCN Activity of Aged and Primary Aerosols, J. Geophys. Res.-Atmos., 122, 11723–11736, https://doi.org/10.1002/2017jd027058, 2017.
Zhao, G., Zhao, C., Kuang, Y., Tao, J., Tan, W., Bian, Y., Li, J., and Li, C.: Impact of aerosol hygroscopic growth on retrieving aerosol extinction coefficient profiles from elastic-backscatter lidar signals, Atmos. Chem. Phys., 17, 12133–12143, https://doi.org/10.5194/acp-17-12133-2017, 2017.
Zhou, X., Ackerman, A. S., Fridlind, A. M., Wood, R., and Kollias, P.: Impacts of solar-absorbing aerosol layers on the transition of stratocumulus to trade cumulus clouds, Atmos. Chem. Phys., 17, 12725–12742, https://doi.org/10.5194/acp-17-12725-2017, 2017.