the Creative Commons Attribution 4.0 License.
the Creative Commons Attribution 4.0 License.
 | 24 Oct 2019
Potential of next-generation imaging spectrometers to detect and quantify methane point sources from space
Daniel H. Cusworth
Daniel J. Jacob
Daniel J. Varon
Christopher Chan Miller
Xiong Liu
Kelly Chance
Andrew K. Thorpe
Riley M. Duren
Charles E. Miller
David R. Thompson
Christian Frankenberg
Luis Guanter
Cynthia A. Randles
We examine the potential for global detection of methane plumes from individual point sources with the new generation of spaceborne imaging spectrometers (EnMAP, PRISMA, EMIT, SBG, CHIME) scheduled for launch in 2019–2025. These instruments are designed to map the Earth's surface at high spatial resolution (30 m×30 m) and have a spectral resolution of 7–10 nm in the 2200–2400 nm band that should also allow useful detection of atmospheric methane. We simulate scenes viewed by EnMAP (10 nm spectral resolution, 180 signal-to-noise ratio) using the EnMAP end-to-end simulation tool with superimposed methane plumes generated by large-eddy simulations. We retrieve atmospheric methane and surface reflectivity for these scenes using the IMAP-DOAS optimal estimation algorithm. We find an EnMAP precision of 3 %–7 % for atmospheric methane depending on surface type. This allows effective single-pass detection of methane point sources as small as 100 kg h−1 depending on surface brightness, surface homogeneity, and wind speed. Successful retrievals over very heterogeneous surfaces such as an urban mosaic require finer spectral resolution. We tested the EnMAP capability with actual plume observations over oil/gas fields in California from the Airborne Visible/Infrared Imaging Spectrometer – Next Generation (AVIRIS-NG) sensor (3 m×3 m pixel resolution, 5 nm spectral resolution, SNR 200–400), by spectrally and spatially downsampling the AVIRIS-NG data to match EnMAP instrument specifications. Results confirm that EnMAP can successfully detect point sources of ∼100 kg h−1 over bright surfaces. Source rates inferred with a generic integrated mass enhancement (IME) algorithm were lower for EnMAP than for AVIRIS-NG. Better agreement may be achieved with a more customized IME algorithm. Our results suggest that imaging spectrometers in space could play an important role in the future for quantifying methane emissions from point sources worldwide.
- Article
(4298 KB) - Full-text XML
- BibTeX
- EndNote


Methane is a powerful greenhouse gas, but the quantification of sources is highly uncertain. Better quantification is critical for developing strategies to reduce atmospheric methane levels. Anthropogenic emissions originate from a very large number of point sources (coal mine vents, oil/gas facilities, confined livestock operations, landfills, wastewater treatment plants) that are individually small, spatially clustered, temporally variable, and difficult to quantify (Allen et al., 2013; Frankenberg et al., 2016). Here we investigate the potential of new-generation satellite instruments designed to map the Earth's surface at high spatial resolution (imaging spectrometers) to also detect individual methane plumes in the shortwave infrared (SWIR) and from there to quantify the corresponding methane point sources.
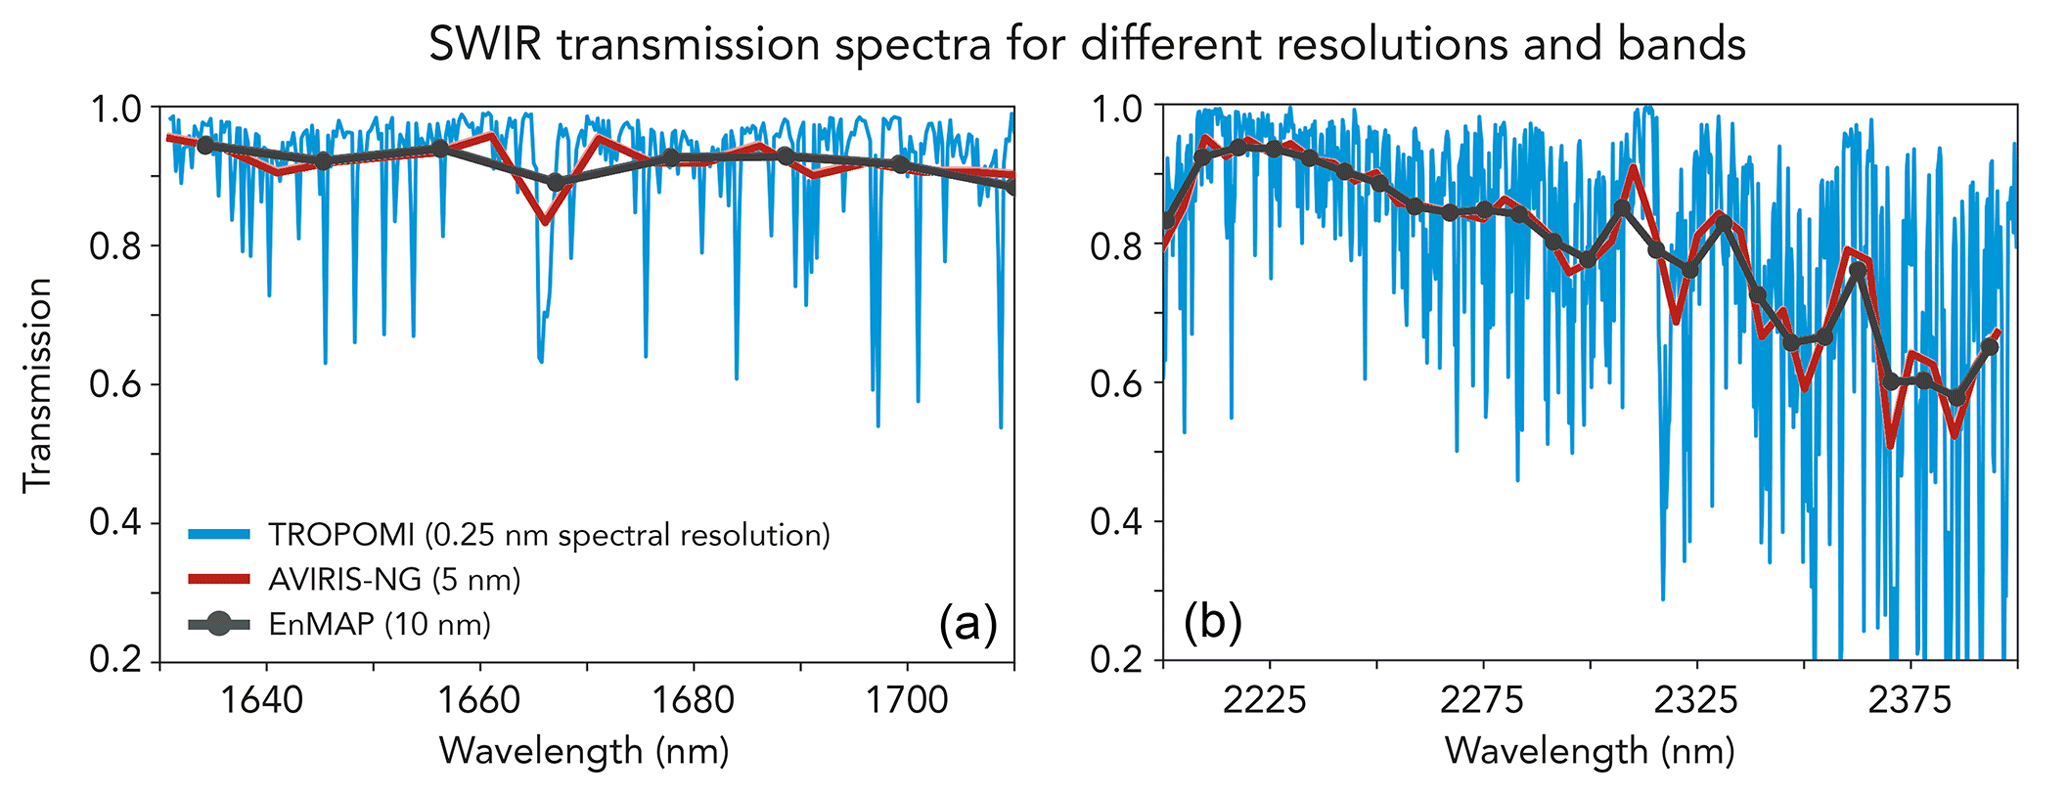
Figure 1Simulated top-of-atmosphere (TOA) transmission spectra for different spectral resolutions (FWHM: full width at half maximum) in the 1650 (a) and 2300 nm (b) shortwave infrared (SWIR) bands. High-resolution spectra were simulated for the US Standard Atmosphere with 1800 ppb total column methane using the HITRAN spectroscopic database and the HITRAN Application Programming Interface (HAPI) tool (Kochanov et al., 2016), and they were then sampled with spectral resolutions of 0.25 nm (TROPOMI), 5 nm (AVIRIS-NG), and 10 nm (EnMAP) at the appropriate wavelength positions.
There has been considerable interest in using SWIR satellite observations of atmospheric methane columns by solar backscatter to detect methane sources and test emission inventories (Jacob et al., 2016). These observations are traditionally made by atmospheric sensors with high spectral resolution (< 1 nm) to capture the fine structure of methane rovibrational absorption features (Table 1). The requirement of high spectral resolution has generally forced a coarse pixel resolution (> 1 km) to achieve satisfactory signal-to-noise ratios (SNRs), but this limits the ability to identify, locate, and quantify individual point sources. Inverse analyses of observations from the SCIAMACHY instrument with 60 km pixel resolution, and from the Greenhouse Gases Observing Satellite (GOSAT) instrument with sparse sampling at 10 km pixel resolution, have quantified emissions over regional scales (Bergamaschi et al., 2009; Kort et al., 2014; Turner et al., 2015). The recently launched TROPOMI instrument with global daily coverage at 7 km nadir pixel resolution (Hu et al., 2018) will refine the regional characterization but still cannot resolve point sources (Sheng et al., 2018). Planned instruments with ∼1 km pixel resolution (MethaneSat, CEOS, 2018; Geo-FTS, Xi et al., 2015) should be able to detect large point sources after inversion of several days of observations (Cusworth et al., 2018; Turner et al., 2018) but would not resolve densely clustered or temporally variable sources.
Table 1Shortwave infrared (SWIR) remote sensors for observing methane point sources.
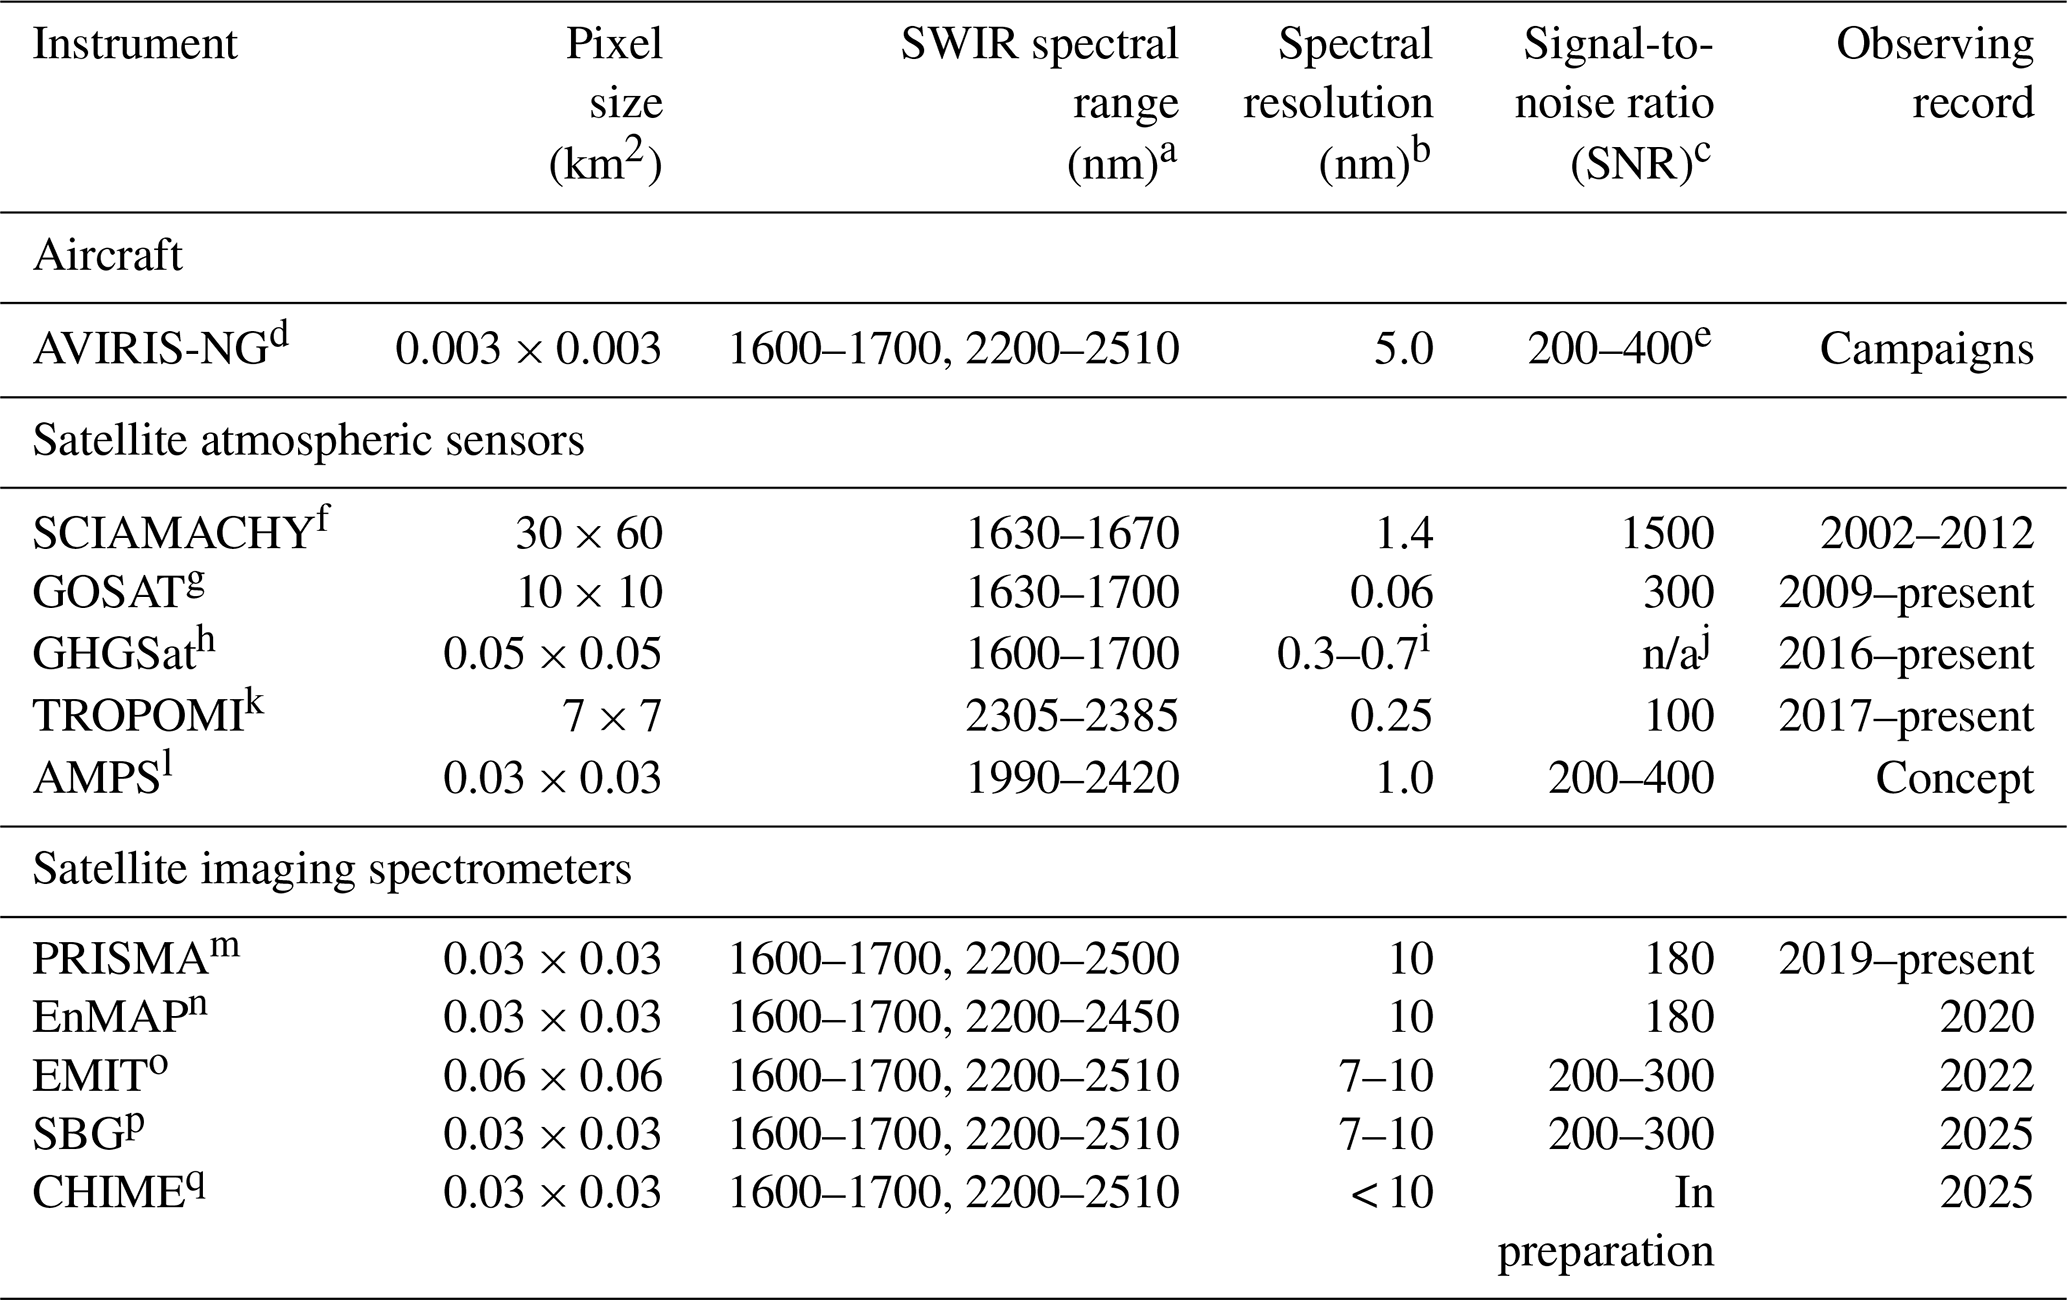
a Methane has absorption bands around 1650 and 2300 nm (Fig. 1). b Spectral resolution is represented by the full width at half maximum (FWHM). c For SCIAMACHY and GOSAT, SNR is for the CO2 band used in the CO2 proxy method retrieval. For other instruments, SNR is at 2300 nm. SNR estimates are for a reference 30∘ solar zenith angle and 0.3 surface reflectivity with clear sky. d Airborne Visible/Infrared Imaging Spectrometer – Next Generation (Thorpe et al., 2017). AVIRIS-NG provides roughly a ground sampling distance (GSD) of 1 m per kilometer altitude. The Frankenberg et al. (2016) and Duren et al. (2019) campaigns operated at 3–4 km altitude. e Along-track oversampling increases SNR by , where N is the number of along-track frames. AVIRIS-NG typically has N > 4 so AVIRIS-NG effective SNR at 2300 nm can be as much as 400. f SCanning Imaging Absorption SpectroMeter for Atmospheric CHartographY (Frankenberg et al., 2006). g TANSO-FTS instrument aboard the Greenhouse Gases Observing Satellite (Kuze et al., 2016). Pixels are circles of 10 km diameter separated by about 250 km along track and cross track. h GreenHouse Gases Satellite (McKeever et al., 2017). i GHGSat SNR is not comparable to other missions due to difference in instrument concept. j Spectral resolution differs on the demonstration instrument GHGSat-D vs. upcoming missions GHGSat-C1 and C2. k TROPOspheric Monitoring Instrument (Hu et al., 2018). l Airborne Methane Plume Spectrometer (Thorpe et al., 2016). m PRecursore IperSpettrale della Missione Applicativa (http://prisma-i.it, Loizzo et al., 2018). n Environmental Mapping and Analysis Program (Guanter et al., 2015). o Earth Surface Mineral Dust Source Investigation (Green et al., 2018). p Surface Biology and Geology, previously called HyspIRI (Hochberg et al., 2015). q Copernicus Hyperspectral Imaging Mission for the Environment (Nieke and Rast, 2018). n/a: not applicable.
Space-based methane sensors have previously focused on achieving high precision (< 1 %) and low relative bias (< 0.3 %) for measurements of the dry air column methane mixing ratio (), as is appropriate for regional characterization of sources (Buchwitz et al., 2015). However, these requirements can be relaxed if the focus is to observe individual plumes. Precision can be traded for pixel resolution because methane plumes are generally subkilometer in scale (Frankenberg et al., 2016), so that plume enhancements are larger when the pixel resolution is finer (Jacob et al., 2016). Bias may not be an issue if the plume enhancement is referenced to the local background. Two commercial instruments, GHGSat and Bluefield Technologies, have recently been developed to observe individual methane plumes (CEOS, 2018). The GHGSat instrument samples selected 12 km×12 km scenes with 50 m×50 m effective pixel resolution (McKeever et al., 2017). A demonstration GHGSat instrument (GHGSat-D) launched in 2016, with an estimated precision of about 13 %, has proven able to detect large point sources in excess of 1000 kg h−1 (Varon et al., 2018a).
Here we examine the potential of a different class of satellite instruments, imaging spectrometers, to detect and quantify individual methane point sources. These instruments are designed for global land surface measurements, but they may be repurposed for nonoptimal methane remote sensing. They have fine pixel resolution (< 100 m), with much coarser spectral resolution than atmospheric sensors because surface reflectance spectra are relatively smooth. Some current imagers such as Landsat (Roy et al., 2014) and WorldView-3 (http://worldview3.digitalglobe.com, last access: 18 October 2019) have observing bands in the SWIR to retrieve soil moisture, mineral composition, and vegetation traits (Cleemput et al., 2018). However, the SWIR spectral resolutions for Landsat (100 nm) and WorldView-3 (40–50 nm) are too coarse to usefully resolve methane absorption features. The Hyperion instrument on board NASA Earth Observing-1 had a 10 nm spectral resolution in the SWIR but a low signal-to-noise ratio (SNR) of 20 (Folkman et al., 2001). Hyperion was able to detect the massive Aliso Canyon methane blowout (Thompson et al., 2016), but its SNR is too low for detection of smaller point sources.
A new generation of imaging spectrometers set for launch over the next decade (EnMAP, PRISMA, EMIT, and the anticipated SBG and CHIME investigations) will achieve ∼10 nm or better spectral resolution in the SWIR with a pixel resolution in the range 30–60 m and SNR of 180–400 or beyond (Table 1). Experience with airborne imaging spectrometers of comparable specifications suggests that these satellite instruments should be able to observe methane plumes from moderate to large sources. The Airborne Visible/Infrared Imaging Spectrometer (AVIRIS-C), with a 10 nm spectral resolution and SNR of 70 (Green et al., 1998), was able together with Hyperion to detect the massive Aliso Canyon methane leak in California (Thompson et al., 2016). The next generation AVIRIS instrument (AVIRIS-NG), with a finer spectral resolution of 5 nm and SNR of 200 (Thorpe et al., 2014), was able to detect a range of methane plumes over the Four Corners region of New Mexico, including from gas-processing facilities, storage tanks, pipeline leaks, well pads, and coal mine venting shafts (Frankenberg et al., 2016). AVIRIS-NG has since been flown over 272000 potential methane-emitting point sources in California between 2016 and 2018 (CARB, 2017; Duren et al., 2019).
Table 1 presents the next generation of spaceborne imaging spectrometers. These include the Italian Space Agency's PRecursore IperSpettrale della Missione Applicativa (PRISMA; Loizzo et al., 2018), launched in March 2019; the German Space Agency's Environmental Mapping and Analysis Program (EnMAP; Guanter et al., 2015), scheduled for launch in 2020; NASA's Earth Surface Mineral Dust Source Investigation (EMIT; Green et al., 2018), scheduled for launch to the International Space Station in 2022; and NASA's Surface Biology and Geology (SBG; Hochberg et al., 2015) and the European Space Agency's Copernicus Hyperspectral Imaging Mission for the Environment (CHIME; Nieke and Rast, 2018), both of which target launch readiness in the mid-2020s. We will focus our baseline analysis on EnMAP, for which detailed documentation is available (Guanter et al., 2015), and examine other instruments through sensitivity analyses. EnMAP is a push-broom-style instrument with 10 nm resolution in the SWIR and an expected 180 SNR at 2300 nm. PRISMA has very similar instrument specifications to EnMAP (Loizzo et al., 2018). The EMIT instrument is slated to have a 7–10 nm spectral resolution and 60 m pixel resolution (Green et al., 2018). Other investigations, such as SBG, are called for in the NASA Earth Science and Applications Decadal Survey (National Academies, 2018). The Airborne Methane Plume Spectrometer (AMPS) instrument concept would be tailored specifically for methane detection and have 1 nm SWIR spectral resolution with 30 m pixel resolution (Thorpe et al., 2016).
Figure 1 shows simulated transmission spectra in the weak (∼1650 nm) and strong (∼2300 nm) SWIR methane absorption bands at the spectral resolutions of TROPOMI (0.25 nm full width at half maximum, FWHM), AVIRIS-NG (5 nm), and EnMAP (10 nm). EnMAP spectra are sampled following the precise wavelength positions given in Guanter et al. (2015). The 1650 nm methane band has the advantage of being near a CO2 band, so that joint retrievals of methane and CO2 can be combined with independent knowledge of the CO2 column mixing ratio to remove joint errors in surface reflectivity and atmospheric scattering (the so-called “CO2 proxy” method; Frankenberg et al., 2005a). However, the 1650 nm band is much weaker than the 2300 nm band and only the 2ν Q branch can be detected at the EnMAP spectral resolution. Sampling the transmission spectra at the EnMAP spectral resolution yields only 8 data points in the 1650 nm band as compared to 25 in the 2300 nm band. The 2300 nm band also exhibits more resolved structure. Our early attempts to use the CO2 proxy method in the 1650 nm band with EnMAP synthetic spectra were unsuccessful. In what follows we focus on the 2300 nm band as sampled in the useful 2210–2410 nm range.
We examined the sensitivity of EnMAP to atmospheric methane by generating synthetic top-of-atmosphere (TOA) EnMAP scenes with added methane plumes over a variety of surface types. We used for this purpose the EnMAP end-to-end simulation tool (EeteS; Segl, 2012), developed to generate EnMAP TOA solar backscattered spectra with expected instrument error included. EeteS takes surface information from another imaging instrument (e.g., SPOT-5) and passes the image through spatial, atmospheric, spectral, and radiometric modules to generate EnMAP spectra. The atmospheric module is based on the MODTRAN5 radiative transfer code (Berk et al., 2006). It assumes a horizontally invariant 1800 ppb , and here we add methane plumes simulated with the Weather and Research Forecasting Model large-eddy simulation (WRF-LES) at 30 m×30 m resolution (Varon et al., 2018b).
Figure 2 shows a simulated red–blue–green (RBG) EeteS image over Berlin. We consider four scenes within this domain to add WRF-LES methane plumes and perform subsequent retrievals. The scenes are labeled as grass, dark (water), bright, and urban. They have mean SWIR surface reflectances of 0.09, 0.02, 0.30, and 0.13, respectively. The urban scene is highly heterogeneous. The WRF-LES simulation is conducted with 30 m×30 m resolution (the EnMAP pixel resolution), 100 W m−2 sensible heat flux (moderately unstable meteorological conditions), and a mean wind speed of 3.5 m s−1. We generate an ensemble of 15 instantaneous plumes by sampling the WRF-LES simulation at five time slices and for three source rates of 100, 500, and 900 kg h−1. This range is typical of large (but not unusually large) individual point sources (Jacob et al., 2016).
We compute the optical depth of the methane plume τ(λ) at wavelength λ by multiplying HITRAN absorption cross sections (σH; Kochanov et al., 2016) by the methane volume mixing ratio enhancement (ΔVMR) and vertical column density of dry air (VCD) in the 72-layered atmosphere of the MERRA-2 meteorological reanalysis (Gelaro et al., 2017):
Following Beer's law, the plume transmission T(λ) is the negative exponential of τ(λ) weighted by the geometric air mass factor A (AMF) for the backscattered solar radiation:
Each pixel's EeteS radiance spectrum is multiplied by this additional plume transmission. We do not add noise or aerosol effects to the plume transmission spectra because the EeteS scene already accounts for those in the computation of back-scattered radiances, so that multiplying by the additional plume transmission already factors in the corresponding noise. Figure 3 shows an example WRF-LES plume (500 kg h−1 source rate) superimposed over the grass and urban scenes.
We extended our analysis to other new-generation imaging spectrometers of Table 1 by adapting the EnMAP scenes to different spectral resolutions and SNRs. For this purpose, we interpolated EeteS surface radiance spectra to the desired spectral resolution assuming no instrument noise. We then multiplied these radiance spectra by the transmission spectra from the US Standard Atmosphere (Kneizys et al., 1996) with WRF-LES methane plumes added. The SNR values in Table 1 are for a specific reference solar zenith angle (30∘) and reflectivity (0.3), but the EeteS radiometric module produces different noise estimates over different surfaces. Here we took the ratios of SNR values relative to EnMAP from Table 1 and applied these ratios to the EeteS noise fields.
To test our EnMAP retrievals with actual observations, we also downsampled AVIRIS-NG images taken from aircraft over California (CARB, 2017) to match EnMAP spatial resolution and further convolved these spectra with the appropriate Gaussian filter to match EnMAP spectral resolution and wavelength positions (Guanter et al., 2015). AVIRIS-NG flew at 3–4 km above the ground, so we simulated additional extinction at higher altitudes based on the US Standard Atmosphere. We compared the retrieved methane from AVIRIS-NG and the synthetic EnMAP to determine the ability of EnMAP to detect and quantify the methane point sources identified by AVIRIS-NG.
We retrieved methane from the synthetic imaging spectrometer spectra by adapting the iterative maximum a posteriori differential optical absorption spectroscopy (IMAP-DOAS) algorithm developed for AVIRIS (Frankenberg et al., 2005b; Thorpe et al., 2017; Ayasse et al., 2018). DOAS retrievals isolate higher-frequency features resulting from gas absorption from lower-frequency features that include surface reflectance as well as Rayleigh and Mie scattering (Bovensmann et al., 2011). A polynomial term accounts for the low-frequency features (Thorpe et al., 2017).
3.1 State vector
In addition to methane (CH4), the retrieval must account for variable absorption by water vapor (H2O) and nitrous oxide (N2O) over the 2210–2400 nm spectral region. We parameterize low-frequency spectroscopic features as a sum of Legendre polynomials of order k= [0, K] with coefficients ak. The state vector (x) optimized through the retrieval is composed of the following elements:
where s is a scaling factor applied to the column mixing ratio of each gas from the US Standard Atmosphere. We also correct for uncertainty in the instrument's wavelength calibration with a spectral shift parameter, which has been shown in previous studies to reduce wavelength position uncertainty (Thorpe et al., 2017; Frankenberg et al., 2005b). EnMAP has strict requirements of 1 nm spectral calibration accuracy and 0.5 nm spectral stability in the SWIR. Preflight calibration campaigns as well as onboard calibration means will be used to ensure the compliance with those requirements (Guanter et al., 2015). Additional uncaptured uncertainty in spectral shift may worsen retrieved . However, given the strong absorption features across the strong 2300 nm CH4 band, we expect this effect to be small compared other low-frequency features and do not explore this effect further. We do not include aerosols in the retrieval as they play little role at the relevant spatial and spectral resolution (Ayasse et al., 2018). Methane point sources generally do not coemit aerosols.
3.2 Optimal estimation
To retrieve the state vector from the EeteS TOA radiances, we use a forward model similar to previous IMAP-DOAS algorithms (Thorpe et al., 2017; Ayasse et al., 2018), with a modification to the polynomial term for surface reflectance:
Here Fh is the high-resolution backscattered TOA radiance at wavelength λ, I0 is the incident TOA solar intensity, τn,l is the default optical depth from the US Standard Atmosphere for trace gas element n= [1,3] of the state vector at vertical level l= [1,72], sn is the scaling factor to that default optical depth optimized in the retrieval, Pk is the kth Legendre polynomial, and the ak represent coefficients optimized in the retrieval. The optical depth τn,l is computed in the same fashion as Eq. (1), using information from the MERRA-2 reanalysis and HITRAN absorption cross sections. For satellite retrievals, the AMF is a scalar describing the optical path through the atmosphere. In Sect. 4.3, we apply the IMAP-DOAS algorithm to airborne AVIRIS-NG scenes and use a vector-valued AMF that depends on the height of the aircraft.
Previous IMAP-DOAS algorithms used a simple polynomial approximation for the surface reflectance, but here we use Legendre polynomials to exploit their orthogonality. Orthogonal polynomials can potentially constrain surface reflectance with fewer terms, leading to better conditioning of the inverse solution. We find that K=4 provides sufficient spectral resolution, whereas previous applications using simple polynomials required K=6 (Ayasse et al., 2018).
We compute the TOA backscattered radiances Fh(x) over the 2210–2410 nm spectral range at 0.02 nm resolution and assemble these in a vector Fh(x) representing the high-resolution spectrum as simulated by the forward model for a given x. We convolve this spectrum with the instrument FWHM and then sample at the known wavelength positions. For example, for EnMAP, we convolve Fh(x) with a 10 nm FWHM and sample the resulting spectra at EnMAP's 10 nm intervals to get the low-resolution F(x). Since the convolution operator is not linear (Frankenberg et al., 2005b), we also explored performing separate convolutions on the high resolution transmission and polynomial terms in Eq. (3) and then multiplying them together to get F(x). We found little difference in the results between methods.
Observed backscattered TOA radiances (y) can be represented as
where the observational error ϵ is the sum of instrument and forward model errors. As is commonly done for satellite retrievals, we assume that the forward model error is small compared to the instrument error characterized by the SNR. The forward model is nonlinear so that the solution must be obtained iteratively. A Jacobian matrix is calculated for each iteration i of the state vector
and we employ a Gauss–Newton iteration to solve iteratively for the optimal state vector (Rodgers, 2000):
Here SO= [εεT] is the observation error covariance matrix defined by the instrument SNR, xA is the prior estimate of the state vector, and SA is the prior error covariance matrix. We set a weak prior error variance for methane (unitless):
gives information on the error correlation between retrieved methane and surface reflectivity, which is a major concern for methane retrievals (Butz et al., 2012).
3.3 Inferring point source rates from methane plume observations
The plume observations can be related to the corresponding source rates by computing the integrated mass enhancements (IMEs) within the plume mask (Frankenberg et al., 2016; Varon et al., 2018b). Following Varon et al. (2018b), we define the plume for the retrieved scenes with a plume mask that applies median and Gaussian filters to pixels above the 80th percentile of within the scene. These filters help to remove spurious signals surrounding a plume and determine the spatial extent of the plume, which is needed for subsequent calculations. The IME is calculated as
where ΔΩi is the plume mass enhancement in pixel i relative to background (kg m−2), Λi is the corresponding area of the pixel, and the summation is over the N pixels within the plume mask. Here, we define the background as the median within the scene. The point source rate Q is then inferred from the IME as (Varon et al., 2018b)
where is a characteristic plume size and Ueff is an effective wind speed describing the rate of turbulent dissipation of the plume (L∕Ueff is the lifetime of the plume against turbulent dissipation to below the detection limit). Varon et al. (2018b) relate Ueff to the 10 m wind speed (U10) by fitting to WRF-LES simulations. Here we use their relationship derived for the GHGSat instrument with 50 m pixel resolution and 5 % precision:
where Ueff and U10 are in units of meters per second (m s−1). The Ueff–U10 relationship should depend on the instrument pixel resolution and precision, and on the plume masking procedure, which would require customized WRF-LES simulations and fitting. Here we simply apply Eq. (10) to the AVIRIS-NG and EnMAP plumes without further modification. In Sect. 4.3, we do not a priori know the wind speed, and we obtain U10 from the HRRR-Reanalysis at 3 km hourly resolution (https://rapidrefresh.noaa.gov/, Benjamin et al., 2016).
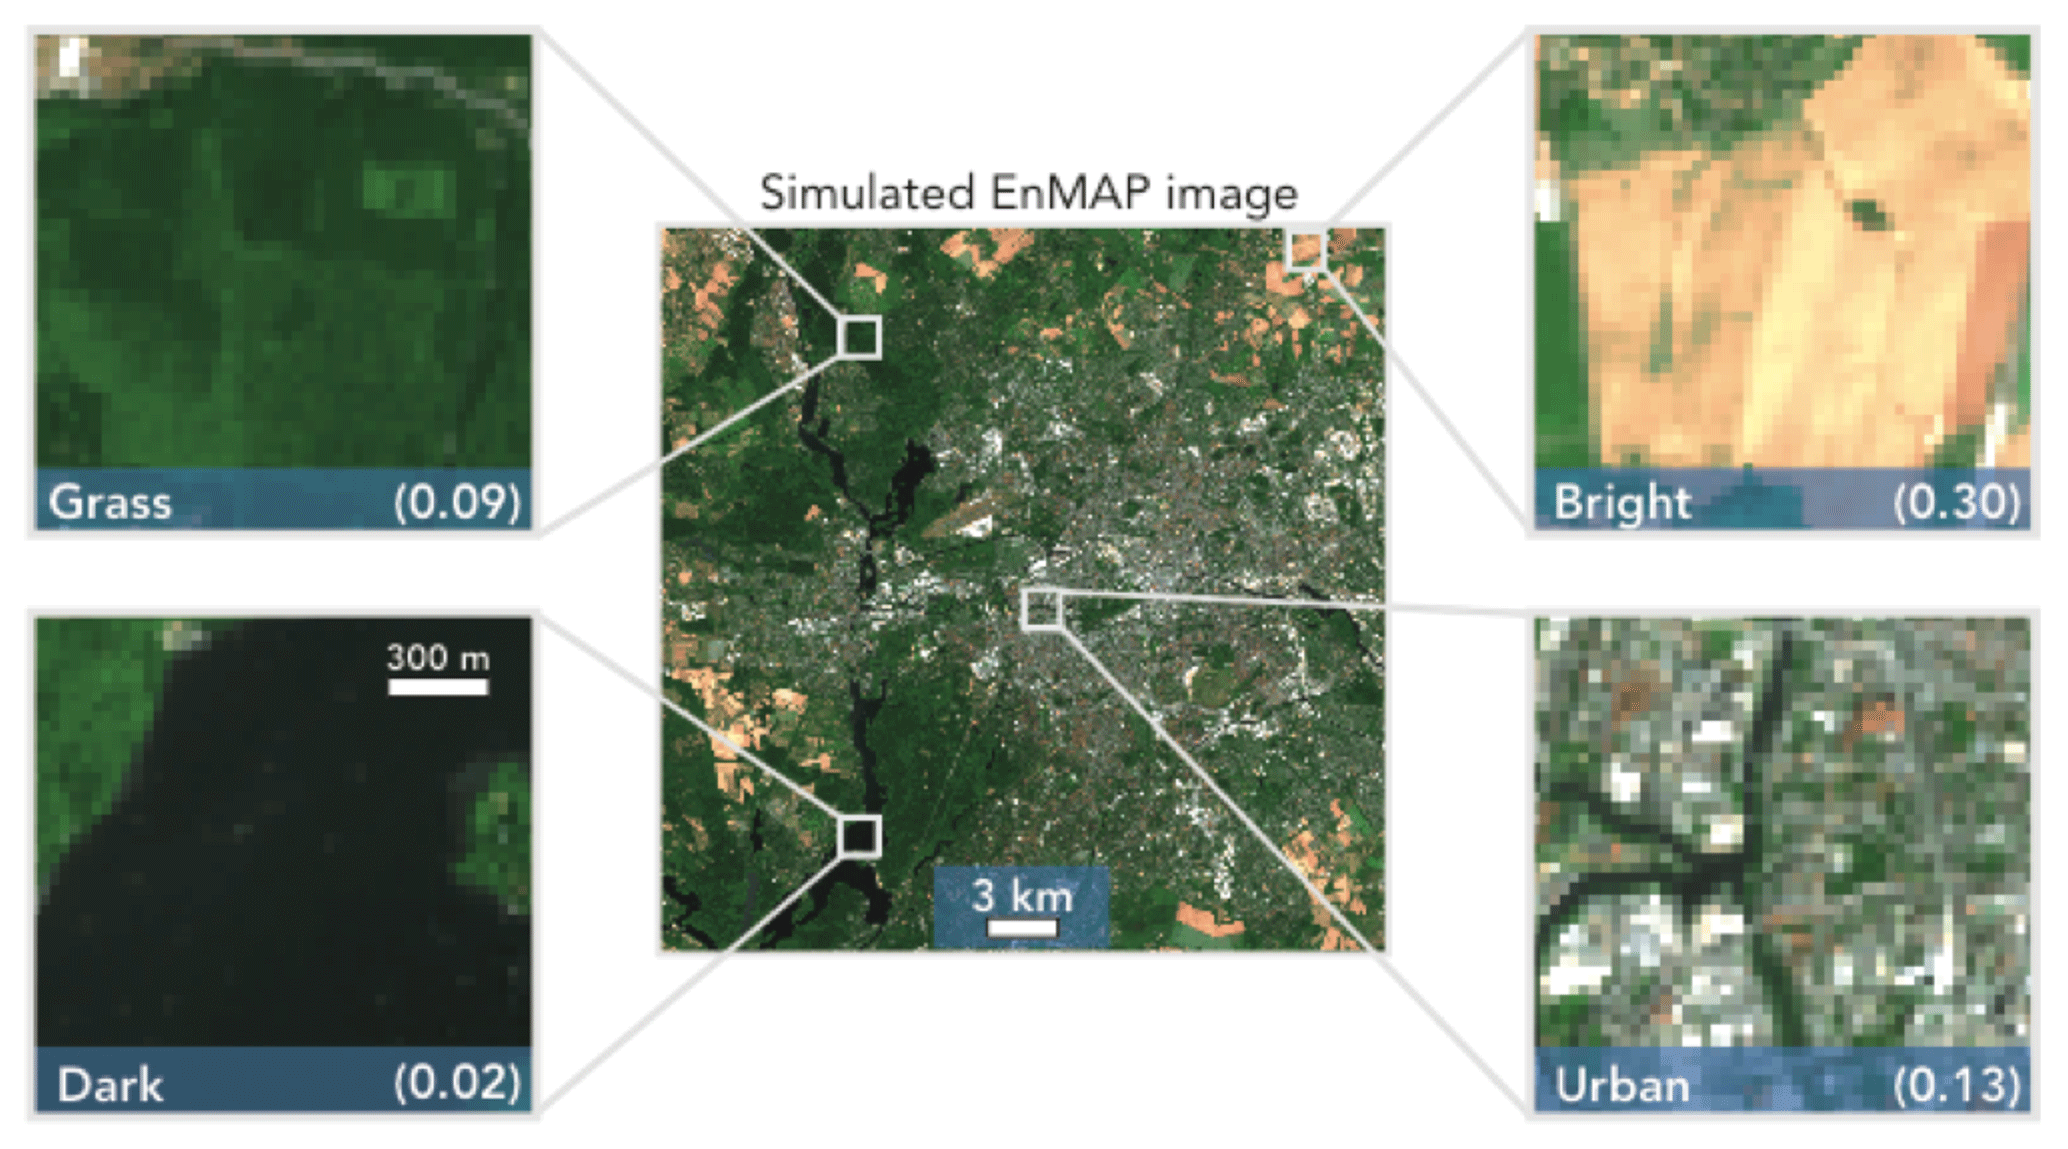
Figure 2RGB image of a synthetic EnMAP scene simulated using the EnMAP end-to-end simulation tool (EeteS) over Berlin. Four scenes with 30 m×30 m pixel resolution are shown (grass, dark, bright, urban) with average surface reflectances in the SWIR (2210–2410 nm) given in parentheses. These different scenes are used in Sect. 3 to evaluate the ability of EnMAP to retrieve atmospheric methane plumes.
4.1 EnMAP plume retrievals over different surfaces
Figure 3 shows examples of the IMAP-DOAS retrievals of 500 and 900 kg h−1 WRF-LES plumes over the grass and urban scenes. The 500 kg h−1 plume is clearly defined in the grass scene near the emission source. It is also detectable in the urban scene but obscured by retrieval artifacts, as some of the variability in surface reflectivity is erroneously retrieved as methane variability. The 900 kg h−1 plume is better captured over both surfaces, though major retrieval artifacts remain in the urban scene.
Varon et al. (2018b) previously estimated the theoretical ability of a satellite instrument to quantify source rates from point sources as a function of instrument precision, assuming a uniform surface reflectance. They concluded that an instrument with 1 %–5 % precision for would be able to quantify point sources with an error of 70–170 kg h−1. Here we characterize the EnMAP instrument precision as the relative residual standard deviation (RRSD) between the true and retrieved column methane concentrations for individual 30 m×30 m pixels in the scenes of Fig. 2 including the WRF-LES plumes. Figure 4 summarizes the results for the four scenes of Fig. 2. We find precisions of 3.5±0.07 % for grass, 7.2±0.1 % for urban, and 2.6±0.08 % for bright scenes. The standard deviations refer to the RRSDs computed for the 15 different realizations of the WRF-LES plumes and for the 3 source rates of 100, 500, and 900 kg h−1. The dark scene was consistently unsuccessful, with error of at least 100 % for each realization, and we do not discuss it further. The bright scene performs the best because of the large backscattered photon flux. The urban scene performs worse than the grass scene, even though its average SWIR surface reflectance is larger, due to the larger variability in reflectance over the scene including dark pixels.

Figure 3Retrieval of a methane plume over grass (a, b, c) and urban (d, e, f) EnMAP scenes. The plume was generated by WRF-LES at 30 m×30 m resolution with a source rate of either 500 kg h−1 or 900 kg h−1. The left panels show the dry air column mixing ratio () enhancements relative to the 1800 ppb background for a 500 kg h−1 methane plume superimposed on the RGB images of Fig. 2. The middle panels show the retrieval of those enhancements using the IMAP-DOAS retrieval algorithm applied to the EnMAP instrument specifications. The right panels show the retrieval of the 900 kg h−1 plume. The enhancements in the right panels are scaled by 5∕9 to be comparable with the other panels. Negative enhancements are reset to equal the background.
We examined the ability of the retrievals to quantify methane point source rates on the basis of the detected plumes, by applying the IME algorithm of Sect. 3.3 to the same ensemble of five WRF-LES plume realizations for each of the three different surfaces and for true source rates 100, 500, and 900 kg h−1. Results are summarized in Table 2. We find that it is possible to quantify source rates as low as 100 kg h−1 for the bright scene and as low as 500 kg h−1 for the grass scene, though the true source rates are underestimated by up to a factor of 2. There could be several factors behind this underestimate, including (1) error correlation with surface reflectivity in the EnMAP retrieval that would cause some loss of the plume and (2) use of the Varon et al. (2018b) Ueff–U10 relationship in Eq. (10) without customization for the EnMAP conditions. As pointed out by Varon et al. (2018b), the Ueff–U10 relationship should be customized to the plume mask definition and to the instrument pixel resolution and precision. This would require an ensemble of WRF-LES simulations specific to the EnMAP conditions and to the plume mask used here. The inability to quantify the 100 kg h−1 plume over the grass scene is properly diagnosed in our retrieval by the failure of the plume mask to detect a plume. However, the surface artifacts in the urban scene lead to spurious retrievals of source rates as the surface features are mistakenly attributed to plumes. This is due to the error correlation between and surface reflectivity (explained in greater detail in Sect. 4.2) and can be diagnosed by inspection of the off-diagonal terms of (Eq. 7).
Table 2True and retrieved point source rates from EnMAP scene simulations with WRF-LES methane plumes.
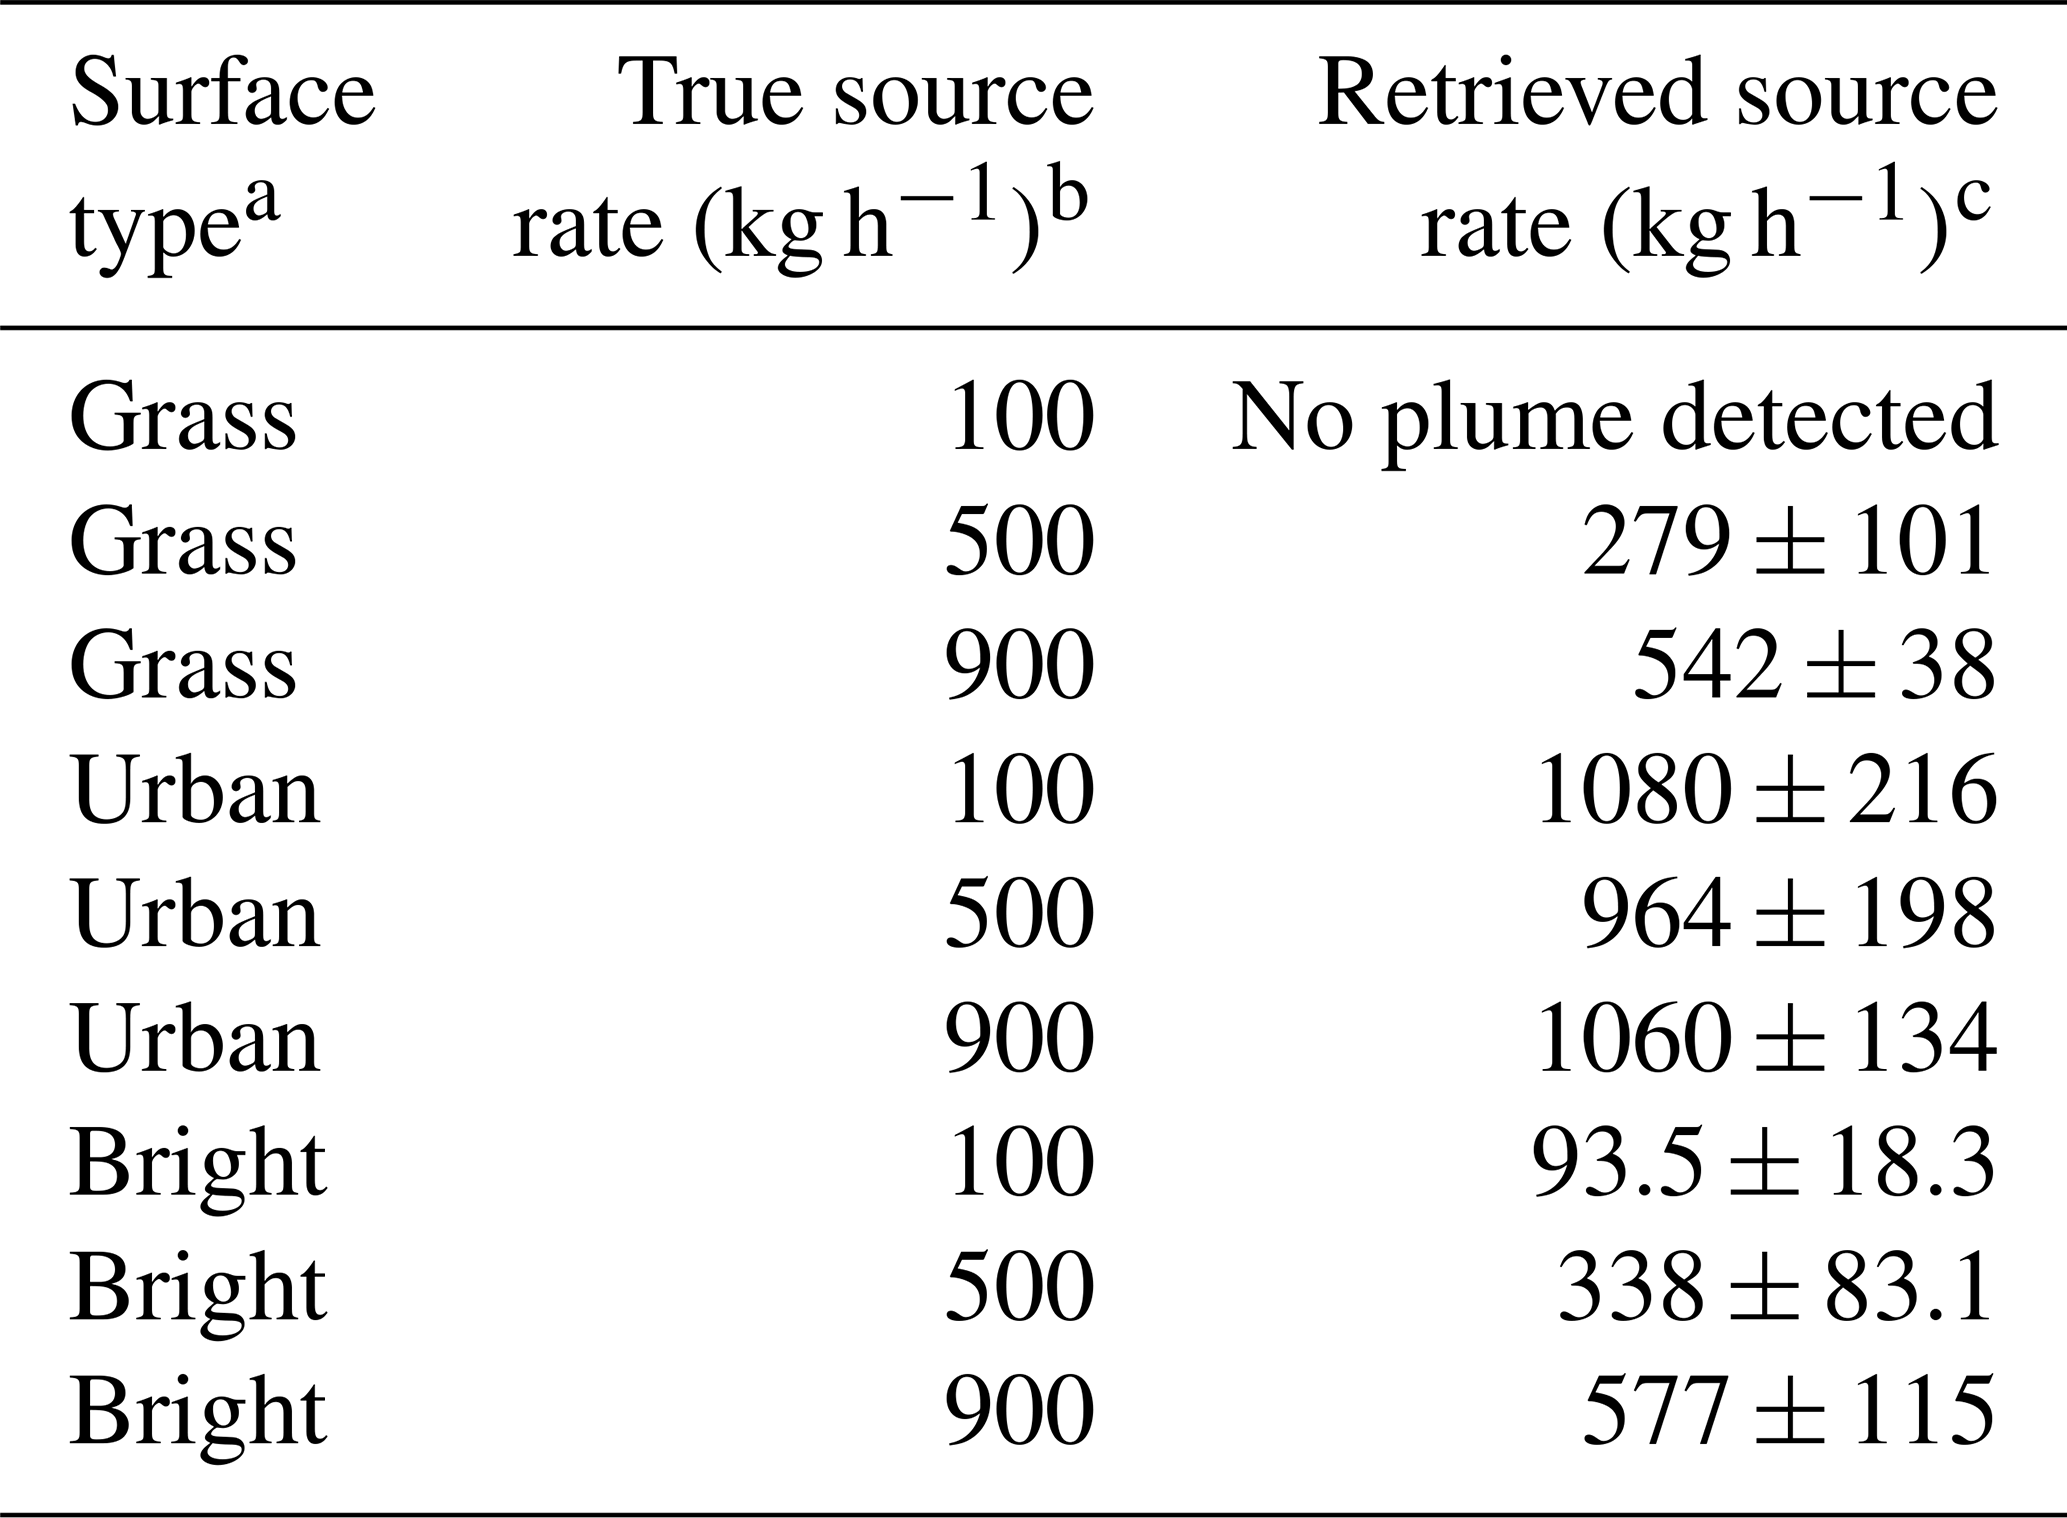
a Surface reflectances determined using the end-to-end simulation tool (EeteS; Fig. 2). b Prescribed in the WRF-LES methane plume simulations (Sect. 2). c Mean and standard deviation of retrieved source rates for five WRF-LES plume realizations.
4.2 Sensitivity to instrument spectral resolution and SNR
We examine the potential of future imaging spectrometers with improved spectral resolution and SNR relative to EnMAP (Table 1) to achieve improved retrievals of point sources. Figure 5 shows the change in the methane retrieval precision as we vary the spectral resolution from 10 to 1 nm and the mean scene-wide SNR from 100 to 500. Specifications of the instruments in Table 1 are identified on the plot. Precision improves as spectral resolution and SNR increase, as expected. The dependencies are not linear, and the contours are concave, meaning that precision is more effectively improved by increasing spectral resolution by a certain factor than by increasing SNR by the same factor. Increasing the spectral resolution improves precision through multiple independent factors: by increasing the number of independent measurements across the useful spectral window; by increasing the effective squared depth of the sharpest methane absorptions, for improved spectral contrast relative to the continuum; and by better resolution of the unique methane absorption shape, which improves discrimination against potential surface confusers.
We saw in Fig. 3 that the inability to decouple surface and methane features at low spectral resolution was a major source of error over inhomogeneous surfaces such as the urban scene. This is manifested in the retrieval by an error correlation between state vector elements (scaling factor for methane column mixing ratios) and ak (coefficients for the surface reflectivity described by Legendre polynomials). This error correlation is described by the posterior error covariance matrix obtained as part of the retrieval (Eq. 7). The bivariate probability density between retrieved and the mean SWIR surface reflectivity can be obtained by summing the error covariances of the Legendre polynomial terms. We find in this manner that the error correlation between and the mean SWIR surface reflectivity for the urban scene decreases between EnMAP () and AMPS (). This is driven by the increase in spectral resolution from 10 to 1 nm. We further find that simply increasing the SNR to 300 (as recommended for SBG) while keeping spectral resolution constant does not improve the error correlation.
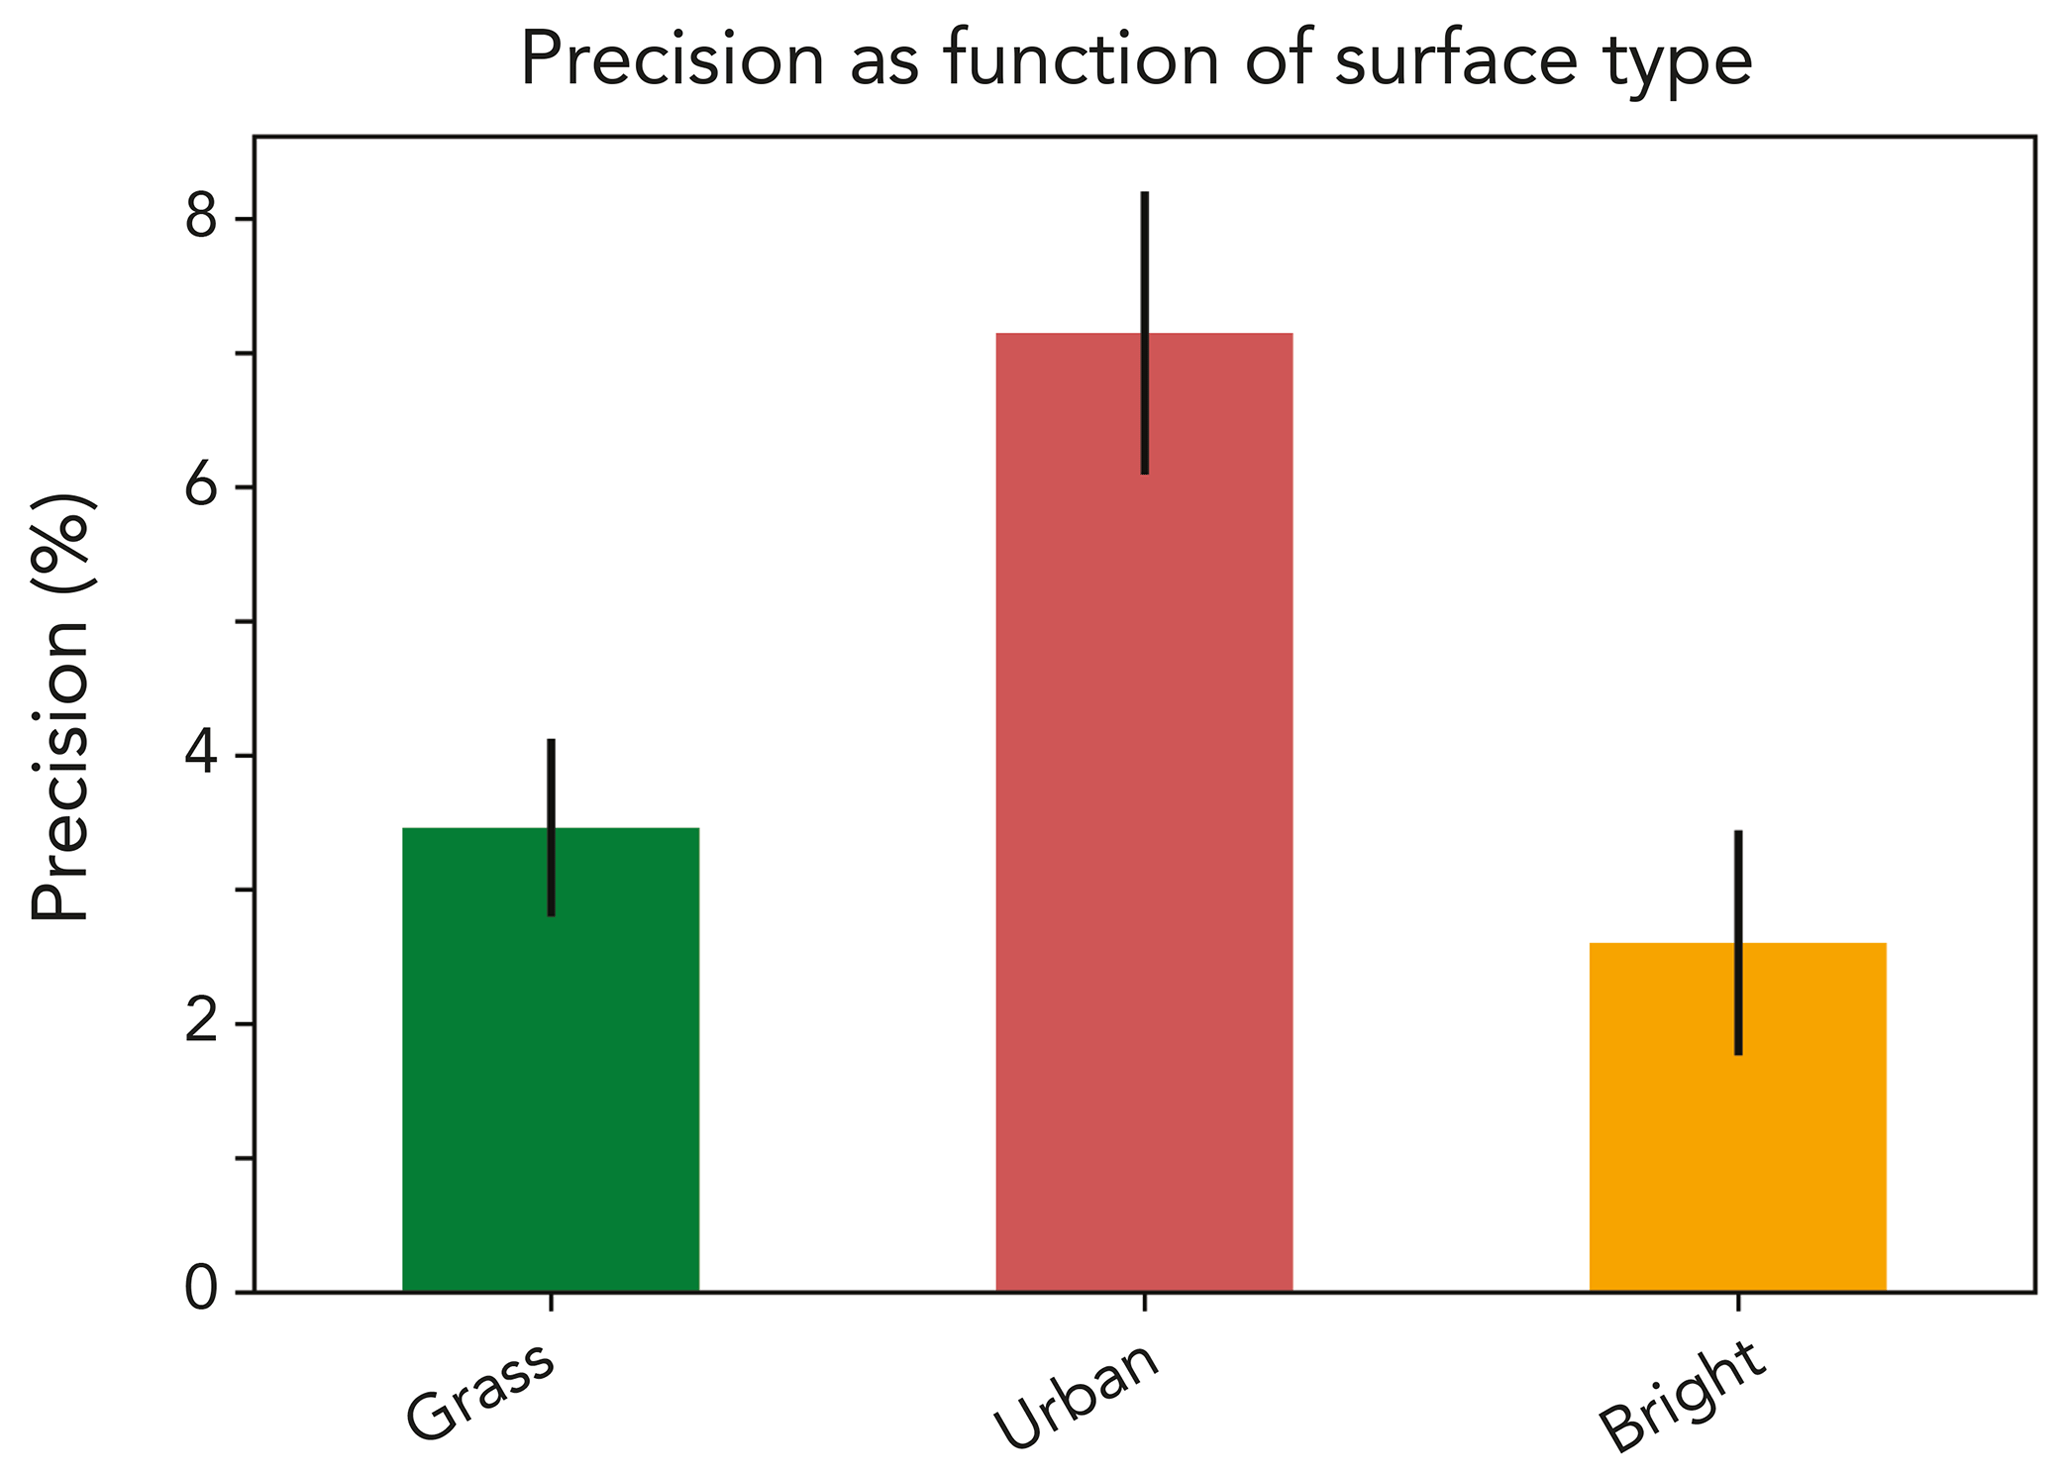
Figure 4Precision of atmospheric methane retrievals from the EnMAP instrument (Table 1) over the grass, urban, and bright surfaces of Fig. 2. Precision is defined as the relative residual standard deviation (RRSD) between the true methane columns in synthetic scenes and values obtained from the IMAP-DOAS retrieval applied to the EnMAP top-of-atmosphere (TOA) backscattered radiances. The error bars represent the standard deviation over 15 WRF-LES plume realizations and three source magnitudes for the plume (100, 500, 900 kg h−1). Precision over the dark surface in Fig. 2 is worse than 100 %.
A related benefit of decoupling from the surface reflectance in the retrieval is to improve the capability for plume pattern recognition, which is necessary to convert observed plume methane enhancements into source rates. Figure 6 illustrates this for the grass and urban scenes of Fig. 3 including the plume from the 500 kg h−1 point source. Retrievals are performed with the specifications of the EnMAP instrument (10 nm spectral resolution, SNR 180), SBG (10 nm, 300), and AMPS (1 nm, 400). For the grass scene we find that all three instruments can discern the plume pattern near the emission source and separate it from surface features. SBG and AMPS capture larger plume domains because of their higher precisions (Fig. 5), which would improve the inference of the source rates. For the urban scene, EnMAP plume detection is swamped by surface artifacts. Simply increasing the SNR as in the SBG instrument does not improve the situation. Increasing the spectral resolution to 1 nm as in the AMPS instrument enables detection of the plume though quantification is still compromised by surface artifacts.
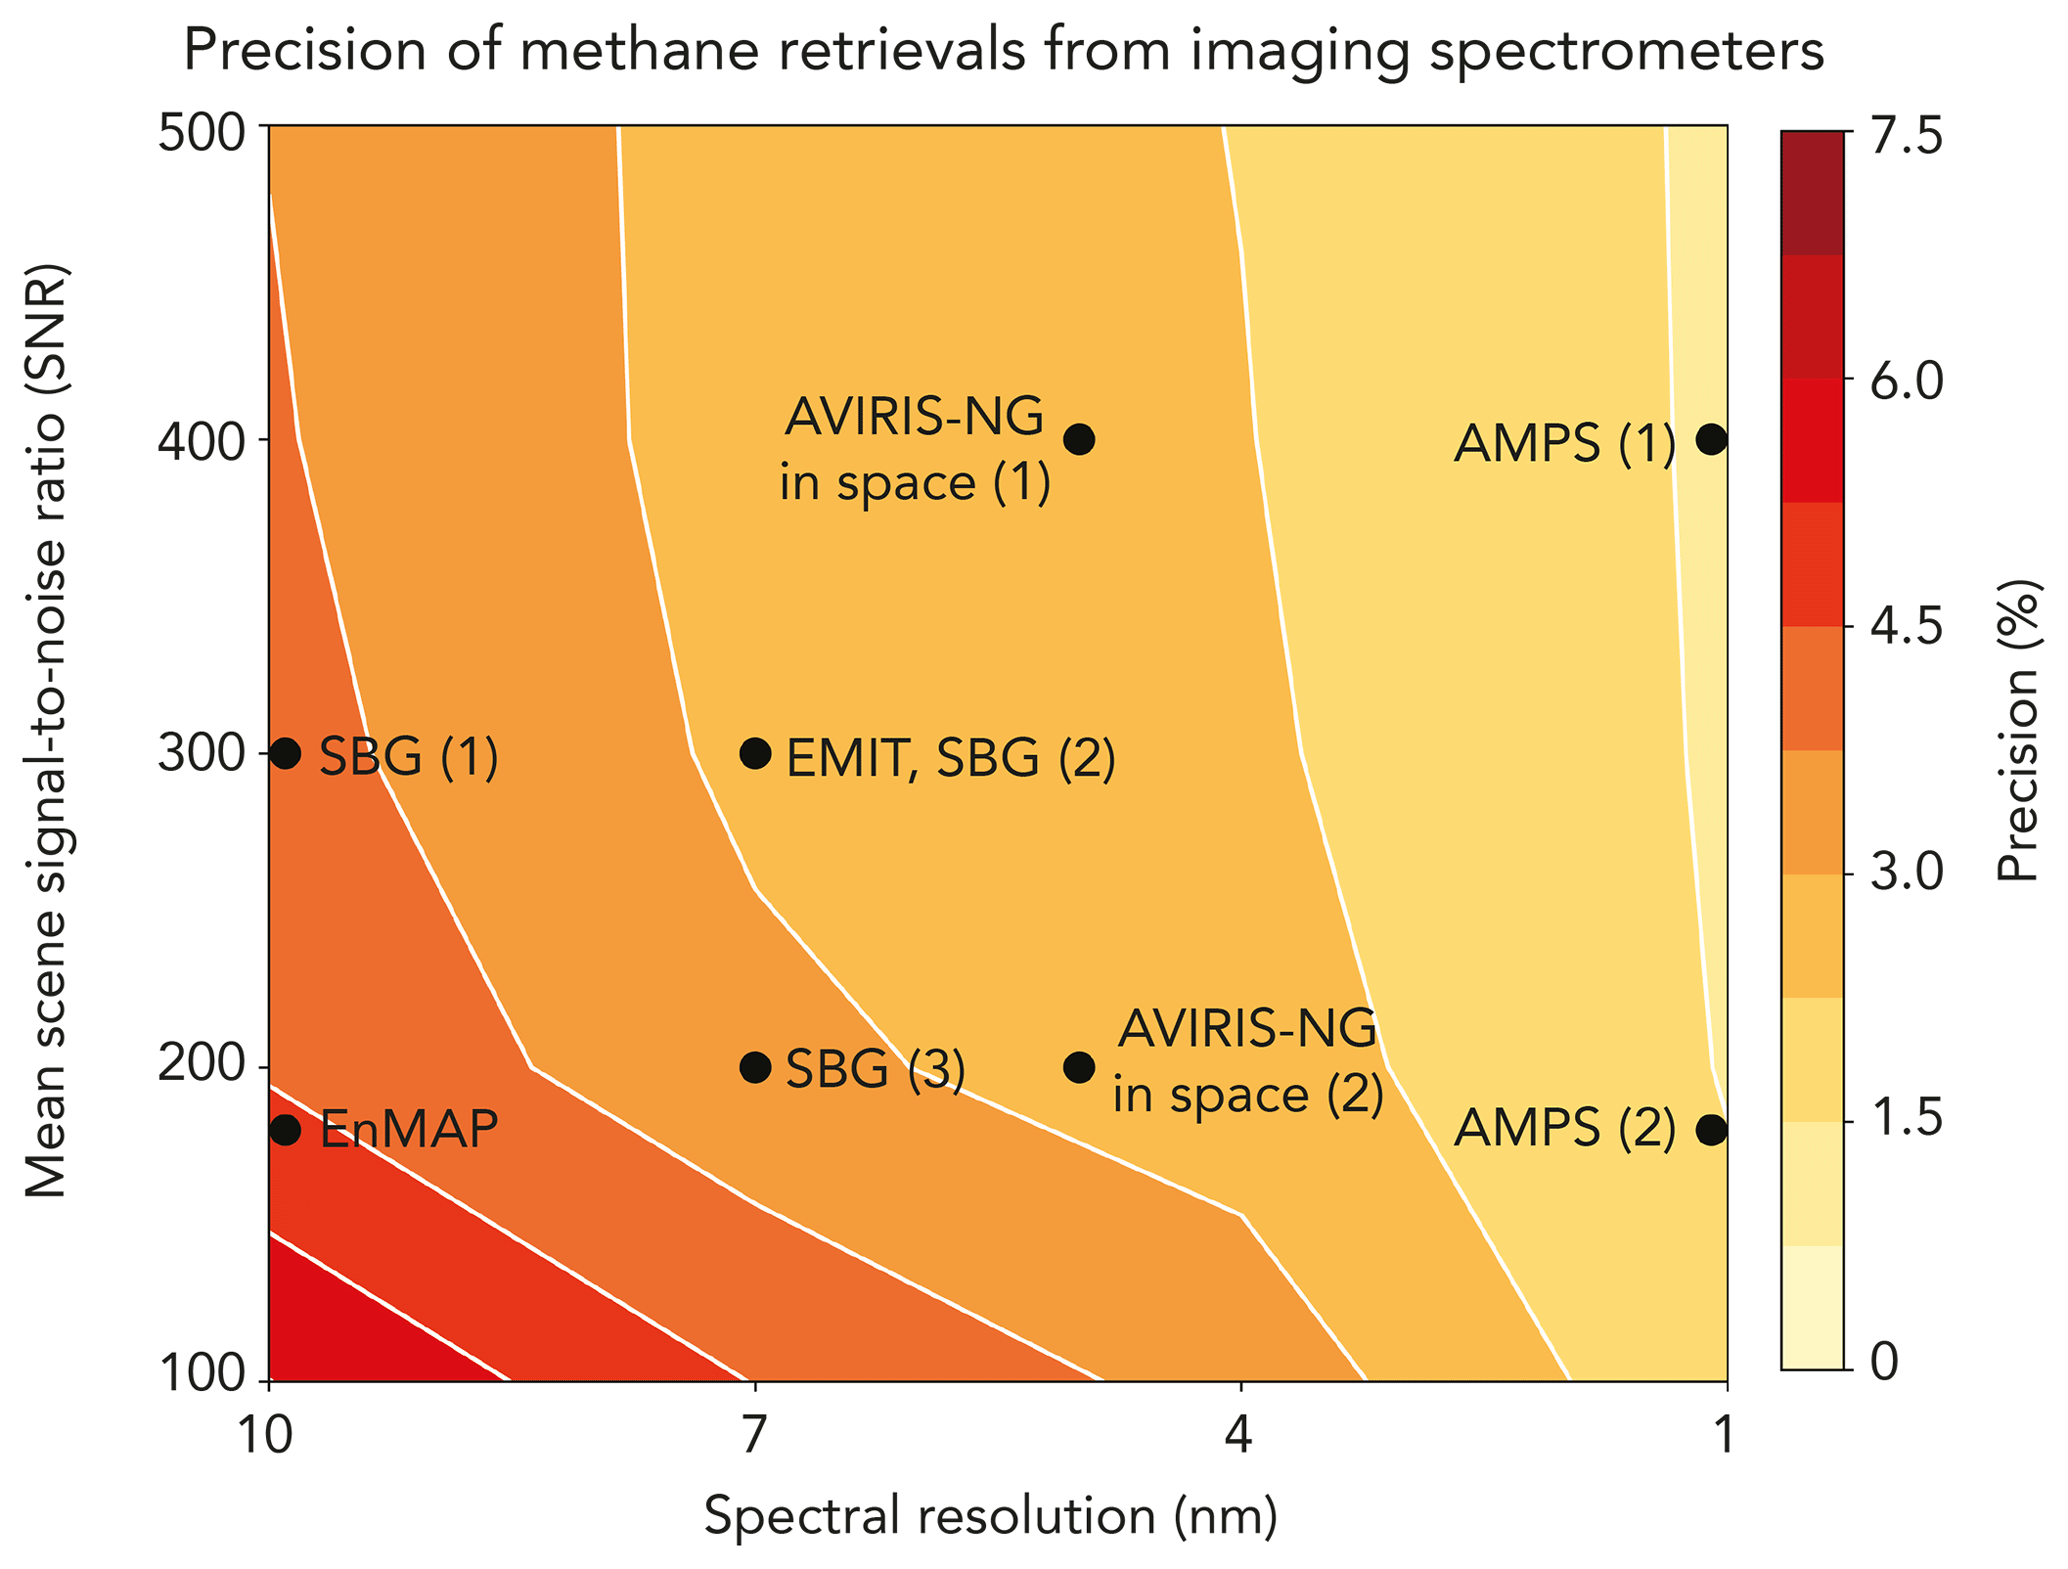
Figure 5Precision of methane retrievals for spaceborne imaging spectrometers observing in the SWIR (2210–2400 nm), as a function of instrument signal-to-noise (SNR) and full-width-at-half-maximum (FWHM) spectral resolution. The SNR values are for a reference 30∘ solar zenith angle and 0.3 surface reflectivity with clear sky, same as in Table 1. Actual SNR for individual pixels may vary, depending in particular on surface reflectivity. Precision is expressed as the relative residual standard deviation (RRSD) of the difference between retrieved and true methane columns over three synthetic scenes of Fig. 2 (grass, urban, bright) including point sources of 100–900 kg h−1 and for 15 different WRF-LES plume realizations. Black dots show different instrument specifications from Table 1. Specifications for the SBG and AMPS instruments are still at the design stage, and values shown here are for the ranges under consideration. Results given for AVIRIS-NG are for a satellite instrument with 30 m×30 m pixel resolution but other specifications (spectral resolution, SNR) same as the airborne instrument.
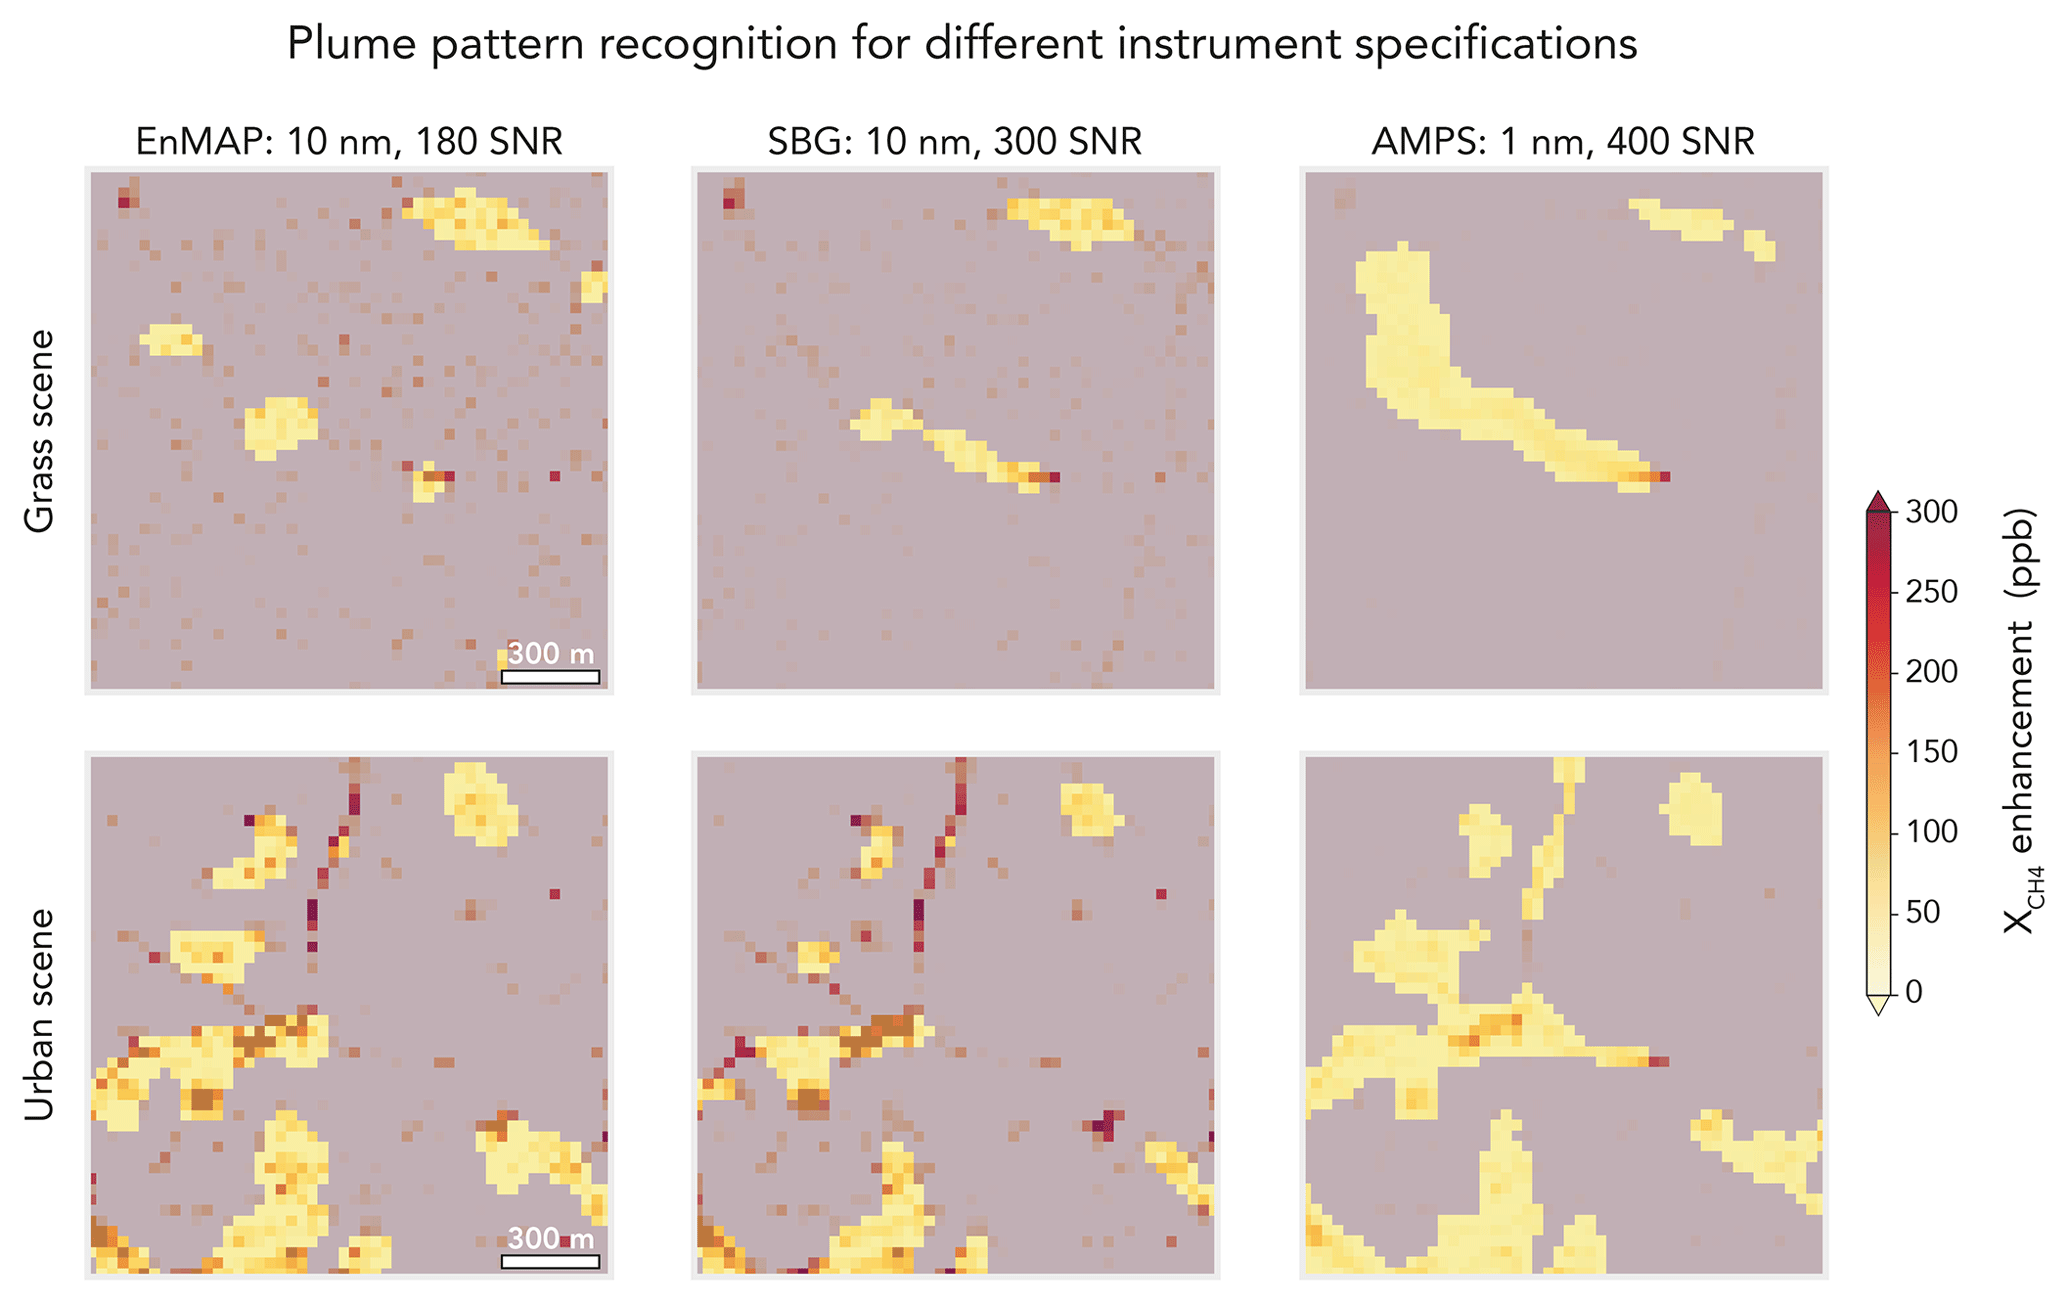
Figure 6Plume pattern recognition algorithm applied to a point source of 500 kg h−1 over grass and urban scenes as shown in Fig. 3. The plume pattern is defined by applying median and Gaussian filters to pixels above the 80th percentile of in the scene. Areas excluded by the mask are shown in gray. The panels show retrievals from the EnMAP, SBG, and AMPS instruments.
4.3 Evaluation with AVIRIS-NG observations
To test the EnMAP retrieval capability with actual observations, we downsampled AVIRIS-NG airborne spectra taken over California methane-emitting facilities (CARB, 2017). We chose three scenes observed by AVIRIS-NG on different days over oil and gas facilities. Figure 7 shows the RGB images, the AVIRIS-NG plume retrievals performed by applying the method of Sect. 3 with a variable AMF, and the downsampled EnMAP retrievals. Plume masks were applied as described in Sect. 3.3 and shown in Fig. 6. At the altitudes used for the California survey, AVIRIS-NG has a 3 m×3 m pixel resolution and hence features much sharper methane enhancements than EnMAP (note the different scales for the middle and right panels). Nevertheless, we see from Fig. 7 that EnMAP is able to detect the same plumes as AVIRIS-NG (two plumes in the bottom panels). This is facilitated by the brightness of the surfaces. The surface reflectivities retrieved simultaneously with the methane enhancements in our IMAP-DOAS algorithm are 0.39–0.49, which is brighter than the bright EeteS scene in Sect. 4.1.

Figure 7Retrieval of atmospheric methane plumes from facilities in the San Joaquin Valley of California imaged by the AVIRIS-NG instrument at 3–4 km altitude (CARB, 2017). (a), (d), and (g) show the RGB images mapped by AVIRIS-NG with the oil/gas facilities of interest circled. Inset in the bottom left corner is the mean retrieved SWIR surface reflectivity for the scene. (b), (e), and (h) show the IMAP-DOAS retrieval applied to the AVIRIS-NG images with 3 m×3 m pixel resolution and 5 nm spectral resolution. (c), (f), and (i) show the IMAP-DOAS retrieval applied to spectra that were spatially and spectrally downsampled to match EnMAP instrument specifications (30 m×30 m pixels, 10 nm spectral resolution). Note the difference in color scale for the methane enhancements in the AVIRIS-NG and EnMAP retrievals, reflecting the coarser pixel resolution of EnMAP. The plume mask described in the text is overlaid on each. The source rates for each plume obtained from the IME method are inset.
Figure 7 shows the source rates inferred from the AVIRIS-NG and EnMAP retrievals for each point source. The AVIRIS-NG source rates are a factor of 1.2–3.0 greater (average 1.9) than the EnMAP source rates. The EnMAP underestimate is consistent with the results in Table 2 and may reflect the same sources of bias, in part correctable through an improved U10–Ueff relationship. The results confirm that EnMAP should be able to detect plumes and estimate source rates down to ∼100 kg h−1 when the scene is sufficiently bright.
We examined the potential of next-generation spaceborne imaging spectrometers (EnMAP, PRISMA, EMIT, SBG, CHIME) for observing atmospheric methane plumes from point sources and inferring the corresponding source rates. These instruments have launch dates of 2019–2025 and focus on observing the Earth surface with fine pixel resolution (30 m×30 m), including observing channels at 2200–2400 nm with 7–10 nm spectral resolution that could also be used to retrieve methane plumes. This would achieve much finer spatial resolution than the standard satellite instruments designed to measure atmospheric methane and would provide a unique resource for global mapping of individual methane point sources.
We focused our baseline analysis on EnMAP (spectral resolution 10 nm, SNR 180, 2020 launch date) as its specifications are well documented (Guanter et al, 2015). We created synthetic spectra using the EnMAP end-to-end simulation tool (EeteS) to simulate various surface scenes (grass, urban, bright) with instrument errors and with superimposed methane plumes generated by a WRF large-eddy simulation (LES). We then retrieved these scenes for atmospheric methane together with surface reflectivities (fitted with Legendre polynomials) using the iterative maximum a posteriori differential optical absorption spectroscopy (IMAP-DOAS) approach. The resulting precisions for methane are 3.5 % for the grass scene, 7.2 % for urban, and 2.6 % for bright. A 500 kg h−1 methane plume (typical of very large point sources) is readily detected over the relatively homogeneous grass surface. The highly heterogeneous urban surface is much more challenging because of retrieval artifacts.
The limitation of EnMAP in detecting methane plumes over heterogeneous surfaces is caused by error correlation between methane and surface reflectivity in the retrieval. We examined how precision and error correlation could be improved by increasing spectral resolution and SNR. We find that increasing spectral resolution reduces the error correlation more efficiently than increasing SNR by enabling separation of fine spectral structure (methane) from coarse spectral structure (surface). The Airborne Methane Plume Spectrometer (AMPS) instrument concept, which bridges the gap between imaging spectrometers and spaceborne methane sensors (1 nm spectral resolution, SNR 400), can greatly decrease surface artifacts and detect a 500 kg h−1 plume even over the heterogeneous urban surface. Alternative retrieval parameterizations might also improve separation of methane and surface reflectivity features (Thompson et al., 2018; Ong et al., 2019).
We tested the EnMAP capability with actual observations by downsampling AVIRIS-NG images taken from aircraft (3 m×3 m pixels, 5 nm spectral resolution, SNR 200) over California methane-emitting facilities (CARB, 2017). We showed that these EnMAP-like images are able to detect actual plumes of magnitude ∼100 kg h−1 over relatively bright surfaces. Source rates inferred from the plumes with a generic integrated mass enhancement (IME) method are a factor of 1.2 to 3 lower for EnMAP than for AVIRIS-NG, which could be due in part to unaccounted dependence of the IME method on instrument pixel size and precision. This should be improved in further work by customizing the IME method to the EnMAP specifications.
In summary, our analysis shows that future spaceborne imaging spectrometers designed to map land surfaces in the SWIR also have potential for detecting methane plumes from point sources and quantifying source rates. The detection capability of 100–500 kg h−1 over relatively bright and homogeneous land surfaces would allow accounting for a wide range of point sources. The fine spatial resolution of these instruments should make them a unique resource to contribute to tiered observing systems for greenhouse gases (Duren and Miller, 2012).
Example EeteS scenes are available at http://www.enmap.org/node/21.html (Segl et al., 2012). WRF-LES simulations are available upon request. HITRAN absorption cross sections are available at https://hitran.org/hapi/ (Kochannev et al., 2016). AVIRIS-NG raw radiances are available at https://avirisng.jpl.nasa.gov/alt_locator/ (Gao et al., 1993). MERRA-2 reanalysis is available at https://gmao.gsfc.nasa.gov/reanalysis/MERRA-2/ (Gelaro et al., 2017).
DHC performed the main analysis, created figures, and wrote the manuscript. DJJ and CRR helped develop the analysis, scientific interpretation, and manuscript. DJV performed WRF-LES simulations. CCM, XL, and KC provided guidance on radiative transfer simulations. AKT and CF helped with the development of the IMAP-DOAS retrieval. AKT, RMD, CEM, and DRT provided guidance on the AVIRIS-NG instrument, campaigns, and retrieval. LG provided EeteS simulations. All authors provided comments to the manuscript.
The authors declare that they have no conflict of interest.
Portions of this work were undertaken at the Jet Propulsion Laboratory, California Institute of Technology, under contract with NASA.
This work was supported in part by the ExxonMobil Research and Engineering Company and NASA's Carbon Monitoring System (CMS) Prototype Methane Monitoring System for California. Data from the California Methane Survey was supported by NASA's Earth Science Division and the California Air Resources Board under ARB–NASA agreement 15RD028 and Space Act agreement 82-19863 as well as the California Energy Commission under CEC-500-15-004.
This paper was edited by Dominik Brunner and reviewed by Gerrit Kuhlmann and one anonymous referee.
Allen, D. T., Torres, V. M., Thomas, J., Sullivan, D. W., Harrison, M., Hendler, A., Herndon, S. C., Kolb, C. E., Fraser, M. P., Hill, A. D., Lamb, B. K., Miskimins, J., Sawyer, R. F., and Seinfeld, J. H.: Measurements of methane emissions at natural gas production sites in the United States, P. Natl. Acad. Sci. USA, 110, 17768–17773, https://doi.org/10.1073/pnas.1304880110, 2013.
Ayasse, A. K., Thorpe, A. K., Roberts, D. A., Funk, C. C., Dennison, P. E., Frankenberg, C., Steffke, A., and Aubrey, A. D.: Evaluating the effects of surface properties on methane retrievals using a synthetic airborne visible/infrared imaging spectrometer next generation (AVIRIS-NG) image, Remote Sens. Environ., 215, 386–397, https://doi.org/10.1016/j.rse.2018.06.018, 2018.
Benjamin, S. G., Weygandt, S. S., Brown, J. M., Hu, M., Alexander, C. R., Smirnova, T. G., Olson, J. B., James, E. P., Dowell, D. C., Grell, G. A., Lin, H., Peckham, S. E., Smith, T. L., Moninger, W. R., Kenyon, J. S., and Manikin, G. S.: A North American Hourly Assimilation and Model Forecast Cycle: The Rapid Refresh, Mon. Weather Rev., 144, 1669–1694, https://doi.org/10.1175/MWR-D-15-0242.1, 2016.
Bergamaschi, P., Frankenberg, C., Meirink, J. F., Krol, M., Villani, M. G., Houweling, S., Dentener, F., Dlugokencky, E. J., Miller, J. B., Gatti, L. V., Engel, A., and Levin, I.: Inverse modeling of global and regional CH4 emissions using SCIAMACHY satellite retrievals, J. Geophys. Res.-Atmos., 114, https://doi.org/10.1029/2009JD012287, 2009.
Berk, A., Anderson, G. P., Acharya, P. K., Bernstein, L. S., Muratov, L., Lee, J., Fox, M., Adler-Golden, S. M., Chetwynd Jr, J. H., Hoke, M. L., Lockwood, R. B., Gardner, J. A., Cooley, T. W., Borel, C. C., Lewis, P. E., and Shettle, E. P.: MODTRAN5: 2006 update, in: Algorithms and Technologies for Multispectral, Hyperspectral, and Ultraspectral Imagery XII, Vol. 6233, International Society for Optics and Photonics, 508–515, 2006.
Bovensmann, H., Doicu, A., Stammes, P., Van Roozendael, M., Von Savigny, C., de Vries, M. P., Beirle, S., Wagner, T., Chance, K., Buchwitz, M., Kokhanovsky, A., Richter, A., Rozanov, A. V., and Rozanov, V. V.: From Radiation Fields to Atmospheric Concentrations–Retrieval of Geophysical Parameters, in: SCIAMACHY-Exploring the Changing Earth's Atmosphere, Springer, 99–127, 2011.
Buchwitz, M., Reuter, M., Schneising, O., Boesch, H., Guerlet, S., Dils, B., Aben, I., Armante, R., Bergamaschi, P., Blumenstock, T., Bovensmann, H., Brunner, D., Buchmann, B., Burrows, J., Butz, A., Chédin, A., Chevallier, F., Crevoisier, C., Deutscher, N., Frankenberg, C., Hase, F., Hasekamp, O., Heymann, J., Kaminski, T., Laeng, A., Lichtenberg, G., Mazière, M. D., Noël, S., Notholt, J., Orphal, J., Popp, C., Parker, R., Scholze, M., Sussmann, R., Stiller, G., Warneke, T., Zehner, C., Bril, A., Crisp, D., Griffith, D., Kuze, A., O'Dell, C., Oshchepkov, S., Sherlock, V., Suto, H., Wennberg, P., Wunch, D., Yokota, T., and Yoshida, Y.: The Greenhouse Gas Climate Change Initiative (GHG-CCI): Comparison and quality assessment of near-surface-sensitive satellite-derived CO2 and CH4 global data sets, Remote Sens. Environ., 162, 344–362, https://doi.org/10.1016/j.rse.2013.04.024, 2015.
Butz, A., Galli, A., Hasekamp, O., Landgraf, J., Tol, P., and Aben, I.: TROPOMI aboard Sentinel-5 Precursor: Prospective performance of CH4 retrievals for aerosol and cirrus loaded atmospheres, Remote Sens. Environ., 120, 267–276, https://doi.org/10.1016/j.rse.2011.05.030, 2012.
CARB: Introduction to the Phase I Report of the California Methane Survey from the Staff of the California Air Resources Board (CARB), Tech. Rep., The California Air Resources Board, 2017.
CEOS: A Constellation Architecture for Monitoring Carbon Dioxide and Methane from Space, Tech. Rep., University of Zurich, Department of Informatics, available at: http://ceos.org/document_management/Meetings/Plenary/32/documents/CEOS_AC-VC_White_Paper_Version_1_20181009.pdf (last access: 18 October 2019), 2018.
Cleemput, E. V., Vanierschot, L., Fernández-Castilla, B., Honnay, O., and Somers, B.: The functional characterization of grass- and shrubland ecosystems using hyperspectral remote sensing: trends, accuracy and moderating variables, Remote Sens. Environ., 209, 747–763, https://doi.org/10.1016/j.rse.2018.02.030, 2018.
Cusworth, D. H., Jacob, D. J., Sheng, J.-X., Benmergui, J., Turner, A. J., Brandman, J., White, L., and Randles, C. A.: Detecting high-emitting methane sources in oil/gas fields using satellite observations, Atmos. Chem. Phys., 18, 16885–16896, https://doi.org/10.5194/acp-18-16885-2018, 2018.
Duren, R. M. and Miller, C. E.: Measuring the carbon emissions of megacities, Nat. Clim. Change, 2, 560–562, 2012.
Duren, R. M., Thorpe, A. K., Foster, K. T., Rafiq, T., Hopkins, F. M., Yadav, V., Bue, B., Thompson, D. R., Conley, S., Colombi, N., Frankenberg, C., McCubbin, I., Eastwood, M. L., Falk, M., Herner, J., Croes, B. E., Green, R. O., and Miller, C. M.: California's Methane Super-emitters, Nature, 575, https://doi.org/10.1038/s41586-019-1720-3, 2019.
Folkman, M. A., Pearlman, J., Liao, L. B., and Jarecke, P. J.: EO-1/Hyperion hyperspectral imager design, development, characterization, and calibration, in: Hyperspectral Remote Sensing of the Land and Atmosphere, Vol. 4151, International Society for Optics and Photonics, 40–52, 2001.
Frankenberg, C., Meirink, J. F., van Weele, M., Platt, U., and Wagner, T.: Assessing Methane Emissions from Global Space-Borne Observations, Science, 308, 1010–1014, https://doi.org/10.1126/science.1106644, 2005a.
Frankenberg, C., Platt, U., and Wagner, T.: Iterative maximum a posteriori (IMAP)-DOAS for retrieval of strongly absorbing trace gases: Model studies for CH4 and CO2 retrieval from near infrared spectra of SCIAMACHY onboard ENVISAT, Atmos. Chem. Phys., 5, 9–22, https://doi.org/10.5194/acp-5-9-2005, 2005b.
Frankenberg, C., Meirink, J., Bergamaschi, P., Goede, A., Heimann, M., Körner, S., Platt, U., van Weele, M., and Wagner, T.: Satellite chartography of atmospheric methane from SCIAMACHY on board ENVISAT: Analysis of the years 2003 and 2004, J. Geophys. Res.-Atmos., 111, https://doi.org/10.1029/2006JD007268, 2006.
Frankenberg, C., Thorpe, A. K., Thompson, D. R., Hulley, G., Kort, E. A., Vance, N., Borchardt, J., Krings, T., Gerilowski, K., Sweeney, C., Conley, S., Bue, B. D., Aubrey, A. D., Hook, S., and Green, R. O.: Airborne methane remote measurements reveal heavy-tail flux distribution in Four Corners region, P. Natl. Acad. Sci. USA, 113, 9734–9739, https://doi.org/10.1073/pnas.1605617113, 2016.
Gao, B. C., Heidebrecht, K. H., and Goetz, A. F. H.: Derivation of scaled surface reflectances from AVIRIS data, available at: https://avirisng.jpl.nasa.gov/alt_locator (last access: 18 October 2019) Remote Sens. Env., 44, 165–178, 1993.
Gelaro, R., McCarty, W., Suárez, M. J., Todling, R., Molod, A., Takacs, L., Randles, C. A., Darmenov, A., Bosilovich, M. G., Reichle, R., Wargan, K., Coy, L., Cullather, R., Draper, C., Akella, S., Buchard, V., Conaty, A., da Silva, A. M., Gu, W., Kim, G.-K., Koster, R., Lucchesi, R., Merkova, D., Nielsen, J. E., Partyka, G., Pawson, S., Putman, W., Rienecker, M., Schubert, S. D., Sienkiewicz, M., and Zhao, B.: The Modern-Era Retrospective Analysis for Research and Applications, Version 2 (MERRA-2), J. Clim., 30, 5419–5454, https://doi.org/10.1175/JCLI-D-16-0758.1, 2017.
Green, R., Mahowald, N., Clark, R., Ehlmann, B., Ginoux, P., Kalashnikova, O., Miller, R., Okin, G., Painter, T., Pérez García-Pando, C., Realmuto, V. J., Swayze, G. A., Thompson, D. R., Middleton, E., Guanter, L., Ben Dor, E., and Phillips, B. R.: NASA's Earth Surface Mineral Dust Source Investigation, in: AGU Fall Meeting Abstracts, 2018.
Green, R. O., Eastwood, M. L., Sarture, C. M., Chrien, T. G., Aronsson, M., Chippendale, B. J., Faust, J. A., Pavri, B. E., Chovit, C. J., Solis, M., Olah, M. R., and Williams, O.: Imaging Spectroscopy and the Airborne Visible/Infrared Imaging Spectrometer (AVIRIS), Remote Sens. Environ., 65, 227–248, https://doi.org/10.1016/S0034-4257(98)00064-9, 1998.
Guanter, L., Kaufmann, H., Segl, K., Foerster, S., Rogass, C., Chabrillat, S., Kuester, T., Hollstein, A., Rossner, G., Chlebek, C., Straif, C., Fischer, S., Schrader, S., Storch, T., Heiden, U., Mueller, A., Bachmann, M., Mühle, H., Müller, R., Habermeyer, M., Ohndorf, A., Hill, J., Buddenbaum, H., Hostert, P., Van der Linden, S., Leita ̃o, P. J., Rabe, A., Doerffer, R., Krasemann, H., Xi, H., Mauser, W., Hank, T., Locherer, M., Rast, M., Staenz, K., and Sang, B.: The EnMAP Spaceborne Imaging Spectroscopy Mission for Earth Observation, Remote Sens., 7, 8830–8857, https://doi.org/10.3390/rs70708830, 2015.
Hochberg, E. J., Roberts, D. A., Dennison, P. E., and Hulley, G. C.: Special issue on the Hyperspectral Infrared Imager (HyspIRI): Emerging science in terrestrial and aquatic ecology, radiation balance and hazards, Remote Sens. Environ., 167, 1–5, https://doi.org/10.1016/j.rse.2015.06.011, 2015.
Hu, H., Landgraf, J., Detmers, R., Borsdorff, T., Aan de Brugh, J., Aben, I., Butz, A., and Hasekamp, O.: Toward Global Mapping of Methane With TROPOMI: First Results and Intersatellite Comparison to GOSAT, Geophys. Res. Lett., 45, 3682–3689, https://doi.org/10.1002/2018GL077259, 2018.
Jacob, D. J., Turner, A. J., Maasakkers, J. D., Sheng, J., Sun, K., Liu, X., Chance, K., Aben, I., McKeever, J., and Frankenberg, C.: Satellite observations of atmospheric methane and their value for quantifying methane emissions, Atmos. Chem. Phys., 16, 14371–14396, https://doi.org/10.5194/acp-16-14371-2016, 2016.
Kneizys, F., Abreu, L., Anderson, G., Chetwynd, J., Shettle, E., Berk, A., Bernstein, L., Robertson, D., Acharya, P., and Rothman, L.: The MODTRAN 2/3 report and LOWTRAN 7 model, Phillips Laboratory, Hanscom AFB, MA, http://web.gps.caltech.edu/~vijay/pdf/modrept.pdf (last access: 18 October 2019), 1996.
Kochanov, R., Gordon, I., Rothman, L., Wcisło, P., Hill, C., and Wilzewski, J.: HITRAN Application Programming Interface (HAPI): A comprehensive approach to working with spectroscopic data, J. Quant. Spectrosc. Ra., 177, 15–30, https://doi.org/10.1016/j.jqsrt.2016.03.005, 2016.
Kort, E. A., Frankenberg, C., Costigan, K. R., Lindenmaier, R., Dubey, M. K., and Wunch, D.: Four corners: The largest US methane anomaly viewed from space, Geophys. Res. Lett., 41, 6898–6903, 2014.
Kuze, A., Suto, H., Shiomi, K., Kawakami, S., Tanaka, M., Ueda, Y., Deguchi, A., Yoshida, J., Yamamoto, Y., Kataoka, F., Taylor, T. E., and Buijs, H. L.: Update on GOSAT TANSO-FTS performance, operations, and data products after more than 6 years in space, Atmos. Meas. Tech., 9, 2445–2461, https://doi.org/10.5194/amt-9-2445-2016, 2016.
Loizzo, R., Guarini, R., Longo, F., Scopa, T., Formaro, R., Facchinetti, C., and Varacalli, G.: Prisma: The Italian Hyperspectral Mission, in: IGARSS 2018–2018 IEEE International Geoscience and Remote Sensing Symposium, 175–178, https://doi.org/10.1109/IGARSS.2018.8518512, 2018.
McKeever, J., Durak, B., Gains, D., Jervis, D., Varon, D., Germain, S., and Sloan, J.: GHGSat-D: Greenhouse gas plume imaging and quantification from space using a Fabry-Perot imaging spectrometer, Abstract (A33G-2450) presented at 2017 AGU Fall Meeting, New Orleans, LA, 11–15 December, 2017AGUFM, 2017.
National Academies of Sciences, Engineering, and Medicine: Thriving on Our Changing Planet: A Decadal Strategy for Earth Observation from Space, Washington, DC: The National Academies Press, https://doi.org/10.17226/24938, 2018.
Nieke, J. and Rast, M.: Towards the Copernicus Hyperspectral Imaging Mission For The Environment (CHIME), in: IGARSS 2018–2018 IEEE International Geoscience and Remote Sensing Symposium, 157–159, https://doi.org/10.1109/IGARSS.2018.8518384, 2018.
Ong, C., Carrère, V., Chabrillat, S., Clark, R., Hoefen, T., Kokaly, R., Marion, R., Souza Filho, C. R., Swayze, G., and Thompson, D. R.: Imaging Spectroscopy for the Detection, Assessment and Monitoring of Natural and Anthropogenic Hazards, Surv. Geophys., 40, 431–470, https://doi.org/10.1007/s10712-019-09523-1, 2019.
Rodgers, C. D.: Inverse methods for atmospheric sounding: theory and practice, Vol. 2, World scientific, Chap. 5, 81–100, 2000.
Roy, D., Wulder, M., Loveland, T., C. E., W., Allen, R., Anderson, M., Helder, D., Irons, J., Johnson, D., Kennedy, R., Scambos, T., Schaaf, C., Schott, J., Sheng, Y., Vermote, E., Belward, A., Bindschadler, R., Cohen, W., Gao, F., Hipple, J., Hostert, P., Huntington, J., Justice, C., Kilic, A., Kovalskyy, V., Lee, Z., Lymburner, L., Masek, J., McCorkel, J., Shuai, Y., Trezza, R., Vogelmann, J., Wynne, R., and Zhu, Z.: Landsat-8: Science and product vision for terrestrial global change research, Remote Sens. Environ., 145, 154–172, https://doi.org/10.1016/j.rse.2014.02.001, 2014.
Segl, K., Guanter, L., Rogass, C., Kuester, T., Roessner, S., Kaufmann, H., Sang, B., Mogulsky, V., and Hofer, S.: EeteS—The EnMAP End-to-End Simulation Tool, IEEE J. Sel. Top. Appl., 5, 522–530, https://doi.org/10.1109/JSTARS.2012.2188994, 2012.
Sheng, J.-X., Jacob, D. J., Maasakkers, J. D., Zhang, Y., and Sulprizio, M. P.: Comparative analysis of low-Earth orbit (TROPOMI) and geostationary (GeoCARB, GEO-CAPE) satellite instruments for constraining methane emissions on fine regional scales: application to the Southeast US, Atmos. Meas. Tech., 11, 6379–6388, https://doi.org/10.5194/amt-11-6379-2018, 2018.
Thompson, D. R., Thorpe, A. K., Frankenberg, C., Green, R. O., Duren, R., Guanter, L., Hollstein, A., Middleton, E., Ong, L., and Ungar, S.: Space-based remote imaging spectroscopy of the Aliso Canyon CH4 superemitter, Geophys. Res. Lett., 43, 6571–6578, https://doi.org/10.1002/2016GL069079, 2016.
Thompson, D. R., Natraj, V., Green, R. O., Helmlinger, M. C., Gao, B.-C., and Eastwood, M. L.: Optimal estimation for imaging spectrometer atmospheric correction, Remote Sens. Environ., 216, 355–373, 2018.
Thorpe, A. K., Frankenberg, C., and Roberts, D. A.: Retrieval techniques for airborne imaging of methane concentrations using high spatial and moderate spectral resolution: application to AVIRIS, Atmos. Meas. Tech., 7, 491–506, https://doi.org/10.5194/amt-7-491-2014, 2014.
Thorpe, A. K., Frankenberg, C., Green, R. O., Thompson, D. R., Aubrey, A. D., Mouroulis, P., Eastwood, M. L., and Matheou, G.: The Airborne Methane Plume Spectrometer (AMPS): Quantitative imaging of methane plumes in real time, in: 2016 IEEE Aerospace Conference, 1–14, https://doi.org/10.1109/AERO.2016.7500756, 2016.
Thorpe, A. K., Frankenberg, C., Thompson, D. R., Duren, R. M., Aubrey, A. D., Bue, B. D., Green, R. O., Gerilowski, K., Krings, T., Borchardt, J., Kort, E. A., Sweeney, C., Conley, S., Roberts, D. A., and Dennison, P. E.: Airborne DOAS retrievals of methane, carbon dioxide, and water vapor concentrations at high spatial resolution: application to AVIRIS-NG, Atmos. Meas. Tech., 10, 3833–3850, https://doi.org/10.5194/amt-10-3833-2017, 2017.
Turner, A. J., Jacob, D. J., Wecht, K. J., Maasakkers, J. D., Lundgren, E., Andrews, A. E., Biraud, S. C., Boesch, H., Bowman, K. W., Deutscher, N. M., Dubey, M. K., Griffith, D. W. T., Hase, F., Kuze, A., Notholt, J., Ohyama, H., Parker, R., Payne, V. H., Sussmann, R., Sweeney, C., Velazco, V. A., Warneke, T., Wennberg, P. O., and Wunch, D.: Estimating global and North American methane emissions with high spatial resolution using GOSAT satellite data, Atmos. Chem. Phys., 15, 7049–7069, https://doi.org/10.5194/acp-15-7049-2015, 2015.
Turner, A. J., Jacob, D. J., Benmergui, J., Brandman, J., White, L., and Randles, C. A.: Assessing the capability of different satellite observing configurations to resolve the distribution of methane emissions at kilometer scales, Atmos. Chem. Phys., 18, 8265–8278, https://doi.org/10.5194/acp-18-8265-2018, 2018.
Varon, D., Jacob, D., McKeever, J., Durak, B., and Jervis, D.: Quantifying Methane Emissions from Individual Coal Mine Vents with GHGSat-D Satellite Observations, in: American Geophysical Union, Fall Meeting 2018, abstract no. A43R-3443, 2018a.
Varon, D. J., Jacob, D. J., McKeever, J., Jervis, D., Durak, B. O. A., Xia, Y., and Huang, Y.: Quantifying methane point sources from fine-scale satellite observations of atmospheric methane plumes, Atmos. Meas. Tech., 11, 5673–5686, https://doi.org/10.5194/amt-11-5673-2018, 2018b.
Xi, X., Natraj, V., Shia, R. L., Luo, M., Zhang, Q., Newman, S., Sander, S. P., and Yung, Y. L.: Simulated retrievals for the remote sensing of CO2, CH4, CO, and H2O from geostationary orbit, Atmos. Meas. Tech., 8, 4817–4830, https://doi.org/10.5194/amt-8-4817-2015, 2015.