the Creative Commons Attribution 4.0 License.
the Creative Commons Attribution 4.0 License.
 | 08 Nov 2019
Recent advances in measurement techniques for atmospheric carbon monoxide and nitrous oxide observations
Christoph Zellweger
Rainer Steinbrecher
Olivier Laurent
Haeyoung Lee
Sumin Kim
Lukas Emmenegger
Martin Steinbacher
Brigitte Buchmann
Carbon monoxide (CO) and nitrous oxide (N2O) are two key parameters in the observation of the atmosphere, relevant to air quality and climate change, respectively. For CO, various analytical techniques have been in use over the last few decades. In contrast, N2O was mainly measured using gas chromatography (GC) with an electron capture detector (ECD). In recent years, new spectroscopic methods have become available which are suitable for both CO and N2O. These include infrared (IR) spectroscopic techniques such as cavity ring-down spectroscopy (CRDS), off-axis integrated cavity output spectroscopy (OA-ICOS) and Fourier transform infrared spectroscopy (FTIR). Corresponding instruments became recently commercially available and are increasingly used at atmospheric monitoring stations. We analysed results obtained through performance audits conducted within the framework of the Global Atmosphere Watch (GAW) quality management system of the World Meteorology Organization (WMO). These results reveal that current spectroscopic measurement techniques have clear advantages with respect to data quality objectives compared to more traditional methods for measuring CO and N2O. Further, they allow for a smooth continuation of historic CO and N2O time series. However, special care is required concerning potential water vapour interference on the CO amount fraction reported by near-IR CRDS instruments. This is reflected in the results of parallel measurement campaigns, which clearly indicate that drying the sample air leads to an improved accuracy of CO measurements with such near-IR CRDS instruments.
- Article
(3043 KB) - Full-text XML
- BibTeX
- EndNote


The Global Atmosphere Watch (GAW) Programme of the World Meteorological Organization (WMO) coordinates a network of atmospheric composition observations comprising 31 global stations, more than 400 regional stations, and around 100 contributing stations operated by contributing networks (GAWSIS, 2018). These stations provide long-term observations of atmospheric greenhouse gases (GHGs) and reactive gases such as carbon dioxide (CO2), methane (CH4), nitrous oxide (N2O), and carbon monoxide (CO), which are essential for understanding the GHG budget, both regionally and globally. To make full use of these observations, the uncertainty of these measurements must be reduced in order to obtain consistent data series with traceability to common reference standards. Within the GAW programme, Central Calibration Laboratories (CCLs) provide reference standards that are linked to internationally accepted calibration scales (Rhoderick et al., 2016, 2018). In addition, World Calibration Centres (WCCs) evaluate GAW stations through independent assessments by on-site system and performance audits (Buchmann et al., 2009). The Laboratory for Air Pollution/Environmental Technology of the Swiss Federal Laboratories for Materials Science and Technology (Empa) has been operating the WCC for carbon monoxide (CO), methane (CH4), carbon dioxide (CO2), and surface ozone (WCC-Empa) since 1996 as a Swiss contribution to the GAW programme and has conducted over 90 system and performance audits over the past 20 years. Furthermore, WCC-Empa collaborates closely with the WCC for nitrous oxide (WCC-N2O) hosted by the Karlsruhe Institute of Technology (KIT) Institute of Meteorology and Climate Research - Atmospheric Environmental Research (IMK-IFU) to increase the number of N2O audits. In order to address scientific needs for interpreting regional or global-scale atmospheric observations, the GAW programme sets ambitious network compatibility goals, which are continuously reviewed and, if necessary, revised during biannual meetings of the WMO/GAW community (WMO, 2018). Network compatibility goals are set for amount fraction ranges observed in the unpolluted troposphere, while extended network compatibility goals reflect the less stringent requirements for urban and regional studies with larger local fluxes. The network compatibility goals currently stand at 2 nmol mol−1 for CO and 0.1 nmol mol−1 for N2O, whilst the extended goals are set to 5 nmol mol−1 for CO and 0.3 nmol mol−1 for N2O. These goals represent the maximum bias that can generally be tolerated in measurements of well-mixed background air used in global models to infer regional fluxes. Some network compatibility goals may not be currently achievable within current measurement and/or scale transfer uncertainties. However, they are targeted for applications which require the smallest possible bias among different datasets or data providers, such as for the detection of small trends and gradients (WMO, 2018).
In situ measurements of tropospheric CO and N2O have been available since the late 1960s (Weiss, 1981; Khalil and Rasmussen, 1983, 1988). While early measurements were mainly analysis results based on flask samples, quasi-continuous measurements have been available since the early 1980s (Brunke et al., 1990). Although continuous measurements of CO and N2O began approximately at the same time and were often collocated, challenges with respect to the measurement techniques for continuous measurements were completely different. Carbon monoxide shows high temporal and spatial variability, whilst the detection of very small changes is needed for N2O observations. In the past, atmospheric CO and N2O measurements at remote locations were almost exclusively made by gas chromatographic (GC) techniques. GC with an electron capture detector (GC/ECD) was by far the most abundant measurement technique for N2O, whereas flame ionisation detection (GC/FID) in combination with a methaniser and GC with a mercuric oxide reduction detector (GC/HgO) were the two most commonly used techniques for CO measurements (Zellweger et al., 2009).
Recent years brought the rapid development of a variety of alternative CO measurement techniques, and a variety of methods are now in use at atmospheric monitoring sites. Common methods include GC techniques (Gros et al., 1999; Novelli, 1999; van der Laan et al., 2009), non-dispersive infrared absorption (NDIR) (Parrish et al., 1994; Nedelec et al., 2003), vacuum ultra-violet resonance fluorescence (VURF) (Gerbig et al., 1999), Fourier transform infrared (FTIR) absorption (Griffith et al., 2012; Hammer et al., 2013a), near-IR cavity ring-down spectroscopy (NIR-CRDS) (Chen et al., 2013; Yver Kwok et al., 2015), and systems using quantum cascade lasers (QCLs) in the mid-infrared such as mid-IR CRDS, off-axis integrated cavity output spectroscopy (OA-ICOS) (Baer et al., 2002; Provencal et al., 2005), and quantum cascade tuneable infrared laser direct absorption spectroscopy (QC-TILDAS) (McManus et al., 2015).
Alternatives to GC-ECD for N2O are not as abundant, but several methods have been proposed in recent years. These include instruments deploying optical techniques in the mid-IR, e.g. CRDS spectroscopy, FTIR, OA-ICOS, QC-TILDAS, and difference-frequency-generation-based (DFG-based) systems. Lebegue et al. (2016) published a comprehensive overview of these techniques as well as their performance under controlled conditions.
The recently developed optical techniques for CO and N2O have clear advantages concerning sensitivity, repeatability, linearity, time response, and temporal coverage, resulting in new measurement setups and calibration strategies. However, only a few published studies comparing spectroscopic techniques with GC systems exist for CO (Zellweger et al., 2009, 2012; Ventrillard et al., 2017) and N2O (Vardag et al., 2014; Lebegue et al., 2016). Such comparisons of traditional and new techniques are crucial for a smooth continuation of multi-decadal time series when introducing new analytical techniques.
In this paper, we analyse data collected during CO and N2O performance audits made by WCC-Empa and WCC-N2O from 2002 through 2017 from the perspective of the used measurement techniques. We further present ambient-air CO comparisons made with a NIR-CRDS travelling instrument during WCC-Empa audits and show limitations of the NIR-CRDS technique with respect to water vapour interference. Assessment of atmospheric measurements through parallel measurements with a travelling instrument is complementary to performance audits with travelling standards and round-robin experiments and is thus an essential, valuable quality control measure (Hammer et al., 2013b; Zellweger et al., 2016).
System and performance audits (hereafter only called audits) by WCCs are part of the quality management framework of the GAW programme (WMO, 2017a). Empa is the designated WCC for CO (since 1997), and since 2009 a collaboration between WCC-Empa and the WCC for N2O has allowed WCC-Empa to include N2O comparisons during station audits. The concept of station audits has been described elsewhere (Klausen et al., 2003; Buchmann et al., 2009; Zellweger et al., 2016). WCCs use two different approaches to conduct performance audits: (i) comparisons of travelling standards (TSs), i.e. high-pressure cylinders with known nominal values of CO and N2O amount fractions, and (ii) parallel measurements using a travelling instrument (TI). The TS method is widely applied, while the TI concept is used less frequently and limited to CO, CO2, and CH4 by WCC-Empa.
2.1 Comparisons using travelling standards
The audit concept using TS supplies gases from high-pressure cylinders, usually dry natural air or synthetic air, to the instruments of the audited station. Usually, multiple analyses of a set of three or more TSs are made and averaged for the final assignment of the TS value by the audited laboratory. Calibrations of the TS against reference standards before and after the station audit ensure traceability to the CCL, which is run by the National Oceanic and Atmospheric Administration Earth System Research Laboratory (NOAA/ESRL). The results are then analysed by a linear regression of the values measured by the station vs. the reference values assigned by the WCC. At WCC-Empa, N2O and CO amount fractions in the TS have been calibrated since 2010 by an Aerodyne quantum cascade laser spectrometer (QC-TILDAS-CS, Aerodyne Research Inc., MA, USA). Before that, an AL5001 vacuum ultra-violet resonance fluorescence analyser (AL5001, Aerolaser GmbH, Germany) was used for CO calibrations. Both instruments are described in more detail in Zellweger et al. (2012). Amount fractions are assigned to the TS using a set of several reference standards purchased from the CCL. The WCC-N2O uses a set of TSs traceable to a set of tertiary standards, which are regularly recalibrated against secondary standards at the CCL. For N2O, the calibration scales in use were the WMO-X2000 for audits before 2006 and WMO-X2006 and X2006A (Hall et al., 2007; NOAA, 2018c) afterwards. CO refers to the WMO-X2000, WMO-X2004, X2014, and X2014A (NOAA, 2018a) calibration scales.
We analysed WCC-Empa performance audit results based on the TS method for carbon monoxide (2005–2017) and nitrous oxide (2009–2017), as well as results of N2O audits conducted by the WCC-N2O (2002–2013). Details on analytical techniques, instruments, and calibration scales of these audits are summarised in Table 1 for CO and Table 2 for N2O. Since the focus of the paper is on instrument performance, only comparisons involving fully functional instruments were considered. Furthermore, if data have been reprocessed due to any known biases, e.g. in working standards, only the results of the final comparison were considered, since they best represent the performance of the measurement instruments at the time of the audit. CO audits made by WCC-Empa before 2005 were not considered for the comparison due to the following reasons. (i) Stations and WCC-Empa were often not referring to the same CO calibration scale. WCC-Empa was using the WMO-X2000 carbon monoxide scale, while many GAW stations were still reporting on the older WMO-X88 scale (Novelli et al., 2003) or other scales. (ii) WCC-Empa at that time based its calibration of travelling standards only on CO standards above 185 nmol mol−1; the WMO-X2000 calibration scale had linearity issues, which have been corrected by the use of the WMO-X2004, X2014, and X2014A calibration scales. WCC-Empa continued using the WMO-X2000 calibration scale until 2011 but used only standards with an amount fraction larger than 185 nmol mol−1. At these amount fractions, the difference between the WMO-X2000 and WMO-X2004 CO scales are very small and questionably significant within their uncertainties. We therefore consider these two scales as being identical for calibrations made at WCC-Empa. For CO, the assessment has been made in the same standardised way as for carbon dioxide (CO2) and methane (CH4) described in Zellweger et al. (2016), while a slightly different approach has been chosen for N2O due to the fact that ambient-air amount fractions increased significantly during the period of observation. The results section gives further details on the methodology.
Table 1CO performance audits using travelling standards from 2005 to 2017. Please note that CSIRO in the table refers to the Commonwealth Scientific and Industrial Research Organisation scale.
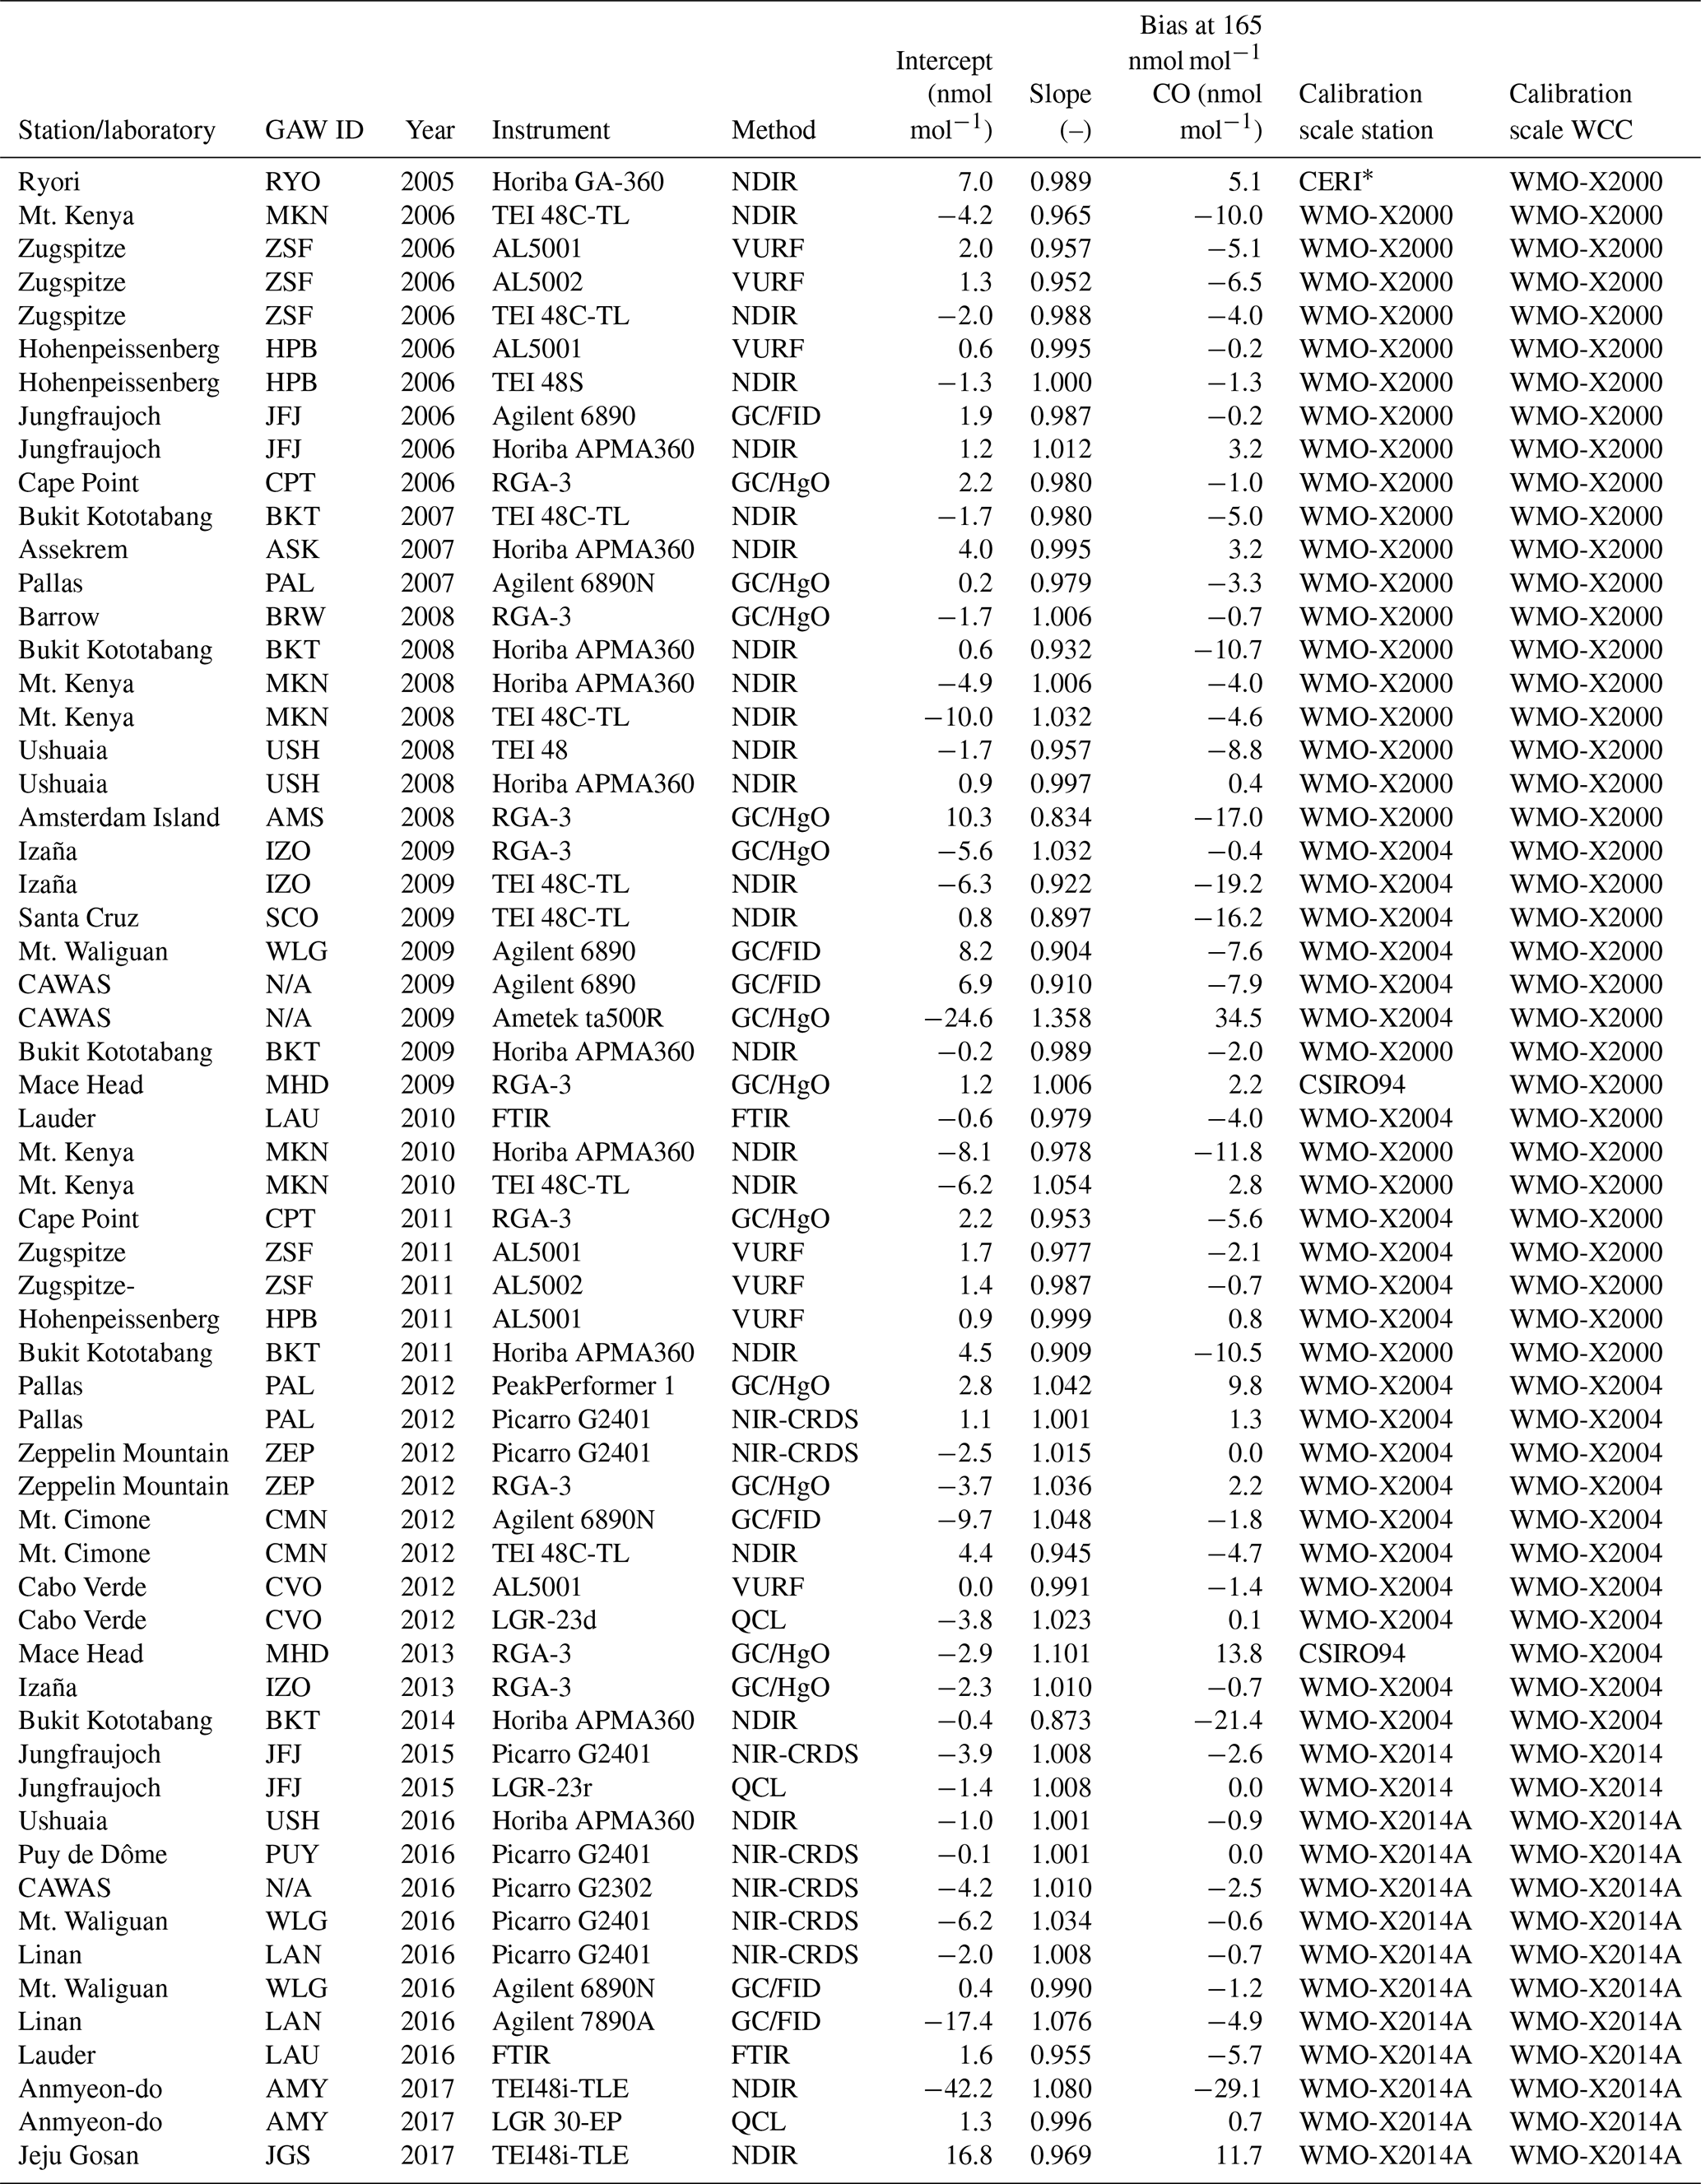
∗ Chemicals Evaluation and Research Institute, Japan.
2.2 Ambient-air comparisons
Assessments based on TS comparisons, e.g. during station audits or round-robin experiments, have limitations. They only cover the analytical system and exclude other aspects that might also be relevant, such as inlet or drying systems. The low water content of the TS may, for example, lead to a systematic bias, especially for analysers based on spectroscopic techniques with implemented water vapour correction algorithms. The assessment during on-site audits should therefore include parallel measurements with a TI whenever feasible (WMO, 2011, 2012, 2014, 2016, 2018).
WCC-Empa implemented this additional approach for CO, CO2, and CH4 audits in 2011. Details of the setup and procedure as well as results for CO2 and CH4 are published in Zellweger et al. (2016). Audits involving parallel measurements for CO were conducted using a NIR-CRDS analyser (G2401, Picarro Inc., USA) as a travelling instrument. The Picarro G2401 instrument has an internal water vapour correction mechanism for CO and reports the dry-air amount fraction only. However, these factory-based corrections are often not adequate (Chen et al., 2013). Due to the higher analytical noise compared to CO2 and CH4 measurements, corrections require a more comprehensive approach (Rella et al., 2013).
The internal water vapour correction of the TI was evaluated using the water droplet method (Zellweger et al., 2012; Rella et al., 2013). Approximately 0.8 mL of ultra-pure water is injected into a constant flow of about 500 mL min−1 of a dry working standard and delivered to the instrument using a bypass overflow. The CO amount fraction of the standards used for the determination of the water vapour interference ranged from 57 to 741 nmol mol−1. No dependency of the water vapour interference on the CO amount fraction was observed. For the WCC-Empa CO analyser, the water vapour influence on the CO amount fraction, which is already corrected by the internal water vapour compensation of the Picarro instrument, was then fitted by a quadratic function. Due to the relatively large uncertainties of individual experiments, we were not able to determine a reliable correction function and, therefore, relied on the factory settings for our experiments.
Parallel measurements with the TI of the following GAW stations are shown in this paper:
-
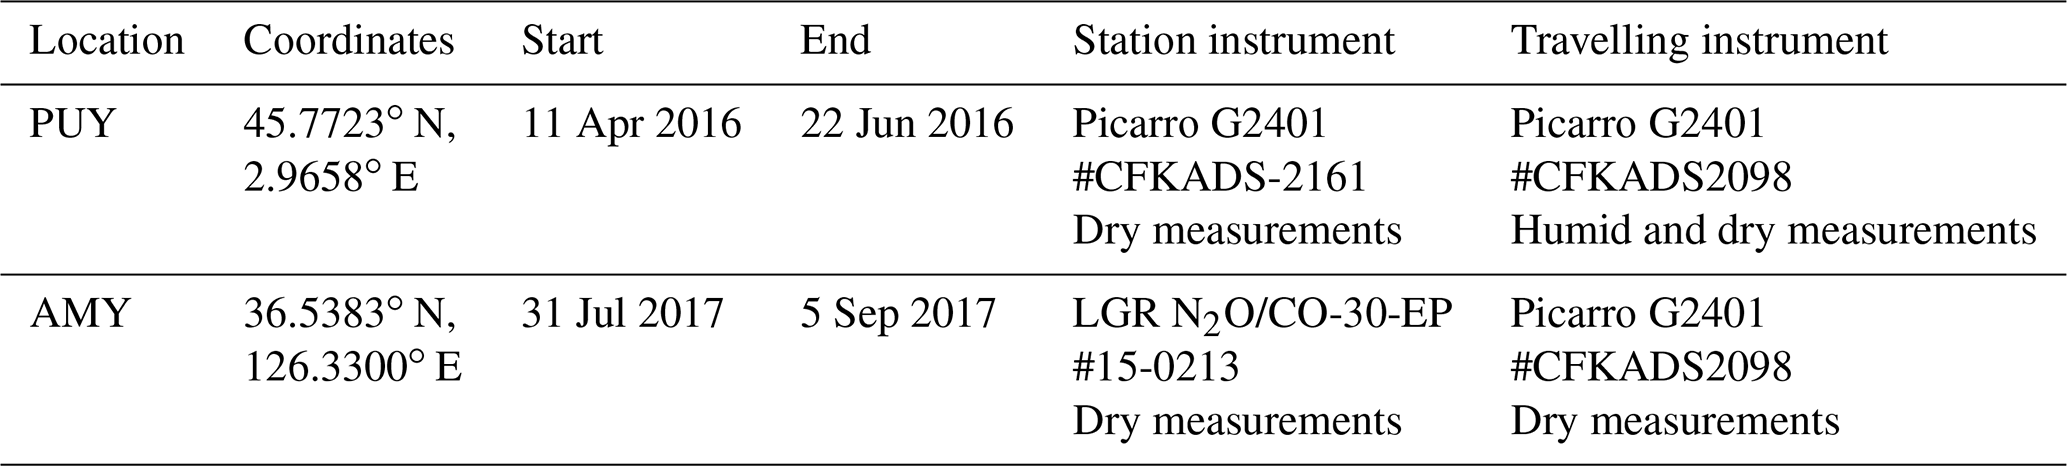
Puy de Dôme (PUY), France, is a global GAW station that is part of the European Integrated Carbon Observation System (ICOS). A separate inlet system leading to the same location as the air intake of the station analyser was in place for the comparison with the TI. An additional pump at a flow rate of approximately 2 L min−1 flushed this WCC-Empa inlet line. For the last days of the comparison, the TI sampled from the station inlet using the same cryogenic dryer as the station instrument. During this period, the air was dried to a dew point of approximately −50 ∘C.
-
Anmyeon-do (AMY), South Korea, is a regional GAW station run and managed by the Environmental Meteorology Research Division of the National Institute of Meteorological Sciences (NIMS). Air was taken with both instruments from the AMY air inlet system, and the air was dried to a dew point of approximately −50 ∘C using a cryogenic trap.
Table 3 gives an overview of the comparisons, including duration and instruments used. Detailed information about the stations is available from the GAW Station Information System (GAWSIS, 2018).
Table 2N2O audits with travelling standards performed by the WCC-N2O (2002–2013) and WCC-Empa (2009–2017). Please note that SIO in the table refers to the Scripps Institution of Oceanography scales.
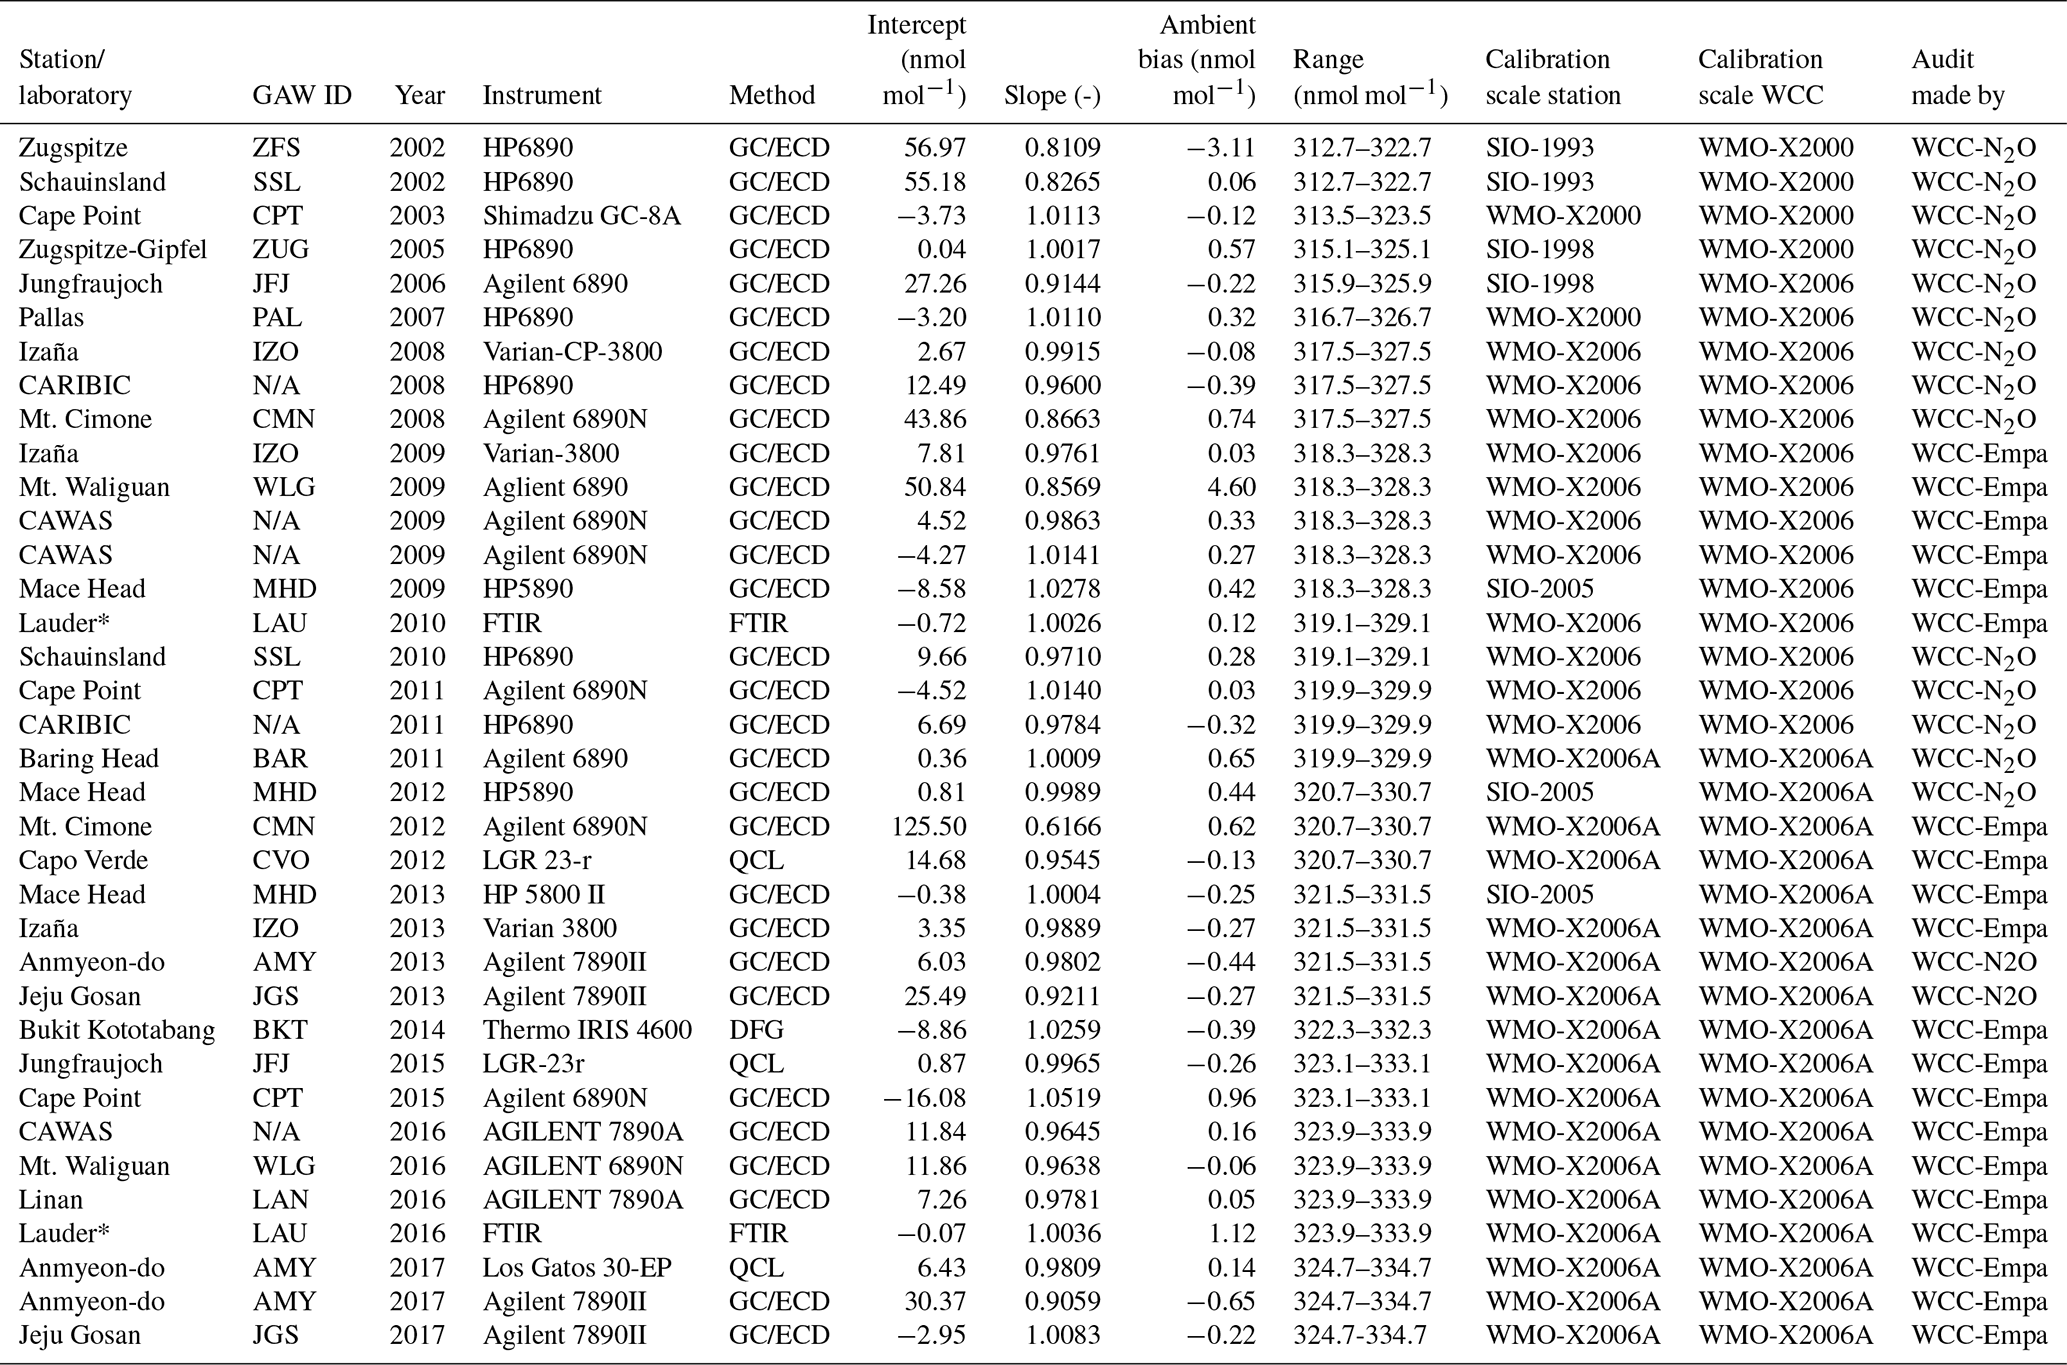
* The difference between the two FTIR comparisons is due to an offset of the working standard used in 2016 and is not related to the performance of the analyser.
3.1 Analysis of travelling standard comparison
One of the objectives of this work was to evaluate the performance of instruments for measuring CO and N2O at remote atmospheric-research observatories. Of particular interest is the question of whether modern spectroscopic techniques such as NIR-CRDS, TILDAS, OA-ICOS, or FTIR have a significant advantage compared to traditional methods and whether spectroscopic techniques improve the results of the performance audits carried out by the WCCs for the corresponding compounds with respect to precision and uncertainty. WCC-Empa made 60 comparisons during station audits using travelling standards for CO (2005–2017) and 20 for N2O (2009–2017). In addition, WCC-N2O conducted 16 comparisons during station audits (2002–2013). Tables 1 and 2 show details of analytical techniques and instruments of these comparisons for CO and N2O, respectively. The three letter codes (GAW ID) refers to the different stations (GAWSIS, 2018). Results of audits at the central calibration facility run by the Centre for Atmosphere Watch and Services (CAWAS) and of the greenhouse gas analysis on board the Civil Aircraft for the Regular Investigation of the atmosphere Based on an Instrument Container (CARIBIC) are also included in the comparisons.
Each of the audits shown in Tables 1 and 2 involved the comparison of a set of travelling standards and was then evaluated by a linear regression analysis of the measured values by the stations vs. the WCC assigned amount fractions, which are traceable to the CCL. To judge whether the combinations of the resulting slope and intercept meet the WMO/GAW network compatibility or extended network compatibility goals, a previously described method for CO2 and CH4 (Zellweger et al., 2016) was applied to CO and N2O. For CO, the bias of 165 nmol mol−1, which is the centre of the amount fraction range of 30–300 nmol mol−1, representing the unpolluted troposphere (WMO, 2018), was plotted against the slope of the individual travelling standard comparisons. This amount fraction range sufficiently covers the inter-hemispheric gradient, year-to-year variability, seasonal cycles as well as observed trends for the period of consideration at remote stations. For N2O, using a fixed amount fraction range however might not be appropriate due to the significant upward trend of the N2O mixing ratio in the atmosphere over the past decades. The range currently representing the unpolluted troposphere has been recently identified as 325–335 nmol mol−1 (WMO, 2018), which corresponds well to the mean global atmospheric N2O amount fraction of 328.9±0.1 nmol mol−1 observed in 2016 (WMO, 2017b). A trend analysis made by Blunden and Arndt (2017) showed an annual increase of about 0.8 nmol mol−1 per year over the last decade, which is in agreement with a fairly constant annual growth rate of 0.81 nmol mol−1 per year from 1977 until today as determined by the National Oceanic and Atmospheric Administration (NOAA, 2018b). Based on this, our analysis of N2O audit results was made using a variable amount fraction range covering 10 nmol mol−1 with the centre being representative for the unpolluted troposphere for the year of the audit. Table 2 gives the corresponding ranges used for the analysis. This method allows displaying the result of each individual CO and N2O audit involving comparisons with travelling standards as a single dot in a bias vs. slope plot, similar to CO2 and CH4 results presented by Zellweger et al. (2016).
3.1.1 Evaluation of CO comparisons
Figure 1 shows the bias in the centre of the relevant amount fraction of the unpolluted troposphere of 30–300 nmol mol−1 CO vs. the slope for the CO audits listed in Table 1. Perfect agreement would result in bias–slope pairs of (0 nmol mol−1/1). The allowed bias–slope combinations meeting the network compatibility (green area) and extended network compatibility goals (yellow area) of 2 and 5 nmol mol−1 (WMO, 2018), respectively, are indicated. The distribution of the observed biases and slopes gives further information about potential systematic offsets, which could be present either at the WCC or at the stations. If results are not systematically biased (e.g. by different calibration scales), a normal distribution of the observed bias and slope pairs around 0 nmol mol−1 (bias) and 1.0 (slope) is expected. This was the case for the slope with a mean value of 0.994 and dispersion (1σ) of 0.068, which is not significantly different from 1 (t test, p=0.47). However, the bias with a mean value of −2.6 nmol mol−1 and dispersion (1σ) of 8.7 nmol mol−1 (1σ) was significantly different from 0 (t test, p=0.02). A potential reason for this could be an upward drift in standards, which is common for CO in air mixtures at ambient amount fractions (Novelli et al., 2003; Gomez-Pelaez et al., 2013). Drift rates are usually on the order of up to 1 nmol mol−1 per year. To account for this, WCC-Empa frequently retrieves reference standards from the CCL. This might not always be the case at measurement sites. There, standards are often in use over long periods without recalibration or the acquisition of new standards. The use of standards having increased amount fractions due to the drift of instrument calibration will then result in an underestimation of ambient CO, which potentially explains the observed mean bias.
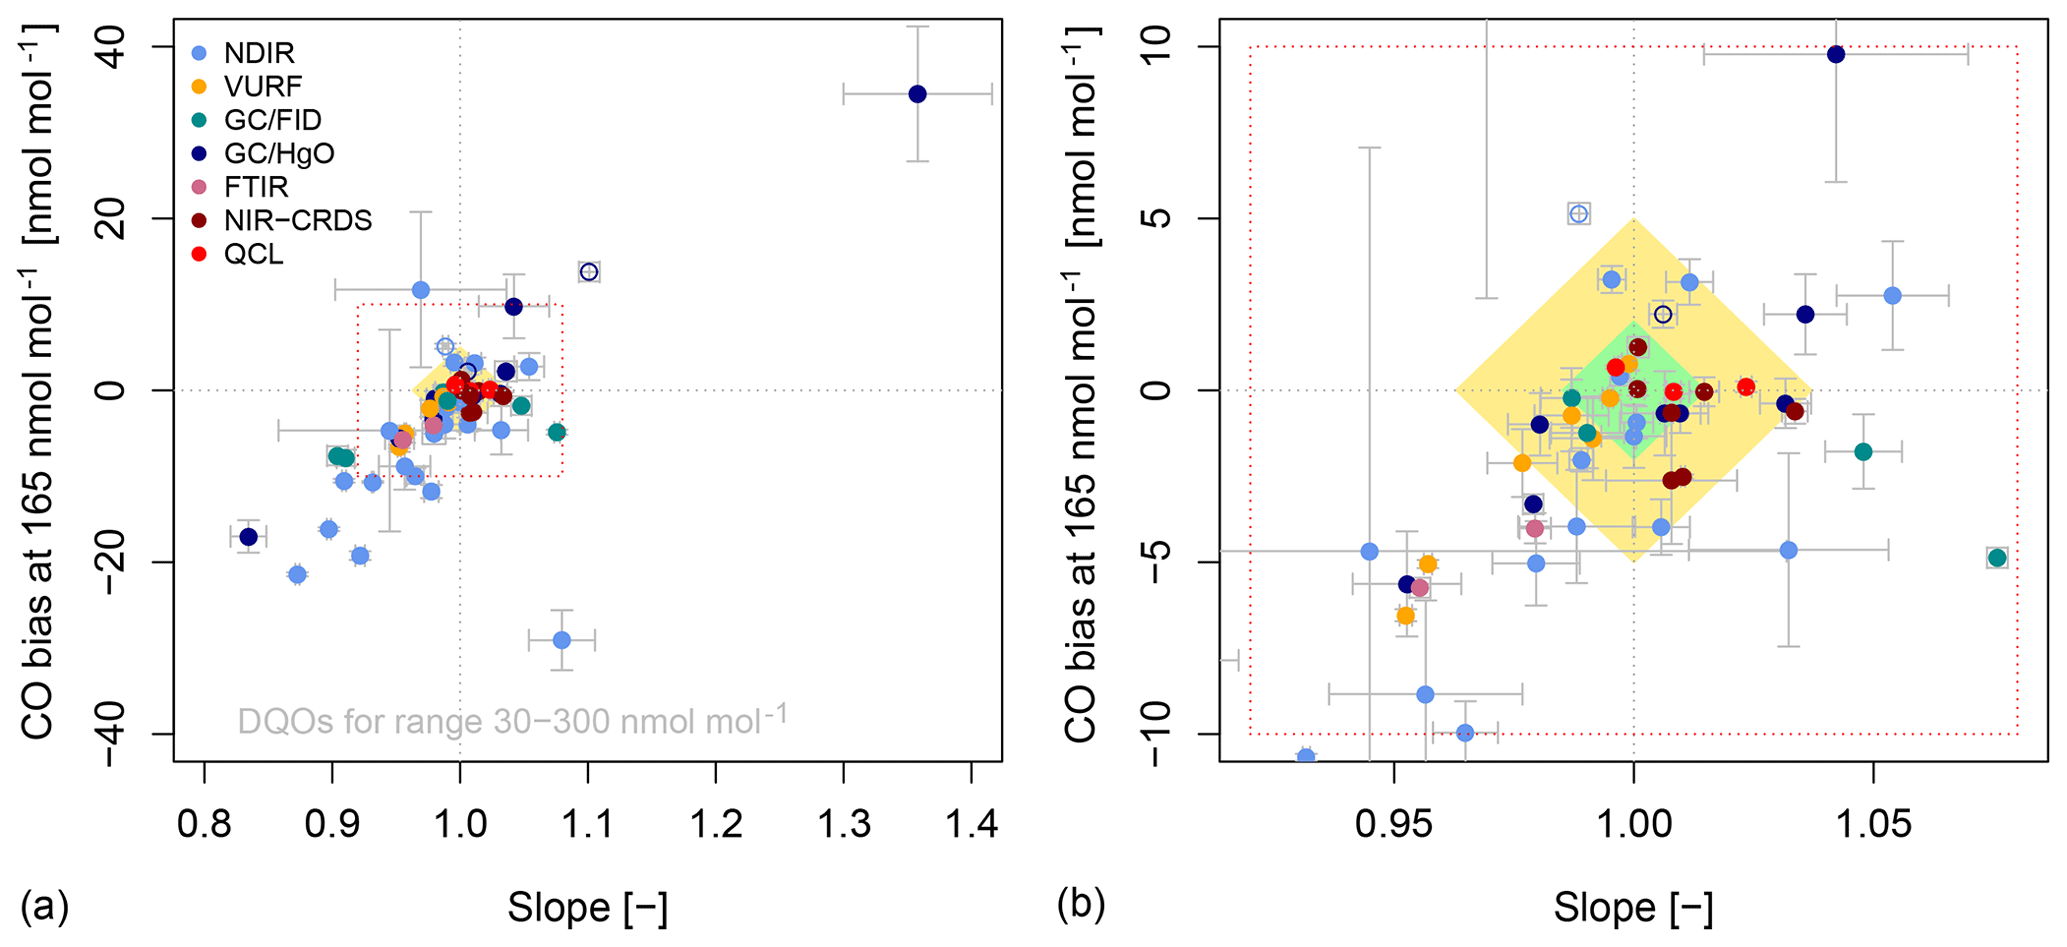
Figure 1(a) CO bias at 165 nmol mol−1 vs. the slope of the audit for individual travelling standard comparisons. Different colours indicate different measurement techniques of the station analysers. Filled symbols refer to a comparison with the same calibration scale at the station and the WCC, while open symbols indicate a scale difference. The error bars correspond to the uncertainty of the slope and the bias (1σ). The green and yellow areas correspond to the WMO/GAW network compatibility and extended network compatibility goals for the amount fraction range of 30–300 nmol mol−1. (b) Detail of the red dotted box in (a).
Figure 1 shows that reaching the network compatibility goals for CO is extremely challenging. The variety of measurement techniques is quite large and shows clear performance differences between methods. Newer spectroscopic techniques such as the QCL-based TILDAS or OA-ICOS spectroscopy (QCL hereafter) or CRDS generally show better performance compared to GC methods or NDIR. Moreover, they also yield higher data coverage due to the truly continuous observations in contrast to the semi-continuous GC measurements and the less frequently required application of reference gases compared to NDIR measurements. Higher data coverage further reduces the uncertainty caused by incomplete sampling. Figure 2 summarises the percentage of comparisons that met the network compatibility and extended network compatibility goals for (a) all comparisons, (b) for GC/HgO and GC/FID systems only, (c) NDIR instruments only, (d) VURF instruments only, and (e) for NIR-CRDS and QCL instruments. FTIR is not shown separately, since only two comparisons of one instrument were made. Out of the 60 comparisons, only 13 (21.7 %) met the network compatibility goal and an additional 14 (23.3 %) met the extended goal in the amount fraction range relevant to the troposphere. Good performance over the entire relevant amount fraction range is required, since atmospheric CO variability is large and pollution episodes, e.g. through long-range transport, are common even at remote locations. Calibration strategies therefore should cover the entire range, which is easier to implement for techniques with a linear response such as VURF, NIR-CRDS, and QCL. The analysis of the performance audit results shows that 90 % of the NIR-CRDS and QCL comparisons were meeting the network compatibility or extended network compatibility goal, while this was the case for less than 40 % of the NDIR analysers or GC systems. From the total of 10 TS–NIR-CRDS/QCL comparisons, five (50 %) were within ±2 nmol mol−1, and an additional four (40 %) were within ±5 nmol mol−1. The corresponding numbers are significantly smaller for GC-based methods (total of 18 comparisons) and NDIR (total of 23 comparisons), which clearly indicates an advantage of the recent methods compared to more traditional techniques.
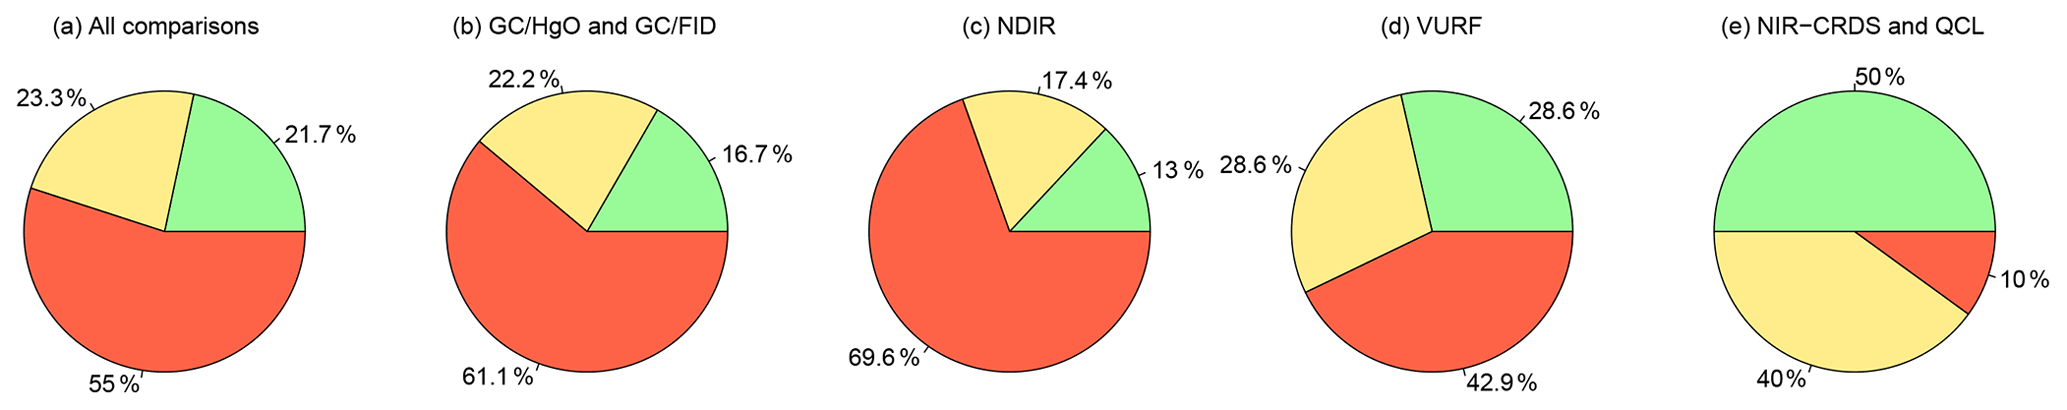
Figure 2Percentage of CO performance audit results that were in the range of 30–300 nmol mol−1 within the WMO/GAW network compatibility goals (green), the extended network compatibility goals (yellow), or outside the network compatibility goals (red area) for (a) all comparisons, (b) GC systems, (c) NDIR analysers, (d) VURF analysers, and (e) NIR-CRDS and QCL systems.
However, these results also depend on calibration and potential issues or differences in the calibration scales. For example, an instrument with perfect repeatability and reproducibility but an incorrect calibration, e.g. by a bias in the calibration standard, can be outside the quality goals only because of calibration issues. In this case, the uncertainty of the linear regression of the travelling standard comparison is expected to be smaller compared to instruments with poorer repeatability and reproducibility. Therefore, the uncertainty of the linear regression analysis is another measure of the instrument performance. Figure 3 shows a boxplot of the standard uncertainty of the slopes of all CO performance audits grouped by different analytical techniques. The results also confirm the better performance of the QCL and NIR-CRDS instruments compared to GC techniques and NDIR. Interestingly, the performance of NDIR analysers and GC/HgO systems is similar, but this is likely due to different reasons. While the repeatability of GC/HgO systems is generally superior compared to NDIR, appropriate compensation of the non-linearity remains obviously difficult compared to the normally linear but noisy NDIR analysers, resulting in a similar performance of both techniques in the field for the amount fraction range from 30 to 300 nmol mol−1.
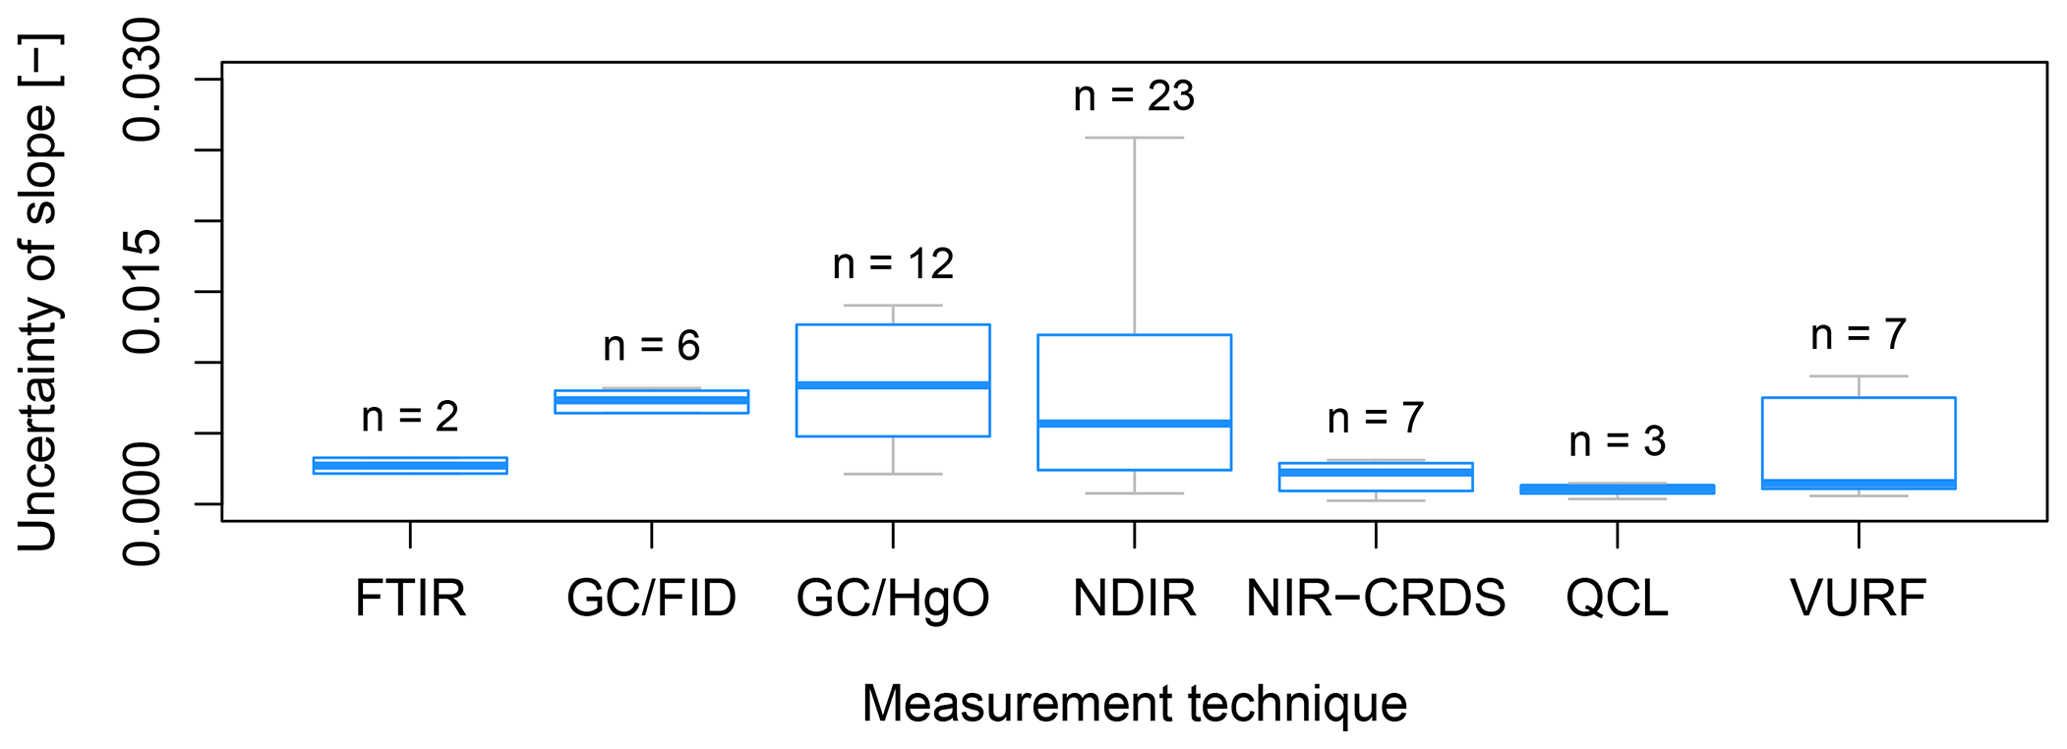
Figure 3Boxplot of slope uncertainties from the regression analysis for the CO performance audits for different analytical techniques including the number of comparisons (n). The horizontal blue line denotes the median, and the blue boxes show the inter-quartile range.
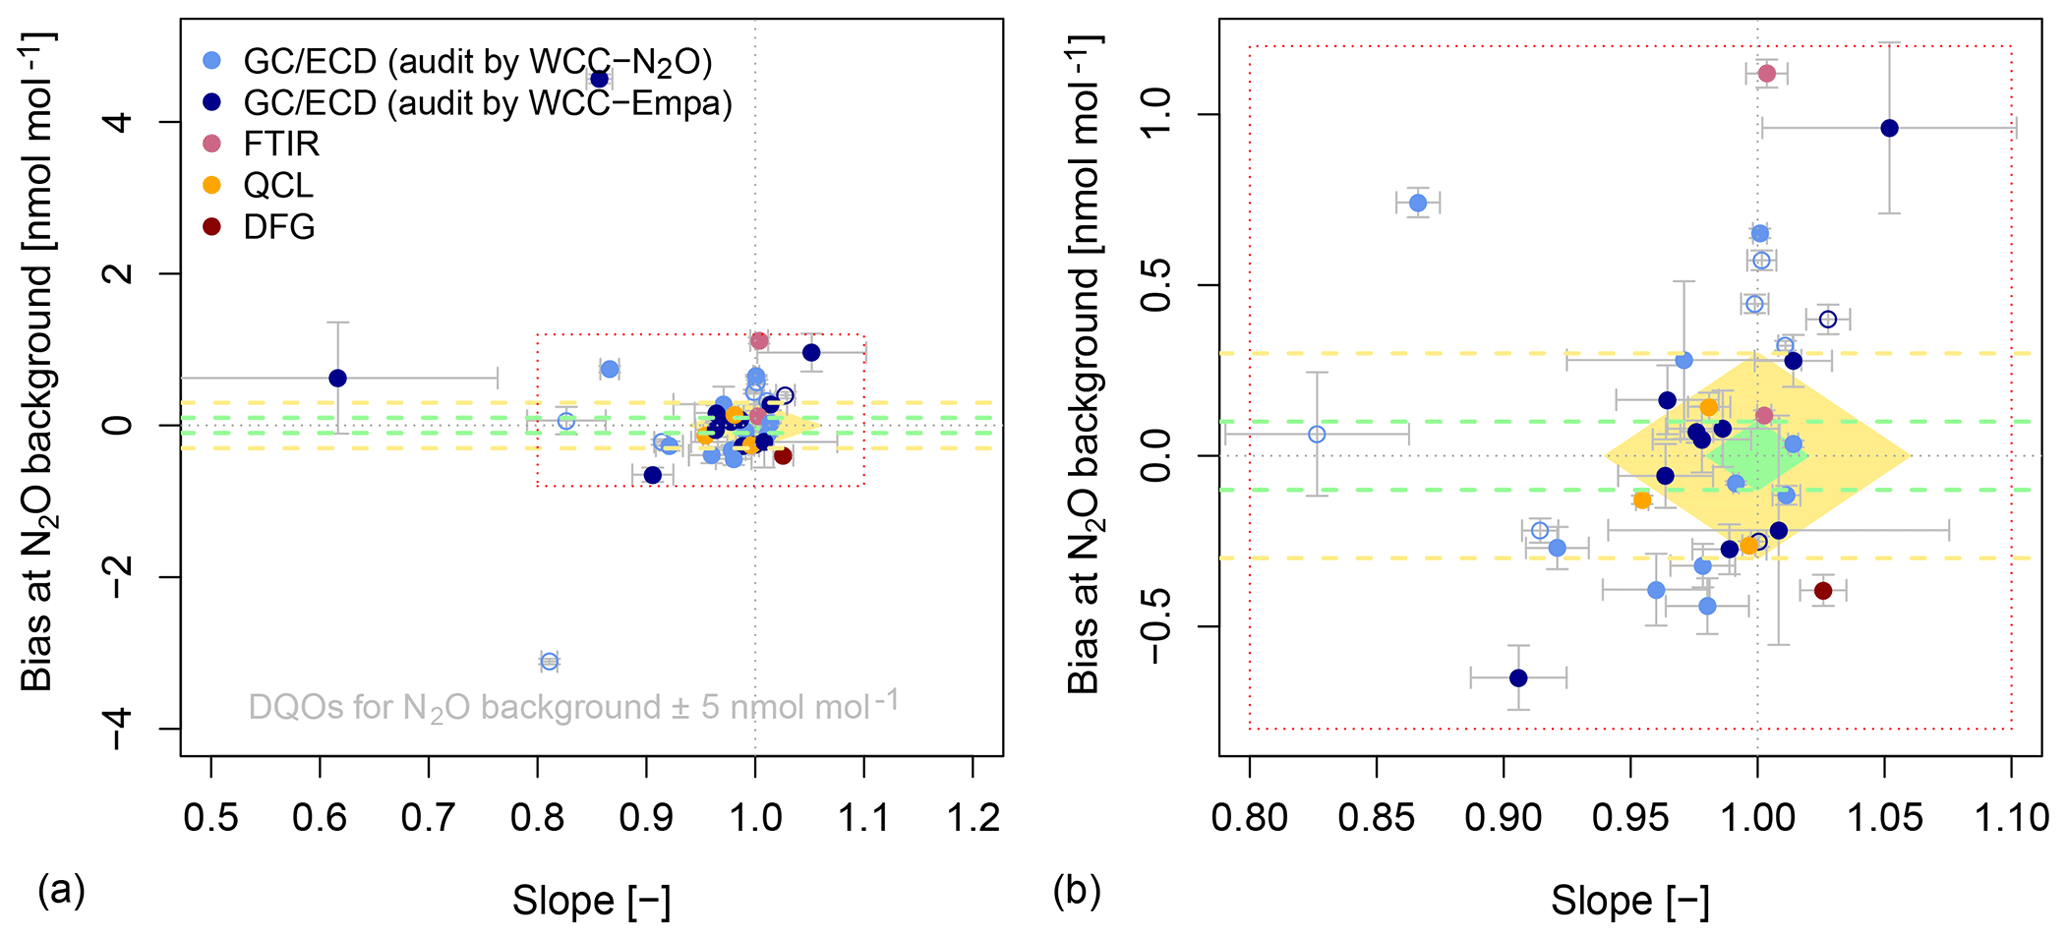
Figure 4(a) N2O bias in the centre of the relevant ambient-air amount fraction (Table 2) vs. the slope of the audit for individual travelling standard comparisons. Different colours indicate different measurement techniques of the station analysers. Filled symbols refer to a comparison with the same calibration scale at the station and the WCC, while open symbols indicate a scale difference. The error bars correspond to the uncertainty of the slope and the bias (1σ). The green and yellow areas correspond to the WMO/GAW network compatibility and extended network compatibility goals for the range of ±5 nmol mol−1 around the centre of the relevant amount fraction range, and the dashed green and yellow lines show the limits at the relevant amount fraction. (b) Detail of the red dotted box in (a).
Comparison with the recent WMO/IAEA Round Robin Comparison Experiment, as done for N2O (see below), is not straightforward. Changes in the calibration scale during the round-robin experiment jeopardises the direct comparison of the audit results with the round-robin results.
3.1.2 Evaluation of N2O comparisons
Figure 4 shows the bias in the centre of the relevant amount fraction range of the year of the comparison vs. the slope for the N2O audits shown in Table 2 along with the allowed bias–slope combinations meeting the network compatibility (green area) and extended network compatibility goals (yellow area) of 0.1 and 0.3 nmol mol−1 (WMO, 2018), respectively. Only results of comparisons with fully functional instruments were considered.
The results presented in Fig. 4 show that reaching the WMO/GAW network compatibility goals remains difficult for N2O. However, calibration ranges at stations can be intentionally limited to the ambient amount fraction typical for their location and time. These ranges are normally significantly smaller than those used in Fig. 4 in the case of N2O. Therefore, bias–slope pairs outside the network compatibility goals do not necessarily imply that the measurements at a station are biased, but they are indicative of the performance of the instrument and its calibration over a given amount fraction range. The dashed green and yellow lines in Fig. 4 denote the limits for meeting the network compatibility and extended network compatibility goals at the relevant amount fraction.
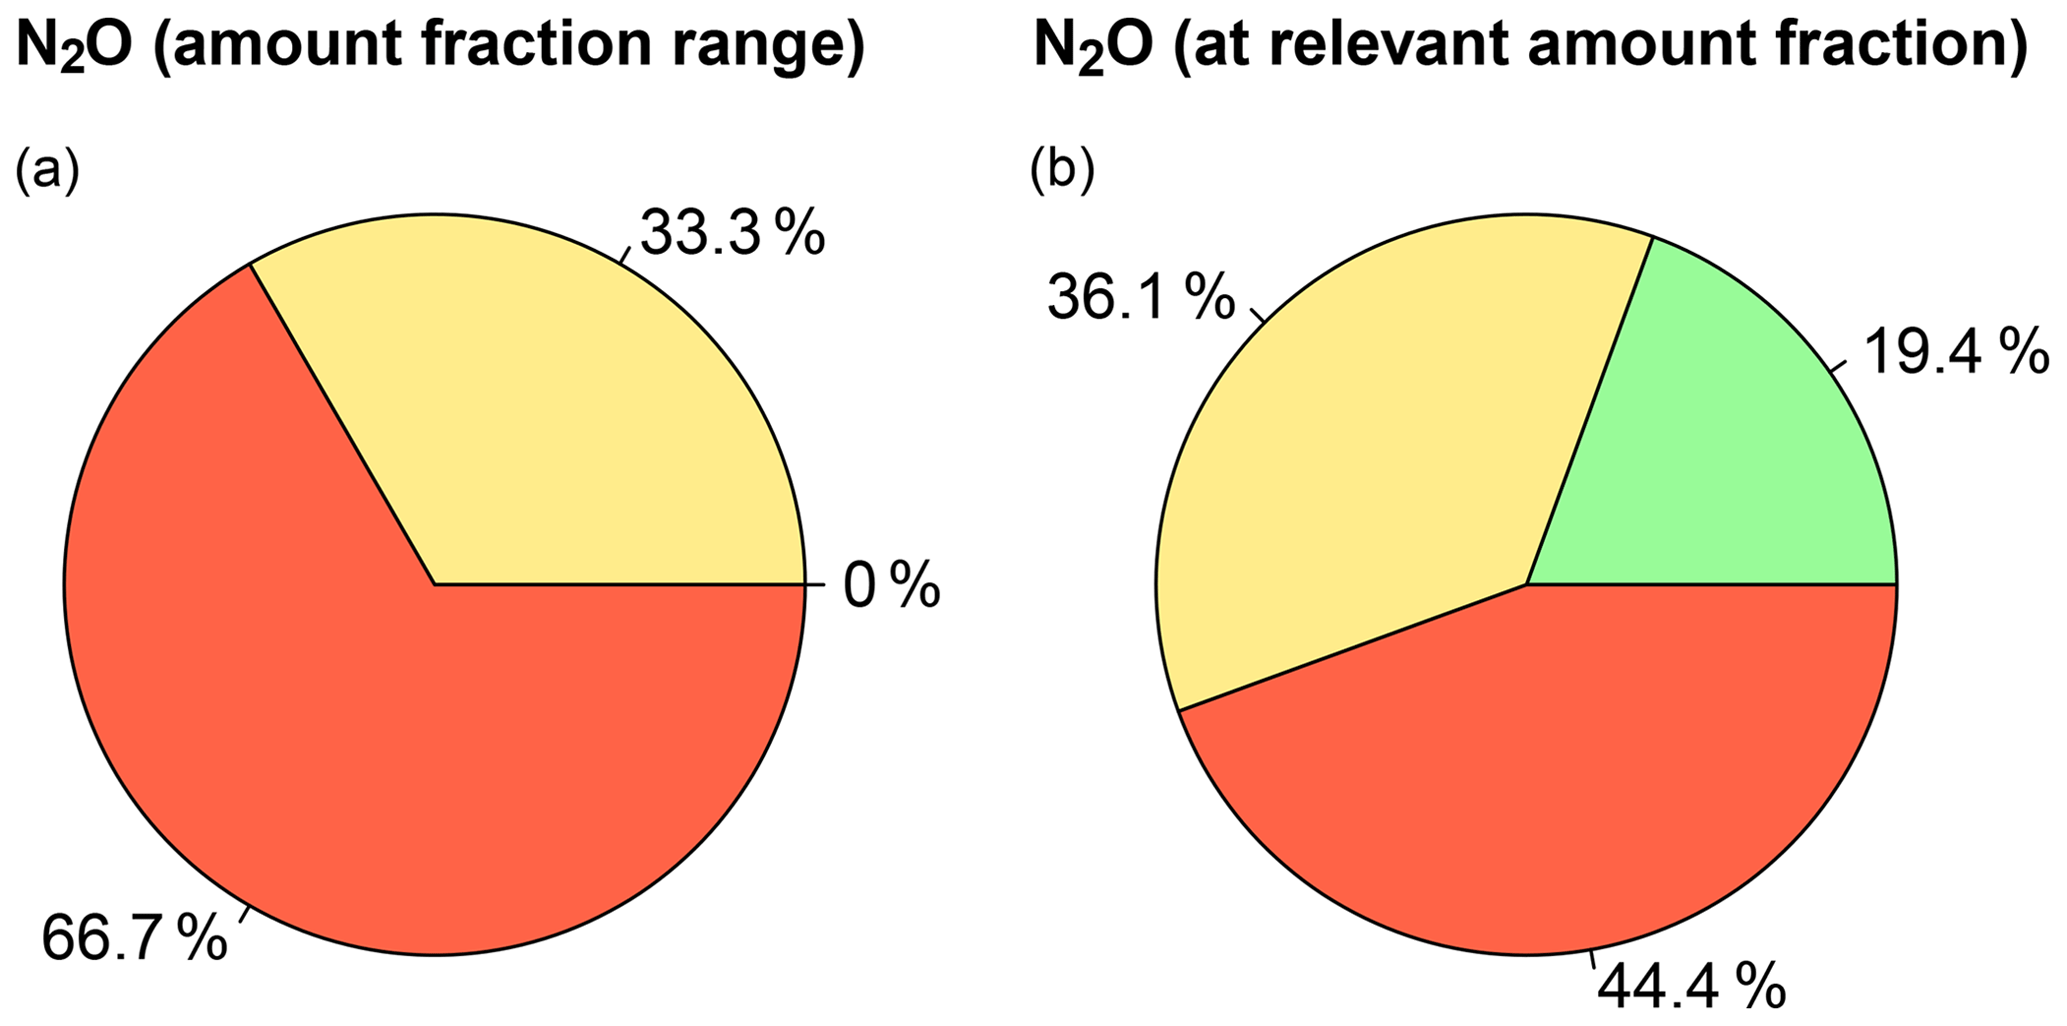
Figure 5(a) Percentage of N2O performance audit results that were for the range of the relevant amount fraction ±5 nmol mol−1 within the WMO/GAW network compatibility goals (green), the extended network compatibility goals (yellow), or outside the network compatibility goals (red). (b) Same as (a) but at the relevant amount fraction (see text for details).
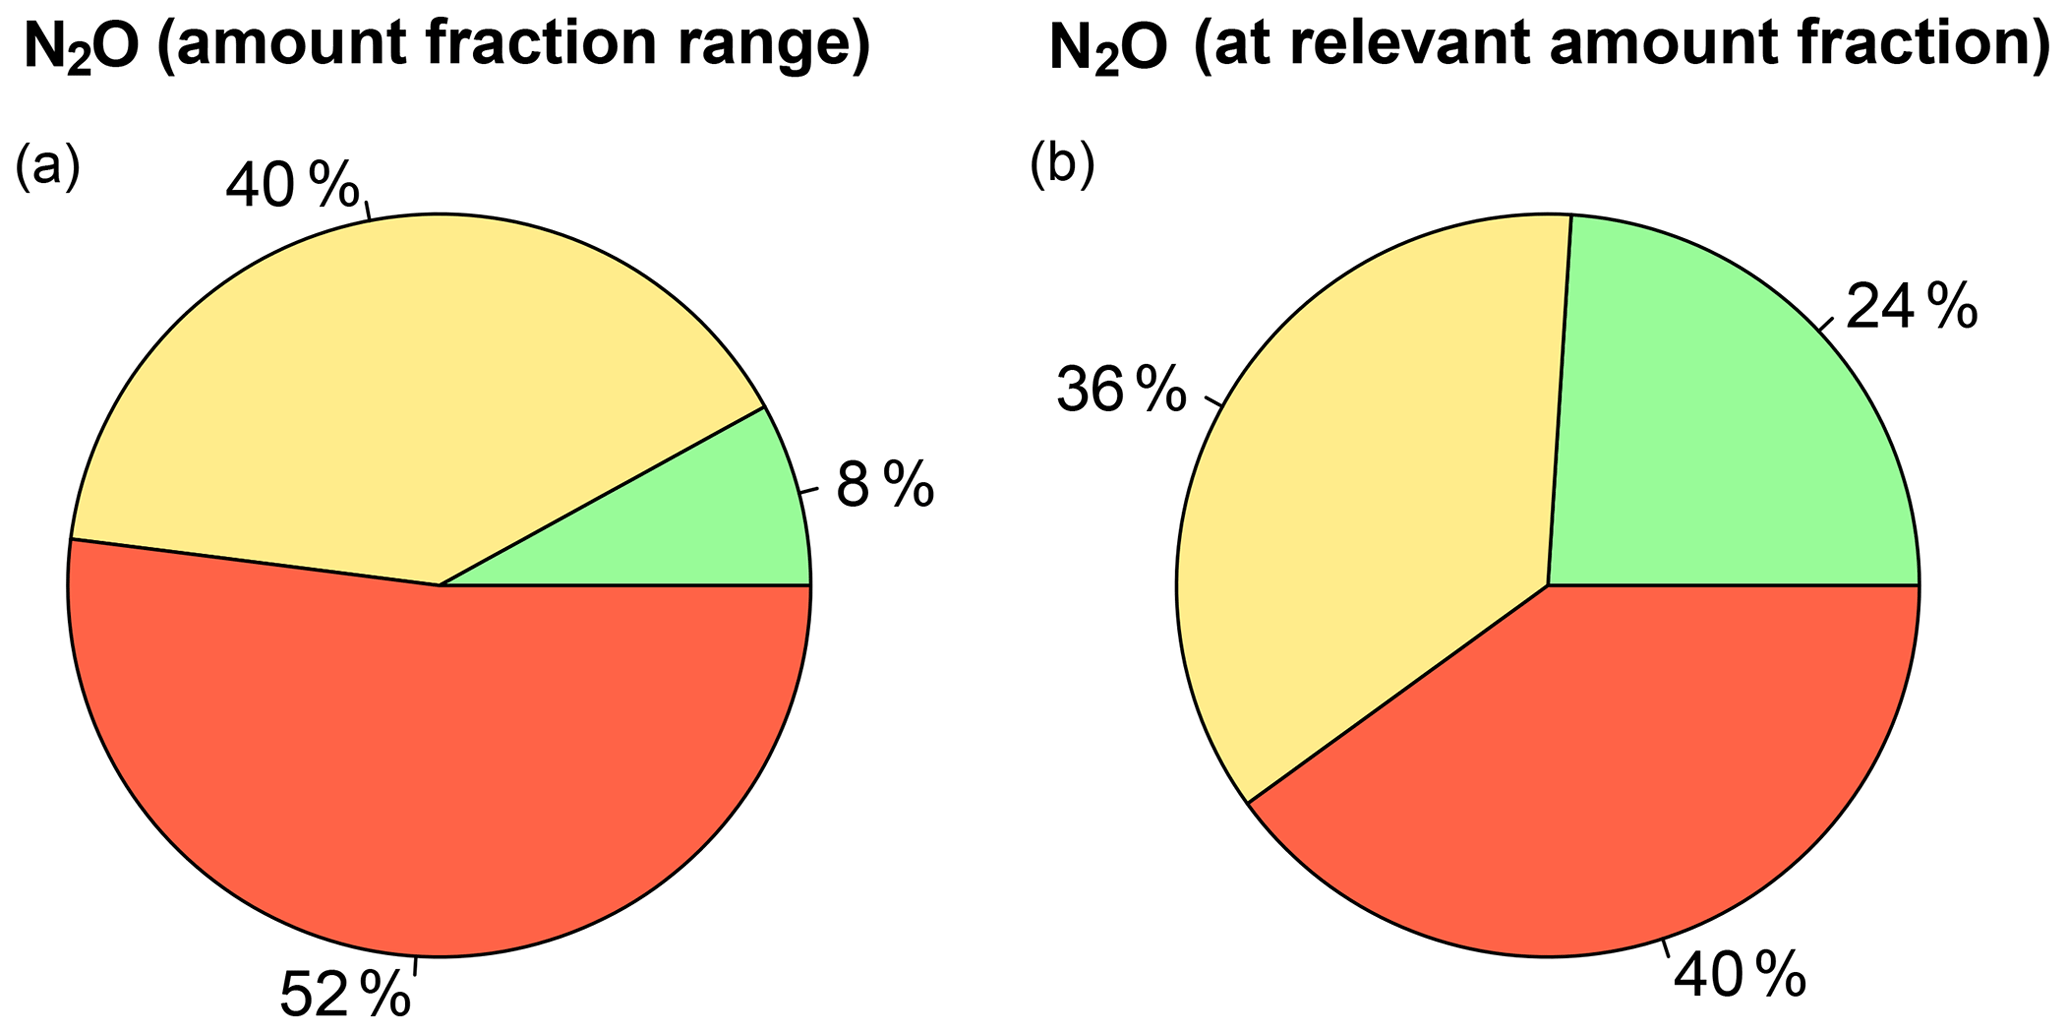
Figure 6(a) Percentage of the results of the sixth round-robin experiment that were for the range of the relevant amount fraction ±5 nmol mol−1 within the WMO/GAW network compatibility goals (green), the extended network compatibility goals (yellow), or outside the network compatibility goals (red area). (b) Same as (a) but at the relevant amount fraction (see text for details).
As discussed above for CO, the distribution of the observed biases and slopes is an indicator of potential systematic offsets, either at the WCCs or at the stations. No significant deviations were observed for audits carried out by WCC-Empa, with a mean value of the bias of 0.32 nmol mol−1 and a dispersion (1σ) of 1.09 nmol mol−1 (t test, p=0.11), and a mean value of the slope of 0.965 with a dispersion (1σ) of 0.093 (t test, p=0.21). WCC-N2O comparisons showed no significant deviations with a mean bias of −0.12 nmol mol−1 and a dispersion (1σ) of 0.89 nmol mol−1 (t test, p=0.35); however, the deviation of the slope with a mean value of 0.954 and a dispersion (1σ) of 0.067 was significant (t test, p=0.01). This result indicates that at the launch of the audits in 2002 the linearity problem of the ECD was not fully considered in the data evaluation by the audited stations. The GC/ECD technique, which contributes most to the results, is known to be highly non-linear (Lebegue et al., 2016), and consequently, deviations are expected for amount fractions away from the relevant level if the non-linearity of the systems had not been determined accurately enough. With ongoing data quality assurance activities and the implementation of linearity corrections for the ECD response, the slope now is close to 1 for more recent performance audits.
Figure 5 presents the result of the above analysis as percentages of comparisons meeting the network compatibility and extended network compatibility goals. Until now, none of the performance audits conducted by either the WCC-N2O or WCC-Empa achieved the compatibility goal of 0.1 nmol mol−1, and only one third of the results were within the extended goals of 0.3 nmol mol−1 when an amount fraction range of 10 nmol mol−1 is considered. This slightly improves if we consider only the bias at the relevant amount fraction. The relevant amount fraction corresponds to the value at the centre of the relevant range for the corresponding year. Under these less stringent conditions, we find 19.4 % compliance with the network compatibility goal and 36.1 % with the extended network compatibility goal. This is in line with the small variations in N2O at remote locations and the corresponding limited calibration range of many stations mentioned above. Lebegue et al. (2016) recognised that measurements of small variations in the N2O amount fractions using GC/ECD is very challenging, which is in agreement with the TS comparison results from the station audits of this work.
The results obtained during the performance audits by WCC-Empa and the WCC-N2O compare well with the recent WMO/IAEA Round Robin Comparison Experiment organised and coordinated by the CCL for N2O hosted by NOAA. The sixth round-robin experiment took place in 2014–2015, and involved the comparison of two standards, one containing a lower (average of 321.6 nmol mol−1) and the other a higher (average of 333.7 nmol mol−1) N2O amount fraction (NOAA, 2018d). A total of 25 laboratories participated in this exercise. With this dataset, we made the same analysis as described above after the exclusion of two laboratories using calibration scales other than WMO-X2006A. The percentage of laboratories fulfilling the WMO network compatibility and extended network compatibility goal was very similar to the results from the station audits by WCC-Empa and the WCC-N2O, as shown in Fig. 6.
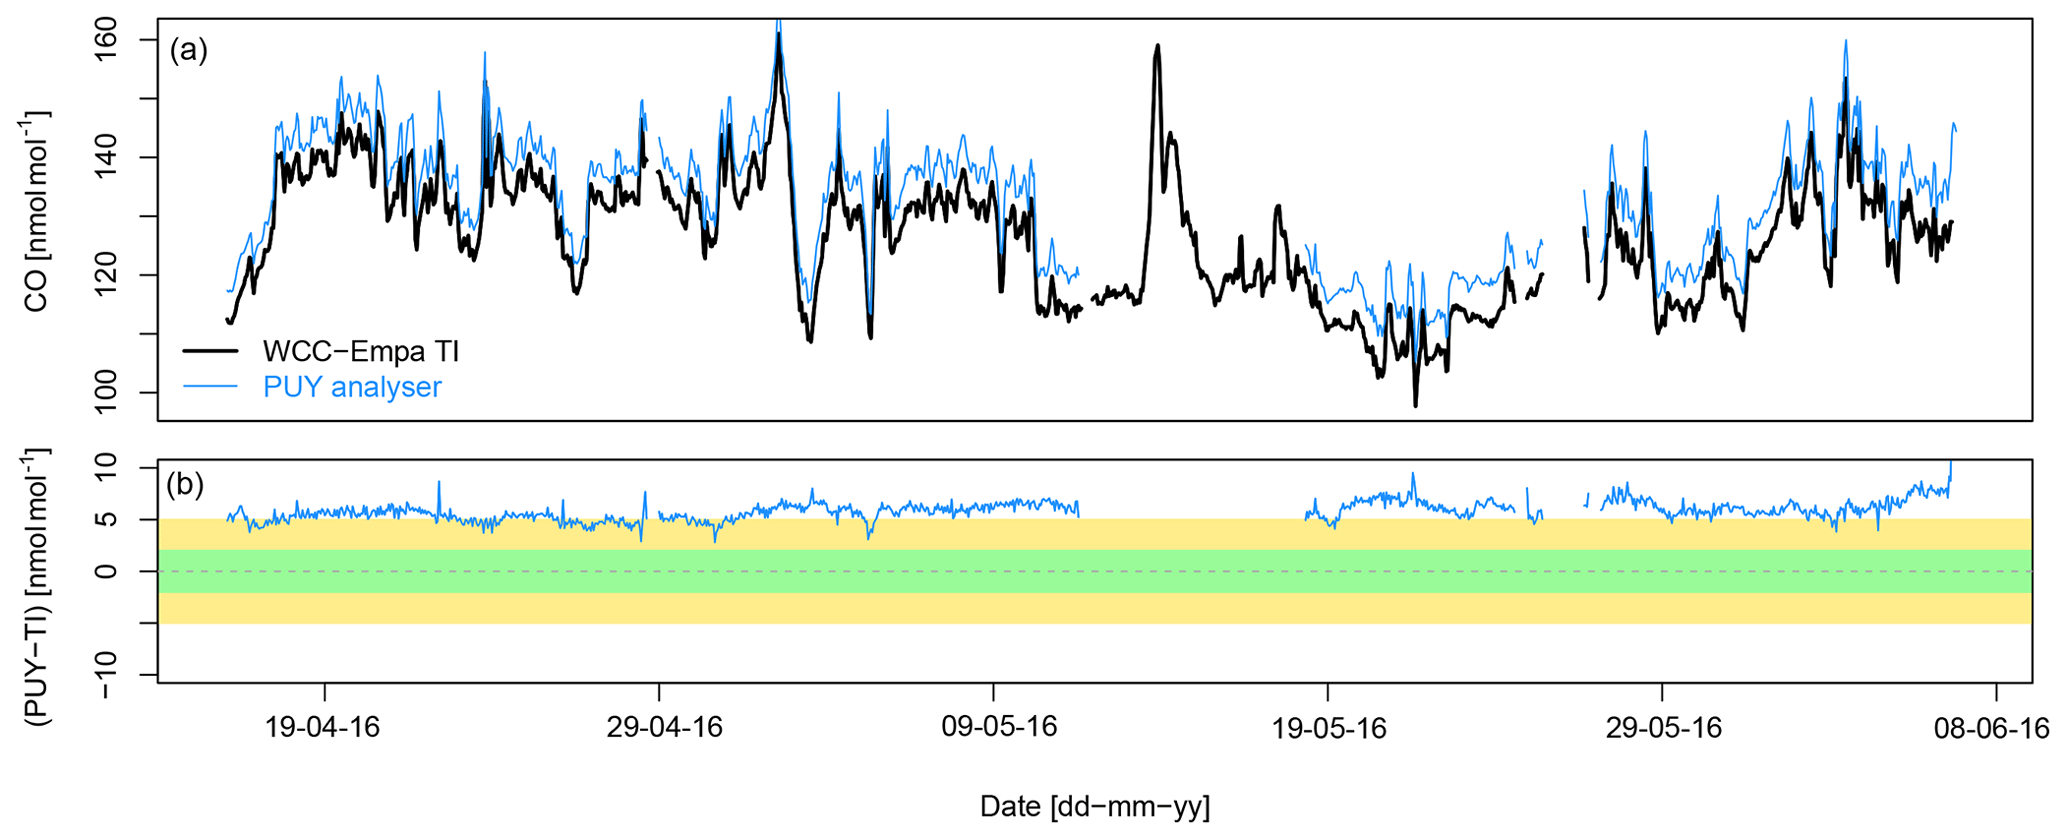
Figure 7Comparison of hourly averages of CO at PUY between the WCC-Empa travelling instrument and the PUY Picarro G2401 for the period when the TI sampled humid air. (a) CO time series. (b) CO bias of the station analyser vs. time. The green and yellow areas correspond to the WMO network compatibility and extended network compatibility goals.
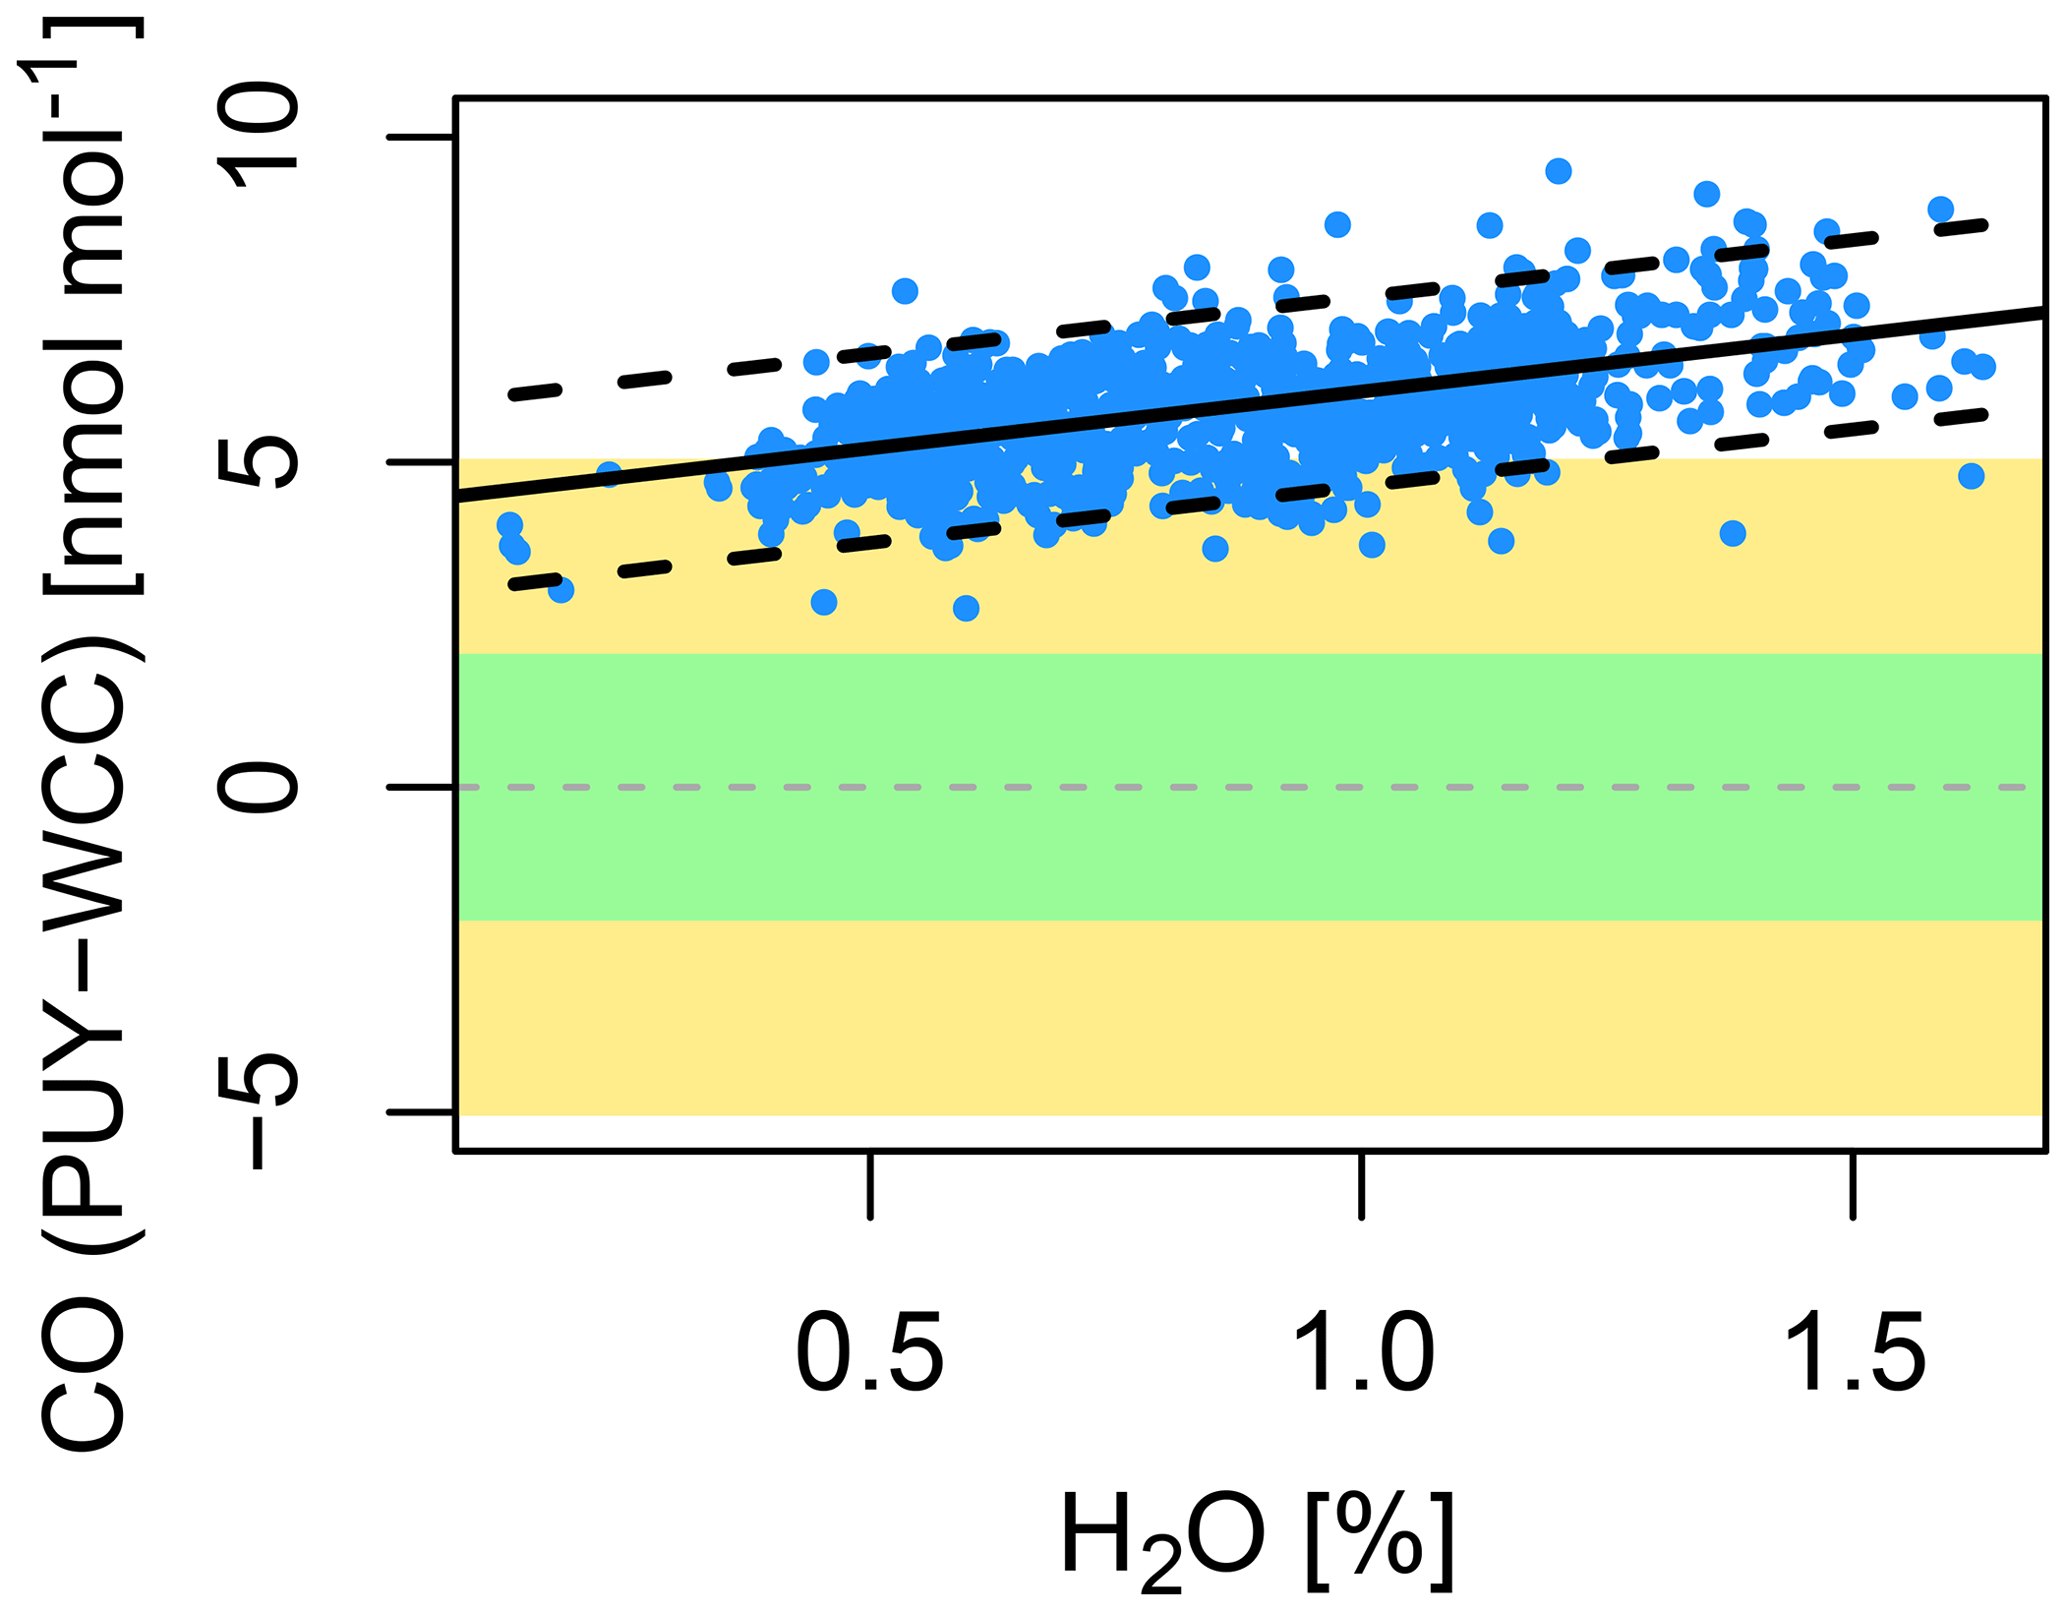
Figure 8Bias of the PUY Picarro G2401 vs. the water vapour measured by the TI. The solid black line shows the linear regression with a 95 % confidence interval (dashed lines). The green and yellow areas correspond to the WMO network compatibility and extended network compatibility goals.
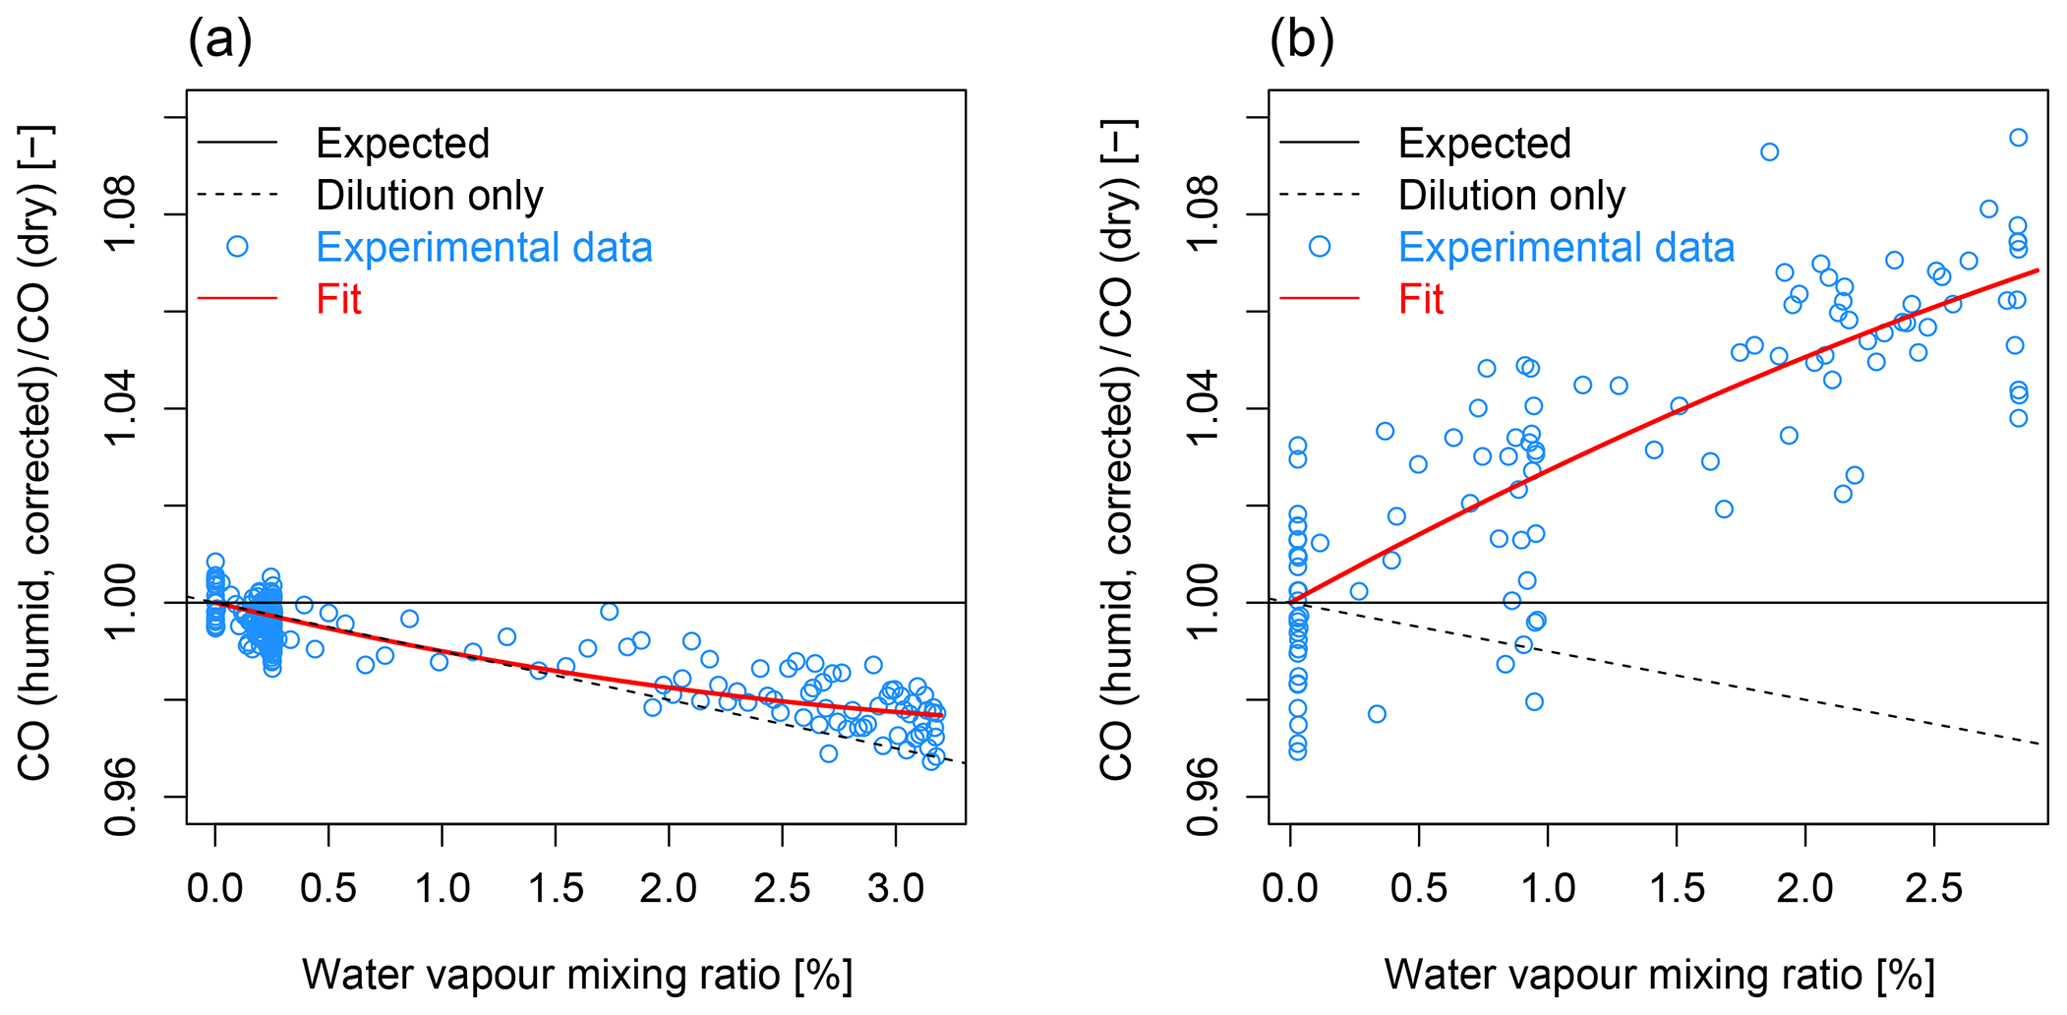
Figure 9CO (humid, corrected) / CO (dry) vs. the reported water vapour for the experiment before (a) (23 March 2016) and after (b) (14 July 2016) the comparison at PUY.
Out of the 25 laboratories in the round-robin experiment, only two (8 %) were entirely within the WMO/GAW network compatibility goal of 0.1 nmol mol−1 for the 10 nmol mol−1 range. At the relevant amount fraction, the percentage of laboratories that were not meeting the quality goals was very similar for the WCC audits (44 %) and the round-robin experiment (40 %).
The above results, both for TS comparisons during audits and the round-robin experiment, are clearly illustrating that it remains highly challenging to reach the network compatibility and extended network compatibility goals for N2O. In contrast to advances made for the detection of CH4, CO2 (Zellweger et al., 2016), and CO, measurements of N2O were in most cases still based on gas chromatography, and only a few recent comparisons involved spectroscopic techniques. The data for N2O clearly indicate the advantages of the spectroscopic techniques compared to gas chromatography. The uncertainty of the observed intercepts and slopes of the linear regression gives information on the linearity and repeatability of the system. The uncertainty of the slope of the linear regression was significantly smaller for QCL and FTIR analysers (median of 0.0028, standard deviation of 0.0031) compared to GC/ECD systems (median of 0.0126, standard deviation of 0.0284). Despite the better performance regarding the linearity and repeatability of the spectroscopic techniques compared to GC/ECD, no clear advantage of the spectroscopic methods was observed during the performance audits. A potential reason could be the uncertainty of the calibration standards, which in the case of N2O is of the same order or even larger than the WMO/GAW network compatibility goal. The CCL determined a reproducibility of N2O calibrations in the ambient range of ∼0.22 nmol mol−1 (95 % confidence level) (Hall et al., 2007; NOAA, 2018c), which is larger than the network compatibility goal. However, this uncertainty is low compared to uncertainties associated with the gravimetric preparation of standards, which highlights the importance of maintaining and propagating calibration scales (Brewer et al., 2018) as implemented in the WMO/GAW programme. Therefore, it is yet too early to quantify this improved performance of spectroscopic techniques for N2O and give a final statement with respect to the network compatibility goals.
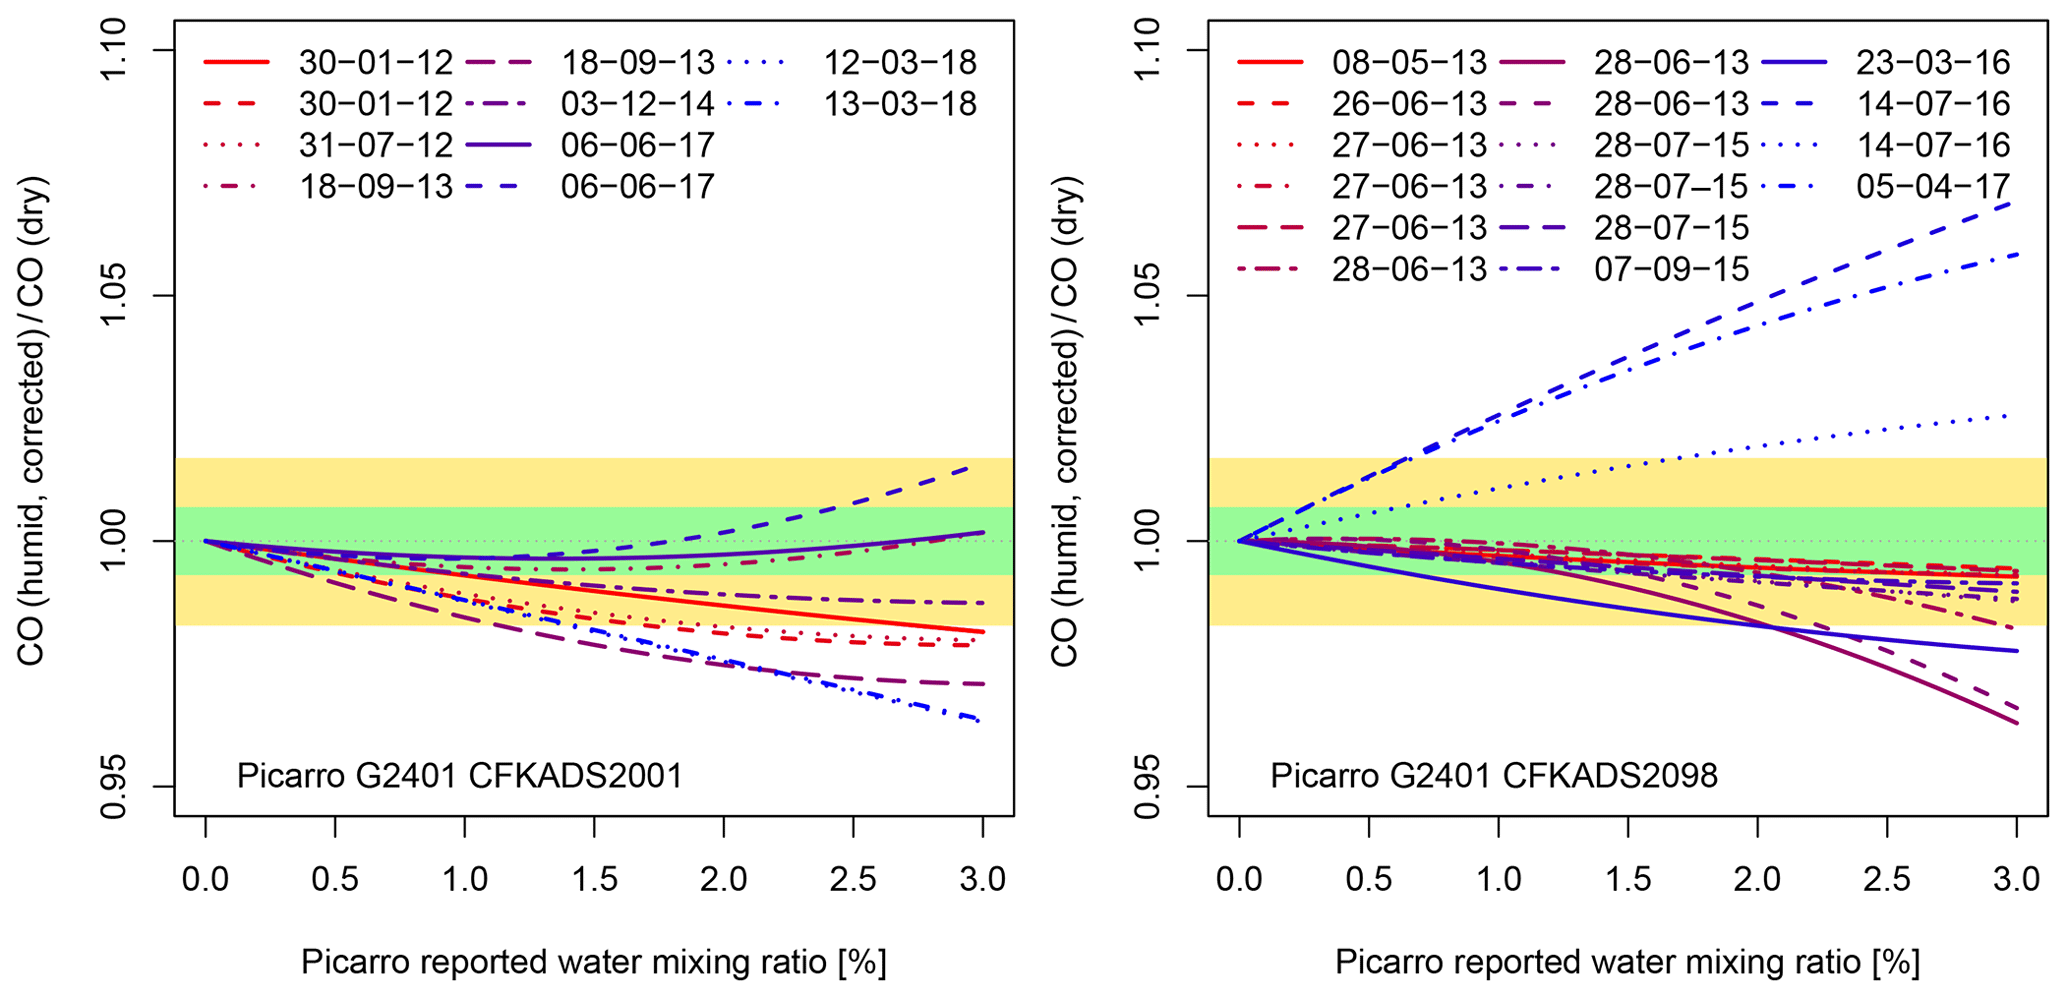
Figure 10Ratios of CO (humid, corrected) / CO (dry) amount fractions vs. the water vapour mixing ratios of two different Picarro G2401 NIR-CRDS analysers over time. The legend shows the date (dd-mm-yy) of the experiment. The coloured areas are the limits for the WMO/GAW network compatibility goal (green) and extended (yellow) network compatibility goal at the amount fraction of 300 nmol mol−1 CO.
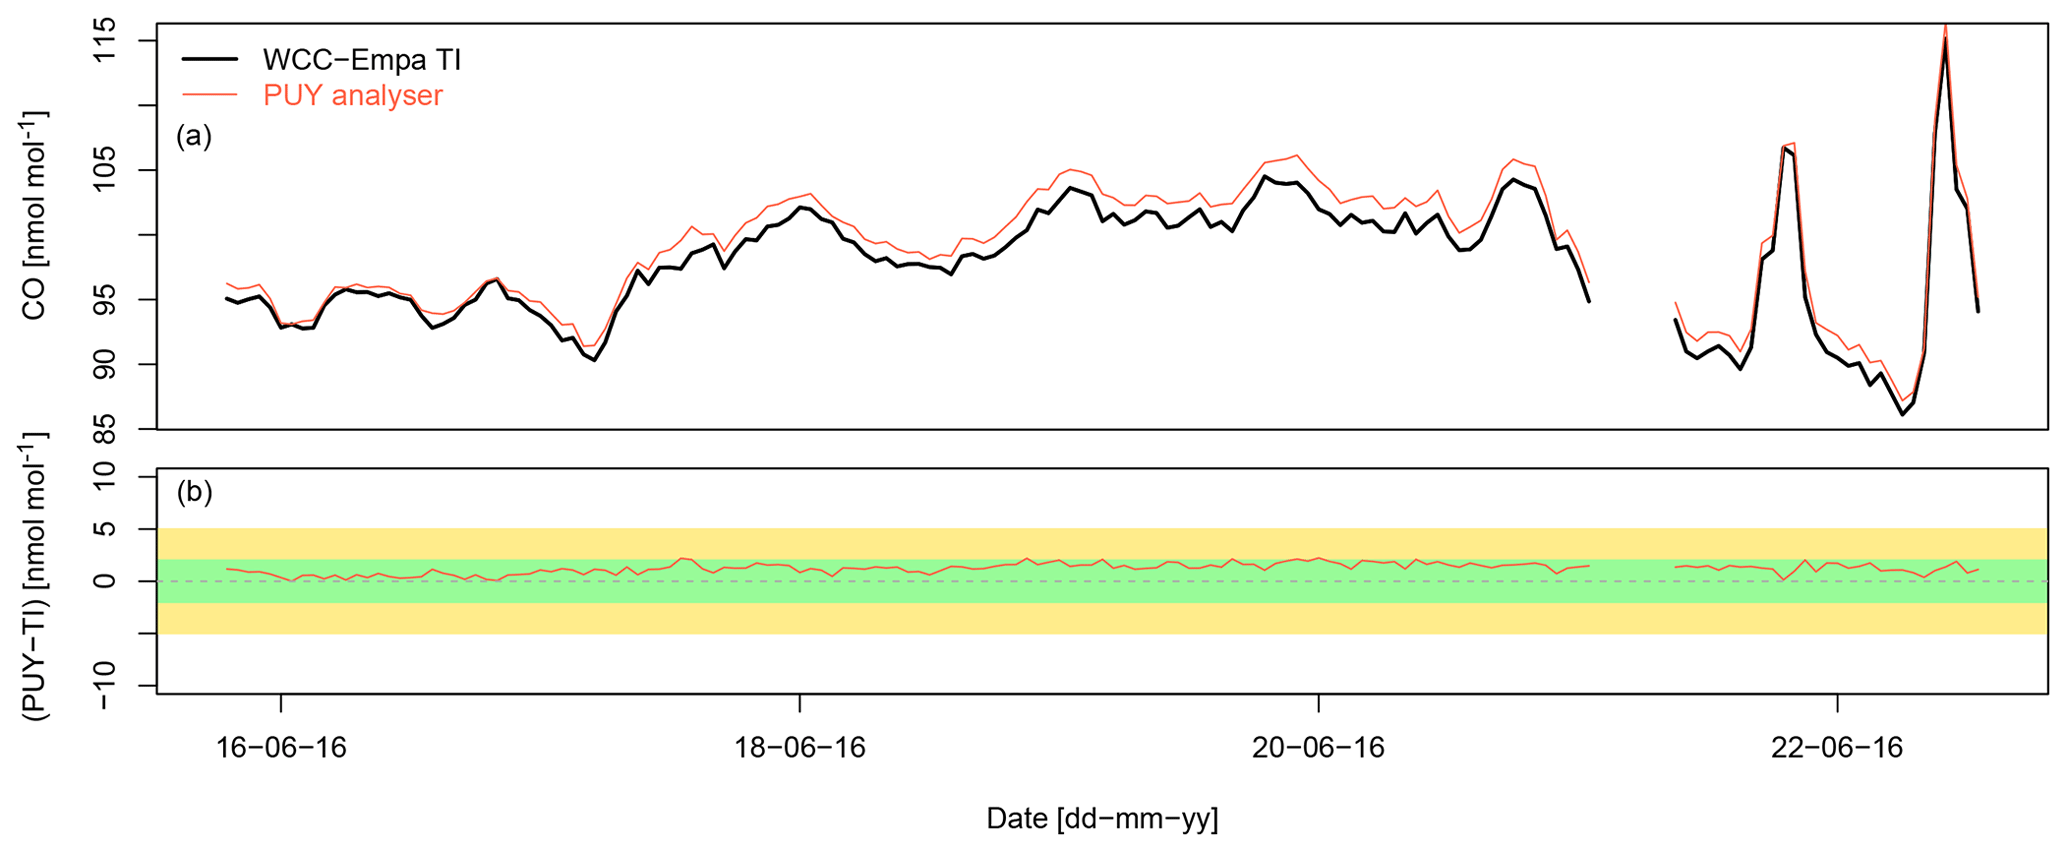
Figure 11Comparison of hourly averages of CO at PUY between the WCC-Empa travelling instrument and the PUY Picarro G2401 for the period when the TI sampled dry air. (a) CO time series. (b) CO bias of the station analyser vs. time. The green and yellow areas correspond to the WMO network compatibility and extended network compatibility goals.
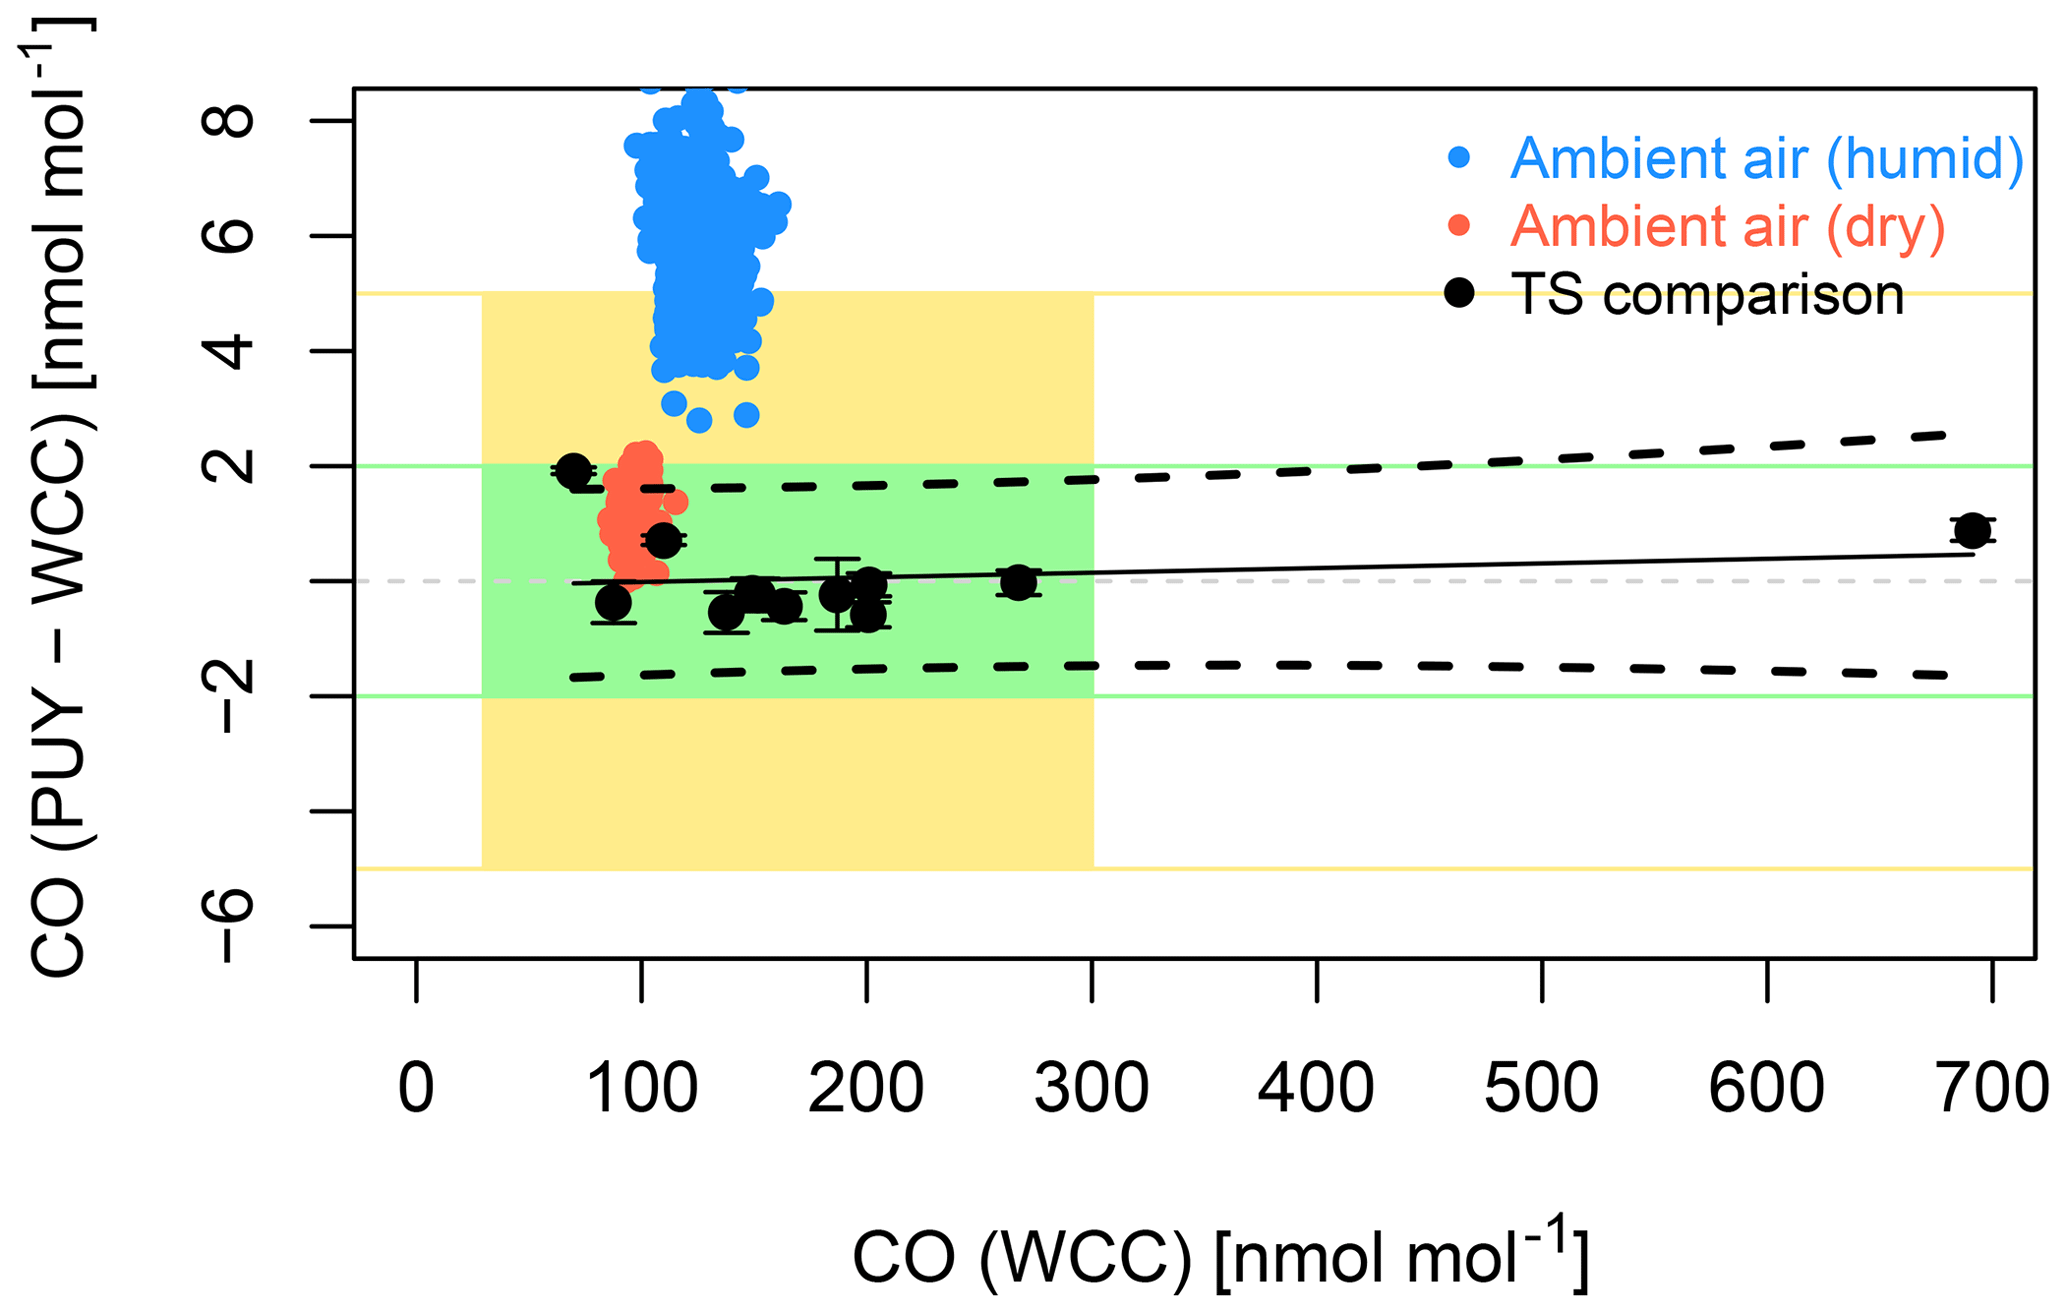
Figure 12Bias of the PUY Picarro G2401 CO instrument vs. WCC-Empa assigned values. Black dots represent the average of the data at a given level from a specific TS comparison. The error bars show the standard deviation of individual measurement points. The green and yellow lines correspond to the WMO network compatibility and extended network compatibility goals, and the green and yellow areas to the amount fraction range relevant for PUY. The dashed lines around the regression lines are the Working–Hotelling 95 percentage confidence intervals. The coloured dots show the bias during the ambient-air comparison without (blue) and with (red) drying of the air sampled by the TI.
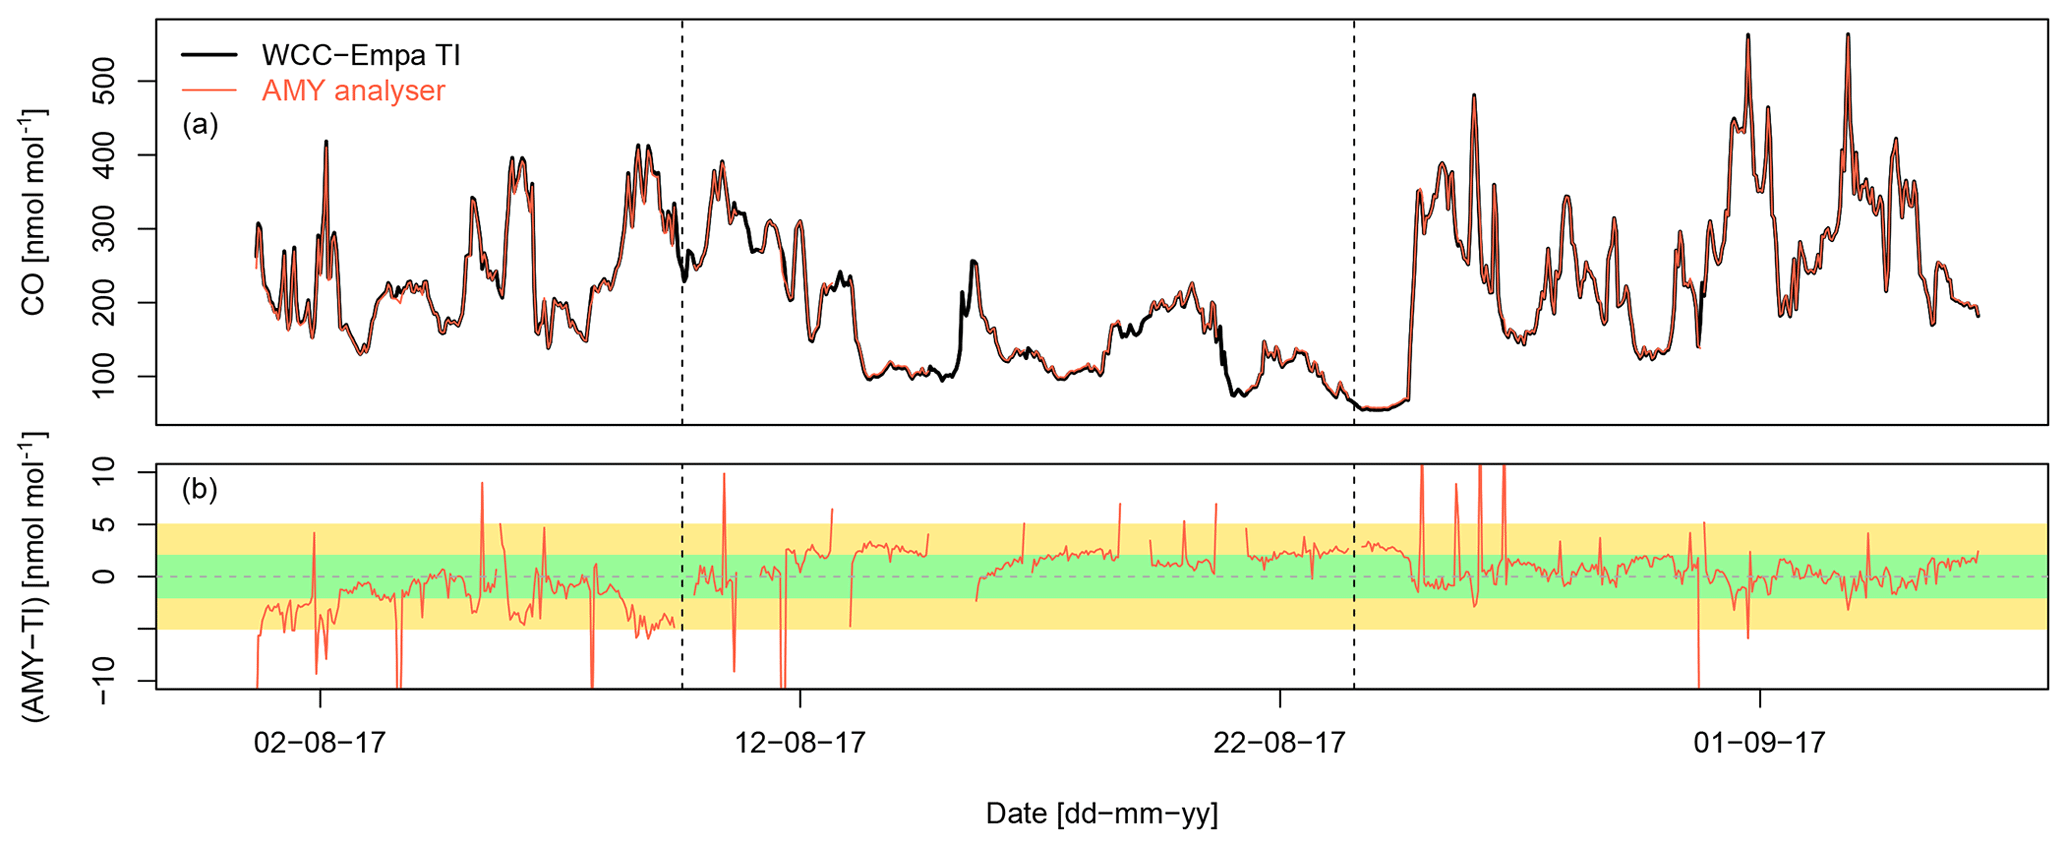
Figure 13Comparison of hourly averages of CO at AMY between the WCC-Empa travelling instrument and the AMY Los Gatos 30-EP QCL analyser. Both instruments sampled dry ambient air. (a) CO time series. (b) CO bias of the station analyser vs. time. The green and yellow areas correspond to the WMO network compatibility and extended network compatibility goals. The dashed vertical lines indicate the time of the calibration of the AMY instrument.
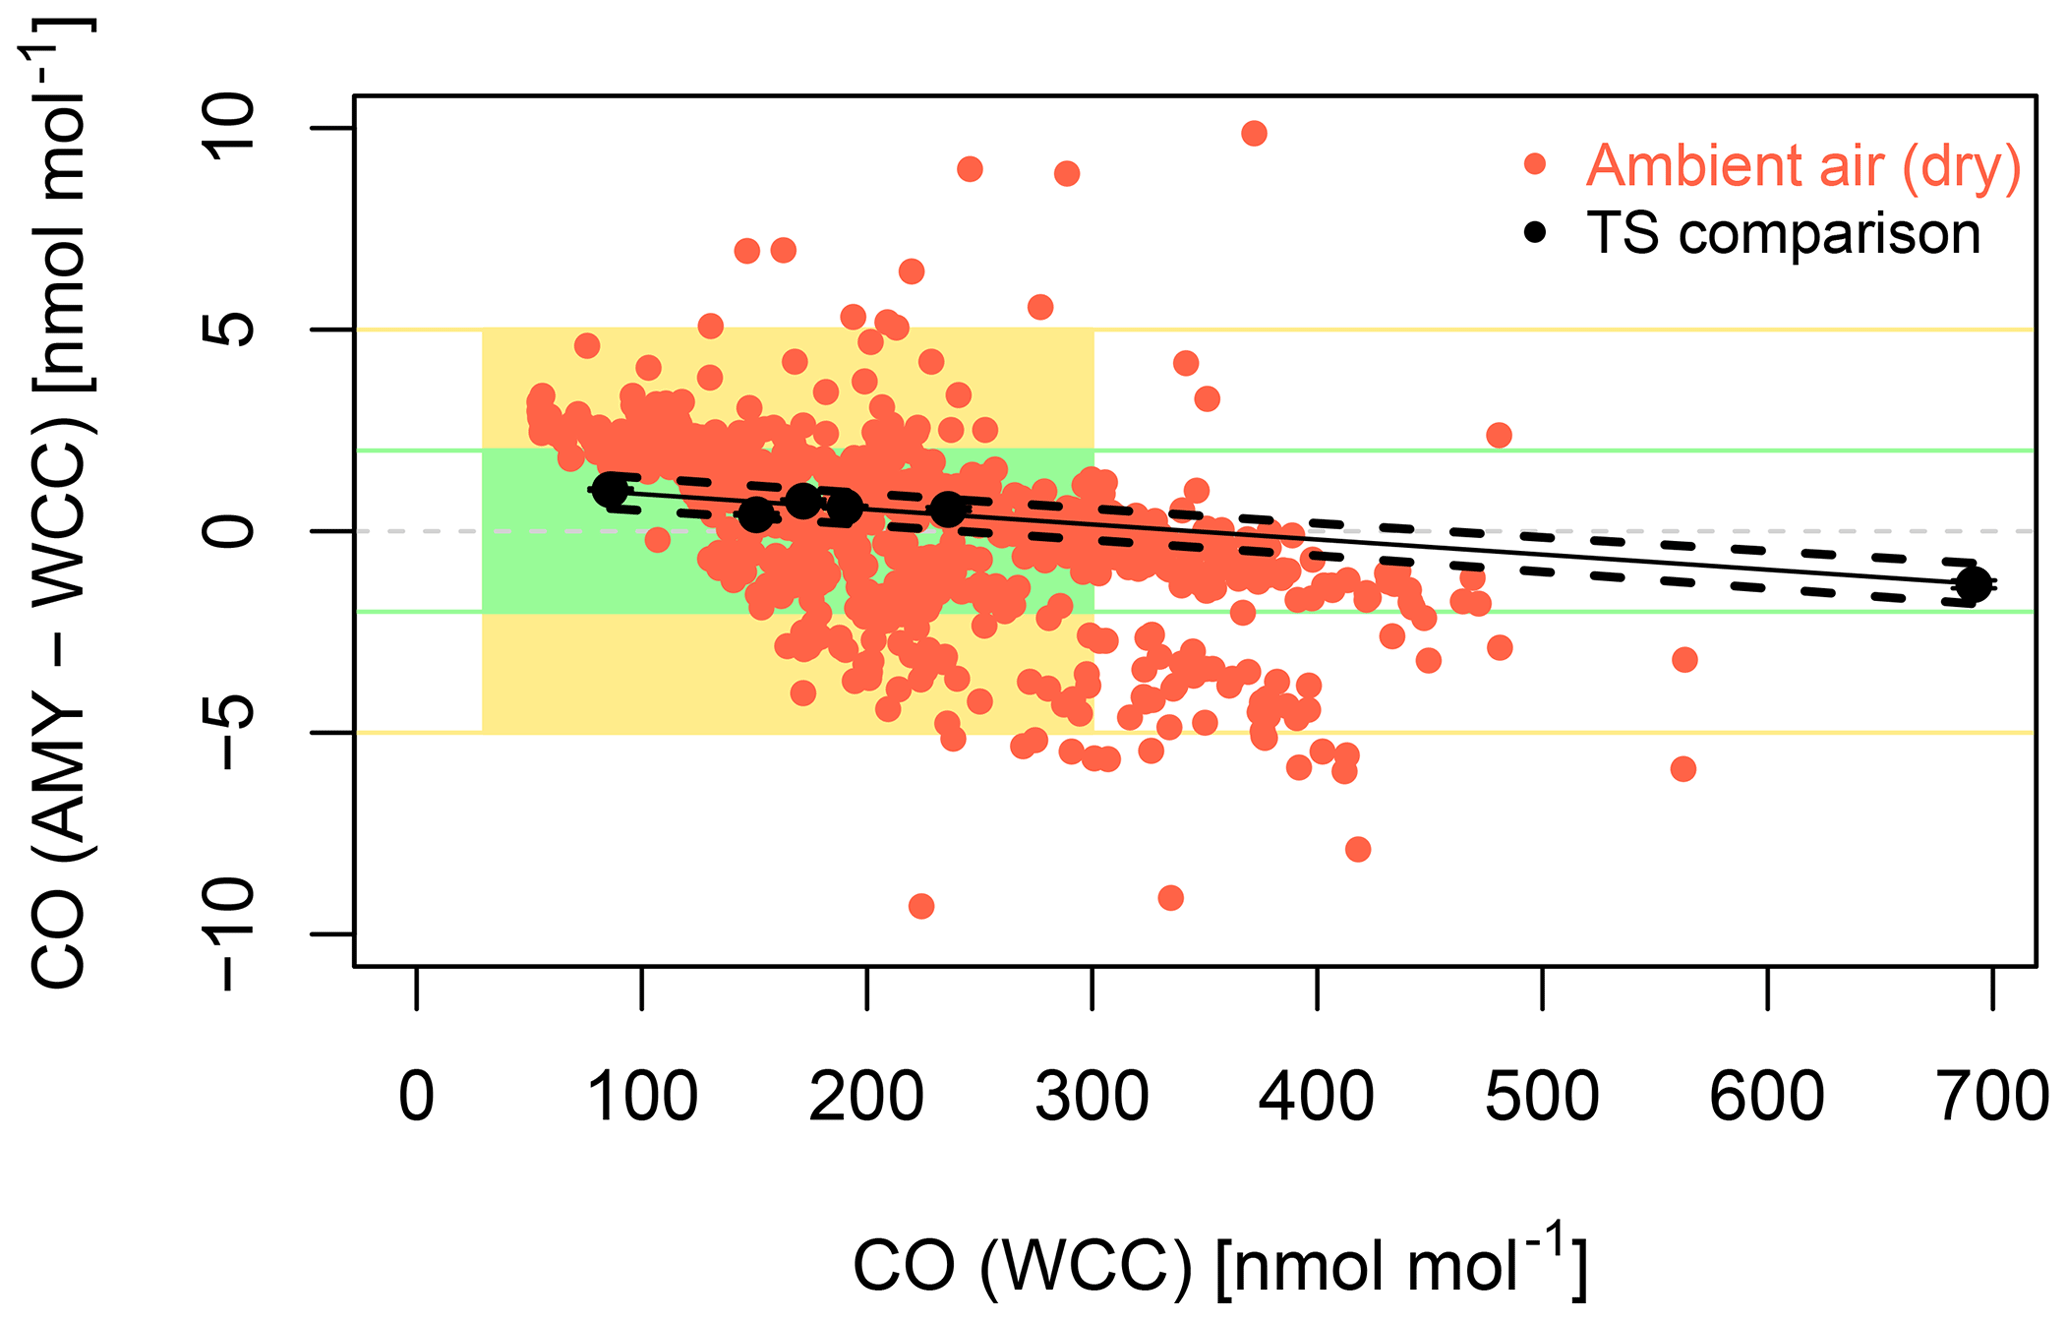
Figure 14Bias of the AMY Los Gatos 30-EP CO instrument vs. WCC-Empa assigned values. Black dots represent the average of the data at a given level from a specific TS comparison. The error bars show the standard deviation of individual measurement points. The green and yellow lines correspond to the WMO network compatibility and extended network compatibility goals, and the green and yellow areas to the amount fraction range relevant for PUY. The dashed lines around the regression lines are the Working–Hotelling 95 % confidence intervals. The red dots show the bias during the ambient-air comparison.
3.2 Ambient-air comparisons
The above results, as well as round-robin experiments, are travelling standard comparisons and are therefore not covering all aspects of ambient-air measurements. Other aspects include bias due to sampling procedures, drying, or potentially relevant insufficient accounting of spectral interferences, e.g. by water vapour. For example, Chen et al. (2013) demonstrated that accurate measurements of CO in humid air is possible with the NIR-CRDS technique implemented by Picarro. Correction functions however are different for each individual instrument, and as a result of the work of Chen et al. (2013), these functions have been implemented in Picarro NIR-CRDS CO analysers since 2012.
WCC-Empa started with parallel measurements of ambient air for CO, CO2, and CH4 during station audits in 2011. The results of the greenhouse gas comparisons showed that additional information, e.g. related to air inlet systems, is obtained by these comparisons (Zellweger et al., 2016). However, these comparisons were in many cases less conclusive for CO. Some parallel measurements showed differences that were not present in the travelling standard comparisons. Sampling issues were unlikely because the ambient-air comparison of CH4 and CO2 agreed well. Therefore, other issues like interferences of ambient-air constituents may cause an additional bias.
For example, the comparison made at the global GAW station Puy de Dôme (PUY) in 2016 showed significant deviations in ambient CO measurements, as illustrated in Fig. 7, while the TS comparison showed good agreement. During this period, the PUY analyser was measuring on average 5.85 nmol mol−1 (standard deviation of 0.94 nmol mol−1) higher than the TI. Despite this bias, both instruments captured the temporal variation well. The WCC-Empa travelling instrument was sampling from the same air intake location but with a completely independent sampling line. In contrast to the PUY instrument, which sampled air dried to a dew point of −50 ∘C, the air sampled by the travelling instrument was not dried. As discussed in Sect. 2.2, the factory-implemented water vapour correction was used. The observed bias correlates with the measured water vapour, as shown in Fig. 8, which indicates issues with the internal water vapour compensation of the TI. Water vapour correction functions of this instrument were determined three weeks before and three weeks after the comparison campaign with a droplet test, in analogy to the method described by Rella et al. (2013). Figure 9 shows the ratio of CO (humid, corrected) / CO (dry) against the measured water vapour content of the TI; CO (dry) is the amount fraction measured by the instrument in the absence of water, and CO (humid, corrected) the water-vapour-corrected CO amount fraction reported by the Picarro G2401 during the humidification by the droplet test. Since the Picarro G2401 reports CO only as a dry-air amount fraction, the measured ratio should be equal to 1 and not depend on water vapour content. However, a significant change in the CO response in relation to water vapour was observed. The TI was underestimating the CO amount fraction in the experiment before the campaign (Fig. 9a), and it then changed to an overestimation after the campaign (Fig. 9b). Possibly, this has been influenced by the upgrade to a new software version of the TI between the two periods. Unlike for CO2 and CH4, individual water vapour correction functions for CO can currently not be determined with sufficient accuracy to achieve the WMO/GAW network compatibility goal of 2 nmol mol−1. Individual experiments using the droplet test have a large uncertainty due to higher instrumental noise for CO compared to CH4 or CO2. Furthermore, CO correction functions seem to be less stable over time, and sudden changes are possible. Figure 10 shows fitted ratios of CO (humid, corrected) / CO (dry) vs. the measured water vapour content for two different instruments over a period of several years. Both instruments show significant variation over time in the humidity-corrected CO reported by the analyser. Consequently, drying of the sample air could improve CO measurements with Picarro G2401 instruments and likely with Picarro G1302 and G2302 CO/CO2/H2O analysers. This has been confirmed by a period of dry ambient-air measurements of both instruments at PUY. Figure 11 shows the comparison of the two analysers during the audit collocation measurement. In this case, the TI was connected to the same sampling line as the PUY instrument after the cryogenic trap, and both instruments were measuring dry air. The bias of the PUY analyser significantly decreased to 1.20 nmol mol−1 with a dispersion (1σ) of 0.57 nmol mol−1. This agrees well with the observed bias during the travelling standard comparison. Potentially, the change of the inlet system could also have been the reason for the reduction in the bias. However, this is unlikely because no change in the bias of CH4 and CO2 amount fraction, which were both measured simultaneously together with CO over the same inlet line, was observed. Figure 12 summarises the results of the performance audits at PUY with TS, as well as the bias observed during the comparison campaign with humid and dry measurement of the TI.
Figure 13 shows another example of a CO ambient-air comparison made at the regional GAW station Anmyeon-do, South Korea, over a period of 1 month in 2017. The comparison was made between the AMY OA-ICOS analyser (LGR-30-EP, Los Gatos Research, USA) and the WCC-Empa Picarro G2401 travelling instrument. Both analysers were measuring ambient air dried to a dew point of −50 ∘C using a cryogenic trap. Temporal variability at this site is significantly larger compared to PUY, and except for a few spikes, it was well captured by both instruments. The bias of the AMY analyser averaged to 0.10 nmol mol−1 with a dispersion (1σ) of 3.20 nmol mol−1 over the entire period of the campaign. However, during the first third of the campaign, the AMY instrument was slightly underestimating the CO amount fraction compared to WCC-Empa (bias of −2.28 nmol mol−1, dispersion of 2.91 nmol mol−1), followed by a slight overestimation in the second third (bias of 1.47 nmol mol−1, dispersion of 2.81 nmol mol−1). The last third then showed good agreement between the two systems (bias of 0.57 nmol mol−1, dispersion of 2.80 nmol mol−1). These differences are likely due to different calibration strategies. The TI was measuring three standard gases to calibrate and compensate for drift of the instrument every 30 h. In contrast, manual calibrations were made of the AMY analyser every 14 d with one calibration standard (dried ambient air traceable to the WMO-X2014A scale), applied as a stepwise change fortnightly, and with no further corrections applied in the meantime. These manual calibrations coincide with the observed change in the bias. Consequently, more frequent calibrations or automated measurements of a working standard to compensate for drift would have further improved the agreement. The ambient-air measurements made at AMY were also in agreement with the TS comparison, which is illustrated in Fig. 14. The scatter in the bias is significantly larger for ambient-air measurements compared to the TS comparison. Firstly, part of this may be explained by the calibration strategy, as discussed above. Secondly, differences in the response time for both instrument types as well as residence time in the inlet might further add to the observed scatter, especially in case of rapid changes in the CO amount fraction, which frequently occurred at AMY.
Both campaigns show that accurate measurements of CO are possible if the sample air is dried. So far, this has not yet been implemented at all measurement stations. The above case study at PUY as well as the experiments done involving the droplet tests only investigated the internally implemented water vapour correction of the Picarro G2401, which proved to be not sufficiently stable enough to achieve the network compatibility goals of the WMO/GAW programme. Alternatively, better determination of the remaining water vapour interference is needed. The droplet method might not be suitable due to the relatively fast drying process, which results in relatively high uncertainties due to the analyser's noise. Alternative methods, e.g. as described by Reum et al. (2019) or as implemented by the ICOS Metrology Laboratory, which uses a Bronkhorst vapour delivery module (VDM) to humidify a gas stream from a tank, might give better results. In addition to improvements of the droplet method, alternative ways to compensate for the water-vapour-dependent CO bias need to be explored. Chen et al. (2013) showed that the main uncertainty of the water vapour correction is due to the fact that the weak CO absorption line is bracketed by adjacent absorption lines of CO2 and H2O. Our results indicate that the compensation of the water vapour interference based on the work of Chen et al. (2013), which has been implemented in Picarro analysers since 2012, does not appropriately correct all the bias and may change over time. Therefore, frequent determination of the water vapour interference will be needed to ensure long-term stability of the correction function or to characterise its change over time. However, this will most likely be insufficient to detect the sudden changes in the correction function that were observed in our experiments. Consequently, drying the sample air should be considered when measuring CO with a Picarro G2401 instrument. Both cryogenic traps and Nafion dryers can be used. WCC-Empa now uses Nafion dryers for the parallel measurements during station audits. Both single tube (MD-070-48S-4) and multi-tube (PD-50T-12MPS) Nafion dryers in reflux mode using the Picarro pump for the vacuum in the purge air were employed successfully. This reduced the amount of water to approximately 0.06 %–0.22 % (single tube) and 0.01 %–0.03 % (multi-tube), depending on ambient-air humidity. In case of using Nafion dryers, the standard gases must be passed though the dryer to compensate for a potential loss in the dryer.
The different elements of the WMO/GAW quality management framework, including round-robin experiments, performance audits with travelling standards, and parallel measurements at stations provide complementary information, which is essential for reducing the bias and uncertainty of time series measured by atmospheric-research stations.
The assessment of performance audit results of CO and N2O with respect to different measurement techniques showed clear advantages of newer spectroscopic techniques such as NIR-CRDS or QCL spectroscopy in the case of CO. However, parallel measurements made using a Picarro NIR-CRDS analyser identified issues with the implemented water vapour compensation, and further improvement is currently only possible by drying the sample air. This can be implemented though drying the sample air with either cryogenic traps or Nafion dryers.
For N2O, one of the limitations is the uncertainty of calibration standards. This highlights the importance of maintaining traceability to an internationally accepted calibration scale as implemented by the GAW programme.
By introducing modern spectroscopic measurement techniques such as CRDS or QCL, the number of GAW stations complying with the WMO/GAW network compatibility goals for CO and N2O will increase. However, reaching the network compatibility goal of 2 nmol mol−1 for CO and 0.1 nmol mol−1 for N2O will remain challenging. Careful calibration strategies and appropriate water vapour corrections or drying the sample air are required for both CO and N2O.
Data from the performance audits made by WCC-Empa are available from the corresponding audit reports (http://www.empa.ch/web/s503/wcc-empa, last access: 30 October 2019). Data of the WMO/IAEA Round Robin Comparison Experiment are publicly available on the NOAA Earth System Research Laboratory Global Monitoring Division web page (https://www.esrl.noaa.gov/gmd/ccgg/wmorr, last access: 30 October 2019). Other data used in the paper are available upon request to the corresponding author.
CZ led and designed this study. BB supervises the activities of WCC-Empa. RS made N2O comparisons during station audits of the WCC-N2O and provided N2O comparison data. CZ and MS performed CO and N2O comparisons during station audits by WCC-Empa. OL contributed to in situ measurements of CO at Puy de Dôme. HL and SK contributed to in situ measurements of CO at Anmyeon-do. CZ wrote the paper. All co-authors (RS, OL, HL, SK, LE, MS, BB) were involved in scientific discussions and commenting on the paper.
The authors declare that they have no conflict of interest.
This article is part of the special issue “The 10th International Carbon Dioxide Conference (ICDC10) and the 19th WMO/IAEA Meeting on Carbon Dioxide, other Greenhouse Gases and Related Measurement Techniques (GGMT-2017) (AMT/ACP/BG/CP/ESD inter-journal SI)”. It is a result of the 19th WMO/IAEA Meeting on Carbon Dioxide, Other Greenhouse Gases, and Related Measurement Techniques (GGMT-2017), Empa Dübendorf, Switzerland, 27–31 August 2017.
MeteoSwiss supported this work through its engagement in the Global Atmosphere Watch programme. We further acknowledge the support by the station staff at various GAW stations during the audits. Haeyoung Lee and Sumin Kim would like to acknowledge support from the Korea Meteorological Administration Research and Development Program “Research and Development for KMA Weather, Climate, and Earth System Services – Development of Monitoring and Analysis Techniques for Atmospheric Composition in Korea” (grant no. 1365003041). Eckhart Scheel, who sadly passed away in 2013, mainly conducted WCC-N2O audits. Further, the WCC-N2O acknowledges the support of the German Environment Agency.
This paper was edited by Christof Janssen and reviewed by three anonymous referees.
Baer, D. S., Paul, J. B., Gupta, M., and O'Keefe, A.: Sensitive absorption measurements in the near-infrared region using off-axis integrated-cavity-output spectroscopy, Appl. Phys. B, 75, 261–265, 2002.
Blunden, J. and Arndt, D. S.: State of the Climate in 2016, B. Am. Meteorol. Soc., 98, Si–S280, 2017.
Brewer, P. J., Brown, R. J. C., Tarasova, O., Hall, B., Rhoderick, G., and Wielgosz, R.: SI traceability and scales for underpinning atmospheric monitoring of greenhouse gases, Metrologia, 55, 174–181, https://doi.org/10.1088/1681-7575/aad830, 2018. 2018.
Brunke, E. G., Scheel, H. E., and Seiler, W.: Trends of Tropospheric CO, N2O and CH4 as Observed at Cape Point, South Africa, Atmos. Environ. Part A, 24, 585–595, 1990.
Buchmann, B., Klausen, J., and Zellweger, C.: Traceability of Long-Term Atmospheric Composition Observations across Global Monitoring Networks, Chimia, 63, 657–660, 2009.
Chen, H., Karion, A., Rella, C. W., Winderlich, J., Gerbig, C., Filges, A., Newberger, T., Sweeney, C., and Tans, P. P.: Accurate measurements of carbon monoxide in humid air using the cavity ring-down spectroscopy (CRDS) technique, Atmos. Meas. Tech., 6, 1031–1040, https://doi.org/10.5194/amt-6-1031-2013, 2013.
GAWSIS: GAW Station Information System, available at: https://gawsis.meteoswiss.ch, last access: 23 July, 2018.
Gerbig, C., Schmitgen, S., Kley, D., Volz-Thomas, A., Dewey, K., and Haaks, D.: An improved fast-response vacuum-UV resonance fluorescence CO instrument, J. Geophys. Res.-Atmos., 104, 1699–1704, 1999.
Gomez-Pelaez, A. J., Ramos, R., Gomez-Trueba, V., Novelli, P. C., and Campo-Hernandez, R.: A statistical approach to quantify uncertainty in carbon monoxide measurements at the Izaña global GAW station: 2008–2011, Atmos. Meas. Tech., 6, 787–799, https://doi.org/10.5194/amt-6-787-2013, 2013.
Griffith, D. W. T., Deutscher, N. M., Caldow, C., Kettlewell, G., Riggenbach, M., and Hammer, S.: A Fourier transform infrared trace gas and isotope analyser for atmospheric applications, Atmos. Meas. Tech., 5, 2481–2498, https://doi.org/10.5194/amt-5-2481-2012, 2012.
Gros, V., Bonsang, B., and Sarda Esteve, R.: Atmospheric carbon monoxide `in situ' monitoring by automatic gas chromatography, Chemosphere – Global Change Sci., 1, 153–161, 1999.
Hall, B. D., Dutton, G. S., and Elkins, J. W.: The NOAA nitrous oxide standard scale for atmospheric observations, J. Geophys. Res.-Atmos., 112, D09305, https://doi.org/10.1029/2006JD007954, 2007.
Hammer, S., Griffith, D. W. T., Konrad, G., Vardag, S., Caldow, C., and Levin, I.: Assessment of a multi-species in situ FTIR for precise atmospheric greenhouse gas observations, Atmos. Meas. Tech., 6, 1153–1170, https://doi.org/10.5194/amt-6-1153-2013, 2013a.
Hammer, S., Konrad, G., Vermeulen, A. T., Laurent, O., Delmotte, M., Jordan, A., Hazan, L., Conil, S., and Levin, I.: Feasibility study of using a “travelling” CO2 and CH4 instrument to validate continuous in situ measurement stations, Atmos. Meas. Tech., 6, 1201–1216, https://doi.org/10.5194/amt-6-1201-2013, 2013b.
Khalil, M. A. K. and Rasmussen, R. A.: Increase and seasonal cycles of nitrous oxide in the earth's atmosphere, Tellus B, 35B, 161–169, 1983.
Khalil, M. A. K. and Rasmussen, R. A.: Carbon-Monoxide in the Earths Atmosphere – Indications of a Global Increase, Nature, 332, 242–245, 1988.
Klausen, J., Zellweger, C., Buchmann, B., and Hofer, P.: Uncertainty and bias of surface ozone measurements at selected Global Atmosphere Watch sites, J. Geophys. Res.-Atmos., 108, 4622, https://doi.org/10.1029/2003JD003710, 2003.
Lebegue, B., Schmidt, M., Ramonet, M., Wastine, B., Yver Kwok, C., Laurent, O., Belviso, S., Guemri, A., Philippon, C., Smith, J., and Conil, S.: Comparison of nitrous oxide (N2O) analyzers for high-precision measurements of atmospheric mole fractions, Atmos. Meas. Tech., 9, 1221–1238, https://doi.org/10.5194/amt-9-1221-2016, 2016.
McManus, J. B., Zahniser, M. S., Nelson, D. D., Shorter, J. H., Herndon, S. C., Jervis, D., Agnese, M., McGovern, R., Yacovitch, T. I., and Roscioli, J. R.: Recent progress in laser-based trace gas instruments: performance and noise analysis, Appl. Phys. B, 119, 203–218, 2015.
Nedelec, P., Cammas, J.-P., Thouret, V., Athier, G., Cousin, J.-M., Legrand, C., Abonnel, C., Lecoeur, F., Cayez, G., and Marizy, C.: An improved infrared carbon monoxide analyser for routine measurements aboard commercial Airbus aircraft: technical validation and first scientific results of the MOZAIC III programme, Atmos. Chem. Phys., 3, 1551–1564, https://doi.org/10.5194/acp-3-1551-2003, 2003.
NOAA: Carbon Monoxide (CO) WMO Scale, available at: https://www.esrl.noaa.gov/gmd/ccl/co_scale.html, last access: 17 May, 2018a.
NOAA: Nitrous Oxide (N2O) – Combined Data Set, available at: https://www.esrl.noaa.gov/gmd/hats/combined/N2O.html, last access: 28 May, 2018b.
NOAA: Nitrous Oxide (N2O) WMO Scale, available at: https://www.esrl.noaa.gov/gmd/ccl/n2o_scale.html, last access: 17 May, 2018c.
NOAA: WMO/IAEA Round Robin Comparison Experiment, available at: https://www.esrl.noaa.gov/gmd/ccgg/wmorr/index.html, last access: 23 July, 2018d.
Novelli, P. C.: CO in the atmosphere: measurement techniques and related issues, Chemosphere, 1, 115–126, 1999.
Novelli, P. C., Masarie, K. A., Lang, P. M., Hall, B. D., Myers, R. C., and Elkins, J. W.: Re-analysis of tropospheric CO trends: Effects of the 1997–1998 wild fires, J. Geophys. Res.-Atmos., 108, 4464, https://doi.org/10.1029/2002JD003031, 2003.
Parrish, D. D., Holloway, J. S., and Fehsenfeld, F. C.: Routine, Continuous Measurement of Carbon-Monoxide with Parts-Per-Billion Precision, Environ. Sci. Technol., 28, 1615–1618, 1994.
Provencal, R., Gupta, M., Owano, T. G., Baer, D. S., Ricci, K. N., O'Keefe, A., and Podolske, J. R.: Cavity-enhanced quantum-cascade laser-based instrument for carbon monoxide measurements, Appl. Opt., 44, 6712–6717, 2005.
Rella, C. W., Chen, H., Andrews, A. E., Filges, A., Gerbig, C., Hatakka, J., Karion, A., Miles, N. L., Richardson, S. J., Steinbacher, M., Sweeney, C., Wastine, B., and Zellweger, C.: High accuracy measurements of dry mole fractions of carbon dioxide and methane in humid air, Atmos. Meas. Tech., 6, 837–860, https://doi.org/10.5194/amt-6-837-2013, 2013.
Reum, F., Gerbig, C., Lavric, J. V., Rella, C. W., and Göckede, M.: Correcting atmospheric CO2 and CH4 mole fractions obtained with Picarro analyzers for sensitivity of cavity pressure to water vapor, Atmos. Meas. Tech., 12, 1013–1027, https://doi.org/10.5194/amt-12-1013-2019, 2019.
Rhoderick, G. C., Kitzis, D. R., Kelley, M. E., Miller, W. R., Hall, B. D., Dlugokencky, E. J., Tans, P. P., Possolo, A., and Carney, J.: Development of a Northern Continental Air Standard Reference Material, Anal. Chem., 88, 3376–3385, 2016.
Rhoderick, G. C., Kelley, M. E., Miller, W. R., Norris, J. E., Carney, J., Gameson, L., Cecelski, C. E., Harris, K. J., Goodman, C. A., Srivastava, A., and Hodges, J. T.: NIST Standards for Measurement, Instrument Calibration, and Quantification of Gaseous Atmospheric Compounds, Anal. Chem., 90, 4711–4718, 2018.
van der Laan, S., Neubert, R. E. M., and Meijer, H. A. J.: A single gas chromatograph for accurate atmospheric mixing ratio measurements of CO2, CH4, N2O, SF6 and CO, Atmos. Meas. Tech., 2, 549–559, https://doi.org/10.5194/amt-2-549-2009, 2009.
Vardag, S. N., Hammer, S., O'Doherty, S., Spain, T. G., Wastine, B., Jordan, A., and Levin, I.: Comparisons of continuous atmospheric CH4, CO2 and N2O measurements – results from a travelling instrument campaign at Mace Head, Atmos. Chem. Phys., 14, 8403–8418, https://doi.org/10.5194/acp-14-8403-2014, 2014.
Ventrillard, I., Xueref-Remy, I., Schmidt, M., Yver Kwok, C., Faïn, X., and Romanini, D.: Comparison of optical-feedback cavity-enhanced absorption spectroscopy and gas chromatography for ground-based and airborne measurements of atmospheric CO concentration, Atmos. Meas. Tech., 10, 1803–1812, https://doi.org/10.5194/amt-10-1803-2017, 2017.
Weiss, R. F.: The temporal and spatial distribution of tropospheric nitrous oxide, J. Geophys. Res.-Oceans, 86, 7185–7195, 1981.
WMO: 15th WMO/IAEA Meeting of Experts on Carbon Dioxide, Other Greenhouse Gases and Related Tracers Measurements Techniques, Jena, Germany, 7–10 September 2009 (WMO TD No. 1553), GAW Report No. 194, World Meteorological Organization, Geneva, Switzerland, 318 pp., 2011.
WMO: 16th WMO/IAEA Meeting on Carbon Dioxide, Other Greenhouse Gases, and Related Measurement Techniques (GGMT-2011), Wellington, New Zealand, 25–28 October 2011, GAW Report No. 206, World Meteorological Organization, Geneva, Switzerland, 2012.
WMO: 17th WMO/IAEA Meeting on Carbon Dioxide, Other Greenhouse Gases and Related Tracers Measurement Techniques (GGMT-2013), Beijing, China, 10–13 June 2013, GAW Report No. 213, World Meteorological Organization, Geneva, Switzerland, 2014.
WMO: 18th WMO/IAEA Meeting on Carbon Dioxide, Other Greenhouse Gases and Related Tracers Measurement Techniques (GGMT-2015), La Jolla, CA, USA, 13–17 September 2015, GAW Report No. 229, World Meteorological Organization, Geneva, Switzerland, 2016.
WMO: WMO Global Atmosphere Watch (GAW) Implementation Plan: 2016–2023 World Meteorological Organization, Geneva, Switzerland, 2017a.
WMO: WMO Greenhouse gas bulletin: the state of greenhouse gases in the atmosphere based on observations through 2016, available at: https://library.wmo.int/doc_num.php?explnum_id=4022 (last access: 28 August 2018), 2017b.
WMO: 19th WMO/IAEA Meeting on Carbon Dioxide, Other Greenhouse Gases and Related Tracers Measurement Techniques (GGMT-2017), Dübendorf, Switzerland, 27–31 August 2017, GAW Report No. 242, World Meteorological Organization, Geneva, Switzerland, 2018.
Yver Kwok, C., Laurent, O., Guemri, A., Philippon, C., Wastine, B., Rella, C. W., Vuillemin, C., Truong, F., Delmotte, M., Kazan, V., Darding, M., Lebègue, B., Kaiser, C., Xueref-Rémy, I., and Ramonet, M.: Comprehensive laboratory and field testing of cavity ring-down spectroscopy analyzers measuring H2O, CO2, CH4 and CO, Atmos. Meas. Tech., 8, 3867–3892, https://doi.org/10.5194/amt-8-3867-2015, 2015.
Zellweger, C., Hüglin, C., Klausen, J., Steinbacher, M., Vollmer, M., and Buchmann, B.: Inter-comparison of four different carbon monoxide measurement techniques and evaluation of the long-term carbon monoxide time series of Jungfraujoch, Atmos. Chem. Phys., 9, 3491–3503, https://doi.org/10.5194/acp-9-3491-2009, 2009.
Zellweger, C., Steinbacher, M., and Buchmann, B.: Evaluation of new laser spectrometer techniques for in-situ carbon monoxide measurements, Atmos. Meas. Tech., 5, 2555–2567, https://doi.org/10.5194/amt-5-2555-2012, 2012.
Zellweger, C., Emmenegger, L., Firdaus, M., Hatakka, J., Heimann, M., Kozlova, E., Spain, T. G., Steinbacher, M., van der Schoot, M. V., and Buchmann, B.: Assessment of recent advances in measurement techniques for atmospheric carbon dioxide and methane observations, Atmos. Meas. Tech., 9, 4737–4757, https://doi.org/10.5194/amt-9-4737-2016, 2016.