the Creative Commons Attribution 4.0 License.
the Creative Commons Attribution 4.0 License.
 | 18 Mar 2020
Early results and validation of SAGE III-ISS ozone profile measurements from onboard the International Space Station
M. Patrick McCormick
Liqiao Lei
Michael T. Hill
John Anderson
Richard Querel
Wolfgang Steinbrecht
The Stratospheric Aerosol and Gas Experiment III (SAGE III, 2018) instrument was launched on 19 February 2017 from the NASA Kennedy Space Center and was integrated aboard the International Space Station (ISS). SAGE III-ISS has been providing ozone profile measurements since June 2017. This paper presents an early validation of the Level 2 solar and lunar occultation ozone data products using ground-based lidar and ozonesondes from Hohenpeißenberg and Lauder as well as satellite ozone vertical products from the Atmospheric Chemistry Experiment Fourier Transform Spectrometer (ACE-FTS) instrument. Average differences in the ozone concentration between SAGE III-ISS and Hohenpeißenberg lidar observations for 1 year are less than 10 % between 16 and 42 km and less than 5 % between 20 and 40 km. Hohenpeißenberg ozonesonde comparisons are mostly within 10 % between 18 and 30 km. The Lauder lidar comparison results are less than 10 % between 17 and 37 km, and the Lauder ozonesonde comparison results are less than 10 % between 19 and 31 km. The seasonal average differences in the ozone concentration between SAGE III-ISS and ACE-FTS are mostly less than 5 % between 20 and 45 km for both the Northern Hemisphere and Southern Hemisphere. All results from these comparisons show that the SAGE III-ISS ozone solar data compare well with correlative measurements throughout the stratosphere. With few comparisons available, the percentage difference between the SAGE III-ISS lunar ozone data and the ozonesonde data is less than 10 % between 19 and 27 km. The percentage difference between the SAGE III-ISS lunar ozone data and the ACE-FTS ozone data is less than 10 % between 20 and 40 km.
- Article
(4106 KB) - Full-text XML
- BibTeX
- EndNote


Ozone plays a significant role in the atmosphere because it contributes to the radiative balance of the atmosphere by absorbing ultraviolet (UV) solar radiation; it also affects the health of humans, animals, and plants (Solomon, 1999). Therefore, it is important to understand its global variations and trends (McCormick et al., 1992; Reinsel et al., 2002; Bourassa et al., 2014; Harris et al., 2015) as well as its impact on climate change (Rex et al., 2004; Son et al., 2008; Thompson et al., 2011). In addition, by modifying the Brewer–Dobson circulation and stratospheric temperatures, climate change impacts global ozone concentrations (Weber et al., 2018). Ozone measurements from the SAGE series of satellite instruments, including SAGE I, II, III/Meteor-3M, and III-ISS, provide important data to investigate stratospheric change and long-term variability in the vertical distribution of stratospheric ozone. The occultation technique that the SAGE series utilizes provides a consistent methodology and fundamental assumption for processing data (McCormick et al., 1989; Wang et al., 2006; Damadeo et al., 2013). The solar occultation method makes SAGE one of the best series of satellite instruments for high-resolution stratospheric ozone measurements. In addition to the SAGE series, previous solar occultation satellite instruments include the HALogen Occultation Experiment (HALOE; Russell et al., 1993), the Polar Ozone and Aerosol Measurement (POAM) III (Lucke et al., 1999), and the Atmospheric Chemistry Experiment Fourier Transform Spectrometer (ACE-FTS; Bernath et al., 2005). The SCanning Imaging Absorption SpectroMeter for Atmospheric CHartographY (SCIAMACHY) also has an occultation mode (Bovensmann et al., 1999). The ACE-FTS is still in operation and provides valuable data for the SAGE III-ISS validation, as is shown in this paper. It is important for the SAGE III-ISS ozone profiles to be well validated to extend the long-standing ozone record of observations from the SAGE series, POAM III, HALOE, and ACE-FTS. The well-characterized ozone data will contribute to the investigation of any trend and possible ozone recovery due to a reduction in chlorofluorocarbons (CFC). In this paper, the global SAGE III-ISS ozone profile data are compared with correlative datasets to investigate possible differences. These comparisons begin the process of showing that SAGE III-ISS ozone data can be used for scientific studies. A systematic assessment of the early SAGE III-ISS ozone profiles is conducted with observations made by comparing SAGE III-ISS ozone profiles with ozone profiles made by Hohenpeißenberg and Lauder ground-based lidar and ozonesondes as well as satellite data from the ACE-FTS. Section 2 describes the instrument and ozone product for the comparison, the criteria for coincidence, and the methodology for validation. The comparison results between coincident events are shown in Sect. 3. The overall summary and conclusion are presented in Sect. 4.
2.1 SAGE III-ISS
The SAGE III-ISS payload was launched by the SpaceX Falcon 9 rocket on 19 February 2017 from the NASA Kennedy Space Center and delivered to the ISS by the SpaceX Dragon spacecraft. It was mated to the ISS on 7 March 2017. The ISS is flying in a 51.64∘ inclination low-Earth orbit, which provides low- and midlatitude occultation coverage. Figure 1 shows SAGE III-ISS solar and lunar occultation coverage from June 2017 to November 2018. The primary objective of the SAGE III-ISS mission is to obtain vertical profiles of ozone, water vapor, nitrogen dioxide, nitrogen trioxide, and aerosol extinction at multiple wavelengths, using solar and lunar occultation measurements. Similar to the SAGE III/Meteor-3M, SAGE III-ISS uses an 809 pixel × 10 pixel charge-coupled device (CCD) array to provide continuous spectral coverage from 280 to 1040 nm with a spectral resolution of 1 to 2 nm. Additionally, an InGaAs infrared (IR) photodiode centered at 1550 nm is included for aerosol extinction measurements at a longer wavelength (Wang et al., 2006). Only 87 pixel groups are transmitted from the satellite for gaseous species and aerosol retrieval due to the limitation in the telemetry bandwidth. In addition to solar occultation, SAGE III-ISS is capable of making lunar occultation measurements at nighttime for ozone, nitrogen dioxide, nitrogen trioxide, and chlorine dioxide. SAGE III-ISS Level 2 solar species retrievals include three ozone profile products.
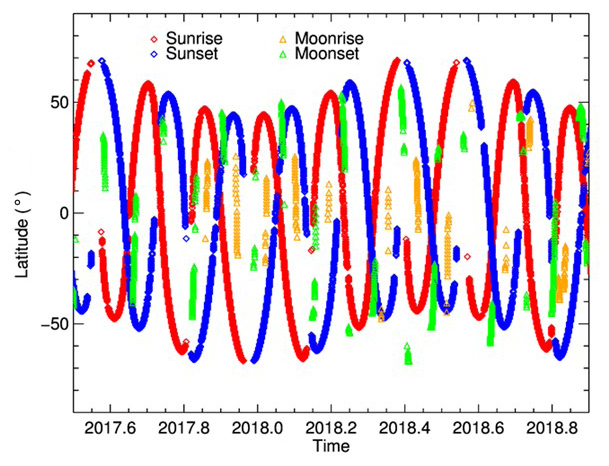
Figure 1The SAGE III-ISS solar and lunar occultation coverage from June 2017 to November 2018. The red curves show the sunrise events, the blue curves show the sunset events, the orange curves show the moon rise events, and the green curves show the moonset events. The horizontal axis indicates year and fraction of a year.
The profile based upon the measurement made in the Hartley–Huggins band is denoted as “Mesospheric Ozone” (MesO3). The profile based upon measurements in the Chappuis band is denoted as “Multiple Linear Regression Ozone” (ChapO3). The profile obtained using a similar approach to that used by SAGE II is denoted as “Least Squares Ozone” (Ozone_aO3; SAGE III-ISS Data Products User's Guide: https://eosweb.larc.nasa.gov/project/sageiii-iss/guide/DPUG-G3B-2-0.pdf, last access: 10 March 2020; Damadeo et al., 2013). The version 5.1 Least Squares Ozone profile is used here for ozone comparison between the SAGE III-ISS and correlative measurements. The vertical resolution of the SAGE III-ISS ozone profiles is 0.5 km with respect to altitude.
2.2 Lidar and ozonesonde
Lidar and ozonesonde ozone profiles provided by the Network for the Detection of Atmospheric Composition Change (NDACC) are used for SAGE III-ISS ozone profile comparisons. A NDACC station at the midlatitude in each hemisphere (Hohenpeißenberg in the Northern Hemisphere and Lauder in the Southern Hemisphere) with an established record of regular ozone measurements from both lidars and sondes is selected for the initial validation. Future validation efforts will include other stations. The Hohenpeißenberg (48∘ N, 11∘ E) ozone lidar has been providing ozone profile data from 15 to 50 km since 1987. The Hohenpeißenberg balloon ozonesonde has been providing ozone profile data since 1967. A remote-sensing research station located at Lauder, New Zealand (45∘ S, 169.7∘ E), has been providing lidar ozone profile data from 8 to 50 km since 1994 and ozonesonde ozone profiles data from 0 to 32 km since 1986.
During the first year of SAGE III-ISS observations (June 2017 to May 2018), ozonesonde launches were generally conducted at Hohenpeißenberg two to three times per week with greater frequencies occurring from October to April. Ozonesonde launches at Lauder were generally conducted three to five times per month during the year with exceptions in June (two measurements) and October (six measurements). Lidar measurements at Hohenpeißenberg were made six to nine times per month in 2017 and four to six times per month in 2018, except for April in which 11 measurements were made. Lidar measurements at Lauder were made one to four times per month during the year. For details see the NDACC website (http://www.ndaccdemo.org/stations, last access: 10 March 2020).
Typical uncertainties in ozone measurements from the Hohenpeißenberg Brewer–Mast sondes are better than 5 % near the ozone maximum at ∼40 hPa and increase to values of 10 % or more above 10 hPa (∼30 km) and up to 15 % in the troposphere (Kerr et al., 1994; SPARC, 1998). Estimated uncertainties in the ozone profiles derived from the Lauder electrochemical concentration cell (ECC) sondes are generally better than 5 % in the troposphere and stratosphere up to 10 hPa (∼30 km) and up to 10 % at higher altitudes (Bodeker et al., 1998). Uncertainties in ozone measurements from the lidar systems are typically 5 % or better between 15 and 35 km altitude and less than 10 % up to about 40 km altitude (Leblanc et al., 2016a, b, c).
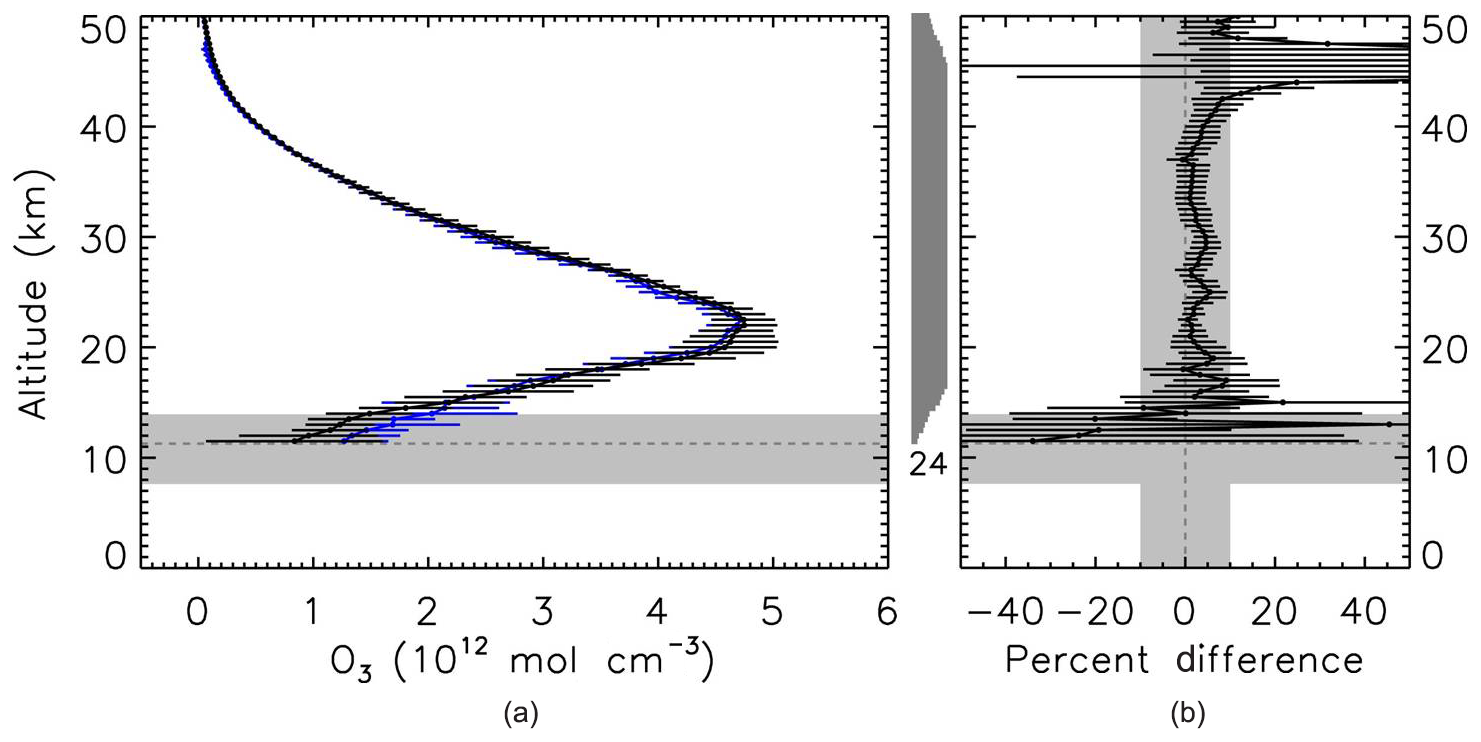
Figure 2(a) The average of all coincident pairs for SAGE III-ISS data and Hohenpeißenberg ozone lidar data from June 2017 to May 2018. The average SAGE III-ISS ozone profile is shown using the black line with twice the standard error (±2SEM) displayed as the black error bars. The average Hohenpeißenberg lidar ozone profile is shown using a blue line with twice the standard error shown as horizontal blue error bars. (b) The average percentage difference between the coincident pairs is also shown. The black line indicates the percentage difference, the black horizontal error bars show twice the standard error of the difference, and the vertical gray shading shows the ±10 % region. The horizontal gray shading shows the altitude range of the tropopause for panels (a) and (b). The horizontal light gray dotted line shows the average altitude of the tropopause height as reported in the SAGE III-ISS data product. The vertical shading on the left of panel (b) indicates the variation in the number of coincident measurements at each altitude (24 in total).
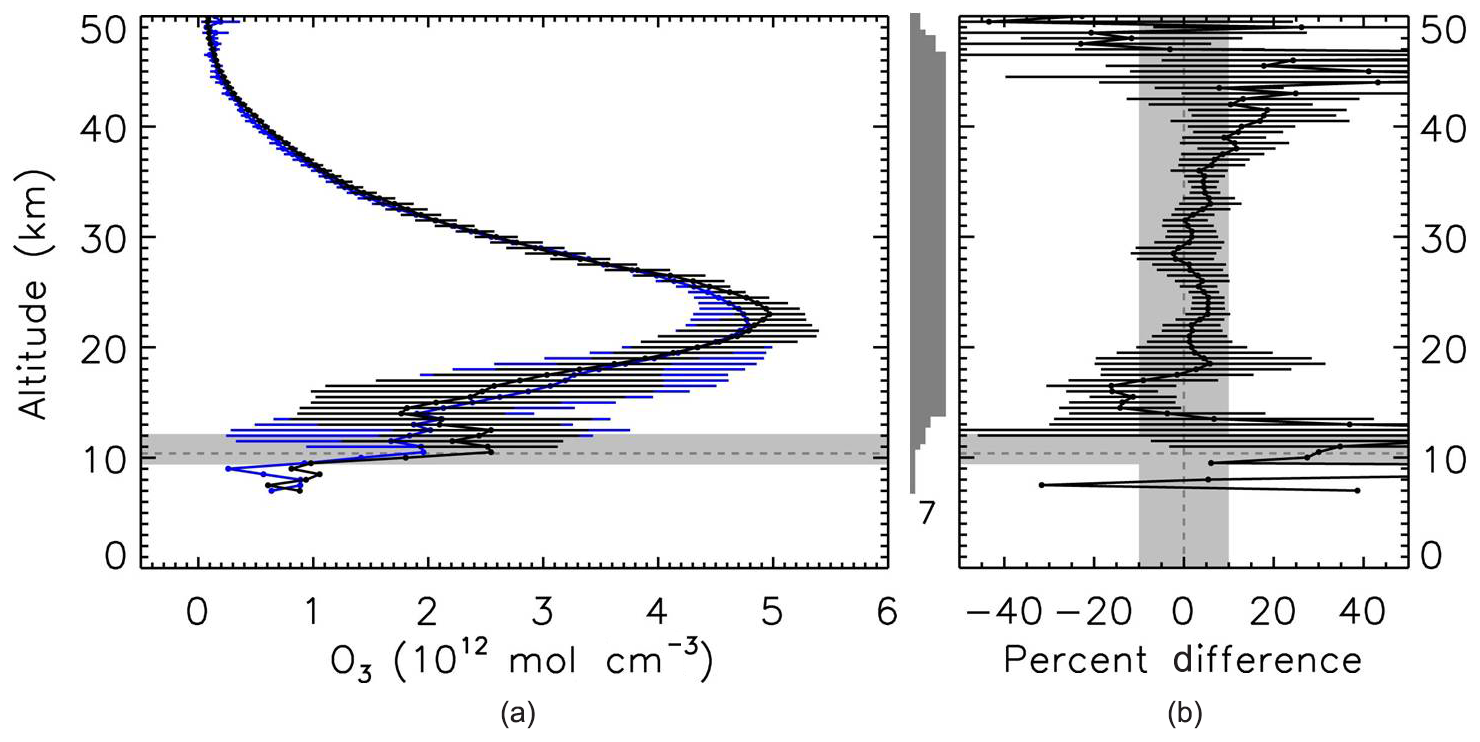
Figure 3Similar to Fig. 2 but for the average difference of coincident pairs of ozone profiles for SAGE III-ISS and Lauder ozone lidar data from June 2017 to May 2018.
2.3 ACE-FTS
The Canadian Atmospheric Chemistry Experiment (ACE) on the SCISAT-1 satellite was launched on 12 August 2003 (Bernath et al., 2005) and is currently operational (at the time of writing). The ACE-FTS is one of the two instruments onboard the spacecraft and provides vertical profiles of ozone and trace gases, as well as temperature, pressure, and aerosol extinction (Boone et al., 2005; Waymark et al., 2013). The ACE-FTS makes its solar occultation measurements in the 85∘ S to 85∘ N latitude region due to its circular 650 km, 74∘ inclination, low-Earth orbit (Bernath et al., 2005). The ACE-FTS vertical measurement range typically extends from 10 to 95 km for ozone. The maximum vertical resolution of ACE-FTS is 3–4 km based on its instrument field of view (Dupuy et al., 2009). ACE-FTS Level 2 version 3.5/3.6 data are used for the ozone comparisons in this work.
2.4 The methodology for comparisons
As a satellite with near-global coverage, SAGE III-ISS allows for a significant number of coincident profiles with data from correlative instruments, which are expected to yield reliable conclusions regarding the consistencies of its data (Imai, 2013). Coincident ozone profiles from SAGE III-ISS and correlative measurements are selected by finding the pair of profiles that has the closest geographic distance within a given time interval. The criteria used for finding coincidence varies for different validation studies so as to obtain a sufficient number of coincident events for all datasets. In order to obtain enough coincident profiles, the criteria used for comparison between ACE-FTS and SAGE III-ISS are less than ±5∘ in latitude, less than ±10∘ in longitude, and less than ±4 h in time. Criteria used to find coincident events between SAGE III-ISS and lidar/ozonesonde data are less than ±5∘ in latitude, less than ±10∘ in longitude, and less than ±24 h in time (Rong et al., 2009). In order to get sufficient comparisons in the Southern Hemisphere, the criteria are expanded to less than ±10∘ in latitude, less than ±20∘ in longitude, and less than ±10 h in time. These broad criteria could result in multiple coincidences for a single SAGE III-ISS profile. In the case of multiple matches, the coincident pair that has the smallest time and spatial difference is chosen. This process reduces the duplicate coincident events in the comparisons. The coincident profiles for the two correlative instruments are found, and then the differences between the two coincident profiles are calculated. For statistical analysis, coincident data are screened to reject the profiles with low-quality measurements according to the recommendation provided by each data product's user guide (SAGE III-ISS Data Products User's Guide: https://eosweb.larc.nasa.gov/project/sageiii-iss/guide/DPUG-G3B-2-0.pdf, http://databace.scisat.ca/level2/ace_v3.5_v3.6, last access: 10 March 2020). Therefore, part of the data record is removed, and this decreases the total amount of coincident pairs in our comparisons. The coincident pair of ozone profiles from the two instruments are linearly interpolated to the SAGE III-ISS altitude grid (Rong et al., 2009; Dupuy et al., 2009).
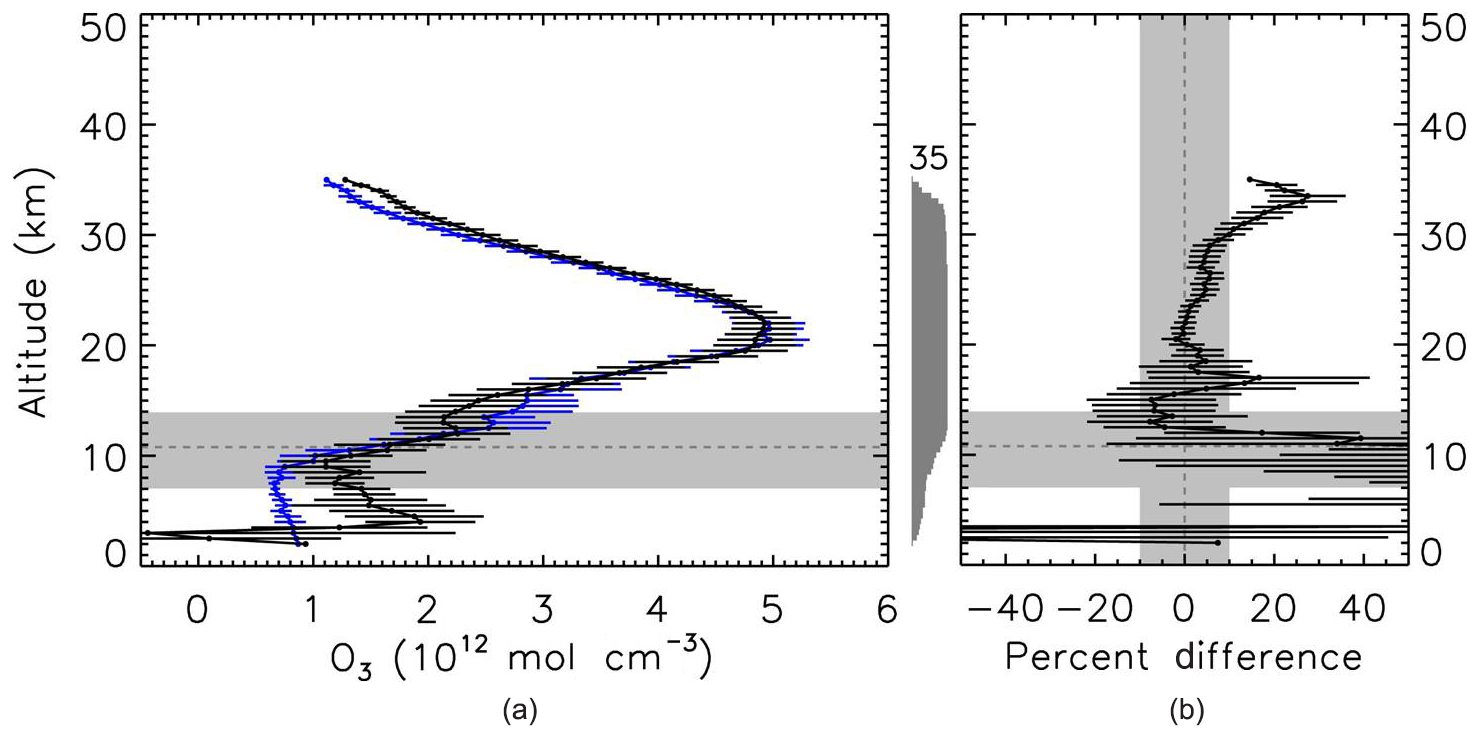
Figure 4Similar to Fig. 2 but for the average difference of coincident pairs for SAGE III-ISS and Hohenpeißenberg ozonesonde profiles obtained from June 2017 to May 2018.
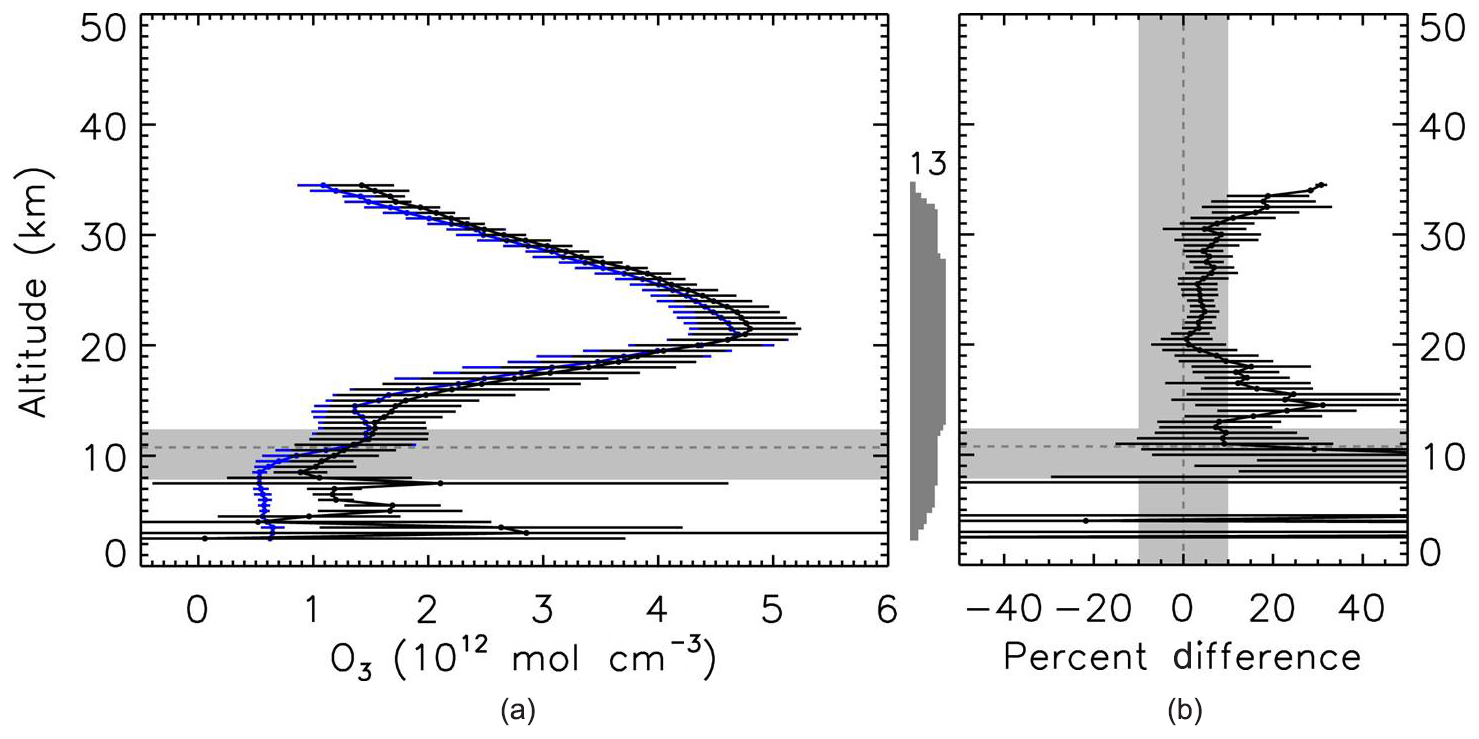
Figure 5Similar to Fig. 2 but for the average difference of coincident pairs for SAGE III-ISS and Lauder ozonesonde profiles obtained from June 2017 to May 2018.
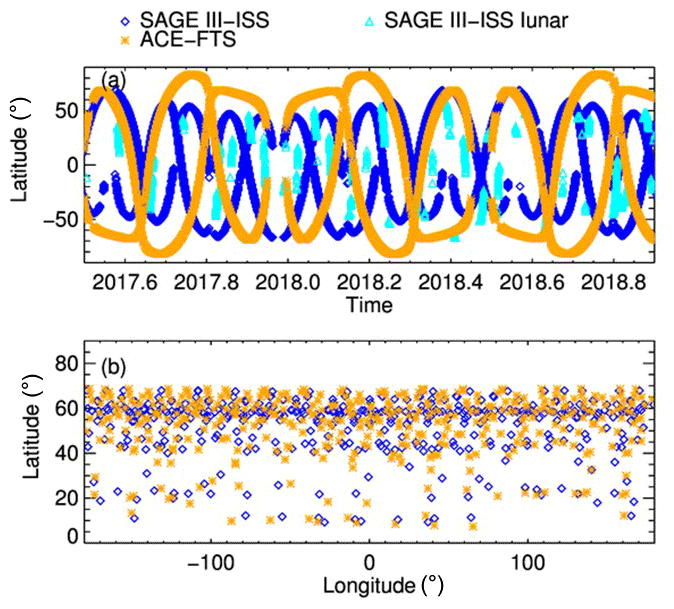
Figure 6(a) The ACE-FTS and SAGE III-ISS solar and lunar occultation coverage for comparison. (b) The latitude and longitude distribution for coincident events of SAGE III-ISS and ACE-FTS under the criteria of a latitude difference of less than ±5∘, a longitude difference of less than ±10∘, and a time difference of less than ±4 h (coincident events could only be found in the Northern Hemisphere).
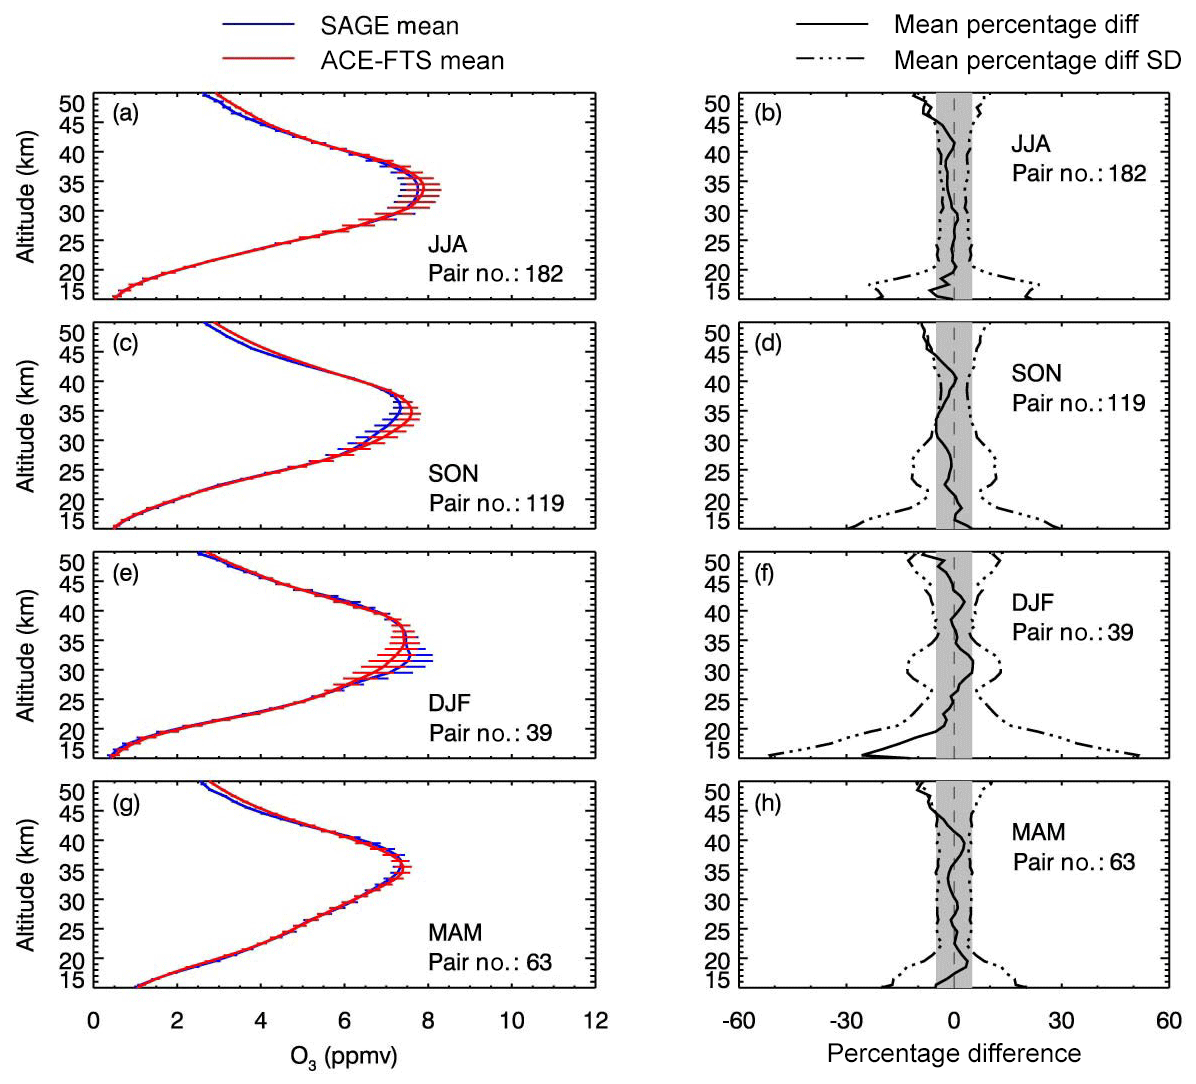
Figure 7Seasonal average ozone mixing ratio profile comparisons between coincident SAGE III-ISS and ACE-FTS measurements for the Northern Hemisphere criteria that are described in Fig. 6. The SAGE III-ISS average ozone mixing ratio profiles are shown using the blue solid line with twice the standard error (±2SEM) shown as horizontal blue error bars. The ACE-FTS average ozone mixing ratio profiles are shown using the red solid line with twice the standard error shown as the horizontal red error bars.
The average difference between the coincident pairs of profiles at a given altitude is calculated using Eq. (1):
where Δ(z) refers to the average ozone difference at a given altitude z, SAGE IIIi(z) is the ozone concentration at altitude z for the ith coincident SAGE III-ISS profile, and corri is the corresponding concentration for the correlated comparison instrument for the ith coincident pair. N(z) is the total number of coincident measurement pairs at altitude z, and refi(z) is the ith reference at altitude z for calculating the difference. The reference for calculating the absolute difference between the coincident pair equals one. In the case of calculating the relative difference for each coincident pair, the refi(z) is the average of the ith coincident pair concentration at altitude z (Randall et al., 2003; Smith et al., 2013):
For comparisons with the lidars and ozonesondes, the reference is taken as the measurement from the ground-based or balloon instrument. As shown in Eq. (3), the standard deviation of the distribution of the relative difference at altitude z provides the spread in the difference for individual coincident pairs. This provides information regarding the significance of the bias of the SAGE III-ISS instrument. This standard deviation also provides a measure of the total uncertainty of the instruments that are used for the comparison (von Clarmann, 2006):
The statistical uncertainty of the mean difference, also known as the standard error of the mean (SEM), is the quantity that allows the significance of the estimated biases to be judged (Dupuy et al., 2009):
Larger average differences and uncertainties are expected for comparisons using expanded coincidence criteria, such as those used for the sonde and lidar as well as the Southern Hemisphere ACE-FTS measurements.
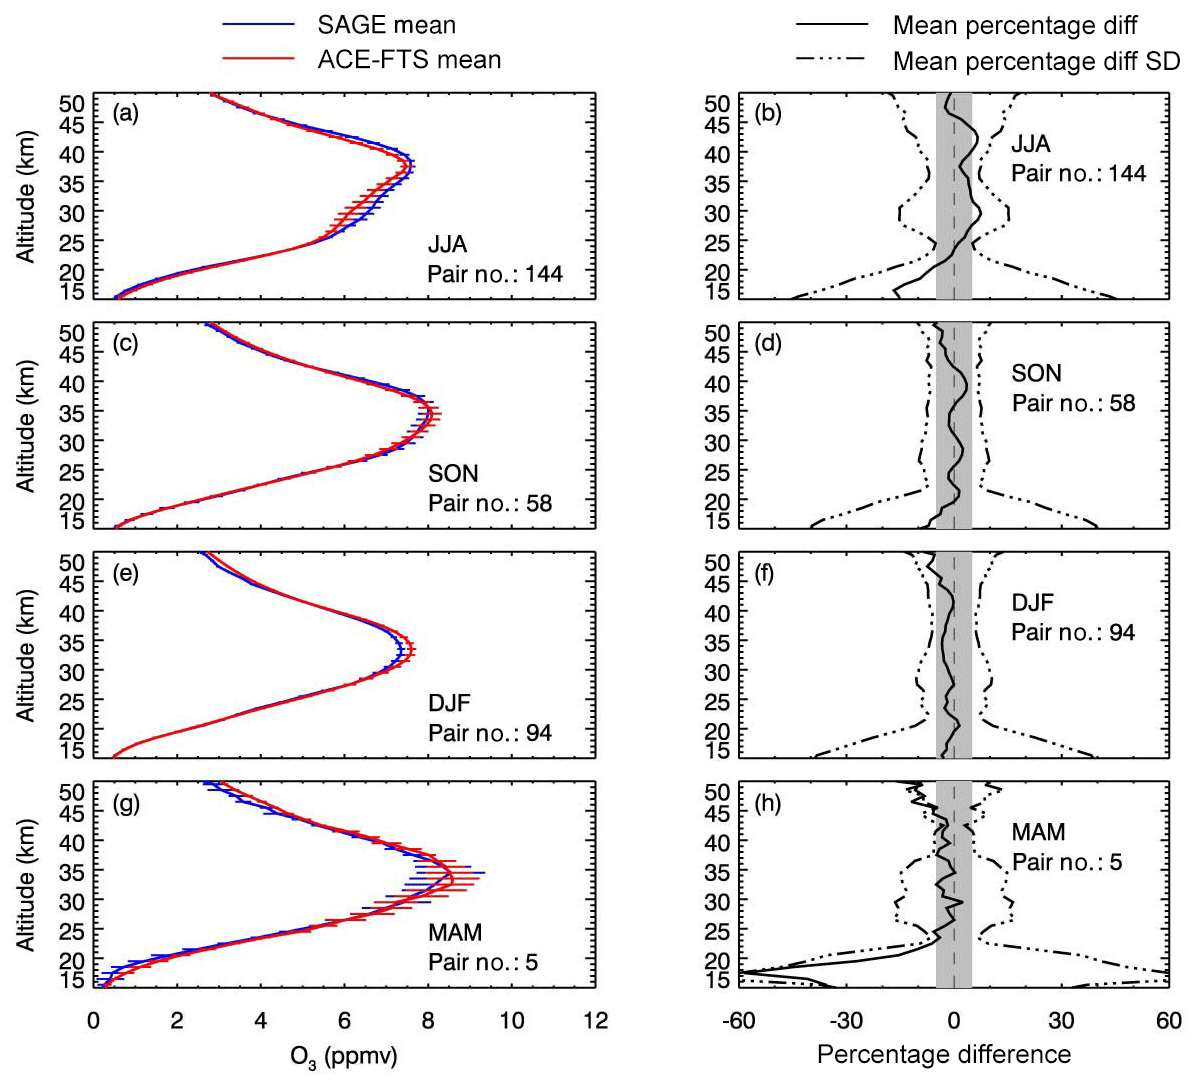
Figure 8Seasonal average ozone mixing ratio profile comparisons between coincident SAGE III-ISS and ACE-FTS measurements for the Southern Hemisphere under the criteria of a latitude difference of less than ±10∘, a longitude difference of less than ±20∘, and a time difference of less than ±10 h.
3.1 Comparison of SAGE III-ISS solar and ground-based lidar measurements
A total of 1 year of data, from June 2017 to May 2018, using the 24 coincident profile pairs between the SAGE III-ISS and the Hohenpeißenberg lidar ozone data, is shown in Fig. 2a. Note that the altitude spread of these comparisons is shown as the vertical gray bar. The average difference of all coincident pairs for 1 year of data is calculated and is shown in Fig. 2b. The average time difference is 11.8 h, the average latitude difference is 3.4∘, the average longitude difference is 4.2∘, and the average profile distance is 526.6 km. The average percentage difference between the SAGE III-ISS and the Hohenpeißenberg lidar data is less than 5 % from 20 to 40 km and 10 % from 16 to 42 km with a very low standard error between 20 and 40 km that increases above and below this region.
Similarly, comparisons between the coincident pairs of the SAGE III-ISS and Lauder ozone lidar are shown in Fig. 3. There is a total of seven coincident pairs found within an average time difference of 12.6 h, an average latitude difference of 2.2∘, an average longitude difference of 3.6∘, and an average separation distance of 381.5 km. The average percentage difference is less than 10 % from about 17 to about 37 km with a low standard error between 20 and 40 km.
3.2 Comparison between SAGE III-ISS solar and ozonesonde measurements
The average of 35 coincident ozone profile pairs between SAGE III-ISS and Hohenpeißenberg ozonesondes is compared, as shown in Fig. 4. The coincident pairs had an average time difference of 9.7 h, an average latitude difference of 3.2∘, an average longitude difference of 4.5∘, and an average separation distance of 516.0 km. The average ozone percentage differences are found to be less than 10 % from about 18 to 30 km. The SAGE III-ISS ozone values show an average positive difference increase above 27 km where uncertainties in the Brewer–Mast ozonesonde measurements rapidly increase (Kerr et al., 1994). The comparison of coincident profile pairs between SAGE III-ISS and the Lauder ozonesonde data is shown in Fig. 5. A total of 13 coincident pairs are found from June 2017 to May 2018. The coincident pairs have an average time difference of 10.8 h, an average latitude difference of 1.6∘, an average longitude difference of 3.3∘, and an average separation distance of 329.3 km. The average percentage difference between SAGE III-ISS and Lauder ozone concentrations is less than 10 % between 19 and 31 km with a low standard error between about 20 and 30 km.
3.3 Comparisons between SAGE III-ISS solar and ACE-FTS measurements
The coincident ozone concentration between SAGE III-ISS and ACE-FTS is compared in this section. In order to compare SAGE III-ISS with the ozone mixing ratio data from ACE-FTS, the number density data of SAGE III-ISS are converted to a volume mixing ratio (ppmv) using the temperature and pressure data reported by SAGE III-ISS. The average coincident ozone profile pairs between SAGE III-ISS and the ACE-FTS are compared for different seasons using SAGE III-ISS Level 2 solar data from June 2017 to November 2018. A total of 403 coincident profiles are found using the criteria. As shown in Fig. 6b, the coincident events between SAGE III-ISS and ACE-FTS are only found in the Northern Hemisphere under the criteria of a latitude difference of less than ±5∘, a longitude difference of less than ±10∘, and a time difference of less than ±4 h. Coincident events are generally located in the mid- and high-latitudes in the Northern Hemisphere because of the high inclination of the SAGE III-ISS and ACE-FTS orbits (Dupuy et al., 2009). More than 85 % of the coincident SAGE III-ISS and ACE-FTS events are located at latitudes higher than 40∘ N in this case.
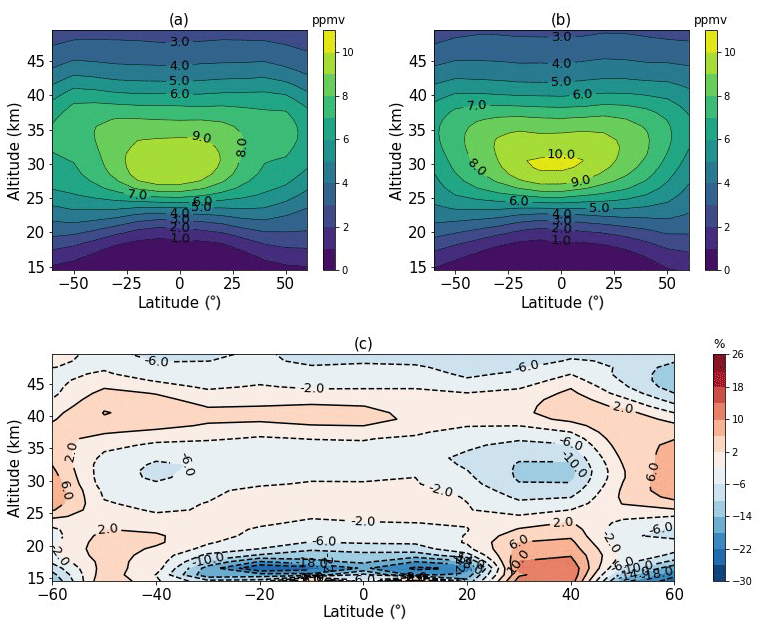
Figure 9Zonal mean ozone comparisons between SAGE III-ISS and ACE-FTS between 15 and 50 km. (a) The zonal mean ozone for SAGE III-ISS. (b) The zonal mean ozone for ACE-FTS. (c) The zonal mean ozone percentage difference between the two abovementioned instruments.
Figure 7a, c, e, and g show the seasonal average ozone mixing ratio profiles and twice the standard error (±2SEM) for the two instruments in the Northern Hemisphere for JJA (June, July, and August; 182 pairs), SON (September, October, and November; 119 pairs), DJF (December, January, and February; 39 pairs), and MAM (March, April, and May; 63 pairs).
Figure 7b, d, f, and h show the average percentage difference between the two instruments and their standard deviations. The bold black line shows the average percentage difference and the dash-dotted line shows the standard deviation of the percentage difference. The vertical gray regions indicate the ±5 % difference region. The mean percentage difference between the two instruments is mostly less than 5 % from 20 to 45 km. The comparisons show slightly larger positive differences near 40 km for the DJF and MAM measurements. The comparisons show slightly negative differences near 30 km for the SON measurements and show positive differences near 30 km for DJF. Between 20 and 40 km, standard deviations for the percentage differences are less than 5 % in JJA and MAM. DJF differences show the largest standard deviation, but they are still mostly less than 10 % between 20 and 50 km. The standard deviation below 20 km is larger for all seasons with a maximum of 50 % in DJF.
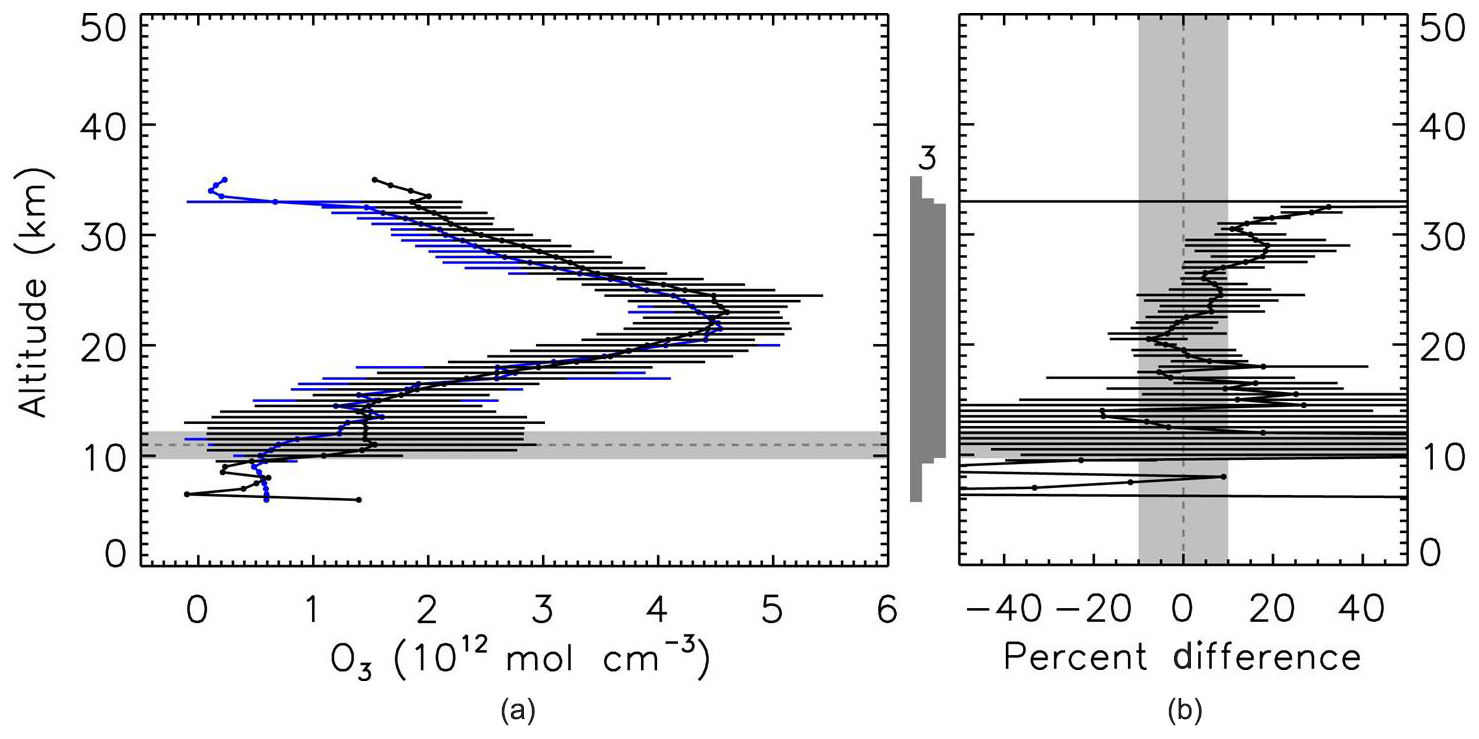
Figure 10Similar to Fig. 2 but for the average difference of coincident pairs for SAGE III-ISS lunar occultation measurements and Lauder ozonesonde profiles obtained from June 2017 to May 2018.
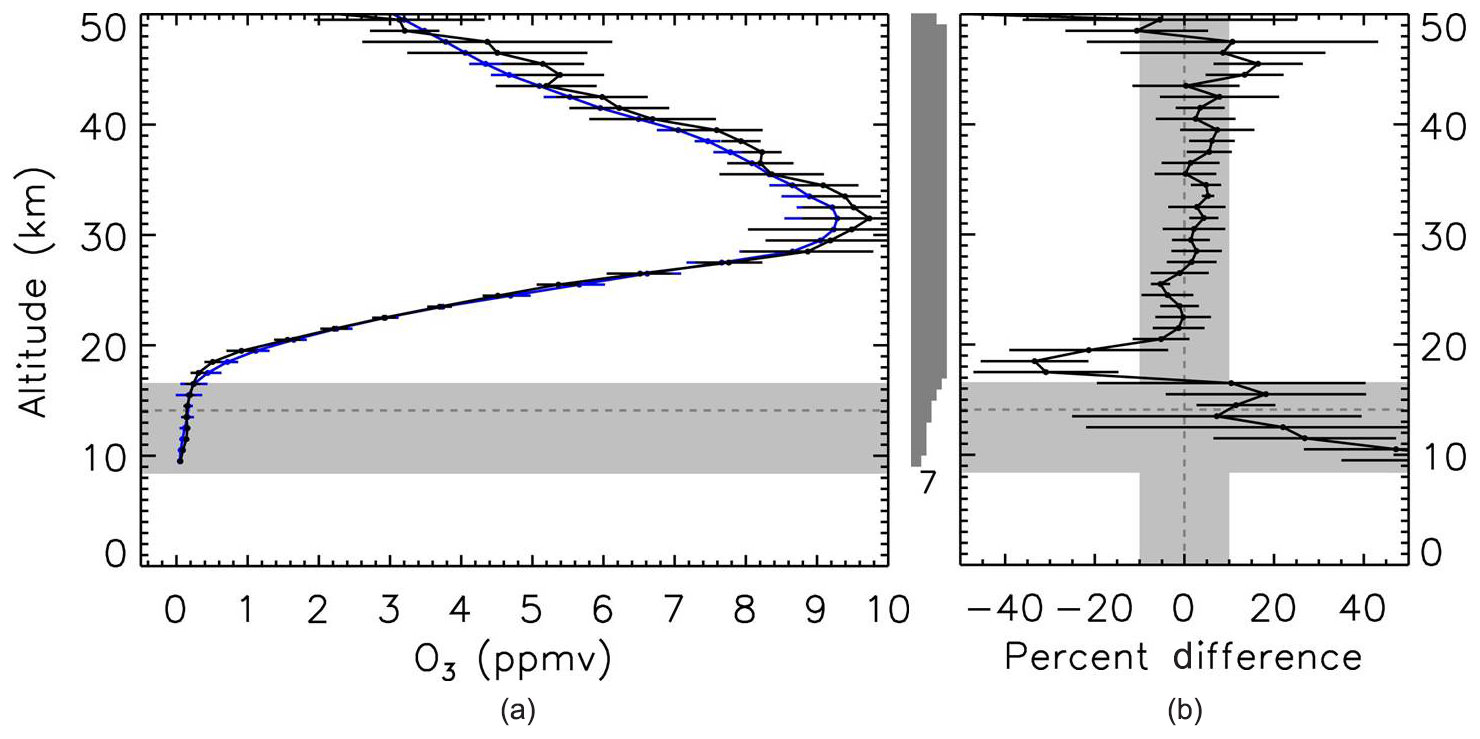
Figure 11Similar to Fig. 2 but for the average difference between SAGE III-ISS lunar occultation measurements and the ACE-FTS ozone. Seven comparisons between the SAGE III-ISS lunar and ACE-FTS measurements are shown.
A wider criteria of a latitude difference of less than ±10∘, a longitude difference of less than ±20∘, and a time difference of less than ±10 h are used to find four seasonal coincident events between the SAGE III-ISS and ACE-FTS in the Southern Hemisphere; a total of 301 pairs of coincident profiles are found. Similar to Fig. 7, Fig. 8a, c, e, and g show the seasonal average ozone mixing ratio profiles and twice the standard error (±2SEM) for the coincident events of the two instruments in the Southern Hemisphere for JJA (144 pairs), SON (58 pairs), DJF (94 pairs), and MAM (5 pairs).
Figure 8b, d, f, and h show that the mean percentage difference between the two instruments is less than 5 % from 20 to 45 km for SON and DJF. The comparison for JJA shows less than a 10 % difference between 20 and 50 km with slightly larger positive differences near 30 and 40 km. The comparison for MAM shows less than a 5 % difference between 25 and 45 km. Between 25 and 45 km, standard deviations for the percentage differences are mostly less than 10 % in SON and DJF. Results in JJA and MAM show the largest standard deviation, but it is still mostly less than 20 % between 20 and 50 km. The standard deviation below 20 km is larger for all seasons with a maximum as large as 60 % in MAM.
The zonal mean ozone mixing ratios from 15 to 50 km for SAGE III-ISS and ACE-FTS are calculated using 10 latitude bins from 60∘ N to 60∘ S. Results are shown in Fig. 9a and b. The maximum ozone mixing ratios are located at about 32 km in the tropical region with maximum mixing ratios larger than 9.8 ppmv shown for both SAGE III-ISS and ACE-FTS. Figure 9c indicates that the SAGE III-ISS zonal average ozone mixing ratios are generally less than the ACE-FTS throughout the tropical stratosphere with an exception near 40 km. The differences are mostly less than 5 % except close to the tropical tropopause area, which is most likely impacted by cirrus clouds that occur more frequently near the tropical tropopause (Nazaryan et al., 2008).
3.4 Comparison between SAGE III-ISS lunar and Lauder ozonesonde and ACE-FTS profiles
The coincident lidar, ozonesonde, and ACE-FTS ozone profiles are compared with SAGE III-ISS lunar ozone profiles. SAGE III/ISS lunar observations are taken much less frequently than solar observations. Consequently, only a few coincident profiles are obtained within the previously defined criteria, including three with Lauder ozonesonde profiles, seven with ACE-FTS, and fewer than three with the other instruments (whose comparisons are not shown).
Figure 10 shows a comparison between SAGE III-ISS and Lauder ozonesonde data taken within an average of 7.2 h of each other, with an average latitude difference of 2.1∘, a longitude difference of 5.4∘, and a spatial difference of 508.6 km. The percentage difference between the coincident pairs is less than 10 % between approximately 19 and 27 km. The average ozone concentration difference between SAGE III-ISS lunar profiles and the ACE-FTS is shown in Fig. 11. The average difference between the two datasets is less than 10 % with a standard deviation of less than 5 % between 20 and 45 km.
This paper represents an early effort to provide validation of upper tropospheric and stratospheric ozone measurements from SAGE III-ISS to the broad scientific user community. It goes a long way toward verifying the performance of the SAGE III-ISS satellite instrument as well as its capability to provide reliable atmospheric ozone profile measurements. Coincident measurements from the first year of ozone data provided by SAGE III-ISS are compared with ozone profiles measured by ground-based lidars and ozonesondes. The average differences in the ozone concentration measured by SAGE III-ISS and Hohenpeißenberg lidar are less than 10 % between 16 and 42 km and less than 5 % between 20 and 40 km. The comparisons between the SAGE III-ISS and Lauder lidar ozone measurements are less than 10 % between 17 and 37 km. The results of comparisons between the SAGE III-ISS and Hohenpeißenberg ozonesondes are mostly less than 10 % between 18 and 30 km. When compared with Lauder ozonesondes, the average differences are less than 10 % between 19 and 31 km. The average ozone concentration differences between SAGE III-ISS and ACE-FTS are mostly less than 5 % between 20 and 45 km in both the Northern Hemisphere and the Southern Hemisphere during different seasons over the period from June 2017 to November 2018. In summary, more than 700 coincident ozone profile pairs are used for the comparisons in this paper, and the results show that SAGE III-ISS is capable of providing ozone profile measurements that are consistent with another satellite instrument as well as ground-based lidars and ozonesondes developed for such validation measurements. Although there are significantly fewer coincident lunar profiles available, early results suggest that the lunar ozone measurements agree well with ozonesondes and the ACE-FTS. This suggests that SAGE III-ISS ozone data compare well with a number of correlative measurements and, given a reasonable lifetime, should be used for stratospheric trend and recovery studies as well as research on the impact of ozone on climate variation studies. The authors will continue these comparisons into the near future by including more NDACC and other ozone measurements as well as new versions of SAGE III-ISS Level 2 data when they become available.
The satellite ozone profile data used in this work were obtained from SAGE III-ISS v5.1 (2020, available at: ftp://l5ftl01.larc.nasa.gov/../distribution/SAGE_III_ISS/) and ACE-FTS v3.5/3.6 (2020, available at: https://databace.scisat.ca/level2/ace_v3.5_v3.6/). The ground-based lidar and ozonesonde ozone profile data were obtained from the NDACC Data Host Facility (2020): the Hohenpeißenberg ozonsonde data were from ftp://ftp.cpc.ncep.noaa.gov/ndacc/station/hohenpei/ames/o3sonde/; the Hohenpeissenberg lidar data were from ftp://ftp.cpc.ncep.noaa.gov/ndacc/station/hohenpei/ames/lidar/; the Lauder ozonesonde data were from ftp://ftp.cpc.ncep.noaa.gov/ndacc/station/lauder/ames/o3sonde/; and the Lauder lidar data were from ftp://ftp.cpc.ncep.noaa.gov/ndacc/station/lauder/ames/lidar/.
MPM formulated the overarching research goals. MTH compared the ozone profiles from SAGE III-ISS with coincident ozone profiles obtained from lidar and sondes. LL compared the SAGE III-ISS and ACE-FTS ozone profiles. LL wrote the initial draft of the paper with contributions from all co-authors. All authors reviewed the manuscript, and MPM provided the final paper for submission.
The authors declare that they have no conflict of interest.
We want to thank the NASA Langley Research Center (NASA LaRC) SAGE III-ISS Data Algorithm Team. The ground-based lidar and ozonesonde data used in this publication were obtained from the Hohenpeißenberg Meteorological Observatory, German National Meteorological Hohenpeißenberg, Germany, and the National Institute of Water and Atmospheric Research (NIWA), Lauder, New Zealand, as part of the Network for the Detection of Atmospheric Composition Change (NDACC). The Atmospheric Chemistry Experiment (ACE), also known as SCISAT, is a Canadian-led mission mainly supported by the Canadian Space Agency. We want to thank the ACE team for providing the ACE-FTS ozone data used in this work.
This work was partially supported by the National Oceanic and Atmospheric Administration – Cooperative Science Center for Earth System Sciences and Remote Sensing Technologies (NOAA-CESSRST; under the cooperative agreement grant no. NA16SEC4810008). The statements contained within the manuscript/research article are not the opinions of the funding agency or the US government and reflect the author's opinions.
This paper was edited by Mark Weber and reviewed by two anonymous referees.
ACE-FTS v3.5/3.6: Satellite ozone profile data, available at: https://databace.scisat.ca/level2/ace_v3.5_v3.6/, last access: 10 March 2020.
Bernath, P. F., McElroy, C. T., Abrams, M. C., Boone, C. D., Butler, M., Camy-Peyret, C., Carleer, M., Clerbaux, C., Coheur, P. F., Colin, R., DeCola, P., DeMaziíere, M., Drummond, J. R., Dufour, D., Evans, W. F. J., Fast, H., Fussen, D., Gilbert, K., Jennings, D. E., Llewellyn, E. J., Lowe, R. P., Mahieu, E., McConnell, J. C., McHugh, M., McLeod, S. D., Michaud, R., Midwinter, C., Nassar, R., Nichitiu, F., Nowlan, C., Rinsland, C. P., Rochon, Y. J., Rowlands, N., Semeniuk, K., Simon, P., Skelton, R., Sloan, J. J., Soucy, M.-A., Strong, K., Tremblay, P., Turnbull, D., Walker, K. A., Walkty, I., Wardle, D. A., Wehrle, V., Zander, R., and Zou, J.: Atmospheric Chemistry Experiment (ACE): mission overview, Geophys. Res. Lett., 32, L15S01, https://doi.org/10.1029/2005GL022386, 2005.
Bodeker, G. E., Boyd, I. S., and Matthews, W. A.: Trends and variability in vertical ozone and temperature profiles measured by ozonesondes at Lauder, New Zealand: 1986–1996, J. Geophys. Res., 103, 28661–28681, 1998.
Boone, C. D., Nassar, R., Walker, K. A., Rochon, Y., McLeod, S. D., Rinsland, C. P., and Bernath, P. F.: Retrievals for the atmospheric chemistry experiment Fourier-transform spectrometer, Appl. Optics, 44, 7218–7231, https://doi.org/10.1364/ao.44.007218, 2005.
Bourassa, A. E., Degenstein, D. A., Randel, W. J., Zawodny, J. M., Kyrölä, E., McLinden, C. A., Sioris, C. E., and Roth, C. Z.: Trends in stratospheric ozone derived from merged SAGE II and Odin-OSIRIS satellite observations, Atmos. Chem. Phys., 14, 6983–6994, https://doi.org/10.5194/acp-14-6983-2014, 2014.
Bovensmann, H., Burrows, J. P., Buchwitz, M., Frerick, J., Noel, S., Rozanov, V. V., Chance, K. V., and Goede, A. P. H.: SCIAMACHY: Mission objectives and measurement modes, J. Atmos. Sci., 56, 127–150, https://doi.org/10.1175/1520-0469(1999)056<0127:SMOAMM>2.0.CO;2, 1999.
Damadeo, R. P., Zawodny, J. M., Thomason, L. W., and Iyer, N.: SAGE version 7.0 algorithm: application to SAGE II, Atmos. Meas. Tech., 6, 3539–3561, https://doi.org/10.5194/amt-6-3539-2013, 2013.
Dupuy, E., Walker, K. A., Kar, J., Boone, C. D., McElroy, C. T., Bernath, P. F., Drummond, J. R., Skelton, R., McLeod, S. D., Hughes, R. C., Nowlan, C. R., Dufour, D. G., Zou, J., Nichitiu, F., Strong, K., Baron, P., Bevilacqua, R. M., Blumenstock, T., Bodeker, G. E., Borsdorff, T., Bourassa, A. E., Bovensmann, H., Boyd, I. S., Bracher, A., Brogniez, C., Burrows, J. P., Catoire, V., Ceccherini, S., Chabrillat, S., Christensen, T., Coffey, M. T., Cortesi, U., Davies, J., De Clercq, C., Degenstein, D. A., De Mazière, M., Demoulin, P., Dodion, J., Firanski, B., Fischer, H., Forbes, G., Froidevaux, L., Fussen, D., Gerard, P., Godin-Beekmann, S., Goutail, F., Granville, J., Griffith, D., Haley, C. S., Hannigan, J. W., Höpfner, M., Jin, J. J., Jones, A., Jones, N. B., Jucks, K., Kagawa, A., Kasai, Y., Kerzenmacher, T. E., Kleinböhl, A., Klekociuk, A. R., Kramer, I., Küllmann, H., Kuttippurath, J., Kyrölä, E., Lambert, J.-C., Livesey, N. J., Llewellyn, E. J., Lloyd, N. D., Mahieu, E., Manney, G. L., Marshall, B. T., McConnell, J. C., McCormick, M. P., McDermid, I. S., McHugh, M., McLinden, C. A., Mellqvist, J., Mizutani, K., Murayama, Y., Murtagh, D. P., Oelhaf, H., Parrish, A., Petelina, S. V., Piccolo, C., Pommereau, J.-P., Randall, C. E., Robert, C., Roth, C., Schneider, M., Senten, C., Steck, T., Strandberg, A., Strawbridge, K. B., Sussmann, R., Swart, D. P. J., Tarasick, D. W., Taylor, J. R., Tétard, C., Thomason, L. W., Thompson, A. M., Tully, M. B., Urban, J., Vanhellemont, F., Vigouroux, C., von Clarmann, T., von der Gathen, P., von Savigny, C., Waters, J. W., Witte, J. C., Wolff, M., and Zawodny, J. M.: Validation of ozone measurements from the Atmospheric Chemistry Experiment (ACE), Atmos. Chem. Phys., 9, 287–343, https://doi.org/10.5194/acp-9-287-2009, 2009.
Harris, N. R. P., Hassler, B., Tummon, F., Bodeker, G. E., Hubert, D., Petropavlovskikh, I., Steinbrecht, W., Anderson, J., Bhartia, P. K., Boone, C. D., Bourassa, A., Davis, S. M., Degenstein, D., Delcloo, A., Frith, S. M., Froidevaux, L., Godin-Beekmann, S., Jones, N., Kurylo, M. J., Kyrölä, E., Laine, M., Leblanc, S. T., Lambert, J.-C., Liley, B., Mahieu, E., Maycock, A., de Mazière, M., Parrish, A., Querel, R., Rosenlof, K. H., Roth, C., Sioris, C., Staehelin, J., Stolarski, R. S., Stübi, R., Tamminen, J., Vigouroux, C., Walker, K. A., Wang, H. J., Wild, J., and Zawodny, J. M.: Past changes in the vertical distribution of ozone – Part 3: Analysis and interpretation of trends, Atmos. Chem. Phys., 15, 9965–9982, https://doi.org/10.5194/acp-15-9965-2015, 2015.
Imai, K., Manago, N., Mitsuda, C., Naito, Y., Nishimoto, E., Sakazaki, T., Fujiwara, M., Froidevaux, L., von Clarmann, T., Stiller, G. P., Murtagh, D. P., Rong, P.-P., Mlynczak, M. G., Walker, K. A., Kinnison, D. E., Akiyoshi, H., Nakamura, T., Miyasaka, T., Nishibori, T., Mizobuchi, S., Kikuchi, K. I., Ozeki, H., Takahashi, C., Hayashi, H., Sano, T., Suzuki, M., Takayanagi, M., and Shiotani, M.: Validation of ozone data from the superconducting Submillimeter-Wave Limb-Emission Sounder (SMILES), J. Geophys. Res., 118, 5750–5769, https://doi.org/10.1002/jgrd.50434, 2013.
Kerr, J. B., Fast, H., McElroy, C. T., Oltmans, S. J., Lathrop, J. A., Kyro, E., Paukkunen, A., Claude, H., Koehler, U., Sreedharan, C. R., Takao, T., and Tsukagoshi, Y.: The 1991 WMO International Ozonesonde Intercomparison at Vanscoy Canada, Atmos. Ocean, 32, 685–716, 1994.
Leblanc, T., Sica, R. J., van Gijsel, J. A. E., Godin-Beekmann, S., Haefele, A., Trickl, T., Payen, G., and Gabarrot, F.: Proposed standardized definitions for vertical resolution and uncertainty in the NDACC lidar ozone and temperature algorithms – Part 1: Vertical resolution, Atmos. Meas. Tech., 9, 4029–4049, https://doi.org/10.5194/amt-9-4029-2016, 2016a.
Leblanc, T., Sica, R. J., van Gijsel, J. A. E., Godin-Beekmann, S., Haefele, A., Trickl, T., Payen, G., and Liberti, G.: Proposed standardized definitions for vertical resolution and uncertainty in the NDACC lidar ozone and temperature algorithms – Part 2: Ozone DIAL uncertainty budget, Atmos. Meas. Tech., 9, 4051–4078, https://doi.org/10.5194/amt-9-4051-2016, 2016b.
Leblanc, T., Sica, R. J., van Gijsel, J. A. E., Haefele, A., Payen, G., and Liberti, G.: Proposed standardized definitions for vertical resolution and uncertainty in the NDACC lidar ozone and temperature algorithms – Part 3: Temperature uncertainty budget, Atmos. Meas. Tech., 9, 4079–4101, https://doi.org/10.5194/amt-9-4079-2016, 2016c.
Lucke, R. L., Korwan, D., Bevilacqua, R. M., Hornstein, J. S., Shettle, E. P., Chen, D. T., Daehler, M., Lumpe, J. D., Fromm, M. D., Debrestian, D., Neff, B., Squire, M., König-Langlo, G., and Davies, J.: The Polar Ozone and Aerosol Measurement (POAM III) Instrument and Early Validation Results, J. Geophys. Res., 104, 18785–18799, https://doi.org/10.1029/1999JD900235, 1999.
McCormick, M. P., Zawodny, J. M., Veiga, R. E., Larsen, J. C., and Wang, P. H.: An overview of SAGE I and II ozone measurements, Planetary Space Sci., 37, 1567–1586, https://doi.org/10.1016/0032-0633(89)90146-3, 1989.
McCormick, M. P., Veiga, R. E., and Chu, W. P.: Stratospheric ozone profile and total ozone trends derived from the SAGE I and SAGE II data, Geophys. Res. Lett., 19, 269–272, https://doi.org/10.1029/92GL00187, 1992.
Nazaryan, H., McCormick, M. P., and Menzel, W. P.: Global characterization of cirrus clouds using CALIPSO data, J. Geophys. Res., 113, D16211, https://doi.org/10.1029/2007JD009481, 2008.
NDACC Data Host Facility: Ground-based lidar and ozonesonde ozone profile data, Hohenpeißenberg ozonsonde data: ftp://ftp.cpc.ncep.noaa.gov/ndacc/station/hohenpei/ames/o3sonde/, Hohenpeissenberg lidar data: ftp://ftp.cpc.ncep.noaa.gov/ndacc/station/hohenpei/ames/lidar/, Lauder ozonesonde data: ftp://ftp.cpc.ncep.noaa.gov/ndacc/station/lauder/ames/o3sonde/, Lauder lidar data: ftp://ftp.cpc.ncep.noaa.gov/ndacc/station/lauder/ames/lidar/, last access: 10 March 2020.
Randall, C. E., Rusch, D. W., Bevilacqua, R. M., Hoppel, K. W., Lumpe, J. D., Shettle, E., Thompson, E., Deaver, L., Zawodny, J., Kyrö, E., Johnson, B., Kelder, H., Dorokhov, V. M., KönigLanglo, G., and Gil, M.: Validation of POAM III ozone: Comparison with ozonesonde and satellite data, J. Geophys. Res., 108, 4367, https://doi.org/10.1029/2002JD002944, 2003.
Reinsel, G., Weatherhead, E. C., Tiao, G. C., Miller, A. J., Nagatani, R., Wuebbles, D. J., and Flynn, L. E.: On detection of turnaround and recovery in trend for ozone, J. Geophys. Res., 107, ACH 1-1–ACH 1-12, https://doi.org/10.1029/2001JD000500, 2002.
Rex, M., Salawitch, R. J., von der Gathen, P., Harris, N. R. P., Chipperfield, M. P., and Naujokat, B.: Arctic ozone loss and climate change, Geophys. Res. Lett., 31, L04116, https://doi.org/10.1029/2003GL018844, 2004.
Rong, P. P., Russell III, J. M., Mlynczak, M. G., Remsberg, E. E., Marshall, B. T., Gordley, L. L., and Lopez-Puertas, M.: Validation of Thermosphere Ionosphere Mesosphere Energetics and Dynamics/Sounding of the Atmosphere using Broadband Emission Radiometry (TIMED/SABER) v1.07 ozone at 9.6 µm in altitude range 15–70 km, J. Geophys. Res., 114, D04306, https://doi.org/10.1029/2008JD010073, 2009.
Russell, J. M., Gordley, L. L., Park, J. H., Drayson, S. R., Tuck, A. F., Harries, J. E., Cicerone, R. J., Crutzen, P. J., and Frederick, J. E.: The Halogen Occultation Experiment, J. Geophys. Res., 98, 10777–10797, https://doi.org/10.1029/93JD00799, 1993.
SAGE III-ISS v5.1: Ozone profile data, available at: ftp://l5ftl01.larc.nasa.gov/../distribution/SAGE_III_ISS/, last access: 10 March 2020.
Smith, A. K., Harvey, V. L., Mlynczak, M. G., Funke, B., Garcia-Comas, M., Hervig, M., Kaufmann, M., Kyrölä, E., López-Puertas, M., McDade, I., Randall, C. E., Russell III, J. M., Sheese, P. E., Shiotani, M., Skinner, W. R., Suzuki, M., and Walker, K. A.: Satellite observations of ozone in the upper mesosphere, J. Geophys. Res., 118, 5803–5821, https://doi.org/10.1002/jgrd.50445, 2013.
Solomon, S.: Stratospheric ozone depletion: a review of concepts and history, Rev. Geophys., 37, 275–316, https://doi.org/10.1029/1999RG900008, 1999.
Son, S. W., Polvani, L. M., Waugh, D. W., Akiyoshi, H., Garcia, R., Kinnison, D., Pawson, S., Rozanov, E., Shepherd, T. G., and Shibata, K.: The impact of stratospheric ozone recovery on the Southern Hemisphere westerly jet, Science, 320, 1486–1489, https://doi.org/10.1126/science.1155939, 2008.
SPARC/IOC/GAW: Assessment of Trends in the Vertical Distribution of Ozone, WMO – Ozone Research and Monitoring Project Report No. 43, World Meteorological Organization (WMO), Geneva, 1998.
Stratospheric Aerosol and Gas Experiment on the International Space Station (SAGE III/ISS) Data Products User's Guide, Version 2.0 October 2018, available at: https://eosweb.larc.nasa.gov/project/sageiii-iss/guide/DPUG-G3B-2-0.pdf (last access: 10 March 2020), 2018.
Thompson, D. W. J., Solomon, S., Kushner, P. J., England, M. H., Grise, K. M., and Karoly, D. J.: Signatures of the Antarctic ozone hole in Southern Hemisphere surface climate change, Nat. Geosci., 4, 741–749, 2011.
von Clarmann, T.: Validation of remotely sensed profiles of atmospheric state variables: strategies and terminology, Atmos. Chem. Phys., 6, 4311–4320, https://doi.org/10.5194/acp-6-4311-2006, 2006.
Wang, H.-J., Cunnold, D. M., Trepte, C., Thomason, L. W., and Zawodny, J. M.: SAGE III solar ozone measurements: Initial results, Geophys. Res. Lett., 33, L03805, https://doi.org/10.1029/2005GL025099, 2006.
Waymark, C., Walker, K. A., Boone, C. D., and Bernath, P. F.: ACE-FTS version 3.0 data set: validation and data processing update, in: Proceedings of the ACVE workshop, Frascati, Italy, March 2013, Ann. Geophys., 56, https://doi.org/10.4401/ag-6339, 2013.
Weber, M., Steinbrecht, W., van der A, R., Frith, S. M., Anderson, J., Coldewey-Egbers, M., Davis, S., Degenstein, D., Fioletov, V. E., Froidevaux, L., Hubert, D., de Laat, J., Long, C. S., Loyola, D., Sofieva, V., Tourpali, K., Roth, C., Wang, R., and Wild, J. D.: Stratospheric Ozone, in: “State of the Climate in 2017”, B. Am. Meteorol. Soc., 99, S51–S54, https://doi.org/10.1175/2018BAMSStateoftheClimate.1, 2018.