the Creative Commons Attribution 4.0 License.
the Creative Commons Attribution 4.0 License.
 | 08 May 2020
Intercomparison study of atmospheric 222Rn and 222Rn progeny monitors
Scott D. Chambers
Olivier Llido
Felix R. Vogel
Victor Kazan
Alessandro Capuana
Sylvester Werczynski
Roger Curcoll
Marc Delmotte
Arturo Vargas
Josep-Anton Morguí
Ingeborg Levin
Michel Ramonet
The use of the noble gas radon (222Rn) as a tracer for different research studies, for example observation-based estimation of greenhouse gas (GHG) fluxes, has led to the need of high-quality 222Rn activity concentration observations with high spatial and temporal resolution. So far a robust metrology chain for these measurements is not yet available.
A portable direct atmospheric radon monitor (ARMON), based on electrostatic collection of 218Po, is now running at Spanish stations. This monitor has not yet been compared with other 222Rn and 222Rn progeny monitors commonly used at atmospheric stations.
A 3-month intercomparison campaign of atmospheric 222Rn and 222Rn progeny monitors based on different measurement techniques was realized during the fall and winter of 2016–2017 to evaluate (i) calibration and correction factors between monitors necessary to harmonize the atmospheric radon observations and (ii) the dependence of each monitor's response in relation to the sampling height and meteorological and atmospheric aerosol conditions.
Results of this study have shown the following. (i) All monitors were able to reproduce the atmospheric radon variability on a daily basis. (ii) Linear regression fits between the monitors exhibited slopes, representing the correction factors, between 0.62 and 1.17 and offsets ranging between −0.85 and −0.23 Bq m−3 when sampling 2 m above ground level (a.g.l.). Corresponding results at 100 m a.g.l. exhibited slopes of 0.94 and 1.03 with offsets of −0.13 and 0.01 Bq m−3, respectively. (iii) No influence of atmospheric temperature and relative humidity on monitor responses was observed for unsaturated conditions at 100 m a.g.l., whereas slight influences (order of 10−2) of ambient temperature were observed at 2 m a.g.l. (iv) Changes in the ratio between 222Rn progeny and 222Rn monitor responses were observed under very low atmospheric aerosol concentrations.
Results also show that the new ARMON could be useful at atmospheric radon monitoring stations with space restrictions or as a mobile reference instrument to calibrate in situ 222Rn progeny monitors and fixed radon monitors. In the near future a long-term comparison study between ARMON, HRM, and ANSTO monitors would be useful to better evaluate (i) the uncertainties of radon measurements in the range of a few hundred millibecquerels per cubic meter to a few becquerels per cubic meter and (ii) the response time correction of the ANSTO monitor for representing fast changes in the ambient radon concentrations.
- Article
(3923 KB) - Full-text XML
-
Supplement
(1604 KB) - BibTeX
- EndNote


Over continents, the natural radioactive noble gas radon (222Rn) (half-life d) is continuously generated within the soil from the decay of radium (226Ra) (Nazaroff and Nero, 1988), and it can then escape into the atmosphere by diffusion, depending on soil characteristics and meteorological conditions (Grossi et al., 2011; López-Coto et al., 2013; Karstens et al., 2015). The global 222Rn source into the atmosphere is mainly restricted to land surfaces (Szegvary et al., 2009; Karstens et al., 2015), with the 222Rn flux from water surfaces considered negligible for most applications (Schery and Huang, 2004).
In recent decades the atmospheric scientific community has been addressing different research topics using 222Rn as a tracer. Examples of such applications include the improvement of inverse transport models (Hirao et al., 2010), the improvement of chemical transport models (Jacob and Prather, 1990; Chambers et al., 2019a), the study of atmospheric transport and mixing processes within the planetary boundary layer (Zahorowski et al., 2004; Galmarini, 2006; Baskaran, 2011; Chambers et al., 2011, 2016, 2019b; Williams et al., 2011, 2013; Vogel et al., 2013; Vargas et al., 2015; Baskaran, 2016), the experimental estimation of greenhouse gas (GHG) fluxes (Levin et al., 1999, 2011; Vogel et al., 2012; Wada et al., 2013; Grossi et al., 2018), and others listed in Grossi et al. (2016).
In light of this, atmospheric 222Rn measurements are being carried out at numerous monitoring stations of GHG concentrations and air quality using three fundamentally different measurement principles: one filter, two filters, and electrostatic deposition (Stockburger and Sittkus, 1966; Hopke, 1989; Whittlestone and Zahorowski, 1998; Paatero et al., 1998; Levin et al., 2002). The two most commonly employed measurement systems at European 222Rn monitoring stations are the dual-flow-loop two-filter monitor (Whittlestone and Zahorowski, 1998; Zahorowski et al., 2004; Chambers et al., 2011, 2014, 2018; Griffiths et al., 2016), which samples and measures radon directly, and the one-filter monitors, of which several kinds are in use (e.g., Stockburger and Sittkus, 1966; Polian, 1986; Paatero et al., 1998; Levin et al., 2002), which sample and measure aerosol-bound radon progeny. Finally, a third method is being used at several Spanish atmospheric stations (Vargas et al., 2015; Hernández-Ceballos et al., 2015; Grossi et al., 2016, 2018; Frank et al., 2016; Gutiérrez-Álvarez et al., 2019). This type of instrument performs a direct measurement of 222Rn and 220Rn (thoron) activity concentrations using the already existent method based on the electrostatic deposition of 218Po and 216Po, respectively (Hopke, 1989; Tositti et al., 2002; Grossi et al., 2012).
The diversity of these three aforementioned measurement techniques could introduce biases or compatibility issues that would limit the comparability of the results obtained by independent studies and the subsequent application of atmospheric radon data for regional to global investigations (e.g., Schmithüsen et al., 2017). Thus, a comparative assessment of all the experimental techniques applied for atmospheric 222Rn activity concentration measurements and a harmonization of their datasets are needed, as suggested by the International Atomic Energy Agency (IAEA, 2012).
Xia et al. (2010) carried out a comparison of the response of a dual-flow-loop two-filter detector from the Australian Nuclear Science and Technology Organisation (ANSTO, Whittlestone and Zahorowski 1998) and a one-filter monitor (α∕β Monitor P3) manufactured by the Bundesamt für Strahlenschutz, Germany (BfS) (Stockburger and Sittkus, 1966), for atmospheric 222Rn measurements under various meteorological conditions at 2.5 m above ground level (a.g.l.) over 1 year. Their results showed that both systems followed the same patterns and produced very similar results most of the time, except under specific meteorological conditions such as when precipitation or the proximity of the forest canopy could remove short-lived progeny from the air mass to be measured by the one-filter monitor. However, Xia et al. (2010) did not find a clear relationship between precipitation intensity and the ratio between progeny-derived 222Rn and 222Rn activity concentration to convert the progeny signal to 222Rn activity concentration.
Grossi et al. (2016) presented results from two short (about 7–9 d) comparisons between a one-filter monitor from Heidelberg University (Heidelberg Radon Monitor, HRM; Levin et al., 2002) and an atmospheric radon monitor (ARMON; Grossi et al., 2012), an electrostatic deposition monitor from the Universitat Politècnica de Catalunya (UPC). The two comparison campaigns were carried out at a coastal and a mountain site, with sampling in both cases from 10 m a.g.l. These comparisons revealed that the responses of both monitors were in agreement except for water-saturated atmospheric conditions or periods of rainfall. Again, the quantity of comparison data was not sufficient to confirm any statistical correlation.
Loss of aerosols in the air intake systems can also complicate the derivation of 222Rn activity concentrations from one-filter systems such as the HRM. Levin et al. (2017) carried out an assessment of 222Rn progeny loss in long tubing by laboratory and field experiments. Results of these experiments, for 8.2 mm inner diameter (i.d.) Decabon tubing, gave an empirical correction function for 222Rn progeny measurements, which enables the correction of measurements for this specific experimental setup (e.g., tubing type and diameter, flow rate, aerosol size distribution).
Finally, Schmithüsen et al. (2017) conducted an extensive European-wide 222Rn∕222Rn progeny comparison study in order to evaluate the comparative performance of one-filter and two-filter measurement systems, determining potential systematic biases between them and estimating correction factors that could be applied to harmonize 222Rn activity concentration estimates for their use as a tracer in various atmospheric applications. In this case, the authors employed a HRM monitor as the reference device. It was taken to nine European measurement stations to run for at least 1 month at each of them. This monitor was run in parallel to other one-filter and two-filter radon monitors operating at each station of interest.
Although several intercomparison campaigns have been carried out in the past, none of them have included simultaneous observations from one-filter, two-filter, and electrostatic deposition methods. Here, we present the results of a 3-month intercomparison campaign carried out in the fall and winter of 2016–2017 in Gif-sur-Yvette (France) where, for the first time, co-located measurements from monitors based on the three measurement principles were included. Two two-filter 222Rn monitors, two single-filter 222Rn progeny monitors, and an electrodeposition monitor were run simultaneously under different meteorological and aerosol conditions sampling from heights of 2 and 100 m a.g.l.
The main objectives of the present study were to (i) compare the calibration and correction factors between all monitors required to derive harmonized atmospheric radon activity concentrations and (ii) analyze the influence that meteorological and environmental parameters, as well as sampling height, can have on the final determined 222Rn activity concentration.
In the present paper the applied methodology is reported, including a short presentation of the 222Rn∕222Rn progeny monitors participating in the campaigns, the sampling sites, and the statistical analysis carried out. Finally, the outcomes of the present study are discussed and compared with the ones from Schmithüsen et al. (2017).
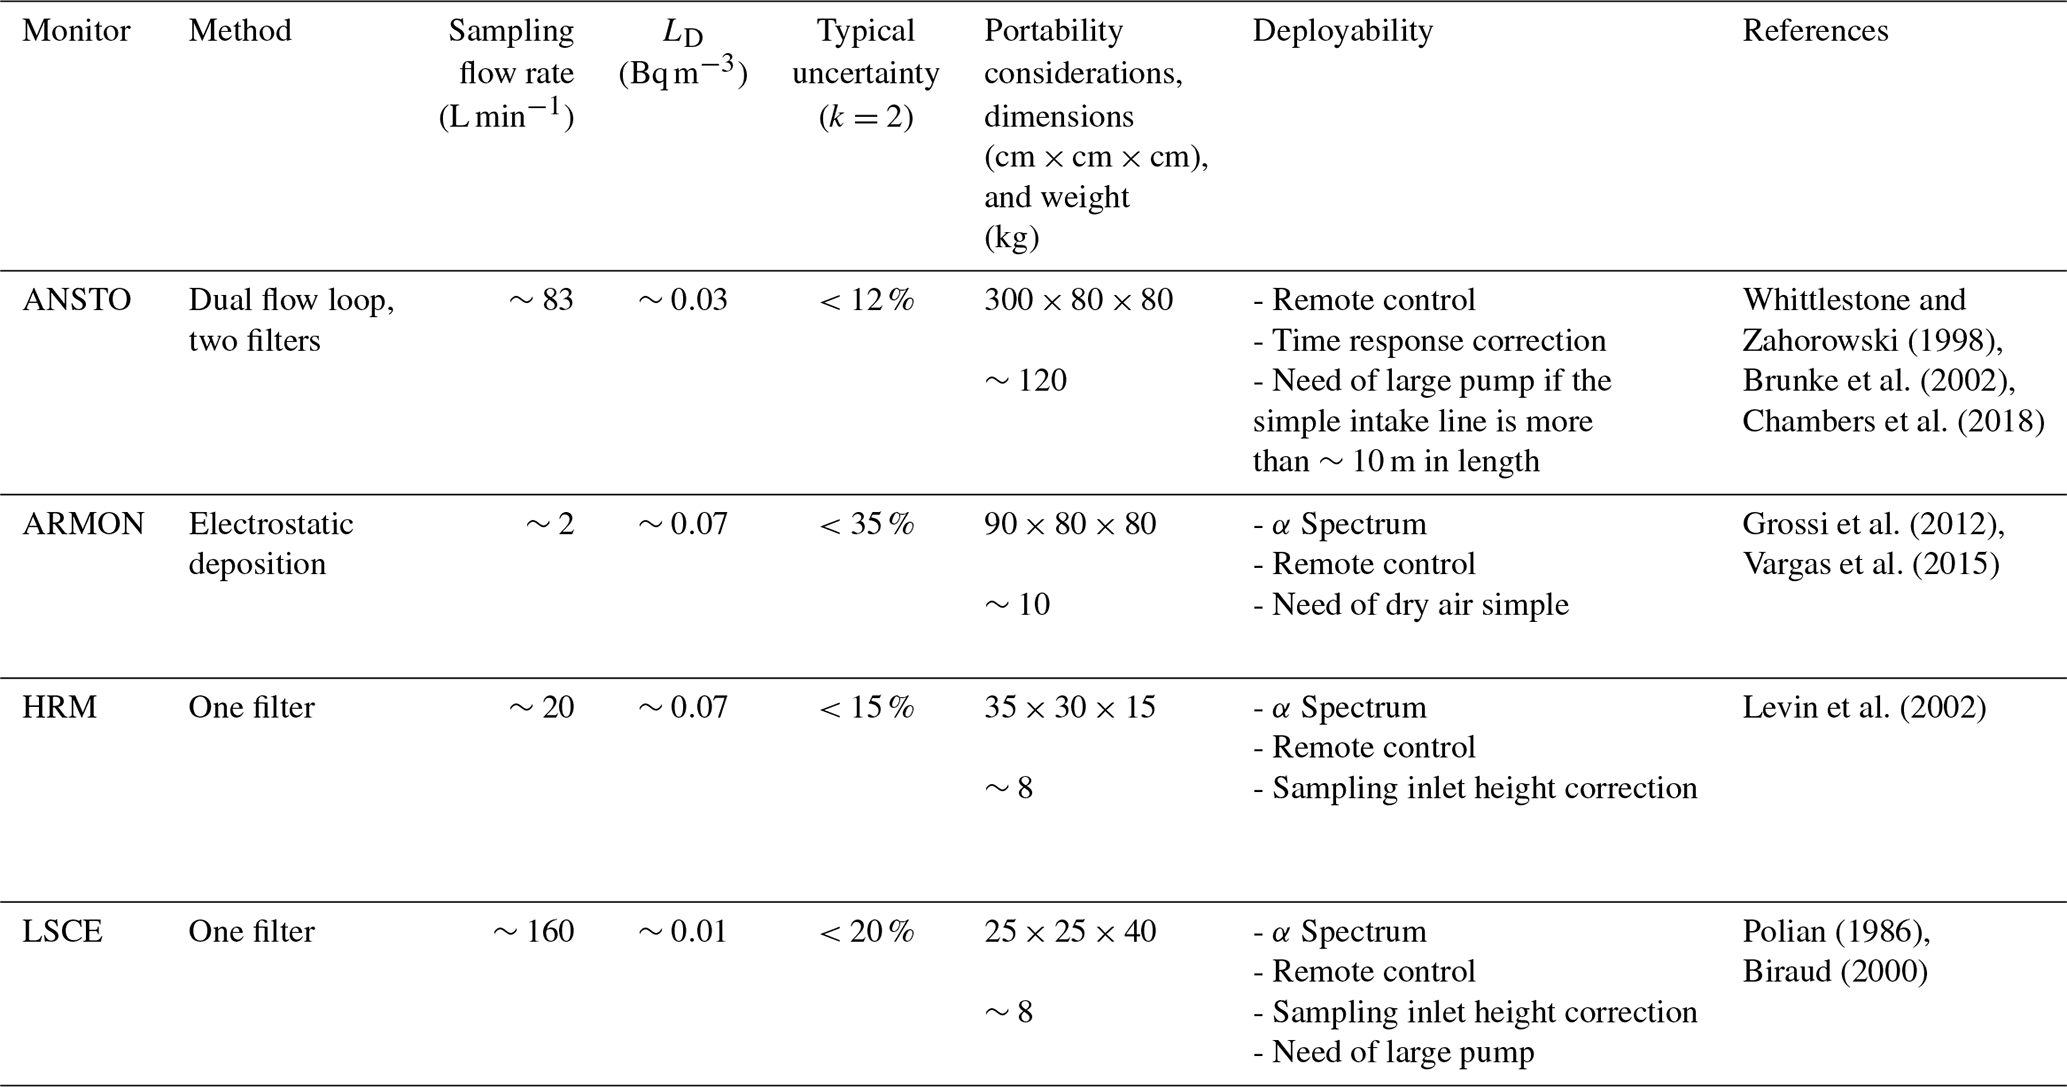
In Sect. 2.1 a short description is given of the monitors compared in the experiment, mainly focusing on measurement techniques, instrument calibration, and maintenance. The main characteristics of these monitors are then summarized in Table 1. Section 2.2 presents the French atmospheric stations of Orme de Mérisiers (ODM) and Saclay (SAC) where the two phases of the intercomparison campaign were realized. Section 2.3 briefly describes the devices used to measure the environmental parameters and the atmospheric aerosol concentration at the above sites during the experiments. Finally, the statistical analysis applied is described in Sect. 2.4.
Table 1Summary of principal characteristics of the 222Rn and 222Rn progeny monitors compared in the present study.
2.1 222Rn and 222Rn progeny monitors
2.1.1 Direct methods
Dual-flow-loop two-filter detectors
The two 1500 L dual-flow-loop two-filter detectors included in this exercise were designed and built at the Australian Nuclear Science and Technology Organisation (ANSTO). This model of detector, which will henceforth be named ANSTO, is based on a previous design by Thomas and Leclare (1970), with some early iterations of the modified design being described by Whittlestone and Zahorowski (1998) and Brunke et al. (2002). The subsequent evolution of two-filter detectors in recent decades, and the current principle of operation, has been described in detail by Williams and Chambers (2016) and Griffiths et al. (2016).
During the measurement campaign ambient air was sampled continuously at a rate of about 83 L min−1 through a 50 mm i.d. HDPE inlet tube and a 400 L delay volume to allow decay of the short-lived 220Rn ( s). The air stream then passes through the first filter, which removes all ambient aerosols as well as 222Rn and 220Rn progeny. The filtered sample, now containing only aerosol-free air and 222Rn gas, enters the main delay volume (1500 L) where 222Rn decay produces new progeny. The newly formed 218Po and 214Po are then collected on a second filter and their subsequent α decays are counted with a ZnS photomultiplier system. Atmospheric 222Rn activity concentrations are then calculated from the α count rate and the flow rate through the chamber.
The detection limit (LD) of two-filter detectors is directly related to the volume of the main delay chamber. Here, LD is understood to represent the ambient radon concentration at which the estimated counting error of the instrument reaches 30 %. The LD of the 1500 L model used in this study was around 0.03 Bq m−3. Under normal operation ANSTO monitors are automatically calibrated in situ every month by injecting radon into the sampling air stream from a well-characterized Pylon 226Ra source (ca. 41 kBq radium at SAC station) for 5 h at a fixed flow rate of ∼100 cc min−1. Automatic instrumental background checks, each lasting 24 h, are also performed every 3 months to keep track of long-lived 210Pb accumulation on the detectors' second filter (which should be changed every 5 years). Based on a calibration source uncertainty of 4 %, coefficient of variability of valid monthly calibrations of 2 %–6 %, and counting uncertainty of around 2 % for radon concentrations ≥1 Bq m−3, the total measurement uncertainty of 1500 L ANSTO radon detectors is typically between 8 % and 12 % (k=2). The ANSTO monitors have low maintenance requirements, but due to their dimensions (2.5–3 m long) it can be challenging to install them at stations with space restrictions. As an alternative to the 1500 L detectors, a 700 L model is also available, which is more portable and has a LD of 0.04–0.05 Bq m−3. The combination of detector volume, operating flow rate, and radon decay chain results in ANSTO monitors having a response time of ∼45 min, which can be corrected for in post-processing (Griffiths et al., 2016).
Two ANSTO monitors were used during this study. As explained later in the text these monitors are permanently running at SAC and ODM stations. No calibration source was available when the ANSTO monitor was installed at the ODM site, so calibration and background information derived prior to transport have been used.
Electrostatic deposition monitor
The atmospheric radon monitor (ARMON) used in this experiment was designed and built at the Institut de Tècniques Energètiques (INTE) of the UPC. The ARMON is a portable instrument based on the electrostatic deposition method, consisting of alpha spectrometry of positive ions of 218Po electrostatically collected on a detector (Hopke, 1989; Pereira and da Silva, 1989; Tositti et al., 2002). The ARMON is described in detail in Grossi et al. (2012).
Sampled air with a flow rate between 1 and 2 L min−1 is first filtered to remove ambient 222Rn and 220Rn progeny and then pumped through a ∼20 L spherical detection volume uniformly covered internally with silver. Within this volume the newly formed 222Rn and 220Rn progeny, i.e., positive 218Po and 216Po ions, respectively, are electrostatically collected on a passivated implanted planar silicon (PIPS) detector surface by an electrostatic field inside the spherical volume. An 8 kV potential is applied between the PIPS detector base and the sphere walls. As for the ANSTO detector, the sensitivity of this instrument type depends on the detector volume. The design of the monitor employed in this study has a LD of about 0.07 Bq m−3 in agreement with the definition given above. Grossi et al. (2012) reported a minimum detection limit for this instrument of around 0.2 Bq m−3 in agreement with the definition of Gilmore (2008). The measurement efficiency of the electrodeposition method is reduced due to neutralization of the positive 218Po in recombination with OH− ions in the sampled air (Hopke, 1989). Consequently, it is necessary to dry the sampled air as much as possible before it enters the detection volume. To this end, a dew point of ∘C was maintained at both intercomparison sites using a cryocooler, consisting of a vessel tube where sampling air was passing through before reaching the radon monitor (Grossi et al., 2018).
Each ARMON is calibrated at the INTE-UPC 222Rn chamber (Vargas et al., 2004) under different 222Rn and relative humidity conditions (Grossi et al., 2012). The radon chamber of the INTE-UPC is a 20 m3 installation, which allows control of the exhalation rate (0–256 Bq min−1) and the ventilation air flow rate (0–100 L min−1). The 222Rn source is a dry powder material containing 2100 kBq 226Ra activity enclosed in the source container (RN-1025 model manufactured by Pylon Electronics). The calibration factor Fcal of the ARMON used in this study was 0.39 counts per minute (cpm) per becquerel per cubic meter with an uncertainty of 10 % (k=2). The correction factor for the humidity influence inside the sphere was per part per million H2O (ppm) with a maximum uncertainty of 10 % (k=2). The total uncertainty of the atmospheric radon activity concentration measured by the ARMON is about 20 % (k=2) for atmospheric 222Rn levels in the range of a few hundred becquerels per cubic meter but could increase up to 30 %–35 % (k=2) when atmospheric 222Rn levels decrease to a few becquerels per cubic meter due to the increase in the error of the alpha counts. The total uncertainty includes the calibration factor Fcal, the background due to the presence of 212Po from 220Rn, the net 218Po counts, and the humidity correction factor (Grossi et al., 2012; Vargas et al., 2015). Every 1–2 years the progeny filter at the ARMON inlet should be changed. The detection volume of the ARMON is safely isolated because it is located within an external wooden cube of 0.18 m3.
2.1.2 Indirect methods
One-filter monitors
One-filter detectors measure the decay rates of aerosol-bound 222Rn progeny directly accumulated by air filtration (Schmithüsen et al., 2017). The 222Rn activity concentration is then calculated assuming a constant disequilibrium factor (Feq) for a given site and sampling height between 222Rn and the measured progeny in the sampled air.
In the present study two monitors based on this method were used. One, named HRM here, was developed at the Institute of Environmental Physics of Heidelberg University, Germany, and is described in detail by Levin et al. (2002). Rosenfeld (2010) describe the most recent version of this monitor for which the electronics, data acquisition, and evaluation hardware and software were modernized. The HRM measurement is based on α spectrometry of 222Rn daughters attached to atmospheric aerosols collected on a static quartz fiber filter (QMA ∅ 47 mm) using a surface barrier detector (Canberra CAM 900 mm2 active surface). The LD of the HRM is about 0.07 Bq m−3 at a flow rate of about 20 L min−1 with an uncertainty smaller than 15 % (k=2) for atmospheric 222Rn levels above 2 Bq m−3. This includes the uncertainty of the line loss correction (see below). Since one-filter detectors have no need for any delay chambers but use only a compact filter holder with an integrated detector and pre-amplifier, the HRM is a small instrument with high portability. Regarding maintenance requirements, the quartz fiber filter should be changed monthly.
During the measurement campaign carried out at the Saclay station, where air samples were collected via a 100 m Decabon tubing (see below), the line loss correction of Levin et al. (2017) was applied to all data of the HRM. No loss of aerosol was assumed in the short tubing used at Orme de Mérisiers station. Here we report 214Po activity concentrations for both sites. However, for the 100 m intake height at Saclay we would not expect any disequilibrium, meaning that, based on the results from Schmithüsen et al. (2017), the reported 214Po activity concentrations directly correspond to 222Rn activity concentrations. By contrast, for the 2 m intake height at ODM we expect a 214Po∕222Rn disequilibrium of about 0.85 to 0.9.
The second type of one-filter monitor participating in this study was built at the Laboratoire des Sciences du Climat et de l'Environnement, LSCE, France (Polian, 1986; Biraud, 2000; Schmithüsen et al., 2017). Within this paper this monitor will be called the LSCE monitor. This monitor uses a moving filter band system, which allows the determination of atmospheric 222Rn activity concentration based on measurements of its progeny 218Po and 214Po. Attached 222Rn progeny are collected on a cellulose filter (Pöllman–Schneider) over a 1 h period at a flow rate of 160 L min−1 and after this aerosol sampling period, the loaded filter is moved to the α spectrometry for a 1 h measurement period by a scintillator from Harshaw Company Co. and photomultiplier from EMI Electronics Ltd. (Biraud, 2000). The LD is about 0.01 Bq m−3 with an uncertainty of about 20 %.
Regarding maintenance on a regular basis, the LSCE monitor's filter roll has to be changed every 3 weeks. Automatic detector background is performed every 3 weeks, and counting efficiency is manually tested with an americium source. The instrument is designed to measure radioactive aerosols a few meters above the ground level. An inlet filter is installed to block black carbon or dirt deposition when the instrument is installed in urban areas as the flow rate drops below 9 m3 h−1. The instrument is about 25 cm high, 40 cm long, and 25 cm deep, and it can be easily deployed at a station.
2.2 Sites
The present intercomparison study was carried out at two stations located 30 km southwest of Paris in the fall and winter of 2016–2017 (Fig. 1). Both stations, 3.5 km apart, belong to the LSCE and are located in a region with a radon flux of ca. 5–10 mBq m−2 s−1 in winter, according to output of the Karsten et al. (2015) model.

Figure 1The INGOSv2.0 222Rn flux map (Karstens et al., 2015) is shown for a typical winter month (December), with locations of the ODM and SAC sites shown in the inset in (a). The radon sampling inlets are indicated for both ODM (b) and SAC (c) by the black arrows.
Phase I of the measurements started at Orme des Mérisiers (ODM, latitude 48.698, longitude 2.146, 167 m above sea level) and ran between 25 November 2016 and 23 January 2017. Here, LSCE and ANSTO (for convenience named ANSTO_ODM here) monitors are routinely running. During Phase I of the intercomparison exercise these two monitors were operated in parallel with a HRM and an ARMON. The sampling height for all radon detectors at ODM was 2 m a.g.l.
Phase II of the exercise was realized at Saclay (SAC, latitude 48.730, longitude 2.180; Fig. 1) between 25 January and 13 February 2017. At this location the sampling inlet height was at 100 m a.g.l. At SAC station another ANSTO monitor (from now on labeled ANSTO_SAC) was already running. In addition, during Phase II this detector was running in parallel with the portable ARMON and HRM detectors. The LSCE monitor did not participate in Phase II of the experiment.
Meteorological parameters were also available at both stations during the intercomparison periods at heights corresponding to the radon measurements (2 and 100 m a.g.l.). In the case of the ODM site, atmospheric aerosol concentrations were also measured for this period.
2.3 Environmental parameters and atmospheric aerosol concentration
Meteorological data used within this study were available from continuous measurements carried out at the SAC and ODM stations at 100 m and at 10 m a.g.l., respectively. The measurements were performed with a Vaisala weather transmitter WXT520 (Campbell Scientific) for (1) wind speed and direction (accuracies of ±3 % and ±3 ∘C, respectively) and (2) humidity and temperature (accuracies of ±3 % and ±0.3 ∘C, respectively). In addition, the atmospheric aerosol concentration was measured at the ODM site using a fine dust measurement device Fidas® 200 S (Palas) at 10 m a.g.l. The measurement range is between 0 and 20 000 particles cm−3. All the accuracies refer to the manufacturer's specifications.
2.4 Data analysis
2.4.1 Correlation factors between monitors
To study the correlation between responses of the different detectors, linear regression models were calculated using hourly atmospheric radon activity concentrations from each monitor. The linear regression fits were calculated following Krystek and Anton (2007), relative to the two portable detectors, ARMON and HRM, because they both were measuring at SAC and at ODM.
2.4.2 Analysis of the influence of the environmental and meteorological parameters on detector response
The present study intended to build upon the findings of Xia et al. (2010) and Schmithüsen et al. (2017) regarding the possible influence of meteorological conditions on the response of radon and radon progeny monitors.
With this in mind, the ratio between hourly atmospheric 222Rn activity concentrations measured and/or obtained by the HRM, LSCE, and ANSTO monitors and that measured by the ARMON were calculated, and their variability was analyzed in relation to hourly atmospheric temperature, relative humidity, and atmospheric aerosol concentration measured at ODM and at SAC. Not enough rain data were available to be used in this study. For this part of the study, the ARMON was used as a reference since it was the only direct radon monitor running at both sites.
Hourly time series of atmospheric 222Rn, in the case of the ARMON and ANSTO monitors, and 222Rn progeny (214Po activity concentration) for the HRM and LSCE monitors, measured at ODM and SAC during Phase I and Phase II of the intercomparison experiment, are presented in Figs. 2 and 3, respectively. In each of the previous figures, a zoom plot has also been reported as an example of the response of each monitor to the sub-diurnal atmospheric radon variability. As shown, all monitors running at both sites follow this variability, with 222Rn and 222Rn progeny data measured or estimated by the three different measurement techniques showing the same general patterns. Table 2 summarizes the mean, minimum, and maximum hourly atmospheric radon or radon progeny activity concentrations measured by each monitor for both campaigns. For further information, Figs. S1 and S2 in the Supplement show the time series of the differences (absolute) and of the ratios (relative) between the hourly 214Po or 222Rn activity concentrations measured by HRM, LSCE, and ANSTO monitors and those measured by the ARMON.
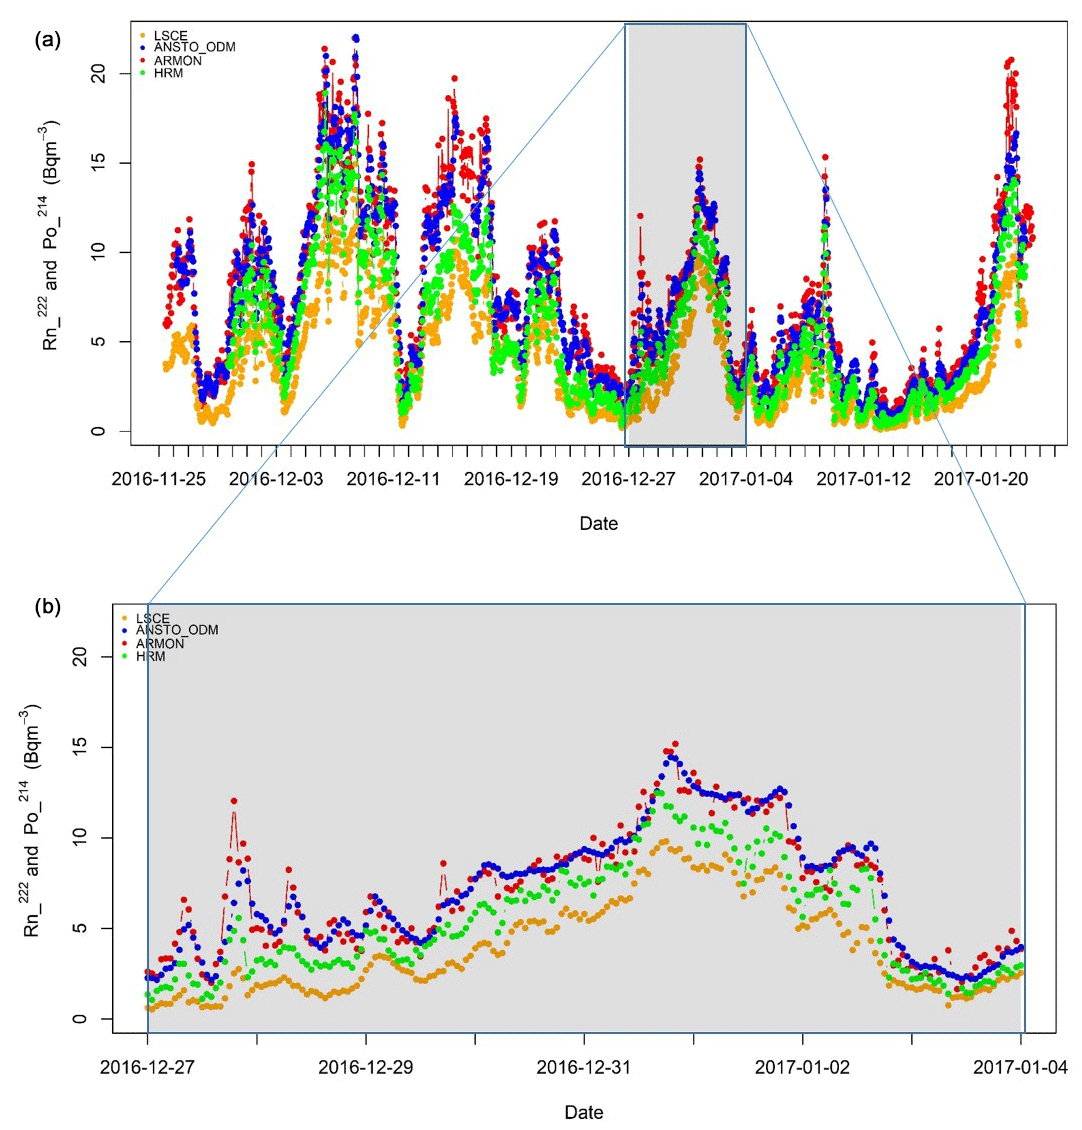
Figure 2(a) Hourly time series of the atmospheric 222Rn and, in the case of LSCE and HRM data, 214Po activity concentration, measured at the Orme de Mérisiers (ODM) station during Phase I (between 25 November 2016 and 23 January 2017) by the ARMON (red circles), ANSTO_ODM (blue circles), HRM (green circles), and LSCE (orange circles) monitors. (b) Hourly time series of the atmospheric 222Rn and 214Po measured between 27 December 2016 and 4 January 2017.

Figure 3(a) Hourly time series of the atmospheric 222Rn and 214Po (HRM) activity concentration measured at the Saclay (SAC) station between 25 January and 13 February 2017 by the ARMON (red circles), ANSTO_SAC (blue circles), and HRM (green circles) monitors. (b) Hourly time series of the atmospheric 222Rn and 214Po measured between 7 and 13 February 2017.
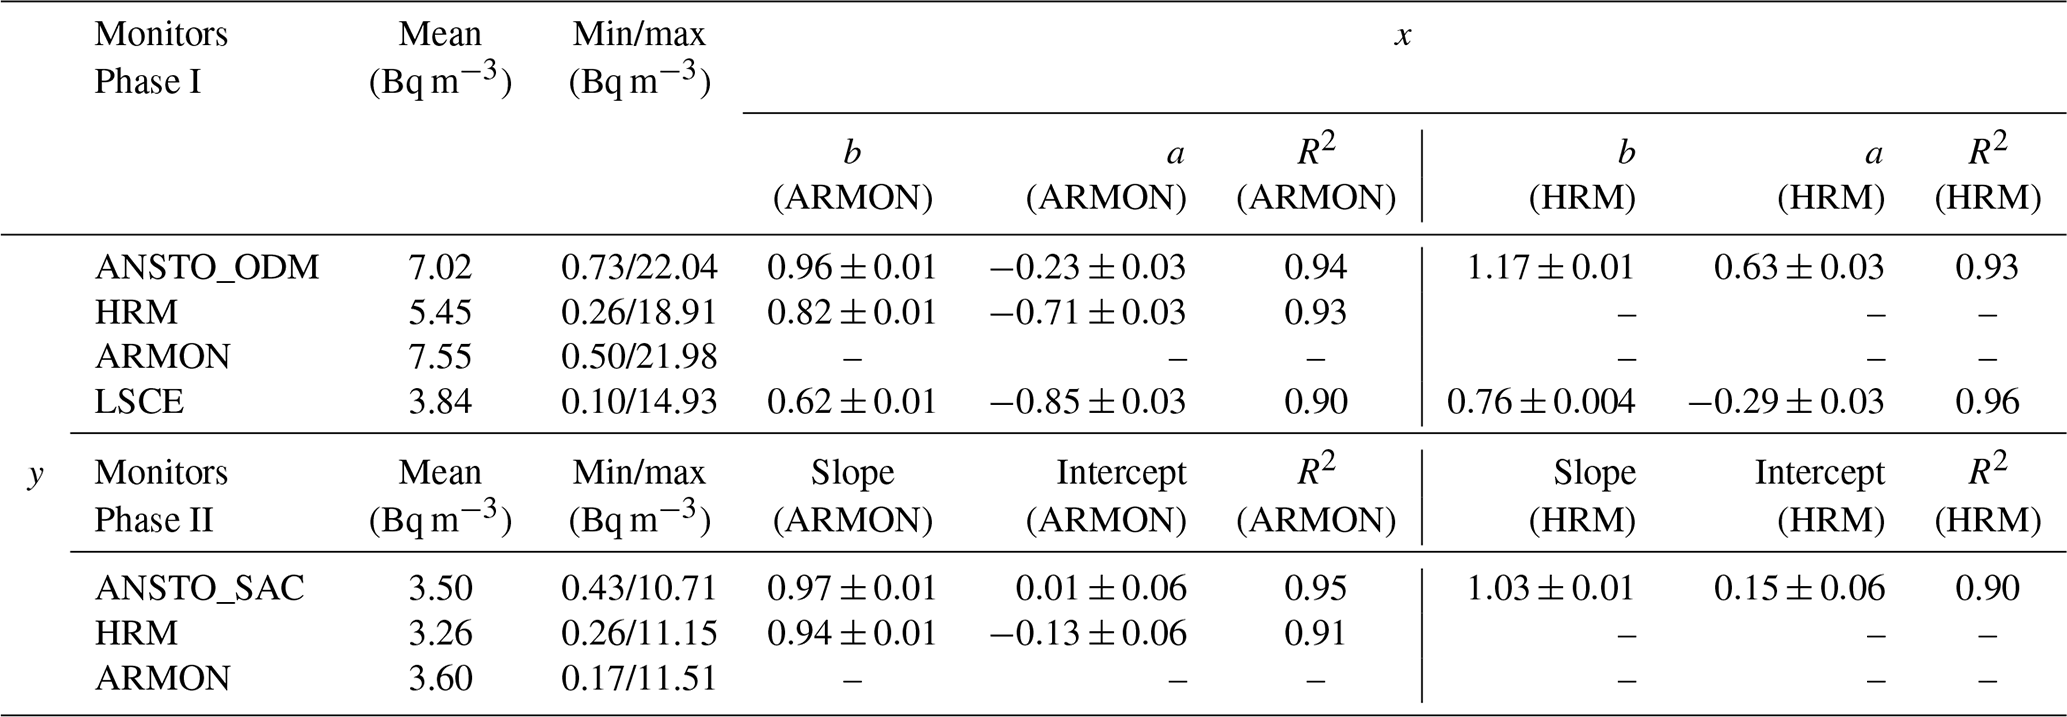
Table 2The means, maxima, and minima of the atmospheric 222Rn and 214Po activity concentration observed by each monitor participating in Phases I and II of the intercomparison campaigns. The slopes (b) and intercepts (a) of the linear regression fits calculated between the hourly atmospheric 222Rn and 214Po activity concentrations measured by the ARMON and/or the HRM and the other 222Rn and 222Rn progeny monitors deployed in both phases are also reported.
3.1 Phase I: ODM site
During Phase I the LSCE, HRM, ARMON, and ANSTO_ODM monitors were operating in parallel, sampling air from the same height (2 m a.g.l.). The mean temperature over Phase I of the campaign was 2.9 ∘C with an interquartile range of 0.10 to 5.8 ∘C. The mean relative humidity was 80 % with an interquartile range of 73 % to 89 %. An average accumulated rain per day of 13 mm was recorded. The main wind patterns during Phase I were from the northeast and southwest, with speeds typically between 1 and 7 m s−1. The mean atmospheric aerosol concentration observed at ODM during Phase I was 505 particles cm−3 with an interquartile range of 233 to 660 cm−3.
The means of the atmospheric 222Rn activity concentration measured by the ARMON and the ANSTO_ODM are in the same order (Table 2). The means of the atmospheric 214Po activity concentrations measured by the LSCE monitor were ca. 50 % lower and ca. 30 % lower by the HRM than the atmospheric 222Rn activity concentration.
Table 2 shows the slopes (b) and intercepts (a) of the linear regression fits calculated between the hourly atmospheric 222Rn and 214Po activity concentrations measured by the ARMON and/or the HRM and the other 222Rn and 222Rn progeny monitors deployed in Phase I. The calculated slopes were in the range of 0.62 to 1.17, and the R2 values varied between 0.90 and 0.96. The slope closest to unity was calculated between the ARMON and ANSTO_ODM monitors and was 0.96±0.01, while the lowest slope was observed between the ARMON and LSCE monitors and was 0.62±0.01. The highest correlation (R2=0.96) was found between the HRM and LSCE monitors. The plots of the linear regression fits of Phase I are shown in the left panels of Figs. S3, S4, and S5. Notably, the offset (a value) of the regression between the ANSTO and ARMON detectors at ODM is considerably greater than that at SAC. The regression slopes are also slightly different. These differences are likely related to the limited calibration and background information available for the ANSTO_ODM detector for this intercomparison project. In particular, a substantial component of the instrumental background signal is site specific. This is likely responsible for much of the change in offset value.
3.2 Phase II: SAC station
Phase II lasted 18 d. The mean temperature during this period was 5 ∘C with an interquartile range of 2 to 8 ∘C. The mean relative humidity was 86 % with an interquartile range of 80 % to 94 %. An average accumulated rain per day of 3 mm was recorded. The main wind patterns during this phase at 100 m a.g.l. were from the south and southwest with speeds typically between 3 and 10 m s−1.
Figure 3 shows the hourly atmospheric 222Rn and 214Po activity concentrations observed at SAC during Phase II by the ARMON, HRM, and ANSTO_SAC instruments.
Table 2 reports the means, minima, and maxima of the atmospheric data measured during Phase II by all participating monitors. In this case, the mean atmospheric 222Rn and 214Po activity concentrations measured by all monitors agreed within the instrumental errors. At 100 m a.g.l. the slopes of the hourly fits of the monitor's response in this case were all close to unity. The calculated offsets also decreased at 100 m a.g.l. relative to 2 m a.g.l. The plots of the linear regression fits of Phase II are shown in the right panel of Figs. S5 and S6. During the period of 30 January to 1 February 2019, the HRM shows significantly lower values than ANSTO and ARMON. This period coincides with saturated air humidity conditions.
Figure S7 presents two plots to summarize the results of the slopes and offsets calculated at both ODM and SAC stations relative to the ARMON.
Figures 2 and 3 show a larger hourly variability of the HRM and ARMON signals compared with the ANSTO ones. This difference in variability is likely due to a larger uncertainty of the HRM and ARMON detectors for atmospheric 222Rn levels of around 1 Bq m−3. In addition, it has to be taken into account that only an approximated form of the Griffiths et al. (2016) response time correction could be applied to the output of the ANSTO detectors. Further investigations should be carried out to clarify these differences and to exactly quantify the detectors' uncertainties for the low 222Rn concentrations typical for outdoor environmental monitoring at or above 100 m a.g.l.
3.3 Comparison with past studies
The results obtained in the present study of the slopes (b) and of the offsets (a) of the regression lines calculated between ANSTO or LSCE monitors against the HRM are here compared with the ones presented by Schmithüsen et al. (2017). Table 3 shows a summary of this comparison. All slopes (correction factors) are defined as (routine station monitor) divided by HRM because this last was used as the reference instrument by Schmithüsen et al. (2017).
Table 3Offsets and slopes of the regression lines calculated between ANSTO or LSCE monitors against the HRM in the present study and by Schmithüsen et al. (2017).
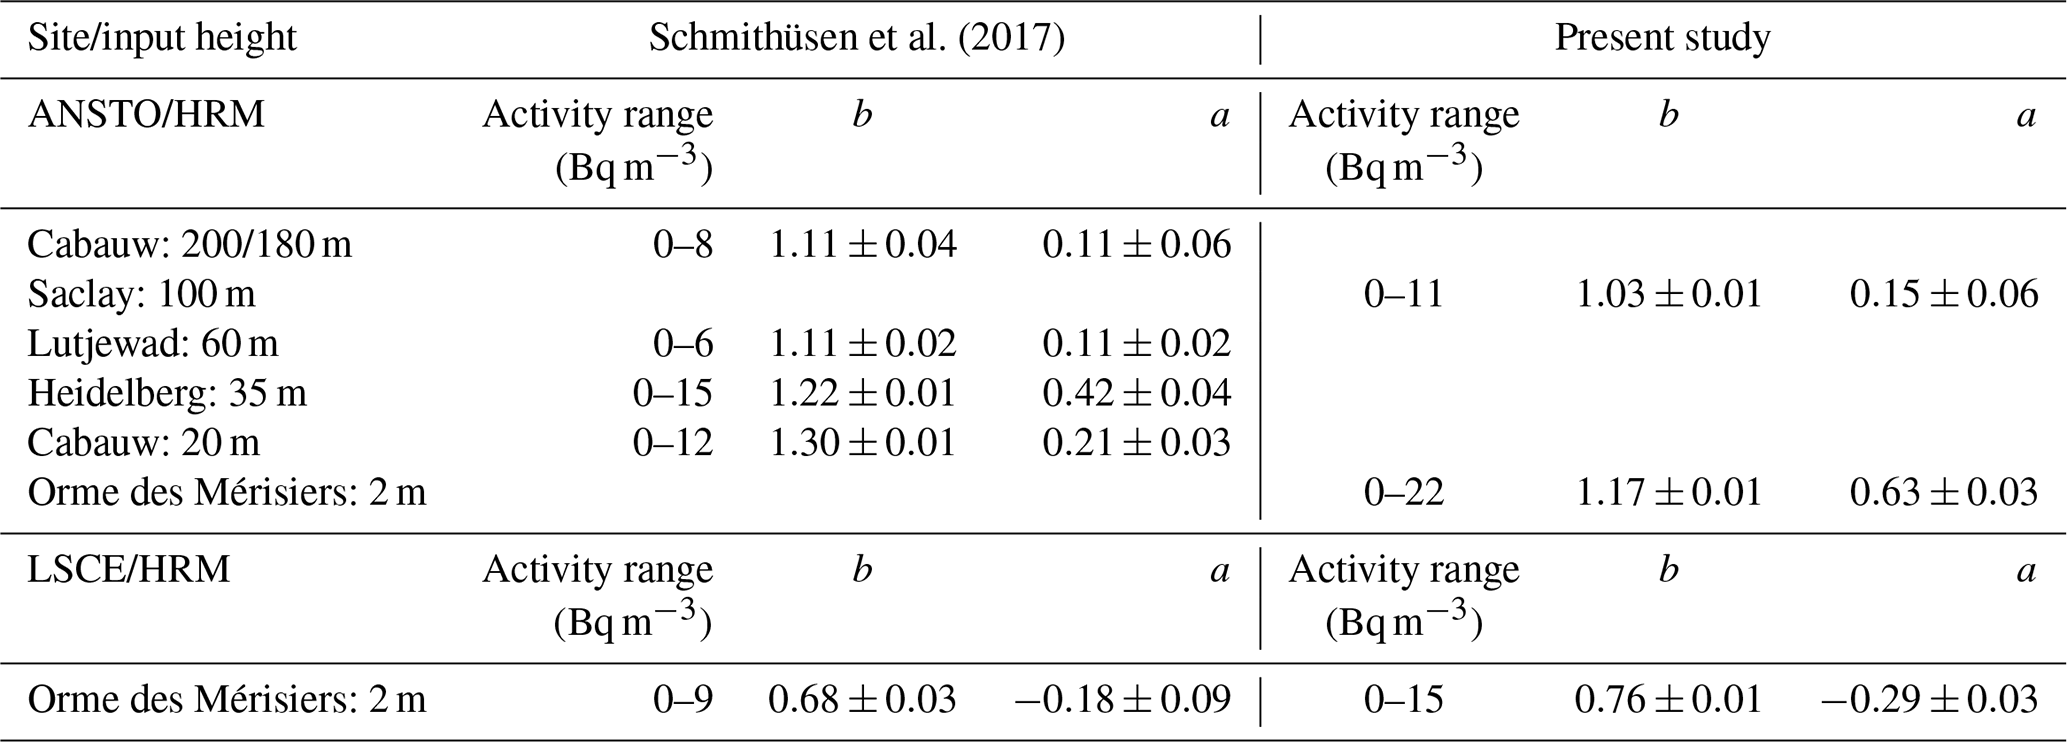
Data in Table 3 need to be analyzed taking into account that a unique traceability chain is not yet available for atmospheric radon measurements and the different monitors routinely running at the different stations could have different calibration chains (e.g., radon source, primary standard). Generally speaking, for both studies, it can be observed that the correction factor between the atmospheric 214Po activity concentration measured by HRM and the atmospheric 222Rn activity concentration measured by ANSTO at each station approaches unity with the increase in the height of the sampling input. By contrast, the offsets of the regression fits decrease with the increase in the input height.
The only case where the compared instruments were exactly the same and at the same height is for the Orme des Mérisiers station. Here the slope between the atmospheric 214Po activity concentration measured by LSCE and HRM is equal to 0.76±0.01. This number is slightly larger but within uncertainties comparable to the number reported by Schmithüsen et al. (2017) of 0.68±0.03 (see Table 3).
3.4 Influence of the weather conditions on the ratio between 214Po and 222Rn measurements
Figure 4 shows the variability of the ratio between hourly atmospheric 214Po and/or 222Rn activity concentration measured by each monitor relative to those measured by the ARMON versus the hourly means of ambient temperature and relative humidity. Analysis was carried out at ODM (Fig. 4a, b) and at SAC (Fig. 4c, d) versus ambient temperature (Fig. 4, left panels) and relative humidity (Fig. 4b, d) measured at the corresponding stations.
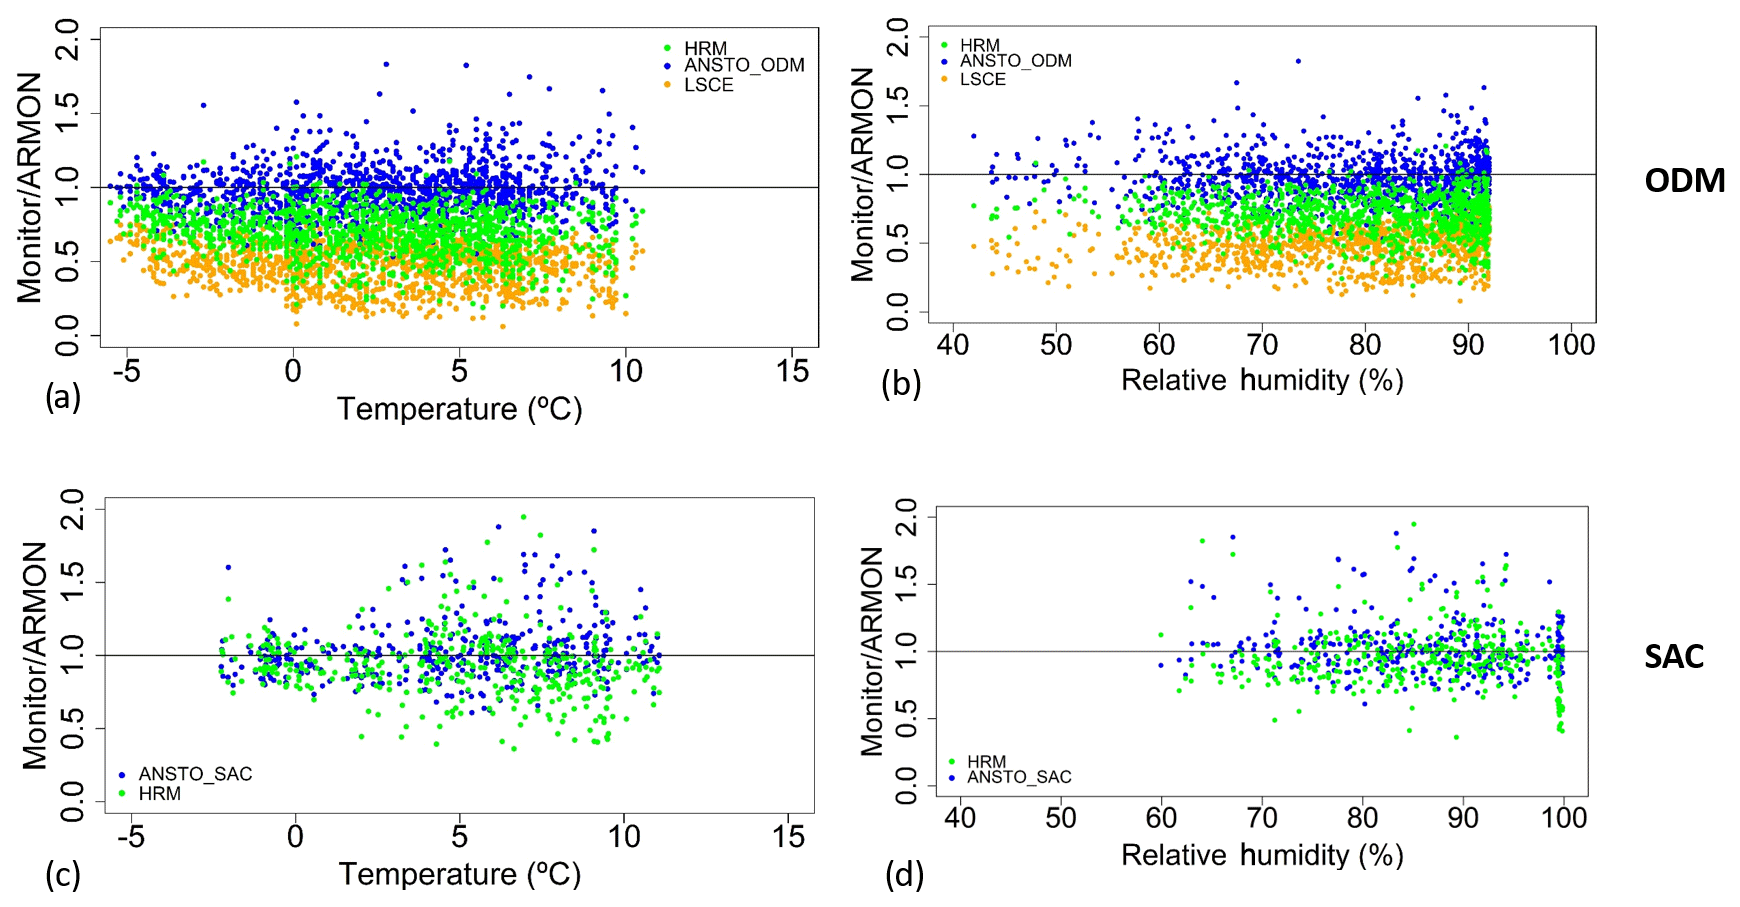
Figure 4Hourly atmospheric 222Rn or 214Po activity concentration obtained by the HRM, LSCE, and ANSTO monitors divided by the 222Rn activity concentration measured by the ARMON detector as a function of the hourly measured atmospheric temperature and relative humidity at ODM (a, b) and at SAC (c, d).
Figure 5 shows the same variability plotted in relation to the ANSTO_ODM at ODM (Fig. 5a, b) and to the ANSTO_SAC at SAC (Fig. 5c, d) versus the hourly means of ambient temperature (Fig. 5a, c) and relative humidity (Fig. 5b, d).
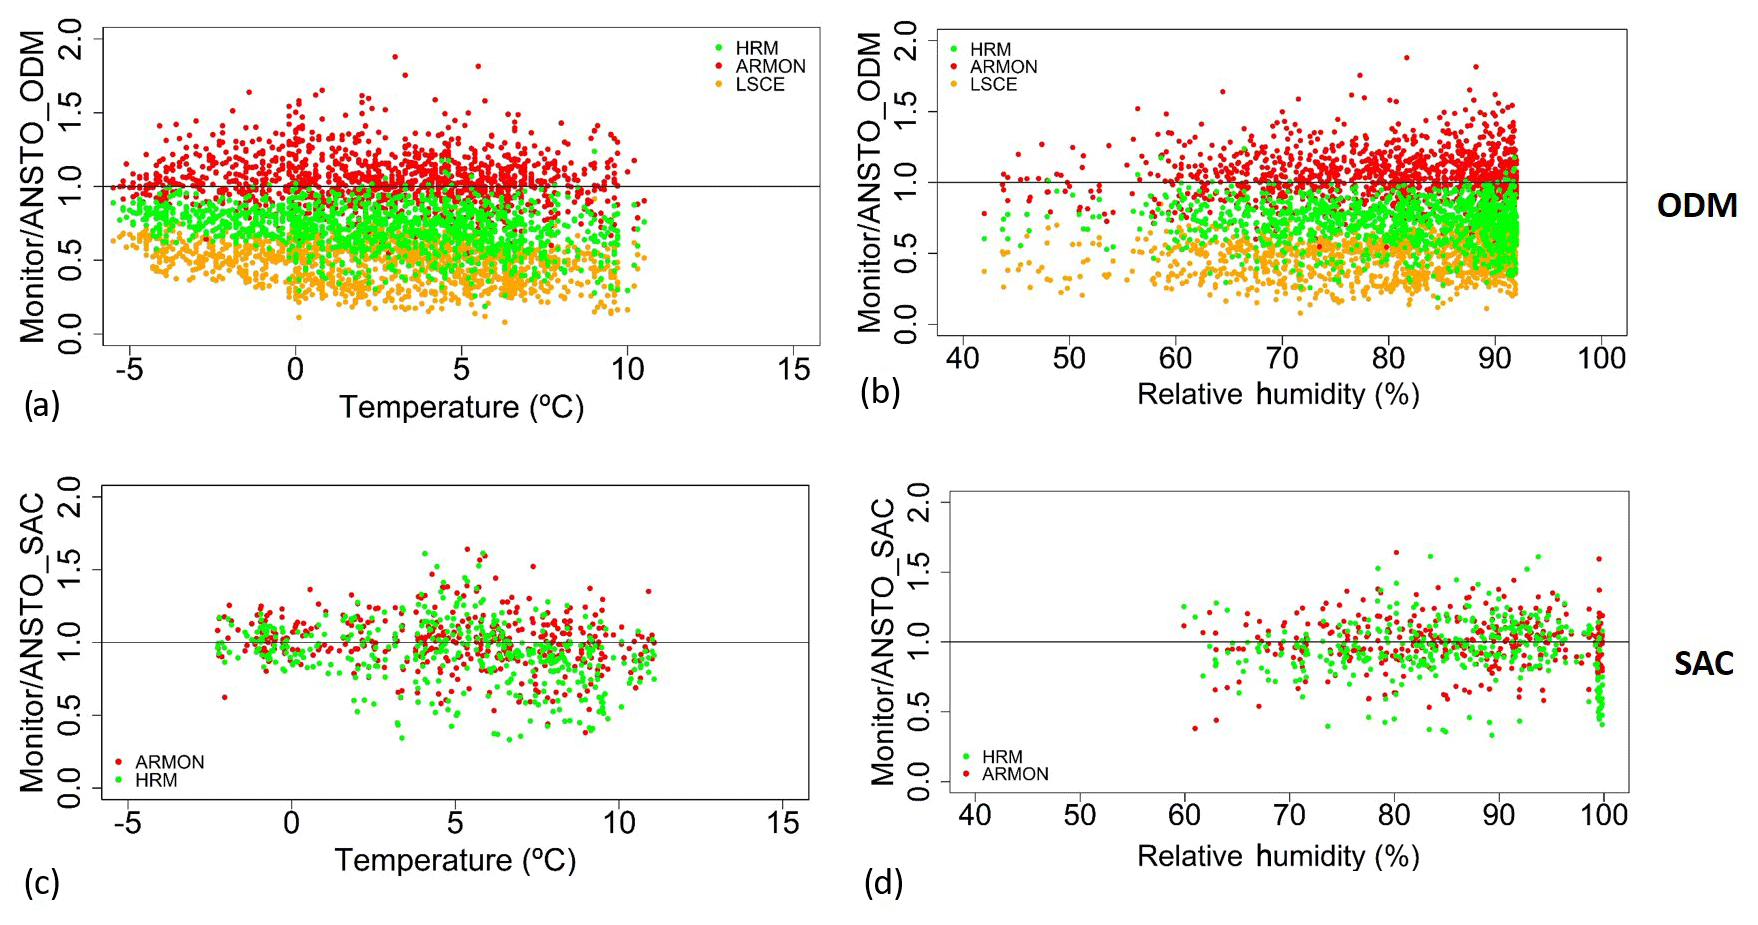
Figure 5Hourly atmospheric 222Rn or 214Po activity concentration obtained by ARMON, HRM, and LSCE monitors divided by the 222Rn activity concentration measured by the ANSTO detectors as a function of the hourly measured atmospheric temperature and relative humidity at ODM (a, b) and at SAC (c, d).
Data do not show any evident patterns at 100 m a.g.l. (SAC station), which could indicate that there is not any impact on 222Rn or 222Rn progeny measurements due to change in ambient temperature and relative humidity, at least not until saturated conditions are achieved. By contrast, a small decrease, of about 10−2 ∘C−1, is observed in the ratio between the 214Po activity concentration (measured by the HRM and LSCE monitors) and the 222Rn activity concentration (measured by the ANSTO_ODM and ARMON monitors) with the increase in the ambient temperature (Fig. S8) at 2 m a.g.l. (ODM station). This temperature dependency may be rather due to the effect of atmospheric activity concentrations, increasing during nighttime, on the disequilibrium between radon and its progeny. However, this influence on measured 214Po∕222Rn ratios is really small compared with other observed effects (e.g., loss of progeny within the sample tube (Levin et al., 2017) or atmospheric aerosol concentration; see below). Looking at Fig. 5, there appears to be less scatter in the point clouds (particularly at SAC) when the ANSTO_SAC monitor is used as the reference, likely attributable to the lower measurement uncertainty of the ANSTO monitor used at this station.
In Fig. 6 the ratio of the hourly atmospheric 222Rn or 222Rn progeny activity concentration measured by the HRM (214Po in Fig. 6a), the LSCE (214Po in Fig. 6b), and the ANSTO_ODM (222Rn in Fig. 6c) monitors and the 222Rn activity concentration measured with ARMON (222Rn) are plotted against the logarithm of the hourly aerosol concentration data. Data indicate the existence of a linear relationship between these variables, i.e., of the form
Here 222Rn(Monitor_i) is the hourly atmospheric 222Rn or 214Po activity concentration measured by individual monitors HRM (214Po), LSCE (214Po), and ANSTO_ODM (222Rn); 222Rn (ARMON) is the one measured by the ARMON monitor; and aerosol conc. is the hourly atmospheric aerosol concentration measured at ODM during Phase I. The results of the linear regression fits are reported in Table 4. The slope of the ratio between the ANSTO_ODM and ARMON monitors in relation to the variability of the logarithm of the hourly atmospheric aerosol concentration is close to zero, and the intercept is close to 1. The ratio between the hourly atmospheric aerosol-bound radon progeny data measured by the two one-filter radon progeny monitors and the one measured by the ARMON seems to decrease with decreasing aerosol concentration (Fig. 6a and b). However, this effect only becomes evident when atmospheric aerosol concentration is lower than 300 particles cm−3.
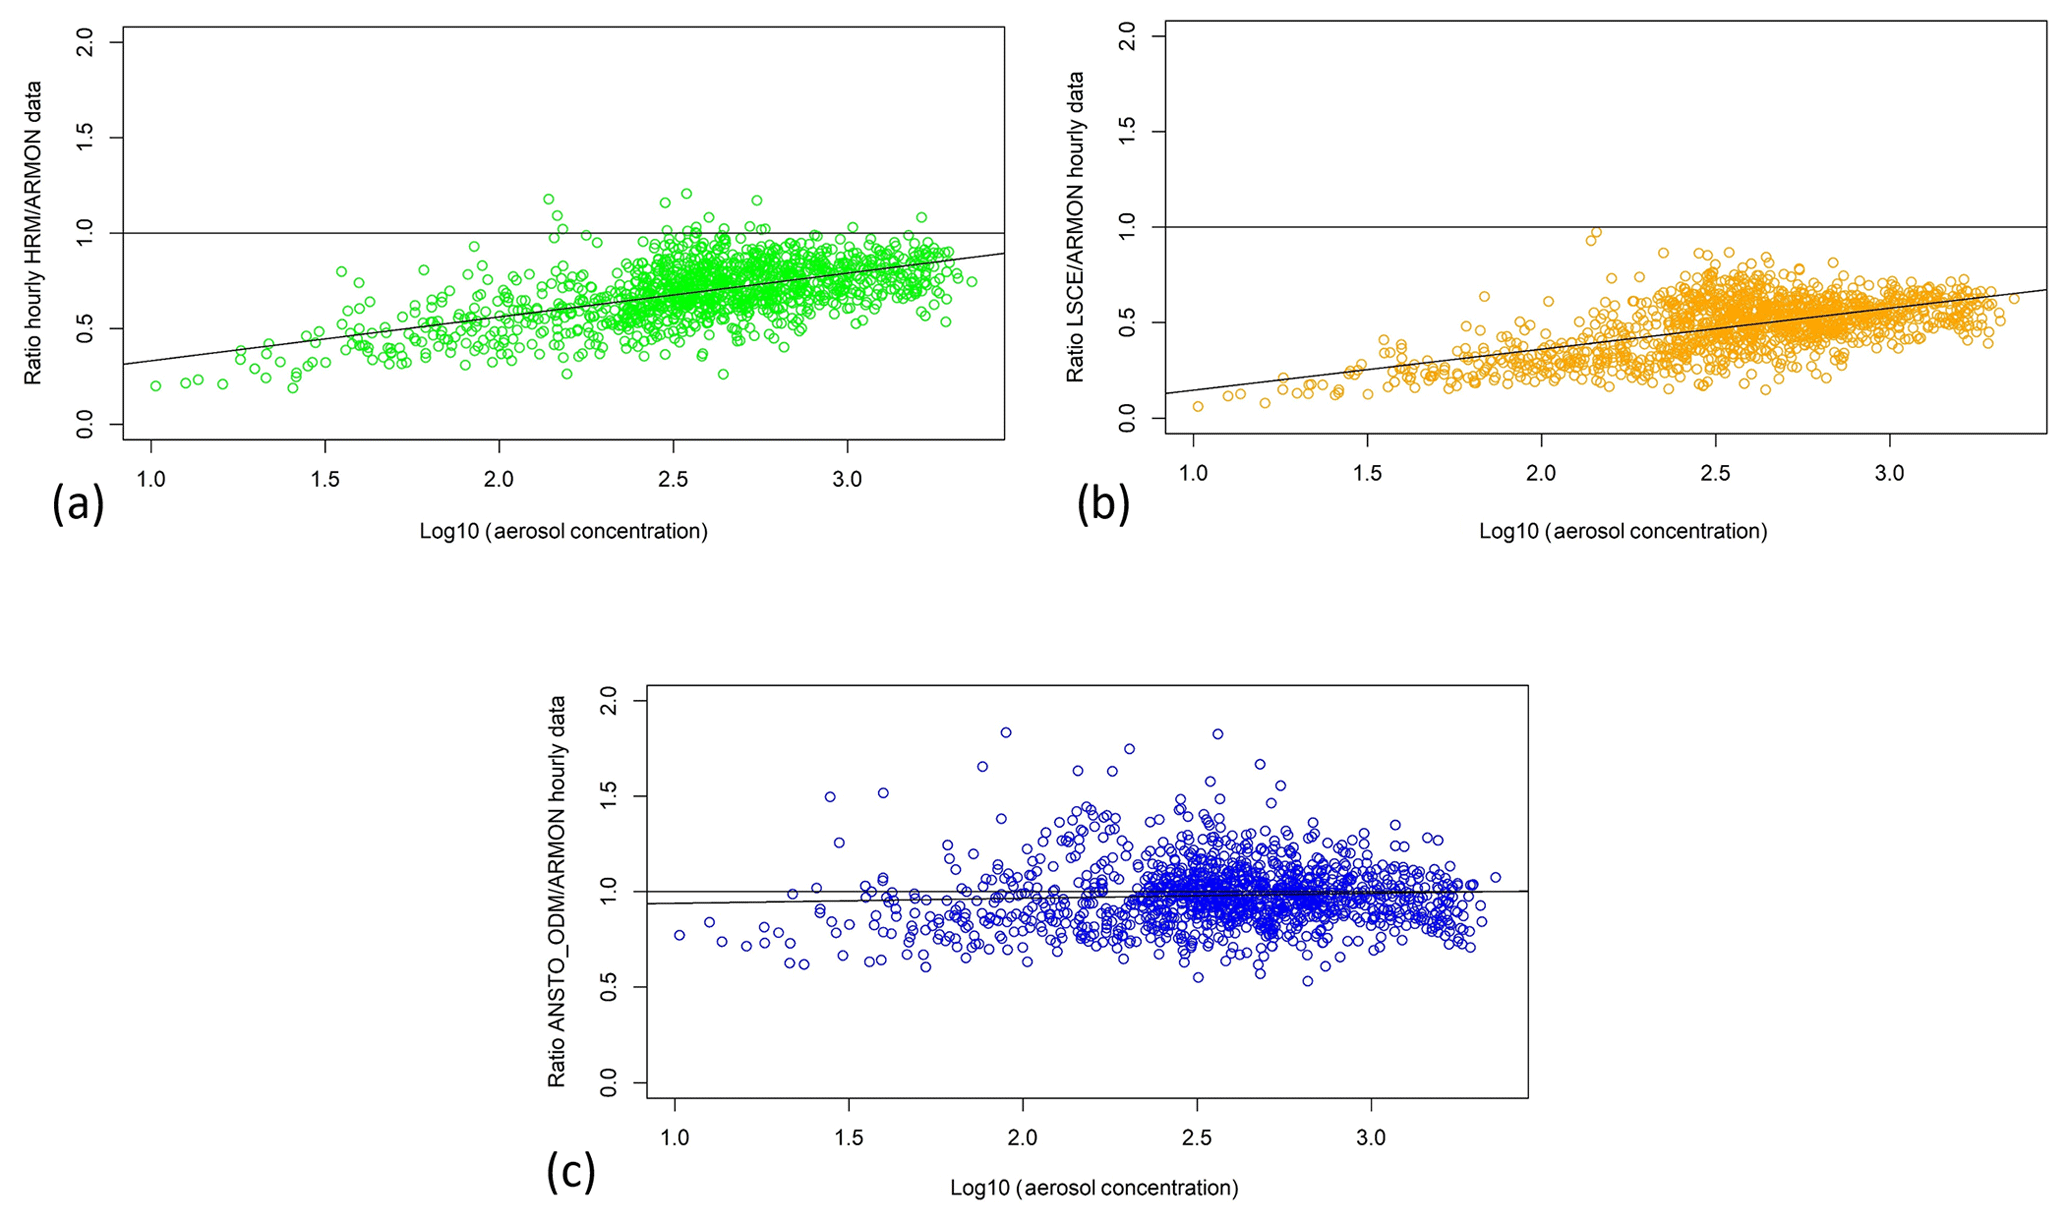
Figure 6Ratio of the atmospheric 222Rn or 214Po activity concentration measured by the HRM (green dots), LSCE (orange dots), and ANSTO_ODM (blue dots) monitors and those measured by the reference ARMON monitor against the logarithm of the atmospheric aerosol concentration measured at the ODM station.
Table 4Intercepts and slopes of the linear regression fits of the Eq. (1).

In order to confirm and build upon the results obtained by Xia et al. (2010), Grossi et al. (2016), and Schmithüsen et al. (2017), a 3-month intercomparison campaign was carried out in the south of Paris, France, in the fall–winter period of 2016–2017. For the first time, three fundamentally distinct radon and radon progeny measurement approaches were compared side by side at two measurement heights, 2 and 100 m a.g.l., under a range of environmental conditions with the aim to compare their responses.
The results of this study show that 222Rn and 222Rn progeny measurements follow the same general patterns of diurnal variability, both close to and further up from the surface. The slopes of the linear regression fits between the radon and the radon progeny measurements, which represent the calibration factors, are not significantly different from one at 100 m height above ground (SAC), but they differ at the 2 m level (ODM). The latter is attributable to the disequilibrium known to exist between 222Rn freshly emitted from the ground and its short-lived progeny in the lowest tens of meters of the atmosphere, the magnitude of which is known to decrease with distance from the surface, as shown in earlier work, and to be close to 1 at a height of 100 m and above (e.g., Jacobi and André, 1963; Schmithüsen et al., 2017).
For the 2 m level, we found a significant correlation of radon progeny activity concentrations between LSCE and HRM measurements (see Fig. S3). The slope, however, is only equal to 0.76±0.01. This result is comparable, considering its uncertainties, with the result reported by Schmithüsen et al. (2017) of 0.68±0.03 (see Table 3) based on the comparison of the same two monitors (HRM and LSCE) and at the same station (ODM) in March and April 2014.
Observations of the total atmospheric aerosol concentration available at the ODM station during the first 2 months of the experiment were used to investigate the influence of changing atmospheric aerosol concentrations on the response of the radon and radon progeny measurements. Under very low atmospheric aerosol loading (<300 particles cm−3), the 222Rn progeny monitors seem to underestimate the atmospheric 214Po activity concentrations by up to 50 %. This effect may be attributable to loss of unattached 218Po and 214Po. Particle number concentrations below 300 particles cm−3 at continental stations are, however, very rare, and even during winter at Alpine stations like Schneefernerhaus such low particle concentrations are only occasionally observed (Birmili et al., 2009).
The comparison of results obtained in the present study with those reported in Schmithüsen et al. (2017) demonstrate that in order to harmonize atmospheric 222Rn activity concentrations measured at different atmospheric networks it will be important to (i) have a well-established metrological chain; (ii) have traceable methods for measuring low-level atmospheric radon activity concentrations; (iii) harmonize the calculation of total uncertainty in atmospheric 222Rn concentrations measured by all monitors when ambient radon is only a few becquerels per cubic meter or less and (iv) use a direct radon monitor as a mobile reference instrument, the response of which is not influenced by meteorological conditions or inlet tube dimensions and length.
Finally, the new portable ARMON seems to have a great potential for being used at atmospheric radon stations with space restrictions. It could also be useful as a mobile reference instrument to calibrate 222Rn progeny instruments or fixed radon monitors. However, the total expanded uncertainty of the ARMON could increase for really low radon activity concentrations (<1 Bq m−3) and when atmospheric 220Rn is also present. This should be better investigated in the near future. The uncertainties related to the ANSTO detector response time correction when characteristics of the entire intake system have not been directly measured should also be investigated.
The raw data and the R codes used for this study are available at https://www.dropbox.com/sh/xokyu4vnt6f0gme/AABt-DxnTBbe6FFT9p4WDZWda?dl=0 (last access: 23 April 2020, Grossi, 2020).
The supplement related to this article is available online at: https://doi.org/10.5194/amt-13-2241-2020-supplement.
CG, OL, FRV, VK, MD, RC, JAM, SDC, and AC worked on the installation of the radon and the radon progeny monitors. In addition, they were in charge of the maintenance of the in situ and remote radon and radon progeny measurements during the 3 months of experiment. CG, OL, VK, SDC, SW, AC, and IL worked at the calculation and delivery of the radon and radon progeny time series data. MD and MR worked on the availability of the meteorological and aerosol data covering the intercomparison campaign period.
All authors collaborated on the discussion of the data results and participated in the writing of the current paper.
The authors declare that they have no conflict of interest.
This study was carried out under the umbrella of the Atmospheric Thematic Center (ATC) of ICOS.
The authors warmly thank (i) the INTE team, especially Vicente Blasco and Juan Antonio Romero, for their work in the building of the ARMON used in this study, and (ii) the R project (https://www.r-project.org/, last access: 24 April 2020) free software environment used here for statistical computing and graphics.
This paper is dedicated to Bruno Grossi, Manuel Javier Navarro Angulo, Alfredo Adán, and the whole team of the Instituto Clínic de Oftalmología (ICOF) of the Hospital of Barcelona.
This research has been supported by the Ministerio Español de Economía y Competividad, Retos 2013 (2014–2016) with the MIP (Methane interchange between soil and air over the Iberian Península) project (grant no. CGL2013-46186-R) and the Ministerio Español de Educación, Cultura y Deporte (grant no. CAs15/00042).
This paper was edited by Tim Arnold and reviewed by Susana Barbosa and Grant Forster.
Baskaran, M.: Po-210 and Pb-210 as atmospheric tracers and global atmospheric Pb-210 fallout: a Review, J. Environ. Radioactiv., 102, 500–513, https://doi.org/10.1016/j.jenvrad.2010.10.007, 2011.
Baskaran, M.: Radon: A Tracer for Geological, Geophysical and Geochemical Studies, in: Springer Geochemistry, Springer International Publishing, 260 pp., https://doi.org/10.1007/978-3-319-21329-3, 2016.
Biraud, S.: Vers la régionalisation des puits et sources des composes à effet de serre: analyse de la variabilité synoptique à l'observatoire de Mace Head, Irlande, PhD thesis, University of Paris VII, France, 2000.
Birmili, W., Ries, L., Sohmer, R., Anastou, A., Sonntag, A., Konig, K., and Levin, I.: Fine and ultrafine aerosol particles at the GAW station Schneefernerhaus/Zugspitze, Gefahrst. Reinhalt. L., 69, 31–35, 2009.
Brunke, E.-G. Labuschagne, C. Parker, B. van der Spuy, D., and Whittlestone, W.: Cape Point GAW Station 222Rn detector: factors affecting sensitivity and accuracy, Atmos. Environ., 36, 2257–2262, https://doi.org/10.1016/S1352-2310(02)00196-6, 2002.
Chambers, S. D., Williams, A. G., Zahorowski, W., Griffiths, A., and Crawford, J.: Separating remote fetch and local mixing influences on vertical radon measurements in the lower atmosphere, Tellus B, 63, 843–859, https://doi.org/10.1111/j.1600-0889.2011.00565.x, 2011.
Chambers, S. D., Zahorowski, W., Williams, A. G., Crawford, J., and Griffiths, A. D.: Identifying tropospheric baseline air masses at Mauna Loa Observatory between 2004 and 2010 using Radon-222 and back trajectories, J. Geophys. Res.-Atmos., 118, 992–1004, https://doi.org/10.1029/2012JD018212, 2013.
Chambers, S. D., Hong, S.-B., Williams, A. G., Crawford, J., Griffiths, A. D., and Park, S.-J.: Characterising terrestrial influences on Antarctic air masses using Radon-222 measurements at King George Island, Atmos. Chem. Phys., 14, 9903–9916, https://doi.org/10.5194/acp-14-9903-2014, 2014.
Chambers, S. D., Galeriu, D., Williams, A. G., Melintescu, A., Griffiths, A. D., Crawford, J., Dyer, L., Duma, M., and Zorila, B.: Atmospheric stability effects on potential radiological releases at a nuclear research facility in Romania: Characterising the atmospheric mixing state, J. Environ. Radioactiv., 154, 68–82, https://doi.org/10.1016/j.jenvrad.2016.01.010, 2016.
Chambers, S. D., Preunkert, S., Weller, R., Hong, S.-B., Humphries, R. S., Tositti, L., Angot, H., Legrand, M., Williams, A. G., Griffiths, A. D., Crawford, J., Simmons, J., Choi, T. J., Krummel, P. B., Molloy, S., Loh, Z., Galbally, I., Wilson, S., Magand, O., Sprovieri, F., Pirrone, N., and Dommergue, A.: Characterizing Atmospheric Transport Pathways to Antarctica and the Remote Southern Ocean Using Radon-222, Front. Earth Sci., 6, 190, https://doi.org/10.3389/feart.2018.00190, 2018.
Chambers, S. D., Guérette, E.-A., Monk, K., Griffiths, A. D., Zhang, Y., Duc, H., Cope, M., Emmerson, K. M., Chang, L. T., Silver, J. D., Utembe, S., Crawford, J., Williams, A. G., and Keywood, M.: Skill-testing chemical transport models across contrasting atmospheric mixing states using Radon-222, Atmosphere, 10, 25, https://doi.org/10.3390/atmos10010025, 2019a.
Chambers, S. D., Podstawczyńska, A., Pawlak, W., Fortuniak, K., Williams, A. G., and Griffiths, A. D.: Characterising the state of the urban surface layer using Radon-222, J. Geophys. Res.-Atmos., 124, 770–788, https://doi.org/10.1029/2018JD029507, 2019b.
Frank, G., Salvamoser, J., and Steinkopf, T.: Messung radioaktiver Spurenstoffe in der Atmosphäre im Rahmen des Global Atmosphere Watch Programmes der WMO, Umweltforschungsstation Schneefernerhaus, Wissenschaftliche Resultate 2011/2012, available at: http://www.schneefernerhaus.de/fileadmin/web_data/bilder/pdf/UFS-Broschuere_2012.pdf, last access: 18 August 2016.
Galmarini, S.: One year of 222Rn concentration in the atmospheric surface layer, Atmos. Chem. Phys., 6, 2865–2886, https://doi.org/10.5194/acp-6-2865-2006, 2006.
Gilmore, G.: Practical Gamma-ray Spectrometry, 2nd edn., John Wiley & Sons, Chichester, 2008
Griffiths, A. D., Chambers, S. D., Williams, A. G., and Werczynski, S.: Increasing the accuracy and temporal resolution of two-filter radon-222 measurements by correcting for the instrument response, Atmos. Meas. Tech., 9, 2689–2707, https://doi.org/10.5194/amt-9-2689-2016, 2016.
Grossi, C.: LSCE_222Rn_Intercomparison, available at https://www.dropbox.com/sh/xokyu4vnt6f0gme/AABt-DxnTBbe6FFT9p4WDZWda?dl=0, last access: 23 April 2020.
Grossi, C., Vargas, A., Camacho, A., López-Coto, I., Bolívar, J. P., Xia, Y., and Conen, F.: Inter-comparison of different direct and indirect methods to determine radon flux from soil, Radiat. Meas., 46, 112–118, https://doi.org/10.1016/j.radmeas.2010.07.021, 2011.
Grossi, C., Arnold, D., Adame, A. J., Lopez-Coto, I., Bolivar, J. P., de la Morena, B. A., and Vargas, A.: Atmospheric 222Rn concentration and source term at El Arenosillo 100 m meteorological tower in southwest Spain, Radiat. Meas., 47, 149–162, https://doi.org/10.1016/j.radmeas.2011.11.006, 2012.
Grossi, C., Àgueda, A., Vogel, F. R., Vargas, A., Zimnoch, M., Wach, P., Martín, J. E., López-Coto, I., Bolívar, J. P., Morguí, J.-A., and Rodó, X.: Analysis of ground-based 222Rn measurements over Spain: filling the gap in southwestern Europe, J. Geophys. Res.-Atmos., 121, 11021–11037, https://doi.org/10.1002/2016JD025196, 2016.
Grossi, C., Vogel, F. R., Curcoll, R., Àgueda, A., Vargas, A., Rodó, X., and Morguí, J.-A.: Study of the daily and seasonal atmospheric CH4 mixing ratio variability in a rural Spanish region using 222Rn tracer, Atmos. Chem. Phys., 18, 5847–5860, https://doi.org/10.5194/acp-18-5847-2018, 2018.
Gutiérrez-Álvarez, I., Guerrero, J. L., Martín, J. E., Adame, J. A., Vargas, A., and Bolívar, J. P.: Radon behavior investigation based on cluster analysis and atmospheric modelling, Atm. Environ., 201, 50–61, https://doi.org/10.1016/j.atmosenv.2018.12.010, 2019.
Hernández-Ceballos, M. A., Vargas, A., Arnold, D., and Bolívar, J. P.: The role of mesoscale meteorology in modulating the 222Rn concentrations in Huelva (Spain) – impact of phosphogypsum piles, J. Environ. Radioactiv., 145, 1–9, https://doi.org/10.1016/j.jenvrad.2015.03.023, 2015.
Hirao, S., Yamazawa, H., and Moriizumi, J.: Inverse modelling of Asian 222Rn flux using surface air 222Rn concentration, J. Environ. Radioactiv., 101, 974–984, https://doi.org/10.1016/j.jenvrad.2010.07.004, 2010.
Hopke, P. K.: The initial behavior of 218Po in indoor air, Environ. Int., 15, 299–308, 1989.
Jacob, D. J. and Prather, M. J.: Radon‐222 as a test of convective transport in a general circulation model. Tellus B, 42, 118–134, https://doi.org/10.3402/tellusb.v42i1.15196, 1990.
Jacobi, W. and André, K.: The vertical distribution of radon 222, radon 220 and their decay products in the atmosphere, J. Geophys. Res., 68, 3799–3814, 1963.
IAEA (International Atomic Energy Agency): Sources and Measurements of Radon and Radon Progeny Applied to Climate and Air Quality Studies, in: Proceedings Series, Proceedings of a technical meeting, Vienna, Austria, organized by the International Atomic Energy Agency and co-sponsored by the World Meteorological Organization, IAEA, 59–62, 2012.
Krystek, M. and Anton, M.: A weighted total least-squares algorithm for fitting a straight line, Meas. Sci. Technol., 18, 3438, https://doi.org/10.1088/0957-0233/18/11/025, 2008.
Levin, I., Glatzel-Mattheier, H., Marik, T., Cuntz, M., Schmidt, M., and Worthy, D. E. J.: Verification of German methane emission inventories and their recent changes based on atmospheric observations, J. Geophys. Res., 104, 3447–3456, https://doi.org/10.1029/1998JD100064, 1999.
Levin, I., Born, M., Cuntz, M., Langendörfer, U., Mantsch, S., Naegler, T., Schmidt, M., Varlagin, A., Verclas, S., and Wagenbach, D.: Observations of atmospheric variability and soil exhalation rate of Radon-222 at a Russian forest site: Technical approach and deployment for boundary layer studies, Tellus B, 54, 462–475, 2002.
Levin, I., Hammer, S., Eichelmann, E., and Vogel, F. R.: Verification of greenhouse gas emission reductions: the prospect of atmospheric monitoring in polluted areas, Philos. T. Roy. Soc. A, 369, 1906–1924, 2011.
Levin, I., Schmithüsen, D., and Vermeulen, A.: Assessment of 222radon progeny loss in long tubing based on static filter measurements in the laboratory and in the field, Atmos. Meas. Tech., 10, 1313–1321, https://doi.org/10.5194/amt-10-1313-2017, 2017.
López-Coto, I., Mas, J. L., and Bolívar, J. P.: A 40-year retrospective European radon flux inventory including climatological variability, Atmos. Environ., 73, 22–33, https://doi.org/10.1016/j.atmosenv.2013.02.043, 2013.
Nazaroff, W. W. and Nero, A. V. (Eds.): Radon and its decay products in indoor air, Physics Today 42, 72, https://doi.org/10.1063/1.2810982, 1988.
Karstens, U., Schwingshackl, C., Schmithüsen, D., and Levin, I.: A process-based 222radon flux map for Europe and its comparison to long-term observations, Atmos. Chem. Phys., 15, 12845–12865, https://doi.org/10.5194/acp-15-12845-2015, 2015.
Paatero, J., Hatakka, J., and Viisanen, Y.: Concurrent measurements of airborne radon-222, lead-210 and beryllium-7 at the Pallas-Sodankylä GAW station, Northern Finland, Finnish Meteorological Institute, Helsinki, Report No. 1998:1, 1–30, 1998.
Pereira, E. B. and da Silva, H. E.: Atmospheric radon measurements by electrostatic precipitation, Nucl. Instrum. Meth. A, 280, 503–505, 1989.
Rosenfeld, M.: Modifikation des Heidelberger Radon-Monitors und erste Messungen, Diploma Thesis, University of Heidelberg, Heidelberg, Germany, 2010.
Schery, S. D. and Huang, S.: An estimate of the global distribution of radon emissions from the ocean, Geophys. Res. Lett., 31, L19104, https://doi.org/10.1029/2004GL021051, 2004.
Schmithüsen, D., Chambers, S., Fischer, B., Gilge, S., Hatakka, J., Kazan, V., Neubert, R., Paatero, J., Ramonet, M., Schlosser, C., Schmid, S., Vermeulen, A., and Levin, I.: A European-wide 222radon and 222radon progeny comparison study, Atmos. Meas. Tech., 10, 1299–1312, https://doi.org/10.5194/amt-10-1299-2017, 2017.
Stockburger, H. und Sittkus, A.: Unmittelbare Messung der natürlichen und künstlichen Radioaktivität der atmosphärischen Luft, Z. Naturforsch., 21, 1128–1132, 1966.
Szegvary, T., Conen, F., and Ciais, P.: European 222Rn inventory for applied atmospheric studies, Atmos. Environ., 43, 1536–1539, https://doi.org/10.1016/j.atmosenv.2008.11.025, 2009.
Tositti, L., Pereira, E. B., Sandrini, S., Capra, D., Tubertini, O., and Bettoli, M. G.: Assessment of summer trands of tropospheric radon isotopes in a costal antartic station (Terra Nova Bay), Int. J. Environ. An. Ch., 82, 259–274, 2002.
Vargas, A., Ortega, X., and Martín Matarranz, J. L.: Traceability of radon-222 activity concentration in the radon chamber at the technical university of Catalonia (Spain), Nucl. Instrum. Meth. A, 526, 501–509, https://doi.org/10.1016/j.nima.2004.02.022, 2004.
Vargas, A., Arnold, D., Adame, J. A., Grossi, C., Hernández-Ceballos, M. A., and Bolívar, J. P.: Analysis of the vertical radon structure at the Spanish “El Arenosillo” tower station, J. Environ. Radioactiv., 139, 1–17, https://doi.org/10.1016/j.jenvrad.2014.09.018, 2015.
Vogel, F. R., Ishizawa, M., Chan, E., Chan, D., Hammer, S., Levin, I., and Worthy, D. E. J.: Regional non-CO2 greenhouse gas fluxes inferred from atmospheric measurements in Ontario, Canada, J. Integr. Environ. Sci., 9, 45–55, https://doi.org/10.1080/1943815X.2012.691884, 2012.
Vogel, F. R., Tiruchittampalam, B., Theloke, J., Kretschmer, R., Gerbig, C., Hammer, S., and Levin, I.: Can we evaluate a fine-grained emission model using high-resolution atmospheric transport modelling and regional fossil fuel CO2 observations?, Tellus B, 65, 18681, https://doi.org/10.3402/tellusb.v65i0.18681, 2013.
Wada, A., Matsueda, H., Murayama, S., Taguchi, S., Hirao, S., Yamazawa, H., Moriizumi, J., Tsuboi, K., Niwa, Y., and Sawa, Y.: Quantification of emission estimates of CO2, CH4 and CO for East Asia derived from atmospheric radon-222 measurements over the western North Pacific, Tellus B, 65, 18037, https://doi.org/10.3402/tellusb.v65i0.18037, 2013.
Whittlestone, S. and Zahorowski, W.: Baseline radon detectors for shipboard use: Development and deployment in the First Aerosol Characterization Experiment (ACE 1), J. Geophys. Res., 103, 16743–16751, https://doi.org/10.1029/98JD00687, 1998.
Williams, A. G. and Chambers, S. D.: A history of radon measurements at Cape Grim, Baseline Atmospheric Program (Australia) History and Recollections, 40th Anniversary Special edn., 131–146, 2016.
Williams, A. G., Zahorowski, W., Chambers, S., Griffiths, A., Hacker, J. M., Element, A., and Werczynski, S.: The vertical distribution of radon in clear and cloudy daytime terrestrial boundary layers, J. Atmos. Sci., 68, 155–174, https://doi.org/10.1175/2010JAS3576.1, 2011.
Williams, A. G., Chambers, S., and Griffiths, A.: Bulk mixing and decoupling of the nocturnal stable boundary layer characterized using a ubiquitous natural tracer, Bound.-Lay. Meteorol., 149, 381–402, https://doi.org/10.1007/s10546-013-9849-3, 2013.
Xia, Y., Sartorius, H., Schlosser, C., Stöhlker, U., Conen, F., and Zahorowski, W.: Comparison of one- and two-filter detectors for atmospheric 222Rn measurements under various meteorological conditions, Atmos. Meas. Tech., 3, 723–731, https://doi.org/10.5194/amt-3-723-2010, 2010.
Zahorowski, W., Chambers, S. D., and Henderson-Sellers, A.: Ground based radon-222 observations and their application to atmospheric studies, J. Environ. Radioactiv., 76, 3–33, https://doi.org/10.1016/j.jenvrad.2004.03.033, 2004.