the Creative Commons Attribution 4.0 License.
the Creative Commons Attribution 4.0 License.
 | 03 Jun 2020
Resolving the size of ice-nucleating particles with a balloon deployable aerosol sampler: the SHARK
Sebastien N. F. Sikora
Michael P. Adams
Ulrike Proske
Alexander D. Harrison
Mark D. Tarn
Ian M. Brooks
Benjamin J. Murray
Ice-nucleating particles (INPs) affect cloud development, lifetime, and radiative properties, hence it is important to know the abundance of INPs throughout the atmosphere. A critical factor in determining the lifetime and transport of INPs is their size; however very little size-resolved atmospheric INP concentration information exists. Here we present the development and application of a radio-controlled payload capable of collecting size-resolved aerosol from a tethered balloon for the primary purpose of offline INP analysis. This payload, known as the SHARK (Selective Height Aerosol Research Kit), consists of two complementary cascade impactors for aerosol size-segregation from 0.25 to 10 µm, with an after-filter and top stage to collect particles below and above this range at flow rates of up to 100 L min−1. The SHARK also contains an optical particle counter to quantify aerosol size distribution between 0.38 and 10 µm, and a radiosonde for the measurement of temperature, pressure, GPS altitude, and relative humidity. This is all housed within a weatherproof box, can be run from batteries for up to 11 h, and has a total weight of 9 kg. The radio control and live data link with the radiosonde allow the user to start and stop sampling depending on meteorological conditions and height, which can, for example, allow the user to avoid sampling in very humid or cloudy air, even when the SHARK is out of sight. While the collected aerosol could, in principle, be studied with an array of analytical techniques, this study demonstrates that the collected aerosol can be analysed with an offline droplet freezing instrument to determine size-resolved INP concentrations, activated fractions, and active site densities, producing similar results to those obtained using a standard PM10 aerosol sampler when summed over the appropriate size range. Test data, where the SHARK was sampling near ground level or suspended from a tethered balloon at 20 m altitude, are presented from four contrasting locations having very different size-resolved INP spectra: Hyytiälä (southern Finland), Leeds (northern England), Longyearbyen (Svalbard), and Cardington (southern England).
- Article
(5803 KB) - Full-text XML
-
Supplement
(799 KB) - BibTeX
- EndNote


Atmospheric ice-nucleating particles (INPs) are not well understood, with knowledge of their concentration, sources, temporal variability, transport, and size in its infancy (Kanji et al., 2017; Murray et al., 2012). This is of importance because clouds between 0 and around −35 ∘C can exist in a supercooled liquid, mixed-phase (ice and water), or glaciated (ice only) state depending in part on the presence or absence of INPs (Kanitz et al., 2011; Vergara-Temprado et al., 2018). In the absence of INPs, cloud droplets can supercool to below ∘C (Herbert et al., 2015), but INPs can trigger freezing at much higher temperatures (Kanji et al., 2017). These particles usually have concentrations that are orders of magnitude smaller than cloud condensation nuclei (CCN) and have a disproportionate impact on clouds because the nucleated ice crystals grow rapidly and precipitate out (Lohmann, 2017; Murray, 2017). In a shallow cloud, heterogeneous ice nucleation can result in dramatic reductions in cloud albedo by removal of supercooled liquid water (Storelvmo, 2017; Vergara-Temprado et al., 2018), whereas in deep convective clouds it can influence a web of microphysical processes in a complex way (Deng et al., 2018; Kanji et al., 2017; Rosenfeld et al., 2011). Hence, a greater understanding of INP lifetime, transport, and distribution in the vertical profile is needed in order to better understand and model cloud processes and their response to a changing climate.
The size of an aerosol particle significantly affects its lifetime and therefore transport in the atmosphere, with particles of a few hundred nanometres potentially having a lifetime of weeks, whereas particles of 10 µm have a lifetime of only hours (Jaenicke, 2007). While composition is recognized to be an important controller of ice nucleation ability (Kanji et al., 2017), it has also been generally thought that the larger an aerosol particle, the more likely it is to serve as an INP (Pruppacher and Klett, 1997). However, the lifetime of coarse-mode aerosol particles decreases rapidly with increasing size. Consistent with larger particles being better ice nucleators, parameterizations of INPs in the atmosphere have been proposed wherein the INP concentration is related to the concentration of aerosol particles larger than 0.5 µm (DeMott et al., 2010, 2015; Tobo et al., 2013). However, most atmospheric measurements of INPs report the sum of INPs below some threshold size set by an inlet or size cut, specified by the aerosol sampler used. For instance, DeMott et al. (2017) provides a comparison between a selection of instruments for the collection and subsequent INP analysis of aerosol, where the aerosol samplers either have a defined size cut-off or have collection efficiencies that decrease in magnitude above a defined size. Nevertheless, there are examples of field studies in which INPs have been size resolved (Berezinski et al., 1988; Creamean et al., 2018b; Huffman et al., 2013; Mason et al., 2016; Reicher et al., 2018; Santachiara et al., 2010; Si et al., 2018; Welti et al., 2009). These studies generally show that while the fine-mode aerosol particles are more abundant, coarse-mode aerosol particles often contribute more to the INP population. In addition, the activated fraction (nn) of coarse-mode aerosol is usually greater than fine-mode aerosol. However, in some field studies (Mason et al., 2016; Si et al., 2018), fine aerosol sometimes contributes more to the INP population than the coarse mode. Therefore, there is a need to determine INP sizes when quantifying atmospheric INP concentrations, as size is important for transport and lifetime and is therefore required to accurately model global INP populations.
Measurements of INPs in and above the boundary layer are crucial to understanding the contribution of local sources to the ice-nucleating activity in clouds, compared to transported aerosol. Aircraft measurements (e.g. Price et al., 2018; Rogers et al., 2001) and mountaintop observatories (e.g. Conen et al., 2015) have been used to quantify INP populations above the boundary layer. For example, it has been shown that there are differences in the INP concentrations measured when in and out of the boundary layer at the High Altitude Research Station Jungfraujoch (Switzerland) (Conen et al., 2015; Lacher et al., 2018). While these measurements are undoubtedly useful, mountaintop measurements are only possible in locations with sufficiently tall yet accessible mountains, and aircraft sampling is expensive and not necessarily possible in remote regions. It is therefore essential that instrumentation is available that can be used to sample aerosol at selected altitudes (including ground level) in order to determine INP concentrations throughout the vertical profile. Unmanned aerial vehicles (UAVs) are becoming more widely used in atmospheric science; these allow the collection of aerosol at altitude at significantly lower cost than with manned aircraft but are limited by relatively short battery lives, usually under 1 h, and potential propeller interference (Jacob et al., 2018; Villa et al., 2016).
Tethered kite and balloon systems have historically been used to make atmospheric measurements and collect aerosol samples with much longer sampling times (many hours are readily achievable) at altitudes up to 2 and 5 km for tethered balloons and kites, respectively (Armstrong et al., 1981; Balsley et al., 1998). An advantage of a balloon or kite system is that an instrument can be held at a chosen altitude for many hours without the balloon interfering with measurements, as the instrument can be suspended on a line many metres below the balloon. They can also stay inflated and in use for periods of many weeks, making them ideal for longer campaigns in remote environments. A new instrument called the Honing On VERtical Cloud and Aerosol properTies (HOVERCAT) (Creamean et al., 2018a) provides the capability to sample aerosol for subsequent INP analysis on a tethered balloon or UAV, allowing both variable altitudes and static collection of non-size-resolved aerosol smaller than 10 µm at 1.2 L min−1. In the past, aerosols have been size segregated using cascade impactors on a tethered balloon system (Hara et al., 2013; Reagan et al., 1984), but balloon-borne cascade impactor systems have not yet been adapted for the purpose of size-resolved INP analysis. The downsides of balloon-based platforms include the need for wind speeds below around 64.4 km h−1 to avoid damage to the balloon and the possibility of “icing” of the balloon and lines when deployed in a cold and humid environment, which could add to the weight of the payload and cause the system to sink or fall slowly. Nevertheless, balloon- and kite-borne measurements remain a valuable way to obtain continuous, high-resolution measurements over a period of many hours in a single location at a range of altitudes.
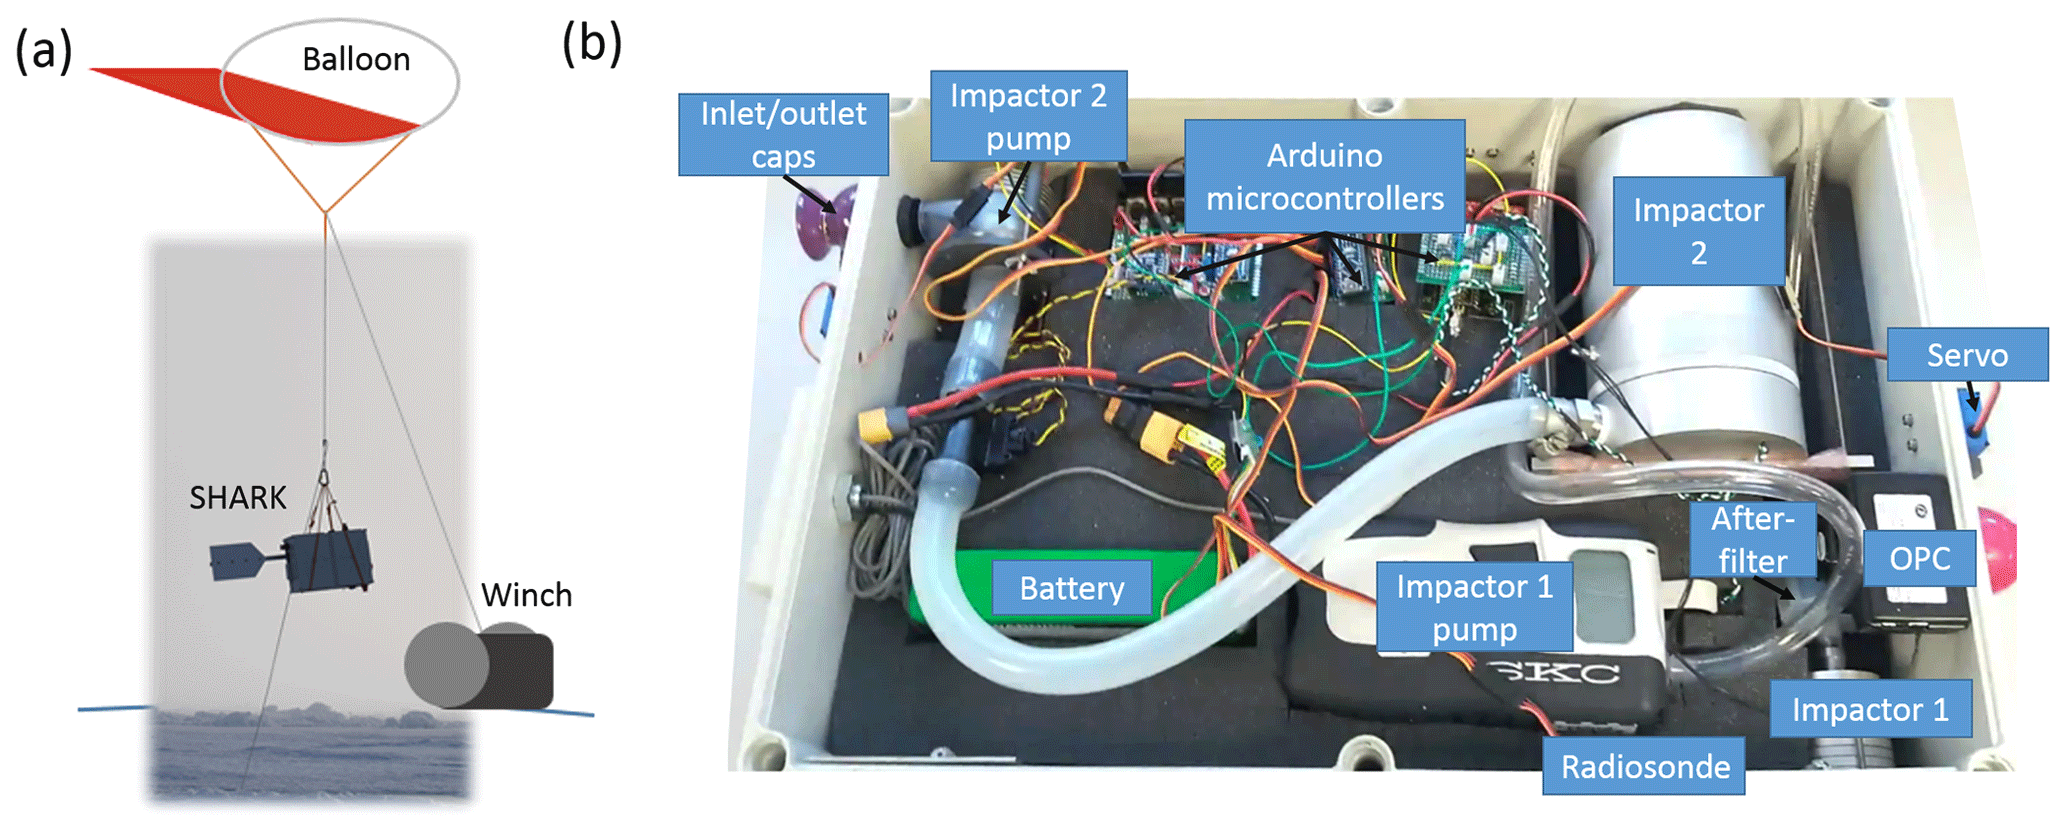
Figure 1The SHARK. (a) The SHARK payload on a tethered balloon connected to ground by a winch. The photograph was taken during deployment in the High Arctic. (b) The components inside the SHARK payload labelled on a photograph. The payload featured a large impactor inlet at the top of the platform for Impactor 2, with the OPC inlet facing the front, and a small impactor inlet at the bottom for Impactor 1. The radiosonde was at the bottom of the box, and the outlet valve for the pump system is shown at the back of the SHARK, where the 100 L min−1 pump for Impactor 2 vents.
In this paper, the design, testing, and operation of a payload named the Selective Height Aerosol Research Kit (SHARK) is presented. It consists of two separate cascade impactor systems, operating at 9 and 100 L min−1, for the size sorting of ambient aerosol particles from 0.25 to 10 µm, with an after-filter and top stage to collect particles below and above this range for offline INP (or other) analysis. The SHARK also features an optical particle counter (OPC) and a radiosonde, which provides real-time measurements of relative humidity (RH), temperature, global positioning system (GPS) altitude, and pressure. Weighing 9 kg, the payload is suitable for use with a 21 m3 or larger tethered balloon such as in Fig. 1a where the SHARK is shown in flight. The use of a tethered balloon and a high-capacity battery allow aerosol to be collected for up to 11 h at a user-selected altitude.
2.1 Instrument description
The SHARK, shown in Fig. 1, comprises two cascade impactors and corresponding pumps, alongside an OPC (OPC-N2, Alphasense, UK) and radiosonde (S1H2-R, Windsond, Sweden), all mounted within a weatherproof enclosure with a tail fin to orient it into the wind. A photograph of the internal components of the SHARK are shown in Fig. 1b. The two cascade impactors were employed to collect particles across different size bins: Impactor 1 from 0.25 to 2.5 µm and Impactor 2 from 1 to 10 µm. Impactor 1 is a cascade impactor (U.S. patent no. 6786105, Sioutas, SKC Ltd., UK), which requires a flow rate of 9 L min−1 and operates with a portable pump (Leland Legacy, SKC Ltd., UK). Impactor 2 is also a cascade impactor (MSP Model 128, TSI, USA), which requires a flow rate of 100 L min−1 at a pressure drop of 0.6 kPa (Marple et al., 1991; Misra et al., 2002), and for which a radial flow impeller (Radial Blower U51, Micronel, UK) was used in reverse as a lightweight pump (∼120 g). These pumps maintain the volumetric flow rate through the impactors as temperature and atmospheric pressure change with altitude. The pump for Impactor 1 was calibrated to apply this adjustment to at least 2.3 km (SKC, 2020), although the presence of the after-filter may reduce the battery life at this altitude. The pump for Impactor 2 is supplied by a larger battery and should be able to maintain flow to at least the same altitude as the Impactor 1 pump and over a longer period of time. The SHARK records the volume of air sampled through Impactor 1 during the flight, and so if the pump battery was depleted or the pressure drop became too great before Impactor 2 had finished sampling, the Impactor 1 pump would shut down and store the recorded value for later analysis. Further testing of the SHARK would be required to define a maximum altitude limit that each SHARK component could operate at. In order to provide RH, temperature, GPS altitude, and pressure data in real time, the sensors and transmitter from a radiosonde were integrated into the system. The OPC measured aerosol size distributions, which were saved in the onboard memory. Servo-controlled caps covered the sample inlets and outlets to reduce contamination during ascent and descent, as well as to protect the components from cloud water. The operation of the SHARK components was controlled remotely via a radio link using an Arduino microcontroller board (16 km range); once the SHARK was at the desired altitude according to the constantly transmitting radiosonde, the inlet caps opened 10 s prior to the pumps and OPC starting in order to initiate aerosol sampling and monitoring. The payload components, including the servo inlet covers and Arduino control boards, were powered by a 5000 mAh battery (4S 14.8 V LiPo, Overlander, UK). The components were assembled into the SHARK payload with the static (i.e. no wind) weight budget of 10 kg for a 21 m3 balloon (Skyhook Helikite, Allsopp Helikites Ltd., UK) in mind; hence the SHARK weighs 9 kg when fully instrumented.
The cascade impactors allow for the collection of size-segregated aerosol (further details are provided in Sect. 2.2) onto thin films (0.25 mm thickness) for subsequent offline analysis, which can be used alongside information about the aerosol size distributions obtained via the OPC and atmospheric conditions from the radiosonde. Our initial focus concerns the analysis of the ice-nucleating properties of the collected aerosol, but an array of analytical techniques could be applied to characterize the size-selected aerosol, including mass spectrometry, DNA analysis, scanning electron microscopy (SEM), and transmission electron microscopy (TEM) (Ault and Axson, 2017; Garcia et al., 2012; Huffman et al., 2013; Laskin et al., 2018).
2.2 Size-segregated collection of aerosol
Two separate cascade impactors were installed, each operating over different size ranges. This enabled size-resolved aerosol sampling onto substrates across both the fine and coarse modes at high flow rates, while keeping power consumption low enough to be run from batteries. Single impactor systems designed to operate across the accumulation and coarse modes simultaneously require a relatively large pressure drop that would typically require a prohibitively large (and heavy) pump and battery for this application.
Impactor 1 sorts aerosol into five size categories: < 0.25 µm (this size bin is defined by the impactor after-filter and is hereafter referred to as 1a), 0.25–0.5 µm (from stage 1b), 0.5–1.0 µm (from stage 1c), 1.0–2.5 µm (from stage 1d), and > 2.5 µm (from stage 1e). The size categories b to e correspond to the impactor stages where the 50 % collection cut-off diameter (d50) is the lower bound of each bin. The size bins and collection efficiencies for each impactor were digitized from data provided by the manufacturers, (Misra et al., 2002; Product Information Sheet – MSP, 2019) and are shown in Fig. 2. Several collection substrates were tested by Misra et al. (2002), and the dataset from the Teflon substrates was chosen to represent Impactor 1 here as that substrate most closely resembled those used in this study. For Impactor 1, the particles were collected on 25 mm diameter filters of pore size 0.05 µm (Nuclepore track-etched membrane polycarbonate filters, Whatman, UK). Filters were used as impactor substrates rather than films since they have very low background contamination and are easier to obtain. Size category 1a corresponds to an after-filter situated after Impactor 1, which comprised a 47 mm diameter polycarbonate filter with a pore size of 5 µm (Nuclepore track-etched membrane) to maintain the flow rate. The collection efficiency of the after-filter was estimated to be 50 %–100 % at 0.25 µm and below (Soo et al., 2016). Impactor 2 collected aerosol particles into three size categories: 1.0–2.5 (2d), 2.5–10 (2e), and > 10 µm (2f), also illustrated in Fig. 2. The 75 mm diameter filters of pore size 0.05 µm (Nuclepore track-etched membrane polycarbonate filters) were used in Impactor 2. An after-filter could not be used with this impactor since its inclusion increased the required pressure drop to beyond what the pump could supply at 100 L min−1.
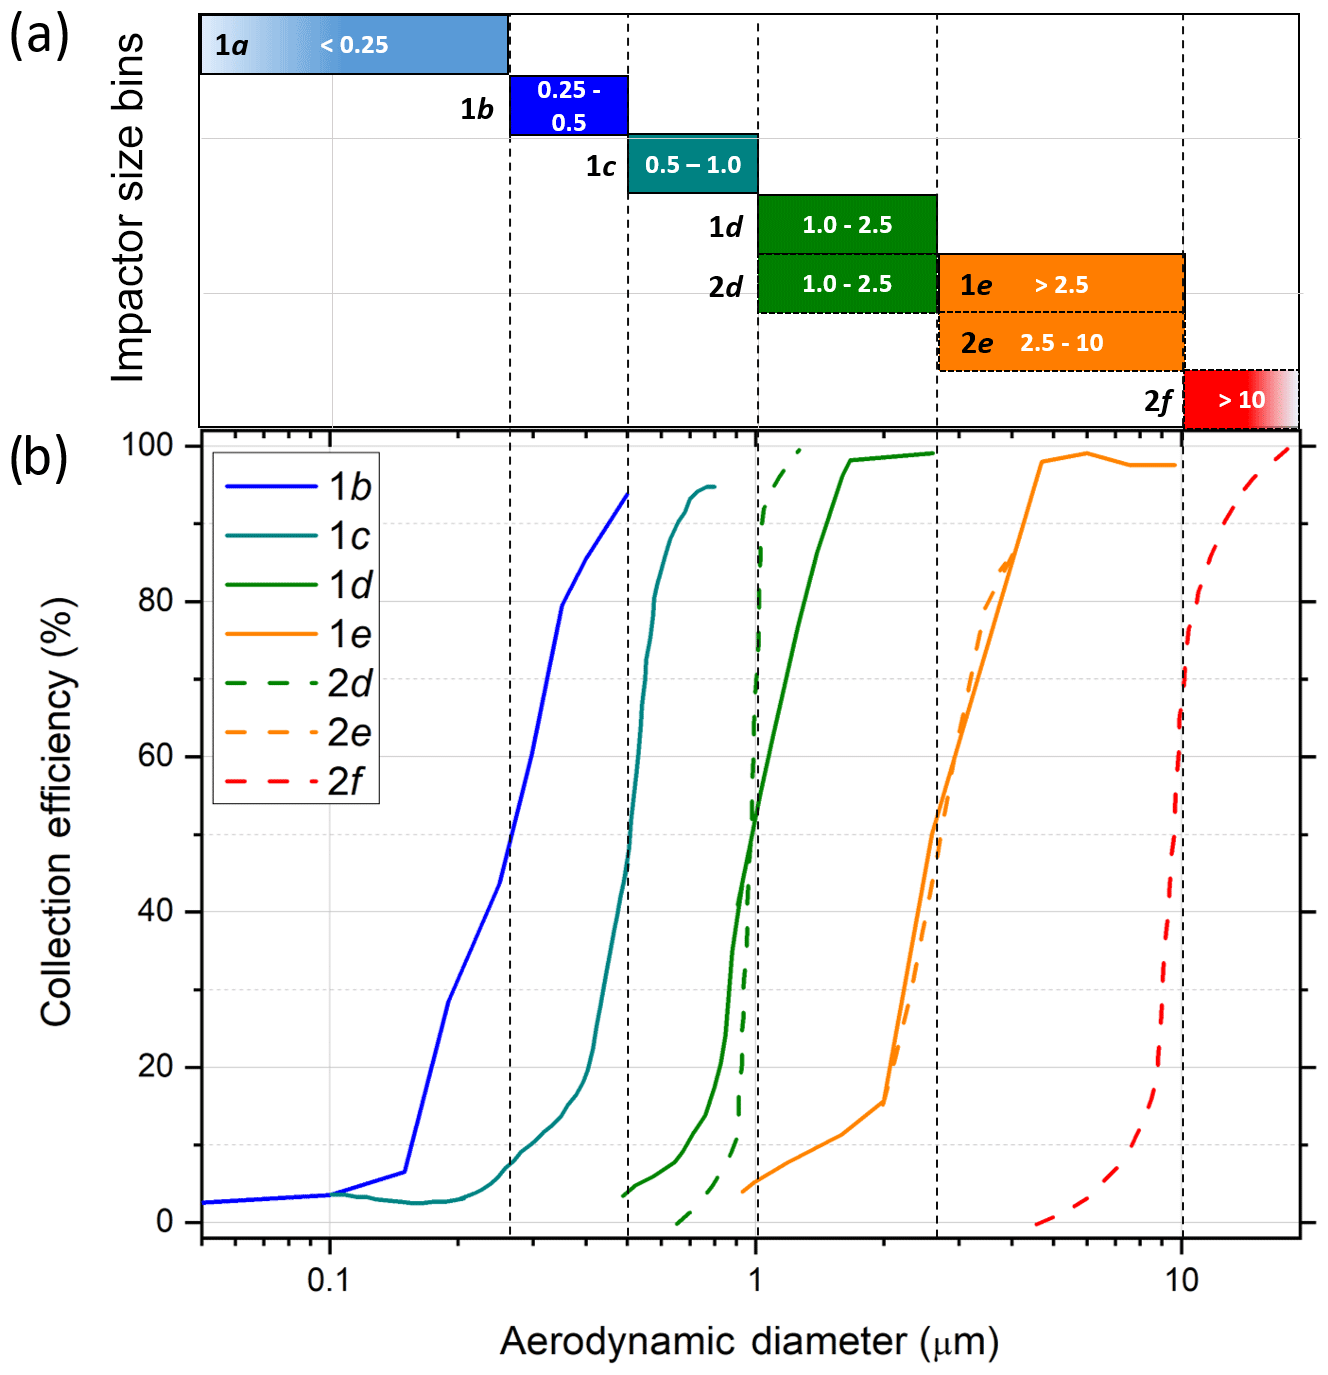
Figure 2Collection efficiencies of each size bin of the two cascade impactors in the SHARK. (a) The size bins for each stage of Impactor 1 and 2 at flow rates of 9 and 100 L min−1, respectively. (b) Impactor efficiency curves for each stage. Impactor 1 has four stages (1b–e) and one after-filter (1a), while Impactor 2 has three stages (2d–f). Stages 1d and 2d as well as 1e and 2e should be approximately equivalent in terms of the aerosol size ranges collected.
A further benefit of using these two impactors in tandem is that, in the size ranges where they overlap of 1.0–2.5 (stage d) and 2.5–10 µm (stage e), the impaction efficiencies are very similar, allowing a direct comparison between the two impactors in this size range. The stages are labelled a through f for the smallest to largest impactor stage sizes (including the after-filter), such that 1d and 2d refer to stage d (1.0–2.5 µm) on Impactors 1 and 2, respectively (see Fig. 2). Background runs were produced by placing the substrates in the SHARK as if setting up to sample, before removing and analysing them as normal to determine the contamination introduced through the installation and recovery of the substrates.
Particle bounce, the bouncing of particles off the impaction substrate and the collection of these particles on the lower stages, has previously been identified as a factor that can cause biases when aerosol is collected by cascade impactors (Cheng and Yeh, 1979; Dzubay et al., 1976). The collection efficiency curves shown in Fig. 2 for Impactor 1 already account for some degree of particle bounce, having been determined experimentally by Misra et al. (2002) using monodispersed polymer particles on a variety of substrates. However, the efficiency curves for Impactor 2 are based on theoretical predictions (Rader and Marple, 1985) and so do not account for any bounce effects. Since two of the stages of Impactors 1 and 2 overlap (stages d and e), it is possible to comment on the possible effects, or lack thereof, of particle bounce, based on the results obtained using each of the comparable stages. This is briefly addressed in Sect. 3.4 where we show good agreement between these two impactors.
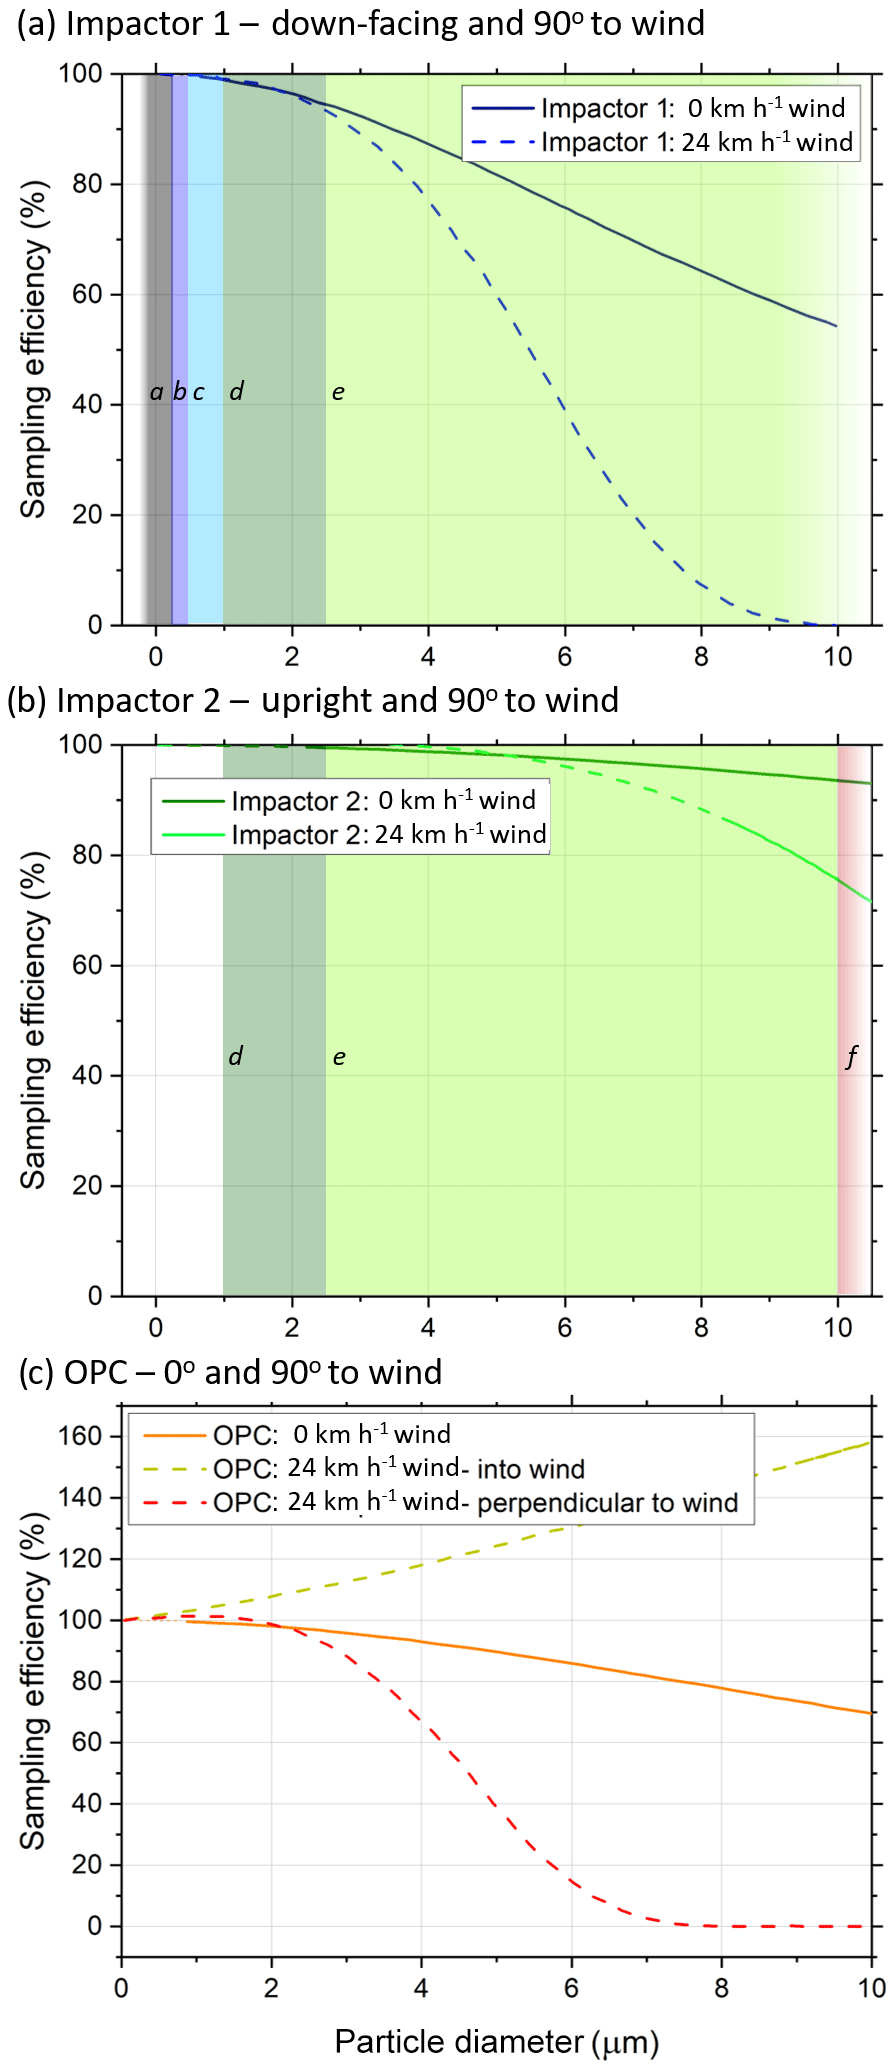
Figure 3SHARK sampling efficiencies. (a) The sampling efficiencies of Impactor 1, with and without wind, when sampling at 90∘ to the wind direction. (b) The sampling efficiencies of Impactor 2, with and without wind, when sampling at 90∘ to the wind direction. (c) The sampling efficiency of the OPC, with and without wind, when sampling at 0 and 90∘ to the wind direction (the OPC was deployed at 0∘ to the wind, based on this calculation). Solid lines denote model predictions within the validity range of the formulas, and dotted lines represent approximations (Von Der Weiden et al., 2009).
2.3 Size distribution measurements
The OPC produced binned particle size distributions from 0.38 to 17 µm every 1.38 s at a typical flow rate of 1.2 L min−1. The OPC was remotely operated through the use of its serial link via an Arduino microcontroller board. Particle size, surface area, and mass concentration data were produced from the raw OPC data, and these were then used to calculate the fraction of the aerosol that acts as an INP – activated fraction, nn(T) – and to weight the INP data to particle surface area, generating the ice-active site density per surface area, ns(T), of aerosol. The particle density used was 1.65 g cm−3, as assumed by the OPC software, and they were assumed to be spherical. No correction was made for the hygroscopic growth of aerosol particles as this required assumptions about the chemical nature of the particles, and hygroscopic growth effects were minimized by avoiding sampling when the RH was above about 80 % (see next section).
2.4 Radiosonde data
Utilizing the radio control built into the payload, real-time data informed decisions of when to turn the pumps on and off to sample. Continuous monitoring of the radiosonde data allows the user to avoid sampling under conditions where RH approached 100 %, at which point aerosol particles become excessively swollen with water or activated to cloud droplets. Hence, the influence of hygroscopic growth or cloud droplets on the collected aerosol could be minimized. The temperature and pressure measurements allowed the volume of air sampled by the impactors and OPC to be corrected to standard conditions (1 atm at 0 ∘C).
2.5 Housing and instrument orientation
The weatherproof housing consisted of an acrylonitrile butadiene styrene (ABS) polymer box with dimensions of (IP67, Fibox). Holes to mount the impactors and OPCs were drilled so that Impactor 2 sat vertically upright, and Impactor 1 was oriented 180∘ to Impactor 2 so that it faced downwards, ensuring that both impactors were always oriented 90∘ to the wind. The OPC was at 90∘ to both impactors and facing towards the front of the box, into the wind (see Fig. 3a–c). See Sect. 2.6 for the rationale of the positioning of the OPC and impactor inlets. The tail fin, which is mounted to the lid of the box, was designed to keep the SHARK orientated into the wind and was fabricated from rigid polyvinyl chloride (PVC) sheet. Impactor 1 had its own mounting screws by which it was attached to the box, whilst for Impactor 2 a custom mount was built. Securing ropes were threaded through reinforced holes in the box and connected via a carabiner for quick and easy attachment to the balloon instrument line, as seen in Fig. 1a. Modular foam was used to keep all components in place during flight.
2.6 Inlet sampling efficiencies via particle loss modelling
Calculation of the particle losses associated with the instrument inlets due to excessive wind speeds in various configurations were used to inform the design of the SHARK and to minimize sampling biases in higher wind conditions. The calculations were done using an open-source particle loss calculator program in Igor Pro, the details and assumptions for which are presented in Von Der Weiden et al. (2009). The particle loss characteristics of the impactor and OPC inlets at their required flow rates were calculated for a wind speed of 0 and 24 km h−1, the latter used as a maximum representative wind speed for operation. The wind speeds required for optimum performance are < 8 km h−1 for the impactors and OPC, but the system may experience higher wind speeds. Hence, we use this modelling to guide our choice of positioning of the instrument relative to wind direction in order to minimize sampling biases at the inlets. The modelling also allows us to better understand which impactor stages (and OPC size bins) will be most affected by such biases. We make no attempt to correct the measurements for sampling biases, since this correction itself would carry substantial uncertainty but used the calculations to inform us of the best configuration for the various inlets.
The inlet sampling efficiencies in the orientations chosen for the final design of the SHARK are shown in Fig. 3. It is important to note that, due to their dissimilar inlet dimensions and operational flow rates, Impactors 1 and 2 are affected differently by the wind. The particle losses for the largest stages of each impactor are the most affected. Stages a to d on both impactors are only minimally affected by losses. The losses are more significant in stage e on both impactors, but the losses on 1e are greater than on 2e with a 50 % cut-off at around 5.5 µm and a negligible sampling efficiency above about 8 µm on 1e. These calculations also demonstrate that the losses are wind-speed-dependent but that in situations where there is significant wind, the results from Impactor 2 will be less influenced by losses than Impactor 1 at sizes above 2.5 µm.
The OPC suffers up to 1.6 times oversampling for 10 µm particles when sampling into 24 km h−1 wind, but when oriented at 90∘ to the wind the collection efficiency of > 6 µm particles approaches 0 % (see Fig. 3c). Therefore, the OPC has been positioned in the SHARK to be oriented into the wind to ensure data are collected for the whole size range, with the caveat of a sub-isokinetic oversampling of larger particles.
The SHARK has been deployed at ground level and on a tethered balloon during development and testing at four locations for the collection and monitoring of aerosol: Cardington (UK), Hyytiälä (Finland), Leeds (UK), and Longyearbyen (Svalbard). Details of the sampling locations, periods, and instrumentation can be found in Table S1 of the Supplement. In this section, we present the results for this set of four SHARK deployments to illustrate the capabilities of the SHARK for quantifying ice-nucleating particle spectra as well as demonstrating that the technique is consistent with more established methods.
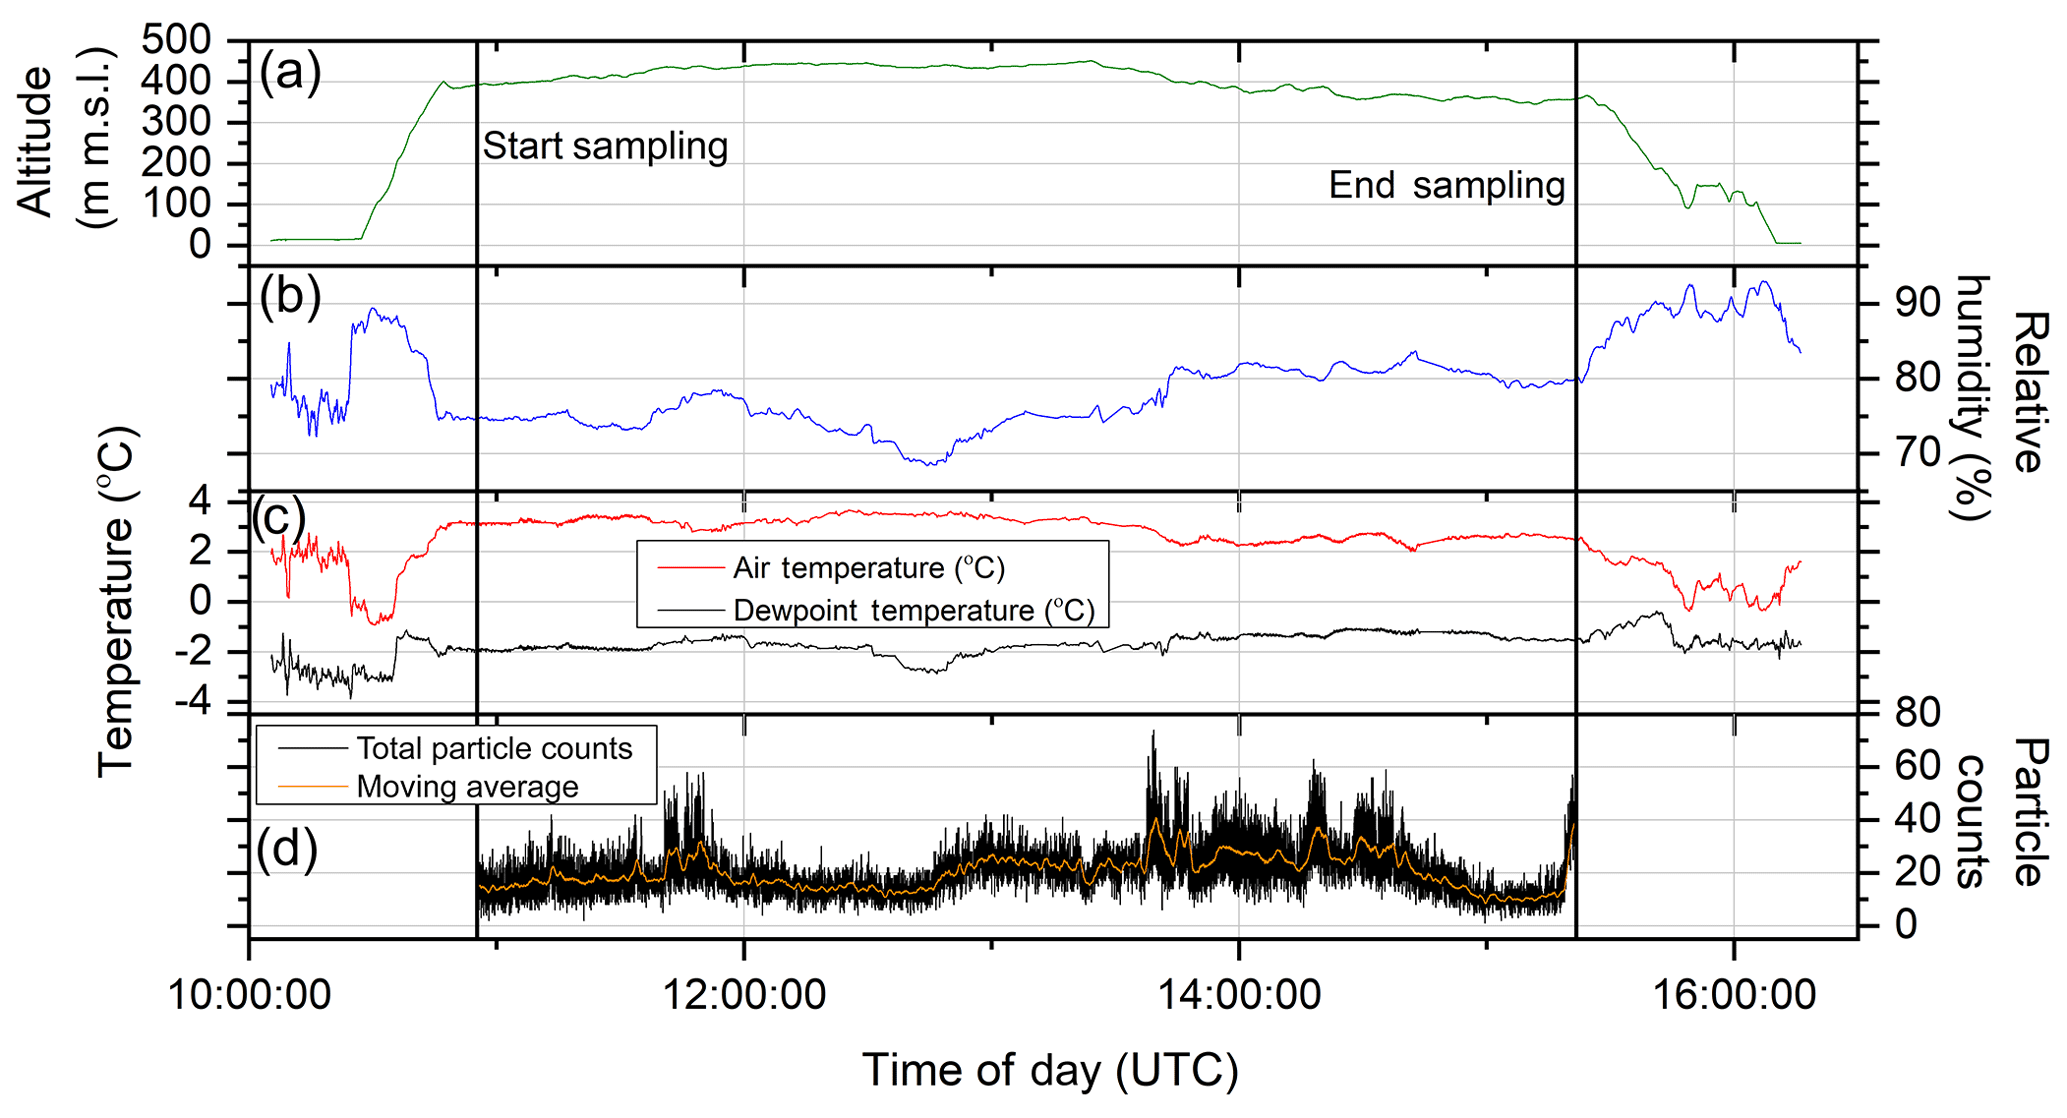
Figure 4Windsond and optical particle counter (OPC) data for a flight during a campaign to the High Arctic. (a) The altitude of the SHARK payload throughout the 4.5 h flight. The sampling start and end times are indicated as solid lines. The SHARK reached 450 m a.m.s.l. and in the last hour of flight was lowered to 350 m due to ice formation on the balloon, instrument, and tether. (b) The humidity during the flight was monitored to ensure the SHARK was not sampling during unfavourable conditions. The SHARK was brought back down to ground level once the sampling had been stopped. (c) The ambient temperature was monitored alongside the dewpoint temperature. (d) Total particle counts throughout the sampling period, as monitored by the OPC.
3.1 Meteorological and aerosol size distribution data from a SHARK flight
An example of the radiosonde and OPC data that were collected during a SHARK flight are shown in Fig. 4. The data were from a sampling event in the High Arctic in the summer of 2018, during which the meteorological data from the radiosonde and aerosol particle data from the OPC were collected alongside impactor films for INP analysis (the INP results will be published elsewhere). Throughout the 4.5 h flight the altitude, humidity, and temperature were closely monitored to inform decisions on sampling. The sampling start and end times are indicated as solid lines in Fig. 4. The SHARK reached 450 m a.m.s.l. and in the last hour of flight lowered to 350 m due to ice formation on the balloon, instrument, and tether. The RH during the flight was monitored to ensure the SHARK did not sample in humidity approaching saturation; the impactor and OPC manufacturers' specified threshold for the components is 95 % RH, but we aim to only sample with the RH below this value (∼80 %) in order to reduce the influence of hygroscopic growth on aerosol size. After sampling was stopped, the SHARK was brought down to ground level, resulting in the humidity rising. The ability to stop the sampling during the flight meant the impactors were covered, and the pumps turned off during the descent and so did not sample the more humid environment. The ambient temperature was monitored alongside the dewpoint temperature to follow the surface inversions. The temperature inversion was used to determine where to stabilize the SHARK and begin sampling, as sampling was desired above the surface inversion for this run.
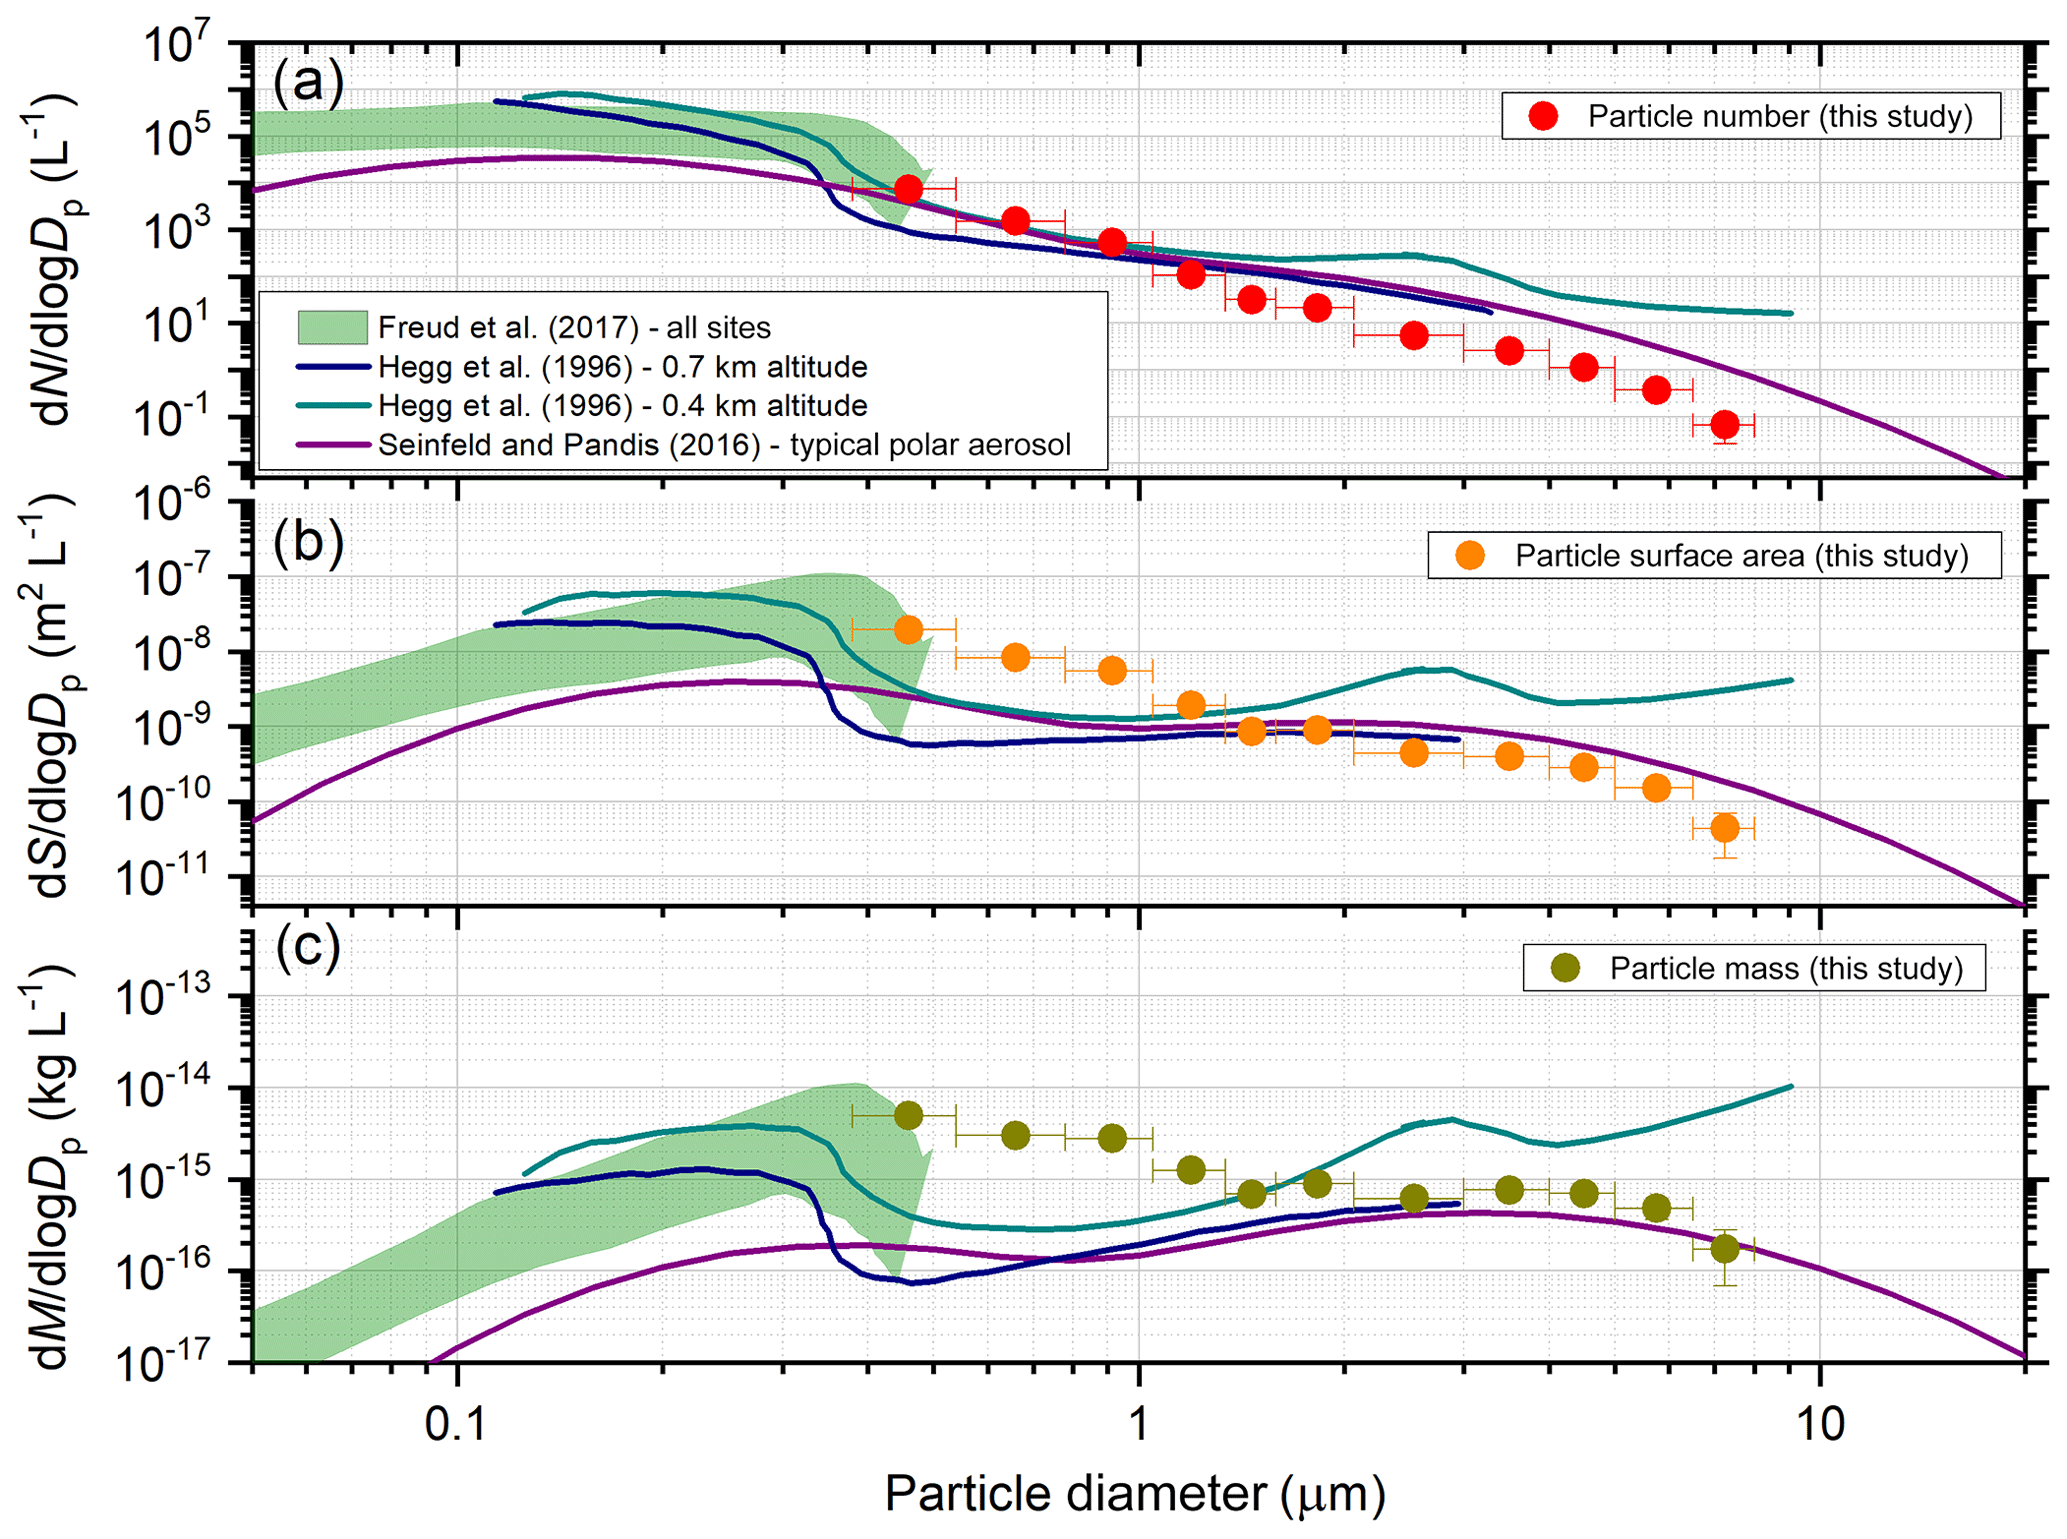
Figure 5Size distribution data produced from OPC measurements. (a) Particle number, (b) particle surface area, and (c) particle mass size distribution data above the surface temperature inversion during a test run of the SHARK suite whilst deployed on a tethered balloon in the High Arctic. Comparisons to previous studies at Arctic sites are shown (Freud et al., 2017; Hegg et al., 1996; Seinfeld and Pandis, 2016). The August aerosol number size distributions for all listed sites in Freud et al. (2017) including Zeppelin, Nord, Alert, Barrow, and Tiksi are shown. The data from Hegg et al. (1996) at altitudes of 0.7 and 0.4 km in Prudhoe Bay, Alaska, are presented. The size distributions from Seinfeld and Pandis (2016) are calculated given the parameters for multimode distributions given in their Table 8.3.
The total particle counts per 1.38 s interval from the OPC are shown in Fig. 4d. Processing of the OPC data yielded the results shown in Fig. 5 for the particle number (dN∕dlog Dp), particle surface area (dS∕dlog Dp), and particle mass (dM∕dlog Dp) size distribution data for the sampling period, where Dp is the particle diameter. We present this data to demonstrate that the OPC produces reasonable data when used facing into wind while suspended from a balloon at altitude. Unfortunately, there is no direct comparison with other aerosol size distribution measurements at the sampling location. While the particle number concentration decreases roughly linearly with size, the surface and mass concentration curves have a mode at around 4 µm in Fig. 5b and c. This is consistent with previous studies conducted within the boundary layer in the Arctic (Freud et al., 2017; Hegg et al., 1996; Seinfeld and Pandis, 2016).
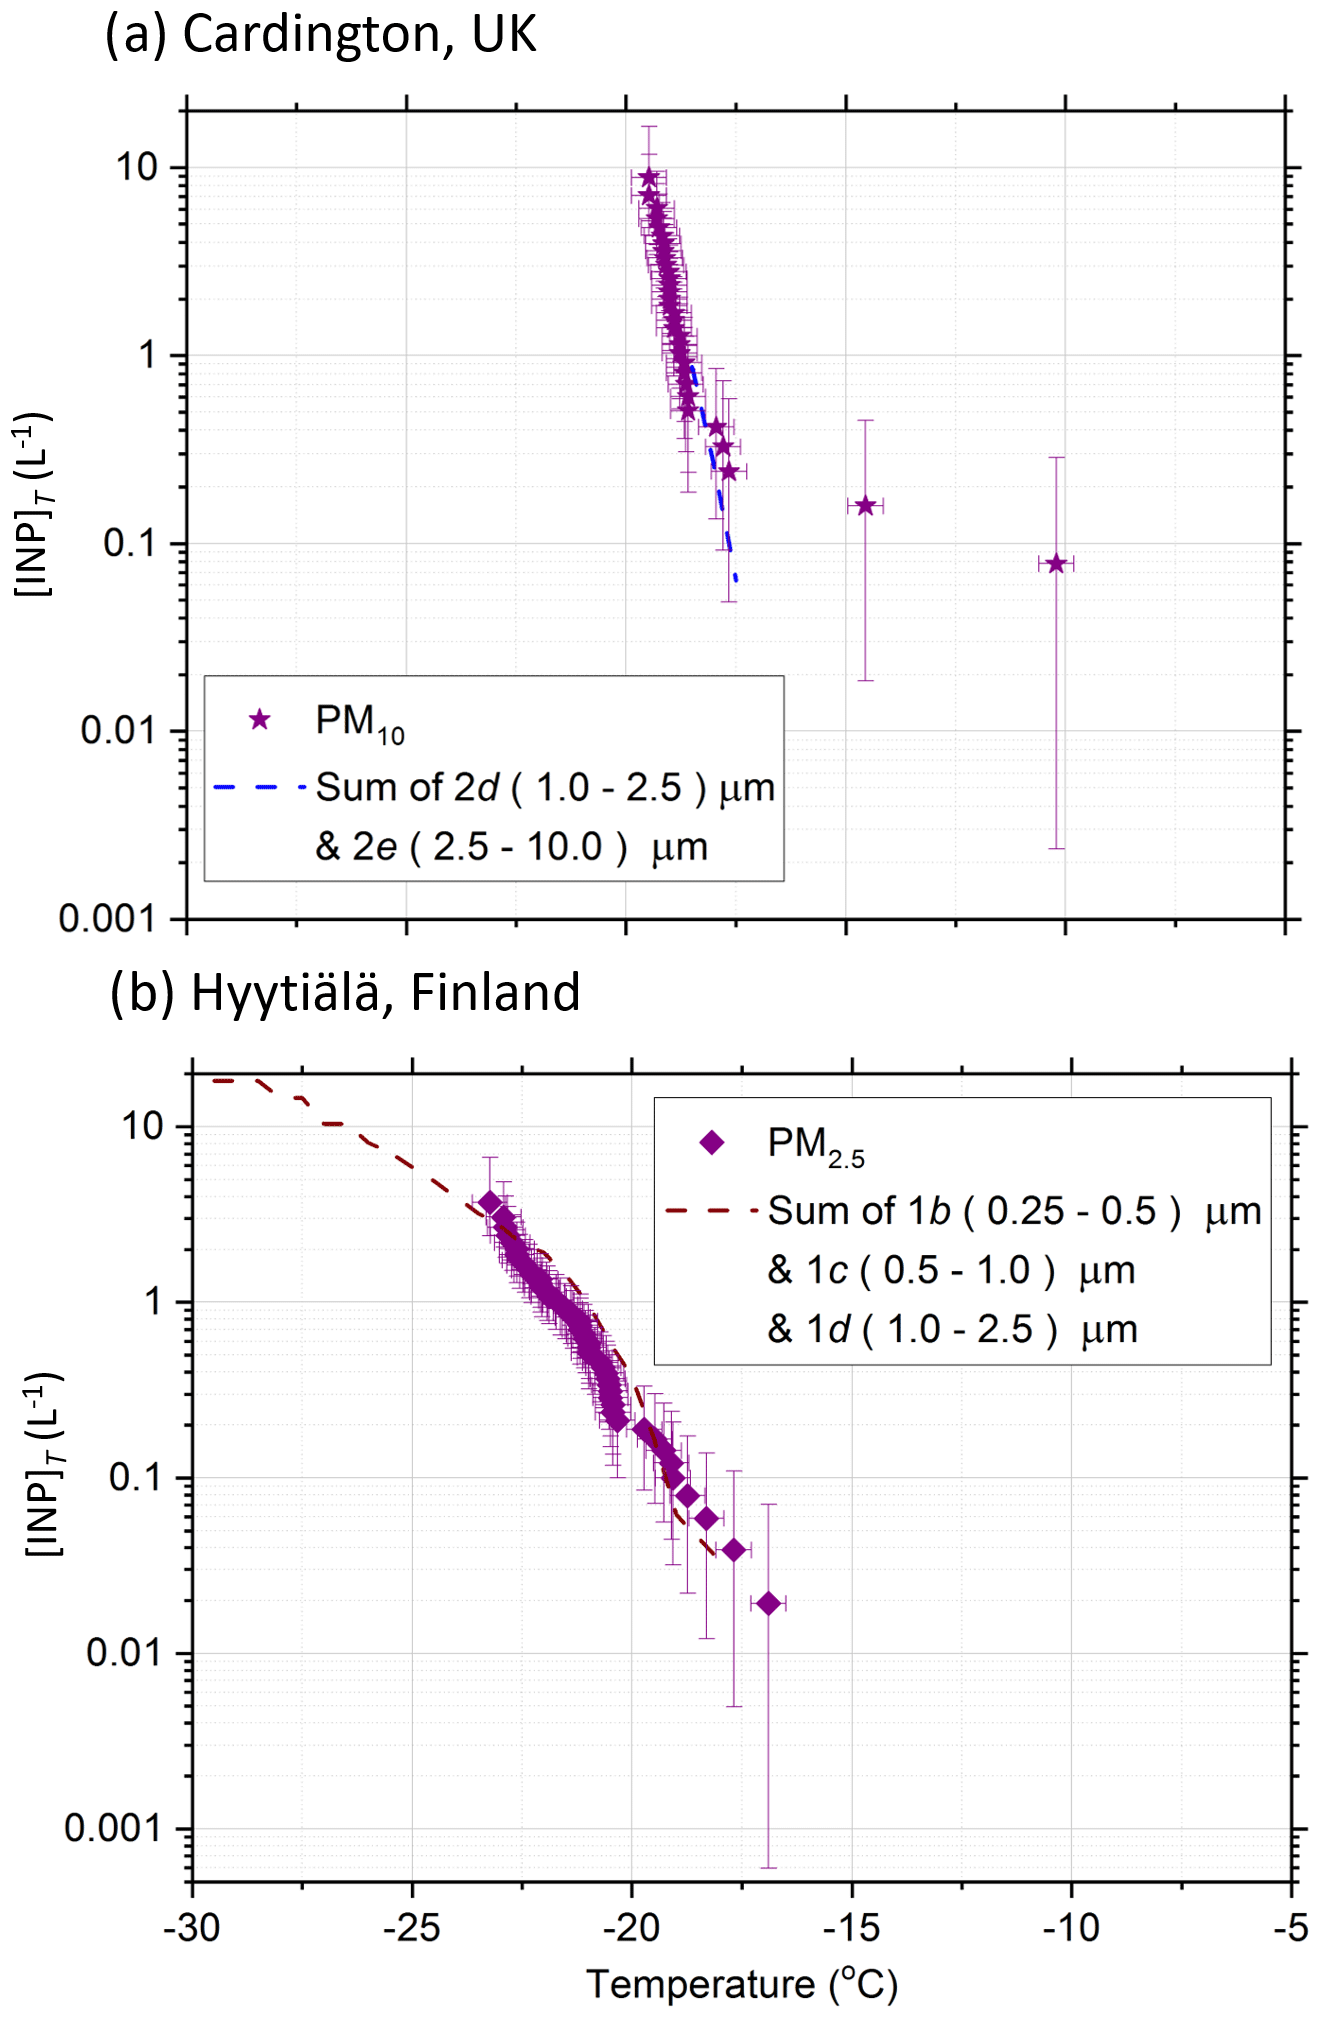
Figure 6The sum of INP concentrations, [INP]T, for labelled stages measured at (a) Cardington (UK) and (b) Hyytiälä (Finland) alongside data from a standard sampler. Cardington data were taken from Impactor 2 whilst on a tethered balloon at 20 m above ground level and are shown against a PM10 sampler at ground level. Hyytiälä data were collected using Impactor 1 at ground level, alongside a PM2.5 sampler. The dotted lines indicate the sum of the INP concentrations for the SHARK impactor stages, calculated by weighting fice(T) to the volume of sampled air and summing the concentrations in each temperature bin.
3.2 Deriving size-resolved INP concentrations from the SHARK samples
The ability to measure INP concentrations and properties using samples collected via the SHARK was tested by performing immersion mode droplet freezing assays on the sampled aerosols. Following a flight, impactor films were removed from both cascade impactors of the SHARK, then each immersed in 5 mL of water and mixed on a vortex mixer for 5 min to wash the collected particles into suspension (O'Sullivan et al., 2018). This suspension was then analysed via a droplet freezing assay using the microlitre Nucleation by Immersed Particle Instrument (µL-NIPI) (Whale et al., 2015), in which 40–50 droplets of 1 µL volume were pipetted onto a hydrophobic glass slide atop a cold plate. A Perspex shield was placed over the cold stage and N2 gas introduced to purge the chamber of moisture as the cold plate was cooled to −40 ∘C at 1 ∘C min−1. The temperatures at which droplets froze were recorded using video analysis until the entire population had frozen. This allowed the fraction of droplets frozen as a function of temperature, fice(T), to be calculated (O'Sullivan et al., 2018; Whale et al., 2015) using the equation , where Nf is the number of frozen droplets at temperature T, and Nt is the total number of droplets. The INP concentration per volume of sampled air as a function of temperature, [INP]T, was then calculated for each film using fice(T), according to Eq. (1) adapted from (Vali, 1971) to include weighting to the volume of air sampled:
where Vdroplet is the droplet volume (i.e. 1 µL), Vwash is the amount of water into which the filter is immersed to produce the suspension for analysis (i.e. 5 mL), and Vair is the volume of air sampled.
3.3 Testing the SHARK INP concentrations against a standard aerosol sampler
In order to test whether the SHARK impactors were sampling in a representative manner, the SHARK was run concurrently with a filter-based particle sampler (BGI PQ100, Mesa Labs) and which is used as an EPA Federal Reference Method for PM10 (designation no. RFPS-1298-124). This sampler was equipped with a PM10 head and an optional cyclone impactor which provided a size cut at 2.5 µm. Aerosol was collected onto 0.4 µm pore size Nuclepore track-etched membrane polycarbonate filters at a flow rate of 16.7 L min−1 (i.e. 1 m3 h−1). This type of filter collects particles across the full range of available aerosol sizes, even at sizes smaller than the pore diameter, with high collection efficiencies (Lindsley, 2016; Soo et al., 2016). These polycarbonate filters have also been successfully employed in other ice nucleation field measurements (DeMott et al., 2016; Harrison et al., 2018; Huffman et al., 2013; McCluskey et al., 2016; Reicher et al., 2019; Tarn et al., 2018). These substrates are known to have a low ice-nucleating ability and allow the collected particles to be released into suspension for subsequent INP analysis (O'Sullivan et al., 2018). The filters were analysed using the µL-NIPI in the same manner as for the impactor films collected using the SHARK. The PQ100 filter sampler was deployed alongside the SHARK in Cardington (UK) and in Hyytiälä (Finland).
In order to compare the SHARK-derived, size-resolved INP data with the results of the PM10 or PM2.5 PQ100 filter sampler, the INP concentrations determined across the appropriate SHARK size categories were summed. In Fig. 6a, data are presented from Cardington, where the sum of 2d and 2e from SHARK is compared with the filter sampler fitted with a PM10 head (Impactor 1 was not available during this test). The SHARK was suspended from a tethered balloon roughly 20 m from the ground, whereas the filter sampler was on the ground (inlet ∼150 cm above the surface), where both samplers were within the well-mixed boundary layer. The agreement is very good apart from two highest temperature points from the filter sampler, but note that the Poisson uncertainties for these points are substantial and also that the two samplers were separated vertically by 20 m.
We then show data from Hyytiälä in Fig. 6b where we compare the INP spectrum from the filter sampler, with a PM2.5 cut-off installed, with the sum of stages 1b, 1c, and 1d (the after-filter; stage 1a was not used on Impactor 1 in this case). Here, both samplers were positioned within a few metres above the ground. Again, the agreement between the SHARK and the filter sampler was very good. For both Cardington and Hyytiälä, the smallest particles (< 0.25 µm) were not sampled using the SHARK, but the agreement between the filter sampler and the SHARK implies that, in these cases, the smallest particles made a minor contribution to the overall INP population, which is what we would generally anticipate from the literature (Berezinski et al., 1988; Huffman et al., 2013; Mason et al., 2016; Santachiara et al., 2010; Si et al., 2018; Welti et al., 2009). The consistency between the SHARK and the filter sampler indicates that there are no major losses of aerosol in the SHARK sampler, at least relative to the PQ100 filter sampler.
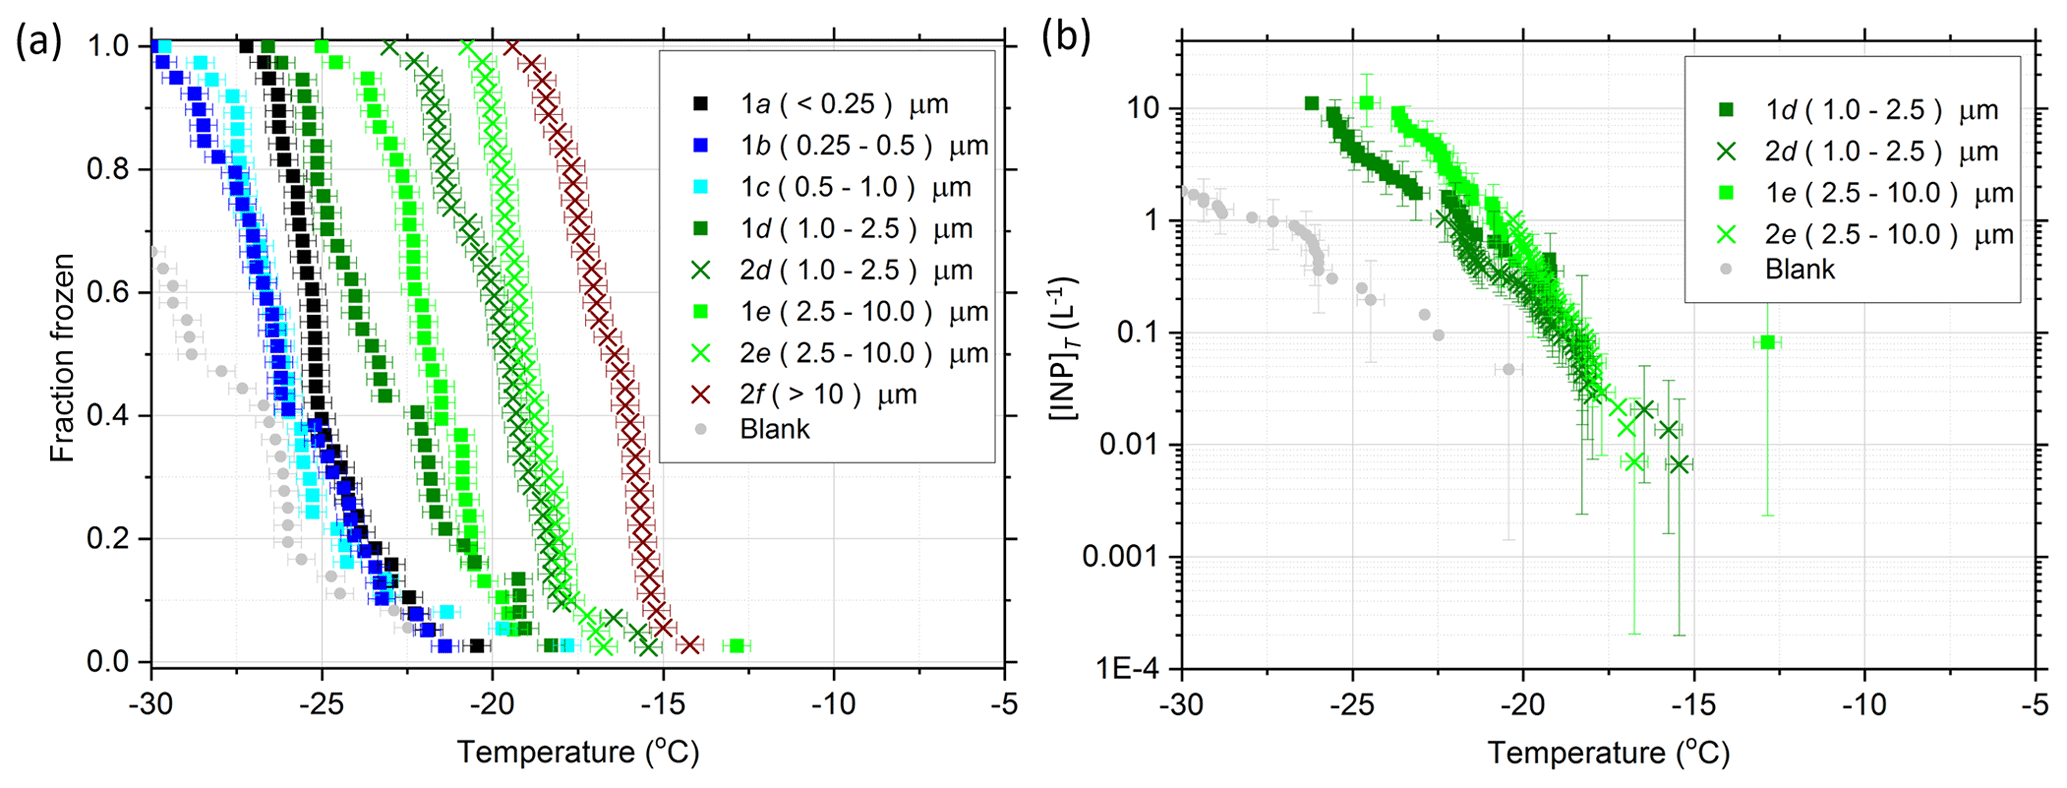
Figure 7Ice-nucleating particle (INP) analysis of samples collected in Leeds (UK) using the SHARK. (a) The fraction of droplets frozen as a function of temperature, fice(T), for each stage of Impactors 1 and 2. The handling blank is shown in grey. (b) The INP concentrations for stage “e” of both impactors (2.5–10 µm), highlighting their excellent agreement.
3.4 Consistency of INP concentrations between SHARK impactors
An example of data from the size-resolved collection and analysis of INPs is shown in Fig. 7, from a sampling run performed in Leeds (UK). The fice(T) curves for each impactor stage are illustrated in Fig. 7a. As discussed in Sect. 2.2, there are two stages, d and e, which have similar size cuts on both stages. Using stage e as an example, it can be seen that while the fraction frozen curves for the two samplers are shifted by about 3 ∘C (Fig. 7a), normalizing to the volume of air sampled to yield [INP]T in Fig. 7b shows that the INP spectra derived from stages 1e and 2e are consistent with one another. Stage 2e covers a lower range of INP concentrations than stage 1e by about 1 order of magnitude, because the flow rate through this impactor was more than a factor of 11.1 (100 L min−1/9 L min−1) higher, and the probability of collecting rarer INP was increased by this factor. The agreement between the two impactors indicates that aerosol was collected with no significant losses/enhancements due to factors like particle bounce or wind observed. Based on the inlet particle loss calculations in Fig. 3, higher losses may have been expected in impactor stage 1e, but these are not apparent here.
3.5 Size-resolved ice-nucleating particle (srINP) spectra at four locations
The derived size-resolved INP (srINP) concentrations for all four test sites are shown in Figs. 8 and 9. The fice(T) curves for these test sites can be found in Figs. S1 to S4 in the Supplement. Figure 8 shows the INP concentration spectra in the classic form, wherein INP concentrations are plotted against temperature for each size bin, whereas Fig. 9 shows the same data in novel srINP plots to allow more intuitive comparison of the INP concentration contribution from each stage with respect to temperature. In Fig. 9, where there were measurements from two impactors for the same stage (e.g. d and e), the INP concentrations were merged by taking an average at temperature intervals of 0.5 ∘C (also for Fig. 6). The colour gradient in Fig. 9 represents the temperature-dependant concentration for each size bin and the overall steepness of the d[INP]T∕dT curve. The steepness of the INP spectra can be useful in discriminating between different INP species. On inspection of Figs. 8 and 9, it can be seen that the spectra in the four locations have very different characteristics. Not only does the general shape of the spectra vary, but the size-dependence is also very different in the four locations. Due to the sample size, these variations could be attributed to the different aerosol population in each location, the time of year, and meteorology, which could affect the INP concentrations and spectra (Kanji et al., 2017; Šantl-Temkiv et al., 2019; Tobo et al., 2019; Wex et al., 2019). We now discuss the size-resolved INP concentration spectra from these tests, bearing in mind that these four tests were one-offs and should not be regarded as characteristic of those sampling sites but rather illustrative of the importance of making size-resolved measurements.
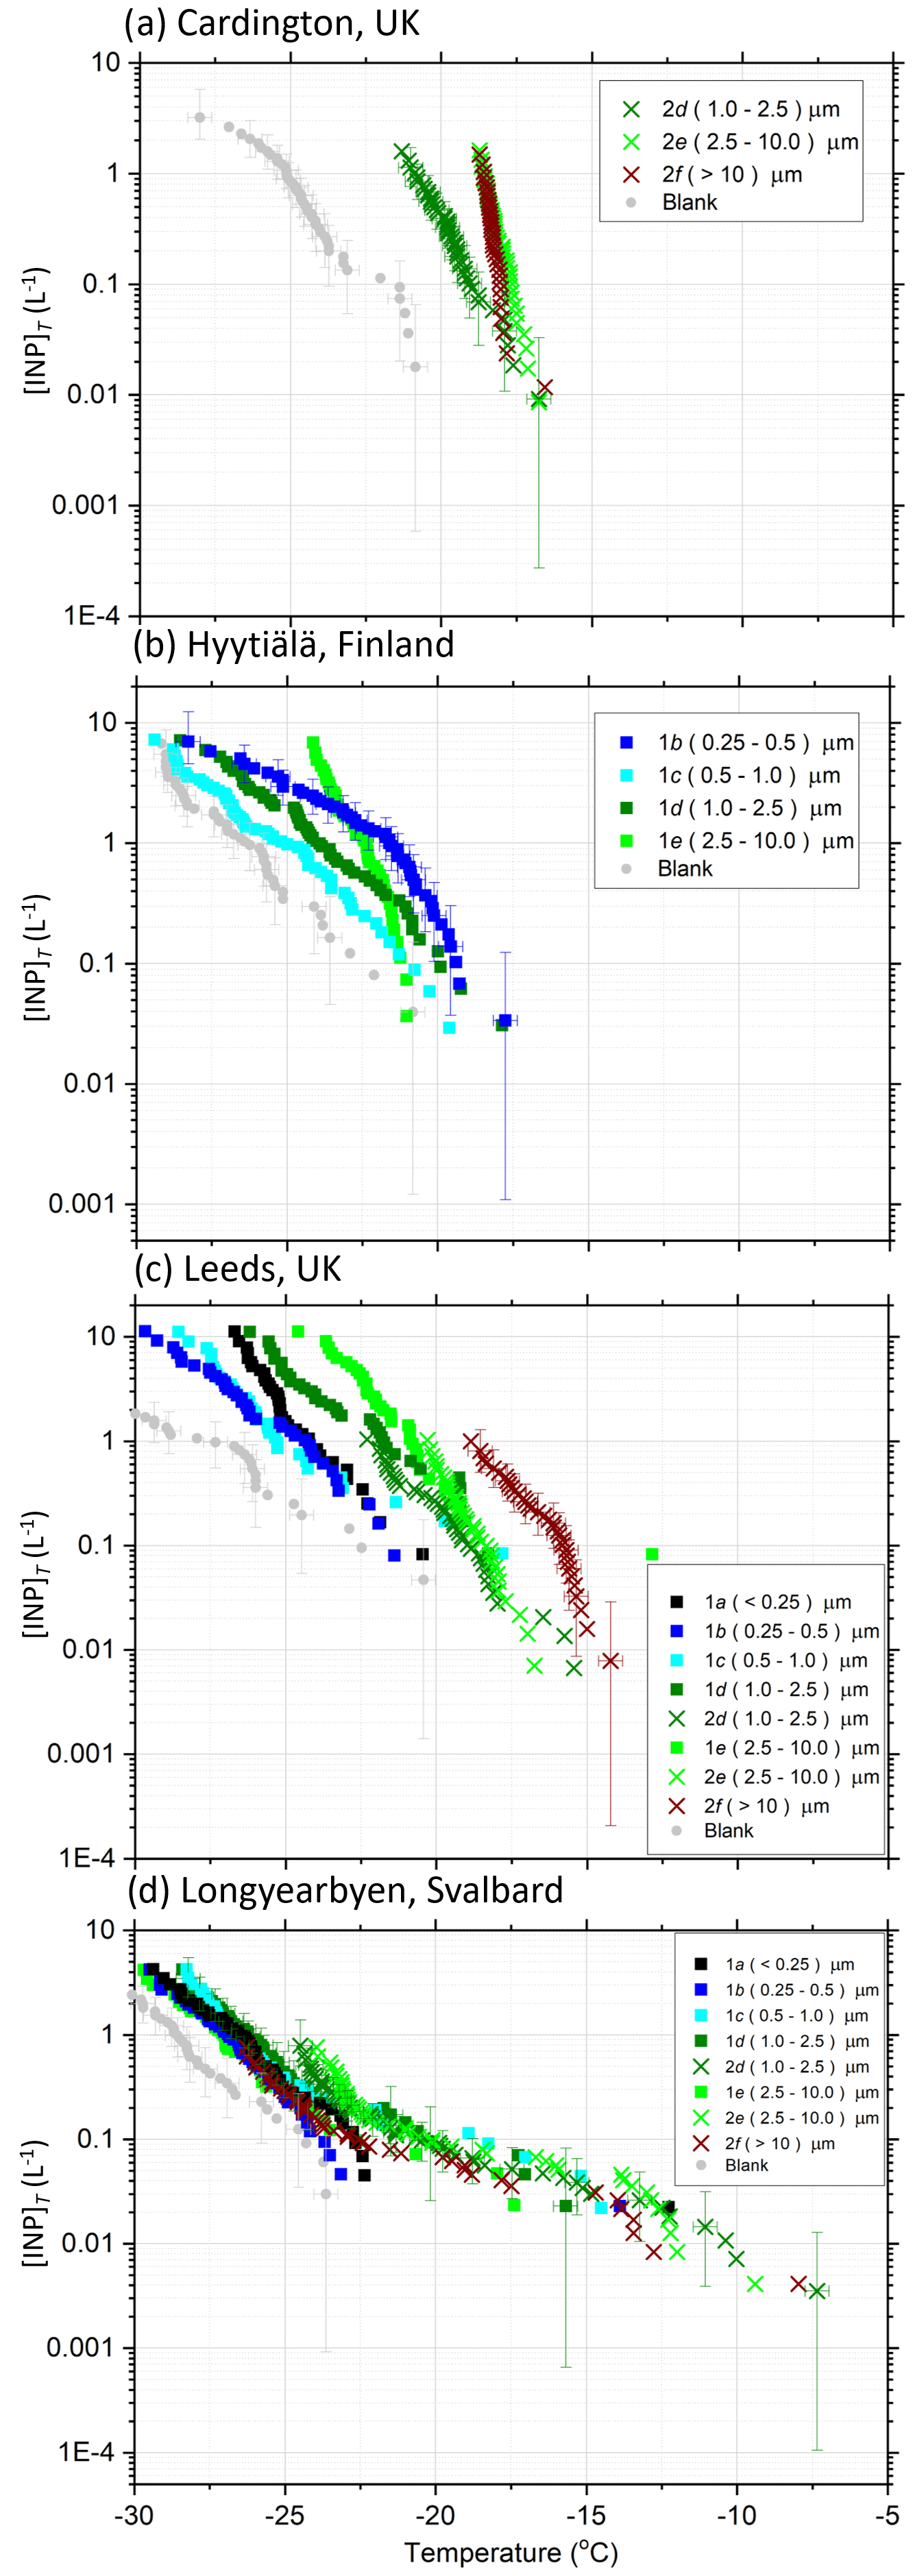
Figure 8INP concentrations determined from each impactor stage of the SHARK at the four testing sites: (a) Cardington (UK), (b) Hyytiälä (Finland), (c) Leeds (UK), and (d) Longyearbyen (Svalbard). Handling blank data, which determine the baseline of the results, are shown in grey. Samples of the error bars are shown.
The first site testing of a prototype of the SHARK in which all of the components were installed was conducted in Cardington (UK) on the 15 May 2018, but only Impactor 2 was used (see Figs. 6a and 8a). The Cardington site is an airfield, with large areas of grassy land near a main road, and the sampling was conducted during spring. In order to demonstrate the utility of the SHARK to make balloon-borne INP measurements whilst providing a comparison with a commercial ground-based sampler, the SHARK was sampling whilst suspended from a tethered balloon, flying roughly 20 m above the ground. The INP spectra (Figs. 8a and 9a) in this location are steep, increasing by 2 orders of magnitude within 2.5 ∘C, and are centred around −18 to −20 ∘C; the [INP]T for 2f and 2e increases by an order of magnitude in just ∼1 ∘C. The INPs in this location were dominated by particles greater than 2.5 µm, whereas particles between 1 and 2.5 µm made a smaller contribution and show a shallower d[INP]T∕dT, seen in Fig. 9a as a larger spread of data. We speculate that the coarse-mode INPs at this site were of biological origin, such as fungal material, pollen, or bacteria with a steep INP spectrum (Kanji et al., 2017). Some fertile and agricultural soil samples have also been shown to be very active (Hill et al., 2016; O'Sullivan et al., 2015; Steinke et al., 2016; Tobo et al., 2014), and a mechanism for emissions of soil material into the atmosphere has been proposed (Wang et al., 2016). However, the steep portion of the INP spectrum for fertile soils tends to be at temperatures above ∘C, warmer than observed in the Cardington sample. The steepness of the curve and the temperature are consistent with ice nucleation by pollen (O'Sullivan et al., 2015; Pummer et al., 2012; Tarn et al., 2018). Although the size of whole pollen grains are often larger than 10 µm, pollen is known to release nanoscale materials that nucleate ice, which might be internally mixed with aerosol in this size bin.
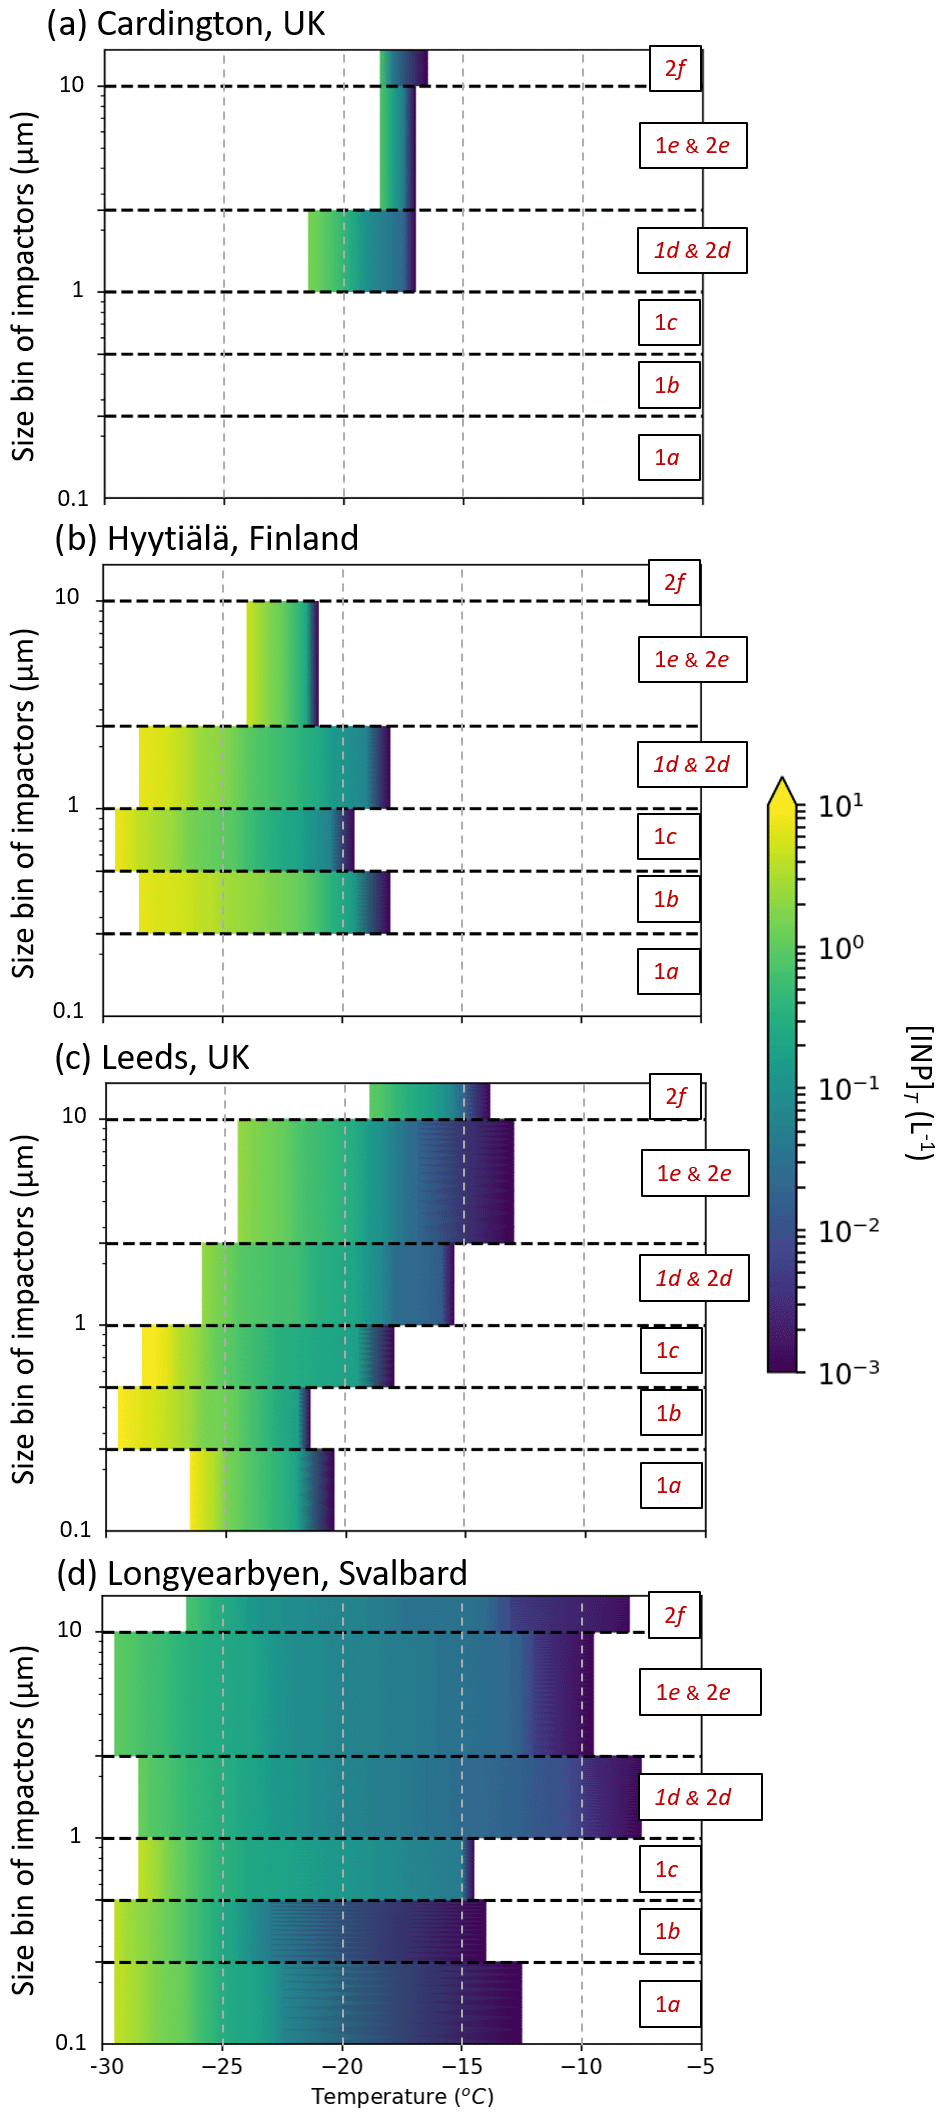
Figure 9Size-resolved ice-nucleating particle concentrations (sr[INP]T) for the four test sites: (a) Cardington (UK), (b) Hyytiälä (Finland), (c) Leeds (UK), and (d) Longyearbyen (Svalbard). The colour bars indicate the INP concentration. The dotted lines on the y axis indicate the size cuts of the impactors. The data from Fig. 8 are presented here in an alternative format, which has the advantage of more clearly and concisely displaying the features of the INP spectrum in each size bin than the plots in Fig. 8.
In Hyytiälä (Finland), a field site in the boreal forest, the INP spectra contrast quite strongly with those in Cardington (see Figs. 6b and 8b). Sampling took place on the 11 March 2018, when the Hyytiälä site was snow covered, and sampling was performed at the surface (inlet ∼150 cm above surface). In this case only Impactor 1 was used without the after-filter installed. The complex nature of the size-dependence of INP is clear here. Intriguingly, in this location, the INP concentration was greatest for the smallest stage used (1b; 0.25–0.5 µm) and accounted for the majority of the INPs between −17 and −22 ∘C. The fewest INPs came from the next smallest stage 1c (0.5–1 µm), while at temperatures below −23 ∘C, stage 1e contained the majority of the INPs. These results indicate that the INP spectra are complex and that concentrations of INPs do not always increase with increasing size as might be expected. Huffman et al. (2013) reported INP concentration measurements in a forest ecosystem, where the particles between 1.8 and 5.6 µm enhanced during rain. Hence, as in the present study, Huffman et al. (2013) showed that INP activity does not always increase with size. The highest INP concentrations in Hyytiälä were measured for aerosol sizes of 0.25–0.5 µm, and we note that these accumulation mode INPs would have lifetimes of many days to weeks in the atmosphere and could therefore be transported to locations and altitudes where they may influence clouds. Clearly, this would be an interesting location for more measurements with the full SHARK payload to gain further information on the long-term INP concentration variations and the aerosol sizes responsible for them.
The testing in Leeds (UK) used both impactors at ground level with the SHARK suspended from a frame to allow orientation into wind. The Leeds sampling was conducted within the University of Leeds campus on a patch of grass on the 7 June 2018 in close proximity to the School of Earth and Environment. In this test the full suite was deployed, including the impactors, after-filter, and OPC. The particle number, surface, and mass size distribution data for this test can be found in Figs. S5 to S7. It can be seen in Fig. 8c that generally, the larger bins contained more active INP. The only exception to this occurred with the after-filter (< 0.25 µm), which had slightly higher INP concentrations below about −25 ∘C than the next two size bins (0.25–1.0 µm). As with the measurements in Hyytiälä, clearly more measurements illuminating the contribution of the smaller particles in similar environments would be beneficial since the atmospheric lifetime of these fine particles is relatively long. We note that a substantial proportion of INPs quantified just outside of Leeds in a previous study were heat sensitive and therefore most likely of biological origin (O'Sullivan et al., 2018). In the future, conducting heat tests, as well as using mass spectrometry, SEM, and DNA analysis with the size-resolved INP samples may help to identify the INP types in the various size fractions and highlight any differences between size ranges.
The final test was in Longyearbyen (Svalbard) from the seventh deck of the icebreaker Oden, 25 m above the surface, when moored ∼200 m from the shore, overnight from 23 to 24 September 2018. The full SHARK payload was used in this case, with the OPC, both impactors, and the after-filter on Impactor 1. The particle number, surface, and mass size distribution data for this test can be found in Figs. S8 to S10. The INP spectra in this location, shown in Fig. 8d were quite distinct from the other three locations in that all size fractions contributed similarly to the INP population, and there is a very shallow slope of dln [INP]T∕dT (Fig. 9d). We detected INPs at temperatures of up to −10 ∘C with concentrations of around 0.01 INP L−1. These high-temperature INP concentrations are consistent with the summertime measurements reported at other Arctic locations, including Ny-Ålesund (Svalbard) (Wex et al., 2019). The INP in this region potentially originate from a range of sources. Tobo et al. (2019) recently reported that dust and biological material from glacial valleys in Svalbard may be an important source of INPs in the region. We also note that we sampled while the Oden was moored in the port of Longyearbyen where local pollution sources may have been significant (Zhao et al., 2019).
3.6 Ice-active surface site density, ns(T), and the activated fraction, nn(T)
The addition of size distribution information to the INP concentration spectra allowed the calculation of the number of active sites per unit surface area, ns(T), and the activated fraction, nn(T), of the size-resolved samples. These quantities are determined by weighting the srINP concentrations to the total surface area and the aerosol number in each size bin, respectively, as shown in Eqs. (2) and (3).
where As is the total surface area of the particles per droplet in a µL-NIPI droplet freezing assay. This was calculated for each impactor size range, using data from the relevant size bins of the OPC data.
where N is the total number of particles sampled by the impactor in each size bin, calculated using the number concentration in each size category as measured by the OPC and the volume of air sampled by the impactor. The size bins from the OPC which have been included in the calculations were matched to those in the impactors. The bin boundaries for the OPC calculations were within tens of nanometres of the impactor bin boundaries.
Calculating the ns(T) and nn(T) values from the INP data was only possible for some of the size ranges due to the sampling ranges of the instrumentation employed. The smallest particle diameter measured by the OPC is 0.38 µm, i.e. above the lower limit of impactor stage 1b, while the largest impactor stage, 2f (> 10 µm), has no defined upper bound. Therefore, the three bins (i.e. impactor stages) that were used to produce ns(T) and nn(T) were c (0.5–1.0 µm), d (1.0–2.5 µm), and e (2.5–10 µm). The ns(T) and nn(T) data were calculated for the field tests in Leeds and Longyearbyen; data from Cardington and Hyytiälä are not provided as the OPC was not in use at these sites.
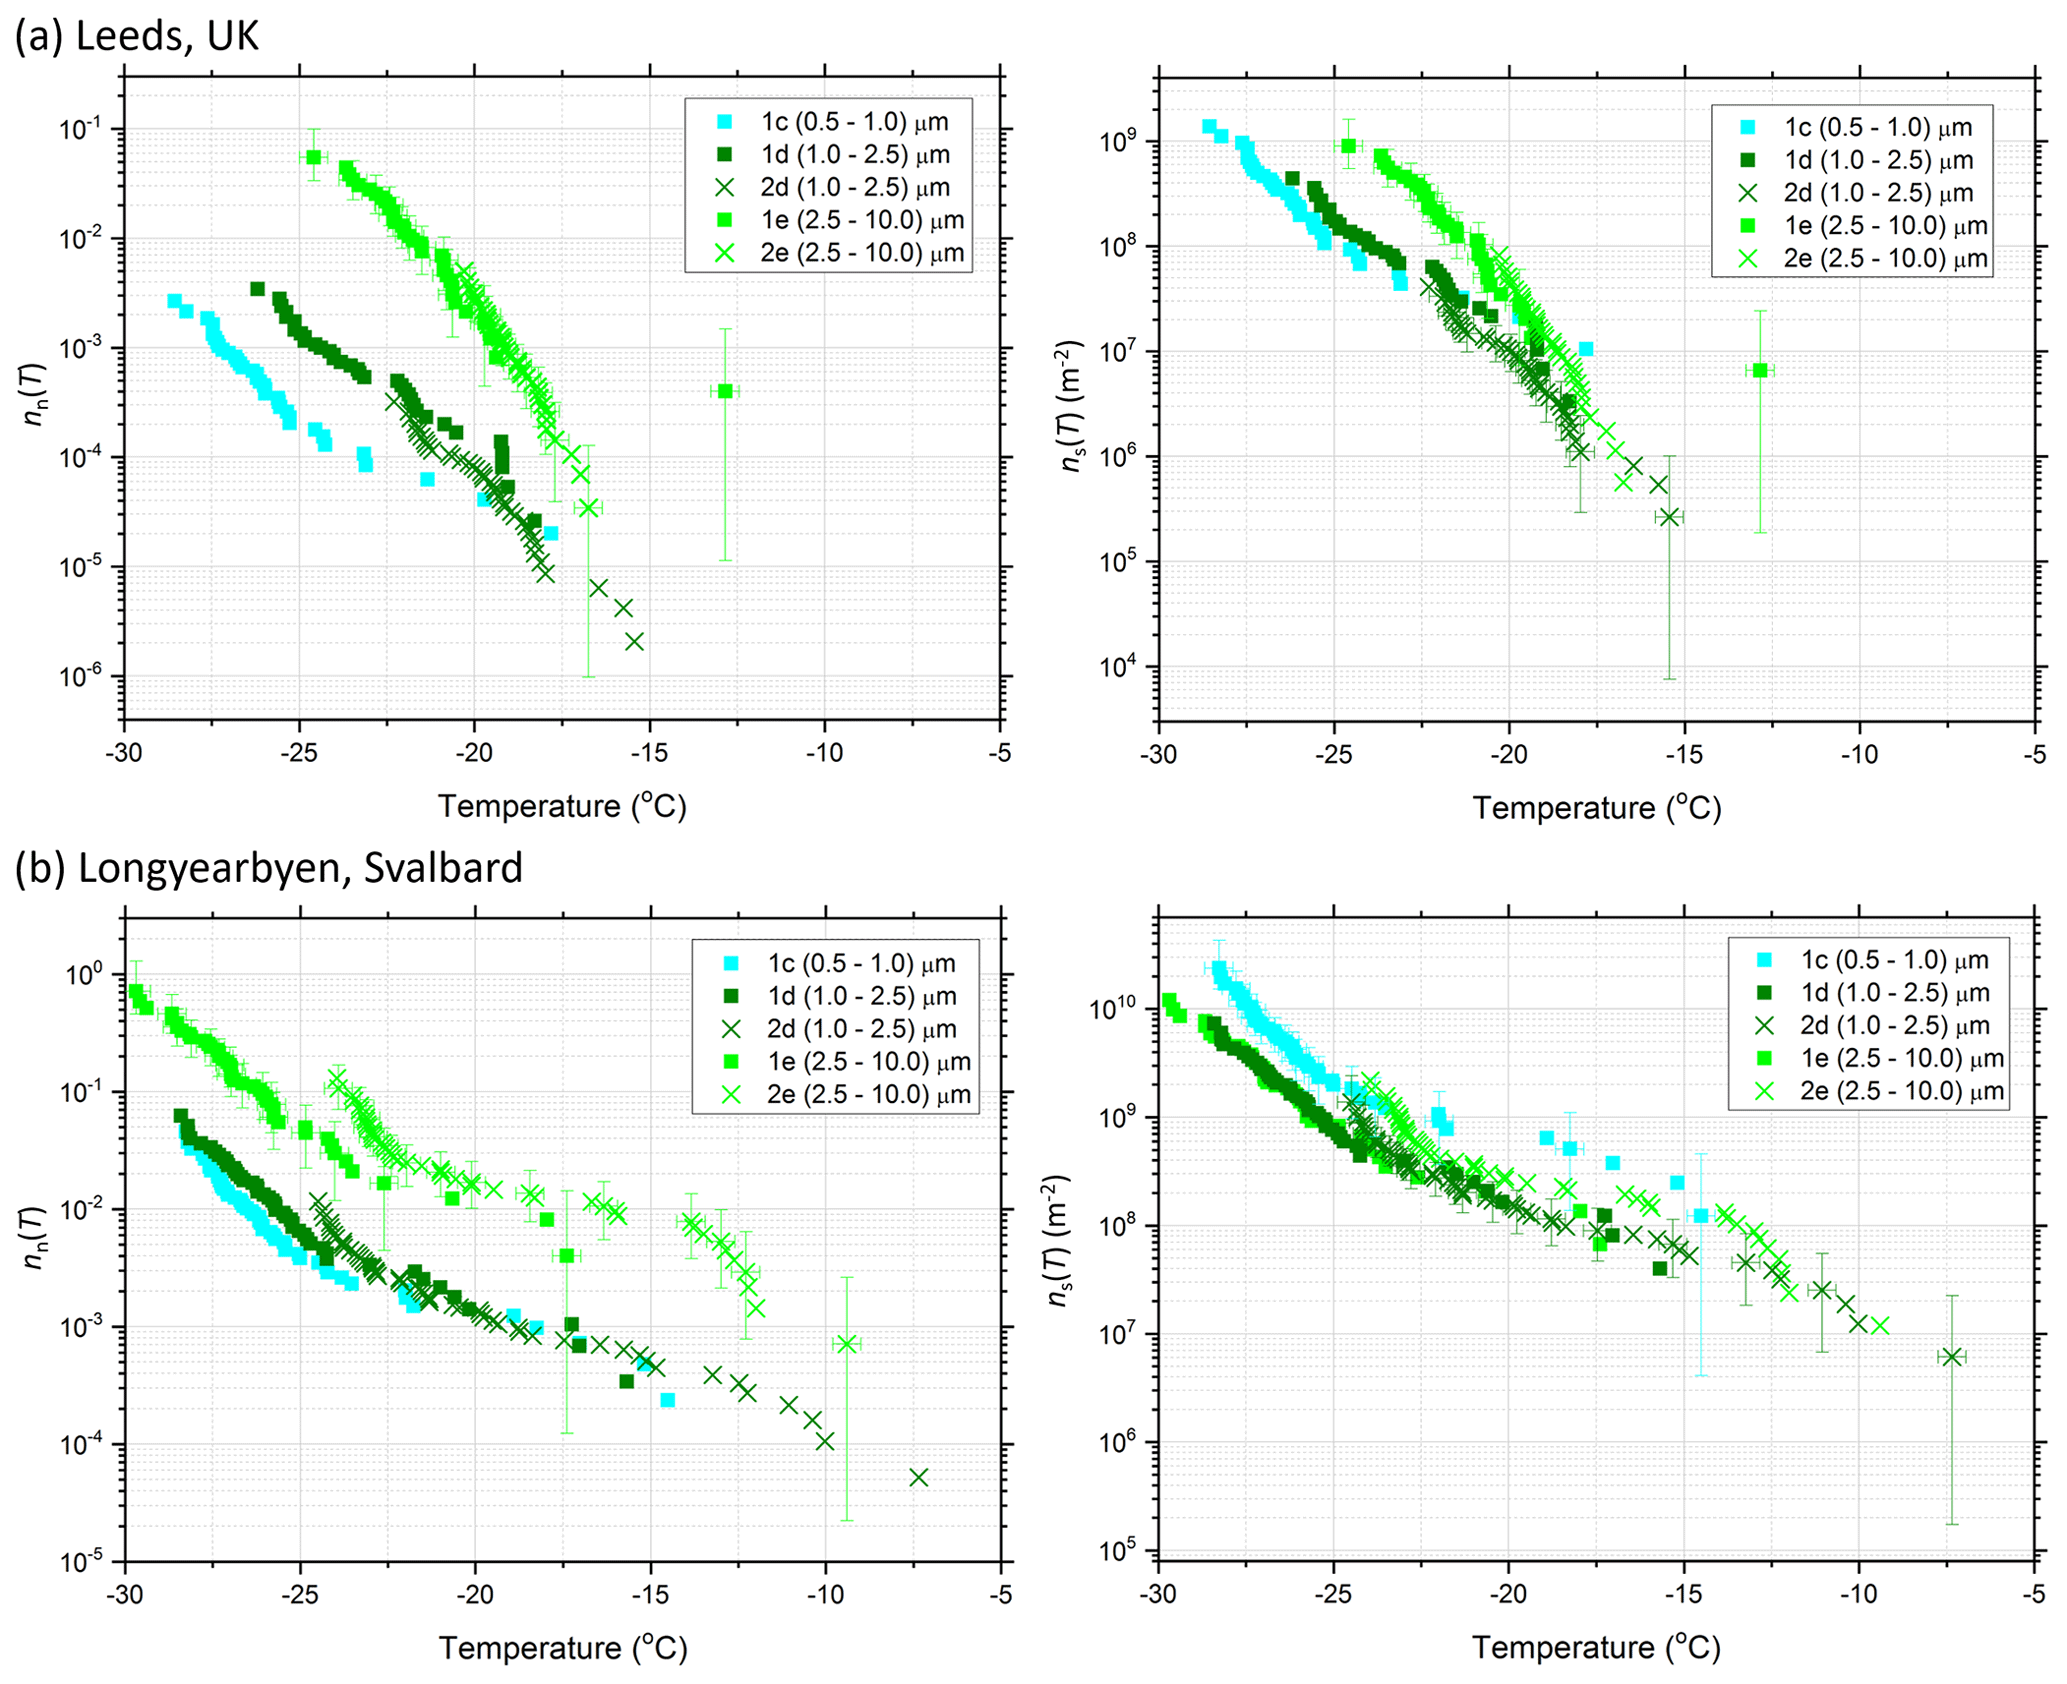
Figure 10Plots showing (left) the activated fraction of aerosol, nn(T), and (right) the number of active sites per surface area, ns(T), for samples tested from two measurement sites: (a) Leeds (UK) and (b) Longyearbyen (Svalbard). The colours of the data points indicate the size bins of each impactor, and the different symbols represent the two impactors. Samples of the error bars are shown.
The plots of activated fraction shown in Fig. 10 are addressed first. For the Leeds sample, there is a difference in the nn(T) values between bins c and e (Fig. 10a), where the smallest bin is 1–3 orders of magnitude lower than the largest bin, with the middle bin in the centre of the two. In Longyearbyen (Fig. 10b), the nn(T) for bin e is about a factor of 10 larger than bin c, but bins c and d produce very similar values of nn(T). Overall, these nn(T) plots show that the coarse-mode aerosol generally have a higher fraction of aerosol that serve as INPs than the fine mode, but there is variability in the dependence on size between the two samples. In contrast to the nn(T) values, the size-resolved ns(T) data for both Leeds and Longyearbyen show that the data from the three size categories are all within a factor of 2–10 (close to our uncertainty estimates). Given the activity of aerosol across these bins scales with surface area, this data might indicate the same INP species is active across each bin at these sites.
This paper describes a lightweight and portable payload, the SHARK, that is capable of collecting size-resolved aerosol particles alongside measurements of ambient temperature, relative humidity, pressure, GPS coordinates, aerosol number distribution, and aerosol size distribution. The 9 kg payload was designed for use on a tethered balloon for measurements at user-selected altitudes for up to 11 h via radio-controlled instrumentation but can be used wherever it can be suspended. During a SHARK flight, the atmospheric conditions the SHARK experiences can be monitored in real time via a radiosonde, and sampling is controlled remotely, allowing the SHARK to be held at a user-defined height and to only sample under specific conditions (for instance above the surface boundary layer).
The SHARK samples aerosol onto filter/film substrates using two cascade impactors to allow aerosol size-segregation from 0.25 to 10 µm, with an after-filter and top stage to collect particles below and above this range. One impactor samples at 9 L min−1, while the other samples at 100 L min−1. The filters were collected here for the offline analysis of INP concentrations and properties, but they could equally be used for other analyses such as mass spectrometry, DNA analysis, SEM, TEM, and ion chromatography. A comparison of ambient INP concentrations measured using the SHARK to those measured using PM10 and PM2.5 aerosol samplers at ground level demonstrated excellent agreement between the instruments. Field testing was conducted in four locations close to ground level and suspended on a tethered balloon at 20 m to demonstrate the capabilities of the SHARK.
The size-resolved INP concentration spectra reveal complex behaviour. For example, in Hyytiälä the 0.25–0.5 µm aerosol size fraction had the most active INP, whereas in Leeds the INP concentration generally decreased with decreasing particle size. Ambient aerosol size distribution measured using the onboard OPC allowed the calculation of the activated fraction, nn(T), and ice-active surface site density, ns(T), data for the sampled INPs in the tests at Leeds and Longyearbyen. It was shown that ns(T) was consistent between 0.5 and 10 µm in these two locations at the times of sampling. It is the intention to make similar measurements in other locations and at higher altitudes in the future.
Generally, it is expected that larger aerosols are more likely to nucleate ice (Pruppacher and Klett, 1997), and our results are consistent with other size-resolved INP measurements which indicate that the size distribution of INP varies spatially and temporarily e.g. (Mason et al., 2016; Si et al., 2018). Quantifying the size of INP, possibly in conjunction with other analytical techniques, is a useful means of identifying different INP types and their sources (Huffman et al., 2013). In addition, knowledge of their size will allow the improved representation of INP in global aerosol models where size is key determinant of lifetime and transport (Atkinson et al., 2013; Perlwitz et al., 2015; Vergara-Temprado et al., 2017). Clearly, more systematic and widespread measurements of INP size are needed in the future in a range of target locations.
The high sample flow rate, choice of low-contamination aerosol collection substrates, and long sampling durations mean that the payload is well suited for INP measurements, including those in low-aerosol environments and locations with relatively low INP concentrations (down to below ∼0.01 INP L−1 and at temperatures down to about −25 ∘C and below). The SHARK is an accessible tool for quantifying size-resolved atmospheric INP concentrations from a tethered balloon. This will allow improved determination of INP sizes, properties, and sources, towards ultimately improving model representations of atmospheric INP distributions.
The datasets for this paper are available at https://doi.org/10.5518/744 (Porter et al., 2020).
The supplement related to this article is available online at: https://doi.org/10.5194/amt-13-2905-2020-supplement.
GCEP led the development of the SHARK, performed the bulk of the experiments, and led the writing of the paper. The initial instrument concept was conceived by GCEP, SNFS, and BJM with advice from IMB. The building and testing of the SHARK and its electrical components was done by SNFS with the assistance of GCEP. The collection and analysis of field samples were performed by GCEP, MPA, UP, ADH, MDT, and IMB. All authors contributed to the writing of this paper. BJM oversaw this project as part of his MarineIce ERC fellowship.
The authors declare that they have no conflict of interest.
The personnel of Hyytiälä forestry station, the HyIce project team, the Cardington meteorological research unit, and those aboard the icebreaker Oden during 2018 are sincerely thanked for support during field testing. One of the field tests was completed as part of the Arctic Ocean (AO) 2018 expedition. The Swedish Polar Research Secretariat (SPRS) provided access to the icebreaker Oden and logistical support in collaboration with the US National Science Foundation. We are grateful to the Chief Scientists Caroline Leck and Patricia Matrai for planning and coordination of AO2018, as well as to the SPRS logistical staff and icebreaker Oden's Captain Mattias Peterson and his crew for expert field support. Anthony Windross and Stephen Burgess are thanked for help with the fabrication of the SHARK housing.
The authors thank the European Research Council for funding (H2020 ERC; 648661 MarineIce) and the Natural Environment Research Council (NERC; NE/M010473/1 and NE/R009686/1). We are grateful to the EU H2020 ACTRIS-2 for a mobility grant to access the Hyytiälä forestry station as part of the HyIce project (SMR7 RP3 HyICE18, 654109).
This paper was edited by Mingjin Tang and reviewed by two anonymous referees.
Armstrong, J. A., Russell, P. A., Sparks, L. E., and Drehmel, D. C.: Tethered Balloon Sampling Systems for Monitoring Air Pollution, J. Air Pollut. Control Assoc., 31, 735–743, https://doi.org/10.1080/00022470.1981.10465268, 1981.
Atkinson, J. D., Murray, B. J., Woodhouse, M. T., Whale, T. F., Baustian, K. J., Carslaw, K. S., Dobbie, S., O'Sullivan, D., and Malkin, T. L.: The importance of feldspar for ice nucleation by mineral dust in mixed-phase clouds, Nature, 498, 355–358, https://doi.org/10.1038/nature12278, 2013.
Ault, A. P. and Axson, J. L.: Atmospheric Aerosol Chemistry: Spectroscopic and Microscopic Advances, Anal. Chem., 89, 430–452, https://doi.org/10.1021/acs.analchem.6b04670, 2017.
Balsley, B. B., Jensen, M. L., and Frehlich, R. G.: The use of state-of-the-art kites for profiling the lower atmosphere, Bound.-Lay. Meteorol., 87, 1–25, https://doi.org/10.1023/A:1000812511429, 1998.
Berezinski, N. A., Stepanov, G. V., and Khorguani, V. G.: Ice-forming activity of atmospheric aerosol particles of different sizes, Atmos. Aerosols Nucleation, 309, 709–712, https://doi.org/10.1007/3-540-50108-8_1167, 1988.
Cheng, Y.-S. and Yeh, H.-C.: Particle bounce in cascade impactors, Environ. Sci. Technol., 13, 1392–1396, https://doi.org/10.1021/es60159a017, 1979.
Conen, F., Rodríguez, S., Hülin, C., Henne, S., Herrmann, E., Bukowiecki, N., and Alewell, C.: Atmospheric ice nuclei at the high-altitude observatory Jungfraujoch, Chem. Phys. Meteorol., 67, 25014, https://doi.org/10.3402/tellusb.v67.25014, 2015.
Creamean, J. M., Primm, K. M., Tolbert, M. A., Hall, E. G., Wendell, J., Jordan, A., Sheridan, P. J., Smith, J., and Schnell, R. C.: HOVERCAT: a novel aerial system for evaluation of aerosol–cloud interactions, Atmos. Meas. Tech., 11, 3969–3985, https://doi.org/10.5194/amt-11-3969-2018, 2018a.
Creamean, J. M., Kirpes, R. M., Pratt, K. A., Spada, N. J., Maahn, M., de Boer, G., Schnell, R. C., and China, S.: Marine and terrestrial influences on ice nucleating particles during continuous springtime measurements in an Arctic oilfield location, Atmos. Chem. Phys., 18, 18023–18042, https://doi.org/10.5194/acp-18-18023-2018, 2018b.
DeMott, P. J., Prenni, A. J., Liu, X., Kreidenweis, S. M., Petters, M. D., Twohy, C. H., Richardson, M. S., Eidhammer, T., and Rogers, D. C.: Predicting global atmospheric ice nuclei distributions and their impacts on climate, P. Natl. Acad. Sci. USA, 107, 11217–11222, https://doi.org/10.1073/pnas.0910818107, 2010.
DeMott, P. J., Prenni, A. J., McMeeking, G. R., Sullivan, R. C., Petters, M. D., Tobo, Y., Niemand, M., Möhler, O., Snider, J. R., Wang, Z., and Kreidenweis, S. M.: Integrating laboratory and field data to quantify the immersion freezing ice nucleation activity of mineral dust particles, Atmos. Chem. Phys., 15, 393–409, https://doi.org/10.5194/acp-15-393-2015, 2015.
DeMott, P. J., Hill, T. C. J., McCluskey, C. S., Prather, K. A., Collins, D. B., Sullivan, R. C., Ruppel, M. J., Mason, R. H., Irish, V. E., Lee, T., Hwang, C. Y., Rhee, T. S., Snider, J. R., McMeeking, G. R., Dhaniyala, S., Lewis, E. R., Wentzell, J. J. B., Abbatt, J., Lee, C., Sultana, C. M., Ault, A. P., Axson, J. L., Diaz Martinez, M., Venero, I., Santos-Figueroa, G., Stokes, M. D., Deane, G. B., Mayol-Bracero, O. L., Grassian, V. H., Bertram, T. H., Bertram, A. K., Moffett, B. F., and Franc, G. D.: Sea spray aerosol as a unique source of ice nucleating particles, P. Natl. Acad. Sci. USA, 113, 5797–5803, https://doi.org/10.1073/pnas.1514034112, 2016.
DeMott, P. J., Hill, T. C. J., Petters, M. D., Bertram, A. K., Tobo, Y., Mason, R. H., Suski, K. J., McCluskey, C. S., Levin, E. J. T., Schill, G. P., Boose, Y., Rauker, A. M., Miller, A. J., Zaragoza, J., Rocci, K., Rothfuss, N. E., Taylor, H. P., Hader, J. D., Chou, C., Huffman, J. A., Pöschl, U., Prenni, A. J., and Kreidenweis, S. M.: Comparative measurements of ambient atmospheric concentrations of ice nucleating particles using multiple immersion freezing methods and a continuous flow diffusion chamber, Atmos. Chem. Phys., 17, 11227–11245, https://doi.org/10.5194/acp-17-11227-2017, 2017.
Deng, X., Xue, H., and Meng, Z.: The effect of ice nuclei on a deep convective cloud in South China, Atmos. Res., 206, 1–12, https://doi.org/10.1016/j.atmosres.2018.02.013, 2018.
Dzubay, T. G., Hines, L. E., and Stevens, R. K.: Particle bounce errors in cascade impactors, Atmos. Environ., 10, 229–234, https://doi.org/10.1016/0004-6981(76)90095-0, 1976.
Freud, E., Krejci, R., Tunved, P., Leaitch, R., Nguyen, Q. T., Massling, A., Skov, H., and Barrie, L.: Pan-Arctic aerosol number size distributions: seasonality and transport patterns, Atmos. Chem. Phys., 17, 8101–8128, https://doi.org/10.5194/acp-17-8101-2017, 2017.
Garcia, E., Hill, T. C. J., Prenni, A. J., DeMott, P. J., Franc, G. D., and Kreidenweis, S. M.: Biogenic ice nuclei in boundary layer air over two U.S. High Plains agricultural regions, J. Geophys. Res.-Atmos., 117, D18209, https://doi.org/10.1029/2012JD018343, 2012.
Hara, K., Osada, K., and Yamanouchi, T.: Tethered balloon-borne aerosol measurements: seasonal and vertical variations of aerosol constituents over Syowa Station, Antarctica, Atmos. Chem. Phys., 13, 9119–9139, https://doi.org/10.5194/acp-13-9119-2013, 2013.
Harrison, A. D., Whale, T. F., Rutledge, R., Lamb, S., Tarn, M. D., Porter, G. C. E., Adams, M. P., McQuaid, J. B., Morris, G. J., and Murray, B. J.: An instrument for quantifying heterogeneous ice nucleation in multiwell plates using infrared emissions to detect freezing, Atmos. Meas. Tech., 11, 5629–5641, https://doi.org/10.5194/amt-11-5629-2018, 2018.
Hegg, D. A., Hobbs, P. V, Gassó, S., Nance, J. D., and Rangno, A. L.: Aerosol measurements in the Arctic relevant to direct and indirect radiative forcing, J. Geophys. Res.-Atmos., 101, 23349–23363, https://doi.org/10.1029/96jd02246, 1996.
Herbert, R. J., Murray, B. J., Dobbie, S. J., and Koop, T.: Sensitivity of liquid clouds to homogenous freezing parameterizations, Geophys. Res. Lett., 42, 1599–1605, https://doi.org/10.1002/2014GL062729, 2015.
Hill, T. C. J., DeMott, P. J., Tobo, Y., Fröhlich-Nowoisky, J., Moffett, B. F., Franc, G. D., and Kreidenweis, S. M.: Sources of organic ice nucleating particles in soils, Atmos. Chem. Phys., 16, 7195–7211, https://doi.org/10.5194/acp-16-7195-2016, 2016.
Huffman, J. A., Prenni, A. J., DeMott, P. J., Pöhlker, C., Mason, R. H., Robinson, N. H., Fröhlich-Nowoisky, J., Tobo, Y., Després, V. R., Garcia, E., Gochis, D. J., Harris, E., Müller-Germann, I., Ruzene, C., Schmer, B., Sinha, B., Day, D. A., Andreae, M. O., Jimenez, J. L., Gallagher, M., Kreidenweis, S. M., Bertram, A. K., and Pöschl, U.: High concentrations of biological aerosol particles and ice nuclei during and after rain, Atmos. Chem. Phys., 13, 6151–6164, https://doi.org/10.5194/acp-13-6151-2013, 2013.
Jacob, J., Chilson, P., Houston, A., Smith, S., Jacob, J. D., Chilson, P. B., Houston, A. L., and Smith, S. W.: Considerations for Atmospheric Measurements with Small Unmanned Aircraft Systems, Atmosphere, 9, 252, https://doi.org/10.3390/atmos9070252, 2018.
Jaenicke, R.: Aerosol Physics and Chemistry, in: Landolt-Börnstein Numerical Data and Functional Relationships in Science and Technology New Series Group V: Geophysics and Space Research Volume 4 Meteorology Subvolume b, edited by: Fischer, G., Physical and Chemical Properties of the Air, 2007.
Kanitz, T., Seifert, P., Ansmann, A., Engelmann, R., Althausen, D., Casiccia, C., and Rohwer, E. G.: Contrasting the impact of aerosols at northern and southern midlatitudes on heterogeneous ice formation, Geophys. Res. Lett., 38, L17802, https://doi.org/10.1029/2011GL048532, 2011.
Kanji, Z. A., Ladino, L. A., Wex, H., Boose, Y., Burkert-Kohn, M., Cziczo, D. J., and Krämer, M.: Overview of Ice Nucleating Particles, Meteorol. Monogr., 58, 1.1–1.33, https://doi.org/10.1175/AMSMONOGRAPHS-D-16-0006.1, 2017.
Lacher, L., Steinbacher, M., Bukowiecki, N., Herrmann, E., Zipori, A., and Kanji, Z. A.: Impact of air mass conditions and aerosol properties on ice nucleating particle concentrations at the High Altitude Research Station Jungfraujoch, Atmosphere, 9, 363, https://doi.org/10.3390/atmos9090363, 2018.
Laskin, J., Laskin, A., and Nizkorodov, S. A.: Mass Spectrometry Analysis in Atmospheric Chemistry, Anal. Chem., 90, 166–189, https://doi.org/10.1021/acs.analchem.7b04249, 2018.
Lindsley, W. G.: Filter Pore Size and Aerosol Sample Collection, in: NIOSH Manual of Analytical Methods, 1–14, available at: https://www.cdc.gov/niosh/docs/2014-151/pdfs/chapters/chapter-fp.pdf (last access: 30 July 2018), 2016.
Lohmann, U.: Anthropogenic Aerosol Influences on Mixed-Phase Clouds, Curr. Clim. Chang. Reports, 3, 32–44, https://doi.org/10.1007/s40641-017-0059-9, 2017.
Marple, V. A., Rubow, K. L., and Behm, S. M.: A microorifice uniform deposit impactor (moudi): Description, calibration, and use, Aerosol Sci. Technol., 14, 434–436, https://doi.org/10.1080/02786829108959504, 1991.
Mason, R. H., Si, M., Chou, C., Irish, V. E., Dickie, R., Elizondo, P., Wong, R., Brintnell, M., Elsasser, M., Lassar, W. M., Pierce, K. M., Leaitch, W. R., MacDonald, A. M., Platt, A., Toom-Sauntry, D., Sarda-Estève, R., Schiller, C. L., Suski, K. J., Hill, T. C. J., Abbatt, J. P. D., Huffman, J. A., DeMott, P. J., and Bertram, A. K.: Size-resolved measurements of ice-nucleating particles at six locations in North America and one in Europe, Atmos. Chem. Phys., 16, 1637–1651, https://doi.org/10.5194/acp-16-1637-2016, 2016.
McCluskey, C. S., Hill, T. C. J., Malfatti, F., Sultana, C. M., Lee, C., Santander, M. V, Beall, C. M., Moore, K. A., Cornwell, G. C., Collins, D. B., Prather, K. A., Jayarathne, T., Stone, E. A., Azam, F., Kreidenweis, S. M., and DeMott, P. J.: A dynamic link between ice nucleating particles released in nascent sea spray aerosol and oceanic biological activity during two mesocosm experiments, J. Atmos. Sci., 74, 151–166, https://doi.org/10.1175/JAS-D-16-0087.1, 2016.
Misra, C., Singh, M., Shen, S., Sioutas, C., and Hall, P. M.: Development and evaluation of a personal cascade impactor sampler (PCIS), Aerosol Sci., 33, 1027–1047, https://doi.org/10.1016/S0021-8502(02)00055-1, 2002.
Murray, B. J.: Cracking the problem of ice nucleation, Science, 355, 346–347, https://doi.org/10.1126/science.aam5320, 2017.
Murray, B. J., O'Sullivan, D., Atkinson, J. D., and Webb, M. E.: Ice nucleation by particles immersed in supercooled cloud droplets, Chem. Soc. Rev., 41, 6519, https://doi.org/10.1039/c2cs35200a, 2012.
O'Sullivan, D., Murray, B. J., Ross, J. F., Whale, T. F., Price, H. C., Atkinson, J. D., Umo, N. S., and Webb, M. E.: The relevance of nanoscale biological fragments for ice nucleation in clouds, Sci. Rep.-UK, 5, 8082, https://doi.org/10.1038/srep08082, 2015.
O'Sullivan, D., Adams, M. P., Tarn, M. D., Harrison, A. D., Vergara-Temprado, J., Porter, G. C. E., Holden, M. A., Sanchez-Marroquin, A., Carotenuto, F., Whale, T. F., McQuaid, J. B., Walshaw, R., Hedges, D. H. P., Burke, I. T., Cui, Z., and Murray, B. J.: Contributions of biogenic material to the atmospheric ice-nucleating particle population in North Western Europe, Sci. Rep.-UK, 8, 13821, https://doi.org/10.1038/s41598-018-31981-7, 2018.
Perlwitz, J. P., Pérez García-Pando, C., and Miller, R. L.: Predicting the mineral composition of dust aerosols – Part 1: Representing key processes, Atmos. Chem. Phys., 15, 11593–11627, https://doi.org/10.5194/acp-15-11593-2015, 2015.
Porter, G. C. E., Sikora, Se. N. F., Adams, M. P., Proske, U., Harrison, A. D., Tarn, M. D., Brooks, I. M., and Murray, B. J.: Data for “Resolving the size of ice-nucleating particles with a balloon deployable aerosol sampler: the SHARK”, University of Leeds [Dataset], https://doi.org/10.5518/744, 2020.
Price, H. C., Baustian, K. J., McQuaid, J. B., Blyth, A., Bower, K. N., Choularton, T., Cotton, R. J., Cui, Z., Field, P. R., Gallagher, M., Hawker, R., Merrington, A., Miltenberger, A., Neely, R. R., Parker, S. T., Rosenberg, P. D., Taylor, J. W., Trembath, J., Vergara-Temprado, J., Whale, T. F., Wilson, T. W., Young, G., and Murray, B. J.: Atmospheric Ice-Nucleating Particles in the Dusty Tropical Atlantic, J. Geophys. Res.-Atmos., 123, 2175–2193, https://doi.org/10.1002/2017JD027560, 2018.
Product Information Sheet – MSP: Models 128, 129, 130 and 131–High Flow Impactors (HFI), available at: http://www.mspcorp.com/resources/msp-pi-130-revb-us-high-flow-impactors-hfi-128-129-130-131.pdf, last access: 3 October 2019.
Pruppacher, H. R. and Klett, J. D.: Microphysics of Clouds and Precipitation, 2nd Edition, Kluwer Academic Publishers, Dordrecht, 1997.
Pummer, B. G., Bauer, H., Bernardi, J., Bleicher, S., and Grothe, H.: Suspendable macromolecules are responsible for ice nucleation activity of birch and conifer pollen, Atmos. Chem. Phys., 12, 2541–2550, https://doi.org/10.5194/acp-12-2541-2012, 2012.
Rader, D. J. and Marple, V. A.: Effect of Ultra-Stokesian Drag and Particle Interception on Impaction Characteristics, Aerosol Sci. Technol., 4, 141–156, https://doi.org/10.1080/02786828508959044, 1985.
Reagan, J. A., Apte, M. V., Bruhns, T. V., and Youngbluth, O.: Lidar and Balloon-Borne Cascade Impactor Measurements of Aerosols: A Case Study, Aerosol Sci. Technol., 3, 259–275, https://doi.org/10.1080/02786828408959014, 1984.
Reicher, N., Segev, L., and Rudich, Y.: The WeIzmann Supercooled Droplets Observation on a Microarray (WISDOM) and application for ambient dust, Atmos. Meas. Tech., 11, 233–248, https://doi.org/10.5194/amt-11-233-2018, 2018.
Reicher, N., Budke, C., Eickhoff, L., Raveh-Rubin, S., Kaplan-Ashiri, I., Koop, T., and Rudich, Y.: Size-dependent ice nucleation by airborne particles during dust events in the eastern Mediterranean, Atmos. Chem. Phys., 19, 11143–11158, https://doi.org/10.5194/acp-19-11143-2019, 2019.
Rogers, D. C., Demott, P. J., and Kreidenweis, S. M.: Airborne measurements of tropospheric ice-nucleating aerosol particles in the Arctic spring, J. Geophys. Res., 106, 15053–15063, https://doi.org/10.1029/2000JD900790, 2001.
Rosenfeld, D., Yu, X., Liu, G., Xu, X., Zhu, Y., Yue, Z., Dai, J., Dong, Z., Dong, Y., and Peng, Y.: Glaciation temperatures of convective clouds ingesting desert dust, air pollution and smoke from forest fires, Geophys. Res. Lett., 38, L21804, https://doi.org/10.1029/2011GL049423, 2011.
Santachiara, G., Di Matteo, L., Prodi, F., and Belosi, F.: Atmospheric particles acting as Ice Forming Nuclei in different size ranges, Atmos. Res., 96, 266–272, https://doi.org/10.1016/j.atmosres.2009.08.004, 2010.
Šantl-Temkiv, T., Lange, R., Beddows, D., Rauter, U., Pilgaard, S., Dall'osto, M., Gunde-Cimerman, N., Massling, A., and Wex, H.: Biogenic Sources of Ice Nucleating Particles at the High Arctic Site Villum Research Station, Environ. Sci. Technol., 53, 10580–10590, https://doi.org/10.1021/acs.est.9b00991, 2019.
Seinfeld, J. H. and Pandis, S. N.: Atmospheric chemistry and physics: from air pollution to climate change, Third edition, available at: https://www.worldcat.org/title/atmospheric-chemistry-and-physics-from (last access: 5 July 2019), 2016.
Si, M., Irish, V. E., Mason, R. H., Vergara-Temprado, J., Hanna, S. J., Ladino, L. A., Yakobi-Hancock, J. D., Schiller, C. L., Wentzell, J. J. B., Abbatt, J. P. D., Carslaw, K. S., Murray, B. J., and Bertram, A. K.: Ice-nucleating ability of aerosol particles and possible sources at three coastal marine sites, Atmos. Chem. Phys., 18, 15669–15685, https://doi.org/10.5194/acp-18-15669-2018, 2018.
SKC: Leland Legacy Sample Pump: Operating Instructions, (Form 40075 Rev 1910) available at: https://www.skcinc.com/catalog/pdf/instructions/40075.pdf, last access: 25 February 2020.
Soo, J. C., Monaghan, K., Lee, T., Kashon, M., and Harper, M.: Air sampling filtration media: Collection efficiency for respirable size-selective sampling, Aerosol Sci. Technol., 50, 76–87, https://doi.org/10.1080/02786826.2015.1128525, 2016.
Steinke, I., Funk, R., Busse, J., Iturri, A., Kirchen, S., Leue, M., Möhler, O., Schwartz, T., Schnaiter, M., Sierau, B., Toprak, E., Ullrich, R., Ulrich, A., Hoose, C., and Leisner, T.: Ice nucleation activity of agricultural soil dust aerosols from Mongolia, Argentina, and Germany, J. Geophys. Res.-Atmos., 121, 559–576, https://doi.org/10.1002/2016JD025160, 2016.
Storelvmo, T.: Aerosol Effects on Climate via Mixed-Phase and Ice Clouds, Annu. Rev. Earth Pl. Sc., 45, 199–222, https://doi.org/10.1146/annurev-earth-060115-012240, 2017.
Tarn, M. D., Sikora, S. N. F., Porter, G. C. E., O'Sullivan, D., Adams, M., Whale, T. F., Harrison, A. D., Vergara-Temprado, J., Wilson, T. W., Shim, J., and Murray, B. J.: The study of atmospheric ice-nucleating particles via microfluidically generated droplets, Microfluid. Nanofluid., 22, 52, https://doi.org/10.1007/s10404-018-2069-x, 2018.
Tobo, Y., Prenni, A. J., Demott, P. J., Huffman, J. A., McCluskey, C. S., Tian, G., Pöhlker, C., Pöschl, U., and Kreidenweis, S. M.: Biological aerosol particles as a key determinant of ice nuclei populations in a forest ecosystem, J. Geophys. Res.-Atmos., 118, 10100–10110, https://doi.org/10.1002/jgrd.50801, 2013.
Tobo, Y., DeMott, P. J., Hill, T. C. J., Prenni, A. J., Swoboda-Colberg, N. G., Franc, G. D., and Kreidenweis, S. M.: Organic matter matters for ice nuclei of agricultural soil origin, Atmos. Chem. Phys., 14, 8521–8531, https://doi.org/10.5194/acp-14-8521-2014, 2014.
Tobo, Y., Adachi, K., Demott, P. J., Hill, T. C. J., Hamilton, D. S., Mahowald, N. M., Nagatsuka, N., Ohata, S., Uetake, J., Kondo, Y., and Koike, M.: Glacially sourced dust as a potentially significant source of ice nucleating particles, Nat. Geosci., 12, 253–258, https://doi.org/10.1038/s41561-019-0314-x, 2019.
Vali, G.: Quantitative Evaluation of Experimental Results an the Heterogeneous Freezing Nucleation of Supercooled Liquids, J. Atmos. Sci., 28, 402–409, https://doi.org/10.1175/1520-0469(1971)028<0402:qeoera>2.0.co;2, 1971.
Vergara-Temprado, J., Murray, B. J., Wilson, T. W., O'Sullivan, D., Browse, J., Pringle, K. J., Ardon-Dryer, K., Bertram, A. K., Burrows, S. M., Ceburnis, D., DeMott, P. J., Mason, R. H., O'Dowd, C. D., Rinaldi, M., and Carslaw, K. S.: Contribution of feldspar and marine organic aerosols to global ice nucleating particle concentrations, Atmos. Chem. Phys., 17, 3637–3658, https://doi.org/10.5194/acp-17-3637-2017, 2017.
Vergara-Temprado, J., Miltenberger, A. K., Furtado, K., Grosvenor, D. P., Shipway, B. J., Hill, A. A., Wilkinson, J. M., Field, P. R., Murray, B. J., and Carslaw, K. S.: Strong control of Southern Ocean cloud reflectivity by ice-nucleating particles, P. Natl. Acad. Sci. USA, 115, 201721627, https://doi.org/10.1073/pnas.1721627115, 2018.
Villa, T., Salimi, F., Morton, K., Morawska, L., and Gonzalez, F.: Development and Validation of a UAV Based System for Air Pollution Measurements, Sensors, 16, 2202, https://doi.org/10.3390/s16122202, 2016.
von der Weiden, S.-L., Drewnick, F., and Borrmann, S.: Particle Loss Calculator – a new software tool for the assessment of the performance of aerosol inlet systems, Atmos. Meas. Tech., 2, 479–494, https://doi.org/10.5194/amt-2-479-2009, 2009.
Wang, B., Harder, T. H., Kelly, S. T., Piens, D. S., China, S., Kovarik, L., Keiluweit, M., Arey, B. W., Gilles, M. K., and Laskin, A.: Airborne soil organic particles generated by precipitation, Nat. Geosci., 9, 433–437, https://doi.org/10.1038/ngeo2705, 2016.
Welti, A., Lüönd, F., Stetzer, O., and Lohmann, U.: Influence of particle size on the ice nucleating ability of mineral dusts, Atmos. Chem. Phys., 9, 6705–6715, https://doi.org/10.5194/acp-9-6705-2009, 2009.
Wex, H., Huang, L., Zhang, W., Hung, H., Traversi, R., Becagli, S., Sheesley, R. J., Moffett, C. E., Barrett, T. E., Bossi, R., Skov, H., Hünerbein, A., Lubitz, J., Löffler, M., Linke, O., Hartmann, M., Herenz, P., and Stratmann, F.: Annual variability of ice-nucleating particle concentrations at different Arctic locations, Atmos. Chem. Phys., 19, 5293–5311, https://doi.org/10.5194/acp-19-5293-2019, 2019.
Whale, T. F., Murray, B. J., O'Sullivan, D., Wilson, T. W., Umo, N. S., Baustian, K. J., Atkinson, J. D., Workneh, D. A., and Morris, G. J.: A technique for quantifying heterogeneous ice nucleation in microlitre supercooled water droplets, Atmos. Meas. Tech., 8, 2437–2447, https://doi.org/10.5194/amt-8-2437-2015, 2015.
Zhao, B., Wang, Y., Gu, Y., Liou, K.-N., Jiang, J. H., Fan, J., Liu, X., Huang, L., and Yung, Y. L.: Ice nucleation by aerosols from anthropogenic pollution, Nat. Geosci., 12, 602–607, https://doi.org/10.1038/s41561-019-0389-4, 2019.