the Creative Commons Attribution 4.0 License.
the Creative Commons Attribution 4.0 License.
 | 30 Jun 2020
Using global reanalysis data to quantify and correct airflow distortion bias in shipborne wind speed measurements
Sebastian Landwehr
Iris Thurnherr
Nicolas Cassar
Martin Gysel-Beer
At sea, wind forcing is responsible for the formation and development of surface waves and represents an important source of near-surface turbulence. Therefore, processes related to near-surface turbulence and wave breaking, such as sea spray emission and air–sea gas exchange, are often parameterised with wind speed. Thus, shipborne wind speed measurements provide highly relevant observations. They can, however, be compromised by flow distortion due to the ship's structure and objects near the anemometer that modify the airflow, leading to a deflection of the apparent wind direction and positive or negative acceleration of the apparent wind speed. The resulting errors in the estimated true wind speed can be greatly magnified at low wind speeds. For some research ships, correction factors have been derived from computational fluid dynamic models or through direct comparison with wind speed measurements from buoys. These correction factors can, however, lose their validity due to changes in the structures near the anemometer and, thus, require frequent re-evaluation, which is costly in either computational power or ship time. Here, we evaluate if global atmospheric reanalysis data can be used to quantify the flow distortion bias in shipborne wind speed measurements. The method is tested on data from the Antarctic Circumnavigation Expedition onboard the R/V Akademik Tryoshnikov, which are compared to ERA-5 reanalysis wind speeds. We find that, depending on the relative wind direction, the relative wind speed and direction measurements are biased by −37 % to +22 % and to respectively. The resulting error in the true wind speed is +11.5 % on average but ranges from −4 % to +41 % (5th and 95th percentile). After applying the bias correction, the uncertainty in the true wind speed is reduced to ±5 % and depends mainly on the average accuracy of the ERA-5 data over the period of the experiment. The obvious drawback of this approach is the potential intrusion of model biases in the correction factors. We show that this problem can be somewhat mitigated when the error propagation in the true wind correction is accounted for and used to weight the observations. We discuss the potential caveats and limitations of this approach and conclude that it can be used to quantify flow distortion bias for ships that operate on a global scale. The method can also be valuable to verify computational fluid dynamic studies of airflow distortion on research vessels.
- Article
(6894 KB) - Full-text XML
-
Supplement
(53 KB) - BibTeX
- EndNote


Wind speed is an important factor for air–sea interaction. With increasing wind speed, small instabilities at the air–water interface grow to waves that modify both the surface roughness and the airflow near the surface. Wave breaking leads to localised generation of turbulence, the entrainment of air, and the production of sea spray. As these wind-driven processes control the exchange of momentum, heat, trace gases, and particles between the atmosphere and the ocean, wind speed is often used to parameterise air–sea exchange processes. For example, gas transfer is typically parameterised solely by wind speed with the proposed dependencies ranging from nearly linear, (e.g. Krall et al., 2019), over quadratic (e.g. Ho et al., 2006), to cubic (Wanninkhof and McGillis, 1999). For the production of sea spray, most parameterisations are based on Monahan et al. (1986), who suggested that the sea spray flux could be modelled as a function of wind speed with a power law exponent of 3.41. This strong dependency on wind speed means that a relatively low uncertainty in the wind speed translates to potentially significant uncertainties in the parameterised exchange processes. When sea spray production is parameterised with wind speed to the power of 3.41, a 10 % error in the wind speed results in an error in the predicted sea spray production of 38 %.
Within the turbulent surface layer that extends from a few millimetres to a few tens of metres above the sea surface, the wind speed changes with height; thus, the shape of the wind speed profile depends on the atmospheric stability (Monin and Obukhov, 1954). In order to make observations comparable, the wind speed is typically reported as equivalent to the wind speed 10 m a.s.l. (above sea level) and neutral stability (u10N):
where u* is the friction velocity, which is related to u10N via the surface drag coefficient (; Smith, 1988; Fairall et al., 2003); κ=0.4 is the van Kármán constant; and is a dimensionless function of the measurement height (z) and the Obukhov length scale (L*) that accounts for the effects of atmospheric stability that lead to a deviation from the logarithmic profile. The Obukhov length scale characterises the relative contributions to turbulent kinetic energy from buoyant production and shear production and is given by
where g denotes the acceleration due to gravity, Tv is the surface virtual temperature, and and are the turbulent surface sensible and latent heat fluxes respectively.
Aboard ships and on buoys, wind speed measurements are typically performed with 2-D or 3-D anemometers mounted on exposed locations. The measurement platform and smaller structures near the anemometer can cause a distortion of the airflow, thereby reducing the accuracy of the in situ wind speed and direction measurements. Moat et al. (2005) report a typical range of wind speed bias of +11 % to −100 % for anemometer locations above the bridge of research and cargo vessels. For buoys, the ratio of the sensor's height above the main structure to the dimension of the structure is much higher, so that airflow distortion is typically lower (in the order of 5 % to 10 %, e.g. Emond et al., 2012; Bigorre et al., 2012; Schlundt et al., 2020). Therefore, wind speed measurements from buoys are generally taken as a reference for the evaluation of other wind speed products.
Remote sensing systems (altimeter, scatterometer, and microwave radiometer) offer global observations of surface wind speed-related quantities from space. The observed signals are calibrated and validated against surface wind speed observations from buoy networks (Young et al., 2017; Stopa and Cheung, 2014; Jones et al., 2016; Schmidt et al., 2017; Zhang et al., 2018) and from research ships (e.g. Bourassa et al., 2003).
Global atmospheric weather forecast and reanalysis products are provided, for example, by the European Centre for Medium-Range Weather Forecasts (ECMWF) and the United States' National Centers of Environmental Prediction (NCEP). Over the ocean, the accuracy of the numerical models is improved by the assimilation of in situ observations from ships, buoys, and satellite-derived wind speeds. Several studies have investigated the performance of numerical weather models via comparison to in situ observations from ships, buoys, and wave gliders (e.g. Li et al., 2013; Stopa and Cheung, 2014; Jones et al., 2016; Schmidt et al., 2017; Zhang et al., 2018; Belmonte Rivas and Stoffelen, 2019). They document a significant improvement in the precision and accuracy of these models over the last few decades, although they also report variable model bias that can depend on the region and season.
For research experiments in the open ocean, especially in remote areas such as the Southern Ocean, where few observations are available, it is desirable to use shipborne wind speed measurements that offer a higher temporal resolution than remote sensing and numerical weather model products. Flow distortion can, however, lead to biased wind speed and direction estimates that affect the comparison of wind speed-related observations, if they have been made from different ships or if they have been made from the same ship but at a different relative wind direction. Corrections for airflow distortion have been derived from computational fluid dynamics (CFD) models (e.g Popinet et al., 2004; O'Sullivan et al., 2013). This approach requires a detailed 3-D model of the ship's structure. Due to computational limitations, such CFD simulations are often performed for a limited number of relative wind directions, and small ship structures cannot be resolved (Moat et al., 2005; Popinet et al., 2004). However, small structures in the vicinity of the measurement site can have significant impact on the pattern of the airflow (O'Sullivan et al., 2013). Furthermore, modifications to the surrounding structures may invalidate the results obtained by prior CFD studies. The bias in wind speed and wind direction is mainly dependent on the location of the wind sensor and the relative wind direction (Popinet et al., 2004). In the results of their CFD simulation, O'Sullivan et al. (2013) observed changes in the relative wind speed bias depending on the pitch and roll of the ship as well as the magnitude of the relative wind speed. An experimental verification of these findings is, however, outstanding. Landwehr et al. (2015) quantified flow distortion on a research vessel via direct comparison to wind speed measurements from a nearby buoy. However, due to the sparsity of the buoy networks, this approach is not feasible for most experiments, as it would require the dedication of ship time to visit one of these buoys.
A less direct approach would be the validation of shipborne wind measurements against calibrated remote sensing wind speeds. However, despite the growing number of wind-sensing satellites in orbit, the frequency of overpasses at a single location is still small: altimeter sensors return to a location within 5 to 20 d and radiometer missions return approximately twice per day (Young and Donelan, 2018).
In this work, we explore the possibility of using numerical weather reanalysis products, which are constrained via the assimilation of ship, buoy, and remote sensing wind speeds but fill the gaps between the observations with predictions based on state-of-the-art process models. We develop a framework to detect and quantify flow distortion in shipborne measurements using reanalysis data from ERA-5 and apply it to wind speed measurements from the Antarctic Circumnavigation Expedition (ACE) in the Southern and Atlantic oceans. Furthermore, we will discuss possible concerns regarding this method such as the effect of the low temporal and spatial resolution and model biases of the reanalysis products.
Section 2 provides a short overview of studies that have evaluated ERA-5 and its predecessor ERA-Interim. The data used in this study and the methodology are described in Sect. 3. The results are presented and discussed in Sect. 4 and Sect. 5, and conclusions are drawn in Sect. 6.
The performance of ERA-5 and its predecessor ERA-Interim has been evaluated in several studies: Stopa and Cheung (2014) and Zhang et al. (2018) used wind speeds from buoys to validate wind speed (and wave height) from remote sensing products and ERA-Interim reanalysis data. Both studies found that the bias in the ERA-Interim wind speeds varied between regions and for different seasons. For the latitude band from 60 to 40∘ S and the December–January–February period, both studies report that ERA-Interim wind speeds are biased high compared with the satellite wind speeds. During ACE, the majority of data was collected in this latitude band. ERA-Interim wind speeds are also reported to be biased low in the equatorial region west of Africa which the ship crosses during leg 4 (see, for example, Fig. 4a in Young and Donelan, 2018). The studies also report seasonal and regional differences in the agreement between buoy and satellite wind speeds. Since buoy measurements are performed at heights of around 1 m a.s.l., these were converted to u10 via Eq. (1), although the stability correction term was neglected.
A recent analysis (Young and Donelan, 2018), however, showed that some of the seasonal and regional bias between buoy and satellite wind speeds may be an artifact caused by neglecting the stability correction in Eq. (1). They provide correction factors for radiometer and altimeter wind speeds that account for the effects of stability on the wind speed profile as well as the wind speed dependence of the effective sensing height of the two systems.
Utilising recalibrated scatterometer wind speeds from the Advanced SCATterometer (ASCAT), Belmonte Rivas and Stoffelen (2019) characterised ERA-Interim and ERA-5 wind vectors for the year 2016. In comparison to ASCAT, they reported a mean zonal and meridional wind speed bias of less than 0.5 m s−1 for ERA-Interim and less than 0.3 m s−1 for ERA-5. They also report root-mean-square errors (RMSE) of less than 3 m s−1 and less than 2.5 m s−1 for ERA-Interim and ERA-5 respectively. Global maps of the mean wind speed difference (ASCAT minus ERA-Interim and ASCAT minus ERA-5) presented by Belmonte Rivas and Stoffelen (2019) still show regional variability of the bias against ASCAT wind speeds but also a clear reduction for ERA-5 compared with ERA-Interim. Figure 5 in Belmonte Rivas and Stoffelen (2019) shows annual mean bias in ERA-5 zonal and meridional wind speeds against ASCAT of up to 1 m s−1 in the equatorial region west of Africa and less than 0.5 m s−1 in the Southern Ocean.
It is worth mentioning that some studies have evaluated ERA-Interim in the Southern Ocean against in situ observations from ships (Li et al., 2013; Jones et al., 2016). These studies reported mean bias and RMSE values of a few metres per second, which are, however, quite variable between different ships. These results may be affected by flow distortion bias in the shipborne measurements. Li et al. (2013) reported that, where data were available from more than one wind sensor on a single ship, they used the consistency between those readings as a measure to filter potentially affected data.
3.1 Shipborne wind measurements during the Antarctic Circumnavigation Expedition
The Antarctic Circumnavigation Expedition was conducted aboard the R/V Akademik Tryoshnikov. A total of 22 international projects were involved and measured a wide range of variables in the atmosphere, the ocean, on subantarctic islands, and on the Antarctic continent (Walton and Thomas, 2018). The ship moved from Bremerhaven, Germany, to Cape Town, South Africa (leg 0); from Cape Town through the Indian Ocean to Hobart, Australia (leg 1); from Hobart via the Pacific Ocean to Punta Arenas, Chile (leg 2); from Punta Arenas through the Atlantic Ocean back to Cape Town (leg 3); and finally north to Bremerhaven (leg 4) (Schmale et al., 2019a). Therefore, the dataset covers a full circumnavigation of the Antarctic continent between 34 and 78∘ S and two Atlantic transects from 34∘ S to 53∘ N. Figure 1 shows a map of the cruise track.
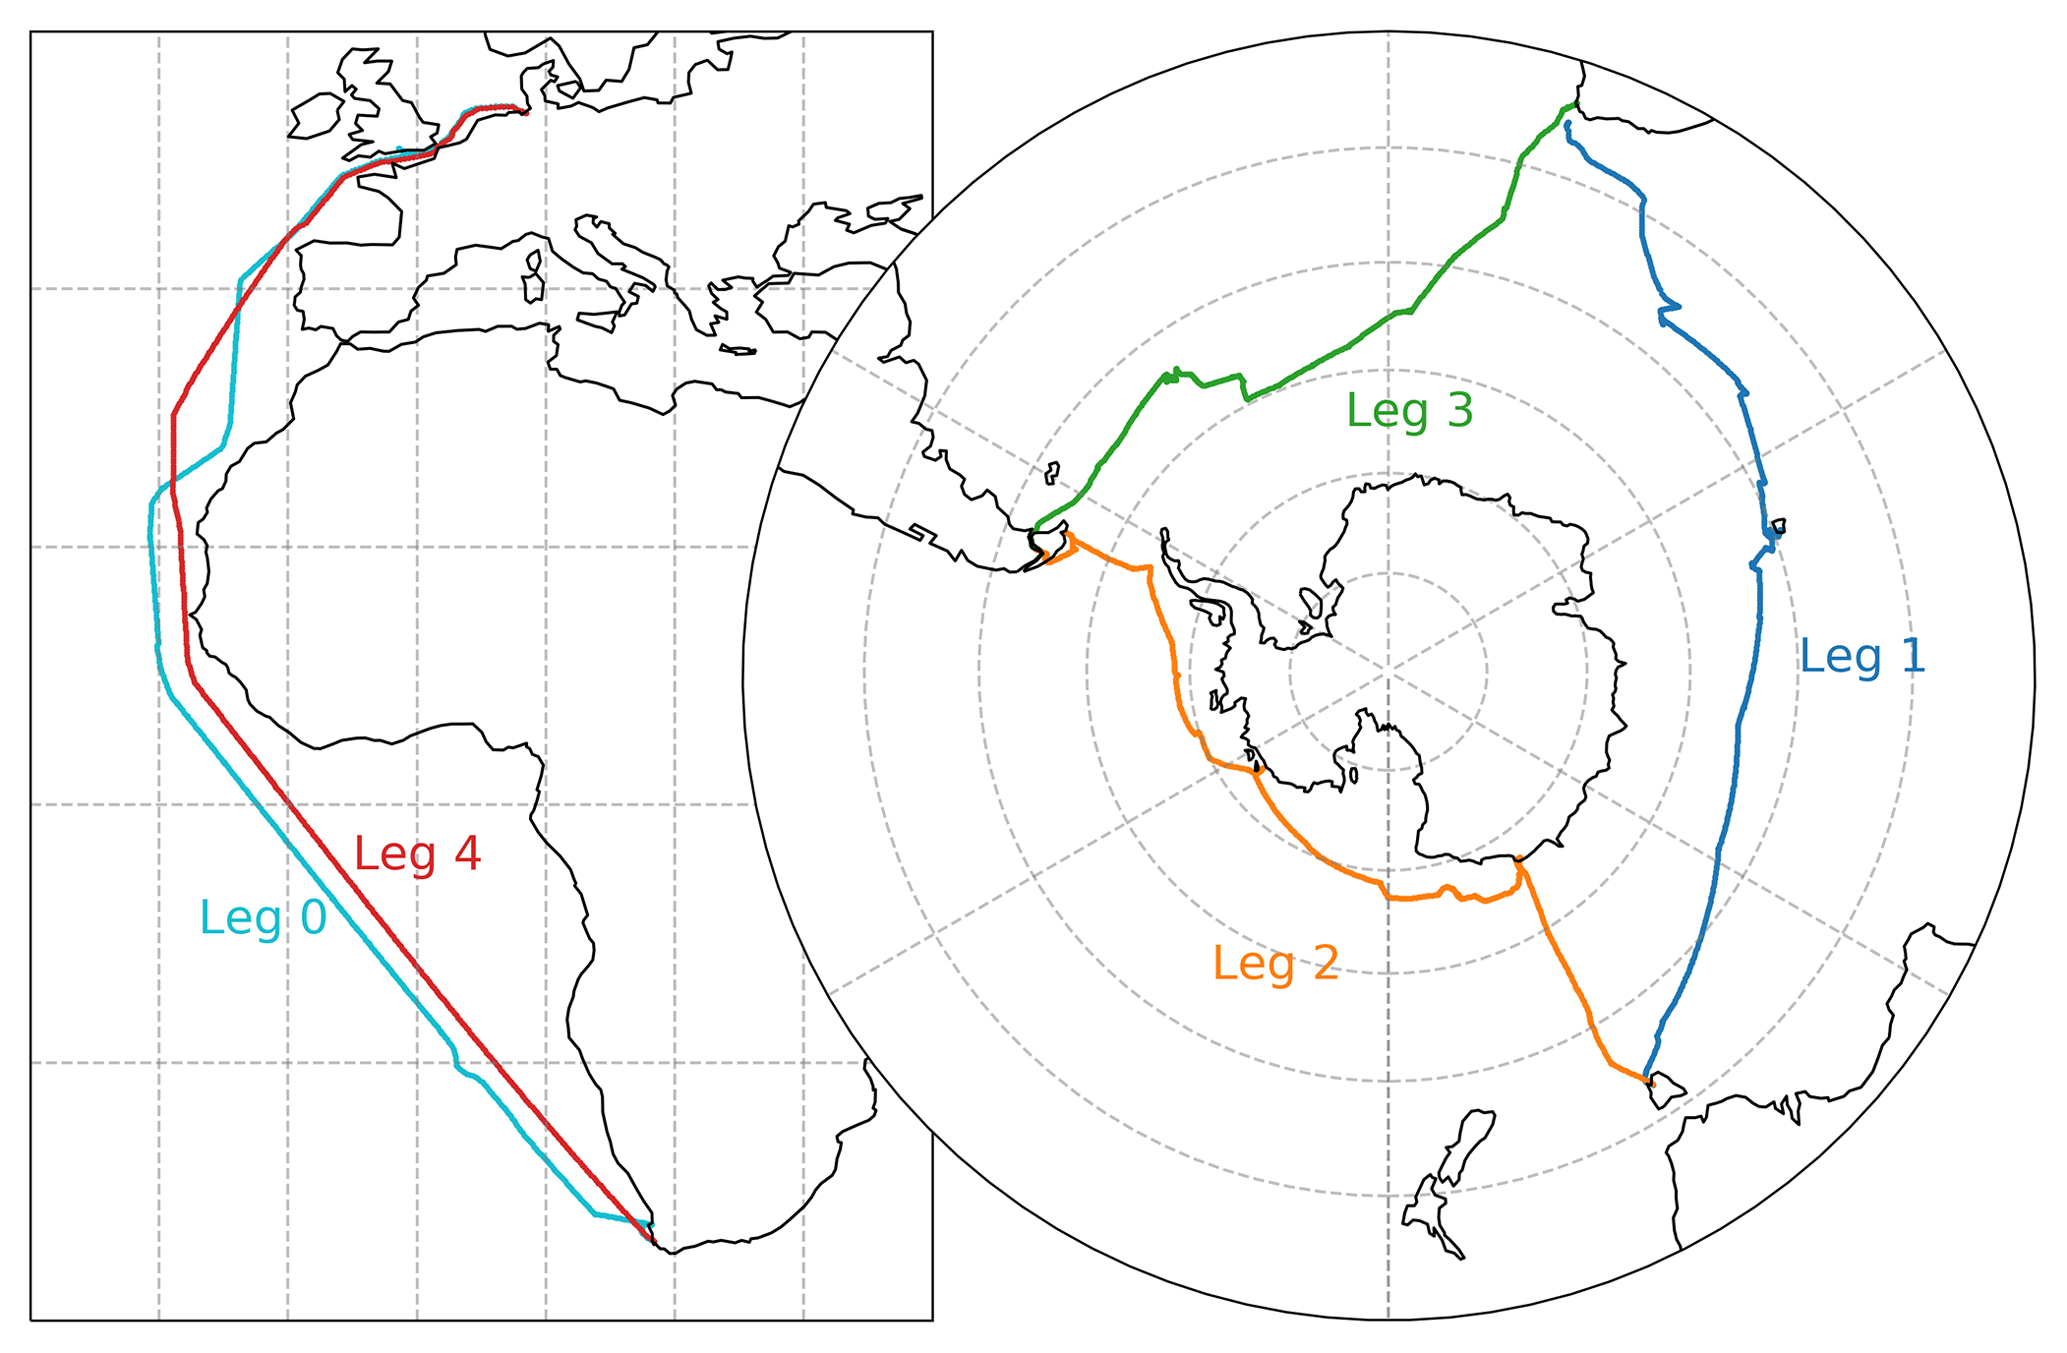
Figure 1 Map showing the track of the R/V Akademik Tryoshnikov. Legs 0–4 are shown using different colours.
In situ wind speed was measured aboard R/V Akademik Tryoshnikov with two 2-D sonic anemometers (models WS425 and WMT702), which were operated as part of an automated weather station (AWS; model AWS420, Vaisala). The anemometers were mounted on 2 m long vertical poles, which were attached to the two topmost side arms on the starboard side and port side of the main mast (see Fig. 2). This places the measurement volumes at ∼3 m above the highest floor of the main mast, ∼8 m above the monkey island (the area above the bridge), and ∼31.5 m a.m.s.l (metres above mean sea level). In the following, measurements from the anemometer located on the starboard side are labelled with the suffix “stbd”, and measurements on the port side are labelled with the suffix “port”.
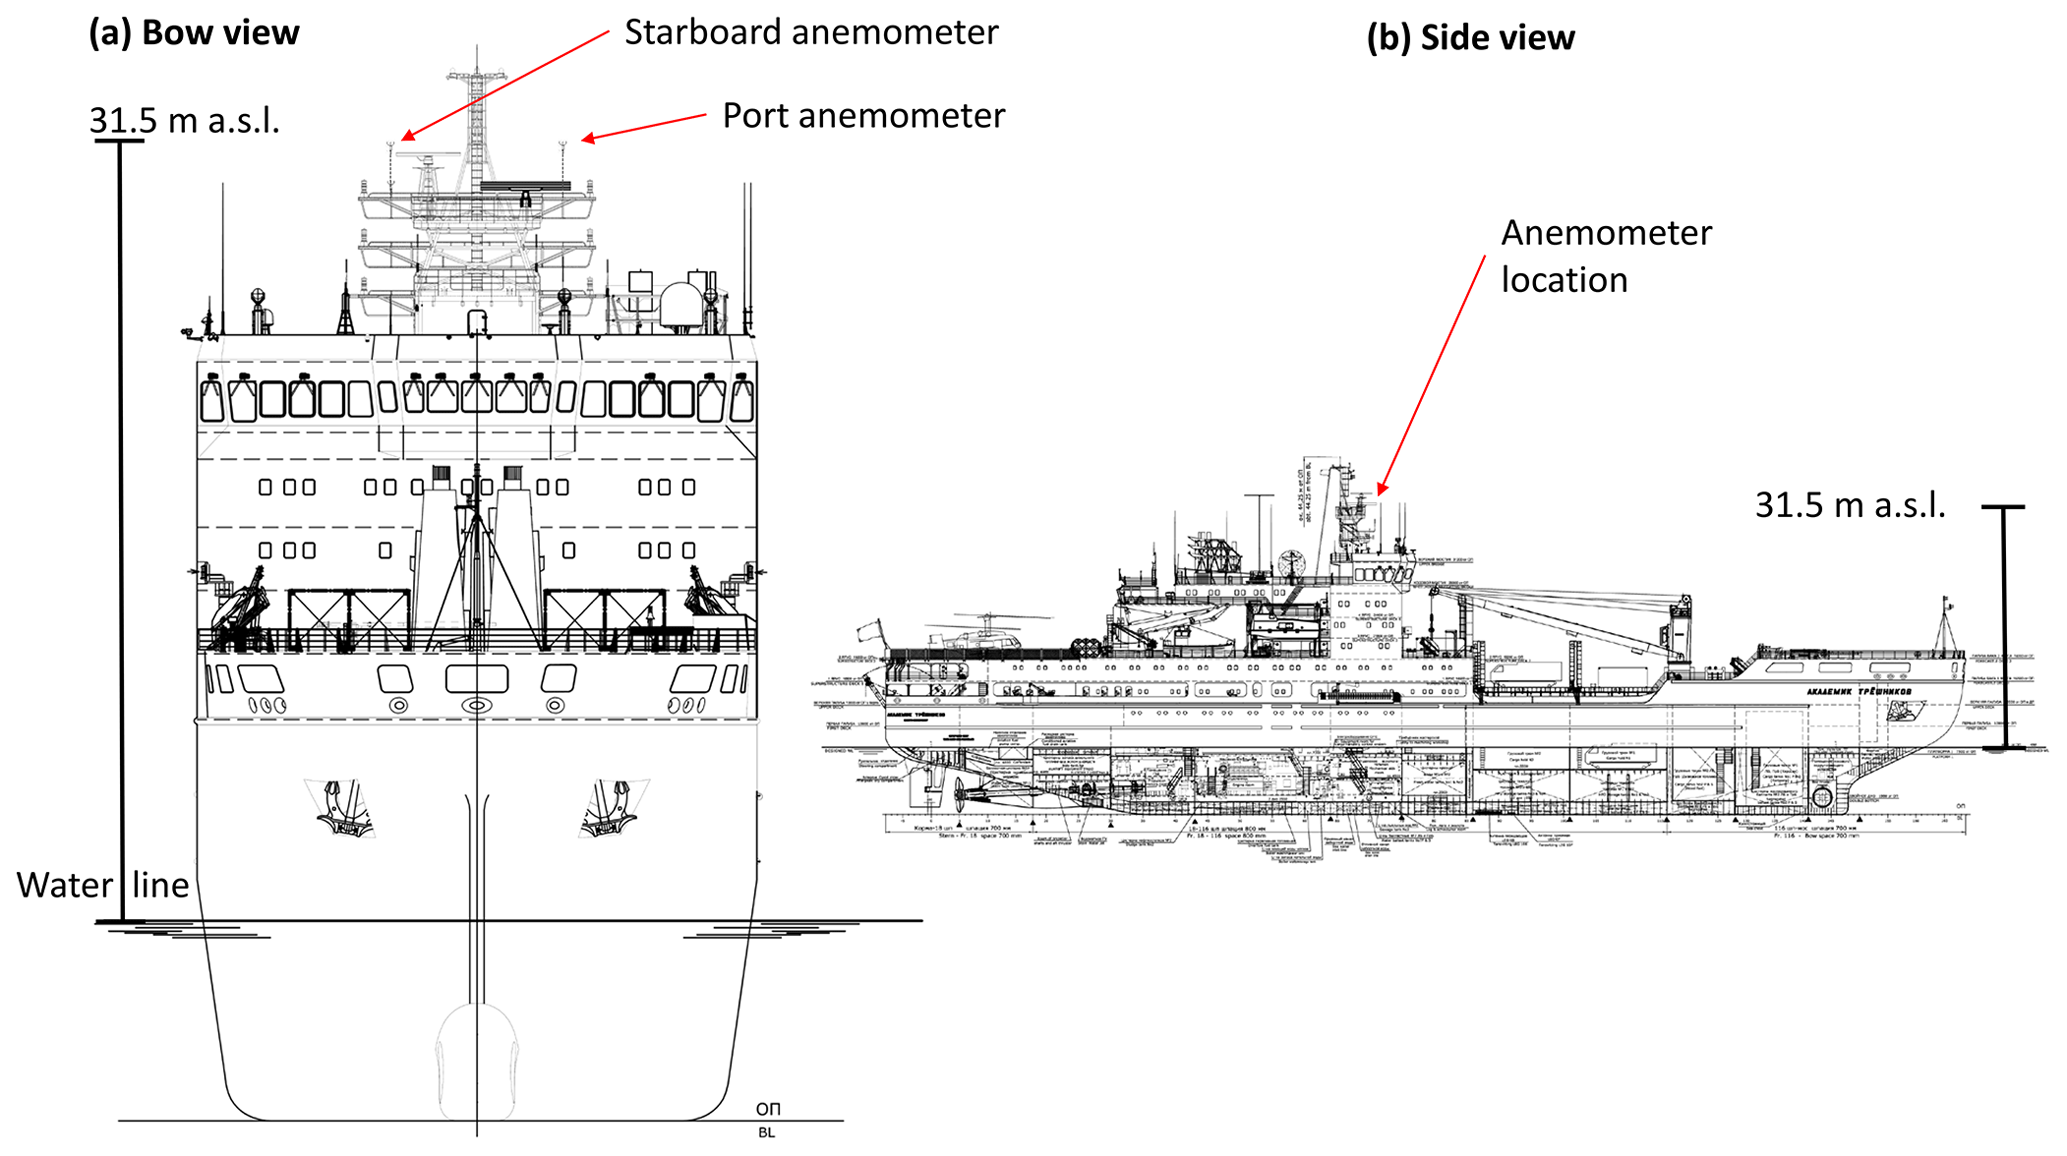
Figure 2 Drawing of the (a) bow and (b) side view of the R/V Akademik Tryoshnikov. The positions of the port and starboard anemometers are indicated by the red arrows (the drawing has been modified by the author to show both anemometers mounted on the 2 m long poles). The side view is provided using a smaller scale. Adjusted vessel plans provided by the Arctic and Antarctic Research Institute (AARI).
Figure 3 shows photographs of the set-up that were taken on a visit to the ship before the cruise. At the level of the anemometers, the main mast and the radar antenna on the starboard side represent two obstacles to the airflow, while the radar antenna on the port side is located more than 1.5 m below the level of anemometers.
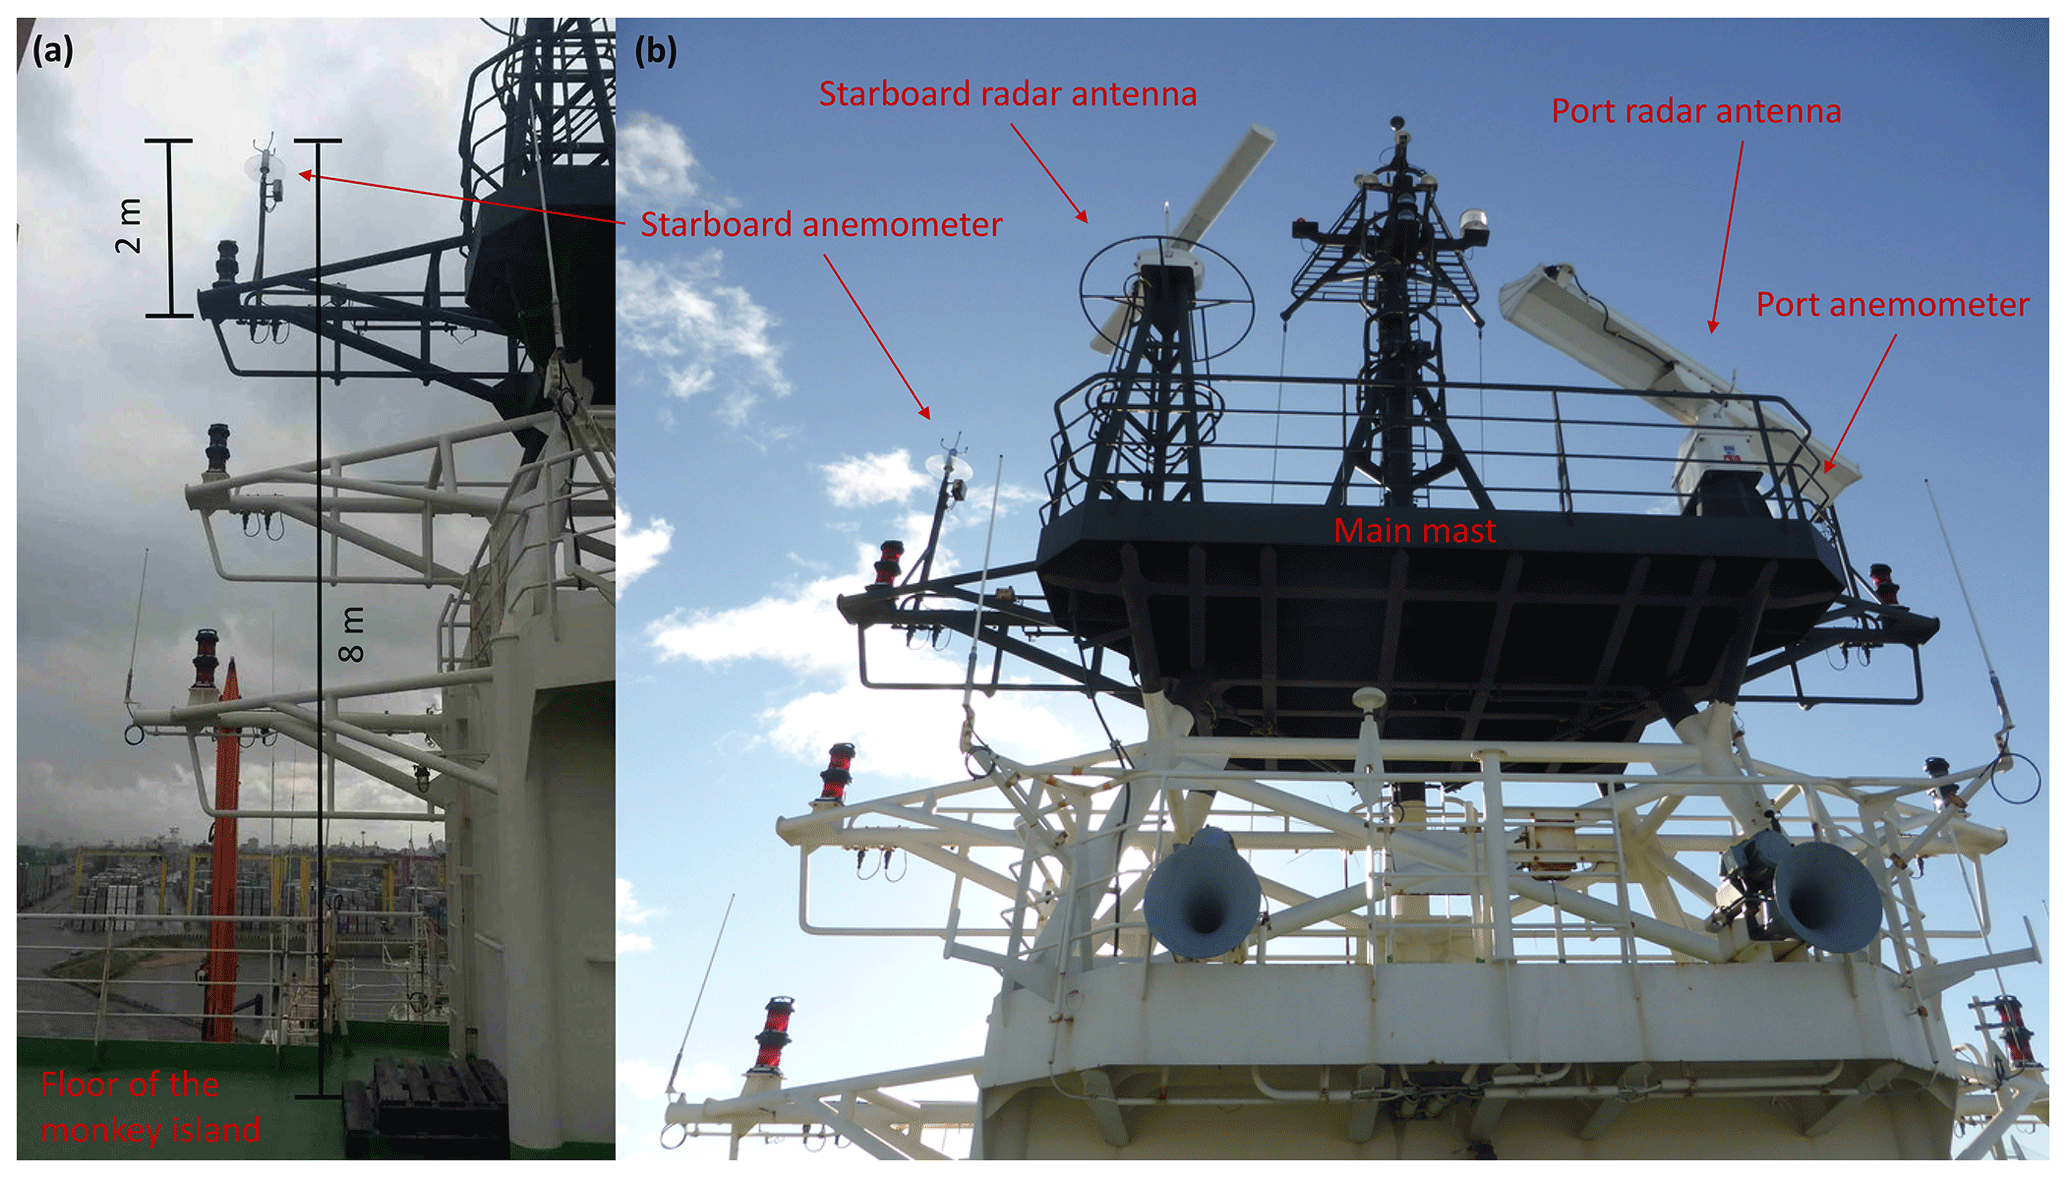
Figure 3Panels (a) and (b) show annotated photographs of the set-up on the main mast. Photo credits: (a) Irina Gorodetskaya; (b) Jenny Thomas.
The recording and preprocessing of the AWS data are documented in Pina Estany and Thomas (2019). The AWS provides a record of the measured relative wind speed (S) and the relative wind direction (D) as well as the ship's heading (ΦH) with a 3 s resolution. The convention used here is if the ship is pointed into the wind and for wind coming from starboard. Where D is used as the x axis in the figures, we have values reaching from to in order to create a panorama. Negative values of D denote wind from the port side and positive values denote wind from the starboard side respectively.
True wind speed and direction were also provided by the AWS. However, for the internal correction the AWS was programmed to assume that the ship's course (ΦC) would always equal the heading (communications with Vaisala customer support, 2019). This assumption neglects situations when the ship's velocity is not aligned with the ship's heading, e.g. when the ship is slowly drifting sideways during a station, and results in an underestimation of the true wind speed (Smith et al., 1999). For this dataset, the difference between course and heading was higher than 10∘ about 22 % of the time. Therefore, we calculated the true wind (u) in post-processing:
where, v is the ship's velocity, r is the observed relative wind vector in the ship's frame of reference, and Hes is the transformation from the instantaneous ship's frame of reference to the East, North, Up coordinate-system.
Here, the ship's reference system is defined as follows: the x axis is along the ship's main axis and positive towards the bow, the y axis is along the beam and positive towards port, and the z axis is positive upward. The vertical component will be neglected in the following analysis as the time averages of the vertical wind speed and the ship's vertical velocity component are negligible for the averaging periods of 5 min and 1 h used. For the same reason, the instantaneous pitch and roll of the ship are neglected. The 5 min average roll varied between and , whereas the pitch only varied between and . The simplified transformation from ship to the earth reference system is given by
The relative wind vector is calculated from S and D as follows:
During the first part of leg 0 (before 27 November 2016 10:00:00 UTC), the navigation data are only available at a low time resolution (less than two samples per minute). For these data, the ship's velocity was recovered from the records of the ship's heading and the true and relative wind speed and direction under the a priori assumption ΦC=ΦH, which holds approximately for . If the recalculated velocity of the ship was above 2 m s−1, the data were used in this analysis. The quality controlled record of the meteorological observations, which were recorded by the AWS, can be obtained from Landwehr et al. (2019).
3.2 Modelled relative wind speed based on ERA-5 and estimation of the flow distortion bias
We derive model-predicted relative wind speed and direction from the ECMWF weather model reanalysis data ERA-5 (Copernicus Climate Change Service, C3S, 2017) as follows: the ERA-5 dataset is provided on a spatial resolution and 1 h temporal resolution. From this, the nearest value in space and time was interpolated onto the ship's track at a 5 min resolution. For details on the choice of the time resolution, see Sect. 3.4. The ERA-5 u10N is utilised to calculate u*, using the wind speed-dependent neutral drag coefficient CD10N provided in the COARE 3.5 bulk flux model (Edson et al., 2013). We use the ERA-5 sensible and latent heat fluxes and u* to derive L*M via Eq. (2). Using ERA-5 heat fluxes instead of the in situ air–sea temperature gradient may introduce errors in the profile adjustment. The ERA-5 sea surface temperature (SST) estimates agree within C with calibrated underway measurements of the bulk sea water temperature at a depth of 5 m, which are provided in Haumann et al. (2020) for 96 % of the data. The same holds for the majority (86 %) of the surface air temperature observations; however, localised events with differences in Ta of up to 8 ∘C between ERA-5 and the observations were observed in the vicinity of some of the islands (see Appendix E).
Using Eq. (1), we calculate the predicted wind speed at the measurement height of z=31.5 m which will hereafter be referred to as uM with the suffix “M” for “model derived”. Note that, as pointed out by Edson et al. (2013), the wind speed profile should be evaluated relative to the water surface. However, as the surface water currents were not measured during ACE, we evaluate against a fixed earth reference frame. This may introduce small errors in the height and stability correction.
Rearranging Eq. (3), the relative wind vector predicted by the model can be calculated as
The expected relative wind speed (SM) and direction (DM) can be derived from rM via Eq. (5) and compared to the measurements from the port and starboard anemometers.
The relation between the observed wind speed (Sm) and direction (Dm) and the model-predicted values SM and DM provide means to quantify the flow distortion correction factors:
and
where the angular brackets denote the average of the observations over sufficiently small intervals of the measured relative wind direction (Dm). Due to the complexity of the structures near the anemometer, the acceleration factor (αS) and the horizontal deflection (δD) vary with the angle of attack. Here, we only account for the horizontal variations that are given by the measured relative wind direction (Dm). This approach neglects any potential effects of the pitch and roll on the flow pattern of the airflow; however, small variations in the wind speed ratio from the port and starboard anemometers may be attributed to changes in the mean roll angle (see Appendix A). Effects of the pitch were not observed, but they cannot be fully ruled out due to the symmetry of the measurement set-up. Nevertheless, the mean pitch varied by less than 1∘.
We apply the correction to the 3 s time series of Dm and Sm in order to calculate a corrected relative wind speed
which is then used to recompute the corrected true wind speed (uc) via Eq. (3). Note that the surface sensible heat flux is approximately linearly related to u*, and, for this reason, L* is approximately proportional to . Therefore, we use an adjusted () to derive u10N from the corrected true wind speed uc via Eq. (1).
3.3 Uncertainty estimation
Errors in the reference wind speed and direction used will propagate into the estimates of the expected relative wind speed and direction and, consequently, of αS and δD. Due to the vector addition, errors in the ERA-5 wind speed and direction are less severe for the bias estimation if the ship is heading against the wind. However, if the ship is moving in the same direction as the wind, the vector addition leads to an amplification of the relative error. This effect is enhanced when the ratio of the ship speed to the wind speed increases. A detailed description of the error propagation can be found in Appendix B.
In order to estimate the uncertainty in the expected relative wind speed and direction, we vary the ERA-5 wind speed by ±20 % or 0.5m s−1 (whichever is larger) and the ERA-5 wind directions by . These values are based on the comparison of the in situ wind speeds from ACE with the ERA-5 predictions. We use the largest absolute deviation of SM and DM resulting from these combinations to estimate ΔSM and ΔDM.
The accuracy of the relative wind speed and direction readings are taken from the data sheets for the WMT702 (WS425): ΔSm=1 % (ΔSm=2 %) and for both models. We neglect the uncertainties in the velocity and heading measurements as these are small in comparison.
The uncertainty in the flow distortion bias estimates are given by
and
We use the estimated uncertainties as weights for the calculation of weighted means as the best estimates of αS(Dm) and δD(Dm).
3.4 Choice of wind direction sectors and time averages
In the following we use relative wind direction sectors to calculate average wind speed ratios and wind direction differences. These sectors have been chosen as a compromise between directional resolution and sample size. For we use an interval width of 5∘ to optimally resolve the variation of αS and δD with Dm. However, for the interval width had to be reduced to 20∘ due to the small number of observations in this sector.
Time averages are necessary to obtain meaningful values of wind speed and direction. However, depending on the ship's layout, the flow distortion bias can be very sensitive to small changes in the relative wind direction. Thus, for the experimental bias determination the dataset needs to be restricted to time intervals over which the relative wind direction did not change significantly. This is fulfilled more easily if the time intervals are short. Here, we choose an averaging time of 5 min for the analysis, but the results do not change significantly for longer averaging times up to 1 h (see Appendix C).
The wind direction sectors are used to calculate weighted averages of the wind speed ratios and wind direction differences. We approximate the error of the mean via bootstrapping: in a first step, all estimates of αS and δD in a given wind direction sector, which are derived from the same ERA-5 grid cell are averaged and treated as one independent sample. The resulting population is resampled 100 times, and the standard deviation of the resulting 100 weighted averages is used as an estimate of the standard error of the mean.
3.5 Selection of data for the estimation of αS and δD
The dataset used in this study amounts to 37 816 and 37 896 5 min average observations from the port and starboard sensors respectively. Subinterval variability of the relative wind direction, the ship's heading, and the ship's speed for each 5 min interval was evaluated using 1 min average data. Only samples where the subinterval variations in D and ΦH were less than 15∘ and the subinterval variation of |v| was less than 1 m s−1 were used for the analysis. About 26 % of the observations failed these criteria.
During leg 2 when the ship was south of 60∘ S, the wind speed and direction observations were reported to the Global Telecommunication System (GTS) under the call sign UBXH3 and partly used for data assimilation in the Integrated Forecast System (IFS; ECMWF, 2016). ERA-5 reanalysis output, which may have been affected by the assimilation of observations from the R/V Akademik Tryoshnikov, was identified and excluded from this analysis. These data comprised 277 h in total. See Appendix D for further details.
For the estimation of αS and δD, we further limit our dataset to observations that were made in ERA-5 open-ocean grid cells (i.e. where the ERA-5 land-sea mask and the sea ice fraction are equal to zero) and for which the distance from the ship's location to the nearest coastline was larger than 50 km. We also restrict the data to situations where in order to limit the magnitude of the stability correction in Eq. (1) to less than 10 % of u10N.
If the ship is moving in the same direction and with approximately the same speed as the airflow, the relative wind speed will approach zero and the relative wind direction cannot be defined. Therefore, intervals where either Sm or SM are smaller than 2 m s−1 are not used for the estimation of αS and δD. About 40 % of the observations (15 163 and 15 344 5 min intervals for port and starboard respectively) passed all criteria and are used for the estimation of the flow distortion bias.
Faulty data transmission or undocumented interference with the sensors (birds, rimming, or heavy rain) can lead to errors in rm that affect a small number of observations. Furthermore, local weather events may not be resolved in the ECMWF model, leading to large differences between uM and the true wind speed. Consequently, some estimates of αS and δD will deviate largely from the main distribution and reduce the accuracy of the estimated mean values. We use a standard method to identify these outliers based on the interquartile range (IQR), i.e. the difference between the 75th and 25th percentile: for each wind direction interval, values that lay more than 1.5×IQR above the 75th percentile or more than 1.5×IQR below the 25th percentile are treated as outliers and are excluded from the calculations. For the paired estimation of αS and δD, a data point was excluded when it failed the criterion for either of the two. This method is termed “IQR-filter” in the following. The IQR-filter removed about 7 % of the observations that had passed the above quality criteria. In total, 13 334 and 13 452 5 min samples passed all quality control criteria for the port and starboard sensors respectively. This amounts to about 35 % of the original available data from both sensors.
Note that the above described filtering methods are only used to derive the subset of data that is suitable to estimate αS(Dm) and δD(Dm). The flow distortion correction factors are later applied to the full dataset of rm in order to derive the corrected wind speed.
4.1 Intercomparison of the measurements of port and starboard anemometers
In Fig. 4, the 5 min averaged relative wind speed and direction recorded by the two anemometers are compared against each other. The ratio of the port and starboard relative wind speeds and the difference in the relative wind direction are shown as functions of the relative wind direction and the subinterval variability of the relative wind direction.
The measurements from the starboard and port sensors agree best for , but differences in the relative wind speed of up to 40 % occur at , where the lee side readings are affected by shadowing due to the main mast. The smaller variation in and at is likely caused by the wake of the small mast, which is mounted on the starboard side (see Fig. 2). This mast only affects the starboard side sensor. The difference between the relative wind direction measurements ranges from to . For the relative wind direction sector , both the wind speed ratio and wind direction difference show a larger variability than for other sectors, and few data points passed the wind direction variability criterion (see Sect. 3.5). A possible explanation for this is turbulence caused by the structure of and emissions from the exhaust stack, which is located in this direction.

Figure 4 (a) Ratio of the relative wind speed recorded by the starboard and port anemometers () as a function of the relative wind direction recorded by the starboard anemometer. (b) The difference in the relative wind directions recorded by the starboard and portside anemometers (). The points denote 5 min average values, and the colours denote the variability of the 1 min average wind direction within each 5 min interval (the maximum of the variability of Dm, stbd and Dm, port ). The red line and shaded area show the respective average and standard error of the mean for the wind direction bins described in Sect. 3.4. The standard error of the mean was estimated via bootstrapping, and it amounts to ∼2 % for the relative wind speed ratio and for the relative wind direction difference. (A total of 0.8 % of the data reside outside the plotted range, and for 4 % of the data the wind direction variability is larger then 60∘.)
4.2 Average deflection and acceleration estimates based on ERA-5 wind speeds
The uM values derived from ERA-5 are used to estimate SM and DM, as described in Sect. 3.2. In Fig. 5, the average values of and per wind direction bin are displayed as a function of Dm, stbd. The distribution of the individual observations of and are shown as heat maps (bi-dimensional histogram). In Fig. 5, we show the samples that passed all quality control measures, except the IQR-filter. Although the variability in the individual ratios and direction differences is high, there is a clear trend of the flow distortion bias with relative wind direction: the ratio peaks at 1.2 for and is close to 1.05 for . Two minima are visible at and , which can be attributed to shadowing of the starboard sensor by the main mast and the radar antenna. For these wind directions, the relative wind speed is underestimated by −37 % and −14 % respectively. The difference amounts to for wind blowing from the bow. For the windward side , the relative wind vector is increasingly deflected away from the centreline until , where the bias in Dm, stbd starts to decrease again. More abrupt variations in are observed for a wind direction from port, for which the starboard sensor is in the wake of the main mast and the radar antenna.
The average variation of is shown in Fig. 6. For the port sensor, the overestimation of the relative wind speed is largest at , where it amounts to +17 %. The strongest underestimation (−25 %) occurs at , where the port sensor is in the wake of the main mast.
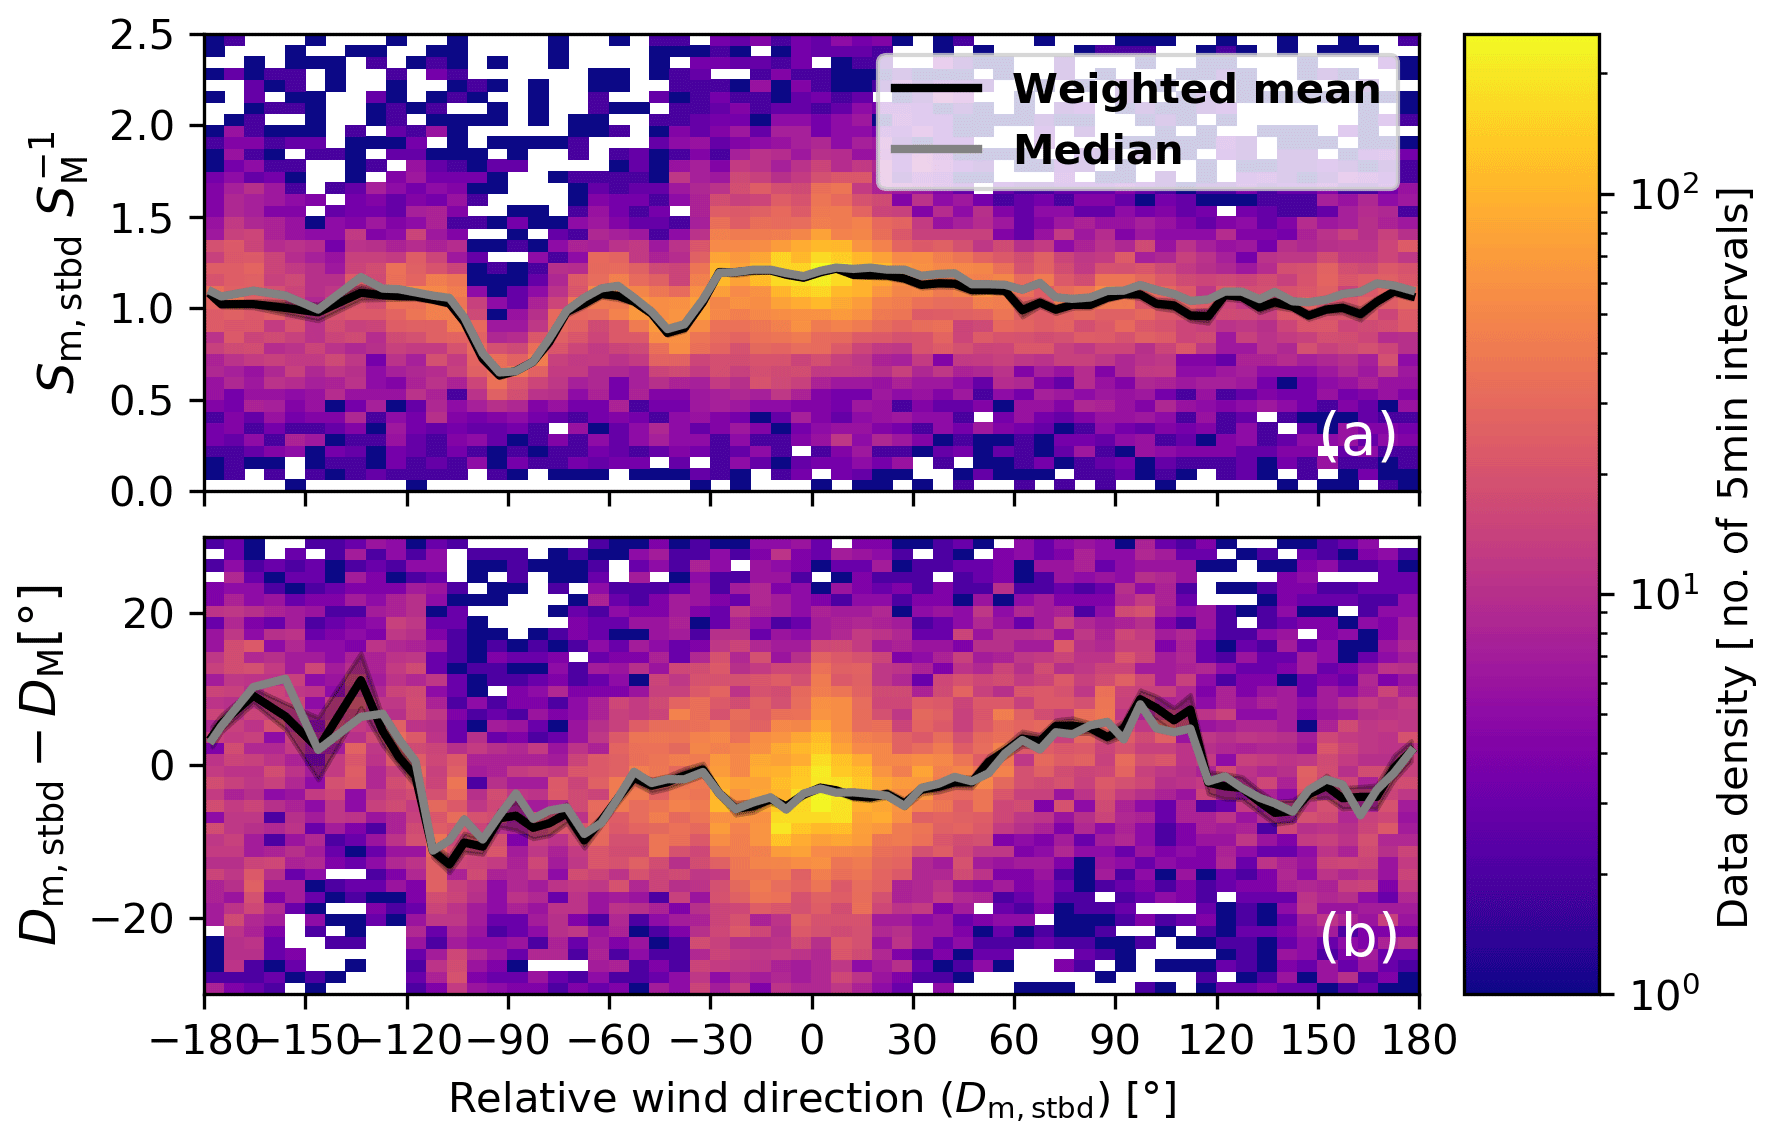
Figure 5 (a) Bi-dimensional histogram of and Dm, stbd. The number of samples per ratio and the wind direction bin are shown as a heat map with a logarithmic colour scale. The black line shows the weighted arithmetic mean calculated over each wind direction sector. The grey line shows the median. Panel (b) is the same as (a) but for the relative wind direction difference.
Several studies (e.g. Stopa and Cheung, 2014; Zhang et al., 2018) suggest that ERA-Interim wind speeds are biased high by ≈5 % in the latitude band from 40 to 60∘ S during the Southern Hemisphere summer. In order to investigate if this affects the derived correction, the bin-averaged ratios for the port sensor are plotted in Fig. 6 for ship positions within and outside of the latitude band from 40 to 60∘ S respectively. Figure 7 shows the number of “unique” 5 min intervals per sector, where “unique” means that for each relative wind direction sector multiple matches with the same latitude × longitude × time grid box are counted only once. The ratio tends to be higher for ship positions north of 40∘ S than for observations from the latitude band from 40 to 60∘ S for most relative wind direction sectors. For , where the large number of observations allows for robust averages, the estimated ratios are lower on average in the 40 to 60∘ S latitude band than north of these latitudes. For latitudes south of 60∘ S, the number of 5 min averages that are not compromised by the assimilation of the observations into the IFS is too low for a wind sector-resolved analysis.
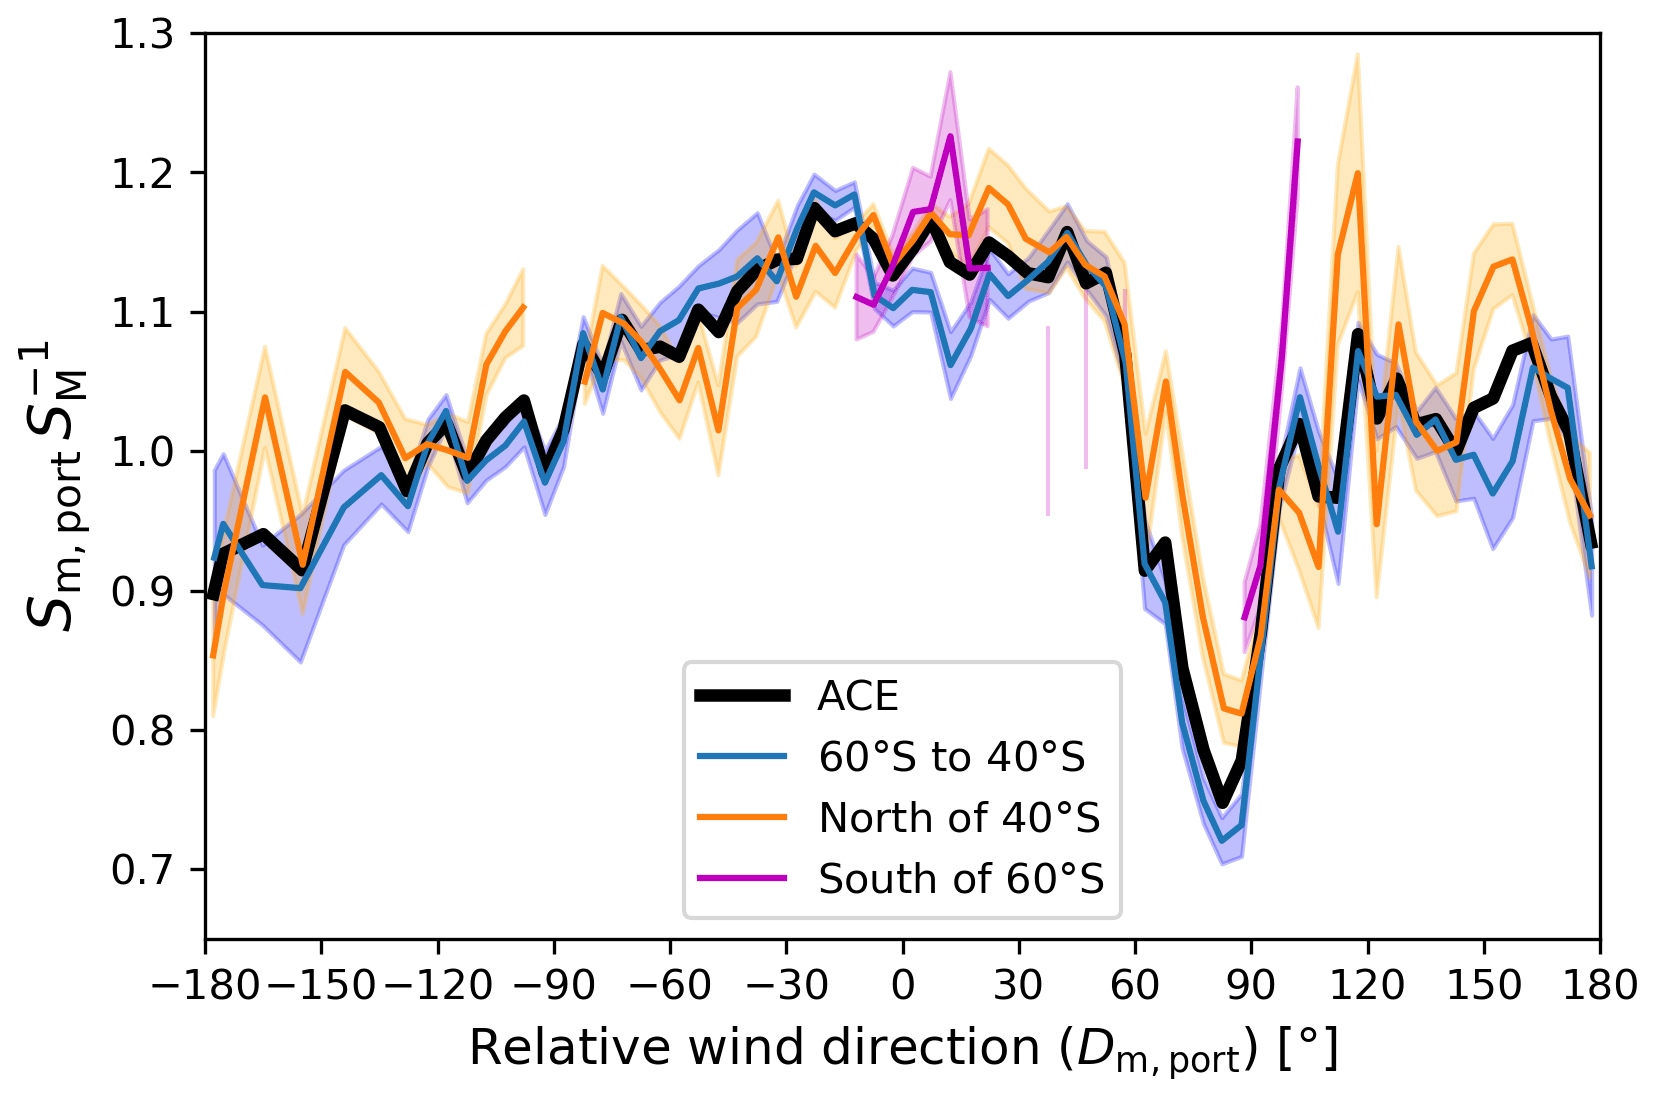
Figure 6Weighted bin average ratio of Sm, port to the expected SM (based on ERA-5) as a function of Dm, port. The weighted bin averages are shown for the whole ACE cruise (black) as well as for the ship's location south of 60∘ S (pink line), between 40 and 60∘ S (blue line), and north of 40∘ S (orange line). The shaded area denotes the standard deviation of the weighted mean.

Figure 7 Number of “unique” observations per wind direction sector for the same subsets as shown in Fig. 6. For the number of “unique” samples in each relative wind direction sector the multiple matches of the 5 min data with the same latitude × longitude × time grid box of ERA-5 are counted only once. The grey dashed line (right axis) shows the total number of 5 min samples. ACE (total) refers to the total “non-unique” counts.
4.3 Effect of the correction on the estimated true wind speeds
Figure 8 shows the distribution of um versus uc (the measured versus corrected true wind speed). The correction of the measured wind vector via Eq. (9) tends to reduce the true wind speed, but the magnitude of the correction varies by more than 5 m s−1. The effect of the correction on the estimates of u (and, consequently, u10N) depends on the relative wind direction as well as the ratio of the wind speed and ship velocity. Figure 9 shows the distribution of for the starboard sensor as a function of the relative wind direction as well as the histogram integrated over all relative wind directions. For 36 % of the data the change in the true wind speed estimates by the correction is less than 5 %. These observations, which are nearly unaffected by flow distortion, are almost exclusively from . The effect of the correction on u is strongest in magnitude for , where the vector addition of true wind speed and ship velocity can lead to situations where . In most cases, the correction leads to a lower estimate of u. The few cases in this sector where the correction leads to an increase in u are related to situations when the ship is heading in the same direction into which the wind blows and has a higher speed than the wind.
For 46 % and 28 % of the data the effect of the correction on u is stronger than 10 % and 20 % respectively, while a bias stronger than ±40 % occurs for 11 % of the measurements. The percentiles of the distributions of for the port and the starboard sensors as well as for averages of the port and starboard wind speeds are summarised in Table 1.
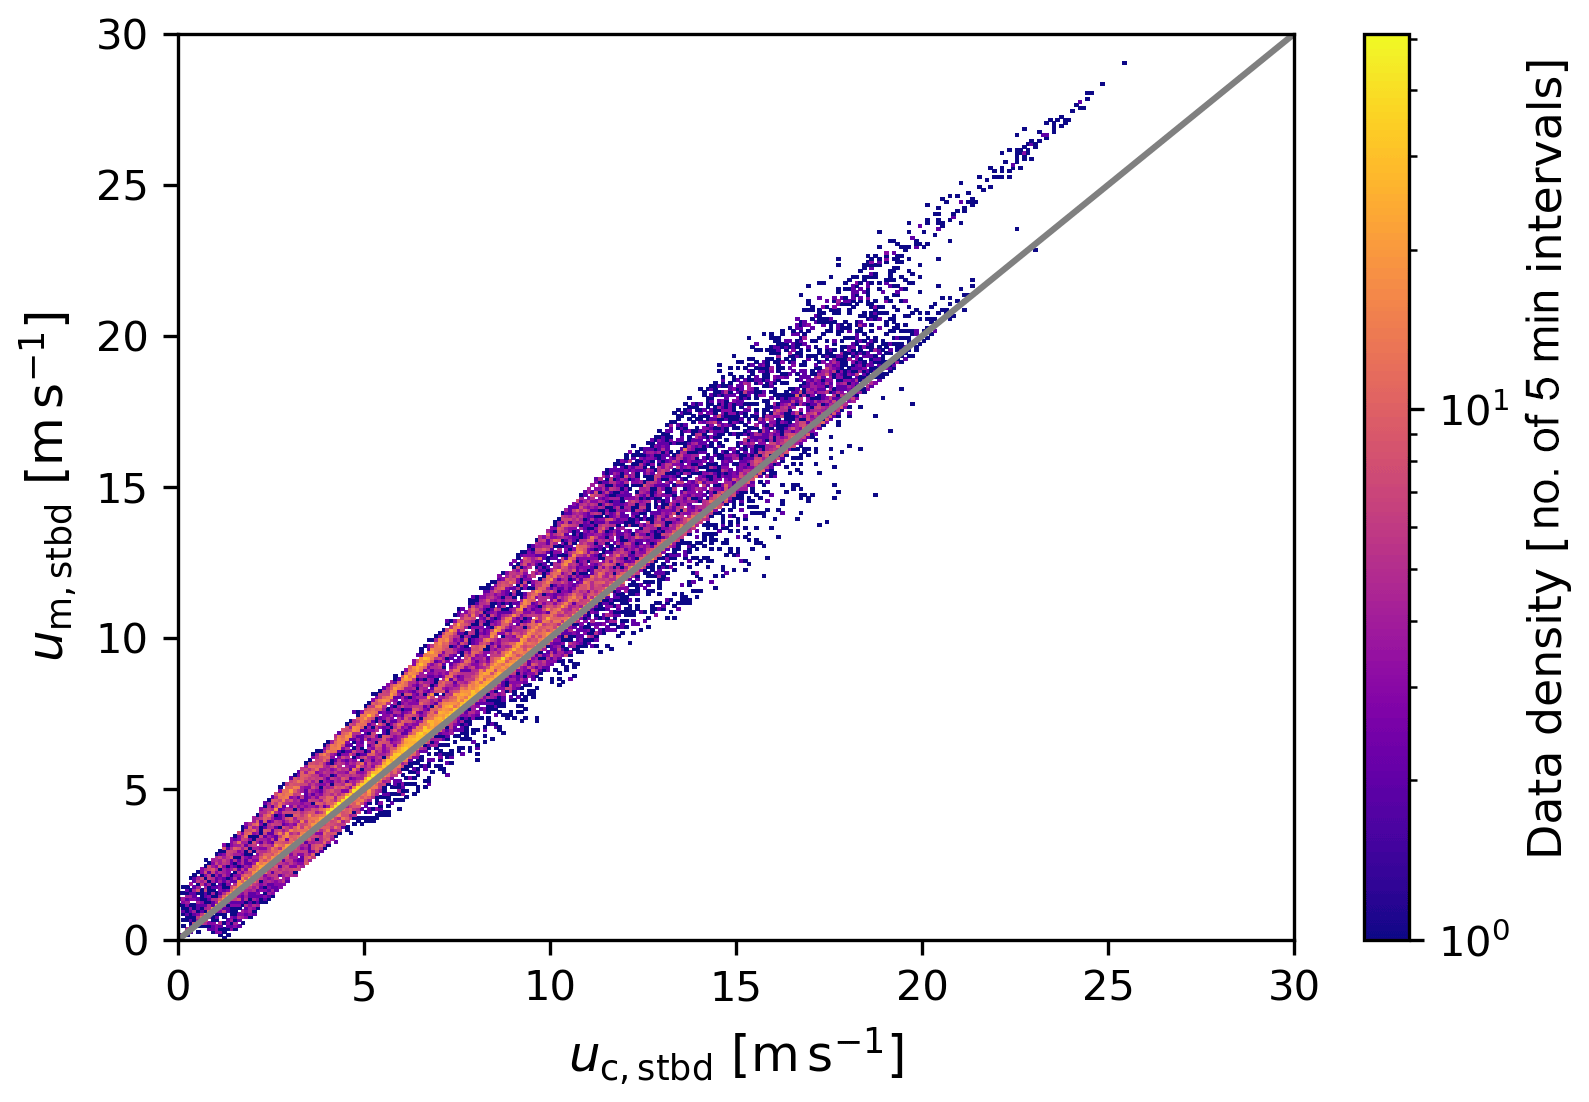
Figure 8 Bi-dimensional histogram of um, stbd against uc, stbd. Counts are provided for a wind speed resolution. The 1:1 line is indicated in grey.
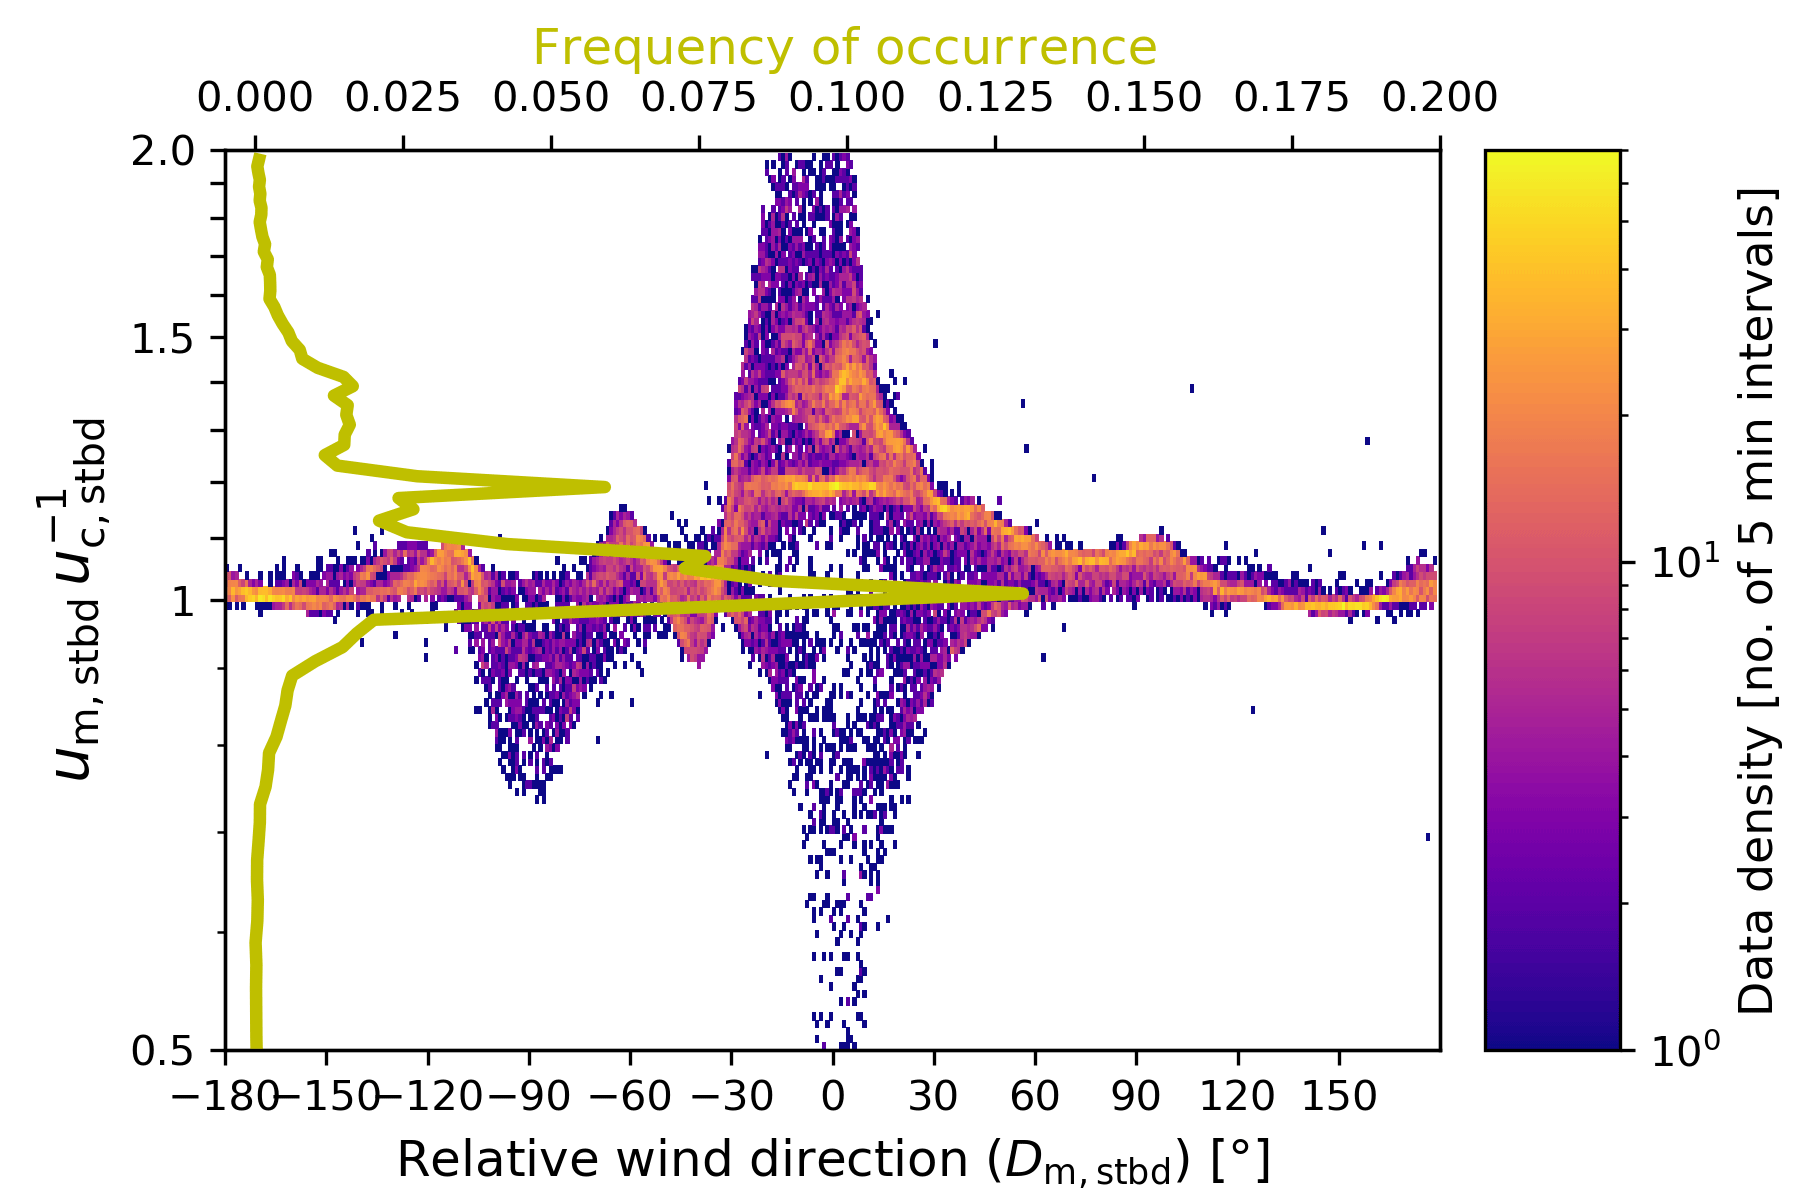
Figure 9Bi-dimensional histogram of the ratio (the effect of the flow distortion correction on the true wind speed estimate) versus the relative wind direction Dm, stbd. Counts are provided in a 1∘ resolution in the wind direction and in a logarithmic resolution of dlog 10=0.005 for the ratio. The yellow line shows the histogram of integrated over all wind directions (top x axis). The frequency of occurrence is provided over linear intervals of the wind speed ratio with a width of 0.02 and plotted on the logarithmic scale of the common y axis.
Table 1 Rows one to three show the percentiles of the relative bias between the uncorrected and corrected true wind speed for the respective starboard and port anemometers as well as for the vector average of the measurements from both sensors. Row four shows the percentiles of the relative bias between ERA-5 and the corrected true wind speed. Row five is the same as row four but shows the relative difference between uc and uc(M−5 %) that was derived from ERA-5 wind speeds, which were modified to a 5 % lower magnitude, in order to test the sensitivity of the correction to a bias in ERA-5. Values provided are for .
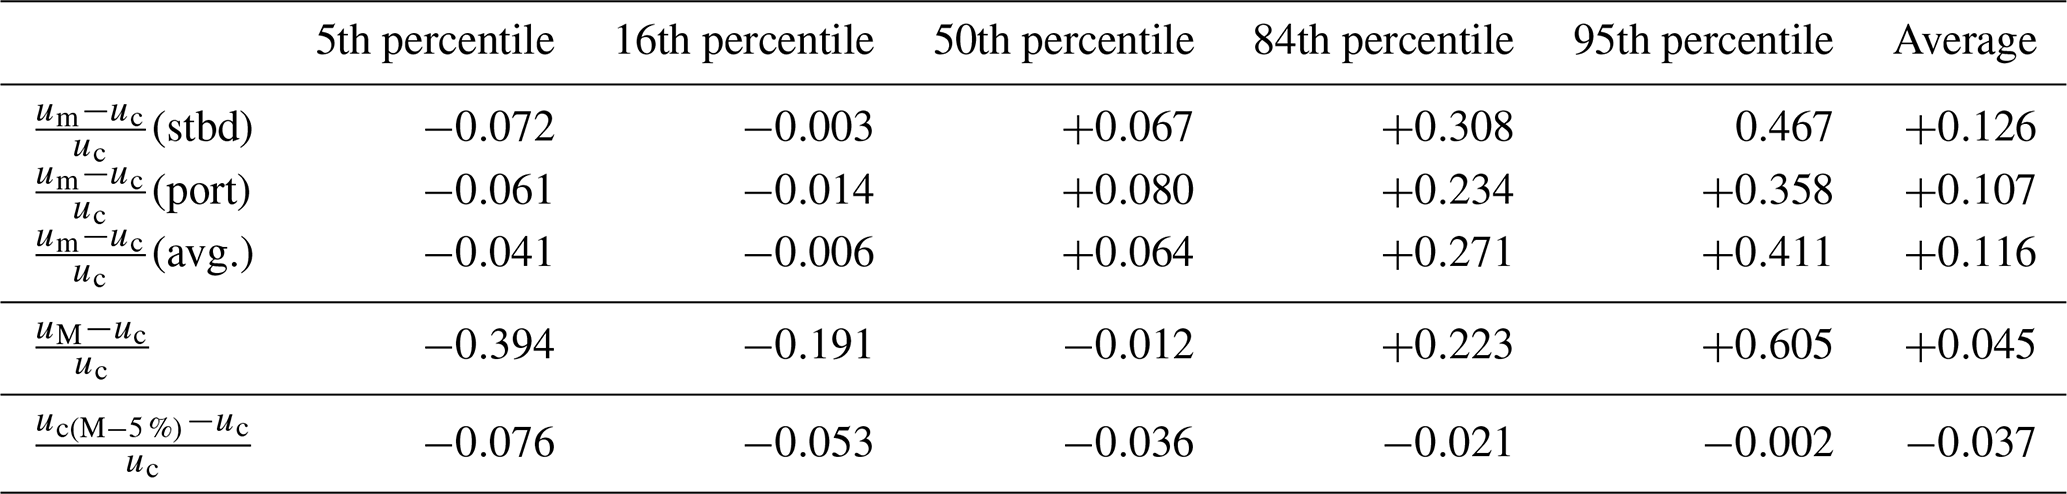
Figure 10 shows the histograms of and . The correction, which has been derived independently for each sensor, improves the agreement between the port and starboard wind speeds, as can be seen by the narrower distribution of the wind speed ratio.
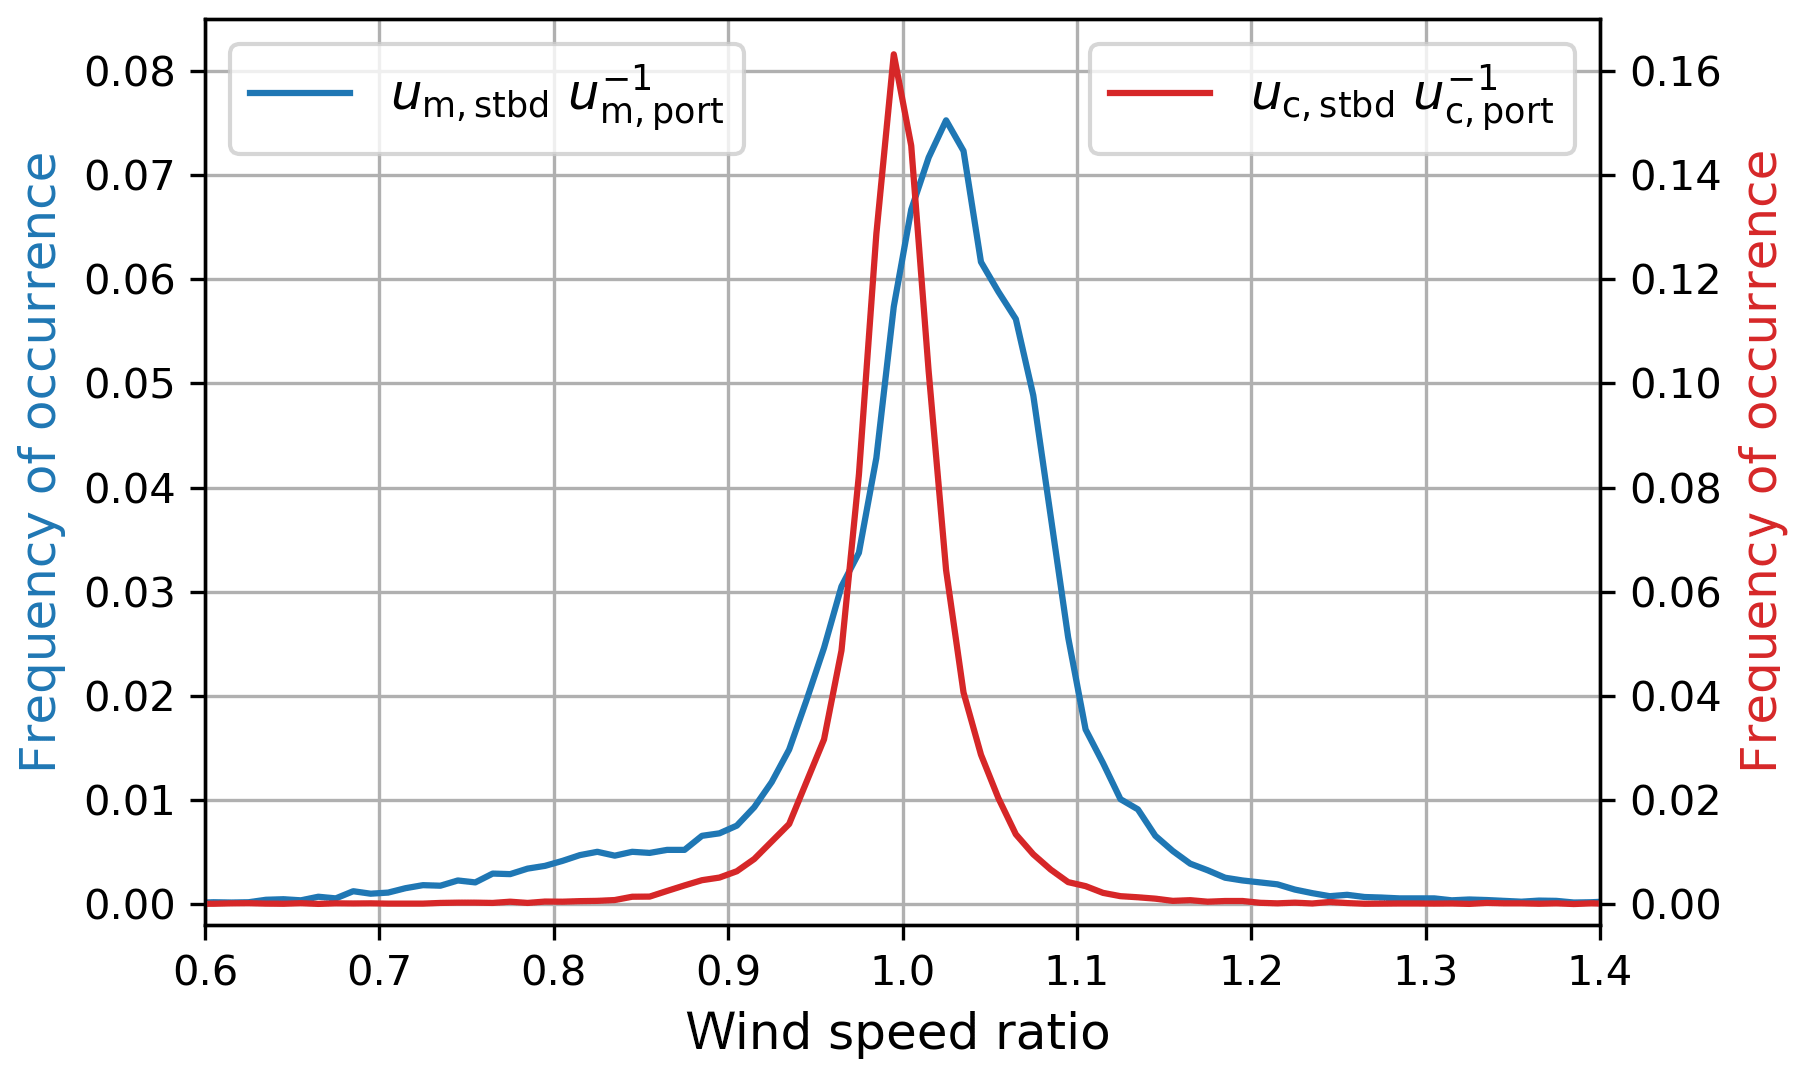
Figure 10 Histograms of the ratio of the true wind speed estimate from the starboard and port sensors with (red line) and without (blue line) the correction applied.
4.4 Remaining uncertainty in the wind speed measurements
During ACE, the correction for the measurement height () ranges from 5 % to 12 % of u10N, depending on the wind speed. The effect of a change in measurement height by up to 5 m on the wind speed would be less than 1 % of u10N. Such a variation in measurement height could be caused by the uplift of the airflow that passes the ship or changing buoyancy of the ship. Likewise, a deviation in the actual drag coefficient from the COARE 3.5 bulk value of 20 % would lead to a change in the u10N estimate of about 1 %.
With a 30 % uncertainty in L* (assuming 20 % uncertainty in u* and the temperature gradient respectively) the uncertainty in the correction for stability () is ≈1 % of u10N on average and amounts to less than 1 % for 76 % of the data and to less than 5 % of u10N for 98.5 % of the data.
The standard deviation of the bin averages of αS ranges from 1 % to 2 % for most wind directions and reaches 3.5 % for . However, the values of αS may be biased low as they are based mainly on samples from latitudes between 60 and 40∘ S, where the comparison with microwave radiometer and altimeter wind speeds indicates that ECMWF wind speeds may be 5 % too high on average during the Southern Hemisphere summer (Stopa and Cheung, 2014). Re-evaluating the correction with 5 % higher or lower ERA-5 reference wind speed leads to corrected u10N estimates that are different by less than 5.3 % within the 16th to 84th percentile range (see Table 1). Therefore, we estimate the common uncertainty of the flow distortion correction to be 5 %.
Thus, the resulting common uncertainty estimate in the corrected u10N is given by
The flow distortion term clearly dominates the uncertainty of the corrected u10N. Note that when the ship travels during low wind conditions the uncertainty approaches 5 % of the ship velocity () and, thus, 0.4 m s−1, which will lead to high relative uncertainties of u10N in these cases.
4.5 Local and regional variations in the ERA-5 wind speed accuracy
Figure 11 shows a map of the ship track. The marker positions indicate the ship's 6 h average location, and the marker sizes represent the magnitude of the corrected true wind speed (uc), which is taken as the average of port and starboard readings. The ratio of the 30 m wind speed from ERA-5 over the corrected in situ wind speed is denoted by the marker colour. Along the ship track, long sections are visible where the ERA-5 wind speeds agree with the in situ wind speeds within a few percent. Large deviations in the wind speed estimates of more than 20 % occur clustered along the ship track. Some of these can be linked to the vicinity of the islands that were passed by the ship. However, the ERA-5 wind speeds also deviate by more than 20 % in the eastern Ross Sea (leg 2) and when the ship passes south-west of Liberia during leg 4 (although this is not observed at the same location during leg 0).
These variations in show some similarities with the bias maps that Stopa and Cheung (2014), Zhang et al. (2018), and Belmonte Rivas and Stoffelen (2019) provide from comparisons of ERA-Interim and ERA-5 with satellite-based wind speeds. Namely, there is a tendency for uM to be higher than uc in the latitudes between 60 and 40∘ S but lower for northern latitudes. Furthermore, the modelled wind speeds are much lower than uc in the equatorial region west of Africa.
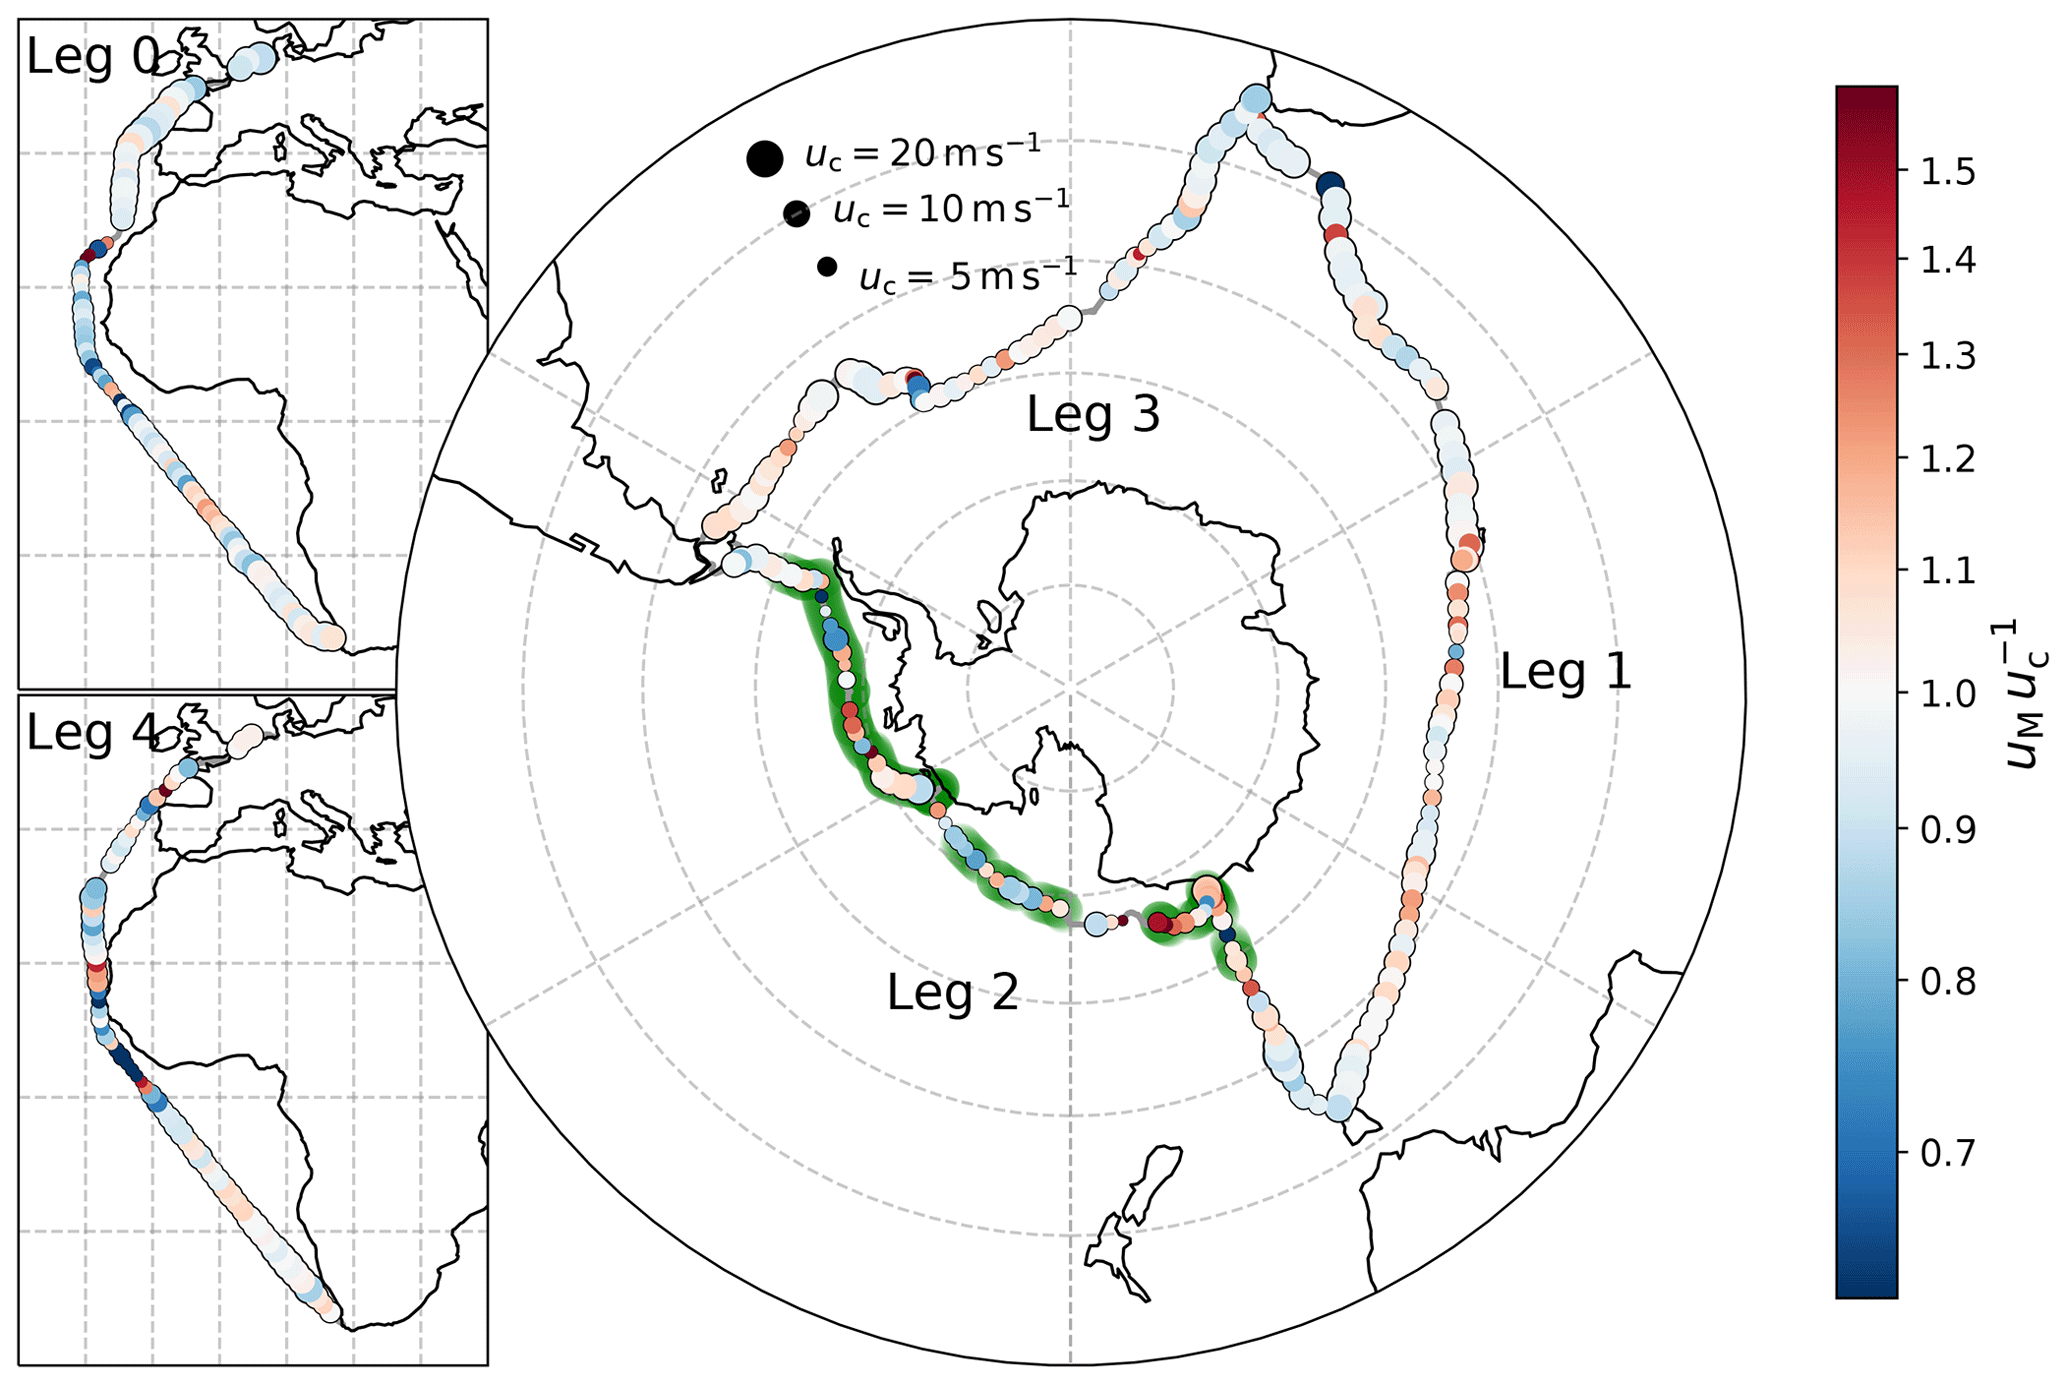
Figure 11 Ratio of the 31.5 m wind speed predicted by ERA-5 over the corrected in situ wind speed along the ACE track. The marker location and maker size indicate the 6 h mean of the ships position and of the corrected observed wind speed (uc, 6 h average of port and starboard readings) respectively. The black markers show the size for . The colours denote the ratio of on a logarithmic scale. The green shading denotes the part of the track where the assimilation of data reported by the R/V Akademik Tryoshnikov may have affected the ERA-5 reanalysis results. Data with less then a 50 km average distance to the nearest shoreline are not shown in this plot.
Figure 12 presents the distribution of the observed wind speed ratios (evaluated at a 1 h resolution) for ship locations north of 40∘ S, between 40 and 60∘ S, and south of 60∘ S. These subsets contain 42 %, 40 %, and 18 % of the data respectively. For data south of 60∘ S, the distribution of is spread out the widest and features a considerable fraction of data points where uM is more than 20 % lower or higher than uc. Sea ice, present in this area, likely reduced the availability of satellite wind speeds for assimilation into the ECMWF model. The mean ratios and the standard error of the mean are also indicated in Fig. 12 using coloured shading (prior to the calculations, the outliers were removed using the IQR-filter). The mean ratios of the two subsets north of 40∘ S and south of 60∘ S, 0.963±0.005 and 0.974±0.013 respectively do not differ significantly from each other and are slightly lower than one. However, the mean of the ratios observed for the interval from 40 to 60∘ S is 1.021±0.004 and is significantly higher than that for the other two intervals (by about 5 %).
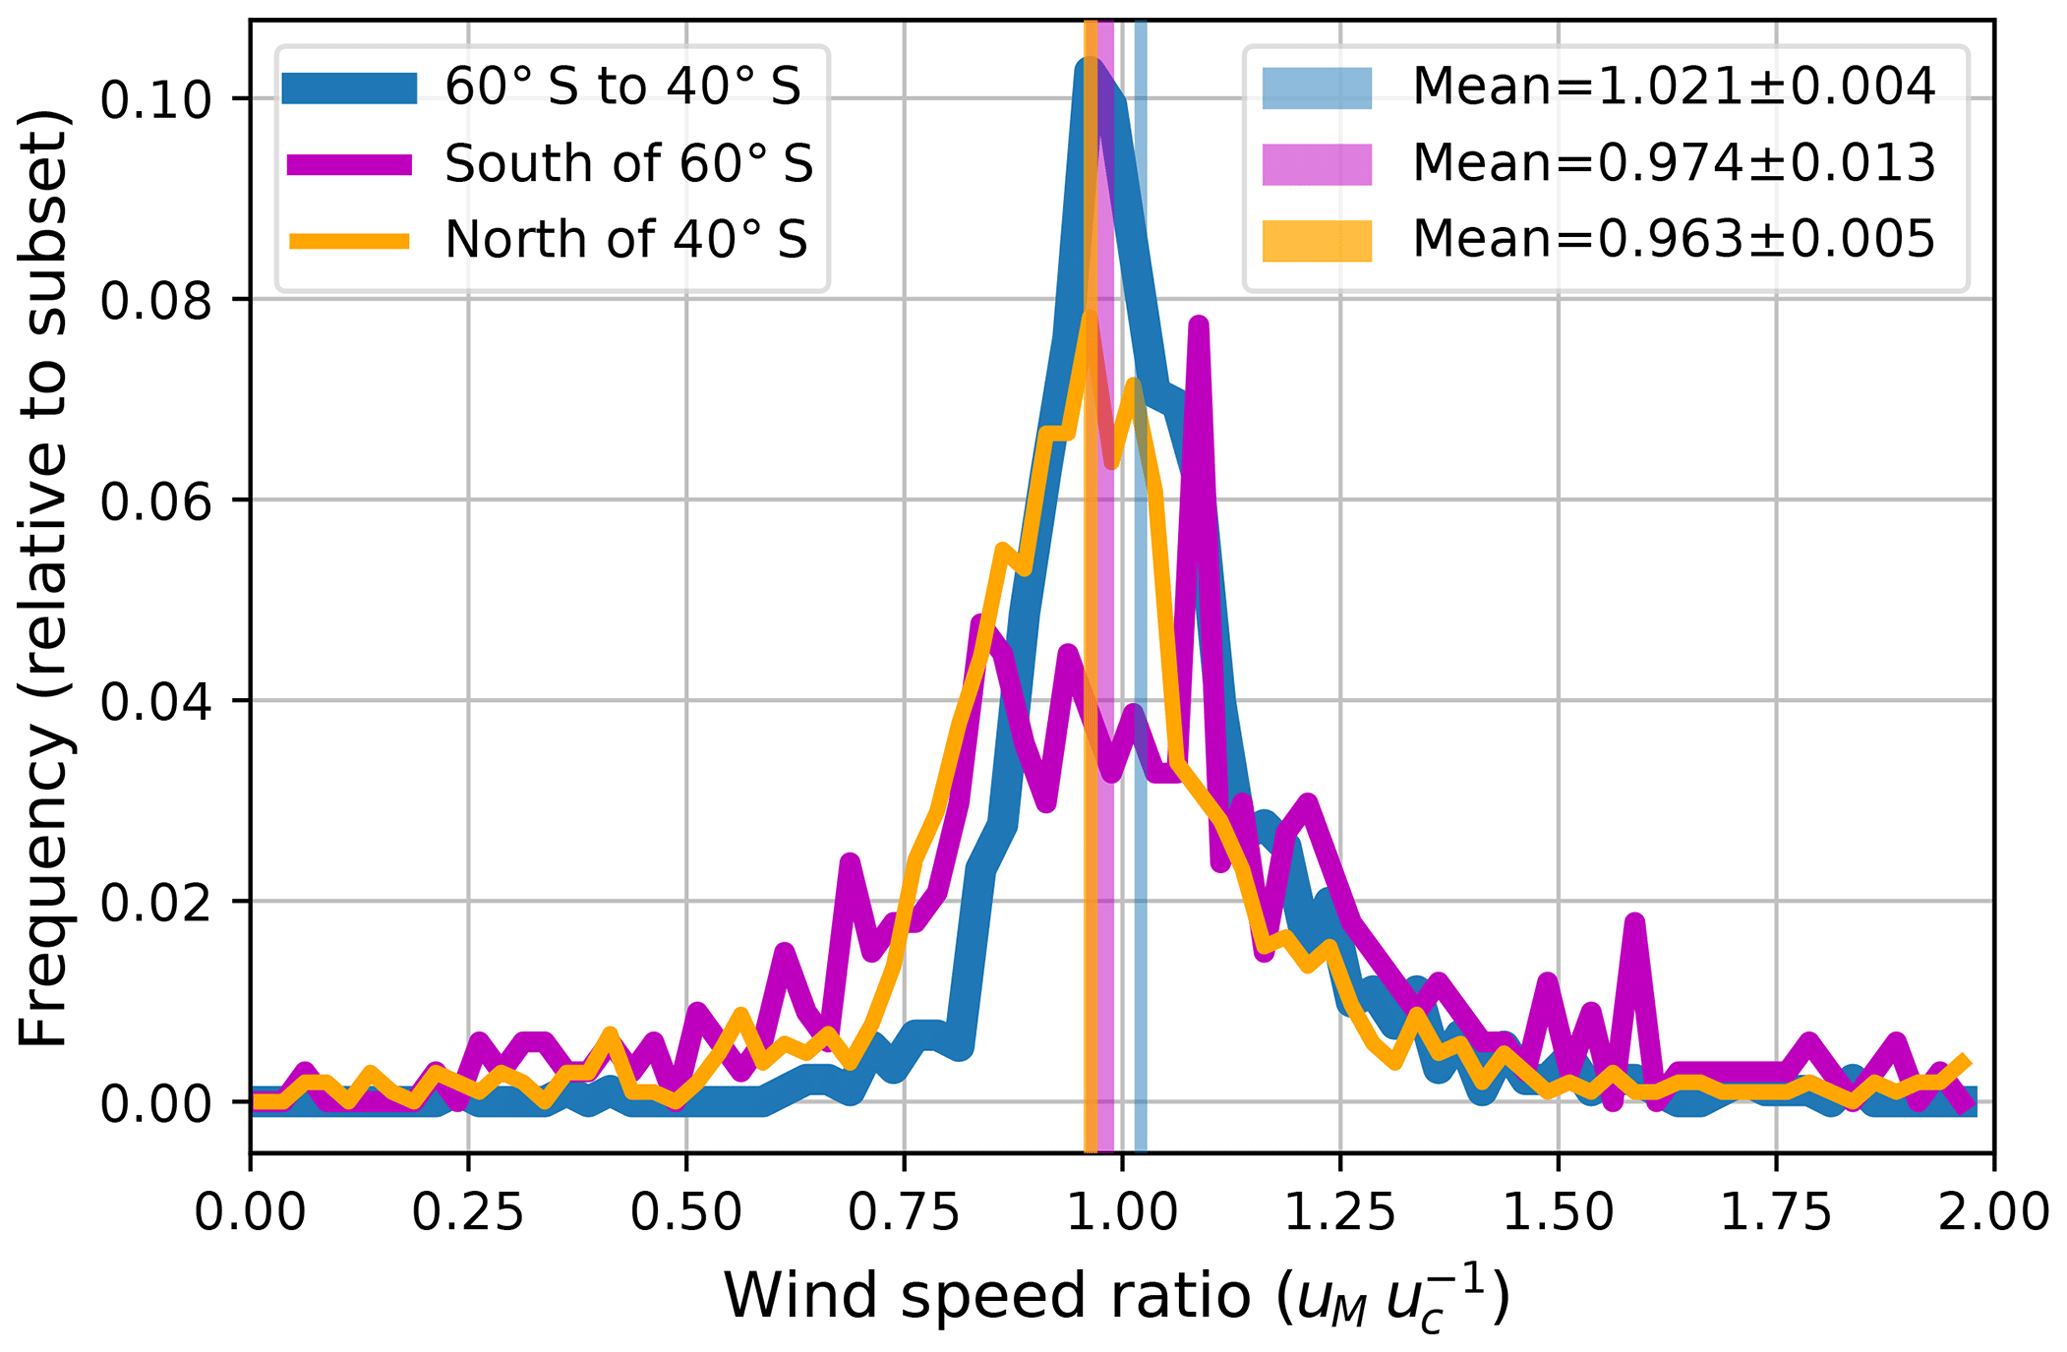
Figure 12 Histogram of the wind speed ratios for uM predicted by ERA-5 over uc estimated from the flow distortion-corrected wind speed. The dataset has been split for ship locations north of 40∘ S, between 40 and 60∘ S, and south of 60∘ S.
The comparison of the wind speed and direction measurements from the two anemometers on the R/V Akademik Tryoshnikov shows that observations are affected by airflow distortion (Fig. 4). This comparison only allows for the detection of differences between the wind speeds at the two anemometer locations, but it does not permit a quantification of the absolute flow distortion bias. We use the ERA-5 reanalysis 10 m neutral wind speed and surface heat fluxes to calculate uM, from which we derive the modelled relative wind speed rM. Due to the relatively low temporal and spatial resolution of the ERA-5 data, the full variability of the near-surface wind speed might be underestimated. Therefore, the model predictions of the true wind speed and derived estimates of the relative wind speed carry a relatively large uncertainty. This can, however, be reduced by averaging over a large number of observations. Based on the ERA-5 wind speed data, we estimate a flow distortion bias in the relative wind speed ranging from −37 % to +22 %. This magnitude is comparable to previous studies (e.g. Popinet et al., 2004; Landwehr et al., 2015).
For wind blowing from the bow, the bias in both sensors is almost identical, which leads to good agreement between the wind speed observations from the port and starboard sensors (Fig. 4). The agreement between measurements from two anemometers on the same ship is often taken as an indicator of the reliability of the wind speed observation (e.g Li et al., 2013). Our observations show that the apparent agreement of two anemometers that are affected by similar flow distortion may be misleading and highlight the case that other measures are needed to verify the quality of shipborne wind speed measurements.
When the wind speeds from the port and starboard sensors are averaged, the bias in u10N ranges from −4 % to +41 % (5th and 95th percentile range) and amounts to +11.5 % on average. The large variability in the bias in u10N throughout the cruise can affect correlations of independent variables with u10N, while the mean bias can reduce the comparability to wind speed-based parameterisations in the literature. As an example, we discuss the relation of u10N to the number concentration of particles with an aerodynamic diameter Da>700 nm (N700) which where measured with an aerodynamic particle sizer (APS; Schmale et al., 2019b). N700 is dominated by particles with an aerodynamic diameter close to 1 µm, which are likely to have a mean atmospheric residence time in the order of a few days (Lewis and Schwartz, 2004). The N700 time series has been filtered for contamination from the ship (Schmale et al., 2019a), which effectively limits the observations to . Here, we limit the dataset to open-ocean conditions during legs 1, 2, and 3, where N700 can be seen as a proxy for sea spray aerosol. Due to the long atmospheric residence time, one cannot expect a tight relation with forcing parameters of the sea spray production flux (e.g. u10N; Lewis and Schwartz, 2004). Nonetheless, the observations from ACE may be useful to constrain sea spray emission parameterisations (manuscripts in preparation). In Fig. 13, N700 is plotted against u10N. The choice of u10N calculated from uc, um, or using the ERA-5 data has an effect on the relation obtained and the potentially deduced parameterisations. In comparison to uc, the higher values of um lead to a shallower wind speed dependency. At high wind speeds , an approximately 30 % lower value of N700 would have been reported for a given wind speed. The ERA-5 data, in contrast, does not fully resolve the variability of u10N at high wind speeds and the use of to parameterise N700 would lead to the conclusion of a steeper increase in N700 with wind speed.
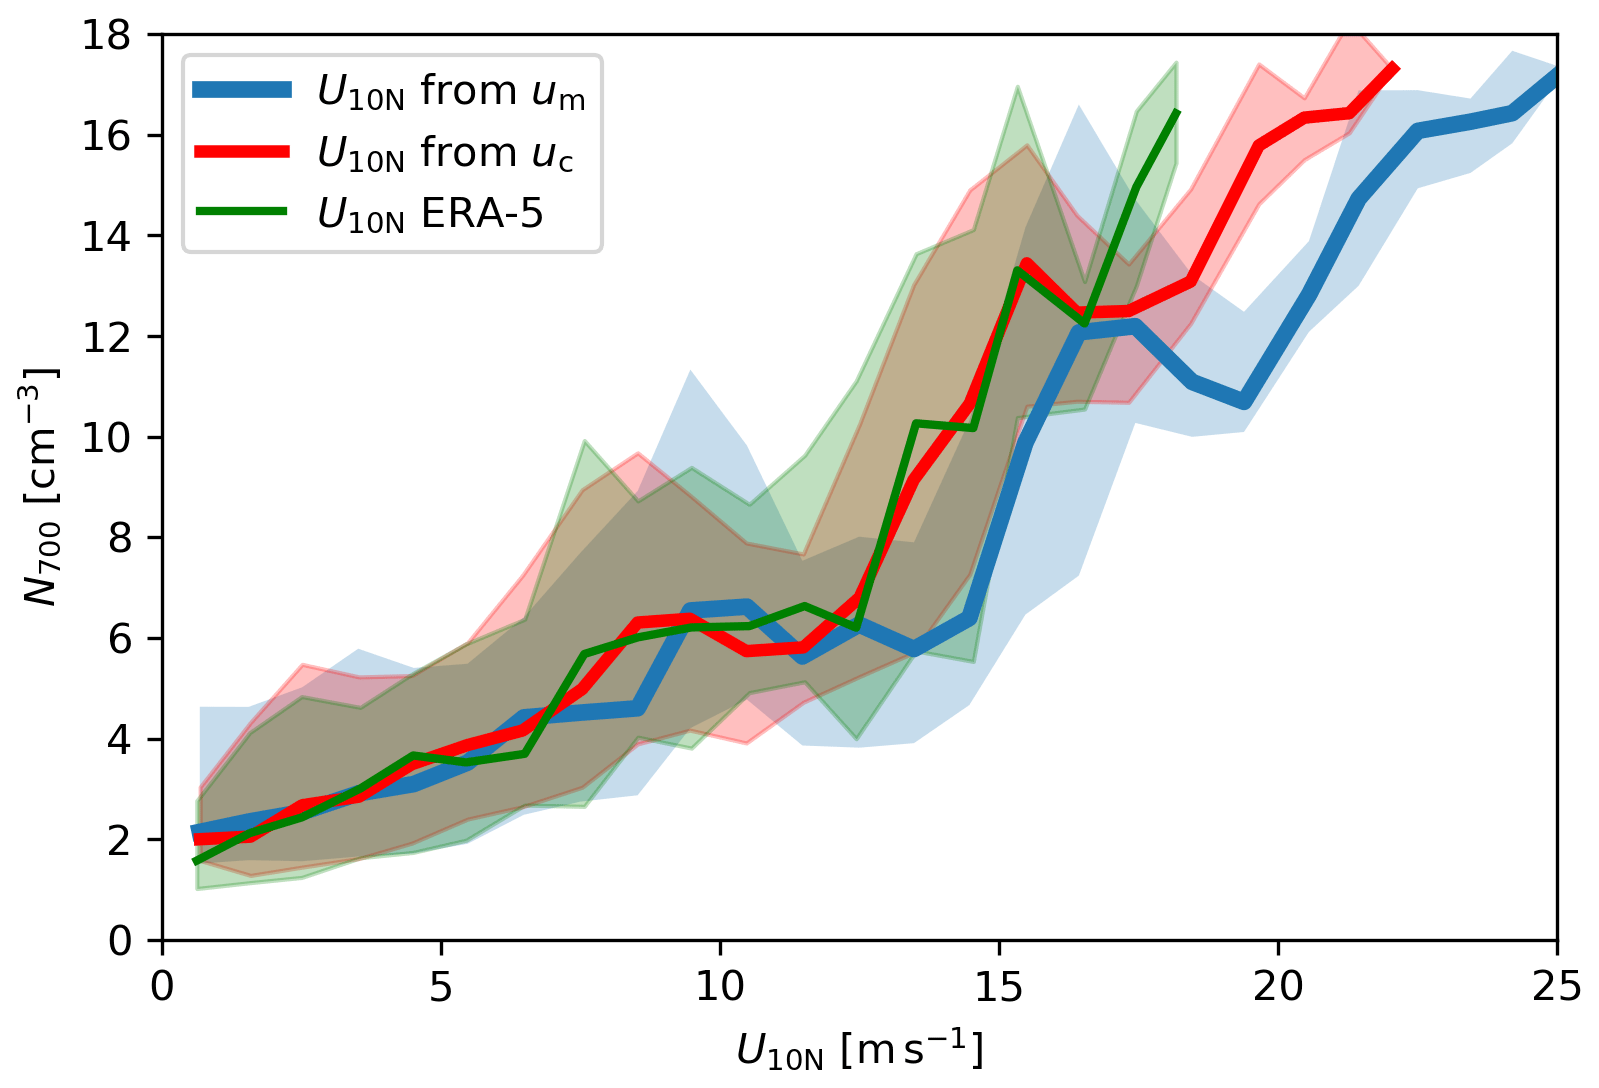
Figure 13 The concentration of particles with an aerodynamic diameter Da>700 nm from legs 1, 2, and 3 as a function of u10N. The lines show the median, and the shaded area shows the IQR calculated over 1 m s−1 wind speed bins. Only data points are included, where contamination from the exhaust stack emissions could be excluded, the calculated air mass back trajectories were over sea for at least 24 h, and the distance to the nearest landmass was more than 50 km.
The along-track variation of has apparent similarities with the bias maps that Stopa and Cheung (2014), Zhang et al. (2018), and Belmonte Rivas and Stoffelen (2019) provide from comparisons of ERA-Interim and ERA-5 with satellite-based wind speeds. The majority of the ACE data was collected between 60 and 40∘ S; thus, it is likely that a potential regional bias for this latitude band affects the estimated correction coefficients. We have evaluated the sensitivity of the proposed correction for an assumed mean bias of 5 % in the ECMWF wind speeds. For this scenario, the average bias of the corrected u10N estimate would amount to −3.6 % on average with an IQR of 2.4 %. Other uncertainties related to the wind speed profile adjustment are in the order of 1 % for the majority of the data, but the uncertainty in the stability adjustment can become significant during periods of low wind speed, when the temperature gradient between the air and the sea surface is high. However, the distribution of uncertainty in the corrected wind speed is largely reduced when compared with the variation of the bias in the u10N estimates that can be caused by the flow distortion.
Changes in the set-up between the four legs (e.g. addition or removal of containers), which could affect the airflow pattern at the anemometer locations, could account for the variability in αS and δD during ACE. There are no changes in the wind speed ratio of the port and starboard sensors between legs; thus, changes close to the anemometer location that would affect each sensor differently can be excluded. The only major modification of the ship's structures between the four legs was that an additional crane and two containers were installed on the main deck on the starboard side of the ship during leg 2. This could have potentially affected measurements in the wind sector from to , but no evidence of this was found when αS from leg 2 was compared to the other legs.
Variations in the 5 min mean roll ( to ), mainly caused by the angle of attack and strength of the wind speed, may explain a small fraction of the variability in the observed flow distortion. However, the variations in the 5 min mean pitch, mainly caused by changing loads, are less than 1∘ and no effect on the flow distortion pattern could be found.
The ACE dataset is unique in its coverage of the Southern Ocean, which is, except for a few regions, heavily under-sampled. ACE aims to establish baselines for many variables and provides the opportunity to study air–sea interaction processes in remote regions. Many of the studied phenomena such as air–sea gas exchange or sea spray production are typically parameterised with wind speed, as they vary largely with atmospheric forcing and mixing in the surface ocean and lower atmosphere. The in situ wind speed measurement as well as other meteorological variables and surface water properties thus provide an important dataset to study such phenomena.
Onboard the R/V Akademik Tryoshnikov in situ wind speed measurements were performed using two 2-D sonic anemometers, which were integrated with an automated weather station. The relative wind speed and direction recordings from both sensors differ by up to 40 % and 12∘ respectively. The difference varies with the observed relative wind direction. This indicates that the measured wind speeds are affected by flow distortion caused by the ship's superstructure. We also observe a slight dependence of the wind speed ratio on the mean roll of the ship, which varied by . An influence of the pitch angle, which varied by less than 1∘, could not be found in the data.
In order to estimate the deviation of the measured wind speed and direction from the undisturbed wind field, the observed relative wind speeds are compared against a model-derived relative wind speed which was calculated from the ERA-5 wind speeds that were interpolated onto the ship's track and translated into the ship's reference system. The flow distortion bias depends on the relative wind direction and ranges between −37 % and +22 % and between and for the relative wind speed and the relative wind direction respectively. These observed biases are based on 1121 h of observations (retained from 135 d at sea). Data in which the ERA-5 reanalysis may have been affected by the assimilation of observations reported by the R/V Akademik Tryoshnikov were excluded from this study. Data filtering and bin averaging using weighted means help to reduce the error of the bias estimates.
The biases in relative wind speed and direction can be directly used as correction factors. This correction fully preserves the high temporal resolution of the in situ wind speed measurements. In order to improve the quality of the wind speed observations the relative wind speed and direction measurements were corrected for the estimated bias prior to the calculation of true wind and u10N. When the wind speeds from the port and starboard sensors are averaged, the correction in u10N ranges from −4 % to +41 % (5th and 95th percentile range) and is +11.5 % on average. If the uncorrected u10N estimates are used with parameterisations for gas exchange or sea spray production, which are typically higher order functions of wind speed, the error propagation will lead to a much larger bias in the derived quantities.
The main advantages of the proposed weather model-based flow distortion correction for shipborne wind speeds over existing CDF-based methods are the low cost of application and the option to monitor changes in the flow distortion pattern that arise from changes in the ship's superstructure over time. However, uncertainties arising from deficiencies in the small-scale and high time resolution wind characteristics of the model reference data used require careful treatment and restrict the applicability of this method to cruises that cover a wide geographical range. It should be noted that any relative bias in the reanalysis wind speeds will cause an equally large or slightly lower bias in the corrected true wind speeds.
The ACE datasets are published on the Zenodo research data repository at https://zenodo.org/communities/spi-ace/ (Thomas, 2020). The wind speed data are accessible at https://doi.org/10.5281/zenodo.3836185 (Landwehr et al., 2020e, uncorrected data), https://doi.org/10.5281/zenodo.3836211 (Landwehr et al., 2020d, flow distortion-corrected data), and https://doi.org/10.5281/zenodo.3836439 (Landwehr et al., 2020c, u10N derived from the flow distortion-corrected data). The flow distortion bias coefficients are accessible at https://doi.org/10.5281/zenodo.3836200 (Landwehr et al., 2020a). The Python scripts that were used to estimate the flow distortion bias and to correct the wind data are accessible at https://doi.org/10.5281/zenodo.3836050 (Landwehr, 2020). The ship's track and velocity are published at https://doi.org/10.5281/zenodo.3772377 (Landwehr et al., 2020b) and were used to calculate the ships distance to land, which is published at https://doi.org/10.5281/zenodo.3832045 (Volpi et al., 2020a). The ERA-5 reanalysis data that were interpolated onto the cruise track are published at https://doi.org/10.5281/zenodo.3831980 (Volpi et al., 2020b). The meteorological data from ACE are published at https://doi.org/10.5281/zenodo.3379590 (Landwehr et al., 2019). The coarse-mode aerosol particle size distribution that was integrated to N700 is published at https://doi.org/10.5281/zenodo.2636709 (Schmale et al., 2019b). The underway measurements of the sea water temperature will be published at https://doi.org/10.5281/zenodo.3660852 (Haumann et al., 2020).
The potential effect of the ship's pitch and roll on the flow distortion pattern was studied. Figure A1 shows the effect of the mean roll on the relative wind speed ratio . The largest change in that may be attributed to the roll angle amounts to 0.07 and occurs for over a change in the roll angle from to . For other relative wind directions, the ratio is less sensitive to the roll angle. The 5 min mean pitch ranged from to . An effect of these small variations on the flow distortion pattern could not be observed in the data. Due to the high degree of complexity, no further attempt was made to derive a quantitative dependence of αS on the roll or pitch angle. We expect the contribution to the overall uncertainty of the wind direction-dependent correction factors to be small.

Figure A1Ratio of the relative wind speed recorded by the starboard and port anemometers () as a function of the relative wind direction recorded by the starboard anemometer. The ratios are computed for 1∘ intervals of the ship's roll angle, which are provided in the legend.
B1 From errors in the reference wind vector to errors in the expected relative wind speed and direction
The proposed correction relies on the calculation of the expected relative wind vector from the predicted true wind speed and the ship's velocity and heading. Figure B1 shows how the propagation of an error in uM into SM and DM depends on the relative wind direction and the ratio of ship velocity to true wind speed.
One should note that the relative wind direction observed on the ship will differ from the relative angle of heading and wind direction () if the ship has a nonzero velocity (Fig. B1a). For , we find |D|≤|Dtrue|, but all directions are possible for D. For v=u, the possible relative wind directions are restricted to with r=0 for . For v>u, the possible range of relative wind directions is restricted by , which corresponds to the situation where u and r are orthogonal and, hence, . The relative wind direction |D| will decrease again for until D=0 for .
On station, a relative error in |uM| results in the same relative error in SM independent of the relative orientation of the ship to the wind direction and DM remains unchanged.
If the ship is moving with |v|<|u|, the relative error in |uM| results in a smaller error in SM for and a magnified error for higher relative wind directions. The largest error in DM occurs for , and the error is zero for and .
For the special case of |v|=|uM|, we find that |rM|=0 is possible for and the relative uncertainty in SM and DM approaches infinity in this case. For , in contrast, the relative error in SM is only half of the error in |uM|.
If the ship is moving faster than the true wind speed, the relative error in SM will be reduced in magnitude; however, for a positive bias in |uM| results in a negative bias in SM. The resulting error in DM increases with the relative wind direction but will be smaller for the branch than for branch.
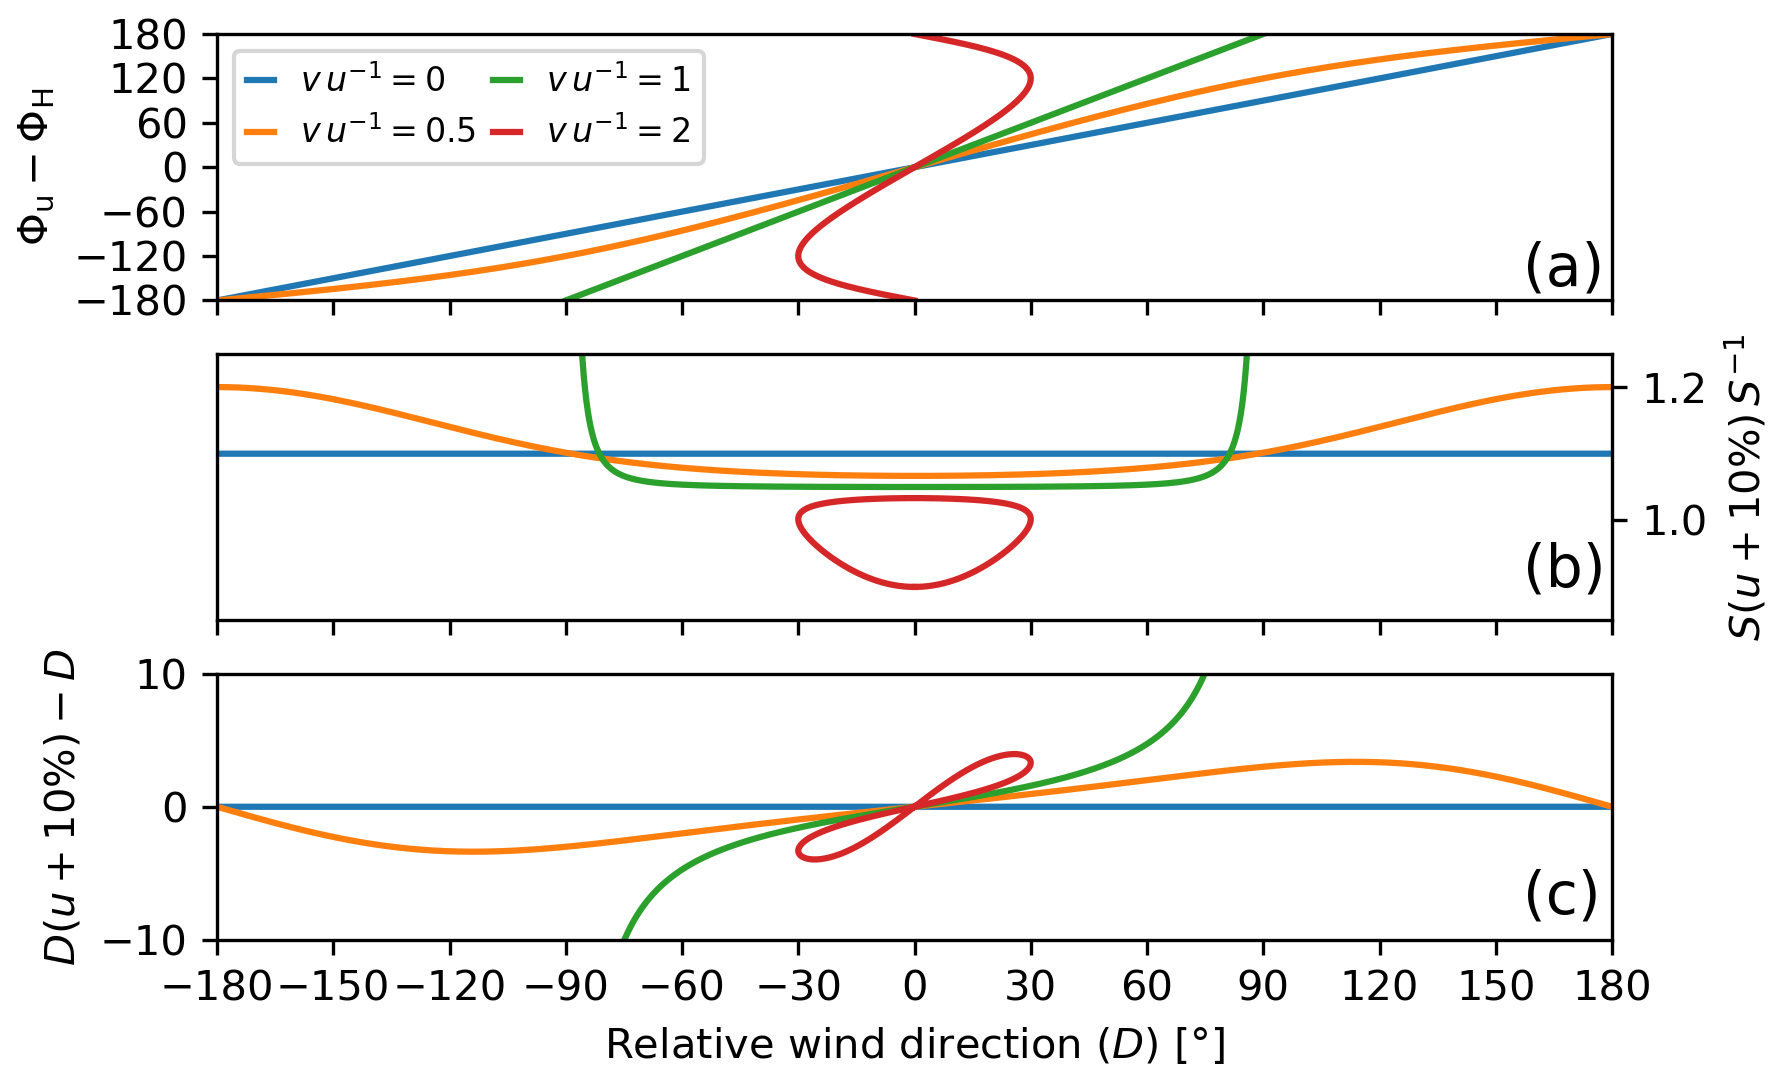
Figure B1 (a) Difference between true wind direction and ship heading as a function of the observable relative wind direction. (b) Relative change in the expected relative wind speed SM for a +10 % bias reference true wind speed (uM) as a function of the relative wind direction. Panel (c) is the same as (b) but shows the corresponding change in the estimated relative wind direction. The different coloured lines correspond to different ratios of the ship speed and the true wind speed.
B2 From errors in the measured relative wind speed (and direction) to errors in the true wind speed (and direction)
If the ship is heading into the wind with v>0, a flow distortion bias in r will have higher impact on u, whereas the relative error will be reduced for Φu=ΦH when compared with data collected while the ship is on station.
B3 Effect of a constant relative bias in the reference wind speed
Figure B2 shows the effect of an overall reduction of the ERA-5 wind speeds by 5 % on the correction factors. The sensitivity of the estimated αS to such a change in the reference wind speed depends on the relative wind direction: the lowest changes (2 %) occur for wind speeds for wind from the bow, and the largest changes (10 %) occur for respectively. The sensitivity of the wind direction bias estimate is very low. For the port sensor, the largest changes () occur at , when the sensor is in the lee of the main mast. This is the case at for the starboard sensor (not shown).
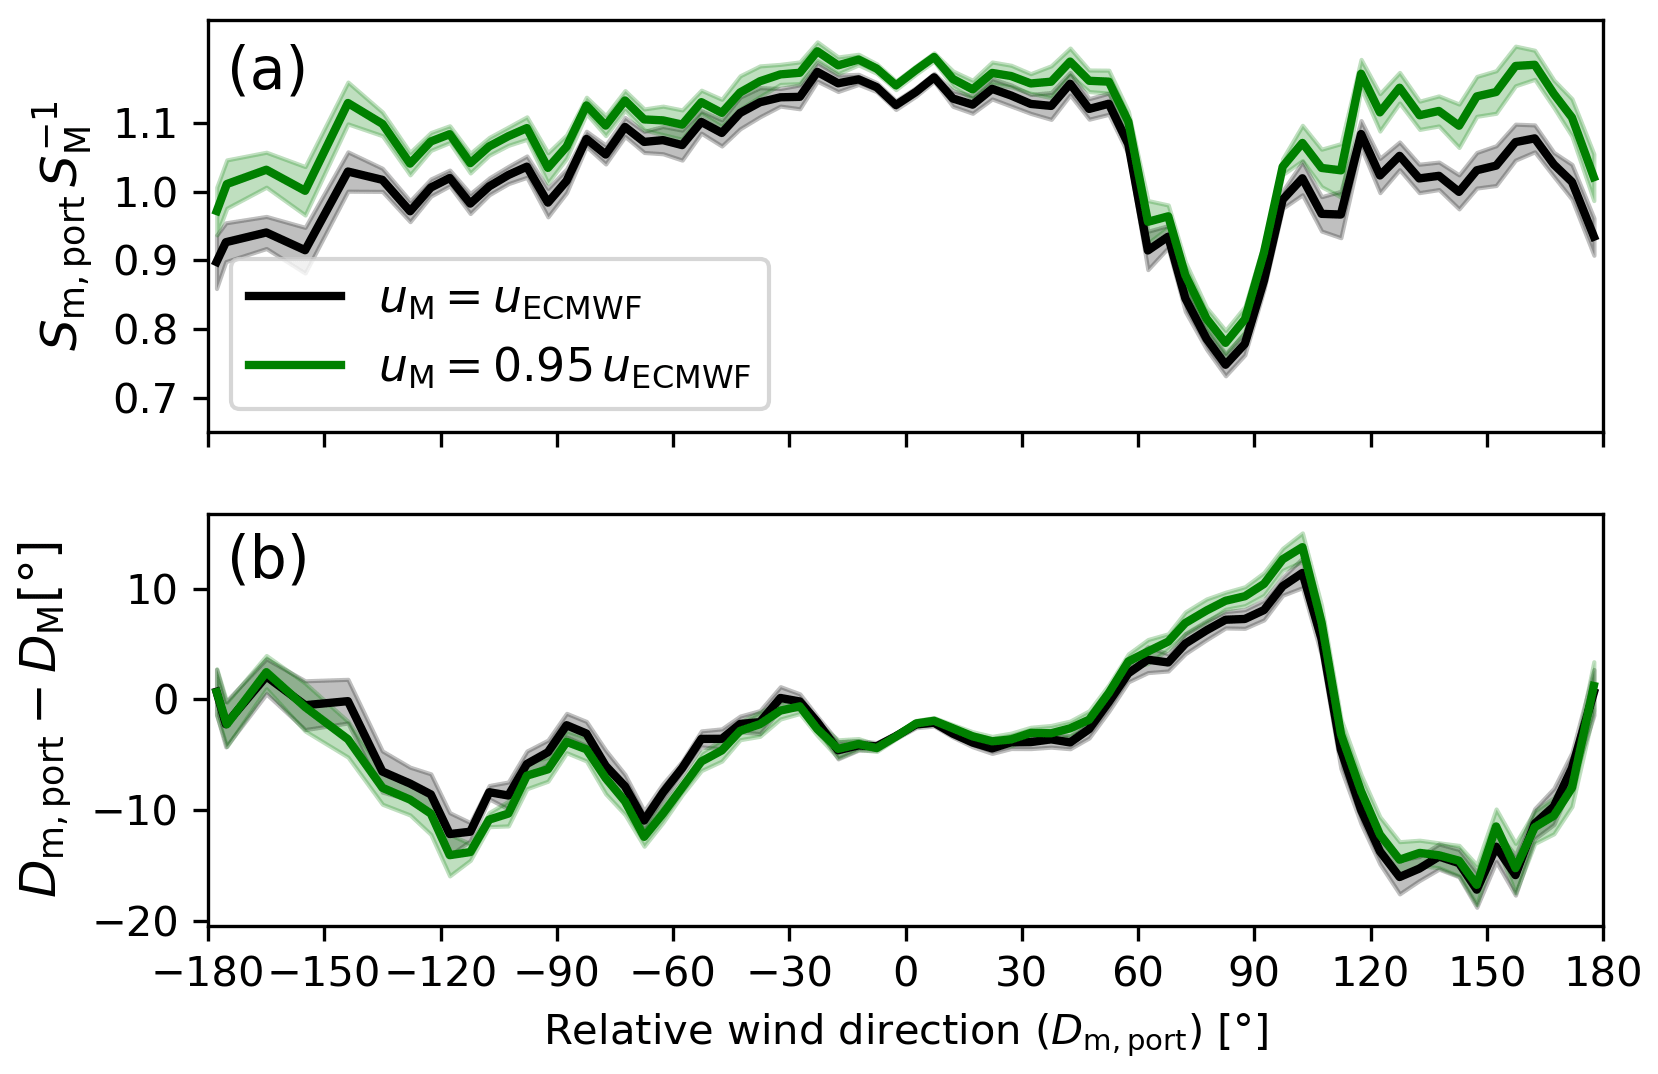
Figure B2(a) Weighted average ratio between measured (port anemometer) and expected relative wind speed as a function of relative wind direction. The black (green) curve shows the result when using the ERA-5 wind speeds (scaled with a factor 0.95) as a free-stream reference. The shaded areas denote the error of the mean. Panel (b) is the same as (a) but for the relative wind direction difference.
Figure B3 shows the integrated histogram of the ratio (cf. Fig. 9) in comparison with the change in the corrected uc for a change in the reference true wind speed by −5 % (uM−5 %). On average, this would change the estimated uc by −3.85 %. For 27 % of the data, the estimate uc would change by more than 5 % to either larger or smaller values. A change of more than 10 % would only occur for 4 % of the data (ship underway at very low wind speeds).

Figure B3 Histogram of the wind speed ratios (average of port and starboard measurements). Also shown is the relative change in the corrected uc estimate for a change of −5 % in the reference wind speed (simulating the effect of a bias in ERA-5).
Figure C1 shows as a function of Dm, port for 5 min and 1 h averages. The 1 h averages were used when at least four of the 5 min samples within the hour passed the quality control. The results are not significantly different; however, due to the lower number of the 1 h samples, reliable averages cannot be estimated for all wind direction sectors.
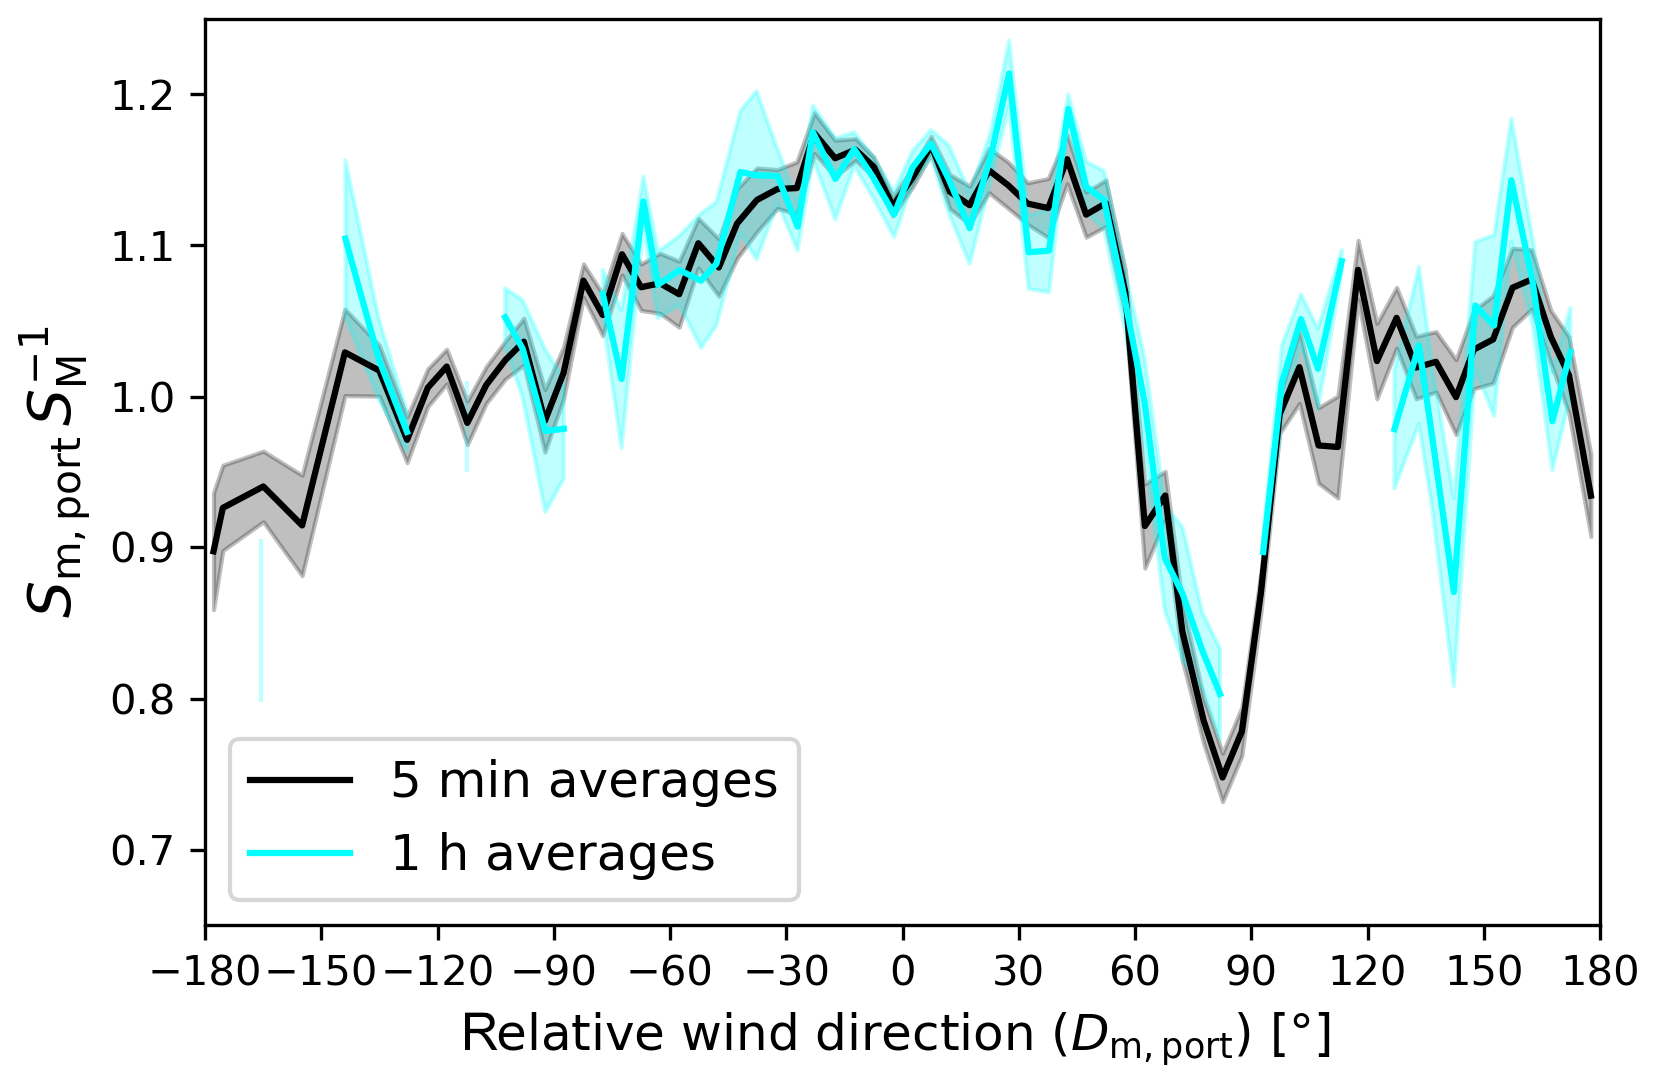
Figure C1 Weighted average ratio between measured (port anemometer) and expected relative wind speed as a function of the measured relative wind direction. The black (cyan) curve shows the result for 5 min and 1 h averages. The shaded areas denote the error of the mean.
Following the request of the Scientific Committee on Antarctic Research (SCAR) and the World Meteorological Organisation (WMO), the wind speed and direction observations from the R/V Akademik Tryoshnikov were reported to Global Telecommunication System (GTS) under the call sign UBXH3 while the ship's location was south of 60∘ S (leg 2). ECMWF provided a list of the time and location for which ground wind speed observations from UBXH3 where assimilated into the Integrated Forecast System (IFS; see Supplement). The list contains 35 entries. During the remaining legs 0, 1, 3, and 4, no data from UBXH3 was assimilated into the IFS.
ERA-5 uses 4D-Var with nonoverlapping 12 h assimilation windows that run from 09:00 to 21:00 and from 21:00 to 09:00 UTC the following day. Observations at any time within each 12 h window can affect the analysed state over the whole 12 h (ECMWF, 2016). In order to ensure that the ERA-5 estimates, which are used to estimate the flow distortion bias, are not affected by the assimilation of data from UBXH3, we exclude all observations within the 12 h windows that contain at least one instance where the observations where assimilated.
Figure D1 shows weighted averages for as a function of Dm, port calculated from the data with (and without) the exclusion of the observations that could have been affected by the assimilation of observations from the R/V Akademik Tryoshnikov. The results when using just the subset of observations that may have been affected by the assimilation of observations from the R/V Akademik Tryoshnikov are also shown. Notably, the estimates of are closer to one for this subset than for the remaining data.
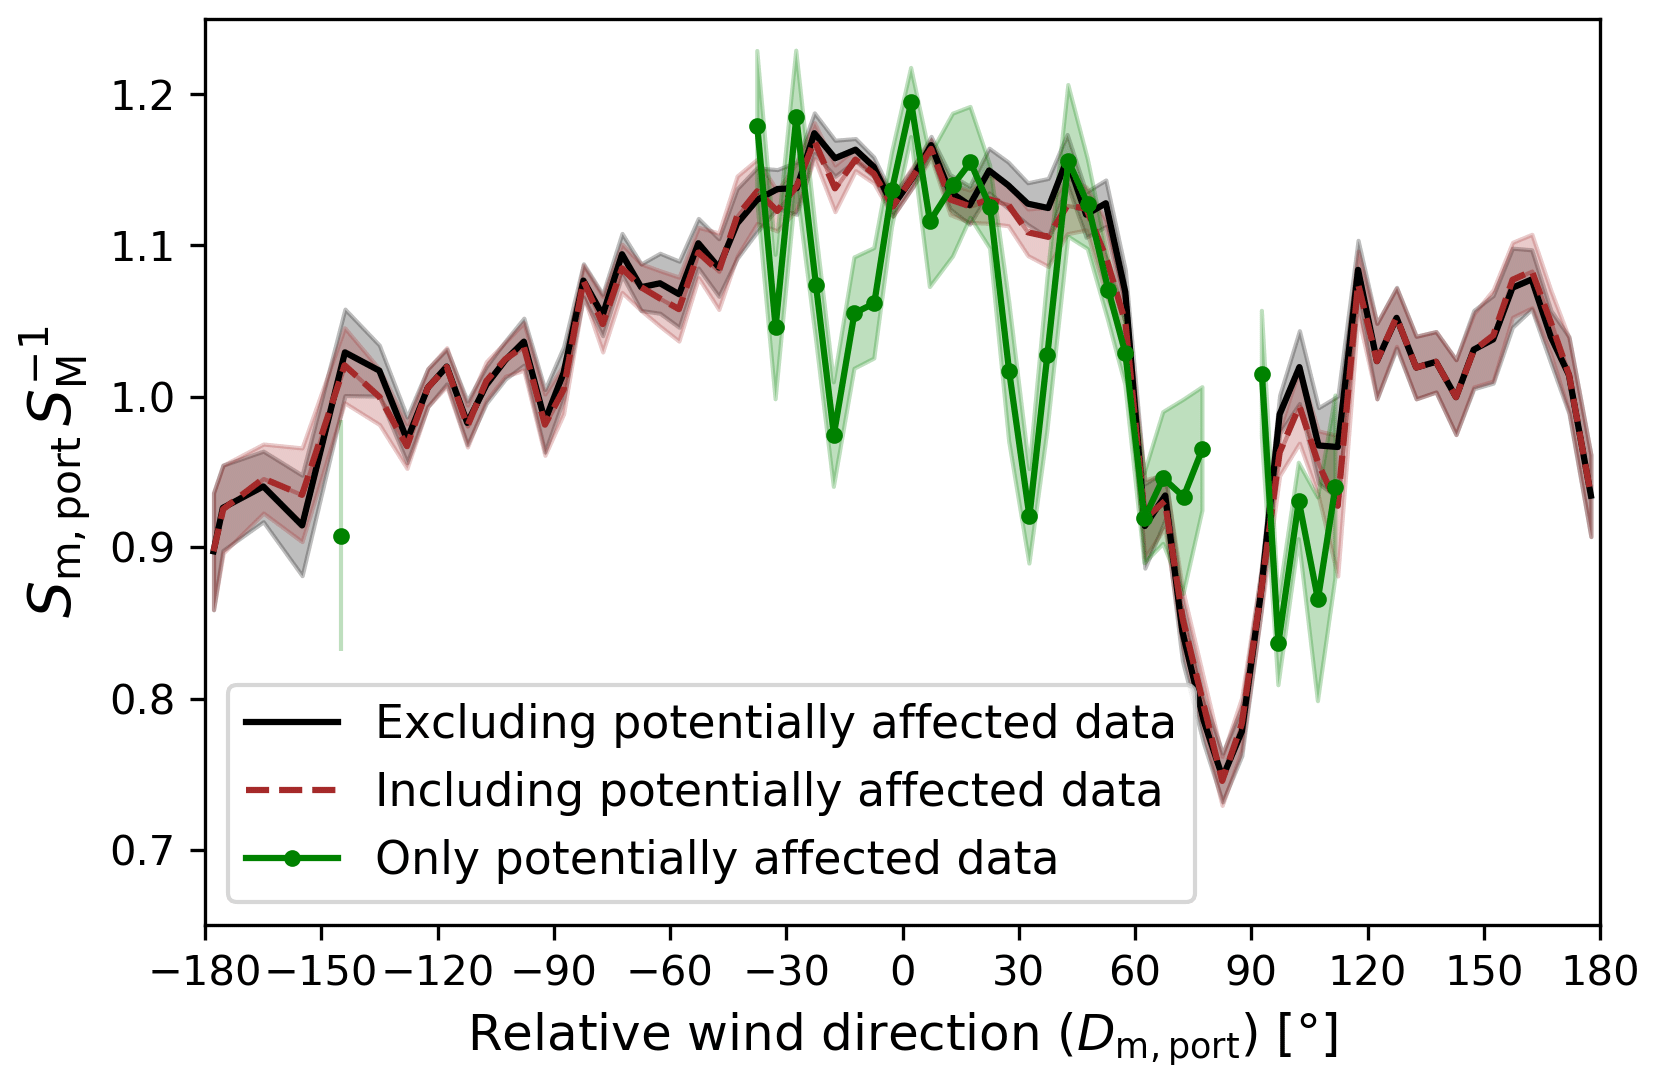
Figure D1 as function of Dm, port. The curves show the results when ERA-5 observations that could have been affected by the assimilation of the reported wind speed observations were not included (black), were included (brown), or were exclusively used for the estimation of (green). The shaded areas denote the error of the mean.
The atmospheric stability, which depends on the air–sea temperature gradient, affects the steepness of the wind speed profiles. In this work, we account for this effect using the ERA-5 heat flux estimates. In Fig. E1a, ERA-5 SST estimates are scattered against in situ observations, which are combined from the calibrated temperature measurements of underway water intake and interpolation of Advanced Very High Resolution Radiometer data onto the ship track (Haumann et al., 2020). In Fig. E1b, the ERA-5 estimates of the air temperature at 2 m a.s.l. are compared to the quality controlled in situ observations of the air temperature measured at 23.7 m a.s.l. provided for legs 1, 2, and 3 in Landwehr et al. (2019). The reanalysis results generally agree well with the observations; however, three events of elevated Ta during legs 1 and 3 (27 December 2016, 31 December 2016–1 January 2017, and 2 March 2017) are not captured in the reanalysis, and the cold air outbreak on 29 January 2017 is not fully resolved. This is reflected in different results in ΔT (see Fig. E1c) and is likely related to the larger differences between uc and uM during these periods (see Fig. E1d).

Figure E1(a) ERA-5 SST against in situ observations of the surface water temperature (Haumann et al., 2020). (b) ERA-5 air temperature at 2 m a.s.l. against Ta measured at 23.7 m a.s.l. (c) ERA-5 ΔT against the observed air–water temperature difference. The transparent scatter shows data for which observations of SST where not available. Here, ΔTm was calculated from the observed Ta and the SST estimates from ERA-5. (d) uM against uc (31.5 m wind speeds). This figure only shows data from legs 1, 2, and 3. All data are displayed as 1 h average values. The colour indicates the time of the observations (UTC) provided as day of the year 2017 (the time difference to 1 January 2017 00:00 UTC in days). The black line indicates the 1:1 line, and the shaded area is the C range.
The supplement related to this article is available online at: https://doi.org/10.5194/amt-13-3487-2020-supplement.
SL carried out the analysis and wrote the paper. IT helped with handling the ECMWF data. IT, MGB, NC, and JS contributed to the interpretation of the results, reviewed the paper, and made suggestions that improved the quality of the article.
The authors declare that they have no conflict of interest.
The ACE-SPACE project, Julia Schmale, Iris Thurnherr, and Nicolas Cassar received funding from EPFL, the Swiss Polar Institute, and Ferring Pharmaceuticals. ACE-SPACE was carried out with additional support from the European FP7 project BACCHUS (grant agreement no. 603445). Sebastian Landwehr received funding from the Swiss Data Science Center (project c17-02). Julia Schmale is the Ingvar Kamprad Chair of Extreme Environments, sponsored by Ferring Pharmaceuticals. We thank ECMWF for providing information about the assimilation of wind observations from station UBXH3. We thank Michele Volpi from the Swiss Data Science Center for support in accessing the ERA-5 reanalysis data. We are also grateful to Jenny Thomas and Carles Pina Estany for preprocessing the meteorological data from ACE.
This research has been supported by the FP7-Environment project BACCHUS (grant no. 603445), the Swiss Data Science Center (grant no. c17-02), the Swiss Polar Institute (ACE7 grant), and the Ferring Pharmaceuticals (ACE7 grant).
This paper was edited by Ad Stoffelen and reviewed by two anonymous referees.
Belmonte Rivas, M. and Stoffelen, A.: Characterizing ERA-Interim and ERA5 surface wind biases using ASCAT, Ocean Sci., 15, 831–852, https://doi.org/10.5194/os-15-831-2019, 2019. a, b, c, d, e, f
Bigorre, S. P., Weller, R. A., Edson, J. B., and Ware, J. D.: A Surface Mooring for Air–Sea Interaction Research in the Gulf Stream. Part II: Analysis of the Observations and Their Accuracies, J. Atmos. Ocean. Technol., 30, 450–469, https://doi.org/10.1175/JTECH-D-12-00078.1, 2012. a
Bourassa, M. A., Legler, D. M., O'Brien, J. J., and Smith, S. R.: SeaWinds validation with research vessels, J. Geophys. Res., 108, 3019, https://doi.org/10.1029/2001JC001028, 2003. a
Copernicus Climate Change Service (C3S) (2017): ERA5: Fifth Generation of ECMWF Atmospheric Reanalyses of the Global Climate, available at: https://cds.climate.copernicus.eu/cdsapp#!/home (last access: July 2019), 2017. a
ECMWF: Part II: Data Assimilation, in: IFS Documentation CY41R2, no. 2 in IFS Documentation, ECMWF, European Centre for Medium-Range Weather Forecasts, Shinfield Park, Reading, RG2 9AX, England, 2016. a, b
Edson, J. B., Jampana, V., Weller, R. A., Bigorre, S. P., Plueddemann, A. J., Fairall, C. W., Miller, S. D., Mahrt, L., Vickers, D., and Hersbach, H.: On the Exchange of Momentum over the Open Ocean, J. Phys Oceanogr., 43, 1589–1610, https://doi.org/10.1175/JPO-D-12-0173.1, 2013. a, b
Emond, M., Vandemark, D., Forsythe, J., Plueddemann, A. J., and Farrar, J. T.: Flow Distortion Investigation of Wind Velocity Perturbations for Two Ocean Meteorological Platforms, Technical Report, Woods Hole Oceanographic Institution, Woods Hole, MA, https://doi.org/10.1575/1912/5182, 2012. a
Fairall, C. W., Bradley, E. F., Hare, J. E., Grachev, A. A., and Edson, J. B.: Bulk Parameterization of Air–Sea Fluxes: Updates and Verification for the COARE Algorithm, J. Climate, 16, 571–591, https://doi.org/10.1175/1520-0442(2003)016<0571:BPOASF>2.0.CO;2, 2003. a
Haumann, F. A., Robinson, C., Thomas, J., Hutchings, J., Pina Estany, C., Tarasenko, A., Gerber, F., and Leonard, K.: Physical and Biogeochemical Oceanography Data from Underway Measurements with an Aqualine Ferrybox during the Antarctic Circumnavigation Expedition (ACE), Zenodo, https://doi.org/10.5281/zenodo.3660852, 2020. a, b, c, d
Ho, D. T., Law, C. S., Smith, M. J., Schlosser, P., Harvey, M., and Hill, P.: Measurements of air‐sea gas exchange at high wind speeds in the Southern Ocean: Implications for global parameterizations, Geophys. Res. Lett., 33, L16611, https://doi.org/10.1029/2006GL026817, 2006. a
Jones, R. W., Renfrew, I. A., Orr, A., Webber, B. G. M., Holland, D. M., and Lazzara, M. A.: Evaluation of Four Global Reanalysis Products Using in Situ Observations in the Amundsen Sea Embayment, Antarctica, J. Geophys. Res.-Atmos., 121, 6240–6257, https://doi.org/10.1002/2015JD024680, 2016. a, b, c
Krall, K. E., Smith, A. W., Takagaki, N., and Jähne, B.: Air–sea gas exchange at wind speeds up to 85 m s−1, Ocean Sci., 15, 1783–1799, https://doi.org/10.5194/os-15-1783-2019, 2019. a
Landwehr, S.: Swiss-Polar-Institute/Wind-Speed-Correction v0.1.0, Zenodo, https://doi.org/10.5281/zenodo.3836050, 2020. a
Landwehr, S., O'Sullivan, N., and Ward, B.: Direct Flux Measurements from Mobile Platforms at Sea: Motion and Airflow Distortion Corrections Revisited, J. Atmos. Ocean. Technol., 32, 1163–1178, https://doi.org/10.1175/JTECH-D-14-00137.1, 2015. a, b
Landwehr, S., Thomas, J., Gorodetskaya, I., Thurnherr, I., Robinson, C., and Schmale, J.: Quality-Checked Meteorological Data from the Southern Ocean Collected during the Antarctic Circumnavigation Expedition from December 2016 to April 2017, Zenodo, https://doi.org/10.5281/zenodo.3379590, 2019. a, b, c
Landwehr, S., Thomas, J., and Schmale, J.: Air-Flow Distortion Bias Factors of the Port and Starboard Anemometers of the Akademik Tryoshnikov Estimated during the Antarctic Circumnavigation Expedition (ACE) Legs 0–4 Undertaken during the Austral Summer of 2016/2017, Zenodo, https://doi.org/10.5281/zenodo.3836200, 2020a. a
Landwehr, S., Thomas, J., and Schmale, J.: Five-Minute Average Cruise Track and Ship Velocity of the Antarctic Circumnavigation Expedition (ACE) Undertaken during the Austral Summer of 2016/2017, Zenodo, https://doi.org/10.5281/zenodo.3772377, 2020b. a
Landwehr, S., Thomas, J., and Schmale, J.: Five-Minute Average Horizontal Wind Velocity Data Combined from Both Sensors (Which Has Been Corrected for Air-Flow Distortion) from the Antarctic Circumnavigation Expedition (ACE) 2016/2017 Legs 0 to 4, Zenodo, https://doi.org/10.5281/zenodo.3836439, 2020c. a
Landwehr, S., Thomas, J., and Schmale, J.: One-Minute Average Horizontal Wind Velocity Data (Which Has Been Corrected for Air-Flow Distortion) from the Antarctic Circumnavigation Expedition (ACE) 2016/2017 Legs 0 to 4, Zenodo, https://doi.org/10.5281/zenodo.3836211, 2020d. a
Landwehr, S., Thomas, J., and Schmale, J.: One-Minute Average Horizontal Wind Velocity Data (Not Corrected for Air-Flow Distortion) from the Antarctic Circumnavigation Expedition (ACE) 2016/2017 Legs 0 to 4, Zenodo, https://doi.org/10.5281/zenodo.3836185, 2020e. a
Lewis, E. R. and Schwartz, S. E.: Sea Salt Aerosol Production: Mechanisms, Methods, Measurements and Models; a Critical Review, no. 152 in Geophysical Monograph, American Geophysical Union, Washington, DC, 2004. a, b
Li, M., Liu, J., Wang, Z., Wang, H., Zhang, Z., Zhang, L., and Yang, Q.: Assessment of Sea Surface Wind from NWP Reanalyses and Satellites in the Southern Ocean, J. Atmos. Ocean. Technol., 30, 1842–1853, https://doi.org/10.1175/JTECH-D-12-00240.1, 2013. a, b, c, d
Moat, B. I., Yelland, M. J., Pascal, R. W., and Molland, A. F.: An Overview of the Airflow Distortion at Anemometer Sites on Ships, Int. J. Climatol., 25, 997–1006, https://doi.org/10.1002/joc.1177, 2005. a, b
Monahan, E. C., Spiel, D. E., and Davidson, K. L.: A Model of Marine Aerosol Generation Via Whitecaps and Wave Disruption, in: Oceanic Whitecaps, edited by Monahan, E. C. and Niocaill, G. M., vol. 2, 167–174, Springer Netherlands, Dordrecht, https://doi.org/10.1007/978-94-009-4668-2_16, 1986. a
Monin, A. S. and Obukhov, A. M. F.: Basic Laws of Turbulent Mixing in the Surface Layer of the Atmosphere, Contrib. Geophys. Inst. Acad. Sci. USSR, 151, e187, 1954. a
O'Sullivan, N., Landwehr, S., and Ward, B.: Mapping flow distortion on oceanographic platforms using computational fluid dynamics, Ocean Sci., 9, 855–866, https://doi.org/10.5194/os-9-855-2013, 2013. a, b, c
Pina Estany, C. and Thomas, J.: Swiss-Polar-Institute/Science-Cruise-Data-Management v0.1.0, Zenodo, https://doi.org/10.5281/zenodo.3360649, 2019. a
Popinet, S., Smith, M., and Stevens, C.: Experimental and Numerical Study of the Turbulence Characteristics of Airflow around a Research Vessel, J. Atmos. Ocean. Technol., 21, 1575–1589, https://doi.org/10.1175/1520-0426(2004)021<1575:EANSOT>2.0.CO;2, 2004. a, b, c, d
Schlundt, M., Farrar, J. T., Bigorre, S. P., Plueddemann, A. J., and Weller, R. A.: Accuracy of Wind Observations from Open-Ocean Buoys: Correction for Flow Distortion, J. Atmos. Ocean. Technol., 37, 687–703, https://doi.org/10.1175/JTECH-D-19-0132.1, 2020. a
Schmale, J., Baccarini, A., Thurnherr, I., Henning, S., Efraim, A., Regayre, L., Bolas, C., Hartmann, M., Welti, A., Lehtipalo, K., Aemisegger, F., Tatzelt, C., Landwehr, S., Modini, R. L., Tummon, F., Johnson, J. S., Harris, N., Schnaiter, M., Toffoli, A., Derkani, M., Bukowiecki, N., Stratmann, F., Dommen, J., Baltensperger, U., Wernli, H., Rosenfeld, D., Gysel-Beer, M., and Carslaw, K. S.: Overview of the Antarctic Circumnavigation Expedition: Study of Preindustrial-like Aerosols and Their Climate Effects (ACE-SPACE), B. Am. Meteorol. Soc., 100, 2260–2283, https://doi.org/10.1175/BAMS-D-18-0187.1, 2019a. a, b
Schmale, J., Henning, S., Tummon, F., Hartmann, M., Baccarini, A., Welti, A., Lehtipalo, K., Tatzelt, C., Landwehr, S., and Gysel-Beer, M.: Coarse Mode Aerosol Particle Size Distribution Collected in the Southern Ocean in the Austral Summer of 2016/2017, during the Antarctic Circumnavigation Expedition, Zenodo, https://doi.org/10.5281/zenodo.2636709, 2019b. a, b
Schmidt, K. M., Swart, S., Reason, C., and Nicholson, S.-A.: Evaluation of Satellite and Reanalysis Wind Products with In Situ Wave Glider Wind Observations in the Southern Ocean, J. Atmos. Ocean. Technol., 34, 2551–2568, https://doi.org/10.1175/JTECH-D-17-0079.1, 2017. a, b
Smith, S. D.: Coefficients for Sea Surface Wind Stress, Heat Flux, and Wind Profiles as a Function of Wind Speed and Temperature, J. Geophys. Res., 93, 15467, https://doi.org/10.1029/JC093iC12p15467, 1988. a
Smith, S. R., Bourassa, M. A., and Sharp, R. J.: Establishing More Truth in True Winds, J. Atmos. Ocean. Technol., 16, 939–952, https://doi.org/10.1175/1520-0426(1999)016<0939:EMTITW>2.0.CO;2, 1999. a
Stopa, J. E. and Cheung, K. F.: Intercomparison of Wind and Wave Data from the ECMWF Reanalysis Interim and the NCEP Climate Forecast System Reanalysis, Ocean Model., 75, 65–83, https://doi.org/10.1016/j.ocemod.2013.12.006, 2014. a, b, c, d, e, f, g
Thomas, J.: Swiss Polar Institute: Antarctic Circumnavigation Expedition (ACE), Zenodo, available at: https://zenodo.org/communities/spi-ace/, 21 May 2020. a
Volpi, M., Landwehr, S., Thomas, J., and Schmale, J.: Distance to the Nearest Land/Coastline (Including Small Subantarctic Islands) for the Five-Minute Average Cruise Track of the Antarctic Circumnavigation Expedition (ACE) during the Austral Summer of 2016/2017, Zenodo, https://doi.org/10.5281/zenodo.3832045, 2020a. a
Volpi, M., Landwehr, S., Thomas, J., and Schmale, J.: ERA-5 Reanalysis Results Interpolated onto the Five-Minute Average Cruise Track of the Antarctic Circumnavigation Expedition (ACE) during the Austral Summer of 2016/2017, Zenodo, https://doi.org/10.5281/zenodo.3831980, 2020b. a
Walton, D. W. H. and Thomas, J.: Cruise Report – Antarctic Circumnavigation Expedition (ACE) 20th December 2016 – 19th March 2017, Tech. rep., Zenodo, https://doi.org/10.5281/zenodo.1443511, 2018. a
Wanninkhof, R. and McGillis, W. R.: A Cubic Relationship between Air-Sea CO2 Exchange and Wind Speed, Geophys. Res. Lett., 26, 1889–1892, https://doi.org/10.1029/1999GL900363, 1999. a
Young, I. R. and Donelan, M. A.: On the Determination of Global Ocean Wind and Wave Climate from Satellite Observations, Remote Sens. Environ., 215, 228–241, https://doi.org/10.1016/j.rse.2018.06.006, 2018. a, b, c
Young, I. R., Sanina, E., and Babanin, A. V.: Calibration and Cross Validation of a Global Wind and Wave Database of Altimeter, Radiometer, and Scatterometer Measurements, J. Atmos. Ocean. Technol., 34, 1285–1306, https://doi.org/10.1175/JTECH-D-16-0145.1, 2017. a
Zhang, L., Shi, H., Wang, Z., Yu, H., Yin, X., and Liao, Q.: Comparison of Wind Speeds from Spaceborne Microwave Radiometers with In Situ Observations and ECMWF Data over the Global Ocean, Remote S., 10, 425, https://doi.org/10.3390/rs10030425, 2018. a, b, c, d, e, f
- Abstract
- Introduction
- Performance of ERA-Interim and ERA-5
- Data and methods
- Results
- Discussion
- Conclusions
- Code and data availability
- Appendix A: Effect of mean pitch and roll angle
- Appendix B: Propagation of uncertainty in the true wind correction
- Appendix C: Choice of the averaging time
- Appendix D: Exclusion of intervals affected by data assimilation
- Appendix E: Validation of the ERA-5 SST and air temperature with in situ observations
- Author contributions
- Competing interests
- Acknowledgements
- Financial support
- Review statement
- References
- Supplement