the Creative Commons Attribution 4.0 License.
the Creative Commons Attribution 4.0 License.
 | 10 Aug 2020
An overview of and issues with sky radiometer technology and SKYNET
Teruyuki Nakajima
Monica Campanelli
Huizheng Che
Victor Estellés
Hitoshi Irie
Sang-Woo Kim
Jhoon Kim
Tomoaki Nishizawa
Govindan Pandithurai
Vijay Kumar Soni
Boossarasiri Thana
Nas-Urt Tugjsurn
Kazuma Aoki
Sujung Go
Makiko Hashimoto
Akiko Higurashi
Stelios Kazadzis
Pradeep Khatri
Natalia Kouremeti
Rei Kudo
Franco Marenco
Masahiro Momoi
Shantikumar S. Ningombam
Claire L. Ryder
Akihiro Uchiyama
Akihiro Yamazaki
This paper is an overview of the progress in sky radiometer technology and the development of the network called SKYNET. It is found that the technology has produced useful on-site calibration methods, retrieval algorithms, and data analyses from sky radiometer observations of aerosol, cloud, water vapor, and ozone.
A formula was proposed for estimating the accuracy of the sky radiometer calibration constant F0 using the improved Langley (IL) method, which was found to be a good approximation to observed monthly mean uncertainty in F0, around 0.5 % to 2.4 % at the Tokyo and Rome sites and smaller values of around 0.3 % to 0.5 % at the mountain sites at Mt. Saraswati and Davos. A new cross IL (XIL) method was also developed to correct an underestimation by the IL method in cases with large aerosol retrieval errors.
The root-mean-square difference (RMSD) in aerosol optical thickness (AOT) comparisons with other networks took values of less than 0.02 for λ≥500 nm and a larger value of about 0.03 for shorter wavelengths in city areas and smaller values of less than 0.01 in mountain comparisons. Accuracies of single-scattering albedo (SSA) and size distribution retrievals are affected by the propagation of errors in measurement, calibrations for direct solar and diffuse sky radiation, ground albedo, cloud screening, and the version of the analysis software called the Skyrad pack. SSA values from SKYNET were up to 0.07 larger than those from AERONET, and the major error sources were identified as an underestimation of solid viewing angle (SVA) and cloud contamination. Correction of these known error factors reduced the SSA difference to less than 0.03.
Retrievals of other atmospheric constituents by the sky radiometer were also reviewed. Retrieval accuracies were found to be about 0.2 cm for precipitable water vapor amount and 13 DU (Dobson Unit) for column ozone amount. Retrieved cloud optical properties still showed large deviations from validation data, suggesting a need to study the causes of the differences.
It is important that these recent studies on improvements presented in the present paper are introduced into the existing operational systems and future systems of the International SKYNET Data Center.
Please read the corrigendum first before continuing.
-
Notice on corrigendum
The requested paper has a corresponding corrigendum published. Please read the corrigendum first before downloading the article.
-
Article
(6514 KB)
-
The requested paper has a corresponding corrigendum published. Please read the corrigendum first before downloading the article.
- Article
(6514 KB) - Full-text XML
- Corrigendum
- BibTeX
- EndNote


A sun–sky radiometer is a narrow-band filter photometer able to perform measurements of direct solar and diffuse sky radiation at selected wavelengths and at several scattering angles. Observed data have large information content for aerosol, cloud, and gaseous constituents but are difficult to retrieve because of the need for full radiative transfer computation to quantify single- and multiple-scattered radiation.
The origin of the idea of the technology dates back to the beginning of the last century (Shaw, 2006). Long-term direct solar and diffuse sky measurements were carried out during 1923–1957 by the Smithsonian Astronomical Observatory by monitoring the solar constant with a pyrheliometer at Montezuma (Chile) and Table Mountain (California) (Abbot, 1911; Ångström, 1961, 1974; Roosen et al., 1973; Hoyt, 1979a, b). Diffuse sky irradiance in the circumsolar or solar aureole region was measured by the pyranometer to correct for the atmospheric effects in the measured solar constant (Abbot and Aldrich, 1916). This method was also used by Kalitin (1930), Fesenkov (1933), and Pyaskovskaya-Fesenkova (1957) (Terez and Terez, 2003). By the 1970s, spectral measurements of the direct solar radiation became popular for air pollution monitoring via the introduction of a low-cost compact narrow-band radiometer called a sun photometer, with a silicon photodiode and cutoff or interference optical filters (Volz, 1959, 1974). In parallel, pioneering measurements of spectral diffuse sky radiance started from the ground and aircraft (Bullrich, 1964; Bullrich et al., 1967, 1968; Murai, 1967; Eiden, 1968; Green et al., 1971; Gorodetskiy et al., 1976; Twitty et al., 1976). They were attracted by the characteristic radiance distributions, including bright circumsolar region and neutral points of the degree of polarization in the sky dome. Theoretical and inversion schemes for the involved ill-conditional problems were studied for data analysis (Deirmendjian, 1957, 1959; Phillips, 1962; Twomey 1963; de Bary, 1964; Turchin and Nozik, 1969; Yamamoto and Tanaka, 1969; Dave, 1971; Shifrin et al., 1972; Shifrin and Gashko, 1974).
By the 1980s, analyses of combined sun and sky radiation data became comprehensive (e.g., O'Neill and Miller, 1984a, b; Tanaka et al., 1986; Tanré et al., 1988) after full yet fast radiative transfer computation became possible, allowing quantification of the multiple-scattering component of sky radiance and retrieval of the column-averaged size distribution and the complex refractive index of polydispersed aerosol (Twitty, 1975; Weinman et al., 1975; Box and Deepak, 1978, 1979; Nakajima et al., 1983; O'Neill and Miller, 1984b; Tanré et al., 1988; Tonna et al., 1995; Dubovik and King, 2000; Dubovik et al., 2000, 2002). Networks of radiometers have been developed to utilize sun and sky measurement data for various applications, such as satellite remote sensing validation, air pollution monitoring, and the study of the climate effects of atmospheric constituents, as overviewed by Holben et al. (2001). The largest network is NASA AERONET (Holben et al., 1998) developed in the early 1990s and currently with more than 500 sun–sky photometers. Later, in the 2000s SKYNET was formed with sky radiometers (Nakajima et al., 2007). Compared to the AERONET technology, SKYNET has several differences in measurement and analysis methods.
SKYNET is for research purposes without a centralized data analysis system and its information is scattered in independent papers and documents, which makes SKYNET difficult to understand for the science community. As a result, this paper intends to put forward an overview of the key findings of and issues with SKYNET to provide better information for the community.
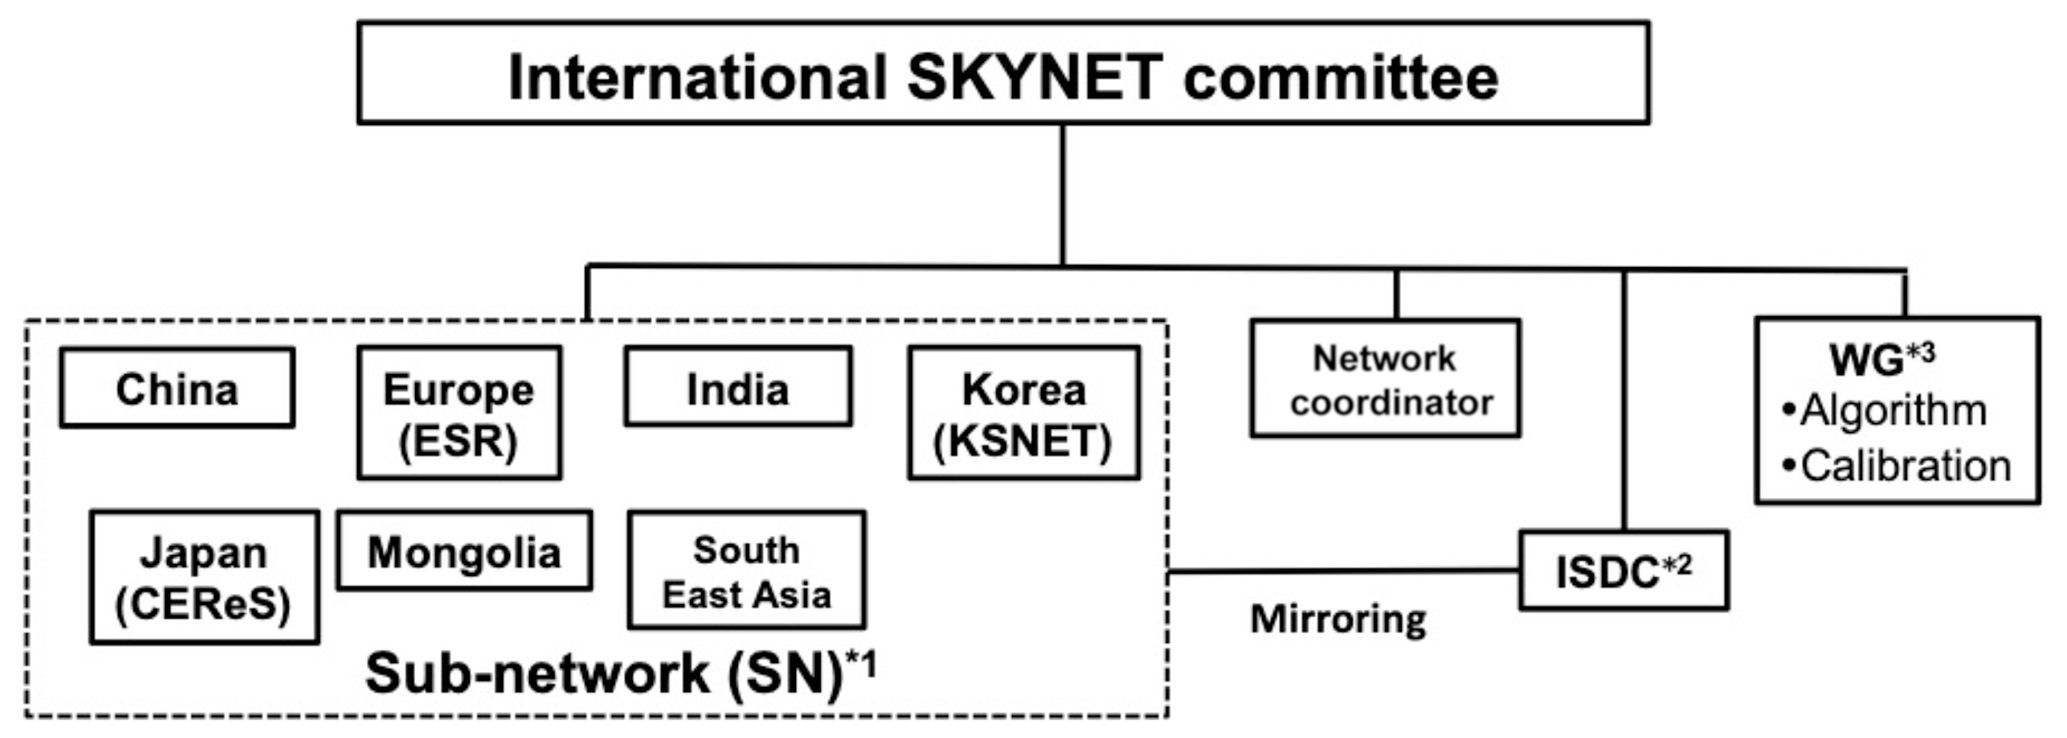
SKYNET is a research group of users of sky radiometers that was initiated around the time of the East Asian Regional Experiment (EAREX) 2005 (Nakajima et al., 2007), one of the regional experiments under the UNEP Atmospheric Brown Cloud (ABC) project (Ramanathan et al., 2007). A number of sky radiometers were deployed in the East Asian region for measuring aerosol optical properties in order to estimate the aerosol impact on the Earth's radiation budget (Takamura et al., 2004; Khatri et al., 2010). Since then, users of sky radiometers have kept growing globally and the number of sky radiometers now exceeds 100 units. Table 1 and Fig. 1 show the sky radiometer sites as recognized by the International SKYNET Committee (ISC). Users established regional sub-network groups in China, Europe, India, Japan, South Korea, Mongolia, and Southeast Asia for data analysis and formed the ISC to discuss international collaboration issues (Fig. 2). Historically, two major groups were grown for regional data collection and analysis: the SR-Center for Environmental Remote Sensing (SR-CEReS) of Chiba University (Takamura et al., 2004, 2009, 2013) and the European SKYNET Radiometers network (ESR) (Campanelli et al., 2004, 2007, 2012). Analysis systems were developed by the sub-networks independently, and thus analysis methods and data archive systems have not been unified.
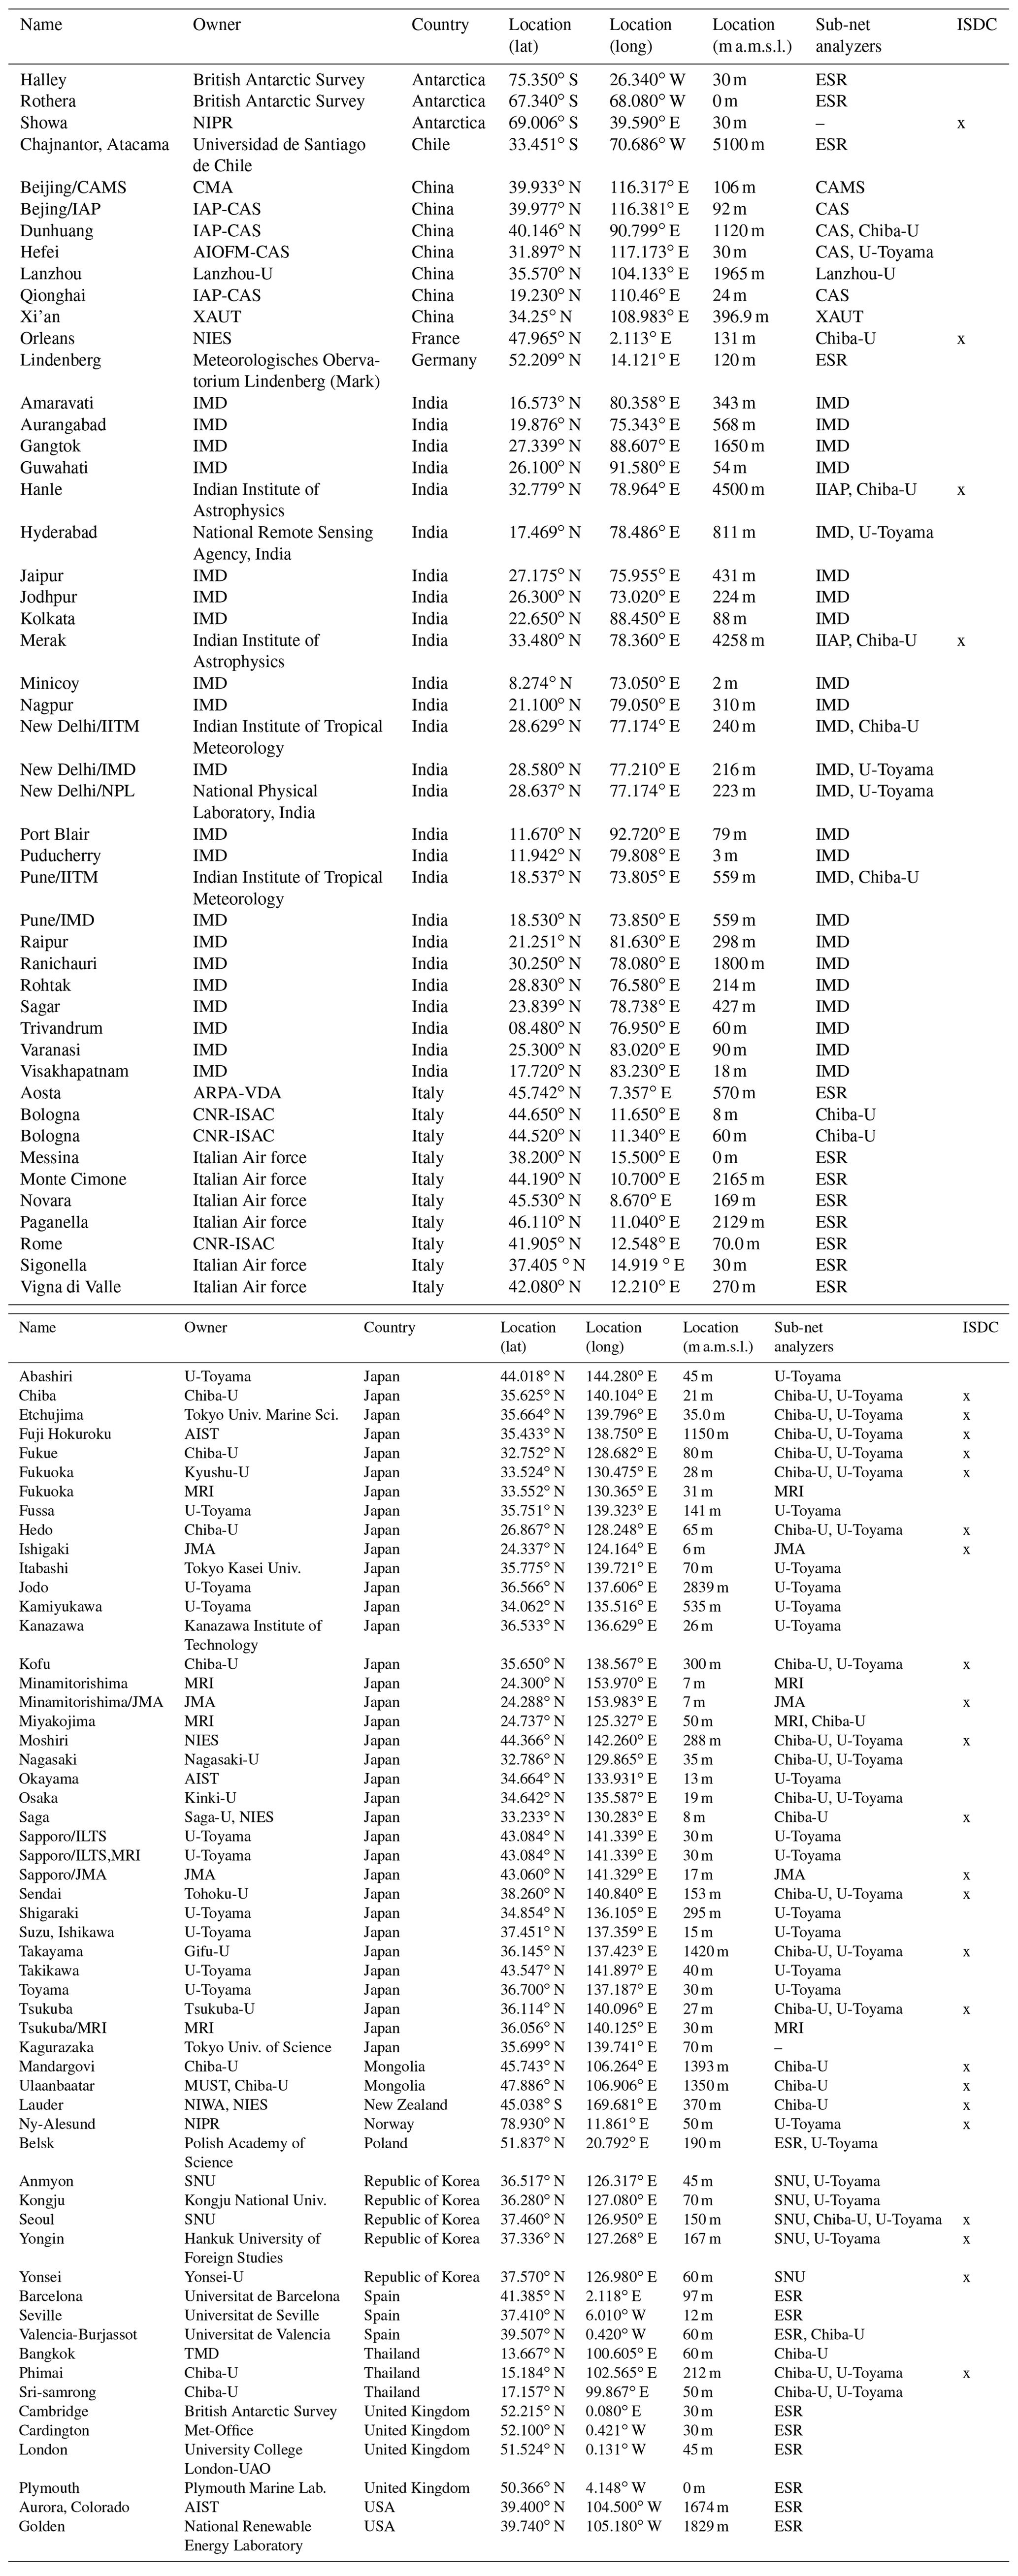

Figure 1A map of the sky radiometer sites.
In 2017, SKYNET became a contributing network of the WMO Global Atmospheric Watch (GAW) (https://community.wmo.int/activity-areas/gaw, last access: 21 July 2020). In this expanding situation of SKYNET having more burden and responsibility, the ISC decided to establish the International SKYNET Data Center (ISDC) at the National Institute for Environmental Studies (NIES) in Japan to start a shared data collection and analysis based on the memorandum of understanding (MOU) between users and the ISDC. Among the sites in Table 1, the ISDC started receiving data from 25 sites across the world. The ISDC is going to provide standard products from the SKYNET network, whereas the regional sub-networks will develop new research products and test new methodologies.
The main instrument of SKYNET is the sky radiometer manufactured by PREDE Co., Ltd. Several versions of the radiometer have been made at user requests. POM-01 is the standard version, with seven wavelengths of λ=315, 400, 500, 675, 870, 940, and 1020 nm, and POM-02 is an extended version, with UV wavelengths of 340 and 380 nm and shortwave infrared wavelengths of 1600 and 2200 nm. Channels of 315 and 940 nm are installed for ozone and water vapor amount retrievals. Full widths at half maximum of band-pass filters are 3 nm or less for channels shorter than 380 nm, 10 nm between 400 and 940 nm, and 20 nm for longer wavelengths. There is a modified version of POM-02 for lunar photometry (Uchiyama et al., 2019). Shipborne versions have been also built (Kobayashi and Shiobara, 2015).
Sky radiometer readings of direct solar and diffuse sky measurements, Vd and Vs, are related to the direct solar irradiance Fd and sky radiance at the mean Earth orbit as follows:
where CR is the radiometric sensitivity or calibration coefficient of the radiometer to translate the radiometer reading to irradiance unit, e.g., W m−2 nm−1; ΔΩ is the solid viewing angle (SVA) of the radiometer; and Res is the sun–Earth distance in astronomical units. SKYNET remote sensing uses the beam transmittance Td of the atmosphere and relative sky radiance R (Nakajima et al., 1986)
where τ is the optical thickness (OT) of the atmosphere consisting of molecular optical thickness τm, single-scattering albedo (SSA) ωm, aerosol optical thickness (AOT) τa, and SSA ωa in the clear sky condition; F0 is the extraterrestrial solar irradiance (ESI); (θ0, φ0) and (θ, φ) are zenith and azimuthal angles of the sun and the line of sight of the sky radiometer, respectively; m0 and m are optical air masses for solar insolation and the line of sight of the radiometer, which are approximated as 1∕cos (θ0) and 1∕cos (θ) for plane-parallel geometry of the atmosphere. SKYNET adopts on-site calibration routines to determine the two radiometric constants, F0 and ΔΩ, using the improved Langley plot method (hereafter, IL or ILP) and the disk scan method (Nakajima et al., 1996; Boi et al., 1999; Uchiyama et al., 2018a, b), as discussed in Sect. 3 and 4. Under the condition that CR and F0 do not change between the time of measurement and time of F0 determination, Td and R do not depend on the calibration coefficient CR, and thus we can select the radiometer reading for F0, i.e., CR=1, without the absolute radiometric calibration. Under this assumption, F0 in the radiometer reading is sometimes called a calibration constant. In order to meet this condition, the on-site calibration is required to be performed as frequently as possible to monitor change of CR due to machine condition change and F0 change due to solar luminosity change.
Standard measurement protocols of SKYNET are as follows. Direct solar irradiance is measured every 1 min. Diffuse sky radiance is measured by full almucantar scan at scattering angles from the set of for θ0≤78∘, whereas the forward almucantar scan is made in Θ≤30∘ for obtaining quick scan data for ILP and/or in a condition of rapid air mass change for θ0>78∘. AERONET adopts a two-side scan of the sun for a symmetry check and spatial averaging of sky radiances to minimize the inhomogeneous effects. On the other hand, SKYNET basically uses a one-side almucantar scan of the sun to save on observation time. At some sites, however, the almucantar scan is made on either side of the sun alternatively, and the retrieval is made for each side separately to evaluate inhomogeneous aerosol distribution in space and time. The sky radiometer has several angle scan modes, i.e., almucantar scan, principal plane scan, cloud scan, and solar disk scan. There are two temporal sampling modes of a regular time interval of 10 min (mode 1) and a regular solar air mass interval of 0.25 (mode 2). Most of the sites in Table 1 adopt the mode 1 measurement with a one-side almucantar scan. The disk scan mode is scheduled once a week at 10:00 LT, though the scan time can be changed according to the user's plan. A cloud scan mode at nadir is taken every 10 min at POM-02 sites and some POM-01 sites.
Once the radiometric constants are determined, the direct solar irradiance F and relative sky radiance R are used for the level 2 (L2) analysis, i.e., retrievals of the geophysical parameters of aerosol, cloud, water vapor, and ozone, as discussed later in Sect. 5. The flow of sky radiometer measurements and data analysis are schematically depicted in Fig. 3. As overviewed in the following sections, F0 and SVA are obtained on-site through various Langley plot methods and the solar disk scan method using data from direct solar and forward scan measurements. Cloud screening is also performed differently by different sub-networks. The ESR performs a cloud screening for a direct solar measurement at 1 min frequency using a procedure based on the methodology developed by Smirnov et al. (2000), Estellés et al. (2012) and Song et al. (2014). Cloud screening for sky measurements uses the downward shortwave radiative flux measured by a co-located pyranometer (Khatri and Takamura, 2009), otherwise they do not perform cloud screening for sky data. CEReS conducts the cloud screening with the method of Khatri and Takamura (2009) but without using global irradiance data from a pyranometer (Irie et al., 2019). It corresponds to the combination of a spectral variability test (Kaufman et al., 2006) and statistical analysis test of Smirnov et al. (2000) including checking the number of data, the diurnal stability check, smoothness criteria, and three standard deviation criteria but without a triplet stability criteria test. We do not use several quality control tests, such as the angular steepness of the solar aureole, for a stricter cloud filter as is done for AERONET (Giles et al., 2019).
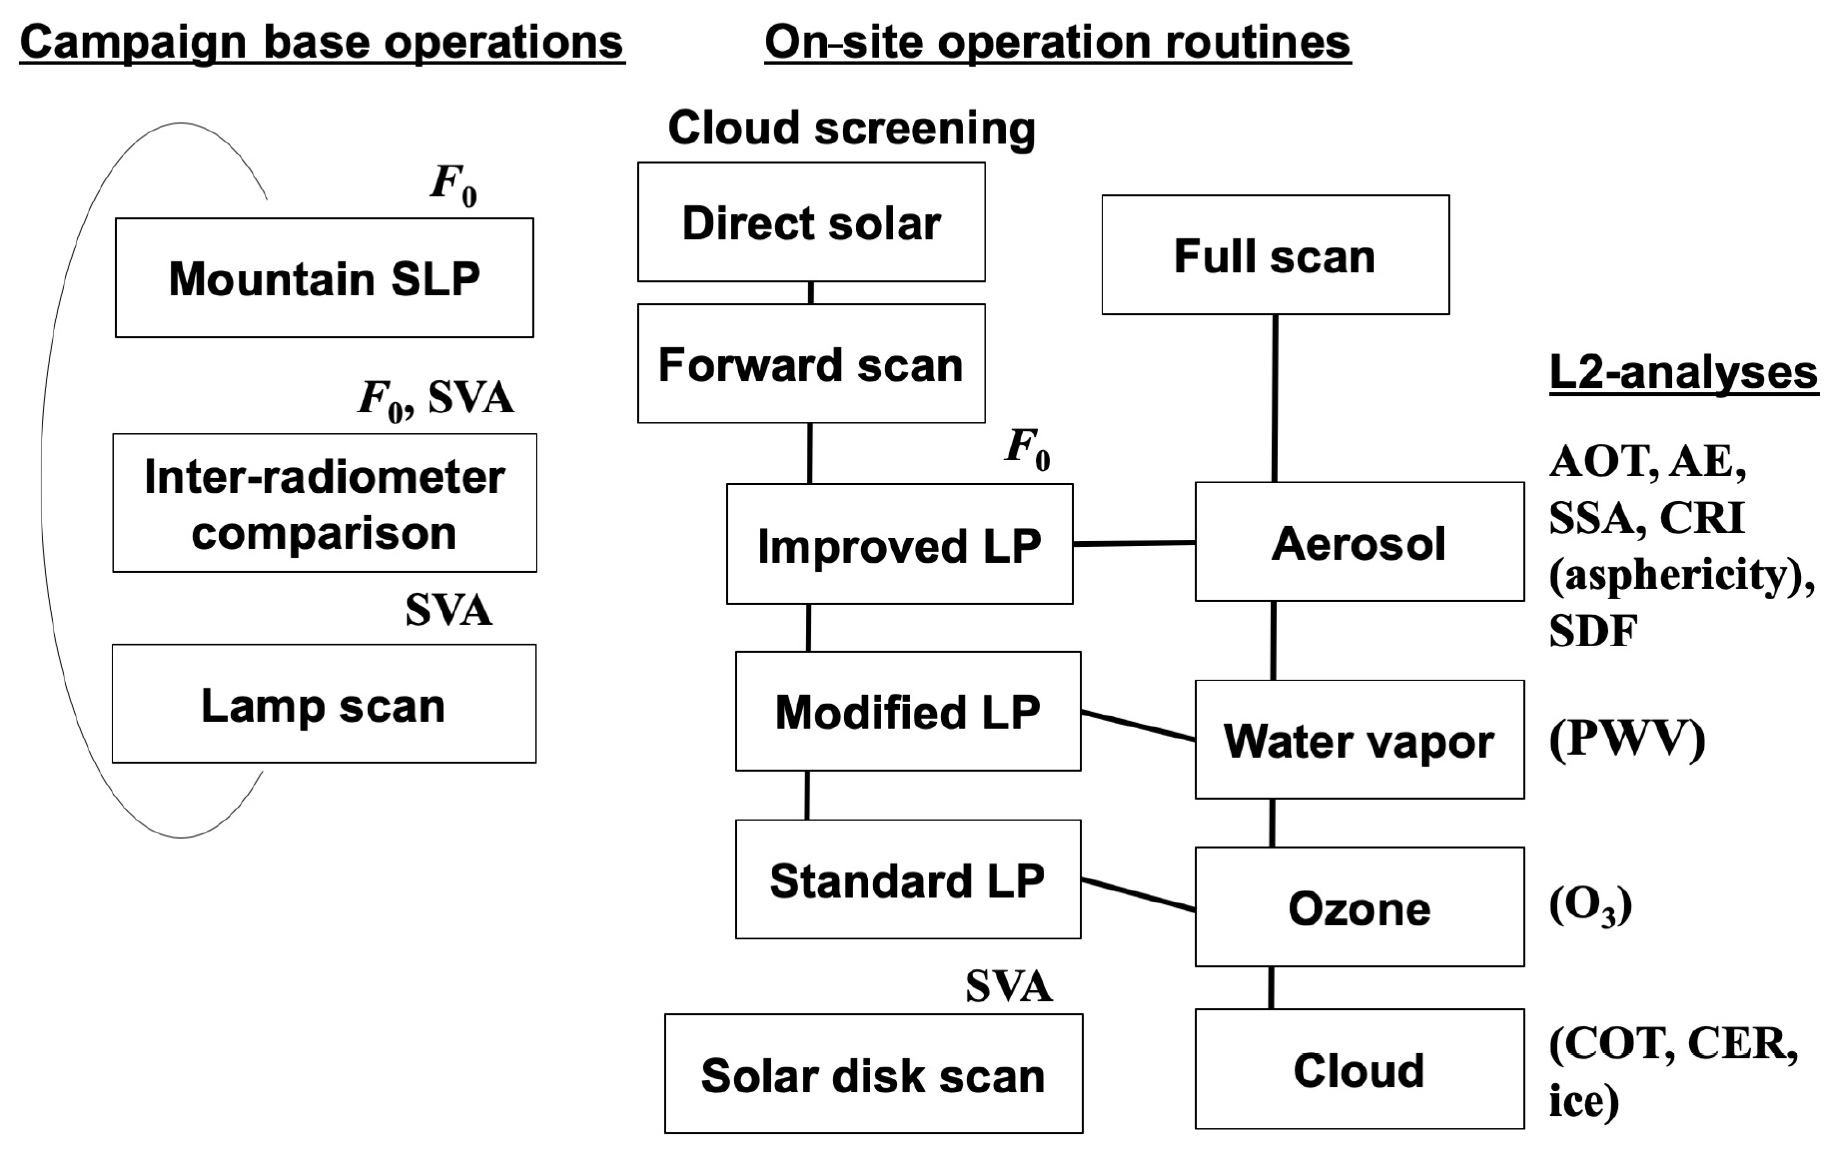
Figure 3A flowchart of the SKYNET analysis. Quantities in parentheses are research products.
Table 2Geophysical parameter products, versions of Skyrad pack, and availability of the known data archives.
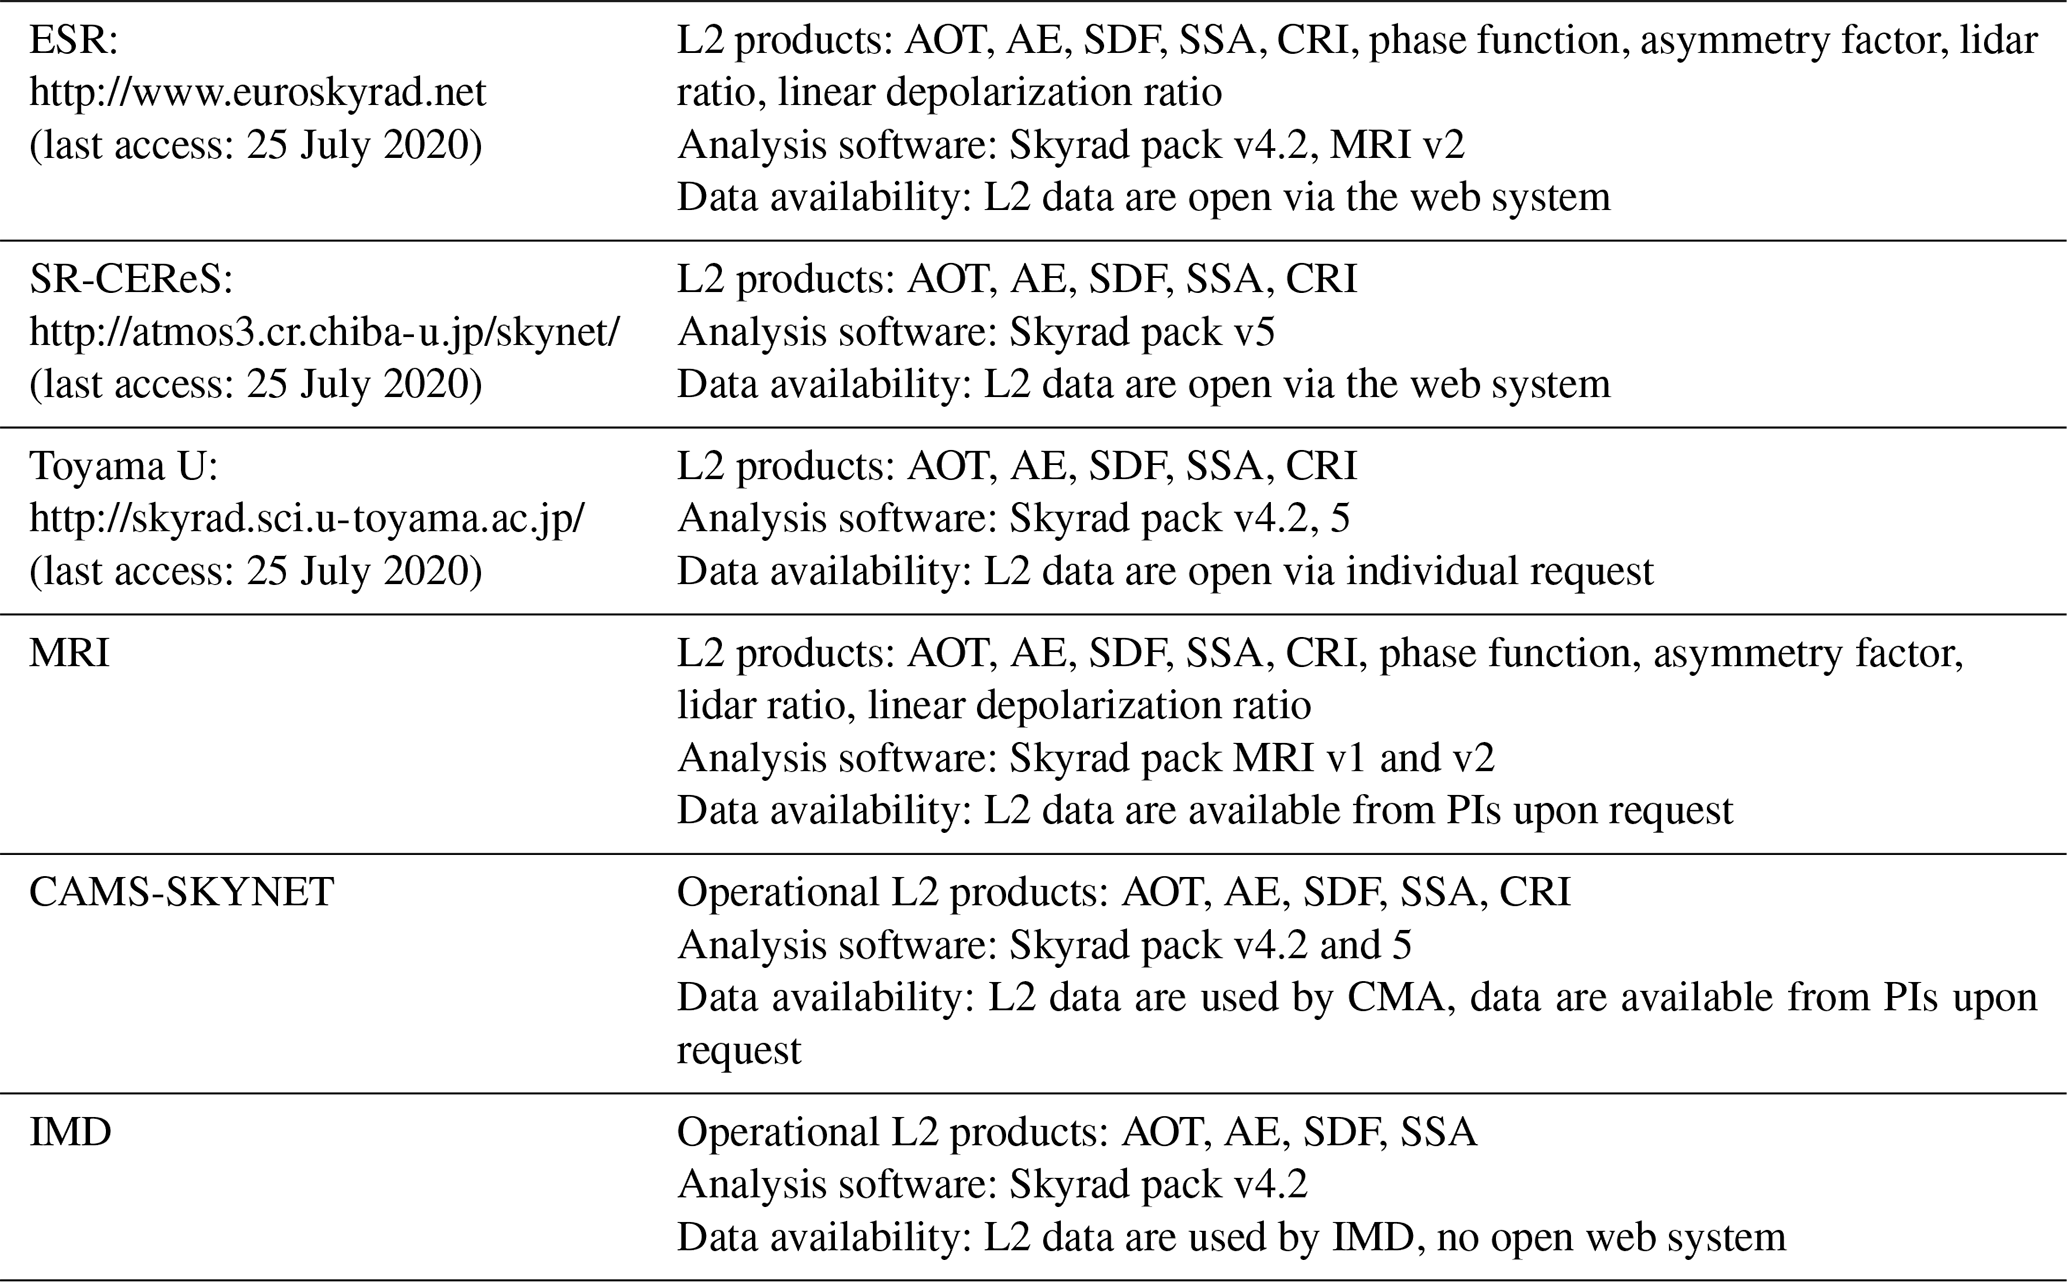
To obtain data for L2 data analysis for retrieval of geophysical parameters for atmospheric constituents, an analysis software called the Skyrad pack has been developed (Nakajima et al., 1996; Hashimoto et al., 2012) and is publicly available on the OpenCLASTR shareware site (http://157.82.240.167/~clastr/data_policy.html, last access: 26 July 2020) for use by the research community. Various L2 products are retrieved by the Skyrad pack, such as spectra of AOT, its slope called Ångström exponent (AE), size distribution function (SDF), SSA, complex refractive index (CRI) , asphericity, cloud optical thickness (COT), cloud effective particle radius (CER), water and ice phase from data in the non-gas-absorbing channels, precipitable water vapor (PWV), and column ozone amount (O3) from the gas-absorbing channels, as explained in the following sections. Common operational products of the sub-networks are AOT, AE, SDF, SSA, and CRI-assuming Mie particles. Other products have been retrieved by research studies. The current operating versions are version 4.2 and 5, and a version from the Meteorological Research Institute of Japan Meteorological Agency (MRI version) developed by Kobayashi et al. (2006, 2010). Table 2 lists the archived geophysical parameters, versions of the retrieval software Skyrad pack, and the data availability in the known data archives. Table 2 indicates that the features of the archives are different from each other and difficult to use for the science community.
In the case of non-gas-absorption channels, the standard Langley plot method (SL or SL plot method) can be used to obtain F0 by plotting the logarithm of the Lambert–Beer's law Eq. (2a) versus m0,
to extrapolate the linear regression line to m0=0. It is known, however, that an air mass dependence or a quadratic time dependence of AOT introduces a serious error in the SL, as claimed by Shaw (1976). Correction methods to this problem were proposed by O'Neill and Miller (1984a, b) and Tanaka et al. (1986) with the use of a time dependence of the circumsolar radiance of which the major part is approximated by the single-scattered radiance proportional to the OT along the solar almucantar circle (θ=θ0), given as follows:
where P is the normalized scattering phase function at the scattering angle of Θ and Rmult is the multiple scattered radiation. Tanaka et al. (1986) used a forward scattering around Θ=20∘ at which the phase function is relatively independent of the SDF of the atmospheric particulate matter. Extending this principle, SKYNET adopts the IL method to extrapolate Eq. (3) regarding the total scattering optical path,
or its aerosol part,
which can be retrieved from the forward scattering part, Θ≤30∘, of the relative sky radiance R, Eq. (4). The formulae in Eqs. (4) and (5) indicate that xa is relatively accurately retrieved from the inversion of the forward scattering part of the sky radiance. We use Eq. (5b) in most of ILPs of the sub-networks.
The accuracy of F0 estimation by the IL method depends on the turbidity condition of the site. The theory of a linear regression model is formulated with a normal random observation error u as
where n is the number of observations. Here, we omit subscript a from τa and ωa for the sake of compact notation unless otherwise specified. Equation (6) gives estimates of regression coefficients and their dispersion as
where upper bar and stand for averaging operation and εu is the root-mean-square error (RMSE) for u. The standard linear regression theory assumes x is an independent variable to be related to a dependent variable y that includes a random residual of the fitting u. Based on this assumption, the dispersion of x is given as
where , , and are dispersions of sampling air masses {m0i} and natural variations in {τi} and {ω} during the ILP, respectively. The dispersion of residual {ui} is approximated by the sum of mean-square errors of τ and ω, i.e., and , caused by the inversion process of Eq. (4) as
where is the mean-square error of {yi} caused by observations of the radiometer, which is usually small and neglected from the formula. The budget of dispersions Eq. (8a) leads to the following estimate for a typical air mass sampling from m1=1.3 to m2=3.5 and atmospheric conditions of large optical parameter change from τ1=0.2 to τ2=0.4 and from ω1=0.85 to ω2=0.95 during the ILP as
if we assume a regular sampling of linear change models for m, τ, and ω. This budget indicates that the wide sampling of air mass is the main contributor to decrease . The IL method allows selection of the atmospheric condition in which τ and ω undergo natural variations that help to increase σx and thus decrease σa. But such selection of unstable atmospheric conditions may increase inversion errors, ετ and εω, wasting the benefit of natural changes in ω and τ. It is also possible to have a change in atmospheric conditions over a short time of less than 5 min in one full angle scan, causing unexpected errors. Sub-networks, therefore, have their own screening protocols for ILP using stability of the time sequence of variables to reject ill conditioned data for ILP. They also reject large AOT cases to secure the calibration accuracy, e.g., AOT >0.4 by ESR (Campanelli et al., 2004).
Combining Eqs. (7) and (8), we have the following estimate for σa assuming b and ω are close to 1,
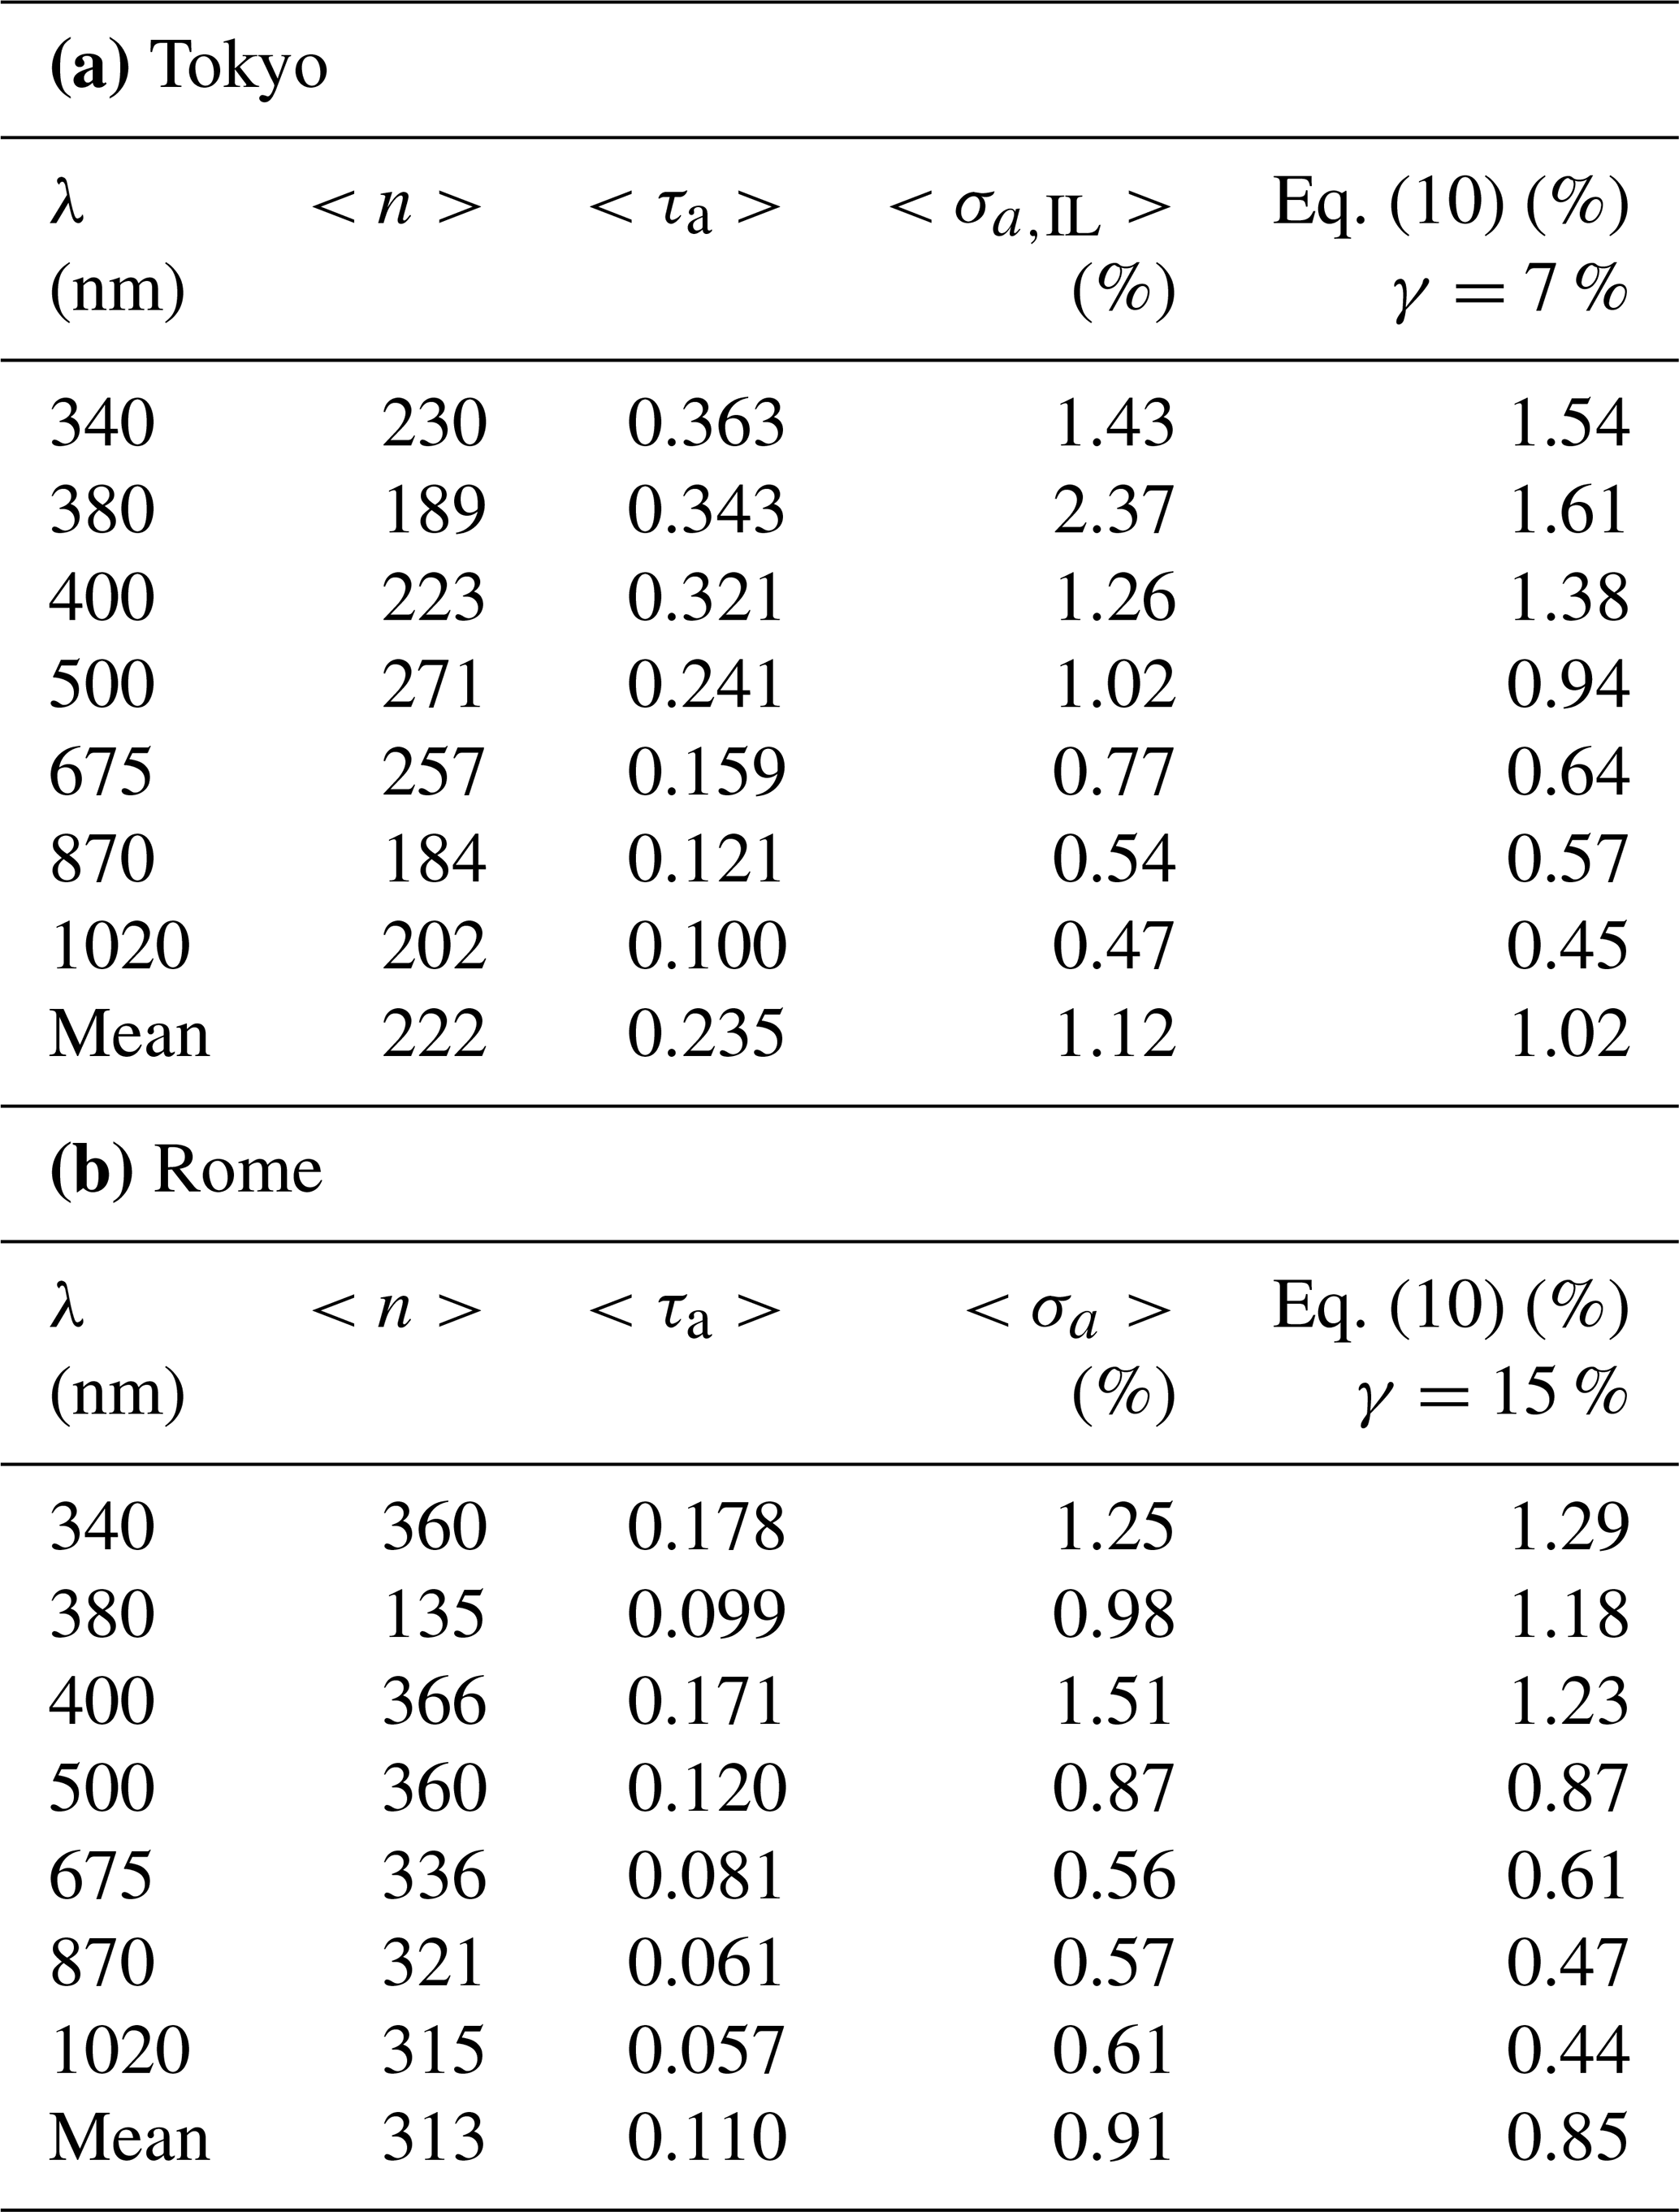
The third expression on the right-hand side of Eq. (10a) is an estimate for m1=1.3 and m2=3.5, and the rightmost expression is an approximation with 10 % relative errors in inversion of τ and ω as a typical example of ILP. This estimate indicates that the accuracy of ln (F0) from the IL method is proportional to the OT during ILP operation at the site. Table 3 lists mean values of n, τa and σa,IL every 30 d (month) obtained by ILP operation carried out at the Tokyo University of Science (TUS) and Rome sites. The table shows that the monthly value of σa,IL ranges from 0.5 % to 2.4 %, with a tendency to increase with decreasing wavelength. We also estimated σa,IL by Eq. (10) with optimum γ values of 7 % and 15 % for Tokyo and Rome, respectively. These estimates correspond to 5 % and 11 % for relative retrieval errors and during ILP operation.
Table 3(a) Monthly mean values of n, τa, and σa,IL obtained by ILP at the Tokyo University of Science (TUS) site averaged for the period of February–May 2017 and (b) those at the Roman site averaged for October 2017 and May–September 2019, other than the 380 nm data, which were taken only in October 2017. Estimates of σa,IL are also given by Eq. (10) assuming γ value of 7 % for Tokyo and 15 % for Rome. All wavelength means are shown in the bottom of each table.
The monitoring ability of F0 by IL on-site methods has merits, such as low-cost frequent calibration to detect the changing constants and a short-term ESI change, and minimizes the radiometer environmental change, avoiding shipping for calibration. The error in F0 is propagated to cause an error in OT from Eq. (3) as
A rough estimate of AOT error by the IL calibration is expected to be on the order of 0.003 to 0.01 for m0=2 in the case of Table 3, though real errors depend on detailed setup and observation sequence at each site. It is important to compare this accuracy of IL with that of SL. In the SL case, we assume x=m in Eq. (6a), so that the error estimate Eq. (7b) is reduced to the following expression as
where we assume the error in a is caused by a part of OT change during the SL plot, which tends to the inverse of the optical air mass as
A measure of OT change during air mass change from m1 to m2 can be defined as
The rightmost estimate is given for m1=1.3 and m2=3.5 as an example. If we assume to be the same as the inversion error in the estimate of IL accuracy, the following estimate is given as
This estimate of the SL error is similar to that of IL given in Eq. (10), suggesting the SL performance is similar to or slightly larger than that of IL under conditions of 10 % change in OT during the SL plot. Selection of the calibration methods, therefore, depends on the character of the turbidity conditions at the site. There are reports from city-area sites, such as Rome, Beijing, and Chiba, that the accuracy of SL method is more than 1 % to 2 % worse than that of IL method, suggesting commonly happens at these sites, and thus we recommend comparison of F0 values from both SL and IL methods to diagnose the calibration quality of the SL and IL methods. At the same time, we recommend high mountain calibration and/or transfer of calibration constants from a well-calibrated standard radiometer to keep the on-site IL calibration healthy.
The SKYNET community performed high mountain calibrations at Mauna Loa (USA, 3397 m a.m.s.l.) and two similar pristine aged-background sites (AOT500 ∼0.05, AOT at λ=500 nm) from the Indian Astronomical Observatory (IAO) at Hanle (Mt. Saraswati, 32∘47′ N, 78∘58′ E, 4500 m a.m.s.l.) and Merak (33∘48′ N, 78∘37′ E, 4310 m a.m.s.l.), located in the high-altitude Ladakh region in the northwestern Himalaya. Figure 4 shows retrieved values of F0 and SVA from the observation taken by a single instrument (POM-01) from IAO-Hanle during January 2008–December 2010 and June 2015–December 2018 and Merak during January 2011–May 2015. They used the Skyrad pack software for data screening with a condition of root-mean-square difference (RMSD) of SVAs below 0.20, while the median value of the long-term data is as much as 0.05. The observations were taken from a wide range of AOTs with minimum (instantaneous) 0.01 to maximum 0.22 with the annual averaged AOT as 0.045±0.026 at 500 nm during 2008 to 2018 at the two sites. Due to limiting cloudy conditions in the afternoon, 35 % of the disk-scanning work is performed between 08:00 and 09:00 LT at this site. Since the disk-scanning procedure takes around 20–25 min to complete the entire wavelengths, it is apparent that in some cases, some wavelengths may have been affected by thin (cirrus) clouds, which are carried by strong winds (above 15 m s−1) at both the sites. The figure indicates that the RMSD of ln (F0) from SL and IL methods agree within about 0.5 %. This F0 uncertainty is smaller than the minimum value of σa,IL at Tokyo and Rome shown in Table 3 and corresponds to an estimate of Eqs. (10) and (13), assuming the mean AOT at the site is on the order of 0.03 at λ=500 nm and n=100. The figure shows that the disk scan method, discussed in the next section, was obtained with monthly mean SVA within 1.5 % for all the spectral channels. The disk scan was performed from observations taken under full clear-sky conditions with minimum of 3–5 d of data in every month (Ningombam et al., 2014). Therefore, there are 12 values of SVA in all the spectral channels in a year. The vertical bar indicates a representative RMSD of monthly means in each year.
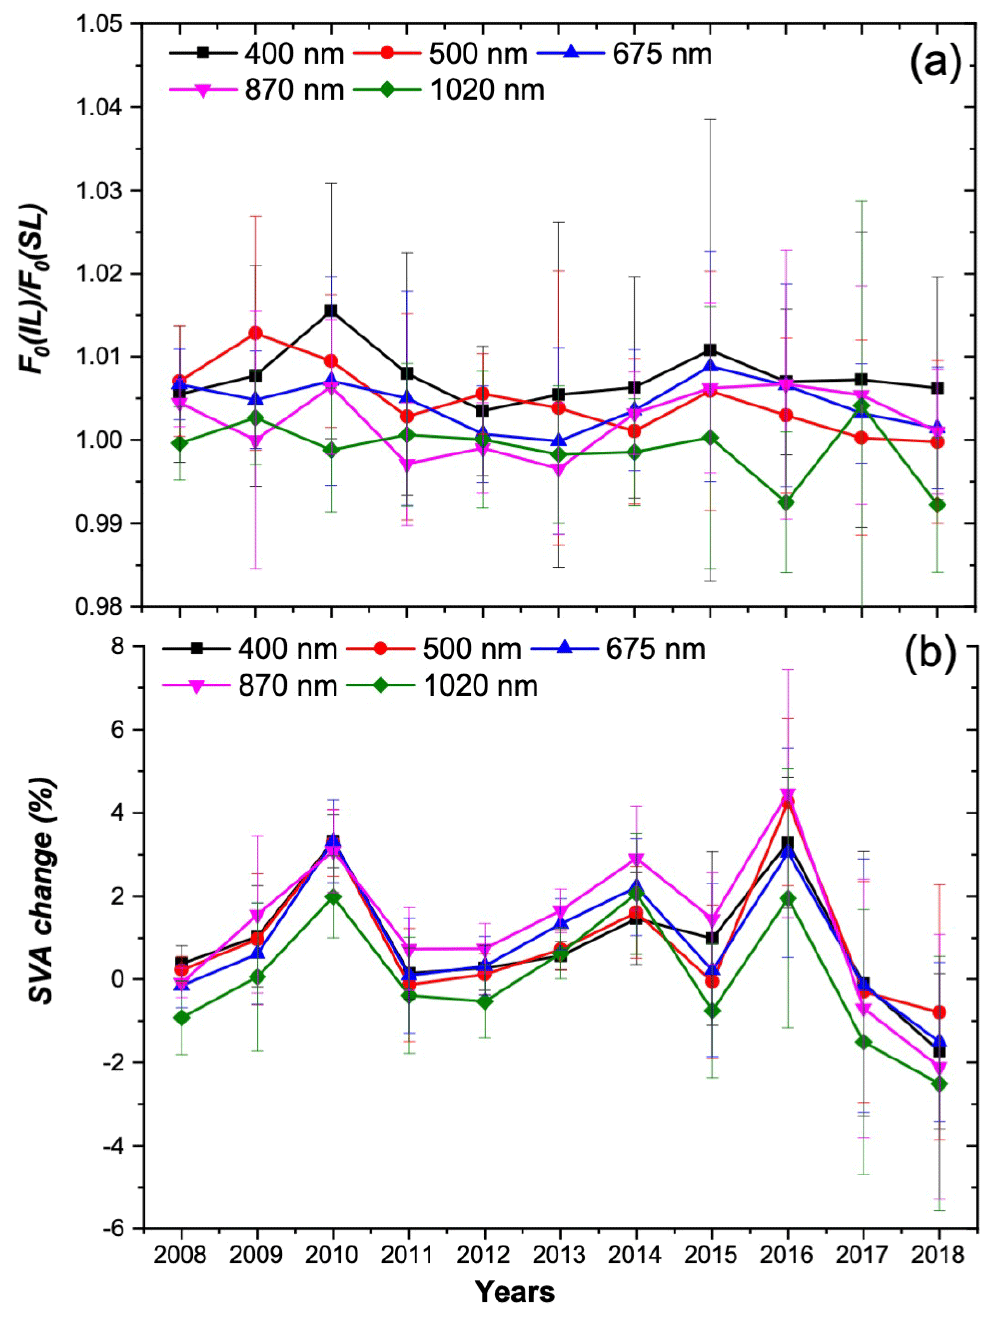
Figure 4Time series of the ratio of F0 values from SL and IL methods (a) and SVA (b) from the observations taken by a single instrument (POM-01) at two pristine sites, IAO-Hanle during January 2008–December 2010 and June 2015–December 2018 and Merak during January 2011–May 2015. The error bar indicates a representative monthly RMSD in each year.
The first QUAlity and TRaceability of Atmospheric aerosol Measurements (QUATRAM, http://www.euroskyrad.net/quatram.html, last access: 22 July 2020) Campaign compared the F0 value from the IL method with that of the standard Precision Filter Radiometer (PFR) (Kazadzis et al., 2018b) of the World optical depth Research and Calibration Center (PMOD/WRC). A preliminary analysis showed the difference is 0.3 % at Davos (1590 m a.m.s.l.), where the mean AOT500 is 0.15 and AOT500 in clean aerosol conditions is 0.05. This F0 uncertainty is similar to those of the IAO sites and again smaller than the minimum value in Table 3, indicating the importance of the careful constant calibration effort on high mountains.
Another important point to note is that comparison of Eqs. (3) and (6) leads to the following relation
The forward scattering analysis of the IL method prescribes the refractive index, and thus it is highly possible for x in Eq. (5a) to include a factor type systematic error like
In this case, Eq. (6) results in the following relation between fitted and true values of a and b, a0 and b0, as
This result shows that the formula of a in Eq. (7a) is invariant to the factor type error, indicating the robustness of the IL calibration. On the other hand, the b value changes depending on the value of C and takes a value in the no error condition according to Eq. (14). Boi et al. (1999) utilized this point and proposed an iterative IL method to improve the F0 value and find the optimum CRI by trying several refractive indices. They reported the method can improve the precision of F0 by 30 %, e.g., 2 % to 1.5 %.
There is another caution regarding the use of the formulae of Eq. (7a). In the real observation, it is difficult to separate natural variations and inversion errors of τ and ω, and thus the dispersion σx tends to include undesired inversion errors that lead the IL method to an underestimation of a and b as understood by Eq. (7b). We are testing a new solution to this problem, named the cross IL method (XIL), which exchanges the role of x and y in the regression analysis, i.e.,
Figure 5 presents retrieved values of a (=ln F0) from the IL and XIL methods with 10 ensemble runs of an idealized experiment with F0=1; ω=1; τ=0.1; n=20; and m=1.3 to 3.5 as a function of normal random errors εx in x. The figure shows that the IL method underestimates the a value, while the XIL stays accurate within RMSE less than 0.03 up to εx=0.01 (10 % of τ=0.1) and 0.05 at εx=0.025 (25 % of τ=0.1), consistent with Eq. (10). Figure 6 and Table 4 compare results of the IL and XIL methods with the following screening conditions applied to 38 sets of real Langley plot data at the TUS site for 4 months from February through May 2017:
and
and
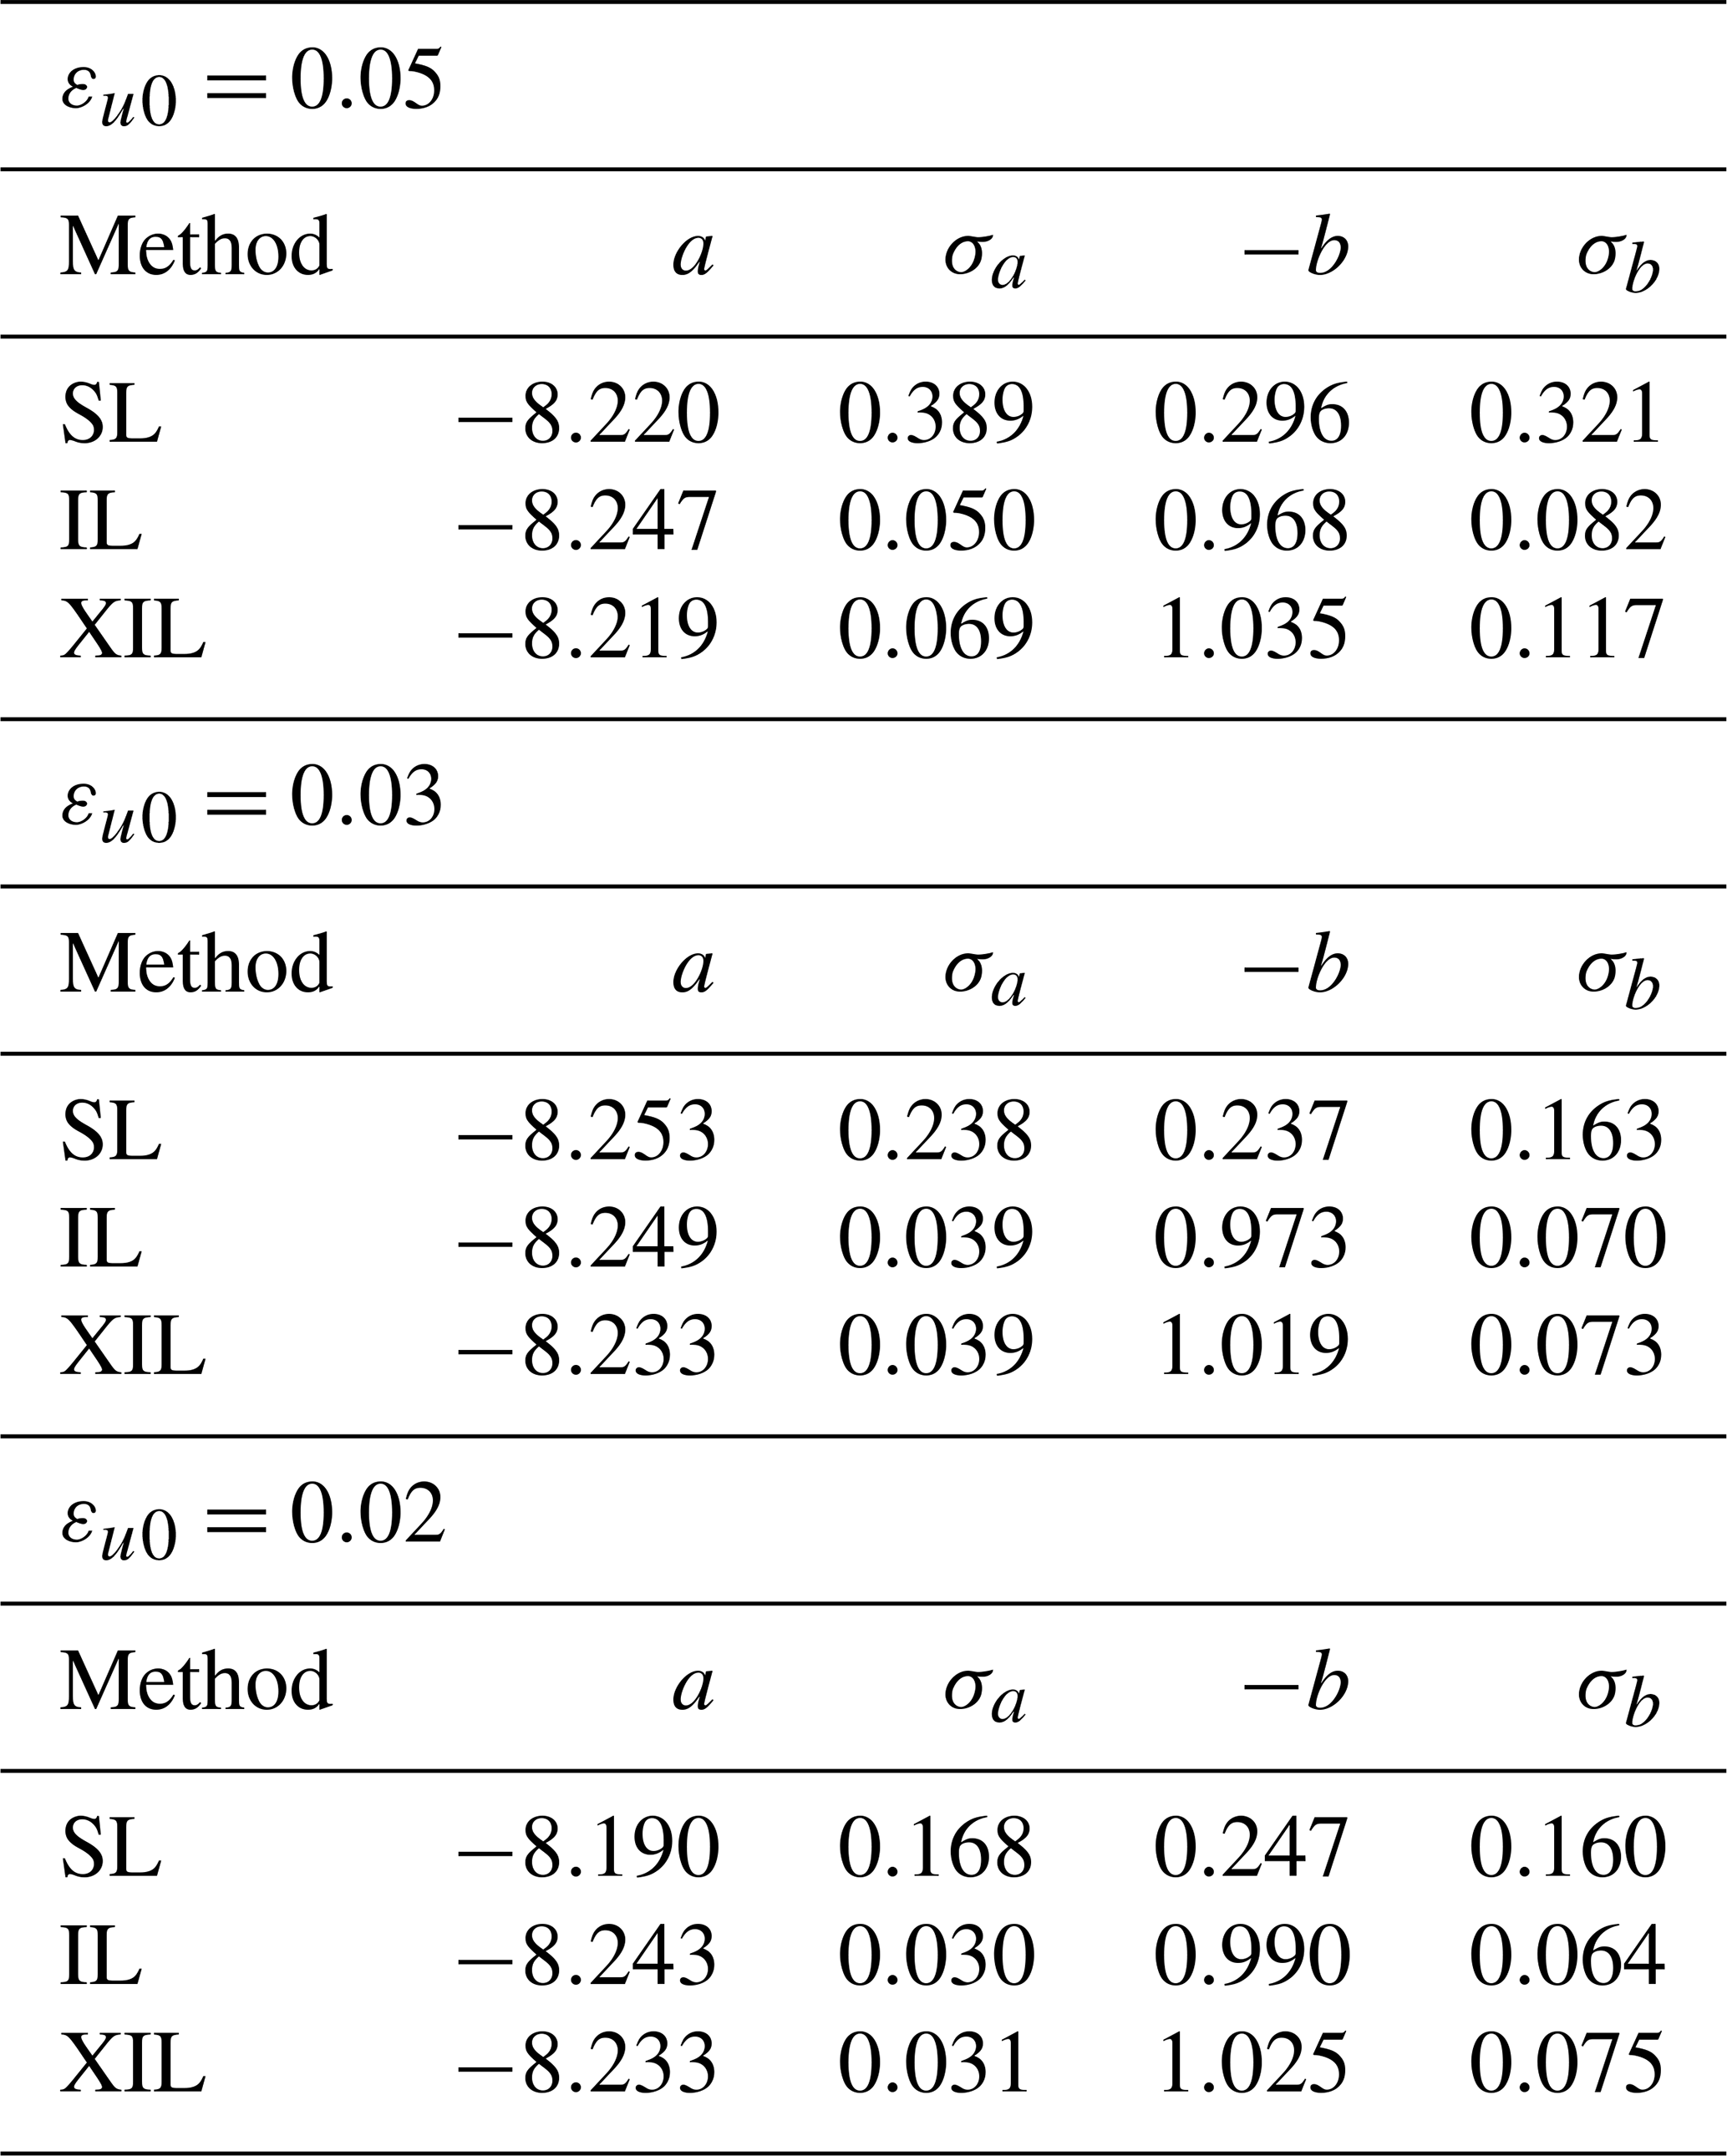
where m1 and m2 are lower and upper limits of air mass in the ILP. The threshold residual εu0 is given as 0.02, 0.03, and 0.05. Figure 6 and Table 4 indicate that the a value from SL is largely scattered, suggesting determination of F0 by SL at turbid sites like Tokyo is not recommendable. On the other hand, a values from IL and XIL converge on a regression line within differences of 2 %–3 %, with a tendency of systematically smaller values by IL than those from the XIL method by amounts of εu0∕2. Although the difference between IL and XIL is not large when we select low-noise data, we would like to recommend the XIL method to be applied to 5 to 10 Langley plot data sets in order to secure an accuracy of 1 % to 2 % in F0 using the screening conditions of Eq. (17). The figure also shows that we can detect a long-term decreasing trend of a value by about 10 % during the period at the TUS site.
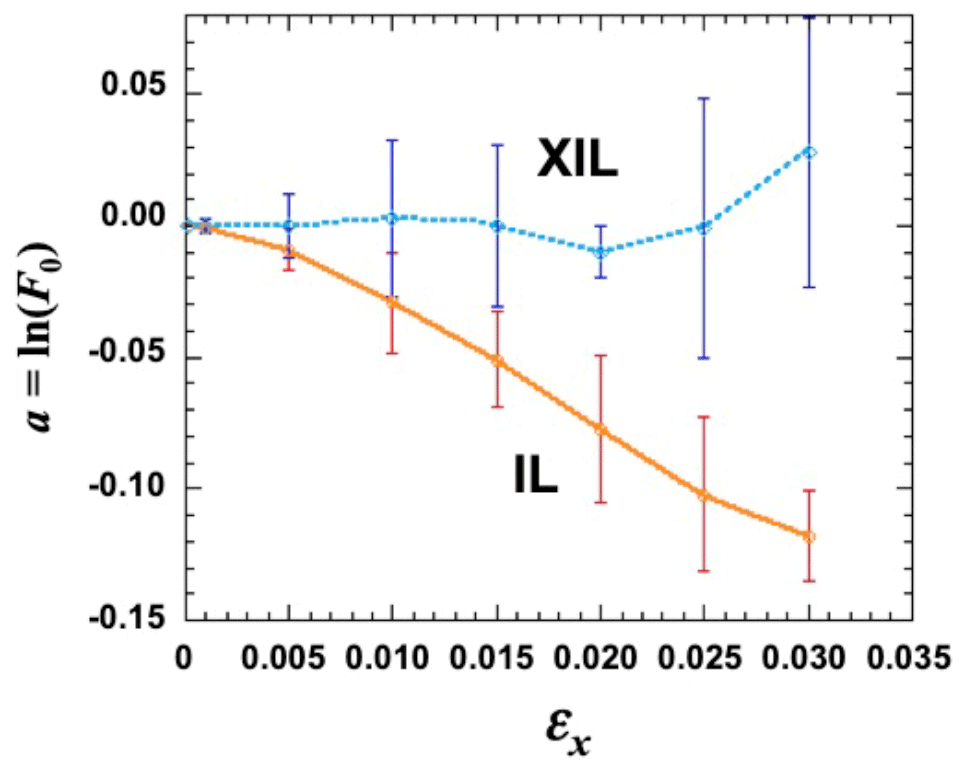
Figure 5Retrieved values of a=ln (F0) from IL and XIL methods with 10 ensemble runs of an idealized experiment (n=20 and m=1.3 to 3.5) as a function of normal random error εx in x. True values are assumed to be F0=1; ω=1; and τ=0.1.
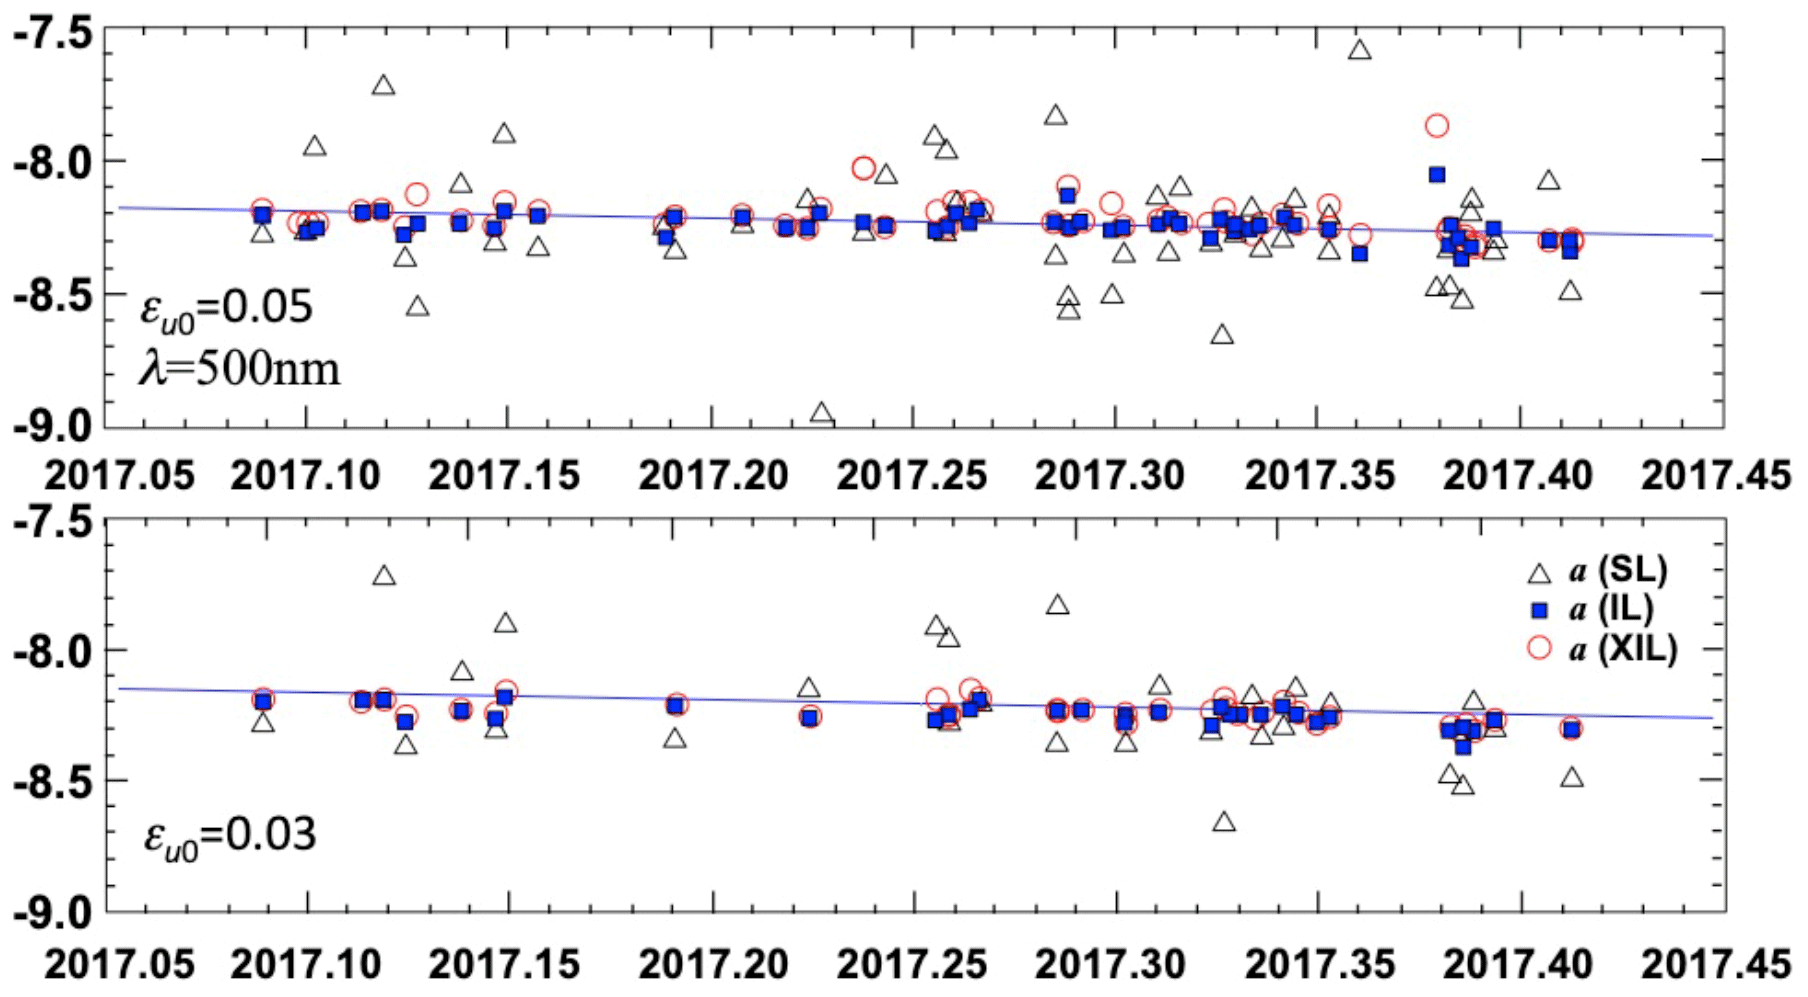
Figure 6Time series of estimated a values by IL and XIL methods for ILP data at the Tokyo University of Science (TUS) site for 4 months from February through May 2017. Presented are the results of two screening conditions of Eq. (17) with εu0=0.05 and 0.03 at λ=500 nm.
Table 4Estimates of a and b values at λ=500 nm and their RMSD values (σa, σb) in the F0 retrieval by IL and XIL methods for ILP data at the Tokyo University of Science (TUS) site for 4 months from February through May 2017. Results of three screening conditions of Eq. (17) with εu0=0.05, 0.03, and 0.02 are listed.
Several methods have been proposed for on-site calibration of the sky radiance measured by the sky radiometer, such as the solar disk scan method, point-source or lamp scan method, and diffuse plate method (Nakajima et al., 1986, 1996; Boi et al., 1999). Among them, the solar disk scan method has been routinely used in the SKYNET measurement of the SVA of the sky radiometer by scanning a circumsolar domain (CSD) of ±1∘ by ±1∘ around the sun at every 0.1∘ interval.
The irradiance received by the radiometer, which is aimed at the direction (x, y) in a Cartesian coordinate system of angular distance from the center of the solar disk at origin (x=0, y=0), is an angular integration of radiances weighted by the response function of the radiometer fR in the field of view (FOV),
In the case of diffuse sky radiance measurement, the SVA of the radiometer is given from Eqs. (1) and (18) as
In the case of the solar disk scan, the main term for F is given as follows under conditions of small contributions from diffuse sky radiation in the CSD,
where Ld is the radiance distribution of the solar disk. The angular aperture of the sky radiometer is about 1∘, whereas the solar disk diameter is about 0.5∘, and thus we can measure the solar disk-averaged value of the radiometer response function as
From Eqs. (1), (20a), and (20b), the following normalization condition has to be fulfilled,
The SVA can be obtained by the angular integration of the radiance in the CSD as follows:
The last expression is obtained using Eqs. (19) and (20c) if the size of CSD is large enough to include FOV or the contribution outside the CSD is small. These equations indicate that flatness of the response function around the optical axis should be secured in manufacturing the sky radiometer for stable measurement of the direct solar radiation through Eq. (20b). The perfect flatness is realized by optics without an objective lens, which is useful for moving platforms such as aircrafts and ships (Nakajima et al., 1986).
Analyzing data from the solar disk scan, Uchiyama et al. (2018b) found an underestimation of SVA from the disk scan method of 0.5 % to 1.9 % and proposed a correction method by extending CSD size up to a scattering angle of 2.5∘, assuming an extrapolation function as illustrated in Fig. 7. They also discussed that the SVA error for the disk scan can exceed 1 % for large AOT conditions such as AOT550 >0.5 and proposed a subtraction method using sky radiance calculated from the size distribution retrieved from the relative radiance. This subtraction method can reduce the error to 0.5 % for AOT550 <2 for sky radiance measurements with the minimum scattering angle Θ=3∘. The recent CEReS system has introduced a quality control for setting the optimal value of SVA for each site including Uchiyama's method, but no other sub-networks implement these correction methods in their operational analysis.

Figure 7Response functions of the sky radiometer at λ=0.5 and 1.6 µm measured by the solar disk scan method.
Though not performed routinely, a Xe lamp scan has been performed in CEReS for the current version of the sky radiometer (Manago et al., 2016). The merit of the method is that we can narrow the size of the point source below 0.5∘ and can extend the CSD size beyond ±1∘ without a significant effect from the sky light. Following this, measured SVAs were compared with those derived from the solar disk scan in daytime. From the experiments, uncertainty in SVA was estimated to be less than ±0.01 msr or ±4 % (Irie et al., 2019). This value is larger than that of Uchiyama et al. (2018b) and more experiments may be needed for more precise estimates and a unit variety.
Once the values of radiometer calibration constants, F0 and SVA, are determined by the calibration methods described in the preceding two sections, the geophysical parameters of aerosols, clouds, water vapor, and ozone are retrieved by inversion of F and/or R in Eqs. (2a) and (2c) at full or specific scattering angles (Fig. 3). Aerosol retrievals are done using Skyrad pack version 4.2 and/or version 5. The former is based on inversion scheme of the Phillips–Twomey type solution of the first kind of Fredholm integral equation with a homogeneous smoothing constraint, and the latter is based on the second kind of the equation with an inhomogeneous constraint and a priori climate data for aerosols (Twomey, 1963) to retrieve the inherent aerosol optical properties. These methods can be generalized by minimization of a cost function φ for realization of an observation vector y as a function of a state vector x with observation error e using a multi-term least-squares method (LSM) (Dubovik and King, 2000; Dubovik, 2004; Dubovik et al., 2011),
where superscript t stands for matrix transpose operation, Sε is the error covariance matrix, φ1 is the norm of the solution from the a priori data xa with its associated covariance Sa, and φ2 is the cost for smoothness of the solution with the G matrix related to the norm of the second derivatives of x. The AERONET analysis uses both the constraints, φ1 and φ2, but with only two elements for φ1 at the smallest and largest size bins and with the value at the largest size bin as small as is possible to still be able to give a contribution to AOT440 wavelength (Dubovik et al., 2006). Skyrad pack versions 4.2 and 5, respectively, adopt the third and second term of the right-hand side of Eq. (21b), but not both. The latter case of version 5 corresponds to the maximum a posteriori solution (MAP) based on the Bayesian theorem (Rodgers, 2000). The MRI version of Skyrad pack uses a φ1 constraint similar to version 5. An iterative search of the nonlinear solution is made by the Gauss–Newton method as
Version 4.2 uses Eq. (22a) without Sa terms, and version 5 uses the one without G terms. Observation and state vectors are given as
where geophysical parameters for the state vector are aerosol volume SDF as a function of logarithm of particle radius r, x=ln r, and real and imaginary parts of CRI, i.e., , as functions of wavelength. The SDF is represented by a linear combination of base functions {fk},
The package allows two types of base functions, i.e., box-car functions or lognormal functions with mode radii {xk} that are regularly spaced in x axis,
The standard analysis in sub-networks assumes 20 lognormal base functions (Nv=20) from r=0.02 to 20 µm with dispersion σ=0.4, though there is an argument for a narrower value (Momoi et al., 2020). The a priori value of the CRI is usually given as –0.005i. The version 4.2 retrieves x through the following four steps: (step 1) the SDF for xa is assumed to be a bimodal lognormal size distribution (Nv=2) with r1=0.1 µm and r2=2 µm and σ1=0.4, σ2=0.8, and the volumes of the two modes are set to be the same, V1=V2, and are estimated from the forward radiance data (Θ≤30∘); (step 2) retrieve from the radiance data in (20, 70∘); (step 3) retrieve {Vk} from the forward radiance data to revise xa; (step 4) retrieve SDF and CRI from the full angle scan data. Step 4 is iterated until a conversion criteria is fulfilled. On the other hand, version 5 follows steps 1, 2, and 4 without step 3. The standard analysis of sub-networks does not treat asphericity of mineral dust and sea salt particles and assumes Mie particles, except for in research studies.
The package adopts the IMS method for solar aureole radiance calculation (Nakajima and Tanaka, 1988) for full scalar radiative transfer code, Rstar, with polarization correction by Ogawa et al. (1989) to save computing time. A full polarization vector code, Pstar (Ota et al., 2010), is also used for research purposes (e.g., Momoi et al., 2020). Asphericity is treated by an approximation of the method of Pollack and Cuzzi (1980) and by several aspherical kernels. Those softwares are available at OpenCLASTR. Other than polar region measurements, the surface albedo is prefixed at 0.05 or 0.1 for wavelengths shorter than 400 nm and 0.1 at longer wavelengths.
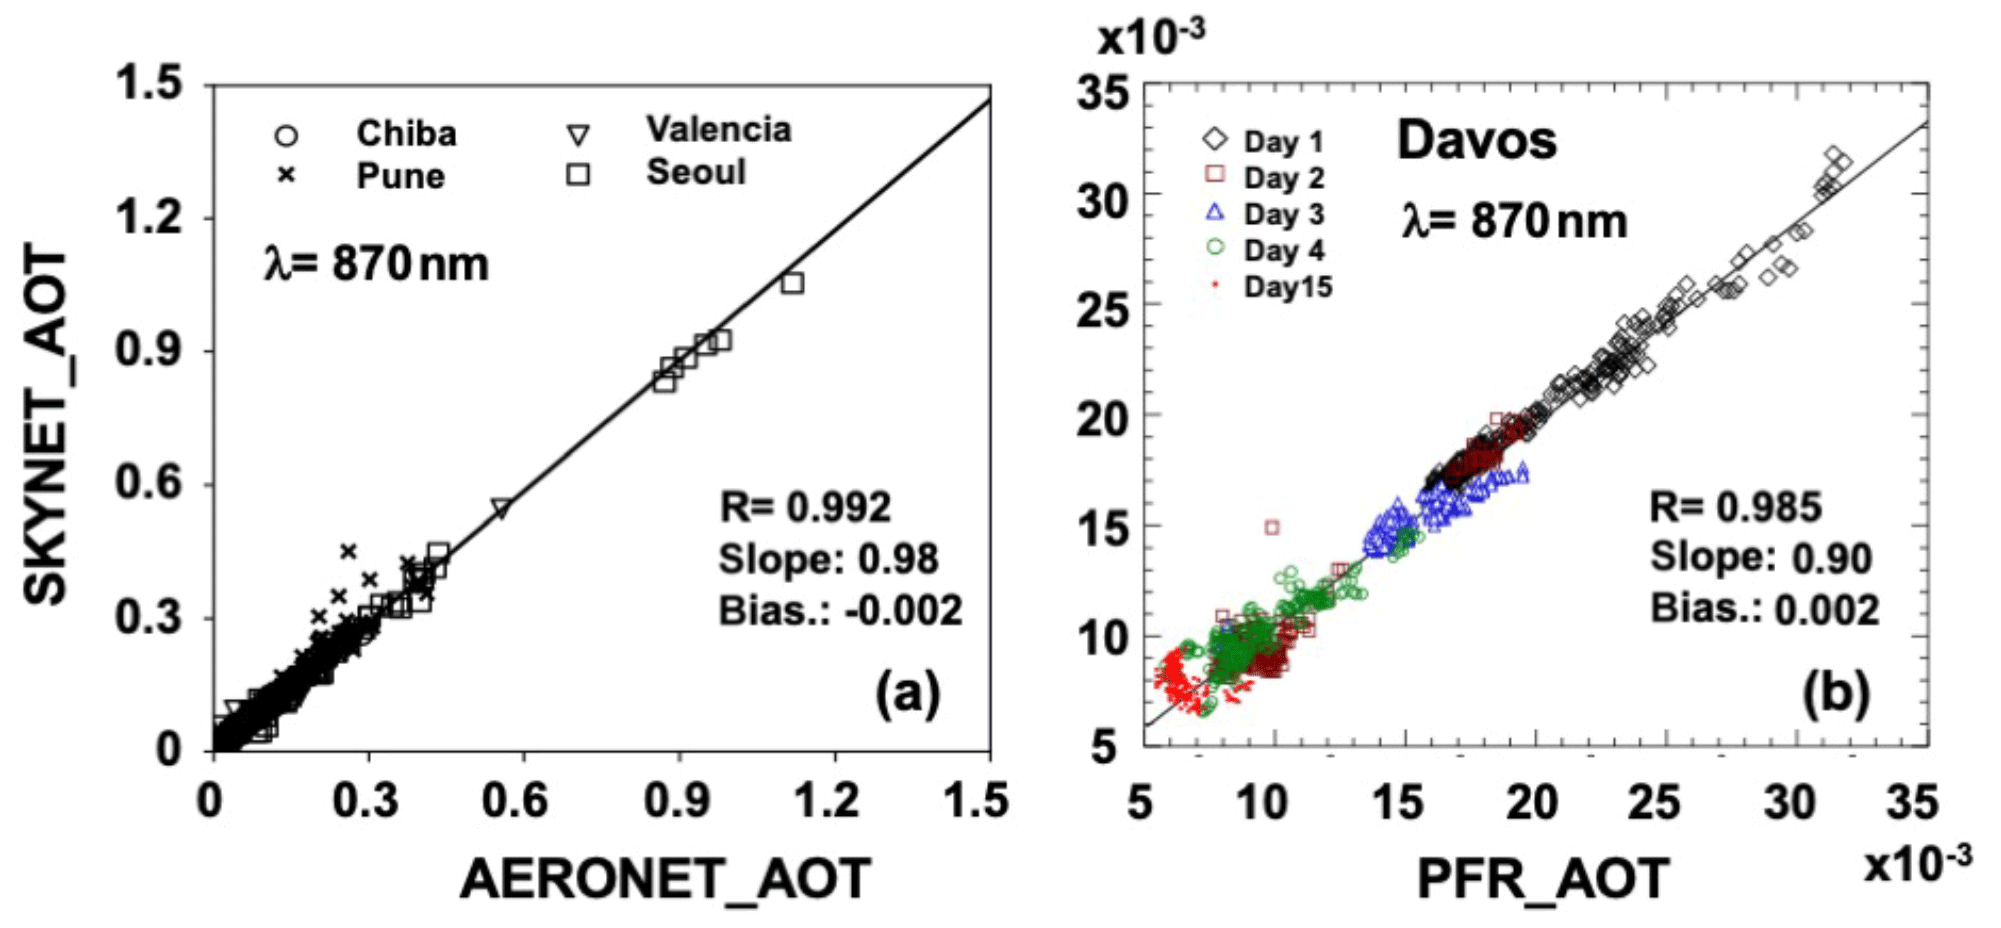
Figure 8Comparison of AOT values at λ=870 nm obtained by the sky radiometer, Cimel sun photometer, and PMOD PFR.
Table 5Statistics of AOT differences from other networks. RMSD values of Estellés et al. (2012) are differences between AERONET values and SUNRAD values for the same Cimel-CE318 sun photometer data with mode 1 (SKYNET-like) and mode 2 (AERONET-like) algorithms.
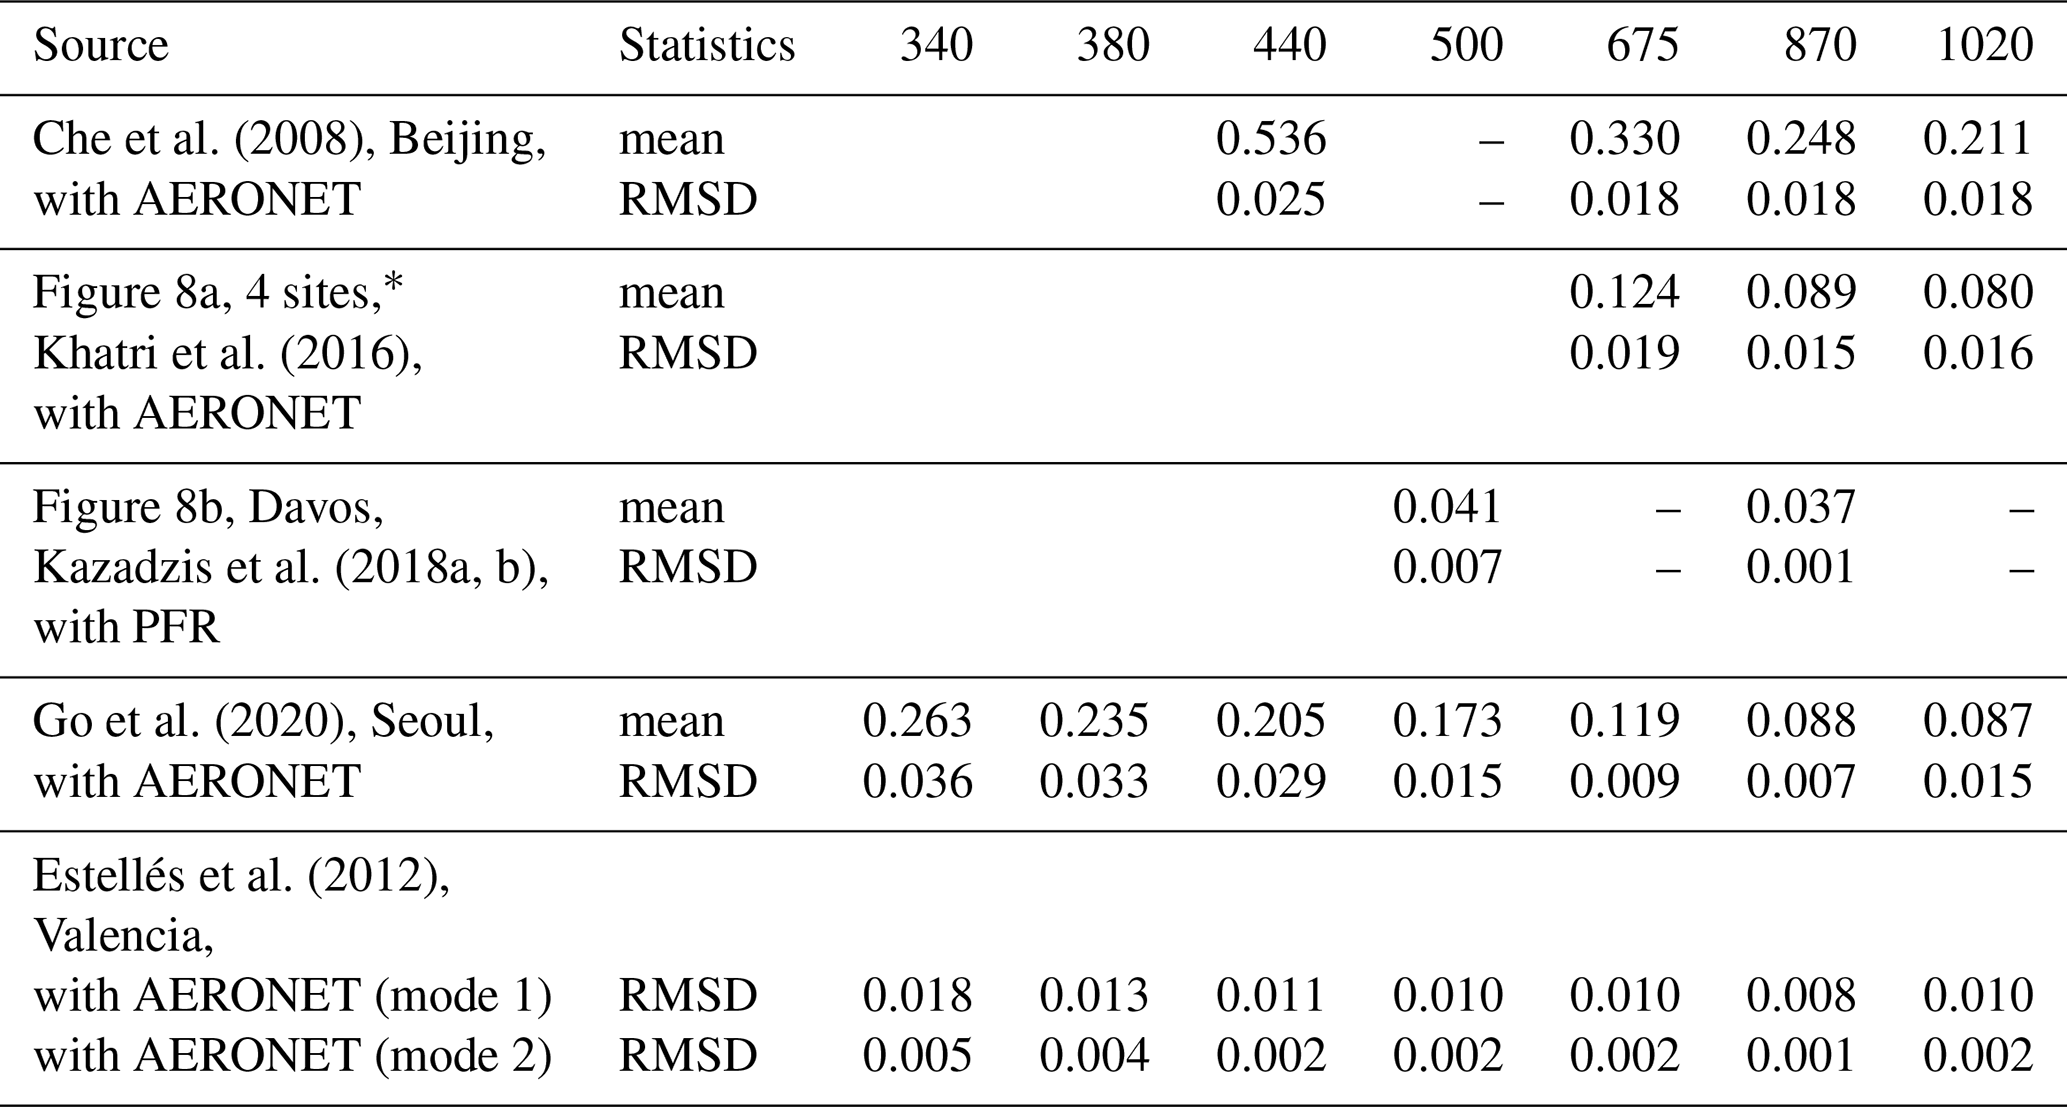
∗ These four sites are Chiba, Pune, Valencia, and Seoul.
Figure 8a and Table 5 compare observed AOT values with those of AERONET at four co-located sites of Chiba (Japan), Pune (India), Valencia (Spain), and Seoul (South Korea) (Khatri et al., 2016). They found that RMSDs were 0.019 at 675 nm and about 0.015 at 870 and 1020 nm with a site dependence of 0.010, 0.033, 0.009, and 0.022 at 870 nm at the four sites, respectively, though this is not shown in Table 5. Che et al. (2008) compared the AOTs between the POM-02 sky radiometer and Cimel CE-318 sun photometer at the top of the Institute of Atmospheric Physics (IAP) in Beijing, which belongs to SKYNET and AERONET. The POM-02 data were processed by Skyrad pack 4.2. They found an RMSD of 0.025 at 440 nm and 0.018 at other wavelengths, which is similar to the findings of Khatri et al.(2016), even with the mean AOT at this site being as large as 0.33 at 675 nm. RMSDs of the Ångström exponent were 0.19 between 440 and 870 nm and 0.28 between 500 and 870 nm, though this is not shown in Table 5.
SKYNET instruments are regularly compared with Precision Filter Radiometer (PFR) instruments belonging to the World Optical depth Research and Calibration Center (WORCC) and the Global Atmospheric Watch PFR network. Results of three POM instruments compared with the reference WORCC triad in 2015 showed differences of less than 0.005 and 0.01 in all cases and for 500 and 865 nm during the fourth filter radiometer comparison (Kazadzis et al., 2018a). During the same campaign, Ångström exponent mean differences were less than 0.5. Under low aerosol conditions, a small relative bias in the AOT determination at 500 and 865 nm can theoretically lead to large deviations in the calculated Ångström exponents (AEs). As an example, for AOTs of about 0.05 and 0.02 at 500 and 865 nm, respectively, AOT differences of 0.01 and 0.005 can lead to AE differences up to ∼1. Since 2015, PFR versus POM long-term comparisons have been performed at various stations, i.e., Valencia (Spain), Chiba (Japan), Davos (Switzerland), and during the QUATRAM campaign in Rome (Italy) (Kazadzis et al., 2018a; Monica Campanelli, personal communication, 2020). Figure 8b and Table 5 compare AOTs at Davos to those of PMOD PFR. The PFR comparison uses the result from the SUNRAD pack (Estellés et al., 2012), where only direct measurements from the sky radiometer are used to retrieve AOT, which have a higher time resolution with respect to direct measurements performed during the almucantar scenarios. They found an RMSD as small as 0.007 and 0.001 at 500 and 870 nm, respectively.
Using multi-radiometer observation data since 2016 at Yonsei University, South Korea, in a validation study for the upcoming Geostationary Environment Monitoring Satellite (GEMS) (Kim et al., 2020), Go et al. (2020) compared AOTs from a Cimel sun photometer, Ultraviolet Multifilter Rotating Shadowband Radiometer (UV-MFRSR), NASA Pandora sun spectrometer, and POM-02 sky radiometer. As shown in Table 5, they found RMSDs between AOT values from the POM-02 and Cimel sun photometer of 0.029 to 0.036 for λ≤440 nm and 0.009 to 0.015 for λ≥500 nm.
The statistics shown in Table 5 indicate that the RMSD took a value less than 0.02 for λ≥500 nm and a larger value of about 0.03 for shorter wavelengths in city areas, whereas mountain comparisons show smaller RMSDs of less than 0.01. This location difference can be understood using F0 uncertainties from around 0.5 % to 2.4 % in Tokyo and Rome and smaller values around 0.3 % to 0.5 % at the mountain sites of Mt. Saraswati and Davos, as discussed in Sect. 3, though uncertainties in AOT comparisons can include other error sources, such as pointing error, time variation, and errors in the retrieval software. Estellés et al. (2012) discussed this point using a comparison of AERONET AOT values with those retrieved by their SUNRAD pack for the same sun photometer, but with two different analysis modes, i.e., mode 1, which implements the SKYNET extinction model, and mode 2 with an AERONET-like model. As listed in Table 5, they found an RMSD of about 0.01 for λ≥440 nm and a larger value in UV channels with a mode 1 setup, whereas a mode 2 setup gives a very small RMSD of less than 0.005. Therefore, more than half of the RMSDs found in the comparison between SKYNET and AERONET can be attributed to differences in the analysis software. The Skyrad pack assumes a simplified extinction model with a plane-parallel assumption in the optical air mass formula, ignores water vapor absorption in IR channels, and has an ozone absorption extinction model in the UV channels that is different from the AERONET model. Slightly larger values at 1020 nm than at 875 nm may be due to the omission of water vapor absorption. Further work is needed to study the effects of these simplifications, which need improvements. For example, SKYNET poses an IL operation limit of m0≤3 instead of m0<5 in the data analysis of Estellés et al. (2012) shown in Table 5.
Table 6Reported SSA differences from other networks: mean bias (Che et al., 2008) and RMSD (Kim et al., 2005; Khatri et al., 2016; Mok et al., 2018). Simulated changes of SSA between Skyrad pack versions 4.2 and 5 and SSA retrieval errors of version 4.2 in an enhanced mineral dust case are also obtained by a numerical simulation (Hashimoto et al., 2012).
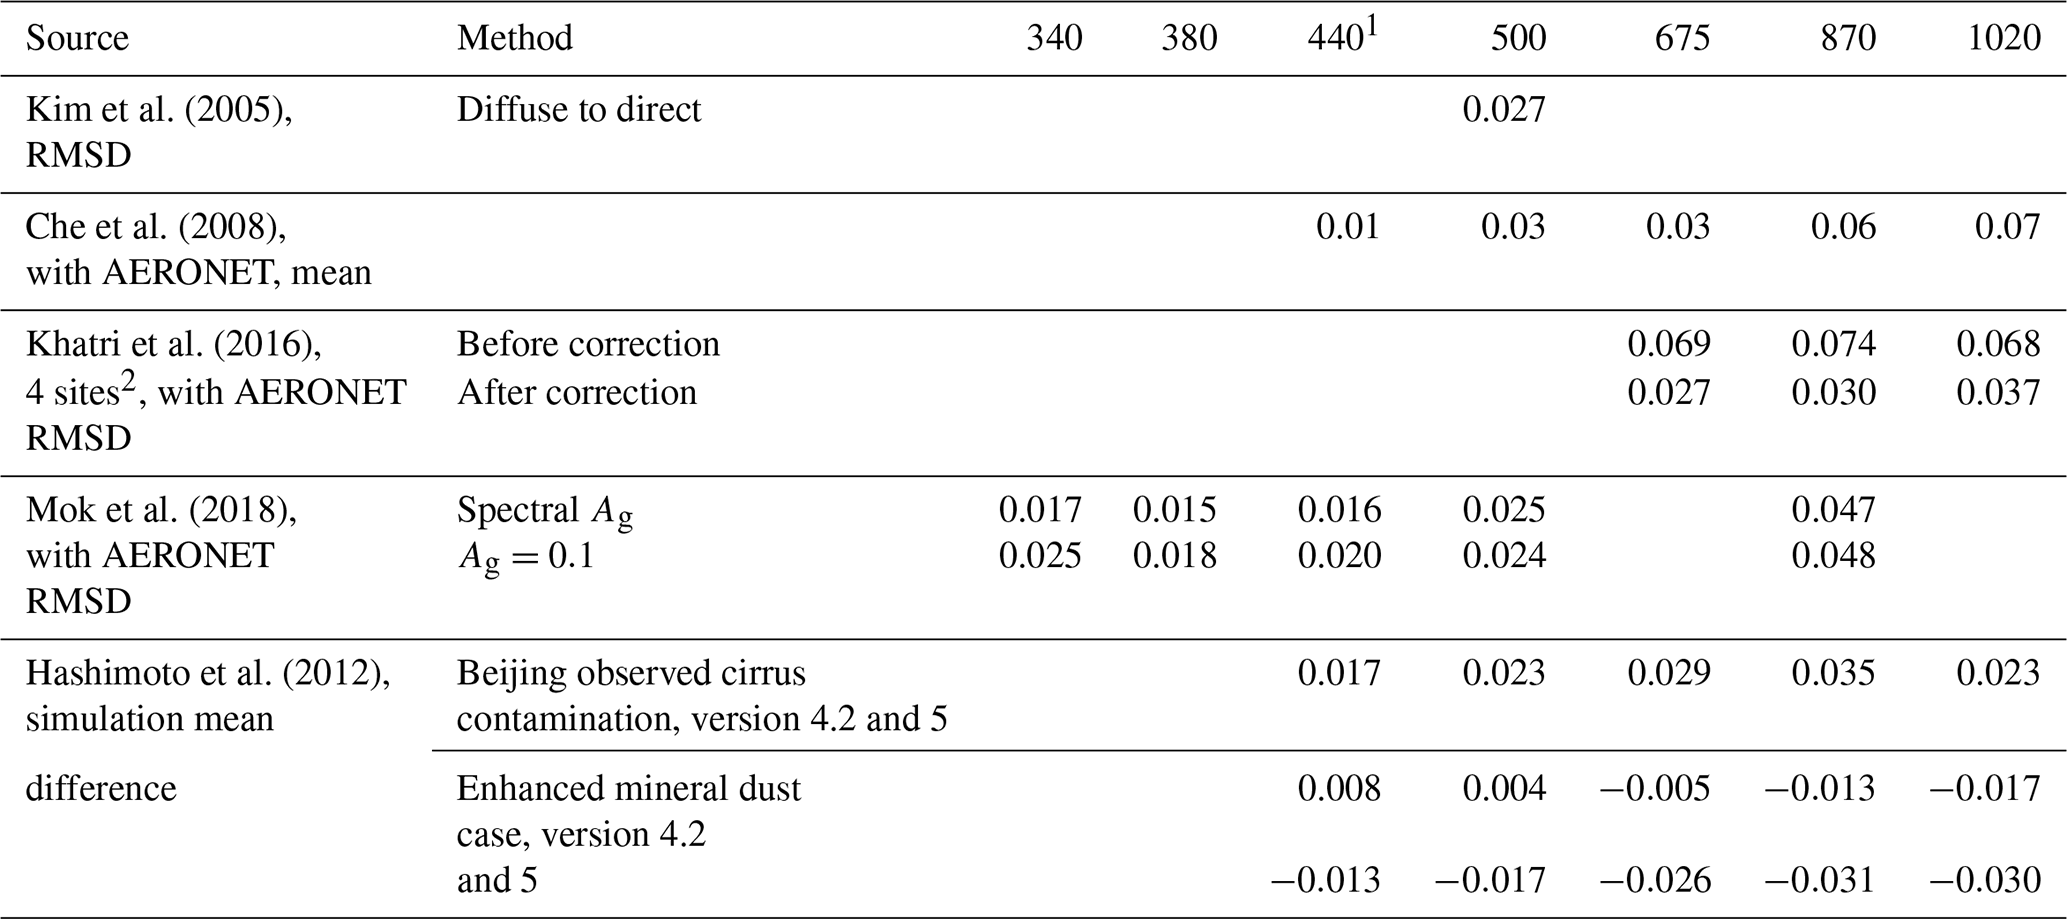
1 400 nm in Hashimoto et al. (2012). 2 Chiba, Pune, Valencia, Seoul.
Table 6 lists reported SSA differences from other networks. SSA values from SKYNET are known to be overestimated, as pointed out by Che et al. (2008). Mean values of SSA in Beijing retrieved from the PREDE sky radiometer were significantly larger than those from the Cimel sun photometer, with differences reaching 0.06 to 0.07 for λ≥870 nm, whereas the mean differences were less than 0.03 at shorter wavelengths. This wavelength dependence can be understood by a tendency for error to increase with decreasing AOT (Dubovik et al., 2000). Similarly Khatri et al. (2016) had a positive difference of about 0.07 RMSD for λ≥675 nm from AERONET values at the four sites (Chiba, Pune, Valencia, and Seoul), and they found that the values can be reduced to around 0.03 if various corrections are applied. The major error source was SVA underestimation of 1.4 % to 3.7 % causing an SSA increase of 0.03 to 0.04. There was an AOT underestimation of 0.02 RMSD at 675 nm, as shown in Table 5, which caused an SSA increase of 0.02 at 675 nm and less than 0.004 at longer wavelengths. Version 4.2 of the Skyrad pack tended to give larger SSA than version 5, but the difference was less than 0.01 for usual aerosol conditions in this case. Effects of surface albedo and asphericity on the SSA difference were less than 0.01. These effects are consistent with those obtained by sensitivity simulations by Pandithurai et al. (2008) and Hashimoto et al. (2012) in a similar way to those described by Dubovik et al. (2000). Pandithurai et al. (2008) found that a 5 % error in F0 and SVA and a 0.5∘ error in the azimuth angle pointing in SKYNET can induce an error of 0.03 in retrieved AOT, and mean and maximum differences in retrieved SSA are about 0.004 and 0.02. Hashimoto et al.(2012), found, in a numerical simulation at 500 nm, as shown in Table 6, a positive SSA retrieval error of +0.03 can be caused by SVA underestimation of about 5 %, AOT underestimation of about −0.02, and ground albedo underestimation of about −0.1.
Aerosol properties in the UV spectral region were extensively measured in the KORUS-AQ campaign (https://espo.nasa.gov/korus-aq/content/KORUS-AQ, last access: 23 July 2020). Mok et al. (2018) compared SSA retrievals, as shown in Fig. 9 and Table 6, from SKYNET SR-CEReS, AERONET, and Pandora AMP radiometers from April to August 2016 at Yonsei University, South Korea. They found differences of around 0.02 for λ≤500 nm and a larger value of 0.05 at 870 nm, similar to those of Che et al. (2008) and Khatri et al. (2016) shown in Table 6. They also found that the SSA difference increased by 0.004 to 0.008 at short wavelengths when they adopted a spectrally fixed ground albedo Ag at 0.1 as was assumed in the SKYNET analysis, instead of the original setup of spectrally varying AERONET ground albedo Ag.

Figure 9Combined spectral SSA from AMP retrievals (blue symbols) and SKYNET retrievals (orange symbols) using MODIS-derived surface albedo. The bottom and top edges of the boxes are located at the sample 25th and 75th percentiles; the whiskers extend to the minimal and maximal values within 1.5 IQR (interquartile range). The outliers are shown in circles. The center horizontal lines are drawn at the median values. The whisker boxes are computed using AOD440 ≥0.4 criteria to correspond the best quality level 2 AERONET data. Cited from Mok et al. (2018).
Cloud contamination is another significant error source, as studied by Hashimoto et al. (2012). They studied a case of cirrus contamination detected by a lidar observation in Beijing and found that Skyrad pack version 4.2 retrieved SSA values larger by between 0.017 and 0.035 than those from version 5, as shown in Table 6. Version 4.2 simply retrieves a cloud particle volume as coarse-mode aerosol volume with the smoothness constraint φ2 in Eq. (21), but version 5 can filter out the cloud particles, owing to the a priori constraint φ1 on SDF. This robustness of version 5 to cloud contamination makes the inversion of the aerosol SDF robust to various noises, as reported by Che et al. (2014) and Jiang et al. (2020), who demonstrated a clear aerosol bimodal size distribution over Beijing in China by using Skyrad pack version 5. Hashimoto et al. (2012), therefore, proposed a data screening protocol to reject unusually large coarse-particle volume: (C1) AOT500 <0.4, (C2) ετ<0.07, and (C3) . Application of this screening protocol reduced SSAs by version 4.2 to be closer to version 5 and AERONET values within 0.03 for 8 to 9 month data at Pune (India) and Beijing (China).
It is also interesting to compare the sky radiometer method with other methods. Kim et al. (2004, 2005) compared SSAs from a sky radiometer with those estimated by the diffuse direct method (King and Herman, 1979) using data from a co-located pyranometer network in the APEX campaign (Asian Atmospheric Particle Environmental Change Studies) (Nakajima et al., 2003). This method is especially beneficial for the climate study community, because the method gives effective SSA values consistent with the Earth radiation budget. They found an RMSD at 500 nm of about 0.03 from data on Amami Ōshima Island. This value is consistent with other values in Table 6.

Figure 10Retrieved and observed aerosol size distribution functions in the African dust event cases in the sun photometer Airborne Validation Experiment in Dust (SAVEX-D) campaign during 16–25 August 2015 (Estellés et al., 2018; Marenco et al., 2018; Ryder et al., 2018).
One reservation about the SSA retrieval by version 5, though, is that it tends to underestimate the SSA due to underestimation of the coarse aerosols when the a priori SDF for constraint tends to zero for radii larger than 10 µm. Hashimoto et al. (2012) showed by their numerical simulation of an enhanced mineral dust case that version 5 tends to underestimate SSA by 0.017 to 0.035 compared to version 4.2, as shown in Table 6, because version 5 mistakenly filters out coarse aerosols using the a priori SDF data xa in Eq. (21c). Estellés et al. (2018) found similar underestimation of the coarse aerosols by version 5 compared to aircraft in situ observations (Marenco et al., 2018; Ryder et al., 2018) for African dust events in the sun photometer Airborne Validation Experiment in Dust (SAVEX-D) campaign during 16–25 August 2015, as shown in Fig. 10. The figure indicates that version 4.2 retrieved coarse-mode SDF similar to the observed SDF, though the error bar is large. These examples suggest an improvement of the a priori SDF data is needed for severe dust storm cases.
Water vapor amount is retrieved from direct solar irradiance measurement in the 940 nm channel. F0 value in the water vapor channel is retrieved by the modified Langley plot (ML or MLP) method based on the following OT formula instead of Eq. (3):
where τa and τR are AOT and OT for molecular scattering, respectively, and Cg is the column-integrated burden of gaseous species, i.e., PWV W in this case; mg is optical air mass for the gaseous species; ag and bg are two prescribed constants to approximate the beam transmittance due to the gaseous species; and ag can be regarded as an equivalent absorption coefficient for band-averaged absorption of the gaseous species. It is common to assume mg to be the same as that of atmospheric air mass, i.e., mg=m in the water vapor case. The value of τa is obtained by an interpolation of the AOT spectrum retrieved from the non-gas absorption channels. There are two algorithms for the SKYNET analysis. One is to use the measured spectral response function of the interference filter of the sky radiometer to prescribe values of ag and bg by the theoretical absorption calculation (Uchiyama et al., 2014). This method is similar to that of the AERONET method. The strong line absorption theory of the 930 nm spectral band yields bg=0.5 (Goody and Yung, 1989) in Eq. (25b). However, there is some dependence of bg on the vertical structure of the atmosphere, and therefore an improved method is proposed by Campanelli et al. (2010, 2014, 2018) to determine ag and bg values using a statistical regression technique of daily observation data at the site. They obtained a range of bg values of 0.53 to 0.61 as monthly mean values of the 3 years from 2007 to 2009 at the San Pietro Capofiume site (SPC; 44∘23′ N, 11∘22′ E, 11 m a.m.s.l.), Italy, with some seasonal dependence. One complexity of this method, however, is a need for measurements of W for making the regression analysis. They used PWV either from radiosonde data or a proxy of PWV constructed from surface meteorological data of temperature and relative humidity. Figure 11 compares PWV by the two methods with GPS and AERONET retrievals in Tsukuba, Japan, and Valencia, Spain, for data taken in 2011. Figure 11 shows that the RMSD from the validation data is less than 0.2 cm using both methods, with some systematic underestimation of the slope of the regression line of 10 % in the former method. Estellés et al. (2012) compared PWV at Valencia, Spain, between AERONET values and those retrieved by the SUNRAD pack for the same Cimel sun photometer. They found an RMSD of 0.20 cm when the SUNRAD pack uses the mode 1 (SKYNET-like) setup, whereas it is reduced to 0.17 cm if SUNRAD uses the mode 2 (AERONET-like) setup, indicating performances of the two modes are similar in water vapor retrievals compared to a significant difference in the AOT case, as shown in Table 5.
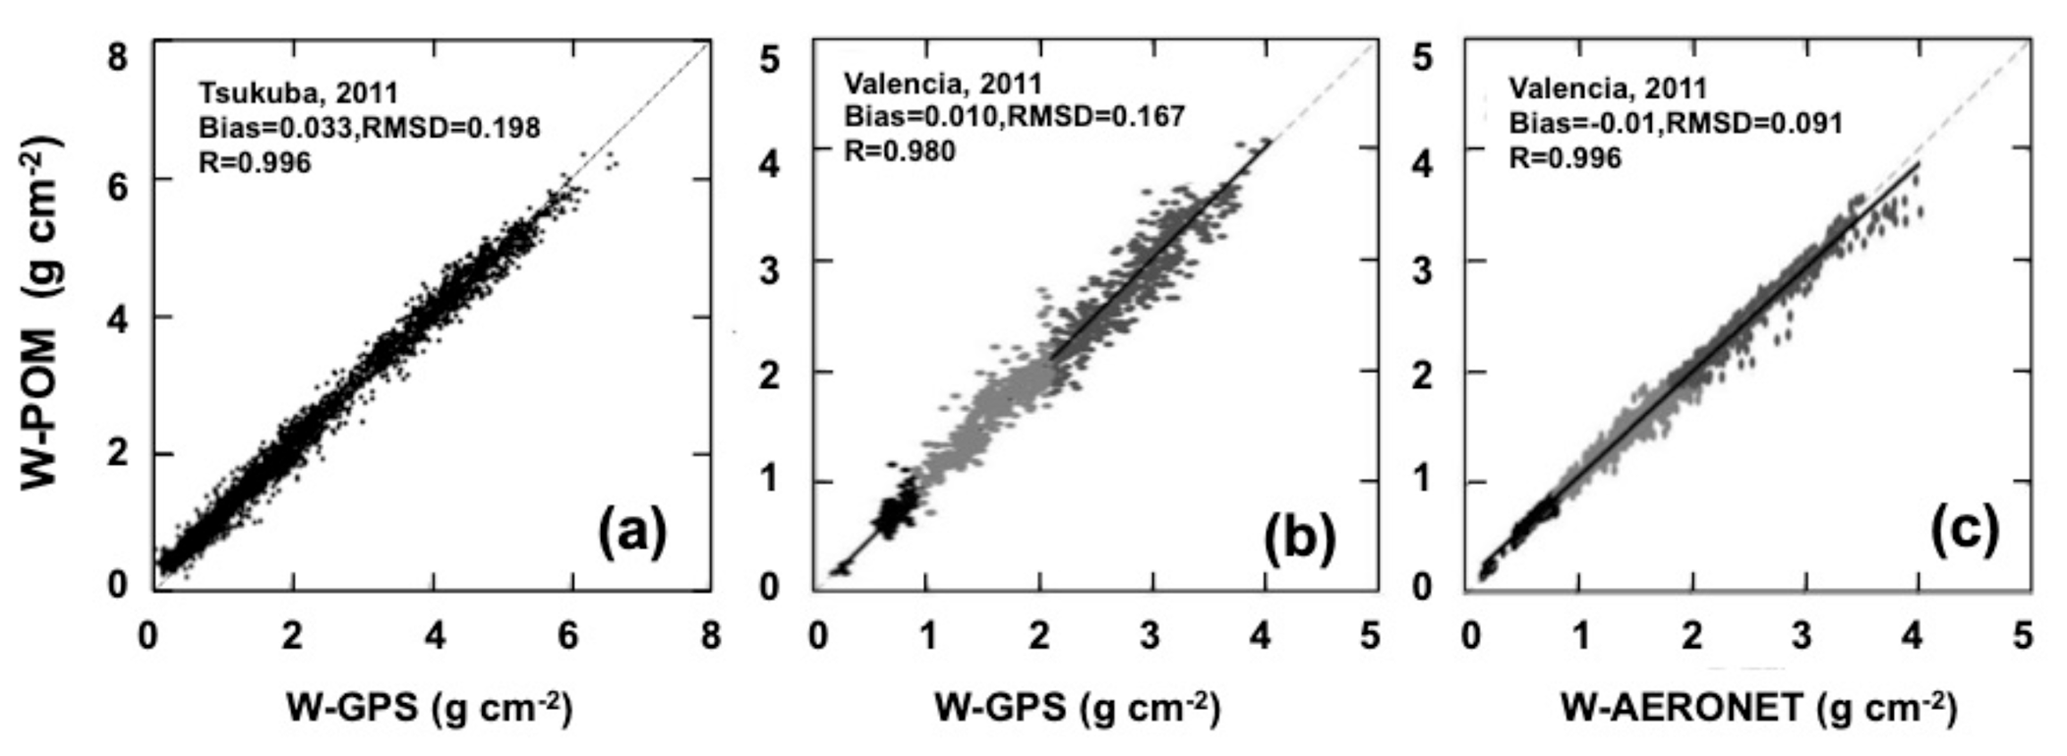
Figure 11Precipitable water retrieved by Uchiyama et al. (2014) in (a) and by Campanelli et al. (2018) in (b) and (c).
In order to get rid of the F0 retrieval process in the water vapor channel, Momoi et al. (2020) proposed a new method of using water vapor dependence of the relative radiance along the almucantar circle of the sky. Although this method has a limited range of retrievable PWV that is less than 2 cm, there is merit in using the value from the method, e.g., Wsky, as a proxy of Cg=W in Eq. (25b) to perform the MLP on site, similar to the IL method for the non-absorption channels, but with
instead of Eq. (25b).
The columnar ozone amount (O3) is retrieved from the direct solar irradiance measurement of 315 nm channel for the Huggins band. Khatri et al. (2014) determined the F0 value using an ML method Eq. (26) assuming bg=1 for ozone without a significant line absorption structure. The formula of mg is given by Robinson (1966). In the F0 determination process, they simultaneously obtained an optimal value of the equivalent ozone absorption coefficient ag, which brings the slope of the ML plot to unity using data of ozone column burden Cg=U measured by the Dobson spectrometer. The RMSD of the fitting for campaign data at the Tsukuba site from 13 December 2012 to 8 January 2013 was 13 DU (Dobson unit) as shown in Fig. 12. They also reported a large degradation of filter transmission in the ozone channel.
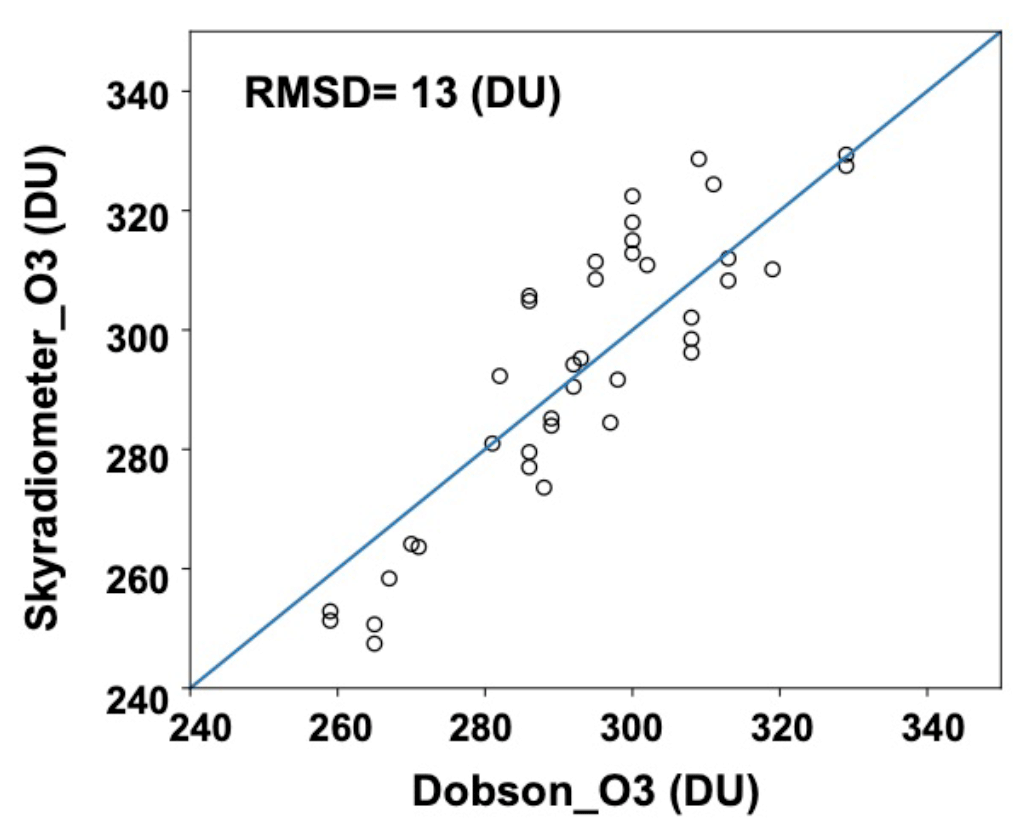
Figure 12Comparison of column ozone amount (DU) retrieved from the sky radiometer at MRI Tsukuba site and from Dobson spectrometer at the JMA Tateno Observatory from 13 December 2012 to 8 January 2013.
Cloud microphysical properties have been obtained from diffuse sky radiance measurements from satellites (Nakajima and King, 1990). A similar approach can be applied to the ground-based radiance measurements. Chiu et al. (2010, 2012) retrieved cloud optical thickness (COT) and effective particle radius (CER) from AERONET data. SKYNET uses the POM-02 sky radiometer, which has 1.6 and 2.2 µm channels (Kikuchi et al., 2006; Khatri et al., 2019). Figure 13 compares COT retrieved from POM-02 at zenith observations at the three sites of Chiba, Fukue, and Hedo combined with retrievals from Himawari-8/AHI satellite-borne imager in a period of October 2015 to December 2016 (Khatri et al., 2019). Satellite retrieval results were obtained by the Comprehensive Analysis Program for Cloud Optical Measurement (CAPCOM) (Nakajima and Nakajima, 1995) in the system of AMATERASS (Takenaka et al., 2011; Damiani et al., 2018). Geostationary satellite observation has the merit of frequent time-matching with the ground-based observation. Figure 13 shows that there is a large scatter of RMSD at 10.2 and a correlation of 0.89. They also studied cloud effective particle radius but did not find a significant correlation between SKYNET and AHI observations. Figure 14 also compares the broadband radiance at zenith measured by a ground-based pyrheliometer and with broadband horizontal radiative flux measured by a pyranometer with those theoretically calculated using the cloud parameters from sky radiometer measurement. Figure 14 indicates that the down-welling radiance at zenith was consistent between the two radiometers, but horizontal radiative fluxes were not well represented by the cloud optical properties retrieved from the sky radiometer at nadir. Figures 13 and 14 suggest that the inhomogeneity of cloud fields is the main source of differences between the cloud parameters obtained by the sky radiometer and satellite measurements.

Figure 13Comparison of cloud optical thickness (COT) retrieved from sky radiometer at the Chiba, Fukue, and Hedo sites and the Himawari-8/AHI satellite-borne imager in the period of October 2015 to December 2016 (Khatri et al., 2019). The regression line is shown with zero intercept constraint at the origin.
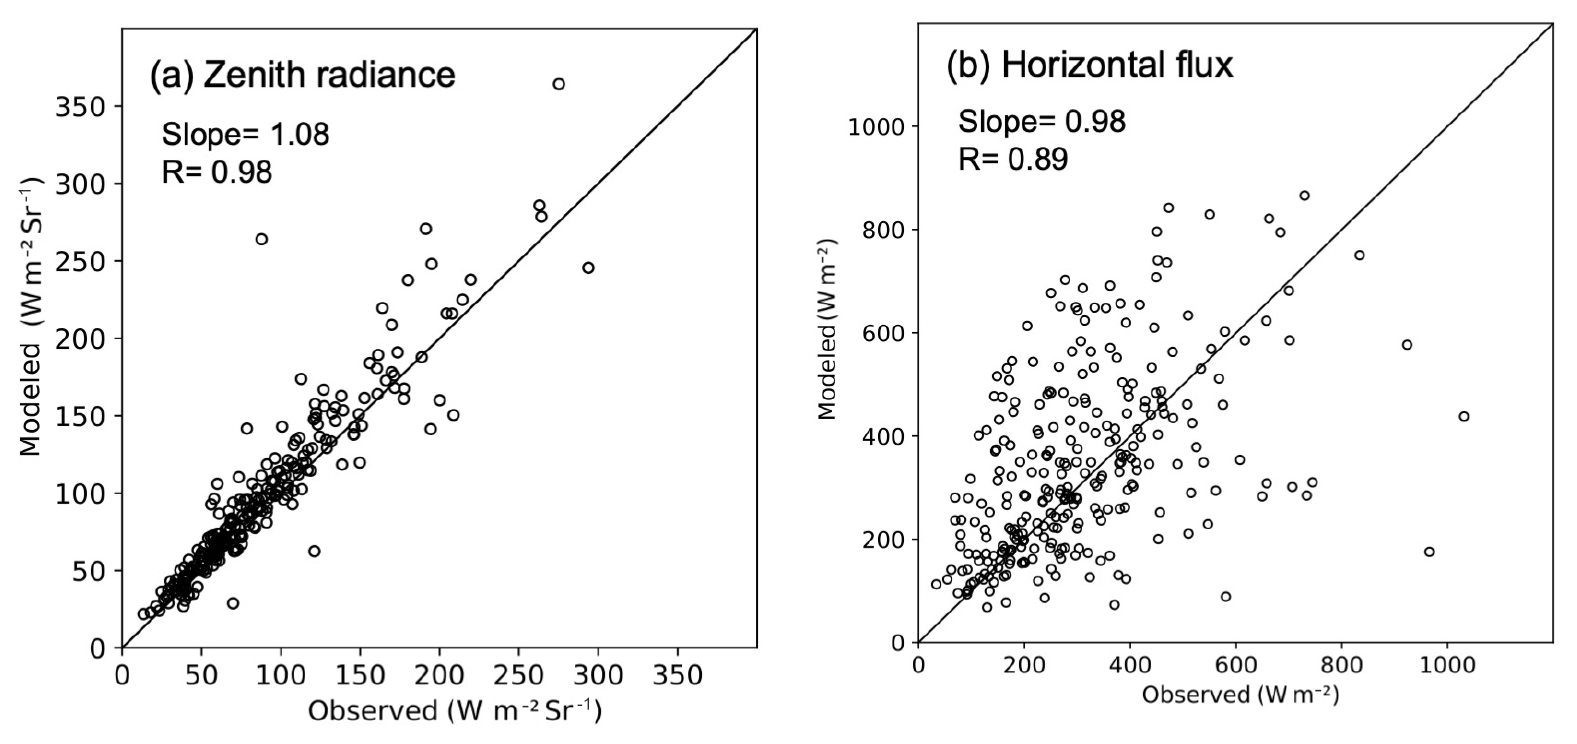
Figure 14The same as in Fig. 13 but for the comparison between modeled and observed broadband (a) radiances and (b) horizontal radiative fluxes. Regression lines are shown with zero intercept constraint at the origin.
The SKYNET community has undertaken efforts at improving their on-site calibration and analysis systems to provide retrieved aerosol and other atmospheric constituents.
An estimate of the retrieval accuracy of F0 is given by Eq. (10) for the IL method, which can serve as an approximation of observed monthly mean uncertainty in F0 as 0.5 % to 2.4 % at the Tokyo and Rome sites and smaller values of around 0.3 % to 0.5 % at the mountain sites of Mt. Saraswati and Davos. These values are consistent with RMSD values, in the AOT comparisons with other networks, of less than 0.02 for λ≥500 nm and a larger value of about 0.03 for shorter wavelengths in city areas and smaller values of less than 0.01 in mountain comparisons. We also developed a new XIL method to correct an underestimation by the IL method in the case of large aerosol retrieval errors.
Several causes of larger SSA values reaching 0.07 than those of other networks have been identified as underestimation of SVA measured by the disk scan method and the new lamp scan method, cloud contamination, and others. Recent reported values of the difference are found to be less than 0.03 after these corrections.
Retrievals of other atmospheric constituents by the sky radiometer are also reviewed. We found accuracies of about 0.2 cm for the precipitable water vapor amount and 13 DU for the column ozone amount. A new on-site calibration method for water vapor has been developed. The cloud optical properties were found to have some (but not large) correlation with satellite remote sensing values, suggesting cloud inhomogeneity may be one source of error.
There are several aims for the next step of the SKYNET to make its system more reliable and useful for the science community. The reported useful improvements of the product quality are still in the research phase, and it is important to introduce them into the existing operational systems and future system of the ISDC. Comparison studies also showed that the analysis software Skyrad pack may need improvements in its simplified optical model. We want to pursue our on-site calibration system for sustainable operation of the network. However, it is still required for a full accuracy assessment to conduct continuous comparison of on-site calibrations of our standard sky radiometer with high mountain calibrations and other network calibrations.
L2 products of SKYNET are available at the archives listed in Table 2. Other datasets used in the present study are available from the corresponding author on reasonable request.
The main contributions to network management were made by TeN, MC, HC, HI, SWK, JK, DL, ToN, GP, VKS, BT, NUT, KA, and AY; to algorithm developments by TeN, MC, VE, HI, MH, PK, RK, MM, and AU; and to data analyses and archiving by MC, HC, VE, HI, SWK, JK, DL, ToN, GP, VKS, BT, NUT, KA, SG, AH, SK, PK, NK, RK, FM, MM, SSN, CLR, AU, and AY.
The authors declare that they have no conflict of interest.
This article is part of the special issue “SKYNET – the international network for aerosol, clouds, and solar radiation studies and their applications (AMT/ACP inter-journal SI)”. It is not associated with a conference.
We are grateful for the support from the JAXA (Japan Aerospace Exploration Agency) SGLI, MOEJ (Ministry of the Environment Japan)-NIES (National Institute for Environmental Studies)-JAXA GOSAT and GOSAT2, ERCA (Environmental Restoration and Conservation Agency) ERDF/S-12, and JST (Japan Science and Technology Agency)/CREST/TEEDDA (JPMJCR15K4) projects. Kazuhiko Miura of Tokyo University of Science is gratefully acknowledged for providing us with Langley plot data. A group of the co-authors were supported by ERCA/ERDF/2-1901, JSPS (Japan Society for the Promotion of Science) /KAKENHI/JP19H04235, P17K00529, and the JAXA 2nd research announcement on the Earth Observations (grant number 19RT000351). ESR is grateful for the support of the Spanish Ministry of Economy and Competitiveness and European Regional Development Fund through funding to the University of Valencia within several projects, such as CGL2015-70432-R and CGL2017-86966-R. The SAVEX-D campaign was funded by EUFAR TNA (European Union Seventh Framework Programme, grant agreement no. 312609), making use of airborne data obtained using the BAe-146-301 Atmospheric Research Aircraft operated by Airtask Ltd and managed by the Facility for Airborne Atmospheric Measurements (FAAM). It was a success thanks to many staff at the Met Office, the University of Leeds, the University of Manchester, the University of Hertsfordshire, FAAM, Directflight Ltd, Avalon Engineering and BAE Systems. ESR also thanks Emanuele Costantini of the Research Area of Tor Vergata for the data center and server maintenance, Dr. Igor Bertello for his help on the development of the ESR system, and Dr. Henri Diémoz from ARPA Valle d'Aosta for continuous support of ESR activities.
Jhoon Kim was supported by the “Technology development for Practical Applications of Multi-Satellite data to maritime issues” project, funded by the Ministry of Ocean and Fisheries, South Korea.
We thank Alexander Smirnov of NASA GSFC for useful discussions about the history of sun and sky measurements.
This research has been supported by the JAXA (grant nos. SGLI and 19RT000351), the MOEJ-NIES-JAXA (GOSAT and GOSAT2), the ERCA (grant nos. S-12 and 2-1901), the JST (grant no. JPMJCR15K4), the JSPS (grant nos. JP19H04235 and P17K00529), the Spanish Ministry of Economy and Competitiveness and European Regional Development Fund (grant nos. CGL2015-70432-R and CGL2017-86966-R), and the EUFAR TNA (grant no. 312609).
This paper was edited by Omar Torres and reviewed by two anonymous referees.
Abbot, C. G.: The silver disk pyrheliometer, Smithson. Misc. Collect., 56, 11 pp., Smithsonian Institution, Washington, D.C., USA, 1911.
Abbot, C. G. and Aldrich, L. B.: The pyranometer- An instrument for measuring sky radiation, Smithson. Misc. Collect., 66, 9 pp., Smithsonian Institution, Washington, D.C., USA, 1916.
Ångström, A. K.: Techniques of determining the turbidity of the atmosphere, Tellus, 13, 214–223, 1961.
Ångström, A. K.: Circumsolar sky radiation and turbidity of the atmosphere, Appl. Optics, 13, 474–477, 1974.
Boi, P., Tonna, G., Dalu, G., Nakajima, T., Olivieri, B., Pompei, A., Campanelli, M., and Rao, R.: Calibration and data elaboration procedure for sky irradiance measurements, Appl. Optics, 38, 896–907, https://doi.org/10.1364/AO.38.000896, 1999.
Box, M. A. and Deepak, A.: Single and multiple scattering contributions to circumsolar radiation, Appl. Optics, 17, 3794–3797, 1978.
Box, M. A. and Deepak, A.: Retrieval of aerosol size distributions by inversion of simulated aureole data in the presence of multiple scattering, Appl. Optics, 18, 1376–1382, 1979.
Bullrich, K.: Scattered radiation in the atmosphere and the natural aerosol, Adv. Geophys., 10, 99–260, 1964.
Bullrich, K., Eiden, R., and Nowak, W.: Sky Radiation, polarization and twilight radiation in Greenland, Pure Appl. Geophys., 64, 220–242, 1967.
Bullrich, K., Eiden, R., Jaenicke, R., and Nowak, W.: Solar radiation extinction, sky radiation, sky light polarization and aerosol particle total number and size distribution on the Island Maui (Hawaii), Pure Appl. Geophys., 69, 280–319, 1968.
Campanelli, M., Nakajima, T., and Olivieri, B.: Determination of the solar calibration constant for a sun sky radiometer. Proposal of an in situ procedure, Appl. Optics, 43, 651–659, 2004.
Campanelli, M., Estellés, V., Tomasi, C., Nakajima, T., Malvestuto, V., and Martínez-Lozano, J. A.: Application of the SKYRAD improved Langley plot method for the in situ calibration of CIMEL sun-sky photometers, Appl. Optics, 46, 2688–2702, 2007.
Campanelli, M., Lupi, A., Nakajima, T., Malvestuto, V., Tomasi, C., and Estellés, V.: Summertime columnar content of atmospheric water vapor from ground-based Sun-sky radiometer measurements through a new in situ procedure, J. Geophys. Res., 115, D19304, https://doi.org/10.1029/2009JD013211, 2010.
Campanelli, M., Estellés, V., Smyth, T., Tomasi, C., Martinez-Lozano, M. P., Claxton, B., Muller, P., Pappalardo, G. , Pietruczuk, A., Shanklin, J., Colwell, S., Wrench, C., Lupi, A., Mazzola, M., Lanconelli, C., Vitale, V., Congeduti, F., Dionisi, D., Cardillo, F., Cacciani, M., Casasanta, G., and Nakajima, T.: Monitoring of Eyjafjallajökull volcanic aerosol by the new European Skynet Radiometers (ESR) network, Atmos. Environ., 48, 33–45, https://doi.org/10.1016/j.atmosenv.2011.09.070, 2012.
Campanelli, M., Nakajima, T., Khatri, P., Takamura, T., Uchiyama, A., Estellés, V., Liberti, G. L., and Malvestuto, V.: Retrieval of characteristic parameters for water vapour transmittance in the development of ground-based sun–sky radiometric measurements of columnar water vapour, Atmos. Meas. Tech., 7, 1075–1087, https://doi.org/10.5194/amt-7-1075-2014, 2014.
Campanelli, M., Mascitelli, A., Sanò, P., Diémoz, H., Estellés, V., Federico, S., Iannarelli, A. M., Fratarcangeli, F., Mazzoni, A., Realini, E., Crespi, M., Bock, O., Martínez-Lozano, J. A., and Dietrich, S.: Precipitable water vapour content from ESR/SKYNET sun–sky radiometers: validation against GNSS/GPS and AERONET over three different sites in Europe, Atmos. Meas. Tech., 11, 81–94, https://doi.org/10.5194/amt-11-81-2018, 2018.
Che, H., Shi, G., Uchiyama, A., Yamazaki, A., Chen, H., Goloub, P., and Zhang, X.: Intercomparison between aerosol optical properties by a PREDE skyradiometer and CIMEL sunphotometer over Beijing, China, Atmos. Chem. Phys., 8, 3199–3214, https://doi.org/10.5194/acp-8-3199-2008, 2008.
Che, H., Shi, G., Zhao, H., Nakajima, T., Khatri, P., Takamura, T., Wang, H., Wang, Y., Sun, J., and Zhang, X.: Aerosol optical properties retrieved from a Prede sky radiometer over an urban site of Beijing, China, J. Meteorol. Soc. Jpn., 92A, 17–31, https://doi.org/10.2151/jmsj.2014-A02, 2014.
Chiu, J.-C, Huang, C.-H., Marshak, A., Slutsker, I., Giles, D. M., Holben, B., Knyazikhin, Y., and Wiscombe, W.: Cloud optical depth retrievals from the Aerosol Robotic Network (AERONET) cloud mode observations, J. Geophys. Res., 115, D14202, https://doi.org/10.1029/2009JD013121, 2010.
Chiu, J. C., Marshak, A., Huang, C.-H., Várnai, T., Hogan, R. J., Giles, D. M., Holben, B. N., O'Connor, E. J., Knyazikhin, Y., and Wiscombe, W. J.: Cloud droplet size and liquid water path retrievals from zenith radiance measurements: examples from the Atmospheric Radiation Measurement Program and the Aerosol Robotic Network, Atmos. Chem. Phys., 12, 10313–10329, https://doi.org/10.5194/acp-12-10313-2012, 2012.
Damiani, A., Irie, H., Horio, T., Takamura, T., Khatri, P., Takenaka, H., Nagao, T., Nakajima, T. Y., and Cordero, R. R.: Evaluation of Himawari-8 surface downwelling solar radiation by ground-based measurements, Atmos. Meas. Tech., 11, 2501–2521, https://doi.org/10.5194/amt-11-2501-2018, 2018.
Dave, J. D.: Determination of size distribution of spherical polydispersions using scattered radiation data, Appl. Optics, 10, 2035–2044, 1971.
de Bary, E.: Influence of multiple scattering of the intensity and polarization of diffuse sky radiation, Appl. Optics, 3, 1293–1303, 1964.
Deirmendjian, D.: Theory of the solar aureole Part I: Scattering and radiative transfer, Ann. Géophys., 13, 286–306, 1957.
Deirmendjian, D.: Theory of the solar aureole Part II: Applications to atmospheric models, Ann. Géophys., 15, 218–249, 1959.
Dubovik, O.: Optimization of Numerical Inversion in Photopolarimetric Remote Sensing, in: Photopolarimetry in Remote Sensing, edited by: Videen, G., Yatskiv, Y., and Mishchenko, M., Kluwer Academic Publishers, Dordrecht, the Netherlands, 65–106, 2004.
Dubovik, O. and King, M. D.: A flexible inversion algorithm for retrieval of aerosol optical properties from Sun and sky radiative measurements, J. Geophys. Res., 105, 20673–20696, 2000.
Dubovik, O., Smirnov, A., Holben, B., King, M. D., Kaufman, Y. J., Eck, T. F., and Slutsker, I.: Accuracy assessment of aerosol optical properties retrieval from Aerosol Robotic Network (AERONET) Sun and sky radiance measurements, J. Geophys. Res., 105, 9791–9806, 2000.
Dubovik, O., Holben, B., Eck, T. F., Smirnov, A., Kaufman, Y. J., King, M. D., Tanré, D., and Slutsker, I.: Variability of absorption and optical properties of key aerosol types observed in worldwide locations, J. Geophys. Res., 59, 590–608, 2002.
Dubovik, O., Sinyuk, A., Lapyonok, T., Holben, B. N., Mishchenko, M., Yang, P., Eck, T. F., Volten, H., Muñoz, O., Veihelmann, B., van der Zande, W. J., Leon, J. F., Sorokin, M., and Slutsker, I.: Application of spheroid models to account for aerosol particle nonsphericity in remote sensing of desert dust, J. Geophys. Res., 111, D11208, https://doi.org/10.1029/2005JD006619, 2006.
Dubovik, O., Herman, M., Holdak, A., Lapyonok, T., Tanré, D., Deuzé, J. L., Ducos, F., Sinyuk, A., and Lopatin, A.: Statistically optimized inversion algorithm for enhanced retrieval of aerosol properties from spectral multi-angle polarimetric satellite observations, Atmos. Meas. Tech., 4, 975–1018, https://doi.org/10.5194/amt-4-975-2011, 2011.
Eiden, R.: Calculations and measurements of the spectral radiance of the solar aureole, Tellus, 20, 380–399, 1968.
Estellés, V., Campanelli, M., Smyth, T. J., Utrillas, M. P., and Martínez-Lozano, J. A.: Evaluation of the new ESR network software for the retrieval of direct sun products from CIMEL CE318 and PREDE POM01 sun-sky radiometers, Atmos. Chem. Phys., 12, 11619–11630, https://doi.org/10.5194/acp-12-11619-2012, 2012.
Estellés, V., Marenco, F., Ryder, C., Segura, S., O'sullivan, D., Brooke, J., Campanelli, M., Buxmann, J., and Martínez-Lozano, J. A.: Validation of AERONET and ESR/SKYNET size distributions with airborne insitu measurements in dust conditions, 9th International Workshop on Sand/Duststorms and Associated Dustfall, 22–24 May 2018, Tenerife, Spain, 2018.
Fesenkov, V. G.: To the question of solar constant determination, Sov. Astron. J., 10, 249–266, 1933.
Giles, D. M., Sinyuk, A., Sorokin, M. G., Schafer, J. S., Smirnov, A., Slutsker, I., Eck, T. F., Holben, B. N., Lewis, J. R., Campbell, J. R., Welton, E. J., Korkin, S. V., and Lyapustin, A. I.: Advancements in the Aerosol Robotic Network (AERONET) Version 3 database – automated near-real-time quality control algorithm with improved cloud screening for Sun photometer aerosol optical depth (AOD) measurements, Atmos. Meas. Tech., 12, 169–209, https://doi.org/10.5194/amt-12-169-2019, 2019.
Go, S., Kim, J., Mok, J., Irie, H., Yoon, J., Torres, O., Krotkov, N. A., Labow, G., Kim, M., Koo, J.-H., Choi, M., and Lim, H.: Ground-based retrievals of aerosol column absorption in the UV spectral region and their implications for GEMS measurements, Remote Sens. Environ., 245, 111759, https://doi.org/10.1016/j.rse.2020.111759, 2020.
Goody, R. M. and Yung, Y. L.: Atmospheric Radiation, 2nd edn., Oxford Univ. Press, New York, USA, Oxford, UK, 286 pp., 1989.
Gorodetskiy, A. K., Katin, V. S., and Petrenko, B. Z.: The transparency of the atmosphere and the scattering phase function from aircraft measurements at 1.9–2.3 µm, Izv. Atmos. Ocean. Phy.+, 12, 1269–1276, 1976.
Green, A. E. S., Deepak, A., and Lipofsky, B.J.: Interpretation of the sun's aureole based on atmospheric models, Appl. Optics, 10, 1263–1279, 1971.
Hashimoto, M., Nakajima, T., Dubovik, O., Campanelli, M., Che, H., Khatri, P., Takamura, T., and Pandithurai, G.: Development of a new data-processing method for SKYNET sky radiometer observations, Atmos. Meas. Tech., 5, 2723–2737, https://doi.org/10.5194/amt-5-2723-2012, 2012.
Holben, B. N., Eck, T. F., Slutsker, I., Tanré, D., Buis, J. P., Set- zer, A., Vermote, E., Reagan, J. A., Kaufman, Y. J., Nakajima, T., Lavenu, F., Jankowiak, I., and Smirnov, A.: AERONET – A federated instrument network and data archive for aerosol characterization, Remote Sens. Environ., 66, 1–16, 1998.
Holben, B. N., Tanré, D., Smirnov, A., Eck, T. F., Slutsker, I., Abuhassan, N., Newcomb, W.W., Schafer, J.S., Chatenet, B., Lavenu, F., Kaufman, Y.J., Vande Castle, J., Setzer, A., Markham, B., Clark, D., Frouin, R., Halthore, R., Karneli, A., O'Neill, N. T., Pietras, C., Pinker, R. T., Voss, K., and Zibordi, G.: An emerging ground-based aerosol climatology: Aerosol optical depth from AERONET, J. Geophys. Res., 106, 12067–12097, 2001.
Hoyt, D. V.: The Smithsonian Astrophysical Observatory solar constant program, Rev. Geophys. Space Phys., 17, 427–458, 1979a.
Hoyt, D. V.: Pyrheliometric and circumsolar sky radiation measurements by the Smithsonian Astrophysical Observatory from 1923 to 1954, Tellus, 31, 217–229, 1979b.
Irie, H., Hoque, H. M. S., Damiani, A., Okamoto, H., Fatmi, A. M., Khatri, P., Takamura, T., and Jarupongsakul, T.: Simultaneous observations by sky radiometer and MAX-DOAS for characterization of biomass burning plumes in central Thailand in January–April 2016, Atmos. Meas. Tech., 12, 599–606, https://doi.org/10.5194/amt-12-599-2019, 2019.
Jiang, Z., Duan, M., Che, H., Zhang, W., Nakajima, T., Hashimoto, M., Chen, B., and Yamazaki, A.: Intercomparison between the aerosol optical properties retrieved by different inversion methods from SKYNET sky radiometer observations over Qionghai and Yucheng in China, Atmos. Meas. Tech., 13, 1195–1212, https://doi.org/10.5194/amt-13-1195-2020, 2020.
Kalitin, N. N.: To the question of studying sky radiation intensity around the Sun, Bulletin of Constant Actinometric Commission of Main Geophysical Observatory, 1, 51–56, 1930 (in Russian).
Kaufman, Y. J., Gobbi, G. P., and Koren, I.: Aerosol climatology using a tunable spectral variability, cloud screening of AERONET data, Geophys. Res. Lett., 33, L07817, https://doi.org/10.1029/2005GL025478, 2006.
Kazadzis, S., Kouremeti, N., Diémoz, H., Gröbner, J., Forgan, B. W., Campanelli, M., Estellés, V., Lantz, K., Michalsky, J., Carlund, T., Cuevas, E., Toledano, C., Becker, R., Nyeki, S., Kosmopoulos, P. G., Tatsiankou, V., Vuilleumier, L., Denn, F. M., Ohkawara, N., Ijima, O., Goloub, P., Raptis, P. I., Milner, M., Behrens, K., Barreto, A., Martucci, G., Hall, E., Wendell, J., Fabbri, B. E., and Wehrli, C.: Results from the Fourth WMO Filter Radiometer Comparison for aerosol optical depth measurements, Atmos. Chem. Phys., 18, 3185–3201, https://doi.org/10.5194/acp-18-3185-2018, 2018a.
Kazadzis, S., Kouremeti, N., Nyeki, S., Gröbner, J., and Wehrli, C.: The World Optical Depth Research and Calibration Center (WORCC) quality assurance and quality control of GAW-PFR AOD measurements, Geosci. Instrum. Method. Data Syst., 7, 39–53, https://doi.org/10.5194/gi-7-39-2018, 2018b.
Khatri, P. and Takamura, T.: An algorithm to screen cloud-affected data for sky radiometer data anlaysis, J. Meteorol Soc. Jpn., 87, 189–204, 2009.
Khatri P., Takamura, T., Shimizu, A., and Sugimoto, N.: Spectral dependency of aerosol light-absorption over the East China Sea region, SOLA, 6, 1–4, https://doi.org/10.2151/sola.2010-001, 2010.
Khatri, P., Takamura, T., Yamazaki, A., and Uchiyama, A.: Use of 315 nm channel data of the sky radiometer to estimate the columnar ozone concentration: A preliminary study, J. Meteorol. Soc. Jpn., 92A, 185–194, https://doi.org/10.2151/jmsj.2014-A12, 2014.
Khatri, P., Takamura, T., Nakajima, T., Estellés, V., Irie, H., Kuze, H., Campanelli, M., Sinyuk, A., Lee, S.-M., Sohn, B. J., Pandithurai, G., Kim, S.-W., Yoon, S. C., Martinez-Lozano, J. A., Hashimoto, M., Devara, P. C. S., and Manago, N.: Factors for inconsistent aerosol single scattering albedo between SKYNET and AERONET, J. Geophys. Res.-Atmos., 121, 1859–1877, https://doi.org/10.1002/2015JD023976, 2016.
Khatri, P., Iwabuchi, H., Hayasaka, T., Irie, H., Takamura, T., Yamazaki, A., Damiani, A., Letu, H., and Kai, Q.: Retrieval of cloud properties from spectral zenith radiances observed by sky radiometers, Atmos. Meas. Tech., 12, 6037–6047, https://doi.org/10.5194/amt-12-6037-2019, 2019.
Kikuchi, N., Nakajima, T., Kumagai, H., Kuroiwa, H., Kamei, A., Nakamura, R., and Nakajima, T. Y.: Cloud optical thickness and effective particle radius derived from transmitted solar radiation measurements: Comparison with cloud radar observations, J. Geophys. Res., 111, D07205, https://doi.org/10.1029/2005JD006363, 2006.
Kim, D.-H., Sohn, B.-J., Nakajima, T., Takamura, T., Takemura, T., Choi, B.-C., and Yoon, S.-C.: Aerosol optical properties over East Asia determined from ground-based sky radiation measurements, J. Geophys. Res., 109, D02209, https://doi.org/10.1029/2003JD003387, 2004.
Kim, D.-H., Sohn, B.-J., Nakajima, T., and Takamura, T.: Aerosol radiative forcing over East Asia determined from ground-based solar radiation measurements, J. Geophys. Res., 110, D10S22, https://doi.org/10.1029/2004JD004678, 2005.
Kim, J., Jeong, U., Ahn, M.-H., Kim, J. H., Park, R. J., Lee, H., Song, C. H., Choi, Y.-S., Lee, K.-H., Yoo, J.-M., Jeong, M.-J., Park, S. K., Lee, K.-M., Song, C.-K., Kim, S.-W., Kim, Y. J., Kim, S.-W., Kim, M., Go, S., Liu, X., Chance, K., Miller, C. C., Al-Saadi, J., Veihelmann, B., Bhartia, P. K., Torres, O., Abad, G. G., Haffner, D. P., Ko, D. H., Lee, S. H., Woo, J.-H., Chong, H., Park, S. S., Nicks, D., Choi, W. J., Moon, K.-J., Cho, A., Yoon, J., Kim, S.-K., Hong, H., Lee, K., Lee, H., Lee, S., Choi, M., Veefkind, P., Levelt, P. F., Edwards, D. P., Kang, M., Eo, M., Bak, J., Baek, K., Kwon, H.-A., Yang, J., Park, J., Han, K. M., Kim, B.-R., Shin, H.-W., Choi, H., Lee, E., Chong, J., Cha, Y., Koo, J.-H., Irie, H., Hayashida, S., Kasai, Y., Kanaya, Y., Liu, C., Lin, J., Crawford, J. H., Carmichael, G. R., Newchurch, M. J., Lefer, B. L., Herman, J. R., Swap, R. J., Lau, A. K. H., Kurosu, T. P., Jaross, G., Ahlers, B., Dobber, M., McElroy, C. T., and Choi, Y.: New era of air quality monitoring from space, Geostationary Environment Monitoring Spectrometer (GEMS), B. Am. Meteorol. Soc., 101, E1–E22, https://doi.org/10.1175/BAMS-D-18-0013.1, 2020.
King, M. D. and Herman, B. M.: Determination of the ground albedo and the index of absorption of atmospheric particulates by remote sensing. part I: Theory, J. Atmos. Sci., 36, 163–173, 1979.
Kobayashi, E., Uchiyama, A., Yamazaki, A., and Matsuse, K.: Application of the statistical optimization method to the inversion algorithm for analyzing aerosol optical properties from sun and sky radiance measurements, J. Meteorol. Soc. Jpn., 84, 1047–1062, 2006.
Kobayashi, E., Uchiyama, A., Yamazaki, A., and Kudo, R.: Retrieval of aerosol optical properties based on the spheroid model, J. Meteorol. Soc. Jpn., 88, 847–856, 2010.
Kobayashi, H. and Shiobara, M.: Development of new shipborne aureolemeter to measure the intensities of direct and scattered solar radiation on rolling and pitching vessel, Proc. SPIE 9640, Remote Sensing of Clouds and the Atmosphere XX, 96401A, 1–9, https://doi.org/10.1117/12.2195691, 2015.
Manago, N., Khatri, P., Irie, H., Takamura, T., and Kuze, H.: On the method of solid view angle calibration for SKYNET skyradiometers, 4th International SKYNET workshop, 2–4 March 2016, Rome, Italy, 2016.
Marenco, F., Ryder, C., Estellés, V., O'Sullivan, D., Brooke, J., Orgill, L., Lloyd, G., and Gallagher, M.: Unexpected vertical structure of the Saharan Air Layer and giant dust particles during AER-D, Atmos. Chem. Phys., 18, 17655–17668, https://doi.org/10.5194/acp-18-17655-2018, 2018.
Mok, J., Krotkov, N. A., Torres, O., Jethva, H., Li, Z., Kim, J., Koo, J.-H., Go, S., Irie, H., Labow, G., Eck, T. F., Holben, B. N., Herman, J., Loughman, R. P., Spinei, E., Lee, S. S., Khatri, P., and Campanelli, M.: Comparisons of spectral aerosol single scattering albedo in Seoul, South Korea, Atmos. Meas. Tech., 11, 2295–2311, https://doi.org/10.5194/amt-11-2295-2018, 2018.
Momoi, M., Kudo, R., Aoki, K., Mori, T., Miura, K., Okamoto, H., Irie, H., Shoji, Y., Uchiyama, A., Ijima, O., Takano, M., and Nakajima, T.: Development of on-site self-calibration and retrieval methods for sky-radiometer observations of precipitable water vapor, Atmos. Meas. Tech., 13, 2635–2658, https://doi.org/10.5194/amt-13-2635-2020, 2020.
Murai, K.: Spectral measurements of direct solar radiation and of sun's aureole (I), Pap. Meteorol. Geophys., 18, 239–291, 1967.
Nakajima, T. and King, M. D.: Determination of the optical thickness and effective radius of clouds from reflected solar radiation measurements. Part I: Theory, J. Atmos. Sci., 47, 1878–1893, 1990.
Nakajima, T. and Tanaka, M.: Algorithms for radiative intensity calculations in moderately thick atmospheres using a truncation approximation, J. Quant. Spectrosc. Ra., 40, 51–69, https://doi.org/10.1016/0022-4073(88)90031-3, 1988.
Nakajima, T., Tanaka, M., and Yamauchi, T.: Retrieval of the optical properties of aerosols from aureole and extinction data, Appl. Optics, 22, 2951–2959, 1983.
Nakajima, T., Tanaka, M., Hayasaka, T., Miyake, Y., Nakanishi, Y., and Sasamoto, K.: Airborne measurements of the optical stratification of aerosols in turbid atmospheres, Appl. Optics, 25, 4374–4381, 1986.
Nakajima, T., Tonna, G., Rao, R., Kaufman, Y., and Holben, B.: Use of sky brightness measurements from ground for remote sensing of particulate polydispersions, Appl. Optics, 35, 2672–2686, https://doi.org/10.1364/AO.35.002672, 1996.
Nakajima, T., Sekiguchi, M., Takemura, T., Uno, I., Higurashi, A., Kim, D. H., Sohn, B. J., Oh, S. N., Nakajima, T. Y., Ohta, S., Okada, I., Takamura, T., and Kawamoto, K.: Significance of direct and indirect radiative forcings of aerosols in the East China Sea region, J. Geophys. Res., 108, 8658, https://doi.org/10.1029/2002JD003261, 2003.
Nakajima, T., Yoon, S.-C., Ramanathan, V., Shi, G.-Y., Takemura, T., Higurashi, A., Takamura, T., Aoki, K., Sohn, B.-J., Kim, S.-W., Tsuruta, H., Sugimoto, N., Shimizu, A., Tanimoto, H., Sawa, Y., Lin, N.-H., Lee, C.-T., Goto, D., and Schutgens, N.: Overview of the Atmospheric Brown Cloud East Asian Regional Experiment 2005 and a study of the aerosol direct radiative forcing in east Asia, J. Geophys. Res., 112, D24S91, https://doi.org/10.1029/2007JD009009, 2007.
Nakajima, T. Y. and Nakajima, T.: Wide-area determination of cloud microphysical properties from NOAA AVHRR measurements for FIRE and ASTEX regions, J. Atmos. Sci., 52, 4043–4059, https://doi.org/10.1175/1520-0469(1995)052<4043:WADOCM>2.0.CO;2, 1995.
Ningombam, S. S., Bagare, S. P., Singh, R. B., Campanelli, M., Khatri, P., and Dorjey, N.: Calibration of a Sky radiometer (Prede) using observations obtained from Hanle and Merak high-altitude stations, Atmos. Res., 143, 118–128, 2014.
Ogawa, H., Tanaka, M., and Nakajima, T.: A simple expression for the additional sky radiance produced by polarization effects, J. Meteorol. Soc. Jpn., 67, 877–888, 1989.
O'Neill, N. T. and Miller, J. R.: Combined solar aureole and solar beam extinction measurements. 1: Calibration considerations, Appl. Optics, 23, 3691–3696, 1984a.
O'Neill, N. T. and Miller, J. R.: Combined solar aureole and solar beam extinction measurements. 2: Studies of the inferred aerosol size distribution, Appl. Optics, 23, 3697–3703, 1984b.
Ota, Y., Higurashi, A., Nakajima, T., and Yokota, T.: Matrix formulations of radiative transfer including the polarization effect in a coupled atmosphere-ocean system, J. Quant. Spectrosc. Ra., 111, 878–894, https://doi.org/10.1016/j.jqsrt.2009.11.021, 2010.
Pandithurai, G., Dipu, S., Dani, K. K., Tiwari, S., Bisht, D. S., Devara, P. C. S., and Pinker, R. T.: Aerosol radiative forcing during dust events over New Delhi, India, J. Geophys. Res., 113, D13209, https://doi.org/10.1029/2008JD009804, 2008.
Phillips, D. L.: A technique for the numerical solution of certain integral equations of the first kind, J. Assoc. Comput. Mach., 9, 84–97, 1962.
Pollack, J. B. and Cuzzi, J. N.: Scattering by nonspherical particles of size comparable to a wavelength: A new semi-empirical theory and its application to tropospheric aerosols, J. Atmos. Sci., 37, 868–881, 1980.
Pyaskovskaya-Fesenkova, E. V.: Investigations of atmospheric scattering light, Acad. Sci. USSR, Moscow, Russia, 218 pp., 1957.
Ramanathan, V., Li, F., Ramana, M. V., Praveen, P. S., Kim, D., Corrigan, C. E., Nguyen, H., Stone, E. A., Schauer, J. J., Carmichael, G. R., Adhikary, B., and Yoon, S. C.: Atmospheric brown clouds: Hemispherical and regional variations in long range transport, absorption and radiative forcing, J. Geophys. Res., 112, D22S21, https://doi.org/10.1029/2006JD008124, 2007.
Robinson, N.: Solar Radiation, Elsevier, Amsterdam, the Netherlands, 347 pp., 1966.
Rodgers, C. D.: Inverse Method for Atmospheric Sounding, World Sci., Singapore, 256 pp., 2000.
Roosen, R. G., Angione, R. J., and Clemcke C. H.: Worldwide variations in atmospheric transmission, Baseline results from Smithsonian observations, B. Am. Meteorol. Soc., 54, 307–316, 1973.
Ryder, C. L., Marenco, F., Brooke, J. K., Estellés, V., Cotton, R., Formenti, P., McQuaid, J. B., Price, H. C., Liu, D., Ausset, P., Rosenberg, P. D., Taylor, J. W., Choularton, T., Bower, K., Coe, H., Gallagher, M., Crosier, J., Lloyd, G., Highwood, E. J., and Murray, B. J.: Coarse-mode mineral dust size distributions, composition and optical properties from AER-D aircraft measurements over the tropical eastern Atlantic, Atmos. Chem. Phys., 18, 17225–17257, https://doi.org/10.5194/acp-18-17225-2018, 2018.
Shaw, G. E.: Error analysis of multi-wavelength sun photometry, Pure Appl. Geophys., 114, 390–395, 1976.
Shaw, G. E.: Genesis of sun photometry, Proc. SPIE 6362, Remote Sensing of Clouds and the Atmosphere, XI, 636201, https://doi.org/10.1117/12.692771, 2006.
Shifrin, K. S. and Gashko, V. A.: Reconstruction of the particle size distribution functions when the information about the refractive index of the particles is inexact, Izv. Atmos. Ocean. Phy.+, 10, 943–949, 1974.
Shifrin, K. S., Turchin, V. F., Turovtseva, L. S., and Gashko, V. A.: Reconstruction of particle size distribution by statistical regularization of the scattering function, Izv. Atmos. Ocean. Phy.+, 8, 739–743, 1972.
Smirnov, A., Holben, B. N., Eck, T. F., Dubovik, O., and Slutsker, I.: Cloud-screening and quality control algorithms for the AERONET data-base, Remote Sens. Environ., 73, 337–349, 2000.
Song, H. J., Sohn, B. J., Chun, H. W., Chun, Y., and Lee, S. S.: Improved cloud screening method for the analysis of sky radiometer measurements and application to Asian dust detection, J. Meteorol. Soc. Jpn., 92A, 167–183, 2014.
Takamura, T., Nakajima, T., and SKYNET community group: Overview of SKYNET and its activities, Opt. Pura Apl., 37, 3303–3308, 2004.
Takamura, T., Takenaka, H., Cui, Y., Nakajima, T. Y., Higurashi, A., Fukuda, S., Kikuchi, N., Nakajima, T., Sato, I., and Pinker, R. T.: Aerosol and cloud validation system based on SKYNET observations: Estimation of shortwave radiation budget using ADEOS-II/GLI data, J. Remote Sens. Jpn., 29, 40–53, 2009.
Takamura, T., Khatri, P., Sohn, B. J., Tugjsuren, N., Tana, B., Campanelli, M., and Pandithurai, G.: Aerosol optical properties and aerosol direct effects over typical sites of SKYNET network. International Conference book on climate change in arid and semi-arid regions, Ulaanbaatar, Mongolia, 91–98, ISBN 978-99973-823-5-1, 2013.
Takenaka, H., Nakajima, T. Y., Higurashi, A., Higuchi, A., Takamura, T., Pinker, R. T., and Nakajima, T.: Estimation of solar radiation using a neural network based on radiative transfer, J. Geophys. Res., 116, D08215, https://doi.org/10.1029/2009JD013337, 2011.
Tanaka, M., Nakajima, T., and Shiobara, M.: Calibration of a sunphotometer by simultaneous measurements of direct-solar and circumsolar radiations, Appl. Optics, 25, 1170–1176, 1986.
Tanré, D., Devaux, C., Herman, M. and Santer, R.: Radiative properties of desert aerosols by optical ground-based measurements at solar wavelengths, J. Geophys. Res., 93, 14223–14231, 1988.
Terez, E. I. and Terez, G. A.: A method to determine atmospheric optical depth using observations of direct solar radiation, J. Geophys. Res., 108, 4704, https://doi.org/10.1029/2003JD003829, 2003.
Tonna, G., Nakajima, T., and Rao, R.: Aerosol features retrieved from solar aureole data: A simulation study concerning a turbid atmosphere, Appl. Optics, 34, 4486–4499, 1995.
Turchin, V. F. and Nozik, V. Z.: Statistical regularization of the solution of incorrectly posed problems, Izv. Atmos. Ocean. Phy.+ (English edn.), 5, 14–18, 1969.
Twitty, J. T.: The inversion of aureole measurements to derive aerosol size distributions. J. Atmos. Sci., 32, 584–591, 1975.
Twitty, J. T., Parent, R. J., Weinman, J. A., and Eloranta, E. W.: Aerosol size distribution: remote determination from airborne measurements of the solar aureole, Appl. Optics, 15, 980–989, 1976.
Twomey, S.: On the numerical solution of Fredholm integral equations of the first kind by the inversion of the linear system produced by quadrature, J. Assoc. Comput. Mach., 10, 97–101, 1963.
Uchiyama, A., Yamazaki, A., and Kudo, R.: Column water vapor retrievals from sky radiometer (POM-02) 940 nm data, J. Meteorol. Soc. Jpn., 92A, 195–203, 2014.
Uchiyama, A., Matsunaga, T., and Yamazaki, A.: The instrument constant of sky radiometers (POM-02) – Part 1: Calibration constant, Atmos. Meas. Tech., 11, 5363–5388, https://doi.org/10.5194/amt-11-5363-2018, 2018a.
Uchiyama, A., Matsunaga, T., and Yamazaki, A.: The instrument constant of sky radiometers (POM-02) – Part 2: Solid view angle, Atmos. Meas. Tech., 11, 5389–5402, https://doi.org/10.5194/amt-11-5389-2018, 2018b.
Uchiyama, A., Shiobara, M., Kobayashi, H., Matsunaga, T., Yamazaki, A., Inei, K., Kawai, K., and Watanabe, Y.: Nocturnal aerosol optical depth measurements with modified sky radiometer POM-02 using the moon as a light source, Atmos. Meas. Tech., 12, 6465–6488, https://doi.org/10.5194/amt-12-6465-2019, 2019.
Volz, F. E.: Photometer mit Selen-Photoelement zur spektralen Messung der Sonnenstrahlung und zur Bestimmung der Wellenlängenabhängigkeit der Dunsttrübung, Arch. Meteor. Geophy., B10, 100–131, 1959.
Volz, F. E.: Economical Multispectral Sun Photometer for Measurements of Aerosol Extinction from 0.44 µm to 1.6 µm and Precipitable Water, Appl. Optics, 13, 1732–1733, 1974.
Weinman, J. A., Twitty, J. T., Browning, S. R., and Herman, B. M.: Derivation of phase functions from multiply scattered sunlight transmitted through a hazy atmosphere, J. Atmos. Sci., 32, 577–583, 1975.
Yamamoto, G. and Tanaka, M.: Determination of aerosol size distribution from spectral attenuation measurements, Appl. Optics, 8, 447–453, 1969.
- Abstract
- Introduction
- Sun and sky measurements from the sky radiometer
- Radiometric calibration of the direct solar irradiance measurements
- Sky radiance calibration for the sky radiometer
- Retrievals of parameters for atmospheric constituents
- Conclusions
- Data availability
- Author contributions
- Competing interests
- Special issue statement
- Acknowledgements
- Financial support
- Review statement
- References
The requested paper has a corresponding corrigendum published. Please read the corrigendum first before downloading the article.
- Article
(6514 KB) - Full-text XML
- Abstract
- Introduction
- Sun and sky measurements from the sky radiometer
- Radiometric calibration of the direct solar irradiance measurements
- Sky radiance calibration for the sky radiometer
- Retrievals of parameters for atmospheric constituents
- Conclusions
- Data availability
- Author contributions
- Competing interests
- Special issue statement
- Acknowledgements
- Financial support
- Review statement
- References