the Creative Commons Attribution 4.0 License.
the Creative Commons Attribution 4.0 License.
 | 17 Aug 2020
A global analysis of climate-relevant aerosol properties retrieved from the network of Global Atmosphere Watch (GAW) near-surface observatories
Paolo Laj
Alessandro Bigi
Clémence Rose
Elisabeth Andrews
Cathrine Lund Myhre
Martine Collaud Coen
Alfred Wiedensohler
Michael Schulz
John A. Ogren
Markus Fiebig
Jonas Gliß
Augustin Mortier
Marco Pandolfi
Tuukka Petäja
Sang-Woo Kim
Wenche Aas
Jean-Philippe Putaud
Olga Mayol-Bracero
Melita Keywood
Lorenzo Labrador
Pasi Aalto
Erik Ahlberg
Lucas Alados Arboledas
Andrés Alastuey
Marcos Andrade
Begoña Artíñano
Stina Ausmeel
Todor Arsov
Eija Asmi
John Backman
Urs Baltensperger
Susanne Bastian
Olaf Bath
Johan Paul Beukes
Benjamin T. Brem
Nicolas Bukowiecki
Sébastien Conil
Cedric Couret
Derek Day
Wan Dayantolis
Anna Degorska
Konstantinos Eleftheriadis
Prodromos Fetfatzis
Olivier Favez
Harald Flentje
Maria I. Gini
Asta Gregorič
Martin Gysel-Beer
A. Gannet Hallar
Jenny Hand
Andras Hoffer
Christoph Hueglin
Rakesh K. Hooda
Antti Hyvärinen
Ivo Kalapov
Nikos Kalivitis
Anne Kasper-Giebl
Jeong Eun Kim
Giorgos Kouvarakis
Irena Kranjc
Radovan Krejci
Markku Kulmala
Casper Labuschagne
Hae-Jung Lee
Heikki Lihavainen
Neng-Huei Lin
Gunter Löschau
Krista Luoma
Angela Marinoni
Sebastiao Martins Dos Santos
Frank Meinhardt
Maik Merkel
Jean-Marc Metzger
Nikolaos Mihalopoulos
Nhat Anh Nguyen
Jakub Ondracek
Noemi Pérez
Maria Rita Perrone
Jean-Eudes Petit
David Picard
Jean-Marc Pichon
Veronique Pont
Natalia Prats
Anthony Prenni
Fabienne Reisen
Salvatore Romano
Karine Sellegri
Sangeeta Sharma
Gerhard Schauer
Patrick Sheridan
James Patrick Sherman
Maik Schütze
Andreas Schwerin
Ralf Sohmer
Mar Sorribas
Martin Steinbacher
Junying Sun
Gloria Titos
Barbara Toczko
Thomas Tuch
Pierre Tulet
Peter Tunved
Ville Vakkari
Fernando Velarde
Patricio Velasquez
Paolo Villani
Sterios Vratolis
Sheng-Hsiang Wang
Kay Weinhold
Rolf Weller
Margarita Yela
Jesus Yus-Diez
Vladimir Zdimal
Paul Zieger
Nadezda Zikova
Aerosol particles are essential constituents of the Earth's atmosphere, impacting the earth radiation balance directly by scattering and absorbing solar radiation, and indirectly by acting as cloud condensation nuclei. In contrast to most greenhouse gases, aerosol particles have short atmospheric residence times, resulting in a highly heterogeneous distribution in space and time. There is a clear need to document this variability at regional scale through observations involving, in particular, the in situ near-surface segment of the atmospheric observation system. This paper will provide the widest effort so far to document variability of climate-relevant in situ aerosol properties (namely wavelength dependent particle light scattering and absorption coefficients, particle number concentration and particle number size distribution) from all sites connected to the Global Atmosphere Watch network. High-quality data from almost 90 stations worldwide have been collected and controlled for quality and are reported for a reference year in 2017, providing a very extended and robust view of the variability of these variables worldwide. The range of variability observed worldwide for light scattering and absorption coefficients, single-scattering albedo, and particle number concentration are presented together with preliminary information on their long-term trends and comparison with model simulation for the different stations. The scope of the present paper is also to provide the necessary suite of information, including data provision procedures, quality control and analysis, data policy, and usage of the ground-based aerosol measurement network. It delivers to users of the World Data Centre on Aerosol, the required confidence in data products in the form of a fully characterized value chain, including uncertainty estimation and requirements for contributing to the global climate monitoring system.
- Article
(5194 KB) - Full-text XML
- Companion paper 1
- Companion paper 3
-
Supplement
(415 KB) - BibTeX
- EndNote


Climate change is perceived as one of the world's greatest threats, with the potential to undermine the three social, economic, and environmental pillars of sustainability. Changing atmospheric composition is one of the important drivers of climate change, acting both on the global scale (i.e. warming related to long-lived greenhouse gases such as CO2) and on the regional scale, where atmospheric compounds with a shorter lifetime may enhance or slightly reduce warming from long-lived greenhouse gases.
Aerosol particles are essential constituents of the Earth's atmosphere, impacting the Earth's radiation balance directly by scattering and absorbing solar radiation and indirectly by acting as cloud condensation nuclei. In the recent IPCC Reports on Climate Change (AR5), the impact of aerosols on the atmosphere is widely acknowledged as still one of the most significant and uncertain aspects of climate change projections (IPCC, 2013; Bond et al., 2013). The magnitude of aerosol forcing is estimated to be −0.45 (−0.95 to +0.05) W m−2 for aerosol alone and −0.9 (−1.9 to −0.1) W m−2 when aerosol–cloud feedbacks are accounted for, both with medium confidence level. A more recent study by Lund et al. (2018) report aerosol direct radiative forcing of −0.17 W m−2 for the period 1750 to 2014, significantly weaker than the IPCC AR5 2011–1750 estimate. Differences are due to several factors, including stronger absorption by organic aerosol, updated parameterization of black carbon (BC) absorption in the applied model, and reduced sulfate cooling.
The mechanisms by which aerosol particles influence the Earth's climate have been subject to numerous studies in the last decades and are well understood, yet the uncertainty of the anthropogenic forcing still remains the largest uncertainty among the factors influencing changes in climate. In contrast to most greenhouse gases, aerosol particles have a short atmospheric residence time (days) and undergo transport, mixing, chemical aging, and removal by dry and wet deposition, resulting in a highly heterogeneous distribution in space and time. Different parameterizations used to calculate atmospheric mass loads lead to high diversity among global climate models (Textor et al., 2006; Huneeus et al., 2011; Tsigaridis et al., 2014; Bian et al., 2017). There are several reasons for the high uncertainty: uncertainties associated with aerosol and aerosol precursor emissions linked to new particle formation, in particular for the pre-industrial period; uncertainties in the representation of the climate-relevant properties of aerosol, including the representation of the pre-industrial conditions; uncertainties in the parametrization of sub-grid processes in climate models, in particular for cloud processes (updraft velocity, cloud liquid water content, cloud fraction; relationship between effective radius and volume mean radius, impact of absorbing impurities in cloud drop single-scattering albedo, etc.); and uncertainties in providing an adequate characterization of aerosol climate-relevant properties (spatial and temporal variability). A study published by Carslaw et al. (2013) has shown that 45 % of the variance of aerosol forcing in a model ensemble arises from uncertainties in natural precursor emissions, also in line with the results of Lund et al. (2018).
The study of Lund et al. (2018) also highlights the importance of capturing regional emissions and verification with measurements. Natural and anthropogenic emissions of primary aerosol and their gaseous precursors have been estimated at different scales in many studies and inventories are now providing fairly accurate information on historical emission trends. Historical emission estimates for anthropogenic aerosol and precursor compounds are key data needed for assessing aerosol impact on climate but are difficult to obtain with precision, and there are discrepancies amongst different estimates even for key aerosol climate forcers like black carbon (Granier et al., 2011; Klimont et al., 2017; Lamarque et al., 2010; Wang et al., 2014). For example, in a recent study using ice-core records from Alpine regions, Lim et al. (2017) showed that BC emission inventories for the period 1960s–1970s may be strongly underestimating European anthropogenic emissions.
Providing reliable observations of aerosol properties relevant to climate studies at spatial and temporal resolution suited to users is essential. For example, a measured decrease in pollutant concentrations would be the ultimate indicator of a successful policy to reduce emissions. However, this requires long-term production and delivery of science-based data of known quality in terms of precision, accuracy and sufficient density of data points over the region of interest for the measurements to be representative. Similarly, evaluating model performances from comparisons with observations requires that sets of high-quality data are made available in comparable formats, with known uncertainties, so that comparisons are meaningful. Current modelling tools are suited to the diversity of applications required by the disparate spatial and temporal scales of atmospheric impacts on climate, human health, and ecosystems. There is still a need for accurate representation of observed aerosol which remains challenging, leading to considerable diversity in the abundance and distribution of aerosols among global models. Capacity exists to deliver information products in a form adapted to climate policy applications in particular, but models need to be validated against measured atmospheric composition in both the short and long term (Benedetti et al., 2018).
One major aspect of aerosol forcing on climate is linked to its multi-variable dimension: optical properties of an aerosol particle population are closely linked to its chemical, physical, and hygroscopic properties and also to the altitude dependency of these parameters, which undergo significant short-term (diurnal) temporal variations. The effects of aerosol on climate are driven by both extensive and intensive aerosol properties. Aerosol extensive properties depend on both the nature of the aerosol and the aerosol particle concentration. In contrast, intensive properties are independent of particle concentration and instead relate to intrinsic properties of the aerosol particles (Ogren, 1995). Table 1 lists properties relevant to the determination of aerosol climate forcing. We use the terminology proposed by OSCAR (https://www.wmo-sat.info/oscar/, last access: 11 August 2020) and Petzold et al. (2013) for the specific case of black carbon. Some of the aerosol properties in Table 1 are recognized as aerosol essential climate variable (ECV) products for climate monitoring in the Global Climate Observing System (GCOS). WMO/GAW Report No. 227 (2016) provides a synthesis of methodologies and procedures for measuring the recommended aerosol variables within the Global Atmosphere Watch (GAW) network. The report identifies a list of comprehensive aerosol measurements to be conducted as a priority as well as core measurements to be made at a larger number of stations.
Table 1Measured and derived aerosol particle properties relevant to radiative forcing on climate (adapted from GAW Report No. 227).
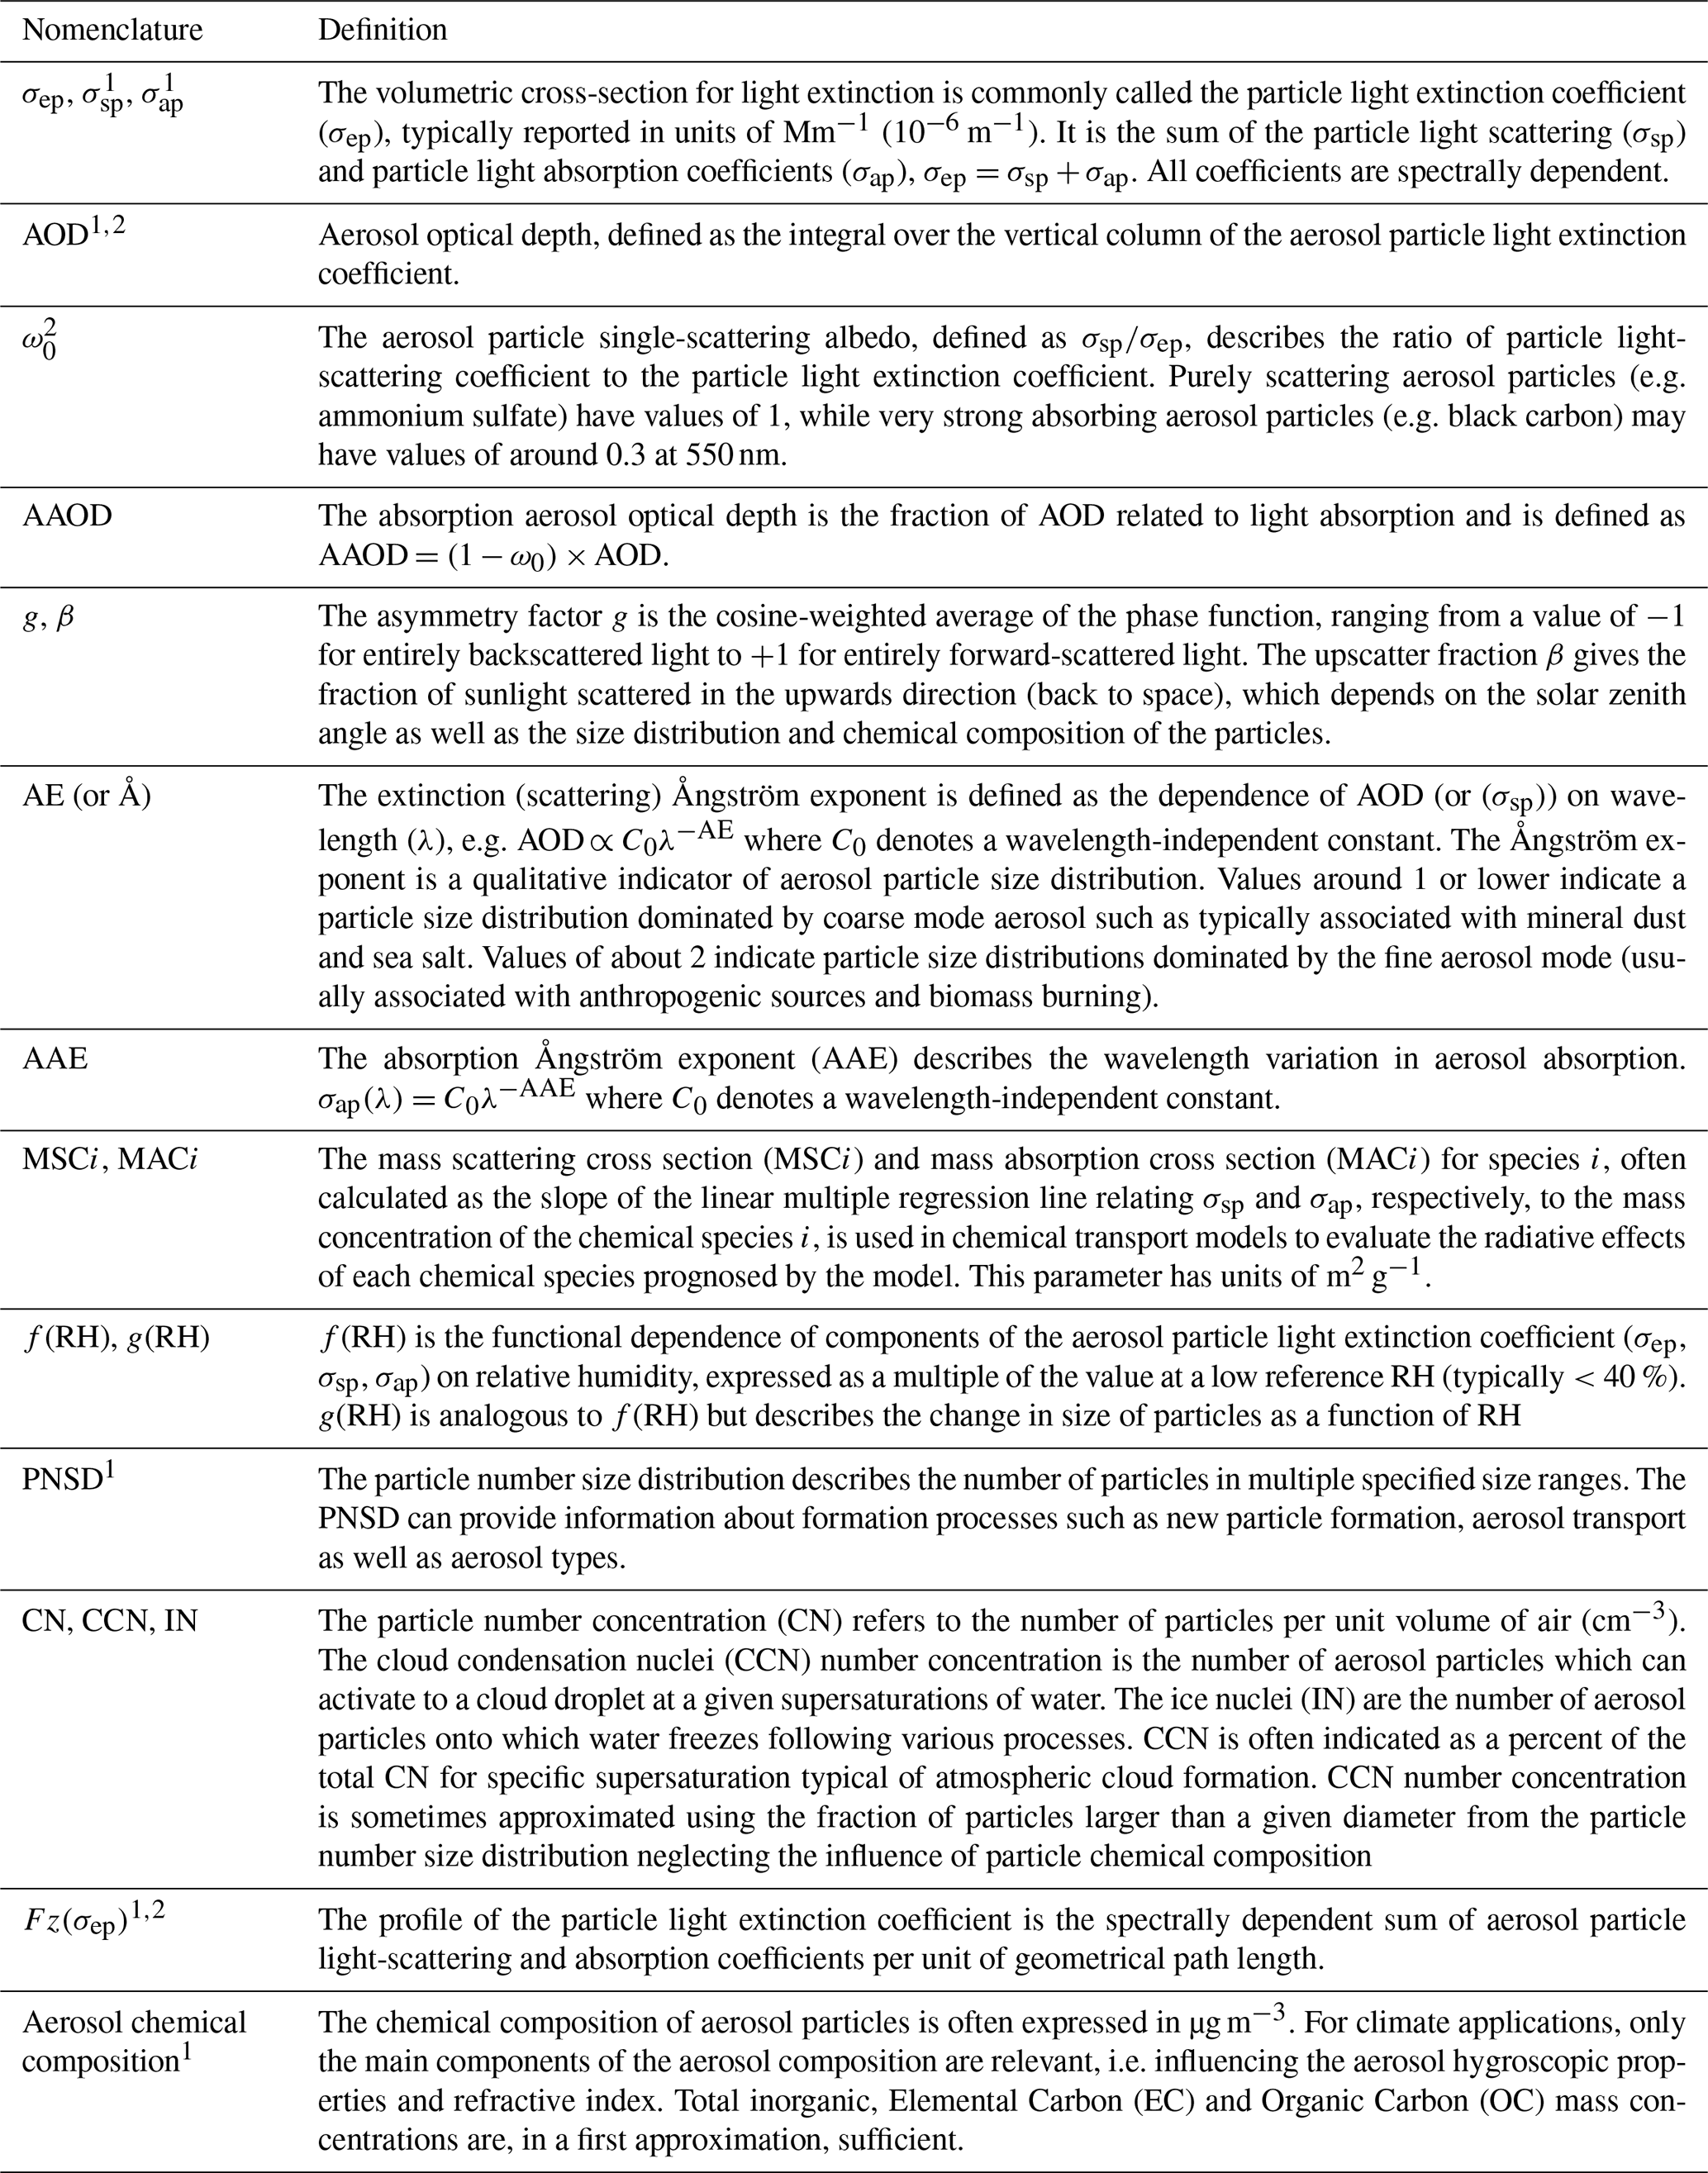
1 Variables currently recognized as core aerosol variables by WMO/GAW. 2 Variables currently recognized as ECVs for Global Climate Monitoring application areas (GCOS).
It is clear that neither a single approach to observing the atmospheric aerosol nor a limited set of instruments can provide the data required to quantify aerosol forcing on climate in all its relevant dimensions and spatial/temporal scales (Kahn et al., 2017; Anderson et al., 2005). Observations from space through remote sensing methods are providing key information to accurately document extensive properties but are still not sufficient to provide information with the required degree of spatial and temporal resolution needed for many applications. Further, remote sensing retrievals have only limited capabilities for determining aerosol chemistry, aerosol particle light absorption, particle size number distribution, condensation nuclei (CN), cloud condensation nuclei (CCN), and ice nuclei (IN) (Kahn et al., 2017). Instead, in situ observations from stationary surface observatories, ships, balloons, and aircraft provide very detailed characterizations of the atmospheric aerosol, often on limited spatial scales. Non-continuous mobile platforms such as aircraft and balloons provide the vertical dimension, however, with limited temporal resolution. The current availability and accessibility of ground-based data sets on climate relevant aerosol properties vary substantially from place to place. An aerosol observing system for climate requires that all the types of observations are combined with models to extrapolate measurement points to large geographical scales against which satellite measurements can be compared (e.g. Anderson et al., 2005; Petäjä et al., 2016).
The in situ segment of atmospheric observations is very complex and involves multiple partners: some are organized in measurement networks, active at regional or global scales, and some are working almost independently. Networks support consistent, long-term measurements of atmospheric variables in order to detect trends and assess reasons for those trends. Information on the variability of aerosol properties from ground-based stations can mainly be divided into two types: (i) in situ networks driven by policy initiatives, with a relatively close relationship with stakeholders and often structured at country scale, providing limited sets of aerosol variables and (ii) the research-based networks, organized at continental or international scales particularly focusing on climate-relevant parameters. The GAW programme of the World Meteorological Organization (WMO) was established in 1989 and the GAW aerosol measurement programme in 1997 originally dedicated to monitoring of climate-relevant species. Networks contributing to the provision of climate relevant aerosol properties are mainly structured with three different categories, some of them affiliated with GAW as contributing networks and some others operating independently.
-
Networks for the detection of aerosol optical depth (AOD): AERONET (https://aeronet.gsfc.nasa.gov/, last access: 11 August 2020), GAW PFR (http://www.pmodwrc.ch/worcc/, last access: 11 August 2020) and CARSNET (China Aerosol Remote Sensing NETwork, Che et al., 2009). Aerosol optical depth (AOD) is one of five core aerosol variables recommended for long-term continuous measurements in the GAW programme.
-
Networks for the detection of aerosol profiles that are internationally organized into GALION (GAW Aerosol LIdar Observing Network) and composed of lidar instruments operating within NDACC (Network for the Detection of Atmospheric Composition Changes), EARLINET/ACTRIS (European Atmospheric Lidar Network) and MPLNET, principally ADNET in Asia and MPLNET. Other lidars (CLN, CORALNET, ALINE) contribute to GALION goals but are not at the same level of maturity or are solely regional in extent.
-
Networks for the detection of in situ aerosol properties, mainly divided into contributions from NOAA's Federated Aerosol Network (NFAN), encompassing sites primarily in North America but also including sites in Europe, Asia, and the Southern Hemisphere, including Antarctic sites (NFAN, Andrews et al., 2019) and ACTRIS (https://www.actris.eu/, last access: 11 August 2020) in Europe but also including sites in other WMO regions (https://cpdb.wmo.int/regions, last access: 11 August 2020). In Europe, the European Monitoring and Evaluation Programme' EMEP (https://www.emep.int, last access: 11 August 2020), and, in the US, the IMPROVE network (http://vista.cira.colostate.edu/Improve/, last access: 11 August 2020) are also providing key information on aerosol in situ variables (Tørseth et al., 2012). Additional networks contributing to the provision of in situ aerosol properties are the Canadian Air and Precipitation Monitoring Network (CAPMoN), the Acid Deposition Monitoring Network in East Asia (EANET) and the Korea Air Quality Network (KRAQNb).
Finally specific contributions are brought by the vertical profiles to in situ observations routinely performed by IAGOS (In-flight Atmospheric Observing System), a contributing network to the GAW and by additional ground-based observations operated outside the GAW context, such as SPARTAN (https://www.spartan-network.org, last access: 11 August 2020).
The scope of the present paper is to provide the necessary suite of information to define a fully traceable ground-based aerosol measurements network, and to give an overview of the state of the operation in the network for a reference year. The paper should deliver to users of the World Data Centre on Aerosol (WDCA), the required confidence in data products in the form of a fully characterized value chain, including uncertainty estimation and requirements for climate monitoring.
The paper is limited to a subset of the climate-relevant aerosol variables. It focuses on variables that are measured or derived from near-surface measurements, thus excluding all columnar and profile variables, despite their strong climate relevance. A second criterion for discussion in the paper is connected to the fact that long-term information is available at sufficient sites across the globe to derive trends and variability with sufficient robustness. Clearly, for many of the variables listed in Table 1, information is only available from a number of stations that are either almost exclusively documenting one single region (i.e. measurements of aerosol chemical properties with online aerosol mass spectrometers in Europe only) or not numerous enough to provide a robust assessment. In the case of EC∕OC observations for example, information exists for many sites in different WMO regions, but many of them are no longer documented at the WDCA.
Finally, the last criterion is connected to the quality, intercomparability, and accessibility of measurements worldwide, meaning that all information used in the paper must be well documented with rich metadata, traceable in provenance and quality, and accessible for all. This clearly limits the scope of the paper to the four independent climate-relevant variables mentioned above: (i) particle light-scattering coefficient, (ii) particle light absorption coefficient, (iii) particle number concentration, and (iv) particle number size distribution.
For this set of variables, there has been, in the last decades, a significant international effort to harmonize the practice and methodologies across the frameworks, and strengthen systematic observations through different networks, or research infrastructure in the case of Europe, operating with a certain degree of interoperability. All networks jointly defined standard operation procedures (SOPs), conduct data collection in a timely and systematic manner, and promote open access and exchange of data without restriction through a unique data hub, the WDCA, hosted by NILU in Norway (https://www.gaw-wdca.org/, last access: 11 August 2020). Operators from these networks perform joint assessments and analyses of data resulting in scientific publications that are discussed below.
This paper then provides a full characterization of the value chain for these four aerosol variables that will serve for defining the fiducial reference network in the future. It also provides an overview of the variability of the variables, and of some additional derived variables from the collection of data for the reference year 2017. The present paper is jointly written with companion papers, three of which (Collaud Coen et al., 2020a; Gliß et al., 2020 and Mortier et al., 2020) are in review in 2020 in parallel with this paper. Gliß et al. (2020) and Mortier et al. (2020) also belong to the AeroCom initiative for IPCC. The papers are the following.
-
Collaud Coen et al. (2020a) analyse trends and variability of optical properties using continuous observations worldwide.
-
Gliß et al. (2020) use the AeroCom (Aerosol Comparisons between Observations and Models, https://aerocom.met.no/, last access: 11 August 2020) models to assess performances of global-scale model performance for global and regional variables distributions, and variability.
-
Mortier et al. (2020) is a multi-parameter analysis of the aerosol trends over the last 2 decades comparing the output from AEROCOM models and observations, including time series of aerosol optical variables.
-
Additional papers are in preparation to analyse the variability of physical properties and to investigate the variability of carbonaceous aerosol using continuous observations worldwide.
Some preliminary information on trends and comparisons with models that are further developed in Collaud Coen et al. (2020a), Gliß et al. (2020) and Mortier et al. (2020) are presented in this paper. Additional manuscripts are in preparation to further investigate variability of the optical and physical properties.
This paper is integrated into a larger initiative called SARGAN (in-Situ AeRosol GAW Network) that will serve as the equivalent for GALION for the near-surface observations of aerosol variables. It is intended to support a future application of SARGAN, and possibly other components of the GAW network, to become a GCOS associated network (https://gcos.wmo.int/en/networks, last access: 11 August 2020). This requires the definition of a threshold, breakthrough, and goals for spatial and temporal resolutions that may be used for designing an operational aerosol in situ network suited to global monitoring requirements in GCOS. Finally, this paper documents all elements required for establishing the GCOS network by addressing (1) the procedures for collecting and harmonizing measurements, data, metadata and quality control, (2) procedures for curation and access to SARGAN data, (3) the available harmonized surface observations within SARGAN and status of the station network, (4) the present-day distribution of SARGAN aerosol properties, and (5) requirements for using SARGAN for global climate monitoring applications.
Controlling and improving data quality and enhancing their use by the scientific community are essential aims within observational networks. Procedures are continuously evolving as new instruments become commercially available and because efforts from the scientific community have resulted in more appropriate operation procedures for monitoring purposes. In the last decade, significant progress has been made in the harmonization of measurement protocols across the different networks and to ensure that all information is made readily available in a coordinated manner.
In the GAW programme, the individual station and its host organization are scientifically responsible for conducting the observations according to the standard operating procedures. This responsibility includes quality assurance of the instruments as well as quality control of the data after measurement. In quality assurance, the stations collaborate with dedicated calibration centres, usually by sending their instruments for off-site calibration in regular intervals, and by station audits performed by relevant GAW calibration centres.
3.1 Harmonization of measurement protocols in SARGAN
Improving data quality and enhancing data use by the scientific community are essential aims within the GAW and the contributing networks. The measurement guidelines and standard operating procedures (SOPs) used for aerosol in situ measurements within the GAW are discussed and prepared by the Scientific Advisory Group (SAG) on “Aerosol” and accepted by the scientific community through peer-reviewed processes. The SOPs provide guidelines for good measurement practice and are listed in WMO/GAW Report No. 227 (2016) and connected reports.
The knowledge of the aerosol effect on climate and air quality as well as the techniques used for the determination of the essential aerosol variables to be monitored at ground-based sites have evolved considerably in the last decade. The methodologies, guidelines, and SOPs are often elaborated and tested within the regional networks such as NFAN or the European research infrastructure ACTRIS and transferred to the GAW programme to be adopted as guidelines or more operational SOPs. SOPs are now available for almost all aerosol climate-relevant measurements, including for some of the most recent aerosol instruments.
The general guidelines for in situ aerosol measurements in the GAW are given in the general WMO/GAW Report No. 227 (2016) and in specific GAW reports such as WMO/GAW Report No. 200 (2011) for particle light scattering and absorption coefficients. Some of the recommended procedures are also adopted at a level of recommended standards by other bodies, such as EMEP under the UNECE, CEN (Center for European Normalization). This is the case for the measurement of the particle number concentration with condensation particle counters (CEN/TS 16976) as well as for the particle number size distribution with mobility particle size spectrometers (CEN/TS 17434).
In SARGAN, measurements of the particle light-scattering coefficient are performed using integrating nephelometers, while measurements of the particle light absorption coefficient utilize various filtered-based absorption photometer instruments. Both particle light scattering and absorption coefficients are dependent upon the size, shape, and composition of the particles as well as the wavelength of the incident light. Measurements of the particle light scattering and absorption coefficients ideally would be performed at various wavelengths at a defined relative humidity. In the GAW and the contributing networks, in situ microphysical and optical aerosol measurements should be performed for a relative humidity (RH) lower than 40 %, although some stations allow measurements up to 50 %.
Furthermore, information on the relative amounts of particle light scattering versus absorption is required for radiative forcing calculations and is defined by the aerosol single-scattering albedo, ω0, which is the ratio of the particle light-scattering coefficient over the particle light extinction coefficient, as defined in Table 1: . In this article, ω0 is computed for one specific λ (550 nm). The scattering Ångström exponent, AE, defined by the power law , describes the wavelength dependence for scattered light and is an indicator of particle number size distribution, and, thus, on the type of aerosol such as anthropogenic, mineral dust, or sea salt. The scattering Ångström exponent can be directly derived from the measured particle light-scattering coefficients at different wavelengths.
Müller et al. (2011) performed an intercomparison exercise for integrating nephelometers to propose procedures for correcting the non-ideal illumination due to truncation of the sensing volumes in the near-forward and near-backward angular ranges and for non-Lambertian illumination from the light sources. Müller's work expanded the initial findings of Anderson and Ogren (1998), which were for a specific nephelometer model. Additionally, measurements of the dependence of the particle light-scattering coefficient on the relative humidity are essential for the calculation of aerosol radiative effects in the atmosphere. This enhanced particle light scattering due to water uptake is strongly dependent on the particle number size distribution and the size-resolved particle composition. However, such measurements require an additional instrumental set-up, which has been implemented at only at very few stations and, with few exceptions, only on a campaign basis (Burgos et al., 2019; Titos et al., 2016).
Petzold and Schönlinner (2004) developed the filter-based Multi-Angle Absorption Photometer (MAAP), which can determine the particle light absorption coefficient directly, considering the light attenuation through and the backscattering above the filter. For other filter-based absorption photometers, the particle light absorption coefficient is determined from the light attenuation through the filter, considering scattering cross-sensitivities and loading effects. The procedures to correct for scattering cross-sensitivity in Particle Soot Absorption Photometer (PSAP) instruments are described in Bond et al. (1999) and Ogren (2010). Several correction procedures for aethalometers are given in Collaud Coen et al. (2010). Recently, the ACTRIS community developed a harmonized factor for the aethalometer AE31 Magee Scientific (AE31) to determine the particle light absorption coefficient, based on long-term intercomparison between aethalometers and the MAAP for different environments and aerosol types (WMO/GAW Report No. 227, 2016).
Table 2Instruments used for the determination of aerosol optical and physical properties in SARGAN, original time resolution for raw data, and associated uncertainties.
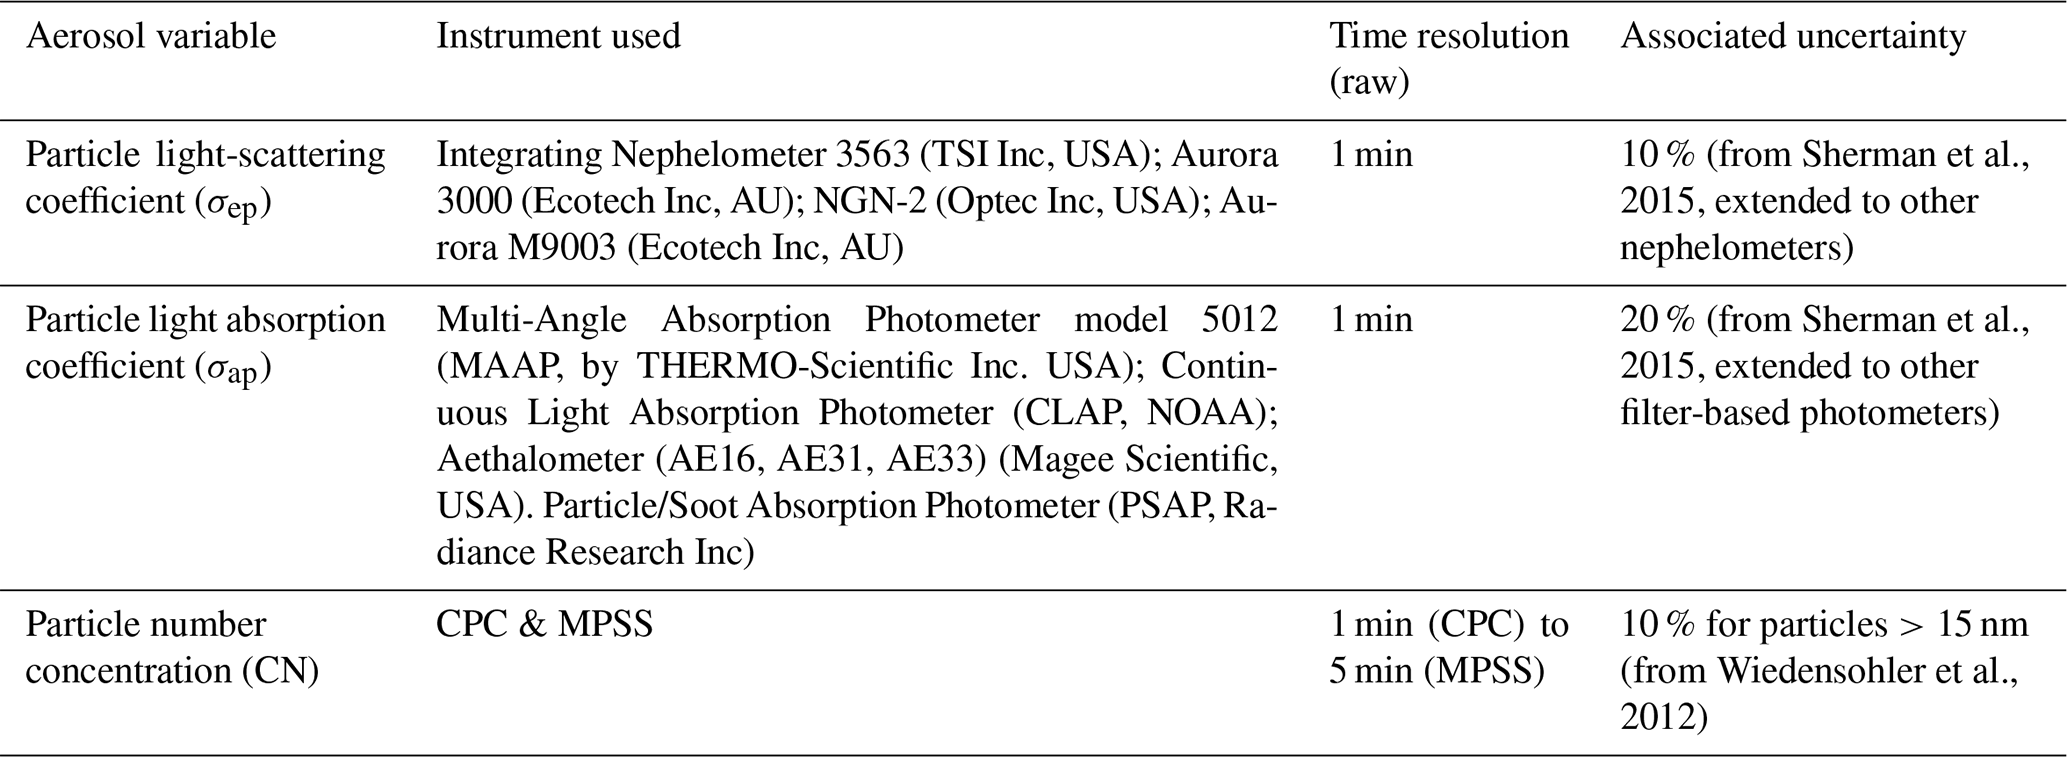
The physical aerosol particle properties reported in this article are derived from the particle number concentration and number size distribution limited to the ultrafine (10–100 nm) and fine (100–1000 nm) ranges. These measurements are performed using condensation particle counters (CPCs) and mobility particle size spectrometers (MPSS). Wiedensohler et al. (2012) describe procedures for long-term MPSS measurements and for their quality assurance. Since measurements of particle number size distributions are mainly restricted to ACTRIS sites and at a few other stations, a global assessment on aerosol physical properties can be only derived for the particle number concentration. For sites where only MPSS data are available, the particle number concentration is determined from the integral over the particle number size distribution measured by the MPSS (see Sect. 5.2 for discussion). Table 2 below summarizes all technical information related to the measurements of aerosol optical and physical properties in SARGAN.
3.2 Curation and access to SARGAN data
In the management of data throughout their life cycle, data curation is the activity that collects, annotates, verifies, archives, publishes, presents, and ensures access to all persistent data sets produced within the measurement framework and programme. The main purpose of data curation is to ensure that data are reliable and accessible for future research purposes and reuse. To this end, SARGAN data should be traceable to the original raw observational data, include version control and identification in case of updates, and include rich metadata going beyond discovery metadata (e.g. variable and station information) to use metadata (instrument description, operating procedures, station setting, calibration and quality assurance measures, and uncertainties). SARGAN data are archived at the WDCA, which is the data repository for microphysical, optical, and chemical properties of atmospheric aerosol for the WMO/GAW programme.
To ensure traceability of data products, the WDCA uses a system of three data levels.
-
Level 0: annotated raw data, all parameters provided by the instrument, parameters needed for further processing; the format is instrument model specific format, “native” time resolution.
-
Level 1: data processed to final parameter, calibrations applied, invalid and calibration episodes removed, format is property specific, “native” time resolution, conversion to reference conditions of temperature and pressure (273.15 K, 1013.25 hPa).
-
Level 2: data aggregated to hourly averages, atmospheric variability quantified, format is property specific.
Each higher data level is produced from the respective lower level as specified by the pertaining operating procedure. The templates for data level and instrument are published on the WDCA homepage and pages referenced from there, together with references to the relevant operating procedures. The templates indicate the metadata and data elements (discovery and use metadata) expected when submitting data to the WDCA, which have been specified in collaboration with the GAW SAG for aerosol and the GAW World Calibration Centre for Aerosol Physics (WCCAP) to ensure that relevant and useful metadata are collected.
Stations report data to the WDCA on an annual basis. After quality control, the station submits the data to the WDCA via an online, web-based submission tool: https://ebas-submit-tool.nilu.no (last access: 11 August 2020). In this process, the tool gives immediate feedback on syntax errors, and performs checks on semantics and sanity of both metadata and data. During curation at the WDCA, the data files are inspected both automatically and manually for metadata completeness and consistency, while the data are inspected for outliers, spikes, and sanity. Issues discovered in the process are reported back to the station, and the station asked to take corrective action and resubmit the data. The same applies for issues discovered after data publication.
By joining the GAW programme, stations commit to reporting their observations in a fully and manually quality controlled version (level 2) on an annual basis, with a deadline of 31 December of the year following the data year to be reported. The WDCA encourages stations to report their data in a traceable way, i.e. to include data levels 0 and 1 with their submissions.
GAW guidelines for quality control have developed and improved over the lifetime of the programme. At the beginning, quality control reflected the GAW objective of providing observations of atmospheric compositions with large-scale representativity. For this reason, observations influenced by local and regional emissions, or by regional phenomena, were flagged invalid during quality control and excluded from being archived. As of 2016, it was acknowledged that atmospheric composition data serve multiple purposes and applications. This is reflected by the recommendation to only remove data affected by instrument issues or contamination during quality control and indicate local or regional influence with a flag that leaves the data valid. This implies that, for any application of WDCA data, filtering the data according to purpose is the first step. When using WDCA data, this shift in quality control approach, which may vary among stations due to their scientific independence, needs to be taken into account. Due to resource limitations, data before 2016 were mostly not reprocessed.
The Global Atmosphere Watch and the affiliated networks have agreed on a FAIR-use data policy encouraging an unlimited and open data policy for non-commercial use, provided without charge, unless noted otherwise. Users of the WDCA are encouraged to contact and eventually offer co-authorship to the data providers or owners whenever substantial use is made of their data. Alternatively, acknowledgement must be made to the data providers or owners and to the project name when these data are used within a publication. All data related to the present article are available at the WDCA.
4.1 A short history of aerosol monitoring networks
The first network designed to make long-term measurements of climate-relevant aerosol properties was the Geophysical Monitoring for Climate Change (GMCC) programme, formed by NOAA in the early 1970s. GMCC was “designed to establish and maintain a programme of observation and analysis of data representative of the global background of selected gases and aerosols” (GMCC, 1973) This focus on establishing a global background climatology meant that the stations were located at remote sites, far from human emission sources, in order to ascertain the extent to which human activities caused changes in climate-relevant aerosol properties. The four initial GMCC stations were chosen to sample representative latitudes within both hemispheres – polar, mid-latitude, and tropical – and were located at the South Pole, Antarctica; Point Barrow, Alaska; Mauna Loa, Hawaii; and Cape Matatula, American Samoa. Two additional locations were initially planned, on the western coast of the USA and on or eastward of the eastern coast of the USA, but were not established until much later. As a consequence of the site selection criteria, the GMCC stations were not positioned to characterize the climate-forcing properties of aerosols in the regions where the climate forcing was large, a weakness that was not addressed until the 1990s, when NOAA established stations in and downwind of the continental USA and the GAW network was founded.
Aerosol particle number concentration was the first aerosol property measured at the GMCC stations, initially with manual expansion-type, water-based instruments and later with automated versions (Hogan and Gardner, 1968). The rationale for the choice of this variable was that these very small particles “are present in all forms of combustion [products], such as those from automobiles, coal or oil-burning power plants, and other human activities, it is essential to monitor the background tropospheric aerosol concentration in order to assess man's possible impact on his global environment” (GMCC, 1973). Recognizing that aerosols may play an important role in the global radiation balance, because they influence the heat budget and scatter or absorb both incoming solar radiation and outgoing terrestrial radiation, multi-wavelength measurements of the aerosol particle light-scattering coefficient using integrating nephelometers were added at the four GMCC stations in the mid to late 1970s.
Although measurements of aerosol particle number concentration and light-scattering coefficient were made during multiple, short-term field studies and in long-term studies at individual field stations (e.g. Gras, 1995), the next network to be established for these measurements was the IMPROVE (Interagency Monitoring of Protected Visual Environments) network in the USA, which was initiated in 1985 to monitor visibility degradation in US National Parks and Wilderness Areas. Nephelometer data from 12 IMPROVE sites, most beginning in 1993, were included in the Collaud Coen et al. (2013) trend analysis.
After the establishment of the WMO GAW programme in 1989, a meeting of experts was convened in 1991 to consider the aerosol component of the GAW (GAW Report No. 79). This group formulated the objective of the GAW aerosol programme to understand changes in the atmospheric aerosol, with two specific tasks:
- a.
to assess the direct and indirect effect of aerosol on climate – through aerosol data representative of different regions; and
- b.
to determine the relative contribution of natural and man-made sources to the physical and chemical properties of the aerosol at locations representative of different regions.
The objective of the GAW aerosol programme was reformulated at the first meeting of the GAW SAG for aerosols in 1997 to determine the spatio-temporal distribution of aerosol properties related to climate forcing and air quality up to multidecadal timescales and further refined in the WMO/GAW Report No. 153 (2003) to determine the spatio-temporal distribution of aerosol properties related to climate forcing and air quality on multi-decadal timescales and on regional, hemispheric, and global spatial scales.
Under the leadership of SAG-Aerosols, the GAW aerosol network grew slowly through the decade 1997–2007, with the refinement of recommended measurements and sampling procedures (WMO/GAW Report No. 153, 2003), and the establishment of the WDCA and the World Calibration Center for Aerosol Physical Properties (WCAAP). The GAW aerosol network was greatly strengthened, particularly in Europe, by the establishment of the EUSAAR (European Supersites for Atmospheric Aerosol Research) programme in 2006 and its successor ACTRIS (Aerosols, Clouds and Trace gases Research Infrastructure) in 2011. The expansion of the GAW aerosol network was further enhanced by the NOAA Federated Aerosol Network (Andrews et al., 2019), which currently supports nearly 30 GAW aerosol stations with scientific and technical advice, data acquisition software, and streamlined procedures for submitting quality-controlled data to the WDCA.
4.2 An overview of recent studies of variability and trends of aerosol in situ optical and physical properties
The pioneering works of Bodhaine (1983, 1995), Delene and Ogren (2002) for US sites, and Putaud et al. (2004, 2010), and Van Dingenen et al. (2004) for European sites are the first studies documenting variability of climate-relevant aerosol properties using long-term observations performed at the network scale. Using long-term observations performed at several sites across the US, Delene and Ogren (2002) investigated the systematic relationships between aerosol optical properties and aerosol loadings that can be used to derive climatological averages of aerosol direct radiative forcing. The work of Putaud et al. (2004, 2010) and Van Dingenen et al. (2004) gathered information from long- and medium-term observations from rural, near-city, urban, and kerbside (near-road) sites in Europe to highlight similarities and differences in aerosol characteristics across the European network. As more sites provided access to longer data sets, the next series of papers (2010 up to present) addressed the issues of regional variability and trends with more robust statistical approaches and providing a comprehensive view of the aerosol variability to be used for model constraints.
Variability for the in situ climate-relevant aerosol properties relevant to SARGAN is documented for many GAW stations. Integration of results from different sets of stations addressed different scales, from country (Sun et al., 2020) to continental (Sherman et al., 2015, Asmi et al., 2013; Fountoukis et al., 2014; Zanatta et al., 2016; Cavalli et al., 2016; Crippa et al., 2014; Pandolfi et al., 2018), to global (Collaud Coen et al., 2013; Asmi et al., 2013; Andrews et al., 2011, 2019; Sellegri et al., 2019).
Generally, the seasonal variability of number concentration, and of the scattering and absorption coefficients, is much larger than diurnal variability at all sites (Sherman et al., 2015; Asmi et al., 2011) except at mountain observatories where meteorology plays a key role (Andrews et al., 2011; Collaud Coen et al., 2018). Typically, changes in aerosol intensive properties can be related to known sources. Timing of their maximum impact leads to well-defined seasonality that varies widely from site to site with the peak occurring at different times of year worldwide (e.g. Schmeisser et al., 2018). In Europe, some aerosol properties at non-urban/peri-urban sites can be divided into different typologies connected to large geographical areas (i.e. central European, Nordic, Mountain, southern and western European), for the different properties: carbonaceous aerosol concentration (Cavalli et al., 2016; Zanatta et al., 2016; Crippa et al., 2014); optical properties (Pandolfi et al., 2018); number concentration (Asmi et al., 2011); number of cloud condensation nuclei (Schmale et al., 2017) or chemical composition (Zhang et al., 2007; Crippa et al., 2014). This feature was used by Beddows et al. (2014), to propose a representation of aerosol number size distribution in Europe with a total of nine different clusters for the whole continent. Two recent studies addressed variability for specific areas, using measurements from Arctic stations (Dall'Osto et al., 2019) and mountain stations (Sellegri et al., 2019). Interestingly, none of the studies detected statistically significant regional work-week- or weekday-related variation for any of the aerosol variables, indicating that the stations are relatively free from local emissions and that regional effects dominate over local effects.
Time series longer than a decade are generally required to derive trends and a lesser number of studies are available, in particular those integrating information from large sets of stations. Statistically significant trends in σsp (decreasing), were found at two sites of NFAN in the US (analysing trends from the mid 90s to 2013) (Sherman et al., 2015). Similar results for a more globally representative set of sites were obtained for a comparison period of up to 18 years 1992–2010 (although less for some sites) by Collaud Coen et al. (2013); for mostly European sites by Pandolfi et al. (2018) for aerosol optical properties (comparison period ending in 2015) and Asmi et al. (2013) for aerosol number concentration. Whenever a trend was detected, it was generally decreasing for the majority of the sites for almost all aerosol extensive variables. Exceptions (increasing trends) were found at several sites that could be explained by local features or by influence of emissions from the Asian continent. Decreasing trends have been reported in the literature for columnar AOD as well (e.g. Yoon et al., 2016; Zhao et al., 2017; Ningombam et al., 2018; Sogacheva et al., 2018). Decreasing trends in number concentration are explained by reduction of anthropogenic emissions of primary particles, SO2 or some co-emitted species, as also shown by Aas et al. (2019) for sulfur species and Tørseth et al. (2012) for PM10, PM2.5 and sulfate. In particular, Tørseth et al. (2012) show strong decreases, ca 50 %, in the period 2000 to 2009 in PM10 and PM2.5. Decreasing trends (of the order of a few % per year) for all variables were more pronounced in North America than in Europe or at Antarctic sites, where the majority of sites did not show any significant trend (e.g. Collaud Coen et al., 2013).
The difference in the timing of emission reduction policy for the Europe and North American continents is a likely explanation for the decreasing trends in aerosol optical parameters found for most American sites compared to the lack of trends observed in Europe. In fact, the decreasing trends in Europe for aerosol optical variables were more detectable in Pandolfi et al. (2018) using a 2000–2015 analysing period than in Collaud Coen et al. (2013) using a comparison period of a maximum of 18 years ending in 2010. These studies did not find a consistent agreement between the trends of particle number (N) and particle optical properties in the few stations with long time series of all of these properties; this is partly explained by the fact that aerosol light-scattering coefficient is dominated by a different part of the aerosol size distribution than number concentration, and hence the two parameters are likely to have different sources.
The analysis of trends in aerosol properties needs to be regularly revisited as longer homogeneous time series become available at more sites, providing better spatial and temporal coverage. The non-parametric seasonal Mann–Kendall (MK) statistical test associated with several pre-whitening methods and with Sen's slope was used as main trend analysis method (Collaud Coen et al., 2020b). Comparisons with General Least Mean Square associated with Autoregressive Bootstrap (GLS/ARB) and with standard Least Mean Square analysis (LMS) (Asmi et al., 2013; Collaud Coen et al., 2013) enabled confirmation of the detected MK statistically significant trends and the assessment of advantages and limitations of each method. As shown in previous studies, trend and variability studies of aerosol properties still face some limitations due to heterogeneous time series, local effects that can only be addressed by some degree of redundancy among GAW stations, etc. It is also important to note that trends in terms of both statistical significance and sign are very sensitive to the period and the methodology used for the calculation. The fact that different aerosol variables show opposite trends at some sites also suggests that further analysis is needed to better understand how the different aerosol parameters are connected to each other in the long term. These studies highlight the fact that other than in Europe and North America, and a few Antarctic stations, no trends can be derived due to lack of data from many areas in the world, as mentioned by Laj et al. (2010) 10 years ago.
Several studies have recently used in situ measurements from, among others, the GAW network for a broad evaluation of the models, in particular in the framework of the AeroCom initiative (https://aerocom.met.no/).
-
Particulate organic matter concentration: Tsigaridis et al. (2014) have found for 31 AeroCom models, compared to remote surface in situ measurements in 2008–2010, a median normalized mean bias (NMB) underestimate of 15 % for particulate organic carbon mass and an overestimate of 51 % for organic aerosol mass. This would indicate that the overall OA∕OC ratio in the models is too high, although many models assume for primary OC emissions a low OA∕OC factor of 1.4. Secondary organic aerosol formation increases this ratio in global aerosol burdens. Note that the biases established are for the relatively few remote sites investigated. It is currently difficult to assess whether there is a robust global bias in OA, OC, or its ratio for the models in question.
-
Dust concentration: Huneeus et al. (2011) have used a set of dust measurements from the SEAREX/AEROCE networks which are very valuable due to their global extent and harmonized data. Fifteen AeroCom models generally overestimate the remote site surface concentrations within a factor of 10. However, they underestimate the magnitude of major dust events, e.g. in the Pacific. Kok et al. (2017), showing that dust found in the atmosphere is substantially coarser than represented in current global climate models, suggest that AeroCom models do not have a sufficient coarse dust component, which suggests that dust may even have a warming direct radiative effect.
-
Sulfate concentrations: the downward trends 1990–2015 of observed and modelled surface sulfate surface concentrations in the Northern Hemisphere have been shown to be very consistent by Aas et al. (2019), using six AeroCom models and a unique large collection of network data across Europe, North America, and Asia. The work convincingly shows the mitigation success of SO2 emissions, which is only possible because of harmonized in situ measurements.
-
Particle number and particle size distributions: 12 AeroCom models with aerosol microphysics simulation capability were evaluated by Mann et al. (2014) in terms of total particle concentrations and number size distributions. Particle number concentrations were collected from 13 global GAW sites operating for 5–25 years, while size distributions were mainly from European sites of ACTRIS in the years 2008/2009. Number concentration was underestimated by the models by 21 % on average.
-
CCN concentrations: of even more relevance for aerosol cloud radiative effects is the evaluation of modelled and observed cloud condensation nuclei. Sixteen AeroCom models were evaluated by Fanourgakis et al. (2019) against measurements of CCN at nine surface sites in Europe and Japan. A model underestimation of about 30 % was found, depending on dry size and supersaturation assumed and season (larger underestimate in winter).
5.1 An overview of networks and organisations contributing to SARGAN
As mentioned previously, the data provision is organized independently, resulting in a rather complex system where data originate from WMO/GAW global, regional, and contributing partner stations which themselves belong to one or more networks, depending on the station history and funding schemes. For example, many stations are labelled simultaneously as GAW, ACTRIS, and EMEP in Europe or GAW and NOAA in the US. Information on station status can be found in the GAW information system (GAWSIS, https://gawsis.meteoswiss.ch/GAWSIS, last access: 11 August 2020). Registration to GAW does not exclude participation in other networks, either contributing to GAW or not. WMO/GAW Report No. 207 (2012) reviewed the situation with respect to the different aerosol networks operating globally. Although data for the report were collected in 2009–2010, the current situation is quite similar to 10 years ago.
According to the GAW information system (GAWSIS, https://gawsis.meteoswiss.ch/GAWSIS/, last access: 11 August 2020, as of June 2019 the GAW aerosol network consists of 33 “Global Stations”, which are encouraged to participate in all the GAW measurement programmes and approximately 250 regional or contributing stations. Not all GAW stations are able to measure all aerosol variables listed in Table 1, and SARGAN is, therefore, a subset of stations in the GAW providing in situ aerosol variables from ground-based stations. Contributors to SARGAN consist primarily of these international networks and research infrastructures.
-
NOAA-FAN (Federated Aerosol Network, https://www.esrl.noaa.gov/, last access: 11 August 2020; Andrews et al., 2019) that consists of 7 stations located in the US and in 22 additional locations worldwide in 2017. NOAA-FAN documents three SARGAN variables: σsp, σap, and CN. EBAS hosts data from all NOAA-FAN sites (except WLG); aerosol data from NOAA baseline stations are also available from NOAA's ftp site.
-
ACTRIS (Aerosol Clouds and Trace Gases Research Infrastructure, https://www.actris.eu/) that consist of 36 stations, of which 5 are located outside Europe. ACTRIS documents all four SARGAN variables, σsp, σap, CN, and PNSD, that are accessible at http://ebas.nilu.no (last access: 11 August 2020). The European Monitoring and Evaluation Programme (EMEP) recommends the measurement of most SARGAN variables in its monitoring strategy and some ACTRIS in situ stations are collocated with EMEP sites. For the four SARGAN variables the quality control procedures are operated in the context of ACTRIS. These data sets are often jointly labelled ACTRIS/EMEP, and all ACTRIS and EMEP data are accessible through the EBAS data portal, undergoing the same data curation and quality control at the data centre.
-
In addition to the two main contributors, other operating networks have provided information for the paper. These are the Interagency Monitoring of Protected Visual Environments (IMPROVE) in the US (http://views.cira.colostate.edu/fed/QueryWizard/Default.aspx, last access: 11 August 2020), the Canadian Air and Precipitation Monitoring Network (CAPMoN) in Canada, the Acid Deposition Monitoring Network in East Asia EANET (http://www.eanet.asia/, last access: 11 August 2020) in East Asia, the Korea Air Quality Network (KRAQNb) in South Korea and various individuals and data from smaller national or regional networks, including the German Ultrafine Aerosol Network (GUAN) in Germany (http://wiki.tropos.de/index.php/GUAN, last access: 11 August 2020).
Historically, there has been limited interaction among the different networks worldwide, as mentioned in the WMO/GAW Report No. 207 (2013). However, on the specific issues of monitoring short-lived climate forcers, the main contributing networks to the GAW have managed to integrate many pieces of the data value chain, from SOPs, to QA/QC and data access. Data sets have also been jointly exploited in several papers (Asmi et al., 2013; Collaud Coen et al., 2013; Andrews et al., 2011, 2019; Pandolfi et al., 2018; Zanatta et al., 2016).
5.2 Characterization of sites contributing to SARGAN
All sites are established with the intention of operating in the long term. For registration to the GAW (Global or Regional status), a period of successful performance of typically 3 years is required before a new site is added. All sites are long term in nature and, for most, adhere to rigorous siting criteria that aim to avoid local sources as much as possible. Sites have been and continue to be selected to answer pressing scientific questions, which evolve with time, and to detect and attribute changes in climate and climate forcing.
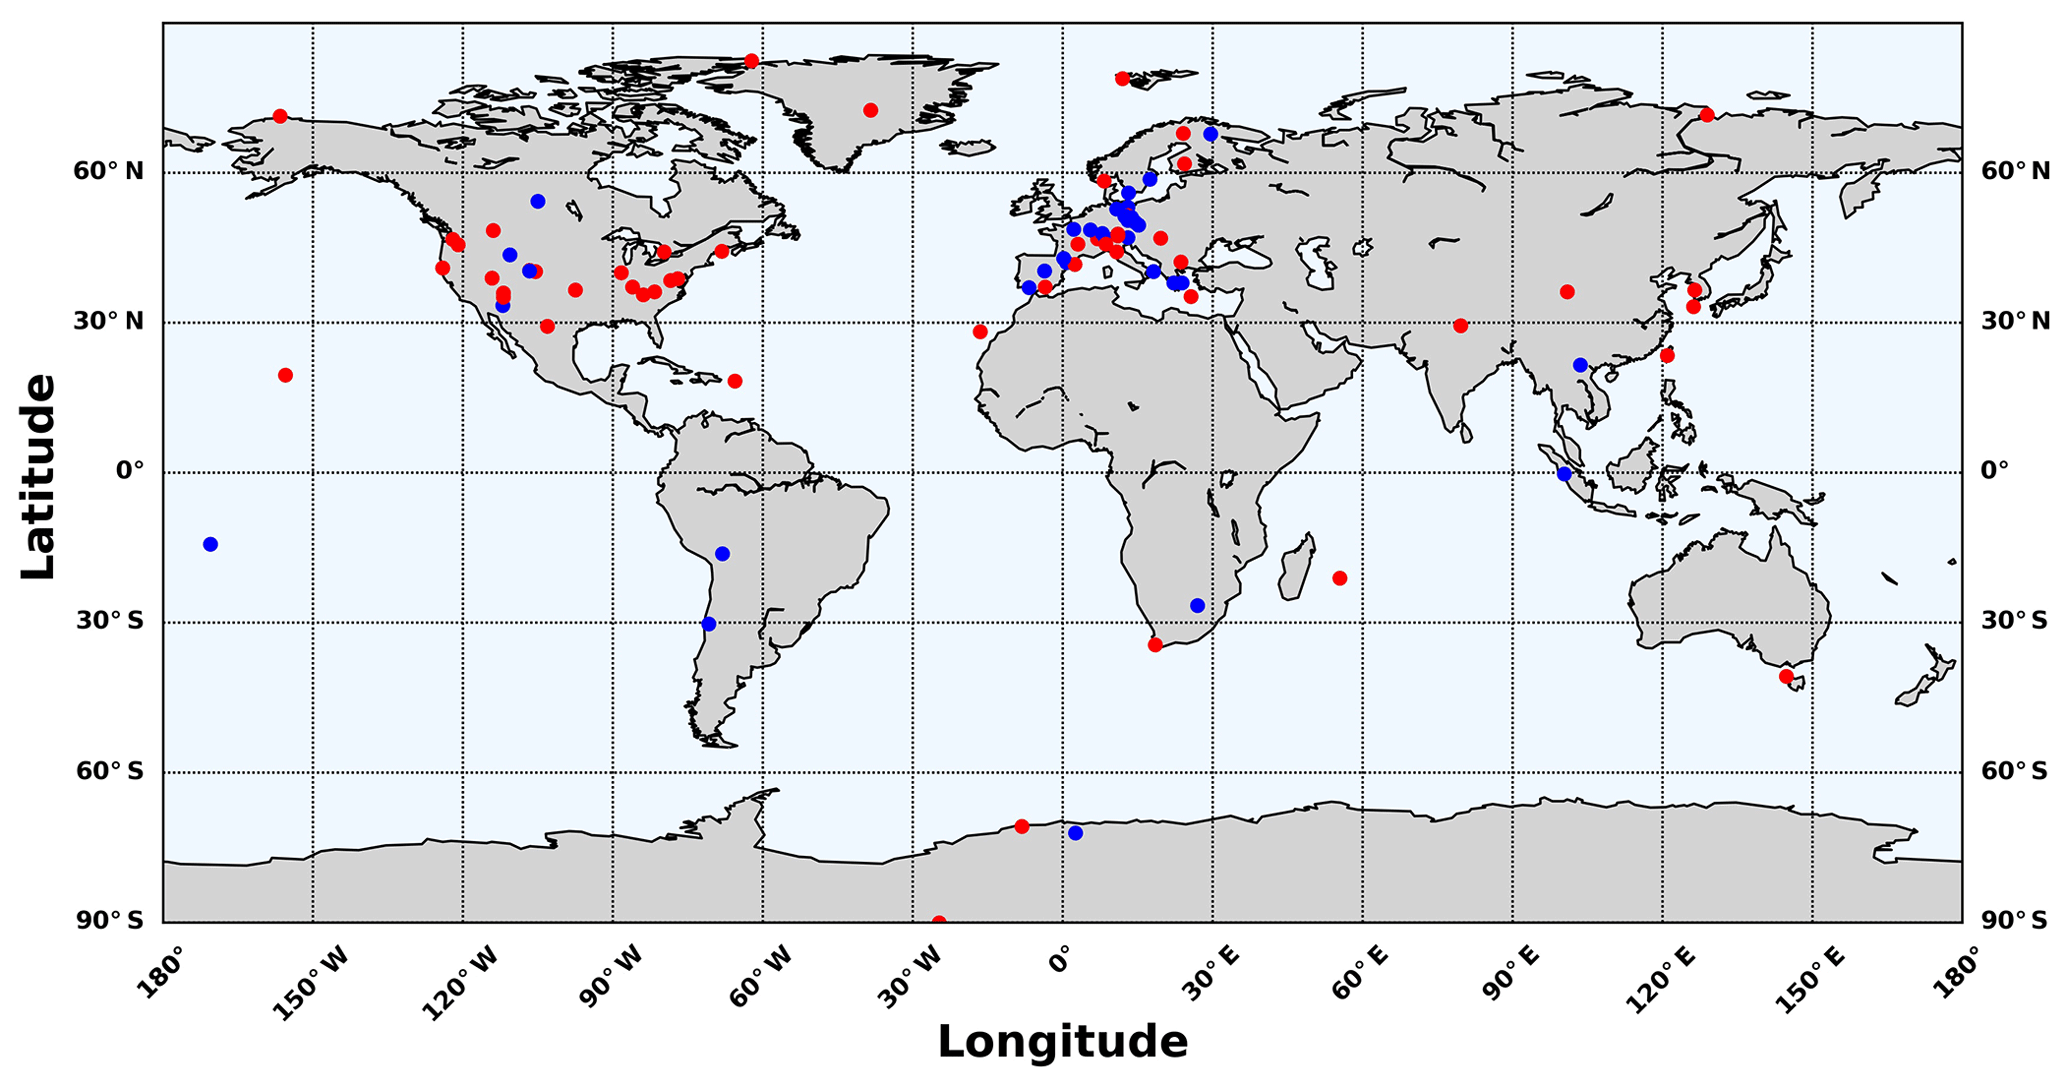
Figure 1Location of sites contributing to the present study. In blue, sites which provided information for the reference year 2017 and in red, sites that in addition, provided >10-year time series for optical properties used in Collaud Coen et al. (2020b).
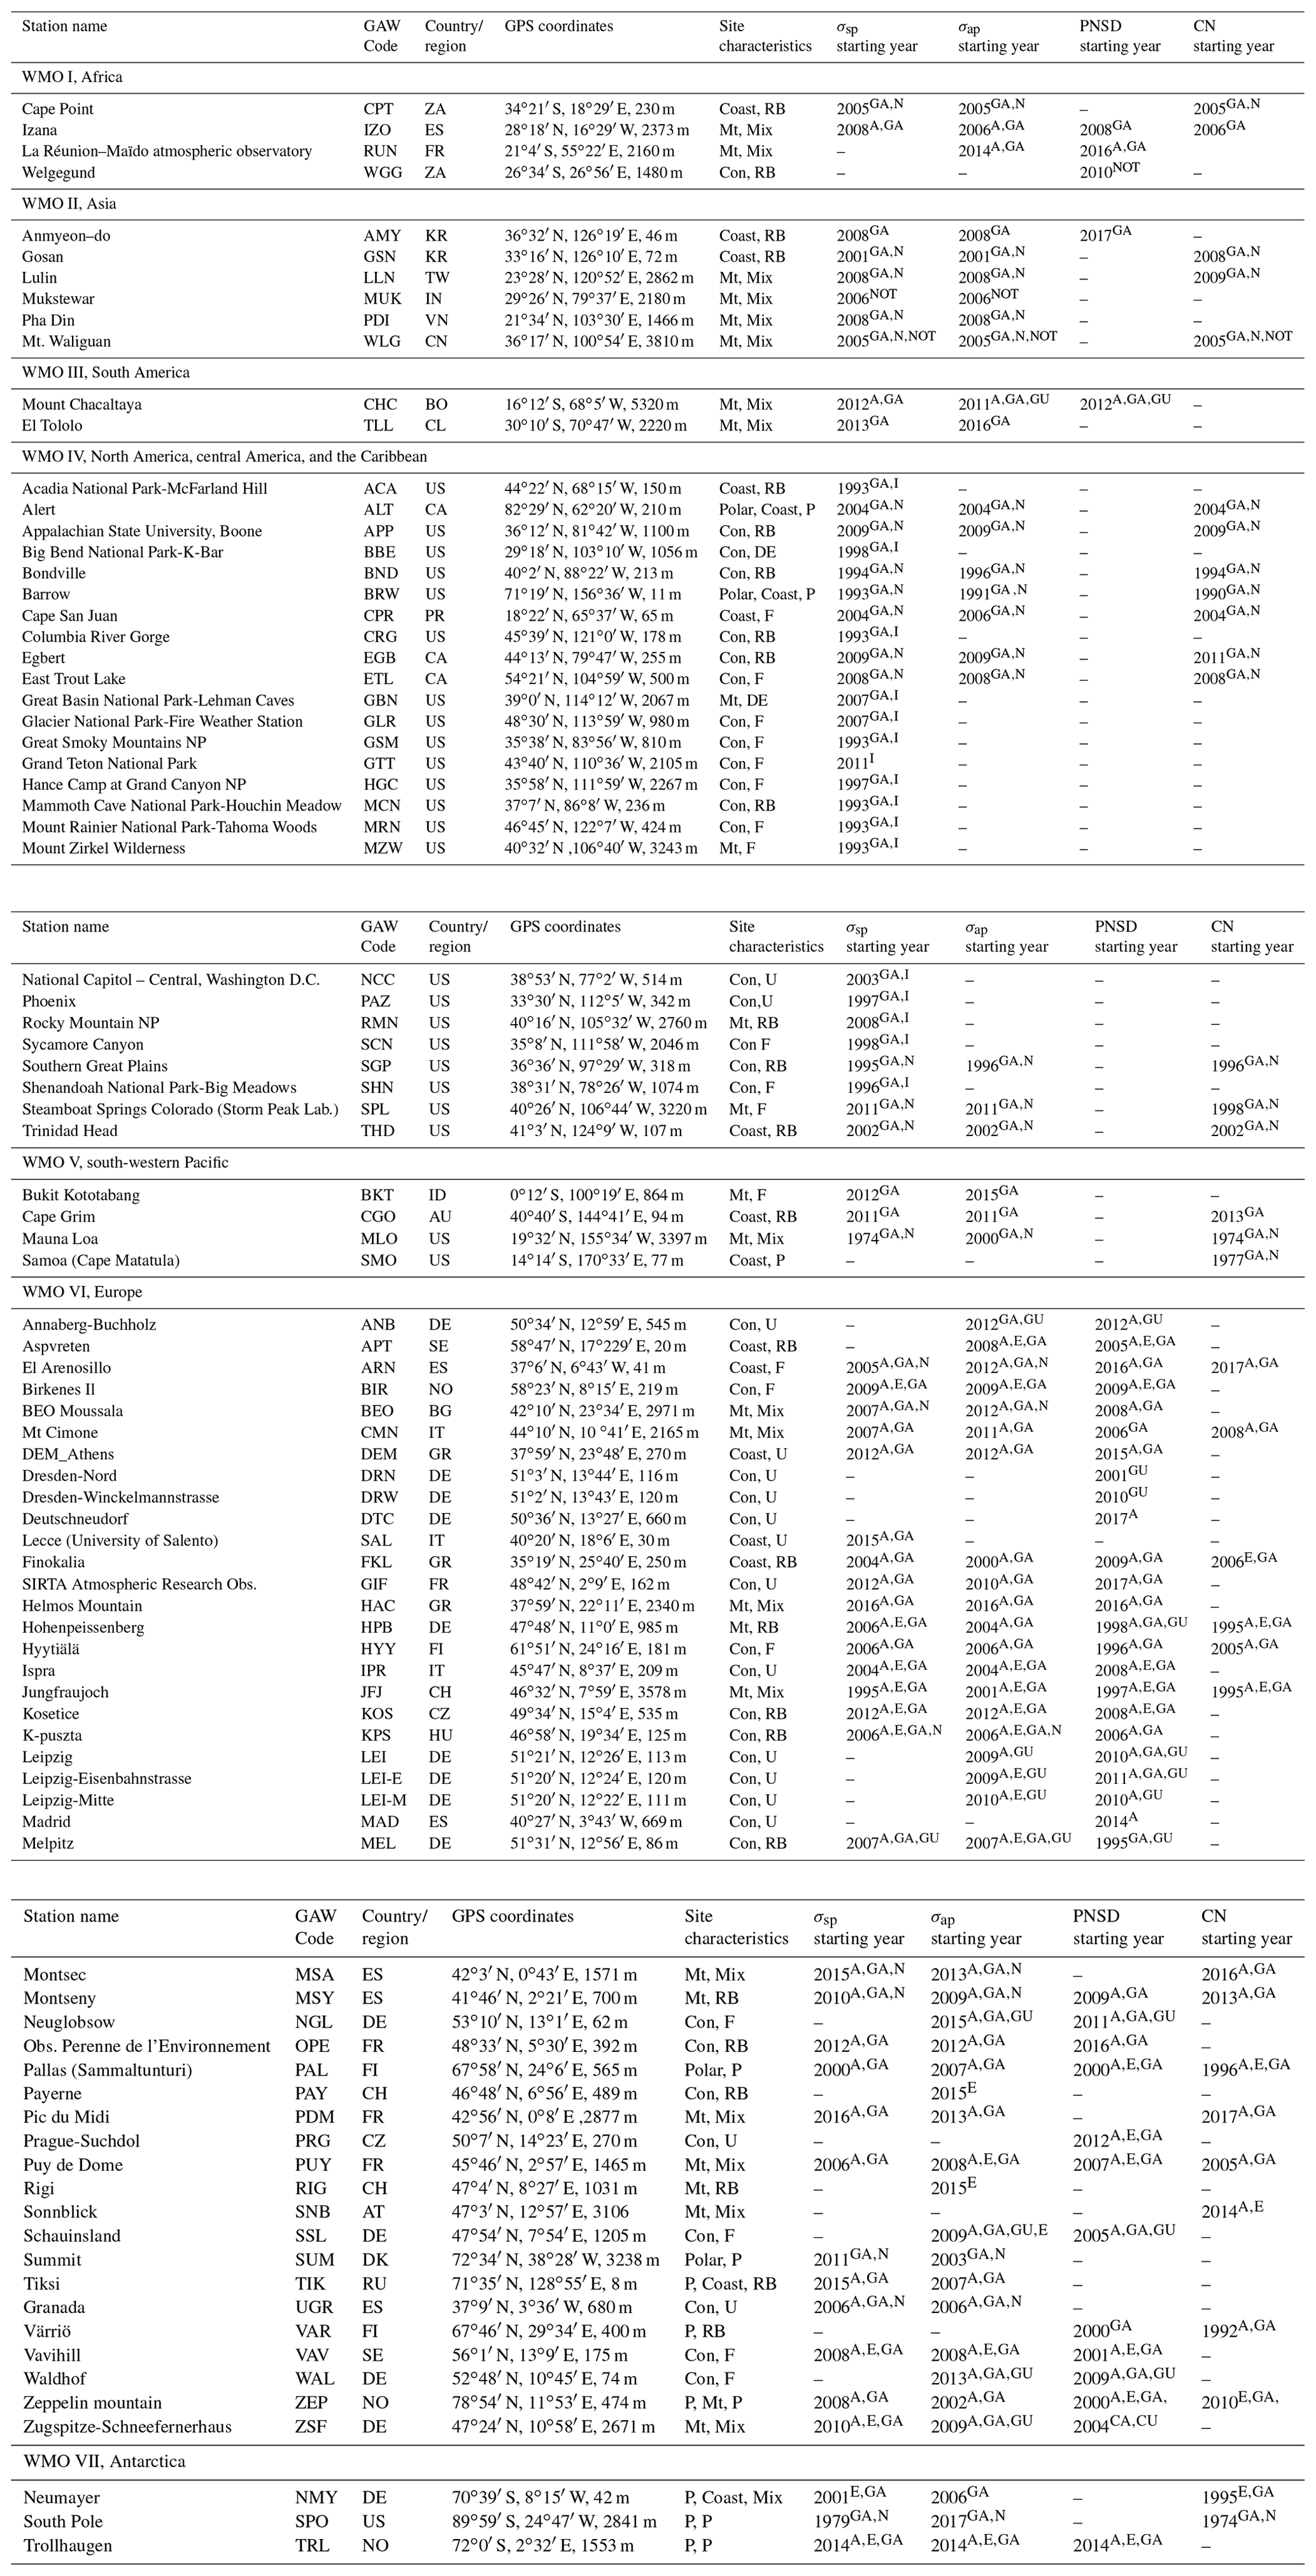
Currently, 89 different sites worldwide are contributing to the provision of at least one SARGAN variable. These sites are indicated in Fig. 1 and Table 3. Note that they are potential additional collocated sites not used in this study. All information used to compile information for this study is directly derived from NOAA-FAN and ACTRIS/EMEP with additional contributions from providers listed in Table 2. Except for a few sites, measurements from all sites comply with the quality assurance and data reporting criteria defined in Sect. 3.1 and 3.2. If the sites are part of a contributing network, inclusion is straightforward in that the contributing network will already have met the GAW quality control and data reporting criteria. We have allowed a few exceptions for some sites located in WMO regions I (Africa), II (Asia), III (South America and the Caribbean), and IV (North America) to ensure the widest geographical coverage possible.
Table 3List of sites in the SARGAN network in 2017 or last year with data in EBAS used in the present study. Table indicates the starting year for each variable, and the site geographical category: Mountain: Mt, Polar: P, Continental: Con, Coastal: Coast, and the air-mass footprint characteristics: Rural background: RB, Forest: F, Desert: DE, (Sub-)urban: U, Pristine: P, Mixed: Mix, ACTRIS: A, EMEP: E, GAW-WDCA: GA, GUAN: GU, IMPROVE: I, NOAA-FAN: N, Not in EBAS: NOT. Sites highlighted in grey closed in 2017 or earlier.
Because of the specific purposes for which NOAA-FAN and ACTRIS/EMEP were established, the nature of the sites is clearly biased to provide information relevant on the regional scale. This is why urban and peri-urban sites are under-represented in SARGAN and that a majority of sites are sampling in environments far from local emission sources, with a station footprint that is generally quite large (influenced by air masses transported more than 100 km away). The issue of spatial representativeness of observing stations has been addressed in many papers (e.g. Wang et al., 2018; Sun et al., 2020), and in particular related to air quality monitoring (e.g. Joly and Peuch, 2012). Representativeness of a site describes how the measurements can be used to derive information for a given timescale or spatial scale, or for a given kind of environment. This information is key whenever ground-based observations are used to compare with space-based measurements or for evaluating models. However, defining station representativeness is not unambiguous and several papers exist with different definitions (Joly and Peuch, 2012).
Station representativeness is very often addressed using density plots identifying the most probable origin of air-mass trajectories terminating at the station over a certain time (typically 3 to 6 d). Many stations in SARGAN can provide such analyses often performed to discriminate source areas influencing the site for climatological studies. Schutgens et al. (2017) discussed representativeness of ground-based observations both in terms of spatial and temporal averaging showing that significant errors may remain even after substantial averaging of data. Joly and Peuch (2012) developed a methodology to build a classification of European air quality monitoring sites, mostly based on regulated pollutants.
In this paper, site characterization is made with a two-criteria approach: (1) a criterion describing the main geographical setting (e.g. polar, continental, coastal, mountain) and (2) a criterion providing indications about the dominant footprint (e.g. forest, rural, desert, urban, pristine, regional background, mixed). Additional details on some of these categories are warranted. Mountain sites are not classified solely based on elevation (for example, high plateaux such as SPO and SUM are not considered mountain sites) but rather on the fact that the station is located higher than the surrounding environment.
For the air-mass footprint, “Mixed” is used whenever no dominant air-mass footprint criterion is identified. This is often the case, for example, for mountain sites where air sampled during night differs from air sampled during day, due to local orographic effects. “Pristine” is used whenever the site is located far away from any anthropogenic or natural sources. Obviously, no simple site characterization can completely capture the influences on a location and we are aware of the shortcomings of this classification. In the context of the paper, this simplistic scheme was considered the easiest way to organize the statistical results. It should be mentioned that site characterization relies on authors' knowledge of the sites, along with indications by the corresponding PIs.
5.3 Evolution of data provision in SARGAN
In their 2013 papers, Collaud Coen et al. (2013) and Asmi et al. (2013) evaluated trends in aerosol optical and physical properties based on time series extending from 1993 to 2010. At that time, 24 sites worldwide had the capacity to provide a ≥10-year time series for at least one of the optical or physical properties. In 2018, there are 52 stations capable of providing ≥10-year time series for optical or physical properties. The increase in number is clearly driven by many European sites initiated between 2000 and 2005, in particular through ACTRIS, but there are also now multiple sites in Asia with 10-year time series through collaboration with NFAN. Figure 2a, b, c, and d illustrate the evolution of data provision in SARGAN for optical and physical properties.
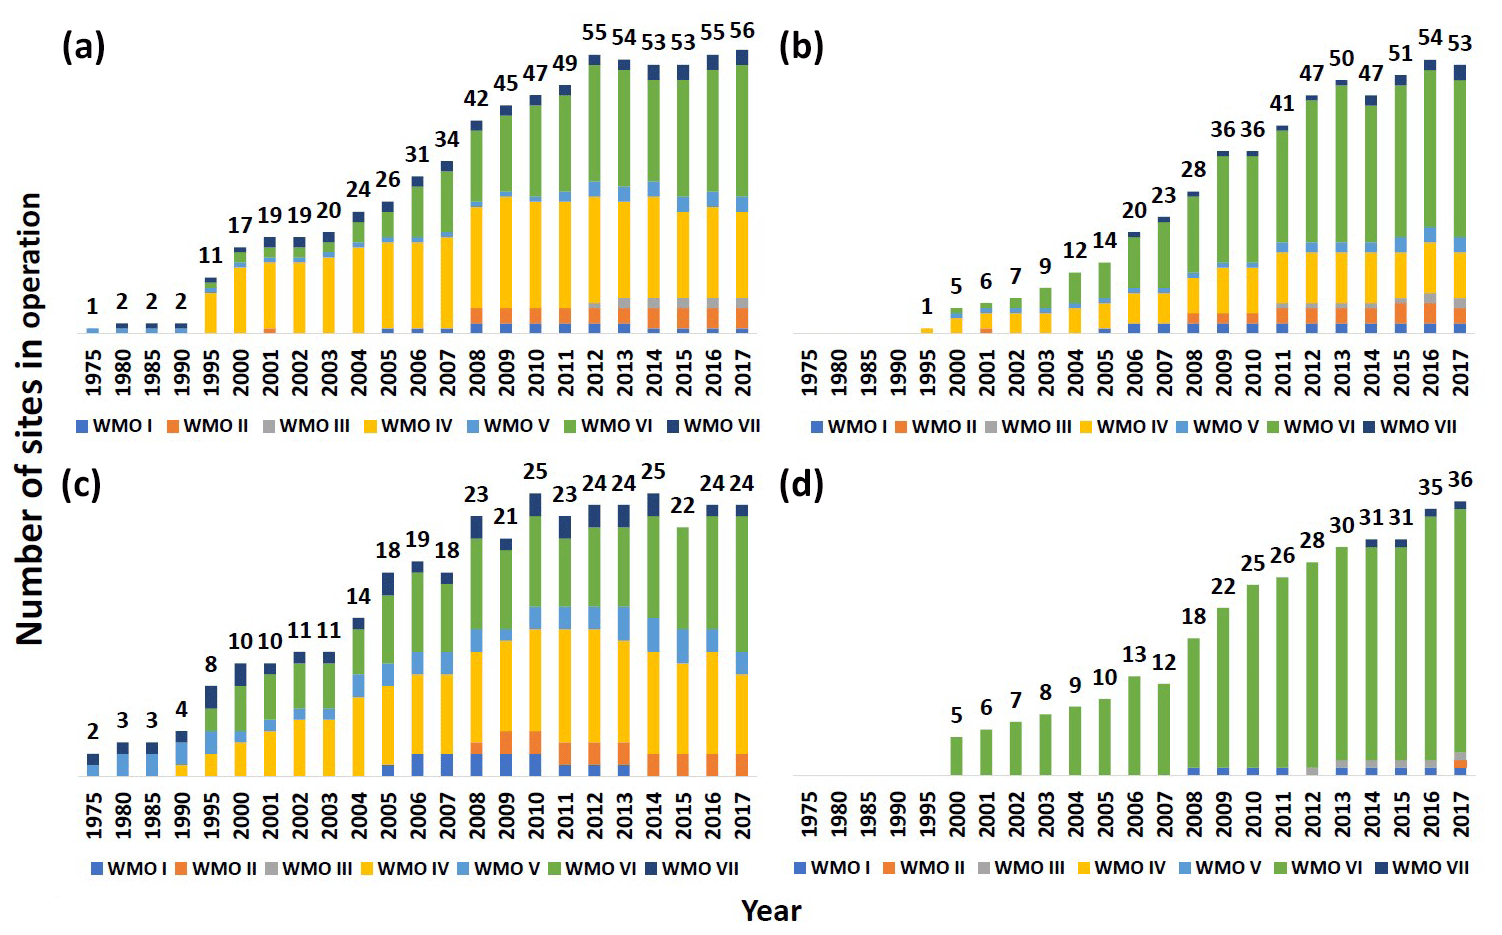
Figure 2The evolution of data provision in SARGAN for optical (a, b), and physical parameters split between sites providing particle number concentration (c) and sites providing particle number size distribution (d) over the period 1975–2017 for the WMO regions. WMO I: Africa, WMO II: Asia, WMO III: South America, WMO IV: North America, central America, and the Caribbean, WMO V: south-western Pacific, WMO VI: Europe, WMO VII: polar.
Globally, considering all four variables, there has been a very significant improvement of data provision in the last 10 years, with almost 5 times more stations operational than shown in Fig. 3. In 2017, the status is that for absorption there are 50 sites with 1 year of data, 37 sites with 5 years of data, and 20 sites with 10 years of data. For scattering, the parallel development is 56 sites with 1 year, 45 sites with 5 years, and 30 sites with 10 years of data.

Figure 3Cumulative number of sites providing information to the WDCA for the aerosol variables: (a) scattering, (b) absorption, and (c) combined size and particle number concentration.
It is worth noting that, besides Antarctic stations, no stations were located outside North America and continental Europe in Collaud Coen et al. (2013) and Asmi et al. (2013), while nine stations outside those regions are now contributing to Collaud Coen et al. (2020b). Overall, the total number of measurement years increased substantially, which will contribute to a more robust vision of the state of the atmosphere. It remains a fact, however, that the number of stations providing information in many areas (Africa, South America, Australia) is too low to draw overarching conclusions about trends for those regions.
The number of stations would have been even higher except that a few were either closed between 2012 and now or moved. This is the case for Mukteshwar station with the longest time series in India (2007–2015) which was moved in order to obtain measurements at another location, thus interrupting the time series. This is also the case for Vavihill station (VAV) in Sweden, moved to another location (Hyltemossa) in order to colocate aerosol and greenhouse gases observations, and Southern Great Plains (SGP) which shifted buildings and instruments and left the NFAN in September 2017. Other stations actually closed (e.g. THD, June 2017, and SMO, July 2017). CPR was offline for many months due to a hurricane (September 2017–March 2018), and GSN has only very sparse data (not usable for trend analysis) since 2016 due to monsoon damage. The global GAW station of NCO-P in Nepal also stopped operating in 2016. Closure of some important stations in regions where measurements are lacking is clearly unfortunate in the context of SARGAN.
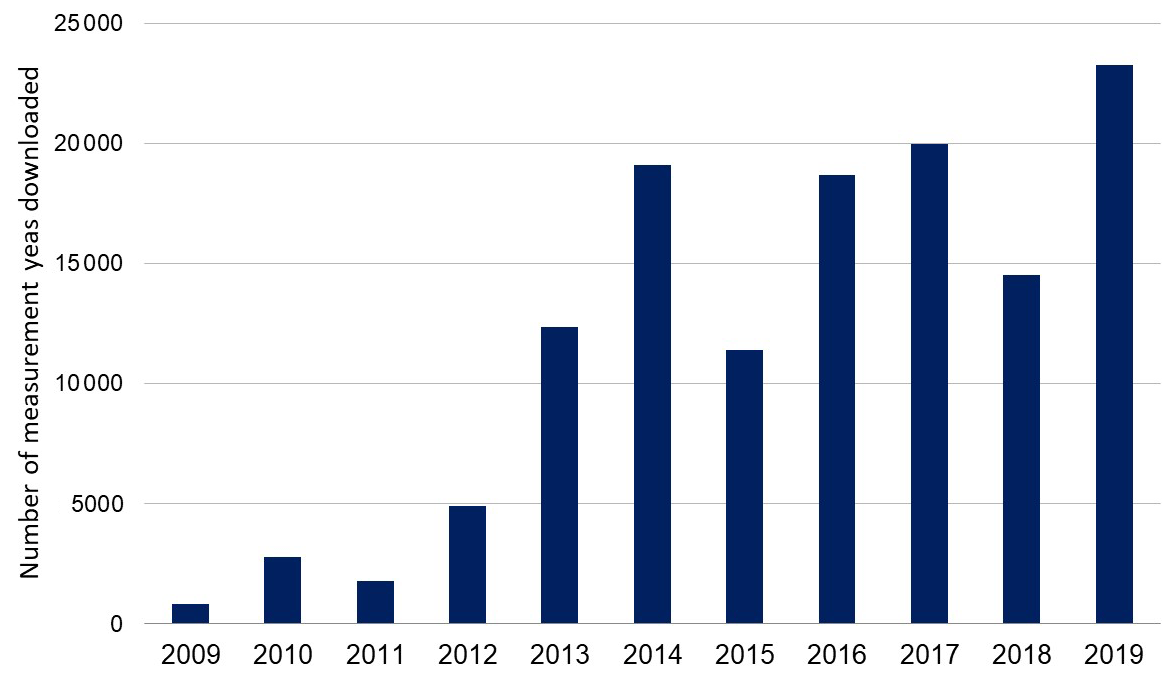
Figure 4The use of SARGAN data from GAW-WDCA over the period May 2009–October 2019 as indicated by the number of full years of measurement data downloaded each year. Data extracts as tailored special delivery (the full database for a special purpose) are not included.
The access to data through the GAW-WDCA database EBAS has been monitored since May 2009. The use is extensive, in volume, number of users, and geographical distribution of download of data. The users of GAW-WDCA data are distributed worldwide. In the period between May 2009 and October 2019, 4110 unique client IPs from 72 different countries have downloaded data, each of them accessing the databases from one to numerous times. Note that some large research institutes (e.g. NOAA in the US) have one single IP for all users. In total, more than 125 000 full measurement years of data have been downloaded from GAW-WDCA since May 2009. The development over time is shown in Fig. 4 with a strong increase over time.
6.1 General criteria for data selection
The present article provides an updated overview of the distribution of aerosol properties based on the information available in EBAS from sites listed in Table 3. The analysis is based on data collected in 2017 to provide the most updated view of measurements worldwide. The analysis is restricted to a very basic statistical overview (yearly and seasonal median, percentiles, average) that is completed, for some stations, by the trend analysis performed as part of Collaud Coen et al. (2020a). To perform this analysis, we preferentially used data collected in 2017. In case the coverage for 2017 was insufficient (see criteria below), data from 2016 were used. This is indicated in Tables S1 and S2 in the Supplement.
All sites contributing to SARGAN in 2017 were included in the analysis. The analysis is based on hourly data of σsp, σap, and PNSD. Only validated measurements were used, i.e. data following the curation described in Sect. 3.2, and, for an aerosol parameter, the data sets from the different stations were further harmonized (e.g. to ensure that the time vectors and data were of the right format and comparable with each other). Prior to the calculation of the summary statistics, a few problematic data points were also removed, following communication with the PI. For each site, annual and seasonal summary statistics were computed (median, 10th and 90th quantiles); the results were included only if 75 % of the hourly data were available over the statistics reference period (with the exception of BRW, MLO, and SPO, whose respective coverage for each aerosol property is detailed in Tables S1 and S2). In cases where the 2017 coverage was not sufficient (i.e. <75 % for all seasons) for an aerosol parameter (e.g. due to instrument failure or natural disaster impacting the station), the 2016 data were considered for that parameter. In cases where the coverage for that aerosol property was insufficient also for 2016 (i.e. <75 % for all seasons), the site was discarded from the analysis for that aerosol property. For the sake of simplicity, the seasons were attributed using the common division December–February, March–May, June–August, and September–November at all sites, even for the stations where other temporal divisions would be more relevant. This is, for instance, the case for CHC, where meteorological conditions are affected by two main seasons (May–September and December–March) with tropical characteristics (i.e. dry and wet, respectively). For all station types and timescales (year and seasons), the discussions are limited to the sites where data availability was sufficient, and which statistics are shown in the relevant figures and tables.
As mentioned in Table 3, many sites are actually influenced by different air-mass types, and some of them are influenced by anthropogenic sources. For most sites, data from all air masses are included in the statistical analysis. For BRW, MLO, and SPO, the data included in this overview do not include all valid measurements collected at these three sites, but only the data corresponding to clean air masses. Clearly, in that case, the coverage criteria indicated above do not apply. This screening protocol, performed by the institutes operating the instruments, results in a lower annual data coverage and in a bias towards lower levels but ensures data consistency with the multi-decadal data available from these sites.
6.2 Global distribution of aerosol optical properties
6.2.1 Data handling
Sixty-four sites in total contributed in 2016/17 to the SARGAN initiative by providing optical aerosol properties: 53 for absorption and 55 for scattering coefficient data, respectively; for 29 of these sites, it was also possible to compute single-scattering albedo. Four different types of filter-based absorption photometers were included in the analysis of σap: the Multi-Angle Absorption Photometer model 5012 (MAAP, by THERMO-Scientific Inc, USA), the Continuous Light Absorption Photometer 3-wavelengths (CLAP-3W, NOAA), the Aethalometer AE31 (Magee Scientific, USA) and the Particle/Soot Absorption Photometer 3-wavelengths (PSAP-3W, Radiance Research Inc). It is important to note that data from Aethalometer AE33 (Magee Scientific, USA) were not used in this study as a unique value for converting the measured attenuation coefficient to particle light absorption coefficient (σap) has not been fixed. The MAAP provides absorption at 637 nm (Mueller et al., 2011), the CLAP at 461, 522, and 653 nm (Ogren et al., 2017), the AE31 at 370, 470, 520, 590, 660, 880, and 950 nm (Hansen et al., 1984), and the PSAP at 467, 530, and 660 nm. Summary statistics for absorption were based on σap at 637 nm for MAAP and on σap at the wavelength closest to 637 nm for other instruments. At PDM the absorption was measured by a single wavelength AE16 at 880 nm: at this site the statistics were based on absorption adjusted to 637 nm assuming a constant AAE =1 as suggested in Zanatta et al. (2016).
For aerosol scattering, the instrument deployed is primarily the Integrating Nephelometer 3563 (TSI Inc, USA), the Aurora 3000 (Ecotech Inc, AU) and the NGN-2 (Optec Inc, USA). The only exceptions are at PDM and SRT, where Aurora M9003 (Ecotech Inc, AU) nephelometers are utilized. Summary statistics for aerosol-scattering coefficient were computed at the wavelength closest to 550 nm for each instrument type, i.e. at 550 nm for the TSI and Optec nephelometers and at 525 nm for the Aurora 3000 and Aurora M9003. Due to the large dependence of scattering on hygroscopicity of aerosol, only scattering coefficients associated with a sample relative humidity less than or equal to 50 % were used; this threshold, slightly higher than the prescribed 40 %, allowed for more sites to be included and was consistent with Pandolfi et al. (2018).
Single-scattering albedo was computed at 550 nm using the optical properties closest to 550 nm for all multiple wavelength instruments. For σap by MAAP the data were adjusted to 550 nm assuming a constant AAE =1.
For both σap and σsp, the effect of the difference in the instrument wavelength on the comparability of the data used for the summary statistics was considered negligible; the only exception was for the estimate of σap at 637 nm by AE16 and of σap at 550 nm by MAAP, for which a constant AAE =1 was assumed.
6.2.2 Global variability of optical properties
The variability of aerosol absorption and scattering coefficient medians is presented in Fig. 5a and b and in Tables S1 and S2 along with other main summary statistics. The range of variability of both σap and σsp is high, spanning several orders of magnitude, with variability at least partly explained by a few main drivers: site latitude, site geographic location/footprint, and the distance from the main anthropogenic sources. Globally the spatial variability of scattering and absorption has large similarities, being both featured by largest variability at mountain sites and minimum variability at urban polluted sites (e.g. LEI, IPR). Within the mid latitudes, absorption and scattering tend to increase from sites with a rural or forest footprint towards those in mixed and urban conditions. Polar sites, both in the Arctic and Antarctic, exhibits the lowest σap and σsp, occasionally below instrumental level of detection (LOD) for absorption. Besides polar sites, lowest σap and σsp values are generally observed at mountain sites, e.g. JFJ, ZSF, and MLO (whose data are screened for clean air sector and may partly explain the low value), along with the southern coastal background site of CGO. A similar situation is observed for the lowest σsp which, besides for pristine sites, are observed for mountain sites. Interestingly, the mountain site of JFJ in Switzerland has a median σap and σsp lower than a few polar sites, i.e. ALT, BRW, PAL, ZEP, and ALT, BRW, NMY, respectively.

Figure 5Boxplot of hourly aerosol absorption (a) and scattering (b) coefficients at the SARGAN sites with sufficient annual coverage over the considered period (see summary Tables S1 and S2 for details). Boxplot colour indicates the footprint and the symbol at the median indicates the geographical category; both colour and symbol follow Table 3.
The variability is generally higher at sites with low σap and σsp, reflecting the contrasting transport, in the case of pristine sites between the very low background values and the increase to advection of less clean air masses, and for mountain sites, the contrasting diurnal or seasonal transport patterns. A very good example is TIK, showing the largest medians among polar sites, where σap spans over 1 order of magnitude, reflecting the collection of both clean and polluted air masses, most likely affected by biomass burning at the high latitudes.
The highest values and the smallest variability in both σap and σsp are observed for urban/peri urban sites (e.g. LEI, UGR, IPR). It is interesting to note that occasionally the rural stations as AMY (East Asia) and KOS (central Europe) have median and range values of σap similar to urban sites, despite being located in rural areas far from local sources. PDI and BKT, both mountain sites in South-East Asian tropical forests, exhibit large medians for both σap and σsp compared to other forest/mountain sites due to recurrent impact by biomass burning (Bukowiecki et al., 2019). Similarly, biomass burning events related to anthropogenic emission from mainland China also affect via regional transport both LLN, another mountain site in South-East Asia, and AMY.
At mountain sites in southern Europe (MSA, HAC, and CMN), a large scattering and absorption range is observed, comparable to that at rural background sites. This variability is partly due to the mixed nature of the sites, to long-range transport events (e.g. Saharan dust outbreaks, coal burning from eastern Europe) and biomass burning both from forest fires in summer and domestic heating in winter. Saharan dust transport events partly explain the variability observed in other Southern European sites, e.g. FKL.
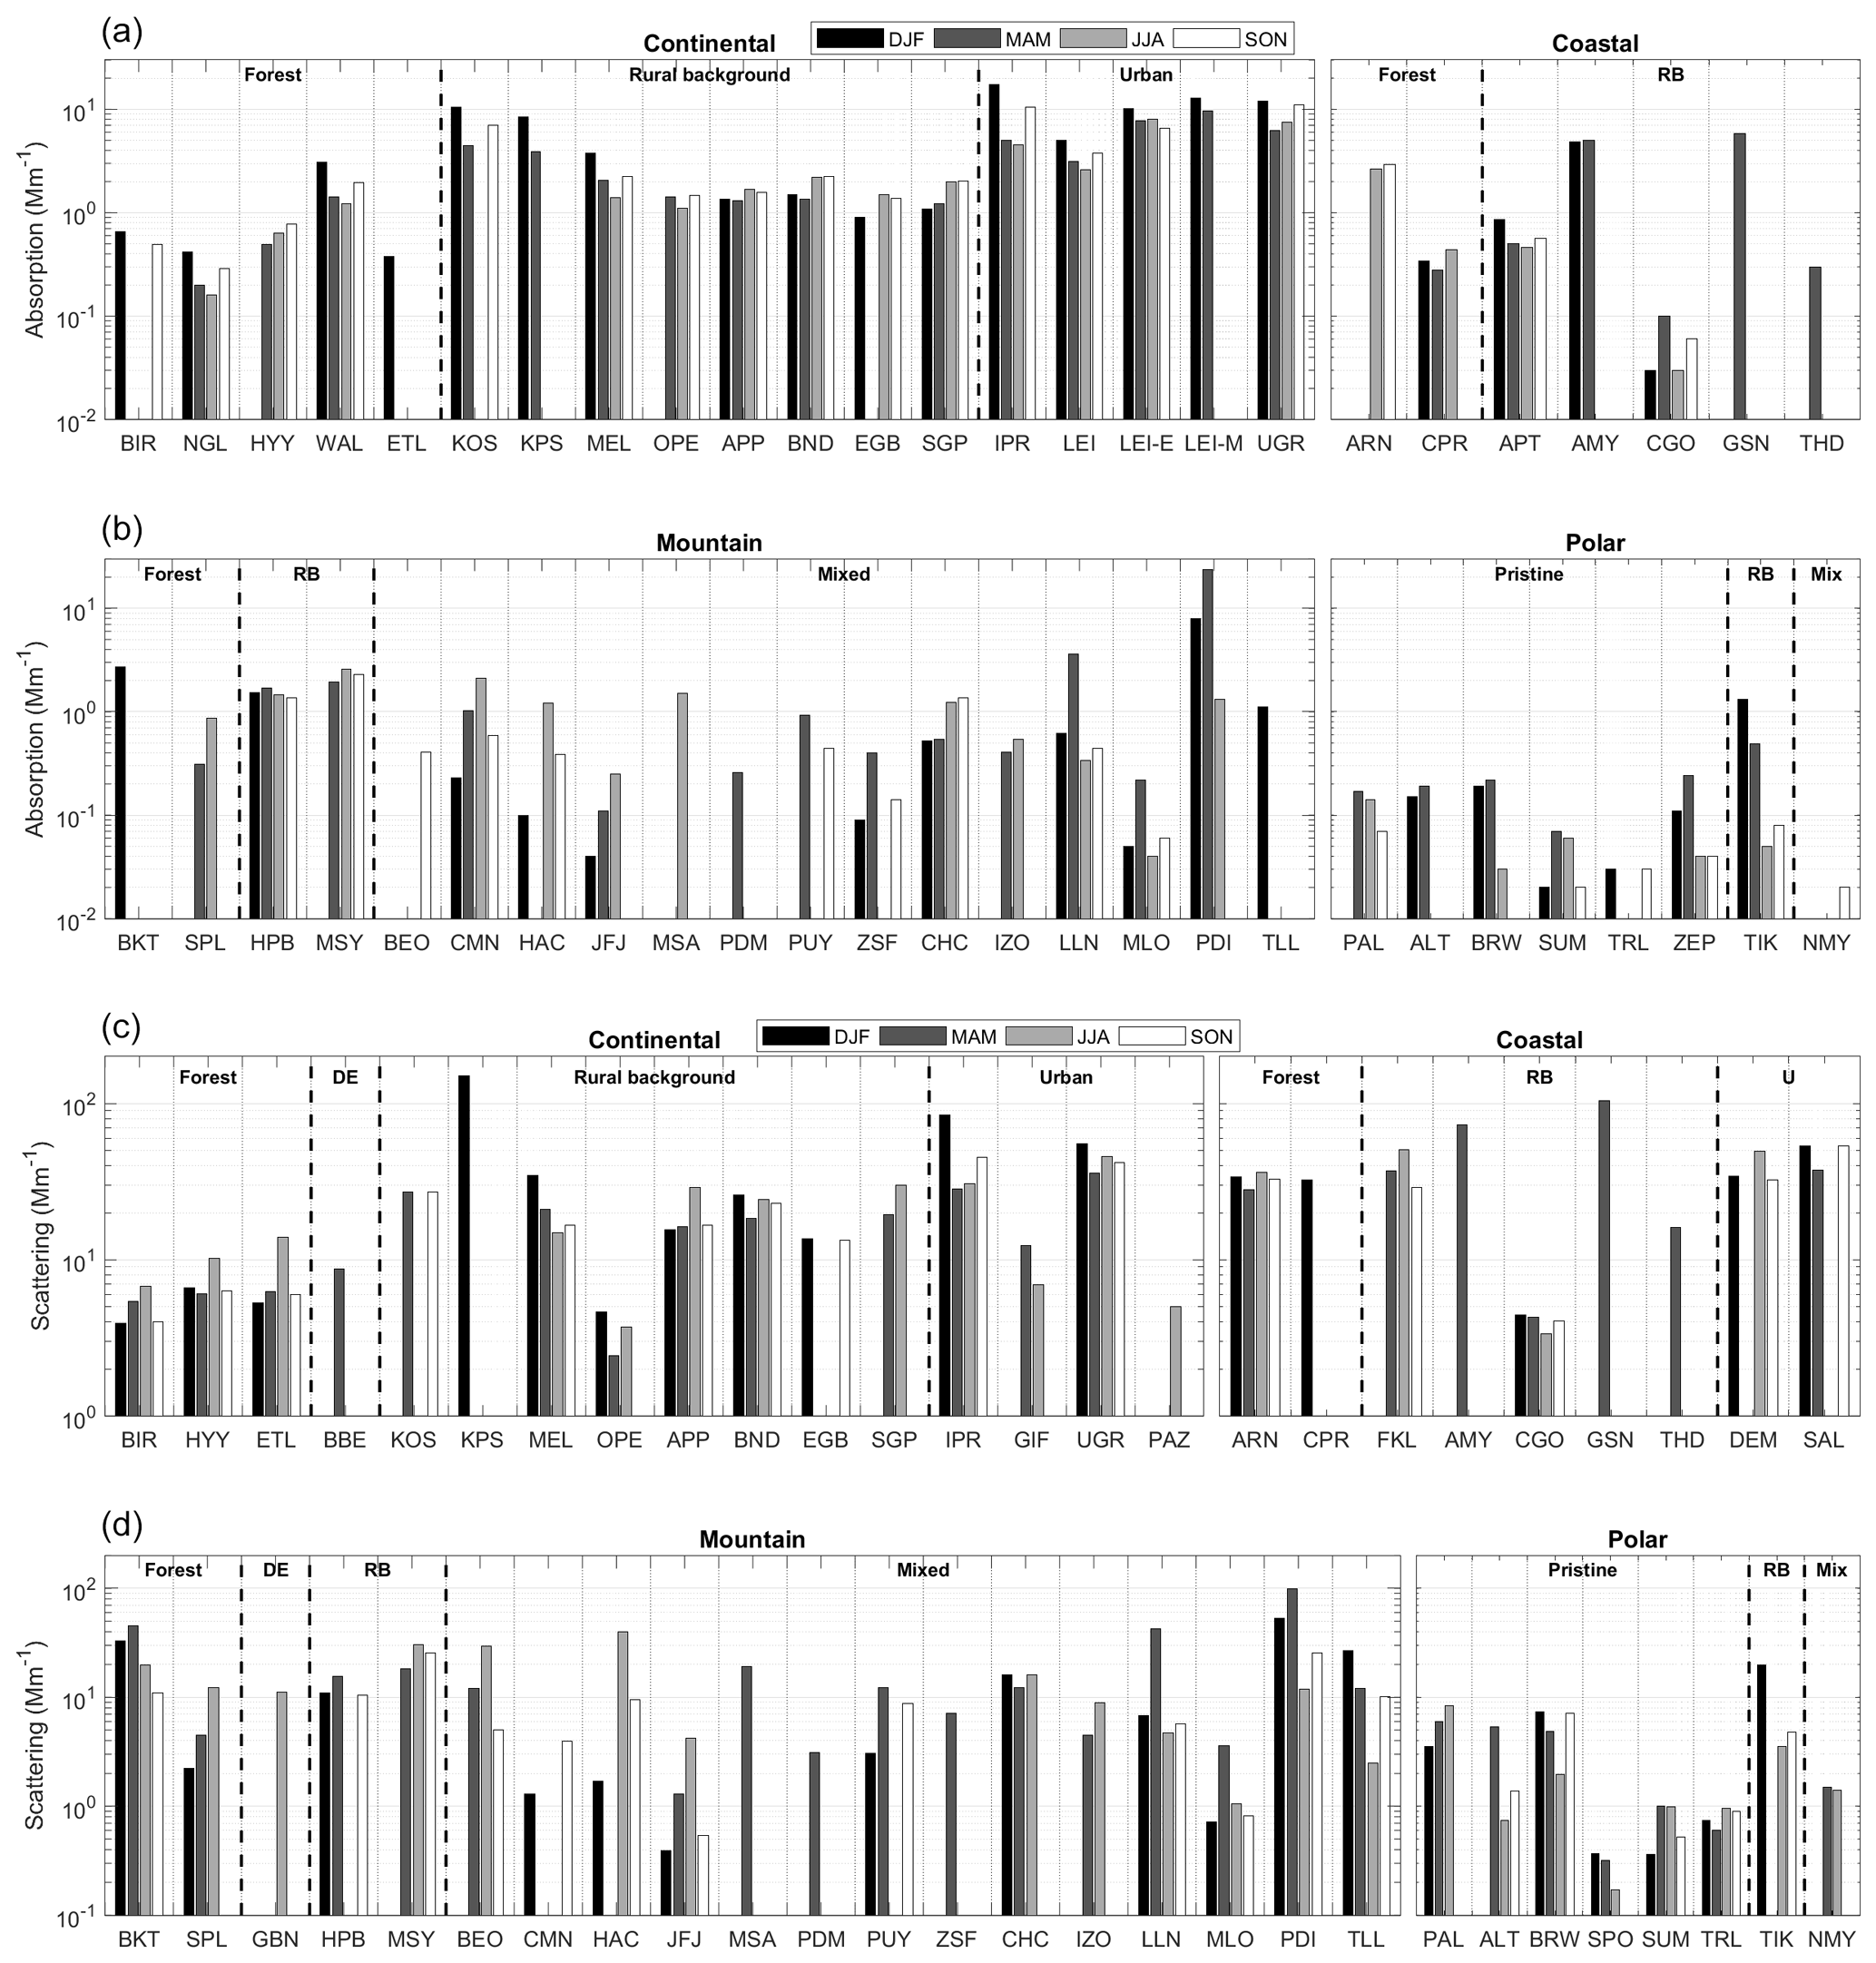
Figure 6Variation of the seasonal median of absorption coefficient (a, b) and scattering coefficient (c, d) for the different sites, grouped according to site classification of Table 3 with DE (Desert), U (Urban), and RB (Rural Background).
The seasonality of σap and σsp is presented in Fig. 6a and b. The variability of the season median is much lower than the yearly variability reflecting the importance of transport in the variability. The most pronounced annual seasonality is observed at high mountain sites due to the seasonal variation of the boundary layer height and the local circulation induced by thermal winds that follow the ground temperature cycle. In the case of mountain sites, the seasonality also reflects the index of boundary layer influence as defined by Collaud Coen et al. (2018). Generally, seasonality is largest at sites in an urban setting (e.g. UGR, NOA, LEI-M) and at those recurrently influenced by transport of either local or distant anthropogenic emissions (e.g. IPR, GSN). Also, biomass burning can have a large influence on absorption seasonality and on absolute levels, e.g. the Asian sites of GSN, LLN, and AMY. In general, the seasonal variations are very clearly observed at remote sites, for example at ALT and TIK, where the seasonality of air-mass origin bringing high levels of aerosol during some parts of the year dominate the very minimal local emissions.
6.2.3 Global variability of single-scattering albedo
For stations providing simultaneous measurements of scattering and absorption coefficients, it is possible to derive the single-scattering albedo, which is done at 550 nm. Overall, ω0 is computed for 31 stations and presented in Fig. 7. Median ω0 values range from slightly less than 0.8 to almost purely scattering particles with ω0 close to 1. The highest values are found at coastal and polar sites clearly influenced by inorganic salts and sulfur-rich particles. The lowest ω0 are observed at sites in southern Europe (IPR and UGR), which are impacted by desert dust, biomass burning, and local emissions. Only six sites have median ω0 below 0.9 but only the coastal, mountain, and polar sites exhibit 25th percentiles constantly above 0.9. Variability of ω0 is strongly connected to air-mass characteristics with, for a single station, a typical range of variability (25th–75th percentiles) of approximately 0.05 units of ω0. The variability at sites characterized as “Mixed”, and in particular the mountain sites, is not higher than at other sites. The switch from free tropospheric air to boundary layer for the mountain sites does not appear to significantly affect ω0.
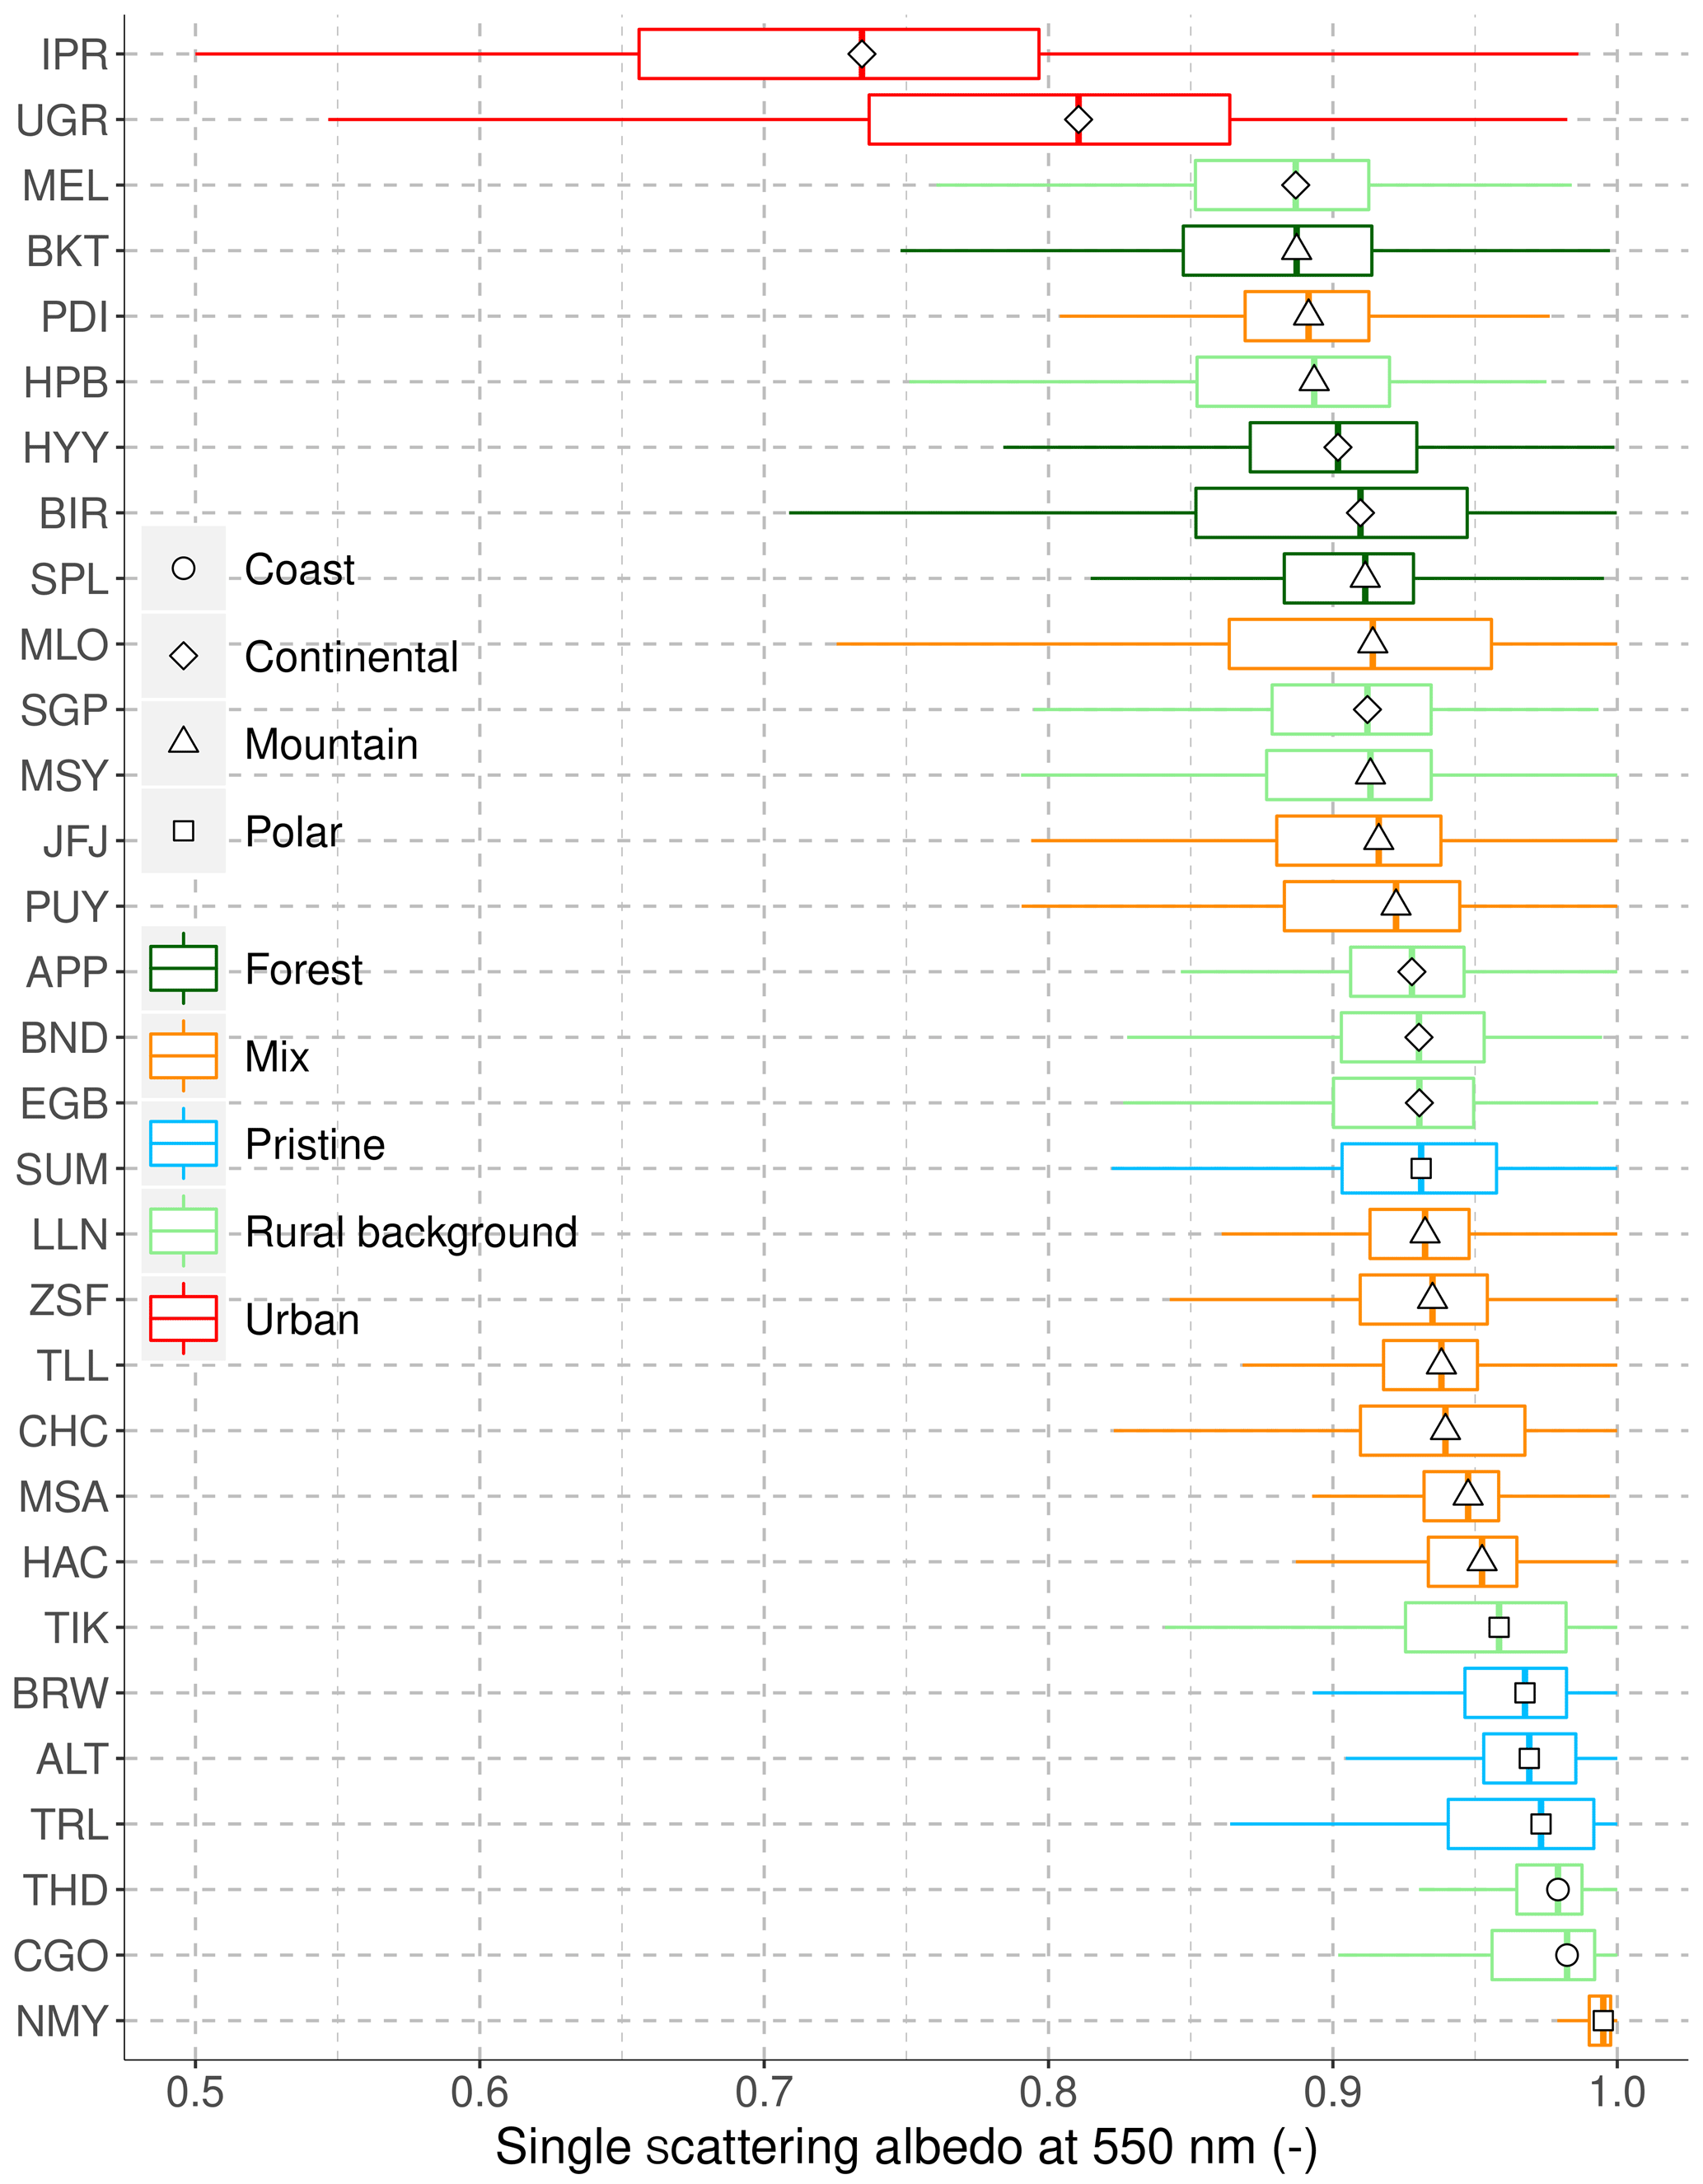
Figure 7Boxplot of quantiles and annual median for single-scattering albedo at 550 nm at the analysed sites. Box colour indicates the footprint according to Table 3.
6.3 Global distribution of aerosol physical properties
6.3.1 Data handling
Data collected at 57 sites contributing to SARGAN were analysed to provide an overview of the condensation nuclei in the atmosphere. Measurements are performed with CPCs and MPSS; note that when both CPC and MPSS were concurrently run at a site, only MPSS data were included in the analysis, as it allowed additional investigation of the PNSD. For MPSS measurements, data inversion was performed by the institutes operating the instruments, and, for both CPC and MPSS, particle number concentrations were reported in particles per cubic centimetre at STP, i.e. T=273.15 K and P=101.3 hPa, following the recommendations from Wiedensohler et al. (2012). As discussed in the overview of European PNSD and CN conducted by Asmi et al. (2011), the diameters associated with MPSS data correspond to the geometric mean diameter of the size intervals used in the inversion. MPSS measurements are moreover usually representative of dry aerosol properties, as the operating procedures described in Wiedensohler et al. (2012) indicate that the relative humidity of the sample air should be kept below 40 %. In total, after excluding the data sets with insufficient data availability (with respect to the criteria reported in Sect. 5.1), CPC measurements collected at 21 stations and MPSS data from 36 sites were included in the analysis (Table S3 in the Supplement).
To allow for the comparison of CN values derived from both instrument types, particle concentration in the range between 10 and 500 nm was inferred from MPSS measurements and assimilated to total CN (hereafter referred to as Ntot). This size range was selected as it was common to most of the MPSS included in this study. In addition, the lower end of this size range is comparable to the lower cut-off diameter of 14 of the 21 CPCs involved in the comparison (10 or 11 nm), and we assumed that particles larger than 500 nm only contributed little to Ntot. The legitimacy of this approach was supported by the fair agreement between Ntot derived from collocated CPC and MPSS measurements at several sites. Moreover, using available MPSS data, we found that, on average, particles in the range between 10 and 11 nm contributed less than 1 % to Ntot (90th percentile of the contribution: 5 %), suggesting that such a small cut point difference was not a major issue for Ntot. However, the influence of a larger difference in lower cut points could not be discounted; this was, for instance, the case for ETL, ARN, and GSN, where particles down to 2.5 nm were accounted for in Ntot (CN data were collected with a CPC TSI 3776 at these sites).
Results in the next section are discussed with respect to the classification of the stations reported in Table 2, including both the geographical and footprint criteria. Also, in order to describe the time evolution of CN and PNSD across the year, observations are categorized by seasons. Diurnal variations were not studied here but would be expected to be strong for certain site types and conditions (e.g. mountain upslope/downslope, urban local traffic).
6.3.2 Global variability of physical properties at SARGAN sites
As shown in Fig. 8 and Table S3, the lowest particle concentrations are typically observed under conditions of minimal anthropogenic influence, at polar sites, where yearly medians of Ntot are of the order of 102 cm−3. Overall, as discussed earlier by Asmi et al. (2011), these stations also display a very clear seasonal cycle compared to other geographical categories, with a summer maximum of Ntot likely resulting from both enhanced secondary aerosol formation, including new particle formation (NPF), and transport (Croft et al., 2016; Nieminen et al., 2018).

Figure 8Yearly median of the total particle number concentration (Ntot). The markers represent the median of the data and the lower and upper edges of the box indicate the 25th and 75th percentiles, respectively. The length of the whiskers represents the 1.5 interquartile range. Different markers and box colours indicate geographical categories and footprint, respectively, according to Table 3. Note that only the sites with sufficient annual coverage (i.e. >75 %) are presented.
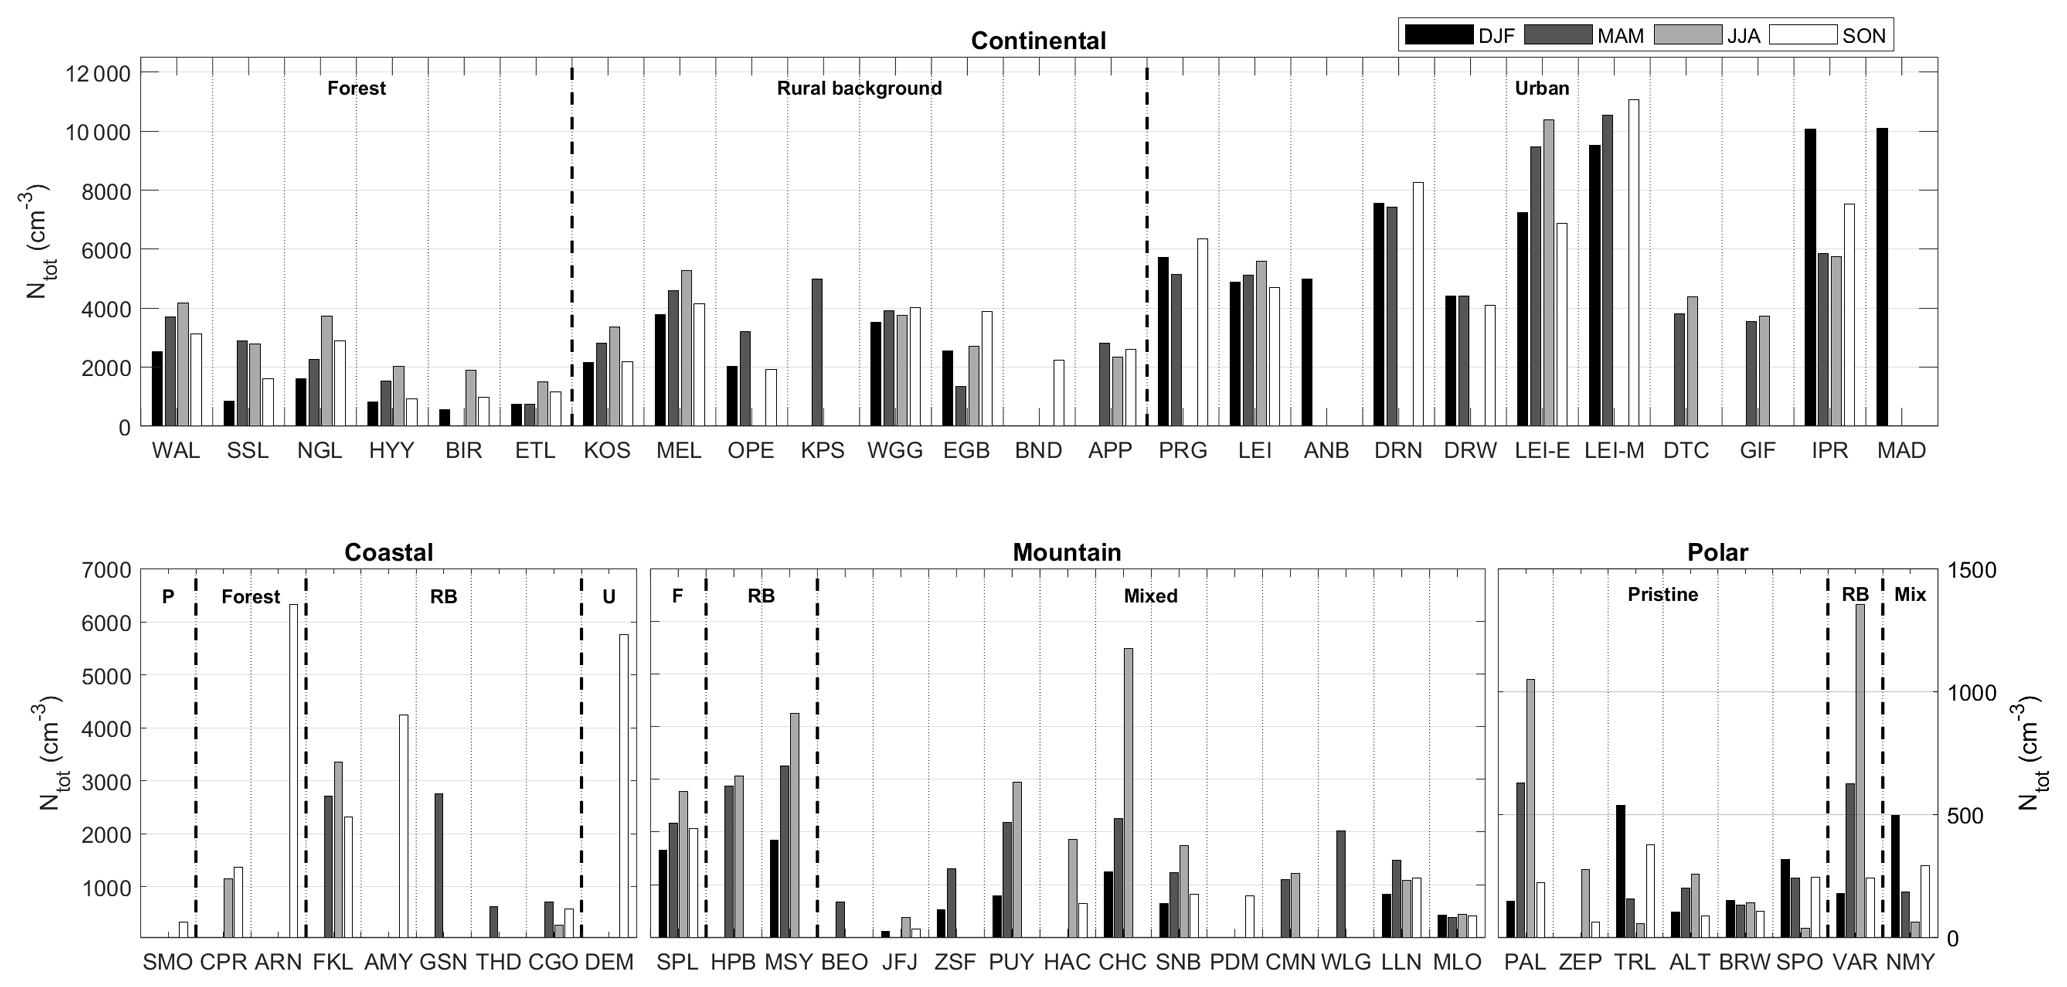
Figure 9Seasonal medians of the total particle number concentration (Ntot). Stations are grouped according to their geographical category and are further sorted based on their dominant footprint. For each site/season, statistics are only presented when corresponding data availability is >75 %. Note that the same scale is used for coastal and mountain sites.
In contrast with polar sites, stations located in urban areas, both continental and coastal, exhibit the highest Ntot, with yearly medians in the range 103–104 cm−3. These sites, all located in Europe, also display a less pronounced seasonal variation (Fig. 9). Slightly greater median values are, nonetheless, observed during summer, when the atmospheric boundary layer (ABL) height is also increased relative to colder seasons. This suggests the presence of an additional source of aerosols in summer which compensates for the ABL height dilution effect, as recently discussed by Farah et al. (2020), who moreover suggested a photochemical or biogenic source. The overall weak seasonality observed in lowland urban areas is likely related to the contribution of very local sources which do not have any strong seasonal cycle (e.g. traffic). The local nature of the observations collected at urban sites is supported by the differences between the measurements performed at neighbouring sites (e.g. LEI and LEI-E).
Remaining sites, including mountain and non-urban continental and coastal stations, do not exhibit as clear a common behaviour as the sites located at high latitudes or in urban areas. They display, on average, intermediate Ntot, with yearly medians of the order of 102–103 cm−3. The signature of their dominant footprint is clear, with lower concentrations and stronger seasonal contrast observed in forested areas compared to rural background stations, while the distinction between the different geographical categories is in contrast less evident. Nonetheless, in agreement with previous observations from Asmi et al. (2011), particle concentrations measured at mountain sites tend to be lower compared to nearby lowland sites (e.g. SNB versus KOS). Mountain sites, and specifically those characterized by mixed footprints, tend to exhibit somewhat more pronounced seasonality relative to lowland stations. This likely results from the strong impact of ABL height variability which, together with the topography of the sites, governs the concentration of particles and their precursors transported at high altitudes (Collaud Coen et al., 2018). Specifically, the summer enhancement of Ntot observed at most of the mountain sites is certainly tightly connected to the increased frequency of ABL injections during this time of the year (e.g. Herrmann et al., 2015). Apart from the lower concentrations, observations collected at non-urban continental and coastal sites display similar seasonal variations as in urban areas, which are again likely explained by the concurrent variability of particle sources and ABL dynamics.
In short, particle concentrations are overall higher during warmer seasons at all sites as a result of enhanced sources, in connection with ABL dynamics for mountain sites. In addition, based on available MPSS data, the major contribution of Aitken-mode particles (30–100 nm) to the total particle number concentration also appears as a common feature of all environments. In contrast, the magnitude of the seasonal cycle of Ntot, together with the variations of the PNSD, exhibits some distinctive behaviour for the different geographical categories and footprint classes, with additional site-dependent characteristics. However, among other factors (including the nature and proximity of the particle sources), the level of anthropogenic influence appears to strongly affect the observations.
The AeroCom initiative has focused since 2002 on the evaluation of global aerosol models with observations (https://aerocom.met.no/). The recent generation of AeroCom models has been asked to provide additional diagnostics on dry scattering and absorption coefficients at ground level. These are currently being analysed by the two companion papers of Gliß et al. (2020) and Mortier et al. (2020) using 14 model simulations of present-day (2010 emissions and meteorology) to construct an ensemble mean AeroCom model and aerosol information extracted from SARGAN surface sites. For a detailed analysis of comparison for variability and trends, readers can refer to the two companion papers. Here we simply provide an overview of the AeroCom median model ensemble used for comparison with observations for the specific SARGAN sites.
7.1 Comparison of observed and modelled optical properties of aerosol particles
Overall, the performance of the model ensemble varies greatly as a function of station location, for both scattering and absorption coefficients. Figure 10a and b compare monthly medians observations and model median ensemble results for the grid point corresponding to the station location, for scattering and absorption coefficients, respectively. Results show an NMB – defined as (model − observation) ∕ observation – of, on average, −14 % between scattering by AeroCom models and observations, pointing to regional deficiencies in aerosol models. The NMB for absorption is smaller (4 %), indicating a better performance for this parameter by the AeroCom models. Obviously, there is, for both scattering and absorption, a large station-to-station variability in the bias, showing either good agreement, underprediction, or overprediction, depending on the site. There is also a significant variability of the NMB between models and observations when calculated for each season. This is also the conclusion of Gliß et al. (2020), which quantified the biases to −34 % and −20 % for scattering and absorption, respectively, and listed possible causes of the biases such as overestimate of scattering enhancement due to hygroscopic growth and the uncertainties in the treatment of absorption optical properties of black carbon, dust, and organic aerosol. At this stage, additional investigations are needed to identify what accounts for the observed differences between model and observations.
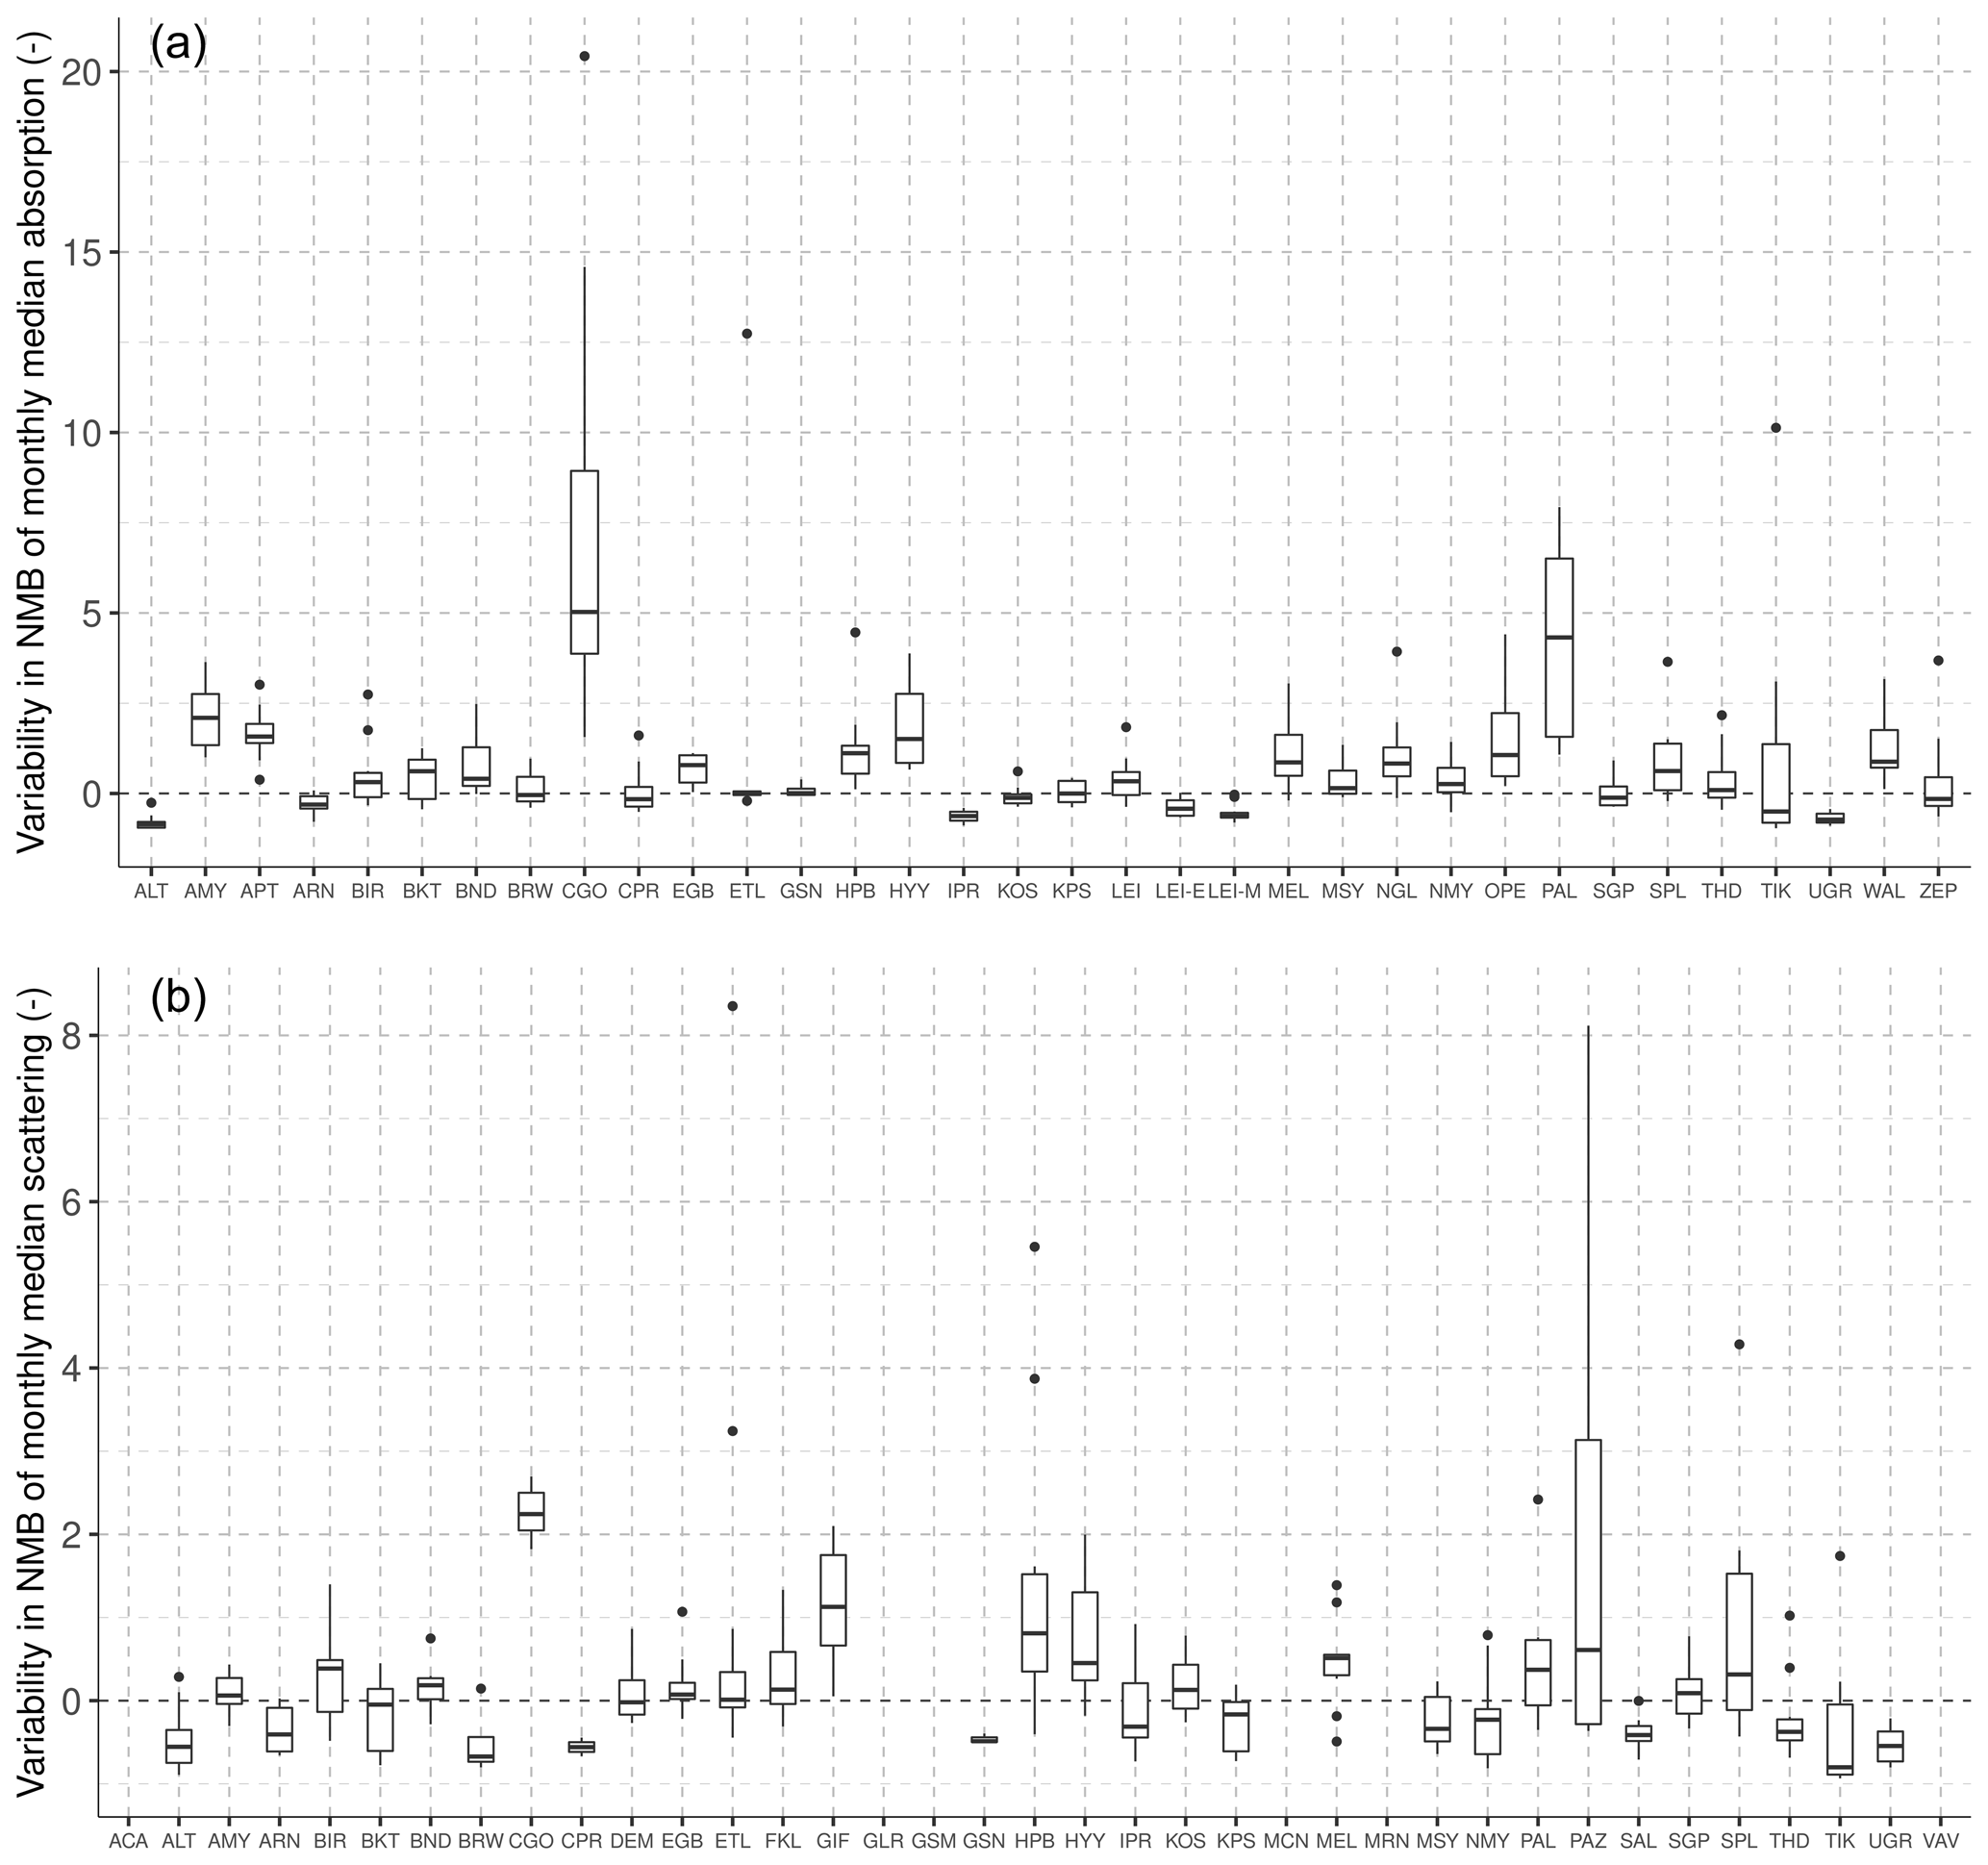
Figure 10(a) Boxplots of the normalized mean bias (NMB) for each SARGAN site, based on monthly median in situ observation and the corresponding monthly median AeroCom simulation result. For scattering coefficient. (b) Boxplots of the NMB for each SARGAN site, based on monthly median in situ observation and the corresponding monthly median AeroCom simulation result. For absorption coefficient.
7.2 Observed and modelled trends of aerosol optical properties
The issue of long-term trends for the aerosol in situ optical properties is specifically addressed in Collaud Coen et al. (2020a) using data from the WDCA extending back to 40 years for some stations. Collaud Coen et al. (2020a) derived time series of measured scattering, backscattering, and absorption coefficients as well as the derived single-scattering albedo, backscattering fraction, scattering, and absorption Ångström exponents at stations with at least 10 years of continuous observations. With respect to the previous trend assessment (Collaud Coen et al., 2013) which used data extending up to 2010, the number of stations with time series longer than 10 years has more than doubled (24 in 2010, 52 currently), so that the spatial coverage is improved and various additional environments are covered in Europe, North America, and in the polar regions. The few stations in Asia, Africa, South America, and in the Oceania/Pacific region cannot, however, be considered representative of their continents/regions, both because of their small number and also because mountainous and coastal environments are overrepresented relative to the continental environment with rural, forest, or desert footprints.
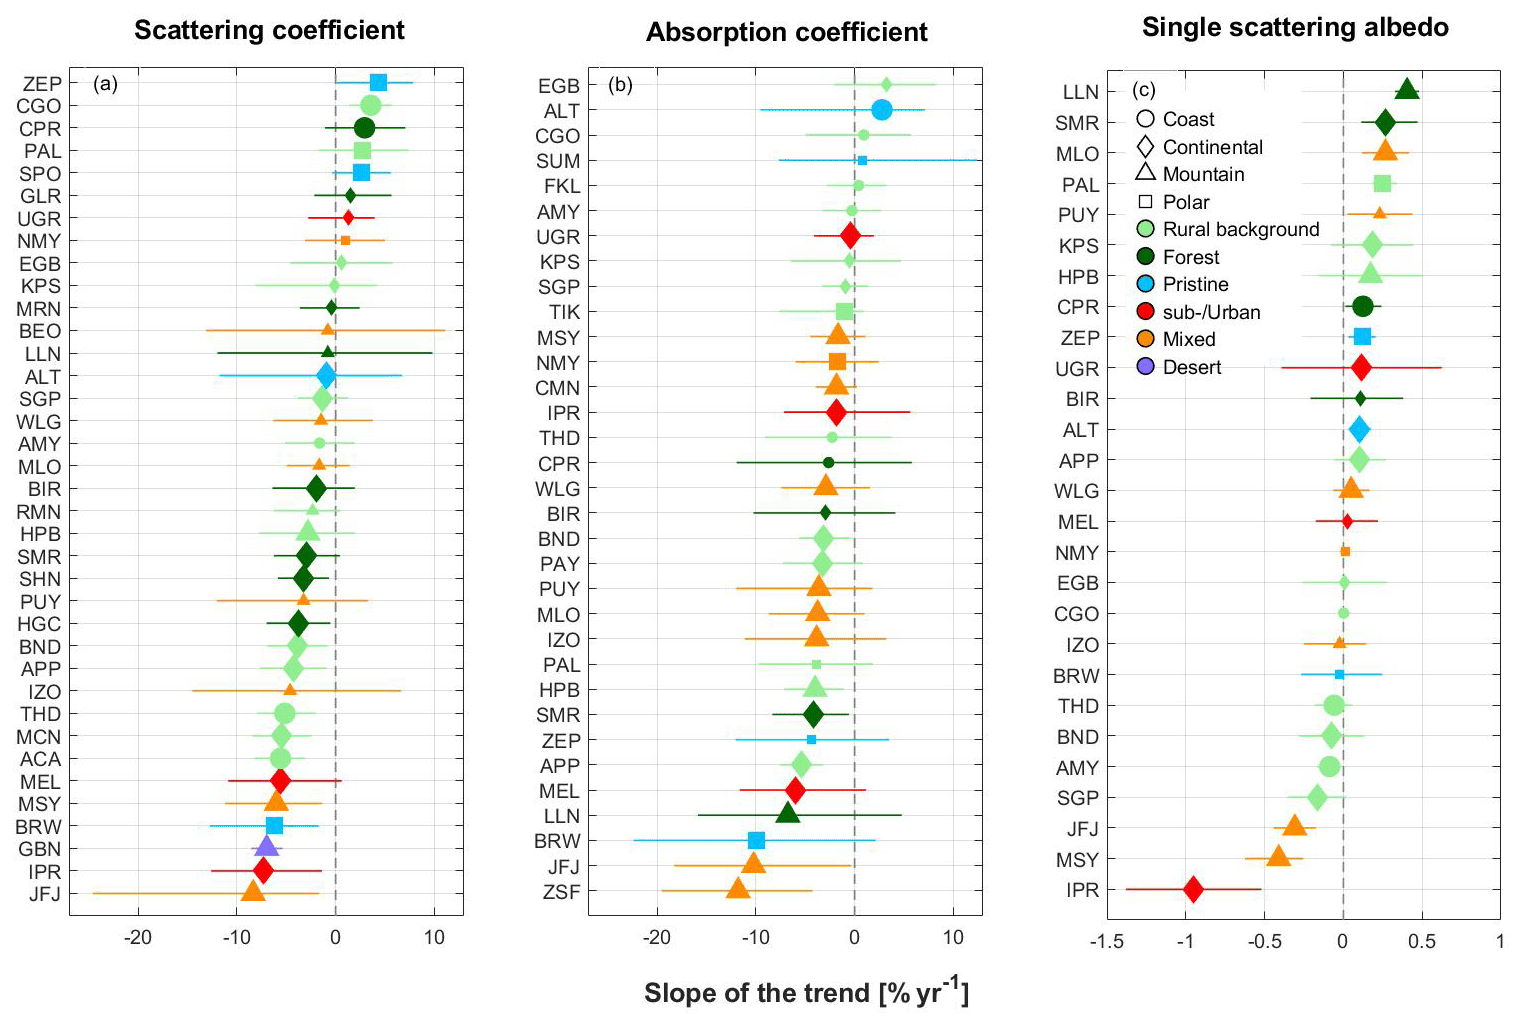
Figure 11Annual trends for (a) the scattering coefficient, (b) the absorption coefficient, and (c) the single-scattering albedo derived for SARGAN stations providing 10-year time series ending in 2016–2018. The larger symbols represent statistically significant trends at 95 % significance level derived from the Mann–Kendall seasonal test Collaud Coen et al., 2020). The lines are the 90 % confidence limit upper and lower confidence limits derived from Sen's slope estimator.
Methodologies and results are presented in detail in Collaud Coen et al. (2020a) and are simply summarized here for scattering and absorption coefficients as well as single-scattering albedo (Fig. 11). The non-parametric seasonal Mann–Kendall statistical test associated with several pre-whitening methods and with Sen's slope was used as the main trend analysis method (Collaud Coen et al., 2020c). Comparisons with general least mean square associated with autoregressive bootstrap (GLS/ARB) and with standard least mean square analysis (LMS) (Asmi et al., 2013; Collaud Coen et al., 2013) enabled confirmation of the detected MK statistically significant trends and the assessment of advantages and limitations of each method. For scattering coefficients, statistically significant increasing trends are found at polar and coastal stations with rural background, pristine, and forest footprints, whereas the largest statistically significant decreasing trends are primarily found at stations with mixed and urban footprints. Few mountainous stations have statistically significant scattering coefficient trends, whereas all of them have ss decreasing absorption coefficient trends. All stations have either statistically significant decreasing or not statistically significant trends in the absorption coefficient. The single-scattering albedo trends seem not to be dependent on either the environment or on the footprints but rather on the geographic area (Collaud Coen et al., 2020a).
Analysis of the long-term information provides evidence that the aerosol load has significantly decreased over the last 2 decades in the regions represented by the 52 stations. Currently, scattering and backscattering coefficients trends are mainly decreasing in Europe and North America and are not statistically significant in Asia. Polar stations exhibit a mix of increasing and decreasing trends. In addition to PAL, the northernmost European station that can be climatologically considered an Arctic station, ZEP and SPO also have statistically significant positive trends, whereas no statistically significant trend is found for the other Antarctic site (NMY). BRW and ALT both exhibit statistically significant negative 10-year trends. A few increasing trends are also found at some stations in North America and Australia. Absorption coefficients also exhibit mainly decreasing trends. Generally, these decreases in aerosol burden are expected to be a direct consequence of decreases in primary particles and particulate precursors such as SO2 and NOx due to pollution abatement policies.
The single-scattering albedo is one of the most important variables determining the direct radiative impact of aerosol, so that its trend analysis – derived for the first time from a large number of stations – has the largest climatic relevance. The global picture is nuanced with statistically significant positive trends mostly in Asia and eastern Europe and statistically significant negative trends in western Europe and North America leading to global positive median trend of 0.02 % yr−1. Fifteen stations exhibit a positive single-scattering albedo trend (relatively more scattering), while nine stations exhibit a negative trend (relatively more absorption).
Trends in scattering and absorption coefficients are also estimated by Mortier et al. (2020) using AeroCom and CMIP6 models that have simulated the historical evolution of aerosol properties. For both variables, simulated trends can reproduce SARGAN derived trends suggesting significant decreases found over North America and Europe, although it must be considered that the number of models providing trends in σap and σsp remains limited. Comparison with observations is also restricted to sites below 1000 m above sea level, which further reduces data points for comparisons. However, decreasing trends in AOD and sulfate are observed for North America and Europe for both model and observational data. Asian in situ surface data are too sparse to derive a regional trend for that region, but it is worth indicating that statistically insignificant AOD and sulfate trends are found in the overall period 2000–2014 over southern and eastern Asia. This suggests that there are different trends in aerosol burden between North America and Europe and Asia. From model data alone, a global trend can be derived. Globally, the average model trend for 2000–2014 amounts to an increase of +0.2 % yr−1 for σsp and +1.5 % yr−1 for σap, respectively, higher than what is observed at ground-based stations.
There are some discrepancies between the work of Collaud Coen et al. (2020a) and Mortier et al. (2020), in particular regarding trends derived for specific regions. This may result from different methods used to aggregate measurements to long time series or to differences in the time period (2000–2018 versus 2009–2018) but, overall, they both confirm the shift of polluting activities from the developed countries to the developing countries during the last 2 decades and may also demonstrate the relatively higher reduction of BC-rich emission in some regions, which will affect aerosol forcing estimates.
Climate observations are fundamental to many aspects related to prediction of future environmental changes and to meet the requirements of the UNFCCC and other conventions and agreements. The establishment of a global network of observations for assessment of atmospheric composition changes, adaptation to climate change, and monitoring the effectiveness of policies for limiting emission of pollutants and/or developing climate information services must define the specific observational requirements for efficiently addressing these issues.
8.1 SARGAN and GCOS principles
Measurement harmonization procedures allowing for direct comparison of data provided, together with the quality control and quality analyses performed all through the data provision chain, have considerably improved the value of SARGAN as an essential piece of the in situ segment of Earth observations for its specific climate-relevant variables. SARGAN addresses to all 10 basic principles of the WMO-IOC-UNEP-ICSU Global Climate Observing System (GCOS). GCOS is designed to meet the requirements for climate observations which are essential to climate monitoring and support implementation of UNFCCC and other climate conventions and agreements.
Table 4A description of the status of SARGAN with respect to the requirements for GCOS networks.

Considering the importance of aerosol properties in the Earth climate system, it is important to define the GCOS requirements for a number of variables that are, or may be in the future, defined as essential climate variables. Today, there are four aerosol GCOS ECV products: AOD, Single-Scattering Albedo, Aerosol Extinction Coefficient Profile, and Aerosol Layer Height. Only Single-Scattering Albedo is directly connected to SARGAN, although the GCOS aerosol variables are currently being revised to include ECVs connected to aerosol size, composition and hygroscopic properties. In its current state SARGAN is able to address the 10 basic GCOS Climate Monitoring Principles as follows (Table 4).
These requirements must include the spatial and temporal resolution of the observations, and their accuracy, precision, and long-term stability. For each requirement, one additional specification is required to identify (1) threshold or minimum requirement defined as the value that has to be met to ensure that data are useful, (2) goal or maximum requirement defined as the value above which further improvement gives no significant improvement in performance or cost of improvement would not be matched by a corresponding benefit likely to evolve as applications progress. In between “threshold” and “goal”, “breakthrough” is defined as an intermediate level that would lead, if implemented, to a significant improvement for the specific application.
It is clear that requirements are defined for specific application areas, in this case climate monitoring applications as defined in OSCAR (https://www.wmo-sat.info/oscar/applicationareas, last access: 11 August 2020). The Climate Monitoring application area is defined as such.
The WMO-IOC-UNEP-ICSU Global Climate Observing System (GCOS) is an internationally coordinated network of global observing systems for climate, designed to meet the requirements for climate observations, which are essential to climate monitoring. Climate observations are fundamental to detect, model, and assess climate change, support adaptation to climate change, monitor the effectiveness of policies for mitigating climate change, develop climate information services, promote sustainable national economic development, and meet other requirements of the UNFCCC and other conventions and agreements.
Observational requirements for other application areas have been recently published (Benedetti et al., 2018) or are currently underway as part of the WMO/GAW activities.
8.2 SARGAN requirement GCOS application area
With the specific definition, and considering the results presented in this paper, in companion SARGAN papers and in previous studies, the following requirements can be defined for SARGAN variables.
The threshold for spatial requirements in the horizontal scale for SARGAN can be defined as the distance between two observing points above which no redundancy is observed when measurements are performed in parallel. A few papers have addressed this issue by investigating the autocorrelation function between time series for different aerosol properties (Anderson, 2003; Sun et al., 2020) and they both lead to similar results related to observations at the ground: temporal variations of an intrinsic aerosol variable observed at the ground are no longer statistically correlated when stations are located more than several hundred kilometres apart. To be more specific, Sun et al. (2020) suggest that correlation of absorption coefficient time series from stations located 500 km apart is still approximately 0.5. A similar result is found for particle number in the 200–800 nm range, while the distance for a similar correlation of 0.5 for particles in the lower size range (10–30 nm) is of the order of 100 km. This, of course, depends on several parameters including the intensity of emissions surrounding the station, and efficiency of removal rates (dry and wet deposition). Interestingly, similar temporal correlations are observed in IAGOS (In-flight Atmospheric Global Observing System) for aerosol variables in the upper atmosphere (Ulrich Bundke, personal communication, 2019).
It is fair to consider that two stations located more than 1000 km apart will, therefore, for aerosol variables relevant to SARGAN, provide very little redundancy in their observations, especially if the stations are located over land. Assuming an advection velocity of 20 km h−1, 1000 km would correspond to approximately 2 d, which is shorter than the aerosol typical lifetime over continents. For observations over the oceans, it is clear that a larger threshold could be considered, corresponding to a turn-over time of approximately a week (i.e. several thousands of kilometres). The threshold for the observation of climate-relevant parameters in SARGAN can, therefore, reasonably be set at 1000 km, while breakthrough and goals for the spatial resolution can, accordingly, be set at 500 and 100 km, respectively. A 100 km spatial resolution would serve the purpose of deriving radiative forcing estimates at scales typical of a large urban area, together with providing information extremely relevant for model and space-based observations. These indicated horizontal requirements for threshold, breakthrough, and goal would require models to provide information on approximately resolution grids for goal, which is now often achieved.
Considering a total land area in Europe of approximately 10 M km2 (thus only including the Russian territory in geographical Europe) and 63 measurement stations in operation (see Table 3), the measurement density in Europe is close to requirements for “breakthrough”. It is even close to the “goal” level if Russia is not considered. In North America, it is close to “threshold” (28 stations for 24 M km2) and between recommended values for threshold and breakthrough for US territory only, including Alaska (21 stations over approximately 10 M km2). For all other regions of the world, the situation is below that recommended for minimal sampling, illustrating the huge gaps in network density.
Because SARGAN is based on individual observation points at the surface, the issue of vertical resolution is not relevant. However, the value of measuring both in the boundary layer and in the free troposphere is clear for many applications. Requirements for temporal resolution can be derived in a simpler way, considering that time-series data sets are often provided on a month-by-month variation in climate over long time periods. Monthly data sets allow many variations in climate to be studied and can be considered a threshold as long as the data are generated by representative original data sets. Information provided with a temporal resolution of 1 d are suitable for addressing issues related to cloud cover, precipitation, impact of temperature, emissions, etc., and can be considered a breakthrough, while the 1 h resolution is a requirement for many applications such as estimating aerosol fluxes or radiative impact of aerosol plumes.
The maximum time lag between observations and the data being freely available is, for most applications, of the order of 1 year (threshold), although data providers are more and more requested to provide information on a shorter timescale, with a 24 h delay and near-real time (6 h delay) corresponding to the “breakthrough” and “goal” levels, respectively.
The definition of requirements for GCOS also asks to establish a level of uncertainty which accounts for all quantifiable uncertainties. In the case of in situ aerosol variables, requirements for the measurement uncertainties can be derived from the observed variability on the different temporal scales, which is quite large. We have used suggested uncertainties provided in Table 2 for CN, σsp, and σap. Uncertainties of ω0 are proposed following procedures of Sherman et al. (2015).
Table 5Proposed requirements for GCOS application area for SARGAN variables.
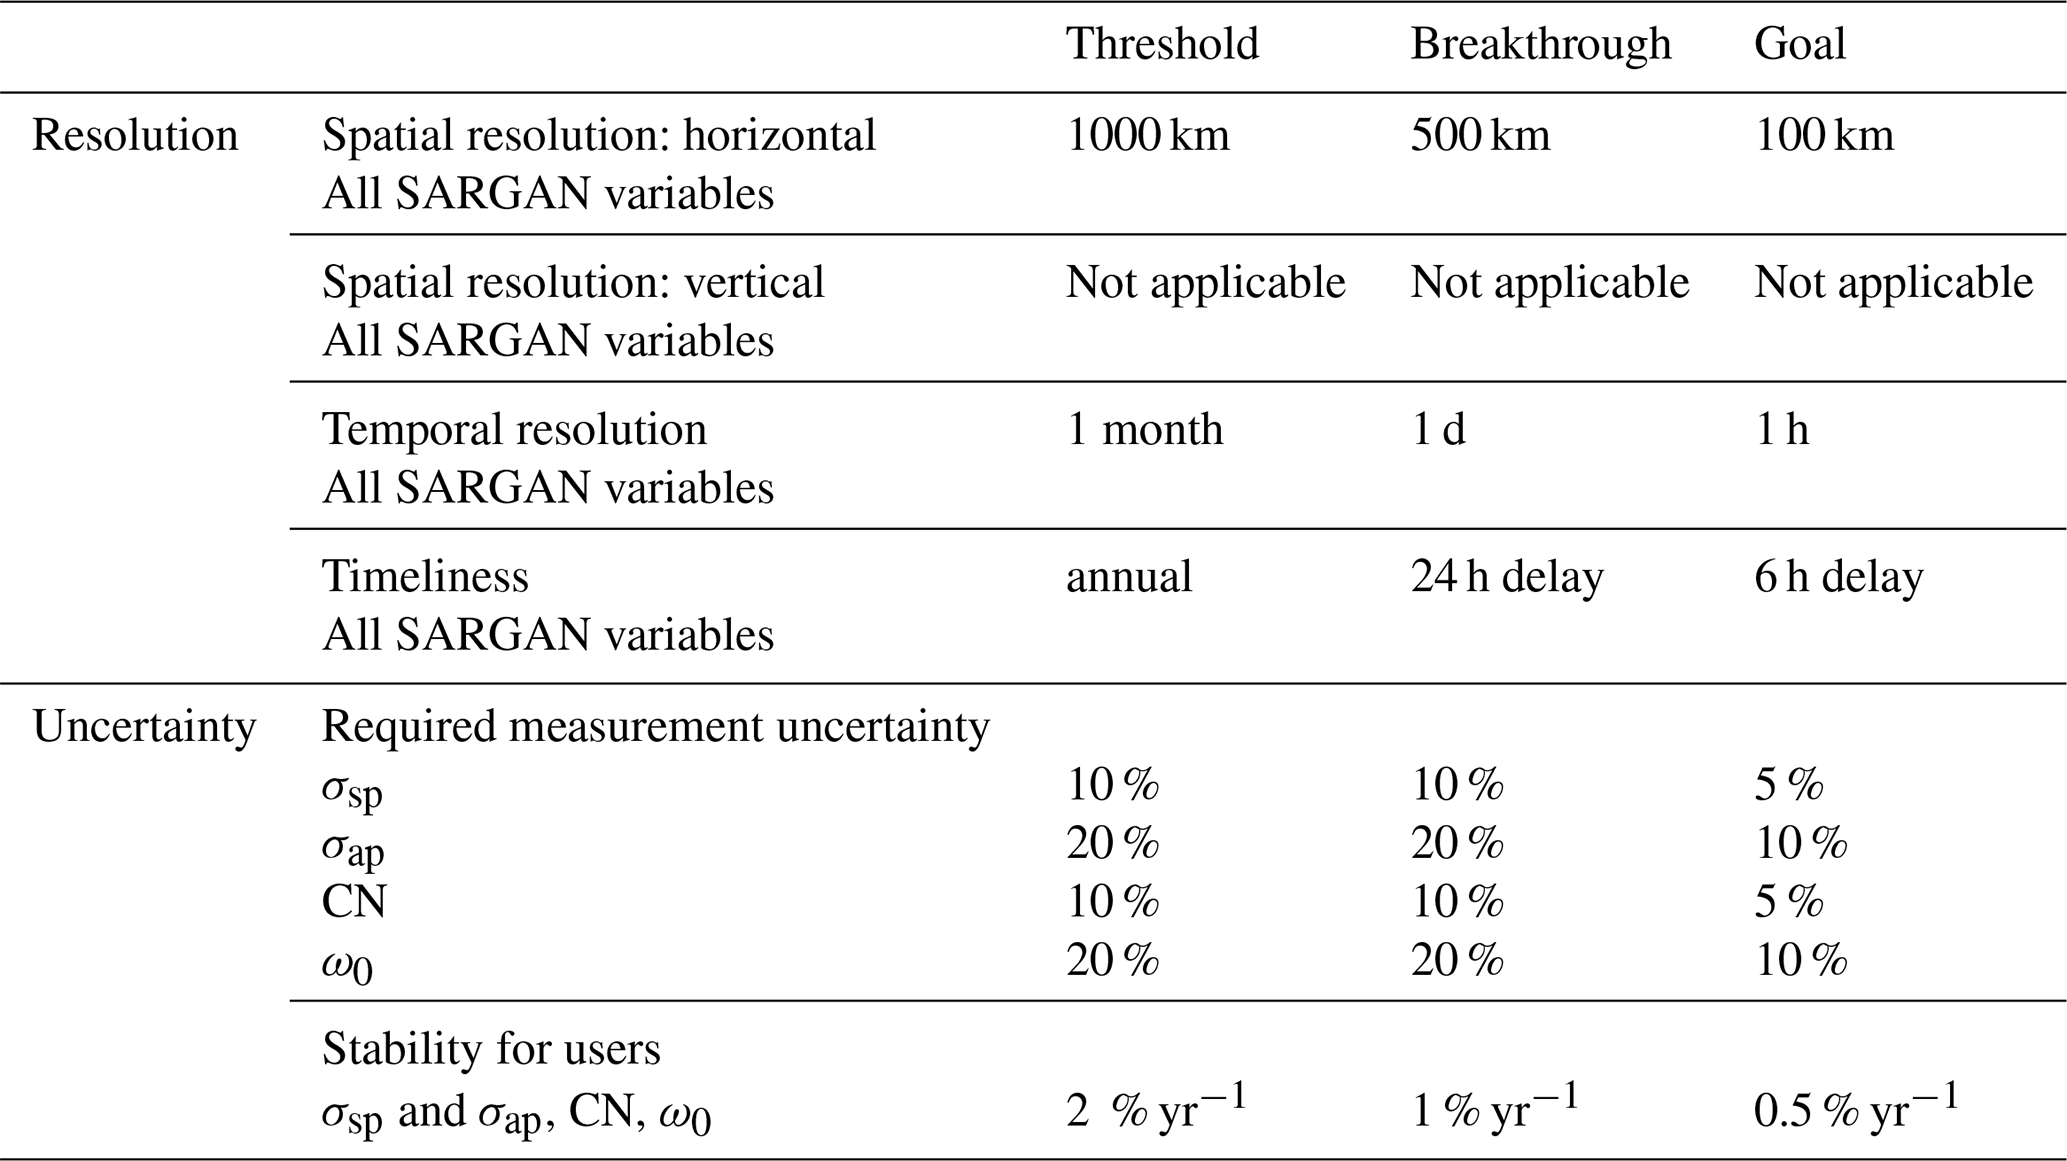
Stability is defined as the maximum permissible cumulative effect of systematic changes in the measurement system to allow long-term climate records compiled from assorted measurement systems. For the optical properties, Collaud Coen et al. (2020a) observed mainly decreasing trends for scattering and absorption coefficients in Europe and North America, while no trend or a mix of increasing and decreasing trends are observed in other parts of the world. When statistically significant, trends derived by Collaud Coen et al. (2020a) for optical properties are of the order of a few (<2) % yr−1 maximum. This defines, for regions where trends are detectable, the threshold requirement for stability since expected trends would not be detectable with higher stability values. Carslaw et al. (2010) estimated the change in aerosol radiative forcing due to climate feedbacks in emission of aerosol precursors from natural systems. They show that a radiative perturbation approaching 1 W m−2 is possible by the end of the century. Detecting and attributing changes to a climate feedback due to changing natural emissions (wildfires, biogenic organic volatile compounds) would require a much lower uncertainty than currently achieved for CN, σsp, and σap and consequently ω0. At this stage, without more information on trends, we are recommending values for stability of 1 % yr−1 for breakthrough and 0.5 % yr−1 for goal for all variables. Requirements for the GCOS application area for σsp, σap, CN, and ω0 are summarized in Table 5.
The present article must be seen as the foundational framework for the observation of aerosol properties collected near surface from ground-based stations worldwide, in the context of the GAW. SARGAN completes a ground-based aerosol observing system composed additionally of the GAW-associated networks GALLION and PFR. SARGAN relies on its regional constituents in the different WMO regions, of which ACTRIS in Europe and NOAA-FAN in the US are the principal contributors.
Although not fully implemented and operational, SARGAN sites share common methodological approaches for measurement and data quality control and a common objective to open access for all data, which are all defined as part of the Global Atmosphere Watch Scientific advisory group on aerosol. Data provision is currently operational, with some sites providing information for more than several decades. The very strong motivation in the early 2000s to develop observations of aerosol climate-relevant parameters led to a substantial increase in operating ground-based stations and availability of data time series with the required level of quality. We consider that the degree of integration of the different providers to SARGAN has reached a mature level which has resulted in more and more users of the data worldwide.
The current SARGAN database can be used for many different applications. In this article, it is limited to very basic statistical descriptions, comparing variability of four SARGAN parameters at 89 sites and a preliminary approach to compare model and observations for the relevant variables. In the associated companion papers long-term climatological trends are derived by Collaud Coen et al. (2020a) for the optical aerosol properties showing for the first time an unequivocal decrease in scattering and absorption coefficient in Europe, following a tendency already detectable in the US several years ago. Model studies (e.g. Mortier et al., 2020) find similar trends to the observations in North America and Europe. Open access to the SARGAN database should enhance the potential for many other applications. Analysis of trends for number concentration is already under way, but we assume that SARGAN data can be efficiently used to support many types of studies related to aerosol impact on air quality, health or climate, quantification of emission sources, or the development of early-warning services.
The SARGAN initiative is currently limited to four variables that are directly observed. They are the only four climate-relevant aerosol variables measured near surface for which a relatively consistent coverage exists worldwide. Providing constraints on radiative forcing estimates would obviously require knowledge of trends and variability for other variables, such as aerosol chemical composition or number concentration of cloud condensation nuclei. Unfortunately, very few sites are currently including these variables in their observation programme, and they are mostly located in Europe as part of ACTRIS. It is clearly a huge and key challenge for the community to extend observations to additional variables, in particular for sites located outside Europe.
The distribution of sites providing information to SARGAN confirms the analysis made in many earlier reports and in Laj et al. (2010): a very strong bias still exists in the world data coverage, with Europe and the US well represented and observations lacking in many other regions, in particular over WMO region III (Africa) and IV (Latin American and Caribbean), Russia, and large parts of Asia. Causes may be connected to difficulties making data accessible through the World Data Centers in some cases, but for many areas of the world, it is directly related to lacking measurements. Detecting atmospheric trends of key atmospheric compounds requires long (>10 years) high-quality records and, despite many initiatives, only a very few stations have managed to maintain operations for observing composition changes over more than a decade.
Laj et al. (2019) recently proposed a series of recommendations to support atmospheric observations in emerging economies. Demonstrating how climate data/information have direct relevance to policy making and explaining the local benefits that monitoring atmospheric composition changes bring to the country in terms of socio-economic impacts in both the short and longer terms may help engage national stakeholders to commit to maintain and develop observation sites. Stimulating the demand for climate observations/climate information of the kind provided by SARGAN at the user level in the countries concerned would be absolutely important. The European concept of atmospheric research infrastructures, such as ACTRIS, was key to securing the necessary long-term engagement in the EU countries to support SARGAN observations. Similar approaches can be proposed and adapted to the different WMO regions.
In a recent comment in Nature, Kulmala (2018) suggested the establishment of 1000 or more well-equipped ground stations around the world tracking environments and key ecosystems, thus sampling beyond the observation of atmospheric composition only. Establishing observation sites with core measurement capabilities documenting key atmospheric components (greenhouse gases, reactive gases, aerosol properties) together with basic meteorology, operated by skilled personnel and providing access to measurement data in countries where this is still lacking, would require a large-scale coordinated effort that is far from being out of reach. Investments for atmospheric monitoring would be anywhere between USD 0.5 million and USD 1 million and annual operations between USD 50 000 and USD 100 000 and two to three FTEPs (full-time equivalent persons) per site.
There is a growing number of multilateral climate finance initiatives designed to help developing countries address the challenges of climate change and air quality. They have a role in capacity building, researching, piloting, and demonstrating new approaches and technologies and are perfectly suited to be used for developing the needed atmospheric component of a global Earth observing system. A “one nation, one station” approach to establish at least one reference station in each country where information is lacking would definitely add essential information to large-scale modelling but also support local research and national policymakers and promote business development for environmental services such as early warnings for extreme weather and atmospheric hazards.
Data are freely available with https://doi.org/10.21336/7f34-8j17 (Laj et al., 2020).
The supplement related to this article is available online at: https://doi.org/10.5194/amt-13-4353-2020-supplement.
PL, AB, CR, EA, CLM, MCC, YL, AW, MS, JAO, MF, JG, AM, MP, TP, SWK, WA, JPP, OMB, MK, and LL defined the concept and methodology of the paper, led the investigation, and supervised the whole process. Curation of data was done by CLM, YL, and MF as part of the duties of the World Data Center for Aerosol. The formal analysis of data sets was done by PL, AB, CR, EA, CLM, MCC, MS, JG, and AM. All the authors have contributed to the necessary funding for the provision of data used in the paper, Validation of results is under the responsibility of PL, AB, CR, EA, CLM, MCC, YL, AW, MS, JG, and AM, while visualization was done by PL, AB, CR, EA, CLM, MCC, YL, and MS. The original draft was written by PL, AB, CR, EA, CLM, MCC, AW, MS, JAO, MF, JG, and OMB, while review and editing was done by PL, AB, CR, EA, CLM, MCC, AW, MS, JAO, MF, JG, OMB, MP, TP, SWK, WA, JPP, and MK.
The authors declare that they have no conflict of interest.
NOAA base supports the following observatories: BRW, BND, MLO, SMO, SUM, SPO, and THD, where efforts of the dedicated observatory staff and of programmer Derek Hageman are appreciated.
IZO measurements are financed by AEMET. The effort and dedication of the staff of the Izaña Observatory in maintaining the instruments are greatly appreciated. Acquisition and data curation were partially financed by European ERDF funds through different Spanish R&D projects of the Spanish Ministerio de Economía, Industria y Competitividad.
CPT is grateful to NOAA ESRL for their continued academic and technical support of the Cape Point aerosol measurements, and the staff from the South African Weather Service, who contributed to the generation of the data records reported here.
Measurements at Welgegund are supported by North-West University, the University of Helsinki, and the Finnish Meteorological Institute.
Pallas and SMEAR II are grateful for the support of the Academy of Finland Centre of Excellence programme (project no. 272041), the Academy of Finland project Greenhouse gas, aerosol and albedo variations in the changing Arctic (project no. 269095), and the Novel Assessment of Black Carbon in the Eurasian Arctic: From Historical Concentrations and Sources to Future Climate Impacts (NABCEA, project no. 296302).
Aerosol measurements at Anmyon-do were supported by Korea Meteorological Administration Research and Development Program “Development of Monitoring and Analysis Techniques for Atmospheric Composition in Korea” under grant KMA2018-00522. Measurements at Gosan were supported by the National Research Foundation of Korea (2017R1D1A1B06032548) and the Korea Meteorological Administration Research and Development Program under grant KMI2018-01111.
The Lulin station is operated under the grants funded by the Taiwan Environmental Protection Administration.
Sites PDM, PUY, GIF, CHC, and RUN are partially operated with the support of CNRS-INSU under the long-term observation programme and the French Ministry for Research under the ACTRIS-FR national research infrastructure. PDM and GIF received specific support of the French Ministry of the Environment. ATMO Occitanie is mentioned for sampling operations at PDM. Measurements at SIRTA are hosted by CNRS and by the alternative energies and atomic energy commission (CEA) with additional contributions from the French Ministry of the Environment through its funding to the reference laboratory for air quality monitoring (LCSQA). PUY is grateful for support from ATMO Auvergne Rhône Alpes for sampling operations and the support from the personnel of the Observatoire de Physique du Globe de Clermont-Ferrand (OPGC). The specific support of the Institut de Recherche et Développement (IRD) in France and the Universidad Mayor de San Andres in Bolivia support operations at CHC operations.
Measurements at IMPROVE sites are grateful for the support of the US Environmental Protection Agency as the primary funding source, with contracting and research support from the National Park Service. The Steamboat Ski Resort provided logistical support and in-kind donations for SPL. The Desert Research Institute is a permittee of the Medicine-Bow Routt National Forests and an equal opportunity service provider and employer. SPL appreciates the extensive assistance of the NOAA/ESRL Federated Aerosol Network, of Ian McCubbin, site manager of SPLand, and of Ty Atkins, Joe Messina, Dan Gilchrist, and Maria Garcia, who provided technical assistance with the maintenance and data quality control for the aerosol instruments.
Cape Grim Baseline Air Pollution Monitoring Station is grateful to the Australian Bureau of Meteorology for their long-term and continued support and all the staff from the Bureau of Meteorology and CSIRO, who have contributed to the generation of records reported here.
The aerosol measurements at the Jungfraujoch were conducted with financial support from MeteoSwiss (GAW-CH aerosol monitoring programme) and from the European Union as well as the Swiss State Secretariat for Education, Research and Innovation (SERI) for the European Research Infrastructure for the observation of Aerosol, Clouds and Trace Gases (ACTRIS). The International Foundation High Altitude Research Station Jungfraujoch and Gornergrat (HFSJG) is mentioned for providing the research platform at the Jungfraujoch.
The aerosol measurements at Kosetice received funding from the European Union's Horizon 2020 research and innovation programme under grant agreement no. 654109 and from the project for support of national research infrastructure ACTRIS – participation of the Czech Republic (ACTRIS-CZ – LM2015037) supported by the Ministry of Education, Youth and Sports of CR within National Sustainability Program I (NPU I), grant agreement no. LO1415. The measurements were also supported by ERDF “ACTRIS-CZ RI” (no. CZ.02.1.01/0.0/0.0/16_013/0001315).
Measurements at the Madrid site were funded by the following projects: CRISOL (CGL2017–85344-R MINECO/AEI/FEDER, UE), TIGAS-CM (Madrid Regional Government Y2018/EMT-5177), AIRTEC-CM (Madrid Regional Government P2018/EMT4329), and REDMAAS2020 (RED2018-102594-T CIENCIA). Measurements at Montsec and Montseny were supported by the Spanish Ministry of Economy, Industry and Competitiveness and FEDER funds under project HOUSE (CGL2016-78594-R), and by the Generalitat de Catalunya (AGAUR 2017 SGR41 and the DGQA). Aerosol measurements at El Arenosillo Observatory are supported by the National Institute for Aerospace Technology and by different R&D projects of the Ministerio Español de Economía, Industria y Competitividad (MINECO). Optical data acquisition would not be possible without the support of the NOAA/ESRL/GMD.
FKL and DEM are grateful for funding by project PANhellenic infrastructure for Atmospheric Composition and climate change (MIS 5021516) which is implemented under action Reinforcement of the Research and Innovation Infrastructure, funded by operational programme Competitiveness, Entrepreneurship and Innovation (NSRF 2014-2020) and co-financed by Greece and the European Union (European Regional Development Fund).
At CMN, aerosol measurements were partially supported by the Italian Ministry of Research and Education.
Measurements at Birkenes II are financed by the Norwegian Environment Agency.
Diabla Gora and Zielonka are grateful for the data from the Chief Inspectorate of Environmental Protection, State Environmental Monitoring. Measurements of absorption at IRB were performed by Aerosol d.o.o., Ljubljana, Slovenia.
VAV is grateful for various Swedish FORMAS, Swedish Research Council (VR) grants and the Magnus Bergvall and Märta och Erik Holmberg foundations and Swedish EPA for making the research possible at the VAV site.
NMY wishes to thank the many technicians and scientists of the Neumayer overwintering crews, whose outstanding commitment enabled continuous, high-quality aerosol records over many years.
This research was supported by the European Commission's Horizon 2020 Framework Programme (ACTRIS-2 (grant agreement no. 654109)); AEMET; European ERDF funds through different Spanish R&D projects of the Spanish Ministerio de Economía, Industria y Competitividad; the North-West University; the University of Helsinki; the Finnish Meteorological Institute; the Academy of Finland Centre of Excellence programme (project no. 272041); the Academy of Finland project Greenhouse gas, aerosol and albedo variations in the changing Arctic (project no. 269095); the Novel Assessment of Black Carbon in the Eurasian Arctic: From Historical Concentrations and Sources to Future Climate Impacts (NABCEA, project no. 296302); the Korea Meteorological Administration Research and Development Program “Development of Monitoring and Analysis Techniques for Atmospheric Composition in Korea” (grant no. KMA2018-00522); the National Research Foundation of Korea (grant no. 2017R1D1A1B06032548); the Korea Meteorological Administration Research and Development Program (grant no. KMI2018-01111); the Taiwan Environmental Protection Administration; CNRS-INSU; French Ministry for Research under the ACTRIS-FR national research infrastructure; French Ministry of the Environment; US Environmental Protection Agency; MeteoSwiss (GAW-CH aerosol monitoring programme); the Swiss State Secretariat for Education, Research and Innovation (SERI); Ministry of Education, Youth and Sports of CR within National Sustainability Program I (NPU I, grant no. LO1415); ERDF “ACTRIS-CZ RI” (grant no. CZ.02.1.01/0.0/0.0/16_013/0001315); CRISOL (CGL2017-85344-R MINECO/AEI/FEDER, UE); TIGAS-CM (Madrid Regional Government Y2018/EMT-5177); AIRTEC-CM (Madrid Regional Government P2018/EMT4329); REDMAAS2020 (RED2018-102594-T CIENCIA); the Spanish Ministry of Economy, Industry and Competitiveness; FEDER funds (project HOUSE, grant no. CGL2016-78594-R); the Generalitat de Catalunya (AGAUR 2017 SGR41 and the DGQA); the National Institute for Aerospace Technology; the Ministerio Español de Economía, Industria y Competitividad (MINECO); NOAA/ESRL/GMD; PANhellenic infrastructure for Atmospheric Composition and climate change (MIS 5021516); Research and Innovation Infrastructure; Competitiveness, Entrepreneurship and Innovation (grant no. NSRF 2014-2020); the Italian Ministry of Research and Education; the Norwegian Environment Agency; Swedish FORMAS; Swedish Research Council (VR); the Magnus Bergvall foundation; the Märta och Erik Holmberg foundation; and the Swedish EPA.
This paper was edited by Charles Brock and reviewed by two anonymous referees.
Aas, W., Mortier, A., Bowersox, V., Cherian, R., Faluvegi, G., Fagerli, H., Hand, J., Klimont, Z., Galy-Lacaux, C., Lehmann, C. M. B., Lund Myhre, C., Oliviè, D., Sato, K., Quaas, J., Rao, P. S. P., Schulz, M., Shindell, D., Skeie, R. B., Stein, A., Takemura, T., Tsyro, S., Vet, R., and Xu, X.: Global and regional trends of atmospheric sulfur, Sci. Reports, 9, 1–11, https://doi.org/10.1038/s41598-018-37304-0, 2019.
Anderson, T. L., Charlson, R. J., Bellouin, N., Boucher, O., Chin, M., Christopher, S. A., Haywood, J., Kaufman, Y., Kinne, S., Ogren, J. A., Remer, L. A., Takemura, T., Tanre, D., Torres, O., Trepte, C. R., Wielicki, B. A., Winker, D. M., and Yu, H.: An `A-Train' strategy for quantifying direct climate forcing by anthropogenic aerosols, B. Am. Meteorol. Soc., 86, 1795–1809, https://doi.org/10.1175/BAMS-86-12-1795, 2005.
Anderson, T. L. and Ogren, J. A.: Determining aerosol radiative properties using the TSI 3563 Integrating Nephelometer, Aerosol Sci. Tech., 29, 57–69, https://doi.org/10.1080/02786829808965551, 1998.
Anderson, T. L., Charlson, R. J., Winker, D. M., Ogren, J. A., and Holmen, K.: Mesoscale Variations of Tropospheric Aerosols, J. Atmos. Sci., 60.1, 119–136, https://doi.org/10.1175/1520-0469(2003)060<0119:MVOTA>2.0.CO;2, 2003.
Andrews, E., Ogren, J. A., Bonasoni, P., Marinoni, A., Cuevas, E., Rodriguez, S., Sun, J. Y., Jaffe, D. A., Fischer, E. V., Baltensperger, U., Weingartner, E., Collaud Coen, M., Sharma, S., Macdonald, A. M., Leaitch, W. R., Lin, N.-H., Laj, P., Arsov, T., Kalapov, I., Jefferson, A., and Sheridan, P. J.: Climatology of aerosol radiative properties in the free troposphere, Atmos. Res., 102, 365–393, https://doi.org/10.1016/j.atmosres.2011.08.017, 2011.
Andrews, E., Sheridan, P., Ogren, J. A., Hageman, D., Jefferson, A., Wendell, J., Alastuey, A., Alados-Arboledas, L., Bergin, M., Ealo, M., Hallar, A. G., Hoffer, A., Kalapov, I., Keywood, M., Kim, J., Kim, S.-W., Kolonjari, F., Labuschagne, C., Lin, N.-H., Macdonald, A., Mayol-Bracero, O. L., McCubbin, I. B., Pandolfi, M., Reisen, F., Sharma, S., Sherman, J. P., Sorribas, M., and Sun, J.: Overview of the NOAA/ESRL Federated Aerosol Network, B. Am. Meteorol. Soc., 100, 123–135, https://doi.org/10.1175/BAMS-D-17-0175.1, 2019.
Asmi, A., Collaud Coen, M., Ogren, J. A., Andrews, E., Sheridan, P., Jefferson, A., Weingartner, E., Baltensperger, U., Bukowiecki, N., Lihavainen, H., Kivekäs, N., Asmi, E., Aalto, P. P., Kulmala, M., Wiedensohler, A., Birmili, W., Hamed, A., O'Dowd, C., Jennings, S., Weller, R., Flentje, H., Fjaeraa, A. M., Fiebig, M., Myhre, C. L., Hallar, A. G., Swietlicki, E., Kristensson, A., and Laj, P.: Aerosol decadal trends – Part 2: In-situ aerosol particle number concentrations at GAW and ACTRIS stations, Atmos. Chem. Phys., 13, 895–916, https://doi.org/10.5194/acp-13-895-2013, 2013.
Asmi, A., Wiedensohler, A., Laj, P., Fjaeraa, A.-M., Sellegri, K., Birmili, W., Weingartner, E., Baltensperger, U., Zdimal, V., Zikova, N., Putaud, J.-P., Marinoni, A., Tunved, P., Hansson, H.-C., Fiebig, M., Kivekäs, N., Lihavainen, H., Asmi, E., Ulevicius, V., Aalto, P. P., Swietlicki, E., Kristensson, A., Mihalopoulos, N., Kalivitis, N., Kalapov, I., Kiss, G., de Leeuw, G., Henzing, B., Harrison, R. M., Beddows, D., O'Dowd, C., Jennings, S. G., Flentje, H., Weinhold, K., Meinhardt, F., Ries, L., and Kulmala, M.: Number size distributions and seasonality of submicron particles in Europe 2008–2009, Atmos. Chem. Phys., 11, 5505–5538, https://doi.org/10.5194/acp-11-5505-2011, 2011.
Beddows, D. C. S., Dall'Osto, M., Harrison, R. M., Kulmala, M., Asmi, A., Wiedensohler, A., Laj, P., Fjaeraa, A. M., Sellegri, K., Birmili, W., Bukowiecki, N., Weingartner, E., Baltensperger, U., Zdimal, V., Zikova, N., Putaud, J.-P., Marinoni, A., Tunved, P., Hansson, H.-C., Fiebig, M., Kivekäs, N., Swietlicki, E., Lihavainen, H., Asmi, E., Ulevicius, V., Aalto, P. P., Mihalopoulos, N., Kalivitis, N., Kalapov, I., Kiss, G., de Leeuw, G., Henzing, B., O'Dowd, C., Jennings, S. G., Flentje, H., Meinhardt, F., Ries, L., Denier van der Gon, H. A. C., and Visschedijk, A. J. H.: Variations in tropospheric submicron particle size distributions across the European continent 2008–2009, Atmos. Chem. Phys., 14, 4327–4348, https://doi.org/10.5194/acp-14-4327-2014, 2014.
Benedetti, A., Reid, J. S., Knippertz, P., Marsham, J. H., Di Giuseppe, F., Rémy, S., Basart, S., Boucher, O., Brooks, I. M., Menut, L., Mona, L., Laj, P., Pappalardo, G., Wiedensohler, A., Baklanov, A., Brooks, M., Colarco, P. R., Cuevas, E., da Silva, A., Escribano, J., Flemming, J., Huneeus, N., Jorba, O., Kazadzis, S., Kinne, S., Popp, T., Quinn, P. K., Sekiyama, T. T., Tanaka, T., and Terradellas, E.: Status and future of numerical atmospheric aerosol prediction with a focus on data requirements, Atmos. Chem. Phys., 18, 10615–10643, https://doi.org/10.5194/acp-18-10615-2018, 2018.
Bian, H., Chin, M., Hauglustaine, D. A., Schulz, M., Myhre, G., Bauer, S. E., Lund, M. T., Karydis, V. A., Kucsera, T. L., Pan, X., Pozzer, A., Skeie, R. B., Steenrod, S. D., Sudo, K., Tsigaridis, K., Tsimpidi, A. P., and Tsyro, S. G.: Investigation of global particulate nitrate from the AeroCom phase III experiment, Atmos. Chem. Phys., 17, 12911–12940, https://doi.org/10.5194/acp-17-12911-2017, 2017.
Bodhaine, B. A.: Aerosol absorption measurements at Barrow, Mauna Loa and the South Pole, J. Geophys. Res., 100, 8967–8975, 1995.
Bodhaine, B. A.: Aerosol measurements at four background sites, J. Geophys. Res., 88, 10753–10768, https://doi.org/10.1029/JC088iC15p10753, 1983.
Bond, T. C., Anderson, T. L., and Campbell, D.: Calibration and intercomparison of filter-based measurements of visible light absorption by aerosols, Aerosol Sci. Technol., 30, 582–600, https://doi.org/10.1080/027868299304435, 1999.
Bond, T. C., Doherty, S. J., Fahey, D. W., Forster, P. M., Berntsen, T., DeAngelo, B. J., Flanner, M. G., Ghan, S., Kärcher, B., Koch, D., Kinne, S., Kondo, Y., Quinn, P. K., Sarofim, M. C., Schultz, M. G., Schulz, M., Venkataraman, C., Zhang, H., Zhang, S., Bellouin, N., Guttikunda, S. K., Hopke, P. K., Jacobson, M. Z., Kaiser, J. W., Klimont, Z., Lohmann, U., Schwarz, J. P., Shindell, D., Storelvmo, T., Warren, S. G., and Zender, C. S.: Bounding the role of black carbon in the climate system: A scientific assessment, J. Geophys. Res., 118, 5380–5552, https://doi.org/10.1002/jgrd.50171, 2013.
Bukowiecki, N., Steinbacher, M., Henne, S., Nguyen, N. A., Nguyen, X. A., Hoang, A. L., Nguyen, D. L., Duong, H. L., Engling, G., Wehrle, G., Gysel-Beer, M., and Baltensperger, U.: Effect of Large-scale Biomass Burning on Aerosol Optical Properties at the GAW Regional Station Pha Din, Vietnam, Aerosol Air Qual. Res., 19, 1172–1187, https://doi.org/10.4209/aaqr.2018.11.0406, 2019.
Burgos, M., Andrews, E., Titos, G., Alados-Arboledas, L., Baltesperger, U., Day, D., Jefferson, A., Kalivitis, N., Kouvarakis, G., Mihalopoulos, N., Sherman, J. P., Sun, J., Weingartner, E., and Zieger, P.: Data Descriptor: A global view on the effect of water uptake on aerosol particle light scattering, Sci. Data, 6, 157, https://doi.org/10.1038/s41597-019-0158-7, 2019.
Carslaw, K. S., Lee, L. A., Reddington, C. L., Pringle, K. J., Rap, A., Forster, P. M., Mann, G. W., Spracklen, D. V., Woodhouse, M. T., Regayre, L. A., and Pierce, J. R.: Large contribution of natural aerosols to uncertainty in indirect forcing, Nature, 503, 69, https://doi.org/10.1038/nature12674, 2013.
Carslaw, K. S., Boucher, O., Spracklen, D. V., Mann, G. W., Rae, J. G. L., Woodward, S., and Kulmala, M.: A review of natural aerosol interactions and feedbacks within the Earth system, Atmos. Chem. Phys., 10, 1701–1737, https://doi.org/10.5194/acp-10-1701-2010, 2010.
Cavalli, F., Alastuey, A., Areskoug, H., Ceburnis, D., Cech, J., Genberg, J., Harrison, R. M., Jaffrezo, J. L., Kiss, G., Laj, P., Mihalopoulos, N., Perez, N., Quincey, P., Schwarz, J., Sellegri, K., Spindler, G., Swietlicki, E., Theodosi, C., Yttri, K. E., Aas, W., and Putaud, J. P.: A European aerosol phenomenology –4: harmonized concentrations of carbonaceous aerosol at 10 regional background sites across Europe, Atmos. Environ., 144, 133–145, https://doi.org/10.1016/j.atmosenv.2016.07.050, 2016.
Cavalli, F., Viana, M., Yttri, K. E., Genberg, J., and Putaud, J.-P.: Toward a standardised thermal-optical protocol for measuring atmospheric organic and elemental carbon: the EUSAAR protocol, Atmos. Meas. Tech., 3, 79–89, https://doi.org/10.5194/amt-3-79-2010, 2010.
Che, H. Z., Zhang, X. Y., Chen, H. B., Damiri, B., Goloub, P., Li, Z. Q., Zhang, X. C., Wei, Y., Zhou, H. G., Dong, F., Li, D. P., and Zhou, T. M.: Instrument calibration and aerosol optical depth validation of the China aerosol remote sensing network, J. Geophys. Res. Atmos., 114, D03206, https://doi.org/10.1029/2008jd011030, 2009.
Collaud Coen, M., Andrews, E., Asmi, A., Baltensperger, U., Bukowiecki, N., Day, D., Fiebig, M., Fjaeraa, A. M., Flentje, H., Hyvärinen, A., Jefferson, A., Jennings, S. G., Kouvarakis, G., Lihavainen, H., Lund Myhre, C., Malm, W. C., Mihapopoulos, N., Molenar, J. V., O'Dowd, C., Ogren, J. A., Schichtel, B. A., Sheridan, P., Virkkula, A., Weingartner, E., Weller, R., and Laj, P.: Aerosol decadal trends – Part 1: In-situ optical measurements at GAW and IMPROVE stations, Atmos. Chem. Phys., 13, 869–894, https://doi.org/10.5194/acp-13-869-2013, 2013.
Collaud Coen, M., Weingartner, E., Apituley, A., Ceburnis, D., Fierz-Schmidhauser, R., Flentje, H., Henzing, J. S., Jennings, S. G., Moerman, M., Petzold, A., Schmid, O., and Baltensperger, U.: Minimizing light absorption measurement artifacts of the Aethalometer: evaluation of five correction algorithms, Atmos. Meas. Tech., 3, 457–474, https://doi.org/10.5194/amt-3-457-2010, 2010.
Collaud Coen, M., Andrews, E., Aliaga, D., Andrade, M., Angelov, H., Bukowiecki, N., Ealo, M., Fialho, P., Flentje, H., Hallar, A. G., Hooda, R., Kalapov, I., Krejci, R., Lin, N.-H., Marinoni, A., Ming, J., Nguyen, N. A., Pandolfi, M., Pont, V., Ries, L., Rodríguez, S., Schauer, G., Sellegri, K., Sharma, S., Sun, J., Tunved, P., Velasquez, P., and Ruffieux, D.: Identification of topographic features influencing aerosol observations at high altitude stations, Atmos. Chem. Phys., 18, 12289–12313, https://doi.org/10.5194/acp-18-12289-2018, 2018.
Collaud Coen, M., Andrews, E., Alastuey, A., Arsov, T. P., Backman, J., Brem, B. T., Bukowiecki, N., Couret, C., Eleftheriadis, K., Flentje, H., Fiebig, M., Gysel-Beer, M., Hand, J. L., Hoffer, A., Hooda, R., Hueglin, C., Joubert, W., Keywood, M., Kim, J. E., Kim, S.-W., Labuschagne, C., Lin, N.-H., Lin, Y., Lund Myhre, C., Luoma, K., Lyamani, H., Marinoni, A., Mayol-Bracero, O. L., Mihalopoulos, N., Pandolfi, M., Prats, N., Prenni, A. J., Putaud, J.-P., Ries, L., Reisen, F., Sellegri, K., Sharma, S., Sheridan, P., Sherman, J. P., Sun, J., Titos, G., Torres, E., Tuch, T., Weller, R., Wiedensohler, A., Zieger, P., and Laj, P.: Multidecadal trend analysis of in situ aerosol radiative properties around the world, Atmos. Chem. Phys., 20, 8867–8908, https://doi.org/10.5194/acp-20-8867-2020, 2020a.
Collaud Coen, M., Andrews, E., Bigi, A., Romanens, G., Martucci, G., and Vuilleumier, L.: Effects of the prewhitening method, the time granularity and the time segmentation on the Mann-Kendall trend detection and the associated Sen's slope, Atmos. Meas. Tech. Discuss., https://doi.org/10.5194/amt-2020-178, in review, 2020b.
Crippa, M., Canonaco, F., Lanz, V. A., Äijälä, M., Allan, J. D., Carbone, S., Capes, G., Ceburnis, D., Dall'Osto, M., Day, D. A., DeCarlo, P. F., Ehn, M., Eriksson, A., Freney, E., Hildebrandt Ruiz, L., Hillamo, R., Jimenez, J. L., Junninen, H., Kiendler-Scharr, A., Kortelainen, A.-M., Kulmala, M., Laaksonen, A., Mensah, A. A., Mohr, C., Nemitz, E., O'Dowd, C., Ovadnevaite, J., Pandis, S. N., Petäjä, T., Poulain, L., Saarikoski, S., Sellegri, K., Swietlicki, E., Tiitta, P., Worsnop, D. R., Baltensperger, U., and Prévôt, A. S. H.: Organic aerosol components derived from 25 AMS data sets across Europe using a consistent ME-2 based source apportionment approach, Atmos. Chem. Phys., 14, 6159–6176, https://doi.org/10.5194/acp-14-6159-2014, 2014.
Croft, B., Martin, R. V., Leaitch, W. R., Tunved, P., Breider, T. J., D'Andrea, S. D., and Pierce, J. R.: Processes controlling the annual cycle of Arctic aerosol number and size distributions, Atmos. Chem. Phys., 16, 3665–3682, https://doi.org/10.5194/acp-16-3665-2016, 2016.
Dall'Osto, M., Beddows, D. C. S., Tunved, P., Harrison, R. M., Lupi, A., Vitale, V., Becagli, S., Traversi, R., Park, K.-T., Yoon, Y. J., Massling, A., Skov, H., Lange, R., Strom, J., and Krejci, R.: Simultaneous measurements of aerosol size distributions at three sites in the European high Arctic, Atmos. Chem. Phys., 19, 7377–7395, https://doi.org/10.5194/acp-19-7377-2019, 2019.
Delene, D. J. and Ogren, J. A.: Variability of aerosol optical properties at four North American surface monitoring sites, J. Atmos. Sci., 59, 1135–1149, https://doi.org/10.1175/1520-0469(2002)059<1135:VOAOPA>2.0.CO;2, 2002.
Fanourgakis, G. S., Kanakidou, M., Nenes, A., Bauer, S. E., Bergman, T., Carslaw, K. S., Grini, A., Hamilton, D. S., Johnson, J. S., Karydis, V. A., Kirkevåg, A., Kodros, J. K., Lohmann, U., Luo, G., Makkonen, R., Matsui, H., Neubauer, D., Pierce, J. R., Schmale, J., Stier, P., Tsigaridis, K., van Noije, T., Wang, H., Watson-Parris, D., Westervelt, D. M., Yang, Y., Yoshioka, M., Daskalakis, N., Decesari, S., Gysel-Beer, M., Kalivitis, N., Liu, X., Mahowald, N. M., Myriokefalitakis, S., Schrödner, R., Sfakianaki, M., Tsimpidi, A. P., Wu, M., and Yu, F.: Evaluation of global simulations of aerosol particle and cloud condensation nuclei number, with implications for cloud droplet formation, Atmos. Chem. Phys., 19, 8591–8617, https://doi.org/10.5194/acp-19-8591-2019, 2019.
Farah, A., Villani, P., Conil, S., Langrene, L., Laj, P., and Sellegri, K.: Characterization of aerosol physical and optical properties at the Perennial Observatory of the Environment (OPE) site, Atmosphere, 11, 172, https://doi.org/10.3390/atmos11020172, 2020.
Fountoukis, C., Megaritis, A. G., Skyllakou, K., Charalampidis, P. E., Pilinis, C., Denier van der Gon, H. A. C., Crippa, M., Canonaco, F., Mohr, C., Prévôt, A. S. H., Allan, J. D., Poulain, L., Petäjä, T., Tiitta, P., Carbone, S., Kiendler-Scharr, A., Nemitz, E., O'Dowd, C., Swietlicki, E., and Pandis, S. N.: Organic aerosol concentration and composition over Europe: insights from comparison of regional model predictions with aerosol mass spectrometer factor analysis, Atmos. Chem. Phys., 14, 9061–9076, https://doi.org/10.5194/acp-14-9061-2014, 2014.
Geophysical Monitoring for Climatic Change No. 1, Summary Report 1972, pp. 79, U.S. Dept. of Commerce NOAA. Miller, J. M. (ed) (1973), available at https://www.esrl.noaa.gov/gmd/publications/summary_reports/summary_report_1.pdf (last access: 11 August 2020), 1972.
Gliß, J., Mortier, A., Schulz, M., Andrews, E., Balkanski, Y., Bauer, S. E., Benedictow, A. M. K., Bian, H., Checa-Garcia, R., Chin, M., Ginoux, P., Griesfeller, J. J., Heckel, A., Kipling, Z., Kirkevåg, A., Kokkola, H., Laj, P., Le Sager, P., Lund, M. T., Lund Myhre, C., Matsui, H., Myhre, G., Neubauer, D., van Noije, T., North, P., Olivié, D. J. L., Sogacheva, L., Takemura, T., Tsigaridis, K., and Tsyro, S. G.: Multi-model evaluation of aerosol optical properties in the AeroCom phase III Control experiment, using ground and space based columnar observations from AERONET, MODIS, AATSR and a merged satellite product as well as surface in-situ observations from GAW sites, Atmos. Chem. Phys. Discuss., https://doi.org/10.5194/acp-2019-1214, in review, 2020.
Granier, C., Bessagnet, B., Bond, T. C., D'Angiola, A., Denier van der Gon, H., Frost, G. J., Heil, A., Kaiser, J. W., Kinne, S., Klimont, Z., Kloster, S., Lamarque, J.-F., Liousse, C., Masui, T., Meleux, F., Mieville, A., Ohara, T., Raut, J.-C., Riahi, K., Schultz, M. G., Smith, S. J., Thompson, A., Aardenne, J., Werf, G. R., and Vuuren, D. P.: Evolution of anthropogenic and biomass burning emissions of air pollutants at global and regional scales during the 1980–2010 period, Climate Change, 109, 163–190, https://doi.org/10.1007/s10584-011-0154-1, 2011.
Gras, J. L.: CN, CCN and particle size in Southern Ocean air at Cape Grim, Atmos. Res., 35, 233–251, https://doi.org/10.1016/0169-8095(94)00021-5, 1995.
Hansen, A. D. A., Rosen, H., and Novakov, T.: The aethalometer — An instrument for the real-time measurement of optical absorption by aerosol particles, Sci. Total Environ., 36, 191–196, https://doi.org/10.1016/0048-9697(84)90265-1, 1984.
Herrmann, E., Weingartner, E., Henne, S., Vuilleumier, L., Bukowiecki, N., Steinbacher, M., Conen, F., Collaud Coen, M., Hammer, E., Jurány, Z., Baltensperger, U., and Gysel, M.: Analysis of long-term aerosol size distribution data from Jungfraujoch with emphasis on free tropospheric conditions, cloud influence, and air mass transport, J. Geophys. Res.-Atmos., 120, 9459–9480, https://doi.org/10.1002/2015JD023660, 2015.
Hogan, A. W. and Gardner, G.: A nucleus counter of increased sensitivity, J. Rech. Atmos., 3, 59–61, 1968.
Huneeus, N., Schulz, M., Balkanski, Y., Griesfeller, J., Prospero, J., Kinne, S., Bauer, S., Boucher, O., Chin, M., Dentener, F., Diehl, T., Easter, R., Fillmore, D., Ghan, S., Ginoux, P., Grini, A., Horowitz, L., Koch, D., Krol, M. C., Landing, W., Liu, X., Mahowald, N., Miller, R., Morcrette, J.-J., Myhre, G., Penner, J., Perlwitz, J., Stier, P., Takemura, T., and Zender, C. S.: Global dust model intercomparison in AeroCom phase I, Atmos. Chem. Phys., 11, 7781–7816, https://doi.org/10.5194/acp-11-7781-2011, 2011.
IPCC: Working Group I Contribution to the IPCC Fifth Assessment Report Climate Change 2013: The Physical Science Basis, Summary for Policymakers, IPCC, Geneva, Switzerland, Final Draft, 1535 pp., 2013.
Joly, M. and Peuch, V. H.: Objective classification of air quality monitoring sites over Europe, Atmos. Environ., 47, 111–123, https://doi.org/10.1016/j.atmosenv.2011.11.025, 2012.
Kahn, R. A., Berkoff, T. A., Brock, C., Chen, G., Ferrare, R. A., Ghan, S., Hansico, T. F., Hegg, D. A., Martins, J. V., McNaughton, C. S., Murphy, D. M., Ogren, J. A., Penner, J. E., Pilewskie, P., Seinfeld, J. H., and Worsnop, D. R.: SAM-CAAM: A concept for acquiring systematic aircraft measurements to characterize aerosol air masses, B. Am. Meteorol. Soc., 98, 2215–2228, https://doi.org/10.1175/BAMS-D-16-0003.1, 2017.
Klimont, Z., Kupiainen, K., Heyes, C., Purohit, P., Cofala, J., Rafaj, P., Borken-Kleefeld, J., and Schöpp, W.: Global anthropogenic emissions of particulate matter including black carbon, Atmos. Chem. Phys., 17, 8681–8723, https://doi.org/10.5194/acp-17-8681-2017, 2017.
Laj, P., Klausen, J., Bilde, M., Plaß-Duelmer, C., Pappalardo, G., Clerbaux, C., Baltensperger, U., Hjorth, J., Simpson, D., Reimann, S., Coheur, P.-F., Richter, A., De Mazie, M., Rudich, Y., McFiggans, G., Torseth, K., Wiedensohler, A., Morin, S., Schulz, M., Allan, J. D., Attie, J.-L., Barnes, I., Birmili, W., Cammas, J. P., Dommen, J., Dorn, H.-P., Fowler, D., Fuzzi, S., Glasius, M., Granier, C., Hermann, M., Isaksen, I. S. A., Kinne, S., Koren, I., Madonna, F., Maione, M., Massling, A., Moehler, O., Mona, L., Monks, P. S., Müller, D., Müller, T., Orphal, J., Peuch, V.-H., Stratmann, F., Tanre, D., Tyndall, F., Abo Riziqmm, A., Van Roozendael, M., Villani, P., Wehner, B., Wex, H., and Zardini, A. A.: Measuring atmospheric composition change, Atmos. Environ., 43, 5351–5414, https://doi.org/10.1016/j.atmosenv.2009.08.020, 2009
Laj, P., Andrade, M., Sokhi, R., Volosciuk, C., and Tarasova, O.: Sustainability of Atmospheric Observations in Developing Countries, WMO Bulletin, vol. 68, World Meteorological Organisation Geneva, Switzerland, 2019.
Laj, P., Bigi, A., Rose, C., Andrews, E., Lund Myhre, C., Collaud Coen, M., Lin, Y., Wiedensohler, A., Schultz, M., Ogren, J. A., Fiebig, M., Gliß, J., Mortier, A., Pandolfi, M., Petäjä, T., Kim, S.-W., Aas, W., Putaud, J.-P., Mayol-Bracero, O., Keywood, M., Labrador, L., Aalto, P., Ahlberg, E., Alados Arboledas, L., Alastuey, A., Andrade, M., Artíñano, B., Ausmeel, S., Arsov, T., Asmi, E., Backman, J., Baltensperger, U., Bastian, S., Bath, O., Beukes, J. P., Brem, B. T., Bukowiecki, N., Conil, S., Couret, C., Day, D., Dayantolis, W., Degorska, A., Eleftheriadis, K., Fetfatzis, P., Favez, O., Flentje, H., Gini, M. I., Gregorič, A., Gysel-Beer, M., Hallar, A. G., Hand, J., Hoffer, A., Hueglin, C., Hooda, R. K., Hyvärinen, A., Kalapov, I., Kalivitis, N., Kasper-Giebl, A., Kim, J. E., Kouvarakis, G., Kranjc, I., Krejci, R., Kulmala, M., Labuschagne, C., Lee, H.-J., Lihavainen, H., Lin, N.-H., Löschau, G., Luoma, K., Marinoni, A., Martins Dos Santos, S., Meinhardt, F., Merkel, M., Metzger, J.-M., Mihalopoulos, N., Nguyen, N. A., Ondracek, J., Peréz, N., Perrone, M. R., Petit, J.-E., Picard, D., Pichon, J.-M., Pont, V., Prats, N., Prenni, A., Reisen, F., Romano, S., Sellegri, K., Sharma, S., Schauer, G., Sheridan, P., Sherman, J. P., Schütze, M., Schwerin, A., Sohmer, R., Sorribas, M., Steinbacher, M., Sun, J., Titos, G., Tokzko, B., Tuch, T., Tulet, P., Tunved, P., Vakkari, V., Velarde, F., Velasquez, P., Villani, P., Vratolis, S., Wang, S.-H., Weinhold, K., Weller, R., Yela, M., Yus-Diez, J., Zdimal, V., Zieger, P., and Zikova, N.: A global analysis of climate-relevant aerosol properties retrieved from the network of GAW near-surface observatories, ACTRiS Data Centre, https://doi.org/10.21336/7f34-8j17, 2020.
Lamarque, J.-F., Bond, T. C., Eyring, V., Granier, C., Heil, A., Klimont, Z., Lee, D., Liousse, C., Mieville, A., Owen, B., Schultz, M. G., Shindell, D., Smith, S. J., Stehfest, E., Van Aardenne, J., Cooper, O. R., Kainuma, M., Mahowald, N., McConnell, J. R., Naik, V., Riahi, K., and van Vuuren, D. P.: Historical (1850–2000) gridded anthropogenic and biomass burning emissions of reactive gases and aerosols: methodology and application, Atmos. Chem. Phys., 10, 7017–7039, https://doi.org/10.5194/acp-10-7017-2010, 2010.
Li, J., Carlson, B. E., Dubovik, O., and Lacis, A. A.: Recent trends in aerosol optical properties derived from AERONET measurements, Atmos. Chem. Phys., 14, 12271–12289, https://doi.org/10.5194/acp-14-12271-2014, 2014.
Lim, S., Faïn, X., Ginot, P., Mikhalenko, V., Kutuzov, S., Paris, J.-D., Kozachek, A., and Laj, P.: Black carbon variability since preindustrial times in the eastern part of Europe reconstructed from Mt. Elbrus, Caucasus, ice cores, Atmos. Chem. Phys., 17, 3489–3505, https://doi.org/10.5194/acp-17-3489-2017, 2017.
Liu, C., Chung, C. E., Yin, Y., and Schnaiter, M.: The absorption Ångström exponent of black carbon: from numerical aspects, Atmos. Chem. Phys., 18, 6259–6273, https://doi.org/10.5194/acp-18-6259-2018, 2018.
Lund, M. T., Myhre, G., Haslerud, A. S., Skeie, R. B., Griesfeller, J., Platt, S. M., Kumar, R., Myhre, C. L., and Schulz, M.: Concentrations and radiative forcing of anthropogenic aerosols from 1750 to 2014 simulated with the Oslo CTM3 and CEDS emission inventory, Geosci. Model Dev., 11, 4909–4931, https://doi.org/10.5194/gmd-11-4909-2018, 2018.
Mann, G. W., Carslaw, K. S., Reddington, C. L., Pringle, K. J., Schulz, M., Asmi, A., Spracklen, D. V., Ridley, D. A., Woodhouse, M. T., Lee, L. A., Zhang, K., Ghan, S. J., Easter, R. C., Liu, X., Stier, P., Lee, Y. H., Adams, P. J., Tost, H., Lelieveld, J., Bauer, S. E., Tsigaridis, K., van Noije, T. P. C., Strunk, A., Vignati, E., Bellouin, N., Dalvi, M., Johnson, C. E., Bergman, T., Kokkola, H., von Salzen, K., Yu, F., Luo, G., Petzold, A., Heintzenberg, J., Clarke, A., Ogren, J. A., Gras, J., Baltensperger, U., Kaminski, U., Jennings, S. G., O'Dowd, C. D., Harrison, R. M., Beddows, D. C. S., Kulmala, M., Viisanen, Y., Ulevicius, V., Mihalopoulos, N., Zdimal, V., Fiebig, M., Hansson, H.-C., Swietlicki, E., and Henzing, J. S.: Intercomparison and evaluation of global aerosol microphysical properties among AeroCom models of a range of complexity, Atmos. Chem. Phys., 14, 4679–4713, https://doi.org/10.5194/acp-14-4679-2014, 2014.
Manninen, H. E., Mirme, S., Mirme, A., Petäjä, T., and Kulmala, M.: How to reliably detect molecular clusters and nucleation mode particles with Neutral cluster and Air Ion Spectrometer (NAIS), Atmos. Meas. Tech., 9, 3577–3605, https://doi.org/10.5194/amt-9-3577-2016, 2016.
Mortier, A., Gliss, J., Schulz, M., Aas, W., Andrews, E., Bian, H., Chin, M., Ginoux, P., Hand, J., Holben, B., Hua, Z., Kipling, Z., Kirkevåg, A., Laj, P., Lurton, T., Myhre, G., Neubauer, D., Olivié, D., von Salzen, K., Takemura, T., and Tilmes, S.: Evaluation of climate model aerosol trends with ground-based observations over the last two decades – an AeroCom and CMIP6 analysis, Atmos. Chem. Phys. Discuss., https://doi.org/10.5194/acp-2019-1203, in review, 2020.
Müller, T., Nowak, A., Weidensohler, A., Sheridan, P., Laborde, M., Covert, D. S., Marinoni, A., Imre, K., Henzing, B., Roger, J.-C., Martins dos Santos, S., Wilhelm, R., Wang, Y.-Q., and de Leeuw, G.: Angular illumination and truncation of three different integrating nephelometers: implications for empirical size-based corrections, Aerosol Sci. Tech., 43, 581–586, https://doi.org/10.1080/02786820902798484, 2009.
Müller, T., Henzing, J. S., de Leeuw, G., Wiedensohler, A., Alastuey, A., Angelov, H., Bizjak, M., Collaud Coen, M., Engström, J. E., Gruening, C., Hillamo, R., Hoffer, A., Imre, K., Ivanow, P., Jennings, G., Sun, J. Y., Kalivitis, N., Karlsson, H., Komppula, M., Laj, P., Li, S.-M., Lunder, C., Marinoni, A., Martins dos Santos, S., Moerman, M., Nowak, A., Ogren, J. A., Petzold, A., Pichon, J. M., Rodriquez, S., Sharma, S., Sheridan, P. J., Teinilä, K., Tuch, T., Viana, M., Virkkula, A., Weingartner, E., Wilhelm, R., and Wang, Y. Q.: Characterization and intercomparison of aerosol absorption photometers: result of two intercomparison workshops, Atmos. Meas. Tech., 4, 245–268, https://doi.org/10.5194/amt-4-245-2011, 2011.
Müller, T., Laborde, M., Kassell, G., and Wiedensohler, A.: Design and performance of a three-wavelength LED-based total scatter and backscatter integrating nephelometer, Atmos. Meas. Tech., 4, 1291–1303, https://doi.org/10.5194/amt-4-1291-2011, 2011.
Nieminen, T., Kerminen, V.-M., Petäjä, T., Aalto, P. P., Arshinov, M., Asmi, E., Baltensperger, U., Beddows, D. C. S., Beukes, J. P., Collins, D., Ding, A., Harrison, R. M., Henzing, B., Hooda, R., Hu, M., Hõrrak, U., Kivekäs, N., Komsaare, K., Krejci, R., Kristensson, A., Laakso, L., Laaksonen, A., Leaitch, W. R., Lihavainen, H., Mihalopoulos, N., Németh, Z., Nie, W., O'Dowd, C., Salma, I., Sellegri, K., Svenningsson, B., Swietlicki, E., Tunved, P., Ulevicius, V., Vakkari, V., Vana, M., Wiedensohler, A., Wu, Z., Virtanen, A., and Kulmala, M.: Global analysis of continental boundary layer new particle formation based on long-term measurements, Atmos. Chem. Phys., 18, 14737–14756, https://doi.org/10.5194/acp-18-14737-2018, 2018.
Ningombam, S., Larson, E. J. L., Dumka, U. C., Estellés, V., Campanelli, M., and Colwell, S.: Long-term (1995–2018) aerosol optical depth derived using ground based AERONET and SKYNET measurements from aerosol aged-background sites, Atmos. Pollut. Res., 10, 608–620, https://doi.org/10.1016/j.apr.2018.10.008, 2019.
Ogren, J. A.: A systematic approach to in situ observations of aerosol properties, Aerosol Sci. Tech., edited by: Charlson, R. and Heintzenberg, J., John Wiley & Sons, Ltd, New York, USA, 215–226, 1995.
Ogren, J. A.: Comment on “Calibration and Intercomparison of Filter-Based Measurements of Visible Light Absorption by Aerosols”, Aerosol Sci. Tech., 44, 589–591, https://doi.org/10.1080/02786826.2010.482111, 2010.
Ogren, J. A., Wendell, J., Andrews, E., and Sheridan, P. J.: Continuous light absorption photometer for long-term studies, Atmos. Meas. Tech., 10, 4805–4818, https://doi.org/10.5194/amt-10-4805-2017, 2017.
Pandolfi, M., Alados-Arboledas, L., Alastuey, A., Andrade, M., Angelov, C., Artiñano, B., Backman, J., Baltensperger, U., Bonasoni, P., Bukowiecki, N., Collaud Coen, M., Conil, S., Coz, E., Crenn, V., Dudoitis, V., Ealo, M., Eleftheriadis, K., Favez, O., Fetfatzis, P., Fiebig, M., Flentje, H., Ginot, P., Gysel, M., Henzing, B., Hoffer, A., Holubova Smejkalova, A., Kalapov, I., Kalivitis, N., Kouvarakis, G., Kristensson, A., Kulmala, M., Lihavainen, H., Lunder, C., Luoma, K., Lyamani, H., Marinoni, A., Mihalopoulos, N., Moerman, M., Nicolas, J., O'Dowd, C., Petäjä, T., Petit, J.-E., Pichon, J. M., Prokopciuk, N., Putaud, J.-P., Rodríguez, S., Sciare, J., Sellegri, K., Swietlicki, E., Titos, G., Tuch, T., Tunved, P., Ulevicius, V., Vaishya, A., Vana, M., Virkkula, A., Vratolis, S., Weingartner, E., Wiedensohler, A., and Laj, P.: A European aerosol phenomenology – 6: scattering properties of atmospheric aerosol particles from 28 ACTRIS sites, Atmos. Chem. Phys., 18, 7877–7911, https://doi.org/10.5194/acp-18-7877-2018, 2018.
Petäjä, T., O'Connor, E. J., Moisseev, D., Sinclair, V. A., Manninen, A. J., Väänänen, R., von Lerber, A., Thornton, J. A., Nicoll, K., Petersen, W., Chandrasekar, V., Smith, J. N., Winkler, P. M., Krüger, O., Hakola, H., Timonen, H., Brus, D., Laurila, T., Asmi, E., Riekkola, M.-L., Mona, L., Massoli, P., Engelmann, R., Komppula, M., Wang, J., Kuang, C., Bäck, J., Virtanen, A., Levula, J., Ritsche, M., and Hickmon, N.: BAECC, A field campaign to elucidate the impact of Biogenic Aerosols on Clouds and Climate, B. Am. Meteorol. Soc., 97, 1909–1928, https://doi.org/10.1175/BAMS-D-14-00199.1, 2016.
Petzold, A. and Schönlinner, M.: Multi-angle absorption photometry—a new method for the measurement of aerosol light absorption and atmospheric black carbon, J. Aerosol Sci., 35, 421–441, https://doi.org/10.1016/j.jaerosci.2003.09.005, 2004.
Petzold, A., Ogren, J. A., Fiebig, M., Laj, P., Li, S.-M., Baltensperger, U., Holzer-Popp, T., Kinne, S., Pappalardo, G., Sugimoto, N., Wehrli, C., Wiedensohler, A., and Zhang, X.-Y.: Recommendations for reporting “black carbon” measurements, Atmos. Chem. Phys., 13, 8365–8379, https://doi.org/10.5194/acp-13-8365-2013, 2013.
Putaud, J. P., Raes, F., Van Dingenen, R., Brüggemann, E., Facchini, M. C., Decesari, S., Fuzzi, S., Gehrig, R., Hüglin, C., Laj, P., Lorbeer, G., Maenhaut, W., Mihalopoulos, N., Müller, K., Querol, X., Rodriguez, S., Schneider, J., Spindler, G., Ten Brink, H., Tørseth, K., and Wiedensohler, A.: European aerosol phenomenology – 2: chemical characteristics of particulate matter at kerbside, urban, rural and background sites in Europe, Atmos. Environ., 38, 2579–2595, https://doi.org/10.1016/j.atmosenv.2004.01.041, 2004.
Putaud, J. P., Van Dingenen, R., Alastuey, A., Bauer, H., Birmili, W., Cyrys, J., Flentje, H., Fuzzi, S., Gehrig, R., Hansson, H. C., Harrison, R. M., Hermann, H., Hitzenberger, R., Hüglin, C., Jones, A. M., Kasper-Giebl, A., Kiss, G., Kousa, A., Kuhlbusch, T. A. J., Lóschau, G., Maenhaut, W., Molnar, A., Moreno, T., Pekkanen, J., Perrino, C., Pitz, M., Puxbaum, H., Querol, X., Rodriguez, S., Salma, I., Schwarz, J., Smolik, J., Schneider, J., Spindler, G., ten Brink, H., Tursic, J., Viana, M., Wiedensohler, A., and Raes, F.: A European aerosol phenomenology – 3: physical and chemical characteristics of particulate matter from 60 rural, urban, and kerbside sites across Europe, Atmos. Environ., 44, 1308–1320, https://doi.org/10.1016/j.atmosenv.2009.12.011, 2010.
Schmale, J., Henning, S., Henzing, J.cS., Keskinen, H., Sellegri, K.,cOvadnevaite, J., Bougiatioti, A., Kalivitis, N., Stavroulas, I., Jefferson, A., Park, M., Schlag, P., Kristensson, A., Iwamoto, Y., Aalto, P., Äijälä, M., Bukowiecki, N., Decesari, S., Ehn, M., Frank, G., Fröhlich, R., Frumau, A., Herrmann, E., Holzinger, R., Kos, G., Kulmala, M., Mihalopoulos, N., Motos, G., Nenes, A., O'Dowd, C. D., Paramonov, M., Petäjä, T., Picard, D., Poulain, L., Prévôt, A. S. H., Swietlicki, E., Pöhlker, M., Pöschl, U., Artaxo, P., Brito, J., Carbone, S., Wiedensohler, A., Ogren, J., Matsuki, A., Yum, S. S., Stratmann, F., Baltensperger, U. and Gysel, M.: What do we learn from long-term cloud condensation nuclei number concentration, particle number size distribution and chemical composition at regionally representative observatories?, Sci. Data, 4, 170003, https://doi.org/10.1038/sdata.2017.3, 2017.
Schmeisser, L., Backman, J., Ogren, J. A., Andrews, E., Asmi, E., Starkweather, S., Uttal, T., Fiebig, M., Sharma, S., Eleftheriadis, K., Vratolis, S., Bergin, M., Tunved, P., and Jefferson, A.: Seasonality of aerosol optical properties in the Arctic, Atmos. Chem. Phys., 18, 11599–11622, https://doi.org/10.5194/acp-18-11599-2018, 2018.
Schmid, H., Laskus, L., Abraham, H. J., Baltensperger, U., Lavanchy, V., Biazjak, M., Burba, P., Cachier, H., Crow, D., Chow, J., Gnauk, T., Even, A., ten Brink, H. M., Giesen, K.-P., Hitzenberger, R., Hueglin, C., Maenhaut, W., Pio, C., Carvahlo, A., Putaud, J.-P., Toom-Sauntry, D., and Puxbaum, H.: Results of the “carbon conference” international aerosol carbon round robin test stage I, Atmos. Environ., 35, 2111–2121, https://doi.org/10.1016/S1352-2310(00)00493-3, 2001.
Sellegri, K., Rose, C., Marinoni, A., Lupi, A., Wiedensohler, A., Andrade, M., Bonasoni, P., and Laj, P.: New particle formation: a review of ground-based observations at mountain research stations, Atmosphere, 10, 493, https://doi.org/10.3390/atmos10090493, 2019.
Sheridan, P. J., Delene, D. J., and Ogren, J. A.: Four years of continuous surface aerosol measurements from the Department of Energy's Atmospheric Radiation Measurement Program Southern Great Plains Cloud and Radiation Testbed site, J. Geophys. Res. Atmos., 106, 20735–20747, https://doi.org/10.1029/2001JD000785, 2001.
Schutgens, N., Tsyro, S., Gryspeerdt, E., Goto, D., Weigum, N., Schulz, M., and Stier, P.: On the spatio-temporal representativeness of observations, Atmos. Chem. Phys., 17, 9761–9780, https://doi.org/10.5194/acp-17-9761-2017, 2017.
Sherman, J. P., Sheridan, P. J., Ogren, J. A., Andrews, E., Hageman, D., Schmeisser, L., Jefferson, A., and Sharma, S.: A multi-year study of lower tropospheric aerosol variability and systematic relationships from four North American regions, Atmos. Chem. Phys., 15, 12487–12517, https://doi.org/10.5194/acp-15-12487-2015, 2015.
Sogacheva, L., Rodriguez, E., Kolmonen, P., Virtanen, T. H., Saponaro, G., de Leeuw, G., Georgoulias, A. K., Alexandri, G., Kourtidis, K., and van der A, R. J.: Spatial and seasonal variations of aerosols over China from two decades of multi-satellite observations – Part 2: AOD time series for 1995–2017 combined from ATSR ADV and MODIS C6.1 and AOD tendency estimations, Atmos. Chem. Phys., 18, 16631–16652, https://doi.org/10.5194/acp-18-16631-2018, 2018.
Sun, J., Birmili, W., Hermann, M., Tuch, T., Weinhold, K., Merkel, M., Rasch, F., Müller, T., Schladitz, A., Bastian, S., Löschau, G., Cyrys, J., Gu, J., Flentje, H., Briel, B., Asbach, C., Kaminski, H., Ries, L., Sohmer, R., Gerwig, H., Wirtz, K., Meinhardt, F., Schwerin, A., Bath, O., Ma, N., and Wiedensohler, A.: Decreasing trends of particle number and black carbon mass concentrations at 16 observational sites in Germany from 2009 to 2018, Atmos. Chem. Phys., 20, 7049–7068, https://doi.org/10.5194/acp-20-7049-2020, 2020.
Textor, C., Schulz, M., Guibert, S., Kinne, S., Balkanski, Y., Bauer, S., Berntsen, T., Berglen, T., Boucher, O., Chin, M., Dentener, F., Diehl, T., Easter, R., Feichter, H., Fillmore, D., Ghan, S., Ginoux, P., Gong, S., Grini, A., Hendricks, J., Horowitz, L., Huang, P., Isaksen, I., Iversen, I., Kloster, S., Koch, D., Kirkevåg, A., Kristjansson, J. E., Krol, M., Lauer, A., Lamarque, J. F., Liu, X., Montanaro, V., Myhre, G., Penner, J., Pitari, G., Reddy, S., Seland, Ø., Stier, P., Takemura, T., and Tie, X.: Analysis and quantification of the diversities of aerosol life cycles within AeroCom, Atmos. Chem. Phys., 6, 1777–1813, https://doi.org/10.5194/acp-6-1777-2006, 2006.
Titos, G., Cazorla, A., Zieger, P., Andrews, E., Lyamani, H., Granados-Muñoz, M. J., Olmo, F. J., and Alados-Arboledas, L.: Effect of hygroscopic growth on the aerosol light-scattering coefficient: measurements, uncertainties and literature review, Atmos. Environ., 141, 494–507, https://doi.org/10.1016/j.atmosenv.2016.07.021, 2016.
Tørseth, K., Aas, W., Breivik, K., Fjæraa, A. M., Fiebig, M., Hjellbrekke, A. G., Lund Myhre, C., Solberg, S., and Yttri, K. E.: Introduction to the European Monitoring and Evaluation Programme (EMEP) and observed atmospheric composition change during 1972–2009, Atmos. Chem. Phys., 12, 5447–5481, https://doi.org/10.5194/acp-12-5447-2012, 2012.
Tsigaridis, K., Daskalakis, N., Kanakidou, M., Adams, P. J., Artaxo, P., Bahadur, R., Balkanski, Y., Bauer, S. E., Bellouin, N., Benedetti, A., Bergman, T., Berntsen, T. K., Beukes, J. P., Bian, H., Carslaw, K. S., Chin, M., Curci, G., Diehl, T., Easter, R. C., Ghan, S. J., Gong, S. L., Hodzic, A., Hoyle, C. R., Iversen, T., Jathar, S., Jimenez, J. L., Kaiser, J. W., Kirkevåg, A., Koch, D., Kokkola, H., Lee, Y. H., Lin, G., Liu, X., Luo, G., Ma, X., Mann, G. W., Mihalopoulos, N., Morcrette, J.-J., Müller, J.-F., Myhre, G., Myriokefalitakis, S., Ng, N. L., O'Donnell, D., Penner, J. E., Pozzoli, L., Pringle, K. J., Russell, L. M., Schulz, M., Sciare, J., Seland, Ø., Shindell, D. T., Sillman, S., Skeie, R. B., Spracklen, D., Stavrakou, T., Steenrod, S. D., Takemura, T., Tiitta, P., Tilmes, S., Tost, H., van Noije, T., van Zyl, P. G., von Salzen, K., Yu, F., Wang, Z., Wang, Z., Zaveri, R. A., Zhang, H., Zhang, K., Zhang, Q., and Zhang, X.: The AeroCom evaluation and intercomparison of organic aerosol in global models, Atmos. Chem. Phys., 14, 10845–10895, https://doi.org/10.5194/acp-14-10845-2014, 2014.
Van Dingenen, R., Putaud, J. P., Raes, F., Baltensperger, U., Charron, A., Facchini, M. C., Decesari, S., Fuzzi, S., Gehrig, R., Hansson, H. C., Harrison, R. M., Hüglin, C., Jones, A. M., Laj, P., Lorbeer, G., Maenhaut, W., Palgren, F., Querol, X., Rodriguez, S., Schneider, J., Ten Brink, H., Tunved, P., Tørseth, K., Wehner, B., Weingartner, E., Wiedensohler, A., and Wåhlin, P.: A European aerosol phenomenology_1: physical characteristics of particulate matter at kerbside, urban, rural and background sites in Europe, Atmos. Environ., 38, 2561–2577, https://doi.org/10.1016/j.atmosenv.2004.01.040, 2004.
Wang, S. X., Zhao, B., Cai, S. Y., Klimont, Z., Nielsen, C. P., Morikawa, T., Woo, J. H., Kim, Y., Fu, X., Xu, J. Y., Hao, J. M., and He, K. B.: Emission trends and mitigation options for air pollutants in East Asia, Atmos. Chem. Phys., 14, 6571–6603, https://doi.org/10.5194/acp-14-6571-2014, 2014.
Wang, R., Andrews, E., Balkanski, Y., Boucher, O., Myhre, G., Samset, B., Schulz, M., Schuster, G., Valari, M., and Tao, S.: Spatial Representativeness Error in the Ground-Level Observation Networks for Black Carbon Radiation Absorption. Geophys. Res. Lett., 45, 2106–2114, https://doi.org/10.1002/2017GL076817, 2018.
Wiedensohler, A., Birmili, W., Nowak, A., Sonntag, A., Weinhold, K., Merkel, M., Wehner, B., Tuch, T., Pfeifer, S., Fiebig, M., Fjäraa, A. M., Asmi, E., Sellegri, K., Depuy, R., Venzac, H., Villani, P., Laj, P., Aalto, P., Ogren, J. A., Swietlicki, E., Williams, P., Roldin, P., Quincey, P., Hüglin, C., Fierz-Schmidhauser, R., Gysel, M., Weingartner, E., Riccobono, F., Santos, S., Grüning, C., Faloon, K., Beddows, D., Harrison, R., Monahan, C., Jennings, S. G., O'Dowd, C. D., Marinoni, A., Horn, H.-G., Keck, L., Jiang, J., Scheckman, J., McMurry, P. H., Deng, Z., Zhao, C. S., Moerman, M., Henzing, B., de Leeuw, G., Löschau, G., and Bastian, S.: Mobility particle size spectrometers: harmonization of technical standards and data structure to facilitate high quality long-term observations of atmospheric particle number size distributions, Atmos. Meas. Tech., 5, 657–685, https://doi.org/10.5194/amt-5-657-2012, 2012.
World Health Statistics 2014, World Health Organization, Geneva, Switzerland, ISBN 978-92-4–156471-7, 2014.
WMO/GAW Report No. 79: Report of the WMO Meeting of Experts to Consider the Aerosol Component of GAW, World Meteorological Organization (WMO), Geneva, Switzerland, 1992.
WMO/GAW Report No. 153: WMO/GAW aerosol measurement procedures, guidelines and recommendations, World Meteorological Organization (WMO), Geneva, Switzerland, 2003.
WMO/GAW Report No. 200: Standard Operating Procedures for In-situ Measurements of Aerosol Mass Concentration, Light Scattering and Light Absorption, Geneva, Switzerland, 2011.
WMO/GAW Report No. 207: Recommendations for a Composite Surface-Based Aerosol Network, Geneva, Switzerland, 2013.
WMO/GAW Report No. 227: Aerosol Measurement Procedures, Guidelines and Recommendations, 2nd Edn., 103 pp., August 2016 (WMO-No. 1177), Geneva, Switzerland, 2016.
Yoon, J., Pozzer, A., Chang, D. Y., Lelieveld, J., Kim, M., Lee, Y. G., Koo, J.-H., Lee, J., and Moon, K. J.: Trend estimates of AERONET-observed and model-simulated AOTs between 1993 and 2013, Atmos. Environ., 125A, 33–47, https://doi.org/10.1016/j.atmosenv.2015.10.058, 2016.
Zanatta, M., Gysel, M., Bukowiecki, N., Müller, T., Weingartner, E., Areskoug, H., Fiebig, M., Yttri, K. E., Mihalopoulos, N., Kouvarakis, G., Beddows, D., Harrison, R. M., Cavalli, F., Putaud, J. P., Spindler, G., Wiedensohler, A., Alastuey, A., Pandolfi, M., Sellegri, K., Swietlicki, E., Jaffrezo, J. L., Baltensperger, U., and Laj, P.: A European aerosol phenomenology–5: climatology of black carbon optical properties at 9 regional background sites across Europe, Atmos. Environ. 145, 346–364, https://doi.org/10.1016/j.atmosenv.2016.09.035, 2016.
Zhang, Q., Jimenez, J. L. Canagaratna, M. R., Allan, J. D., Coe, H., Ulbrich, I., Alfarra, M. R., Takami, A., Middlebrook, A. M., Sun, Y. L., Dzepina, K., Dunlea, E., Docherty, K., DeCarlo, P. F., Salcedo, D., Onasch, T., Jayne, J. T., Miyoshi, T., Shimono, A., Hatakeyama, S., Takegawa, N., Kondo, Y., Schneider, J., Drewnick, F., Borrmann, S., Weimer, S., Demerjian, K, Williams, P., Bower, K., Bahreini, R., Cottrell, L., Griffin, R. J., Rautiainen, J. Sun, J. Y., Zhang, Y. M., and Worsnop, D. R.: Ubiquity and dominance of oxygenated species in organic aerosols in anthropogenically-influenced Northern Hemisphere midlatitudes, Geophys. Res. Lett., 37, L13801, https://doi.org/10.1029/2007GL029979, 2007.
Zhao, B., Jiang, J. H., Gu, Y., Diner, D., Worden, J., Liou, K. N., Su, H., Xing, J., Garay, M., and Huang, L.: Decadal-scale trends in regional aerosol particle properties and their linkage to emission changes, Environ. Res. Lett, 12, 054021, https://doi.org/10.1088/1748-9326/aa6cb2, 2017.
- Abstract
- Introduction
- Scope of the paper
- Procedures for collecting and harmonizing measurements, quality control, and data curation and access
- Procedures for collecting and harmonizing measurements, quality control, and data curation and access
- Current status of the SARGAN station network
- Present-day variability of aerosol physical and optical properties derived from SARGAN stations
- Comparison with AeroCom model outputs for optical properties
- Using SARGAN for global climate monitoring applications
- Conclusions and future challenges
- Data availability
- Author contributions
- Competing interests
- Acknowledgements
- Financial support
- Review statement
- References
- Supplement
- Article
(5194 KB) - Full-text XML
- Abstract
- Introduction
- Scope of the paper
- Procedures for collecting and harmonizing measurements, quality control, and data curation and access
- Procedures for collecting and harmonizing measurements, quality control, and data curation and access
- Current status of the SARGAN station network
- Present-day variability of aerosol physical and optical properties derived from SARGAN stations
- Comparison with AeroCom model outputs for optical properties
- Using SARGAN for global climate monitoring applications
- Conclusions and future challenges
- Data availability
- Author contributions
- Competing interests
- Acknowledgements
- Financial support
- Review statement
- References
- Supplement