the Creative Commons Attribution 4.0 License.
the Creative Commons Attribution 4.0 License.
 | 18 Aug 2020
Aerosol optical properties as observed from an ultralight aircraft over the Strait of Gibraltar
Patrick Chazette
An unprecedented scientific flight was conducted over the Strait of Gibraltar to study the optical properties of the atmospheric aerosols from the sea surface to the lower free troposphere within the framework of the southern Spain experiment for spaceborne mission validation (SUSIE). A Rayleigh–Mie lidar was installed on an ultralight aircraft (ULA) for vertical (nadir) and horizontal line-of-sight measurements. This experiment took place on 13 August 2011 in parallel with continuous observations with a N2-Raman lidar from the coastal site of San Pedro Alcantara (∼ 50 km north-east of Gibraltar). Significant differences were observed between the optical properties of the aerosol layers sampled over the Strait of Gibraltar and San Pedro Alcantara. These differences are related to the surface–atmosphere interface in the planetary boundary layer and the origins and transport processes in the lower free troposphere. A significant contribution of terrigenous aerosols originating from the Iberian Peninsula is highlighted over the two areas. These polluted dusts are identified with lidar ratios (LRs) sr higher than those of Saharan aerosols sampled during the same period (<34 sr) at 355 nm. Furthermore, the particle depolarization ratio is derived with values of ∼ 10 %–15 % for the polluted dust and >20 % for the Saharan dusts. The difference in LRs is the opposite of what is usually assumed for these two types of aerosols and highlights the need to update the classification of aerosols in terms of LR to be used in the inversion of vertical profiles from future spaceborne missions embedding a lidar operating at 355 nm.
- Article
(26889 KB) - Full-text XML
- BibTeX
- EndNote


Very little data exist on the aerosol characterization above the Strait of Gibraltar and its surrounding area where the Atlantic Ocean and the Mediterranean Sea meet. The temperature difference between these two water surfaces inevitably induces a specific atmospheric circulation within the lower troposphere associated with the well-known low-pressure corridor from the Atlantic Ocean to the Mediterranean Sea. The vertical distribution of aerosols can therefore be very heterogeneous against time and space in this region and is an exciting source of study. In addition to this, the Mediterranean region is identified as one of the “hotspots” in projections of future climate change (Giorgi and Lionello, 2008), in which direct and semi-direct effects of aerosol are not properly taken into account in global climate change simulations (IPCC, 2014). Indeed, the presence of aerosols in the lower and middle troposphere have a significant impact on sea surface temperature, evaporation, and precipitation at the regional scale (e.g. Nabat et al., 2015). This impact is mainly felt through a probable positive feedback on the trend for future dryer and thus more atmospherically turbid Mediterranean summers.
In order to characterize the vertical distribution of aerosols over a long period, from mid-June to the end of August 2011, a ground-based remote sensing station was therefore installed in southern Spain in the municipality of San Pedro Alcantara (36∘29′11′′ N, 4∘59′33′′ W) near Marbella in Andalusia. This installation was one of the components of the Fennec programme which was conducted from June to July 2011 (Ryder et al., 2013) and was specifically extended by the southern Spain experiment for spaceborne mission validation (SUSIE) to support an airborne experiment planned in August 2011 over the Strait of Gibraltar. This airborne experiment was funded by the Centre National d'Etude Spatiales (CNES) and the Commissariat à l'Énergie Atomique et aux Énergies Alternatives (CEA). Its main goal was the preparation of the validation campaign for 355 nm wavelength Earth observation space missions such as the Atmospheric Dynamics Mission Aeolus (ADM-AEOLUS), which was launched in August 2018 (Stoffelen et al., 2005; Andersson et al., 2008). It is also a powerful tool for the preparation of the future Earth Clouds, Aerosols and Radiation Explorer mission (EarthCARE; Illingworth et al., 2015), which is part of the Living Planet Programme of the European Space Agency (ESA) and for which upstream studies based on simulations (e.g. Chazette et al., 2001, 1998) have been conducted in the past to prepare the ATmospheric LIDar (ATLID) planned to be embedded on board the EarthCARE satellite. Therefore, it appeared necessary to rely on actual observations of different scientifically relevant atmospheric environments to build a robust database of vertical lidar profiles at 355 nm in order to conduct further realistic link budget studies. The SUSIE experiment is part of this objective and preceded the CHemistry and AeRosols Mediterranean EXperiments (ChArMEx; http://charmex.lsce.ipsl.fr, last access: 14 August 2020) which took place in the western Mediterranean in 2013–2014 (Mallet et al., 2016) over the Balearic Islands (Ancellet et al., 2016; Chazette et al., 2016), Lampedusa island (e.g. Meloni et al., 2018), and the French Riviera (Chazette et al., 2019). It differs from ChArMEx by its location which is at the far west of the Mediterranean Sea in connection with the Atlantic Ocean.
The choice of the Strait of Gibraltar and Andalusia to conduct this field campaign was dictated by the high variability in optical thicknesses and aerosol types that can be encountered over this geographical area, as shown by Rodríguez et al. (2001) via ground measurements. This variability is closely linked to the diversity of sources but also to highly variable meteorological conditions over time (Gallero et al., 2006). The objective of this paper is to present the original results obtained from this field experiment. It brings a piece of information towards the understanding of the variability in the lower troposphere of both the optical properties and origins of observed aerosols. We will see that this is not as predictable as one might expect.
In Sect. 2, we present the instrumental configuration. The methods used to derive the optical properties of aerosols from the lidar profiles are explained in Sect. 3. The analysis of the observations is carried out in Sect. 4, and Sect. 5 presents the origin of the aerosols observed over Gibraltar during the airborne experiment. In Sect. 6, we summarize and conclude.
Two observational platforms are used in this work, one is airborne and the other one is positioned at ground level. Hereafter, we present the instruments which compose those platforms.
2.1 Airborne measurements
Airborne measurements over the Strait of Gibraltar were performed using an ultralight aircraft (ULA) equipped with an active remote sensing device. In this subsection, the ULA scientific payload is presented as the flight plane used during the experiment.
2.1.1 Payload
The ULA/Tanarg-installed eye-safe lidar system ULICE (Ultraviolet LIdar for Canopy Experiment) (Shang et al., 2016) was used to study the lower troposphere (between ∼ 0.15 and 3 km above mean sea level, a.m.s.l.) over the Strait of Gibraltar. The lidar and the ULA's flights close to Gibraltar are represented in Fig. 1. The Tanarg 912 XS was built by the company Air Création (http://www.aircreation.fr/, last access: 14 August 2020) and offers a maximum total payload of ∼ 250 kg including a scientific payload of ∼ 120 kg with a maximum autonomy of ∼ 3 h. The cruise speed is around 85–90 km h−1 and the maximum flight altitude is ∼ 6 km a.m.s.l. (Chazette et al., 2007). The ULA is also equipped with a global positioning system (GPS) and an attitude and heading reference system (AHRS), which are part of the MTi-G components from Xsens (https://www.xsens.com/, last access: 14 August 2020).
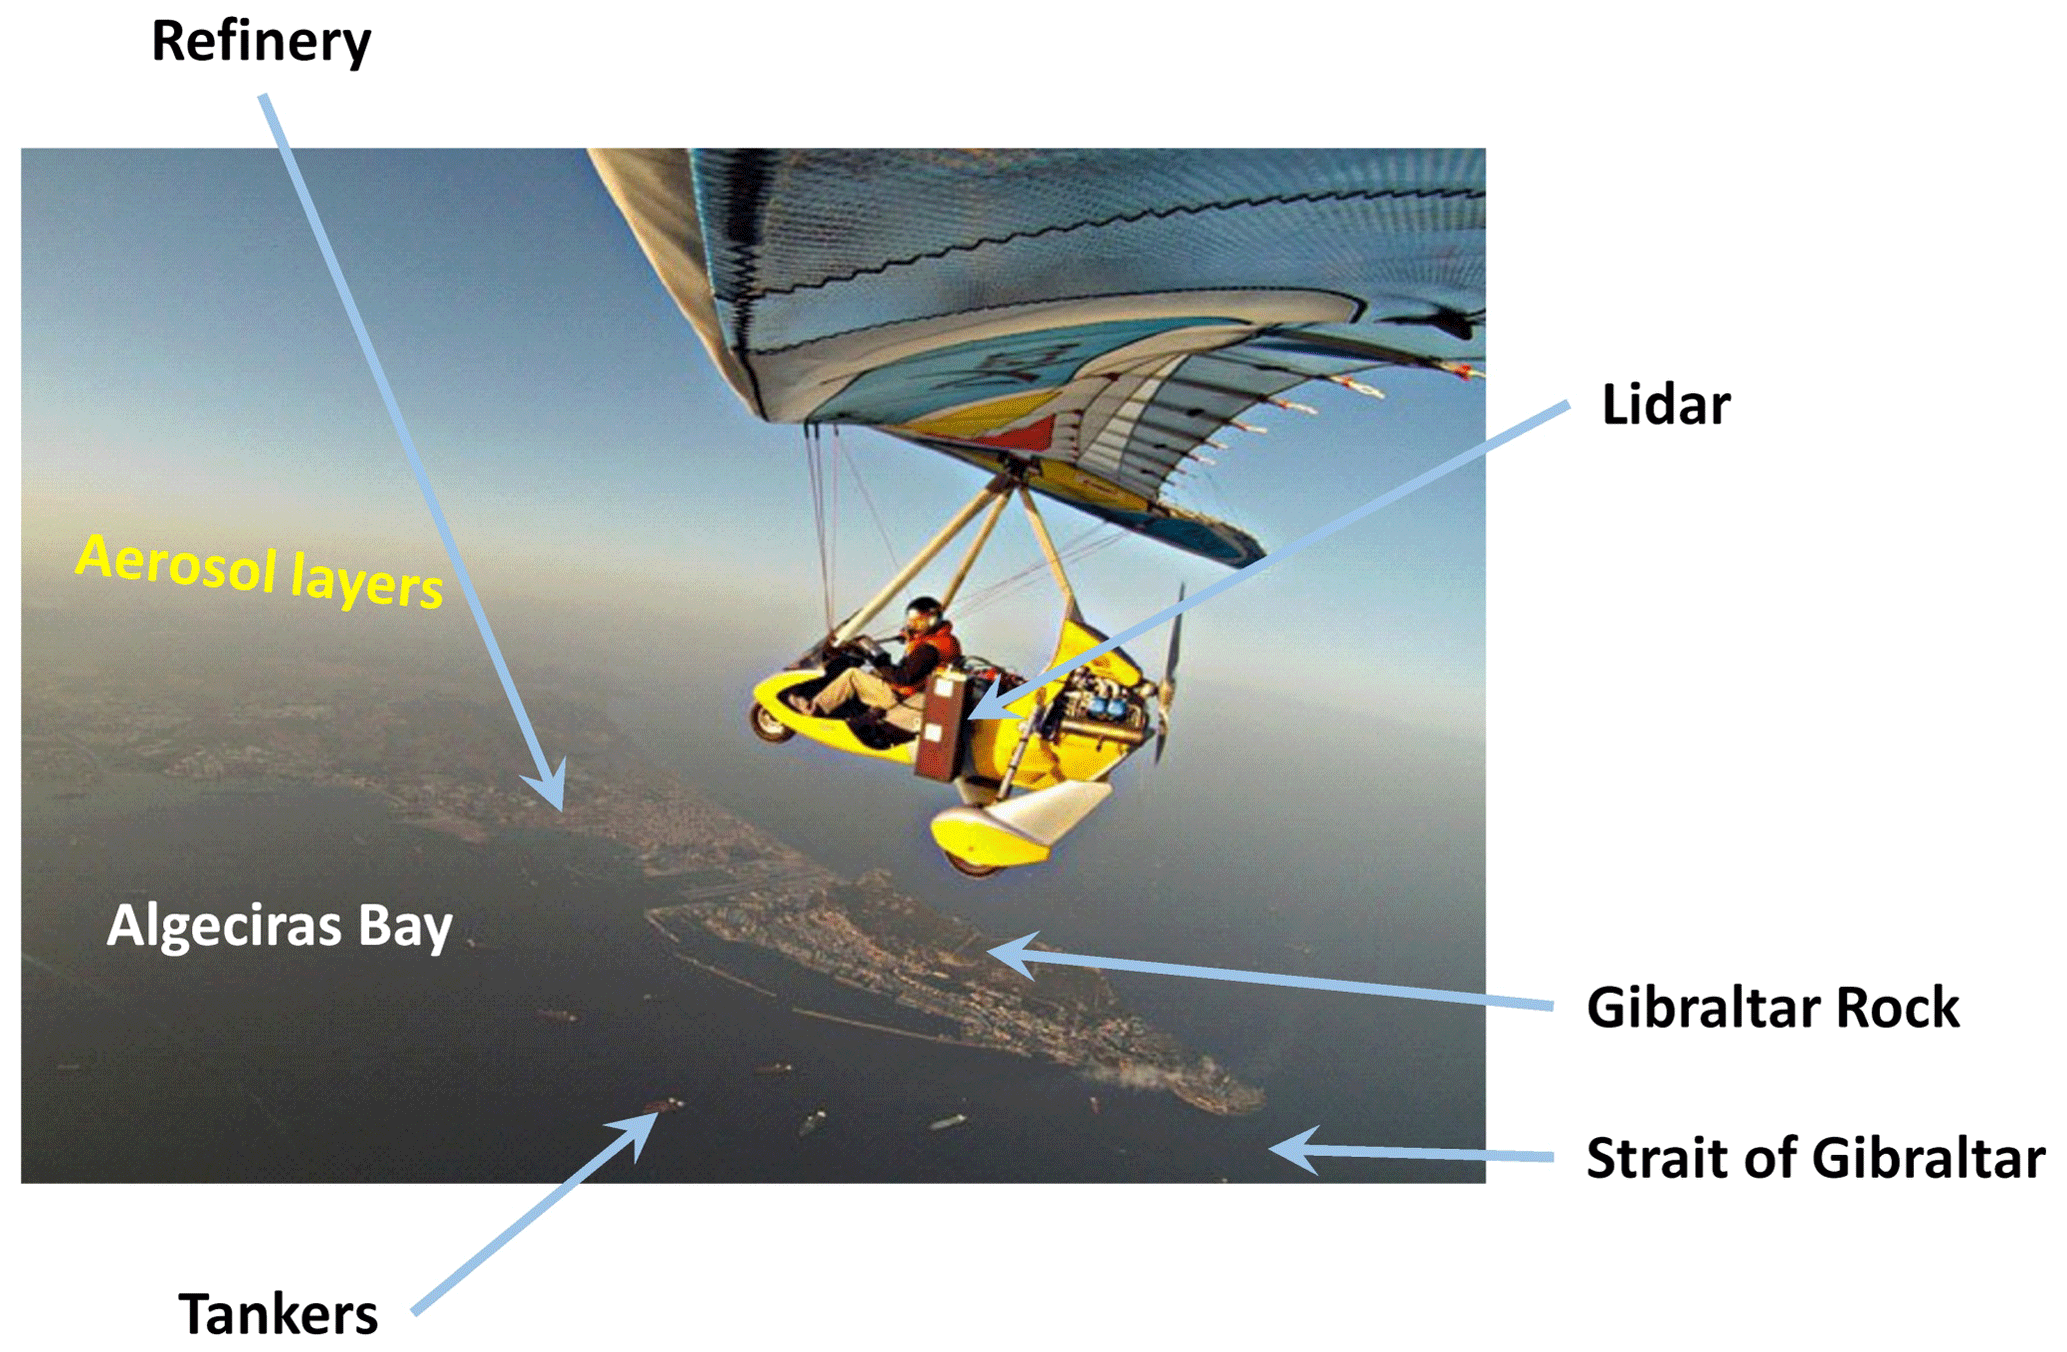
Figure 1Ultralight aircraft (ULA) above the Strait of Gibraltar. The lidar is located on the left side of the ULA in nadir-shooting position. The aerosol layer can be seen in ochre on the horizon of the photo.
The data acquisition was performed by averaging 1000 laser shots at 100 Hz pulse repetition frequency, leading to a temporal sampling close to 10 s. The lidar is controlled by a custom LabVIEW software on a PCI eXtensions for Instrumentation (PXI) computer (National Instruments, http://www.ni.com, last access: 14 August 2020). The ULA payload is autonomous with power supplied by an alternator associated with the propeller. It can deliver the required 600–700 W.
2.1.2 Flight plan
The flight plan allowed a maximum number of lidar profiles during the flight over the Strait of Gibraltar. There were two phases during the flight: a first phase where the lidar line of sight was horizontal and a second phase where the lidar shots were made with nadir sighting (Fig. 2). It was during the ascent and descent that the lidar's line of sight was horizontal to allow the vertical profile of the aerosol extinction coefficient to be reconstructed without assumptions about aerosol types, as shown by Chazette et al. (2007). After take-off from a private field aerodrome (Tahavilla, Spain; 36∘11′17.8′′ N, 5∘45′23.2′′ W), the ceiling for the flight was reached between 2.5 and 3 km a.m.s.l. in agreement with the Spanish and British aviation authorities. The flight remained confined to Spanish and British airspaces.

Figure 2Flight plan of the ULA above the Strait of Gibraltar on 13 August 2011. The colour bar represents the angle of the line of sight (with respect to the true horizon). The broken blue line corresponds to both the ascent and the descent and the broken yellow line to the ULA's flight ceiling. The view from the ULA in Fig. 1 is also highlighted. DEM stands for digital elevation model.
As the ULA is not an aircraft, it cannot take off in strong winds or rainy conditions. It was therefore necessary to wait until the weather conditions were suitable for take-off, i.e. with winds between 10 and 15 m s−1 at ground level. The wind conditions also had to be associated with the presence of significant aerosol layers above the area of Gibraltar that was the subject of this airborne experiment. Between 1 and 22 August, when the ULA was available, only Saturday 13 August in the late afternoon (19:50–21:20 local time, LT) met these conditions.
2.2 Ground-based tools
The sea shore site of San Pedro Alcantara (see Fig. 2; ∼ 50 km north-east of Gibraltar) was equipped with the first version of Lidar for Automatic Atmospheric Surveys using Raman Scattering (LAASURS; Chazette et al., 2017, 2019), described in Royer et al. (2011). LAASURS is an N2-Raman lidar dedicated to research activities. It comprises three channels for the parallel and perpendicular polarizations with respect to the laser emission and the inelastic nitrogen vibrational Raman line of the laser-induced atmospheric backscattered signal. The version used during this field campaign includes a Nd:YAG laser (Ultra® manufactured by Lumibird/Quantel) emitting 16 mJ at 355 nm collimated to fulfil eye-safety requirements. On the same site, a sun photometer was installed and linked to the AErosol RObotic NETwork (AERONET) that distributes the data (https://aeronet.gsfc.nasa.gov/, last access: 14 August 2020).
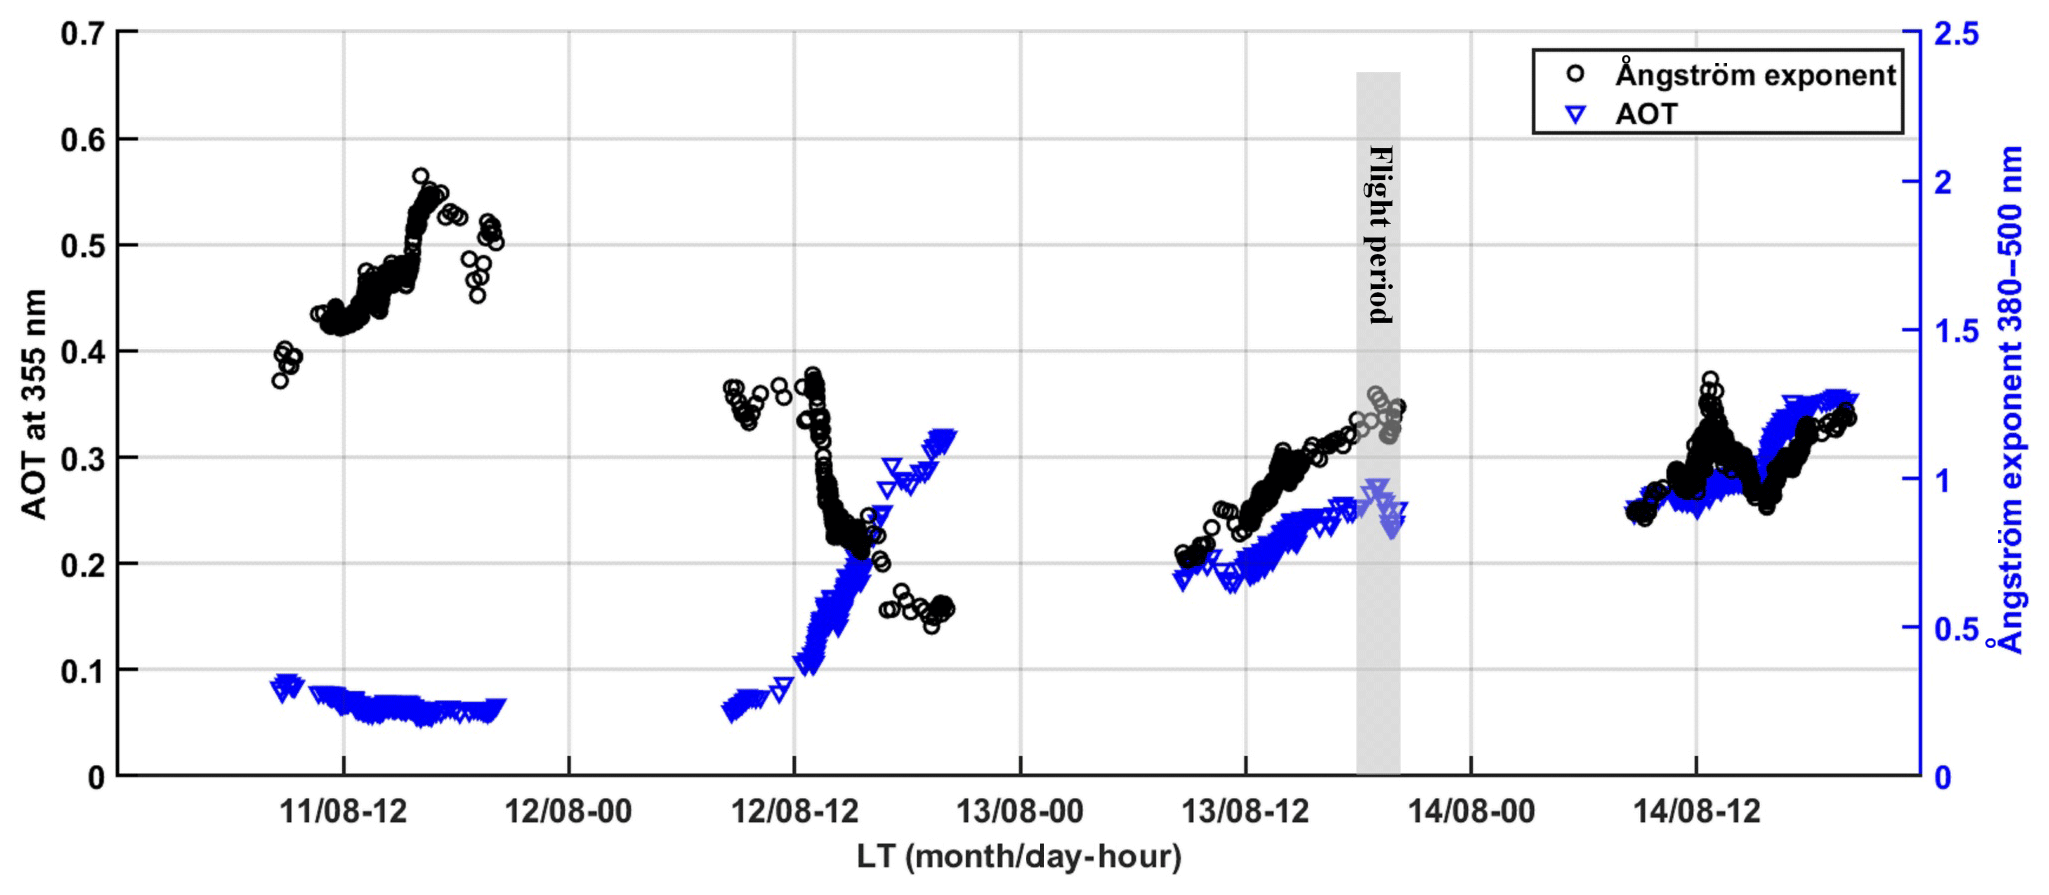
Figure 3Temporal evolution in local time (LT) of both the aerosol optical thickness (AOT) and Ångström exponent between 380 and 500 nm. The flight period is highlighted by the grey area.
The ground-based site was operational from 25 June to 23 August 2011. Within the framework of this study, which focuses on the ULA flight, the interest is on the period from 11 to 14 August when significant aerosol optical thicknesses (AOTs) were observed, as shown in Fig. 3. These AOTs may correspond to a mix of different aerosol types throughout the time period when considering the Ångström exponent range (∼ 0.3 to 1.3) also given in Fig. 3.
Whether for airborne observations (horizontal or nadir sightings) or from ground level, after the background correction, the range-corrected lidar signal, also called the apparent backscatter coefficient (ABC), S is written for the distance s from the emitter as (Ansmann et al., 1992)
C is the system constant and F is the overlap function. The backscatter coefficient βπ is the sum of the molecular and aerosol βπa backscatter coefficients for the emitted wavelength λE or the Raman backscatter coefficient for the N2-Raman wavelength λR. The molecular extinction αm is given at the emitted wavelength λE. It is worth noting that for the airborne lidar and the elastic channel of the N2-Raman lidar, λR equals λE, whereas for the N2-Channel of LAASURS, the wavelengths are different and it is necessary to take into account the Ångström exponent A derived from the sun photometer. The extinction to backscatter ratio (lidar ratio, LR) is given at the wavelength λE, and it can depend on the altitude.
3.1 Airborne lidar
The inversion of airborne lidar data is performed in two successive steps using the flight plan configuration that mixes horizontal and nadir sights. This approach was first used by Chazette et al. (2007), where it is discussed. As a reminder, the aerosol extinction coefficient αa (AEC) is calculated using horizontal sighting measurements (the angle of the line of sight with respect to the true horizon is here at ±10∘), assuming that the aerosol optical properties do not change along the line of sight between two distances s. During this flight, the lowest variability is obtained for s between 0.7 and 1.2 km, which allows us to get as far as possible from a residual effect of the overlap factor. Hence, for a flight altitude zf, the AEC is given by
An estimate of the LR can then be calculated by adjusting the inversion (Klett, 1981) of the nadir-looking lidar profiles to the AEC profile. There are several independent measurements to differentiate two aerosol layers against the altitude and to evaluate their respective LRs. The separation altitude z0 between the two layers is also evaluated, and the continuity of the LR is ensured via a sigmoid function defined against the altitude z expressed in kilometres as
LRl and LRu correspond to the LRs for the lower and upper aerosol layers, respectively. The ULICE system also allows us to evaluate the volume depolarization ratio (VDR) and then the linear particle depolarization ratio (PDR), as presented in Chazette et al. (2012).
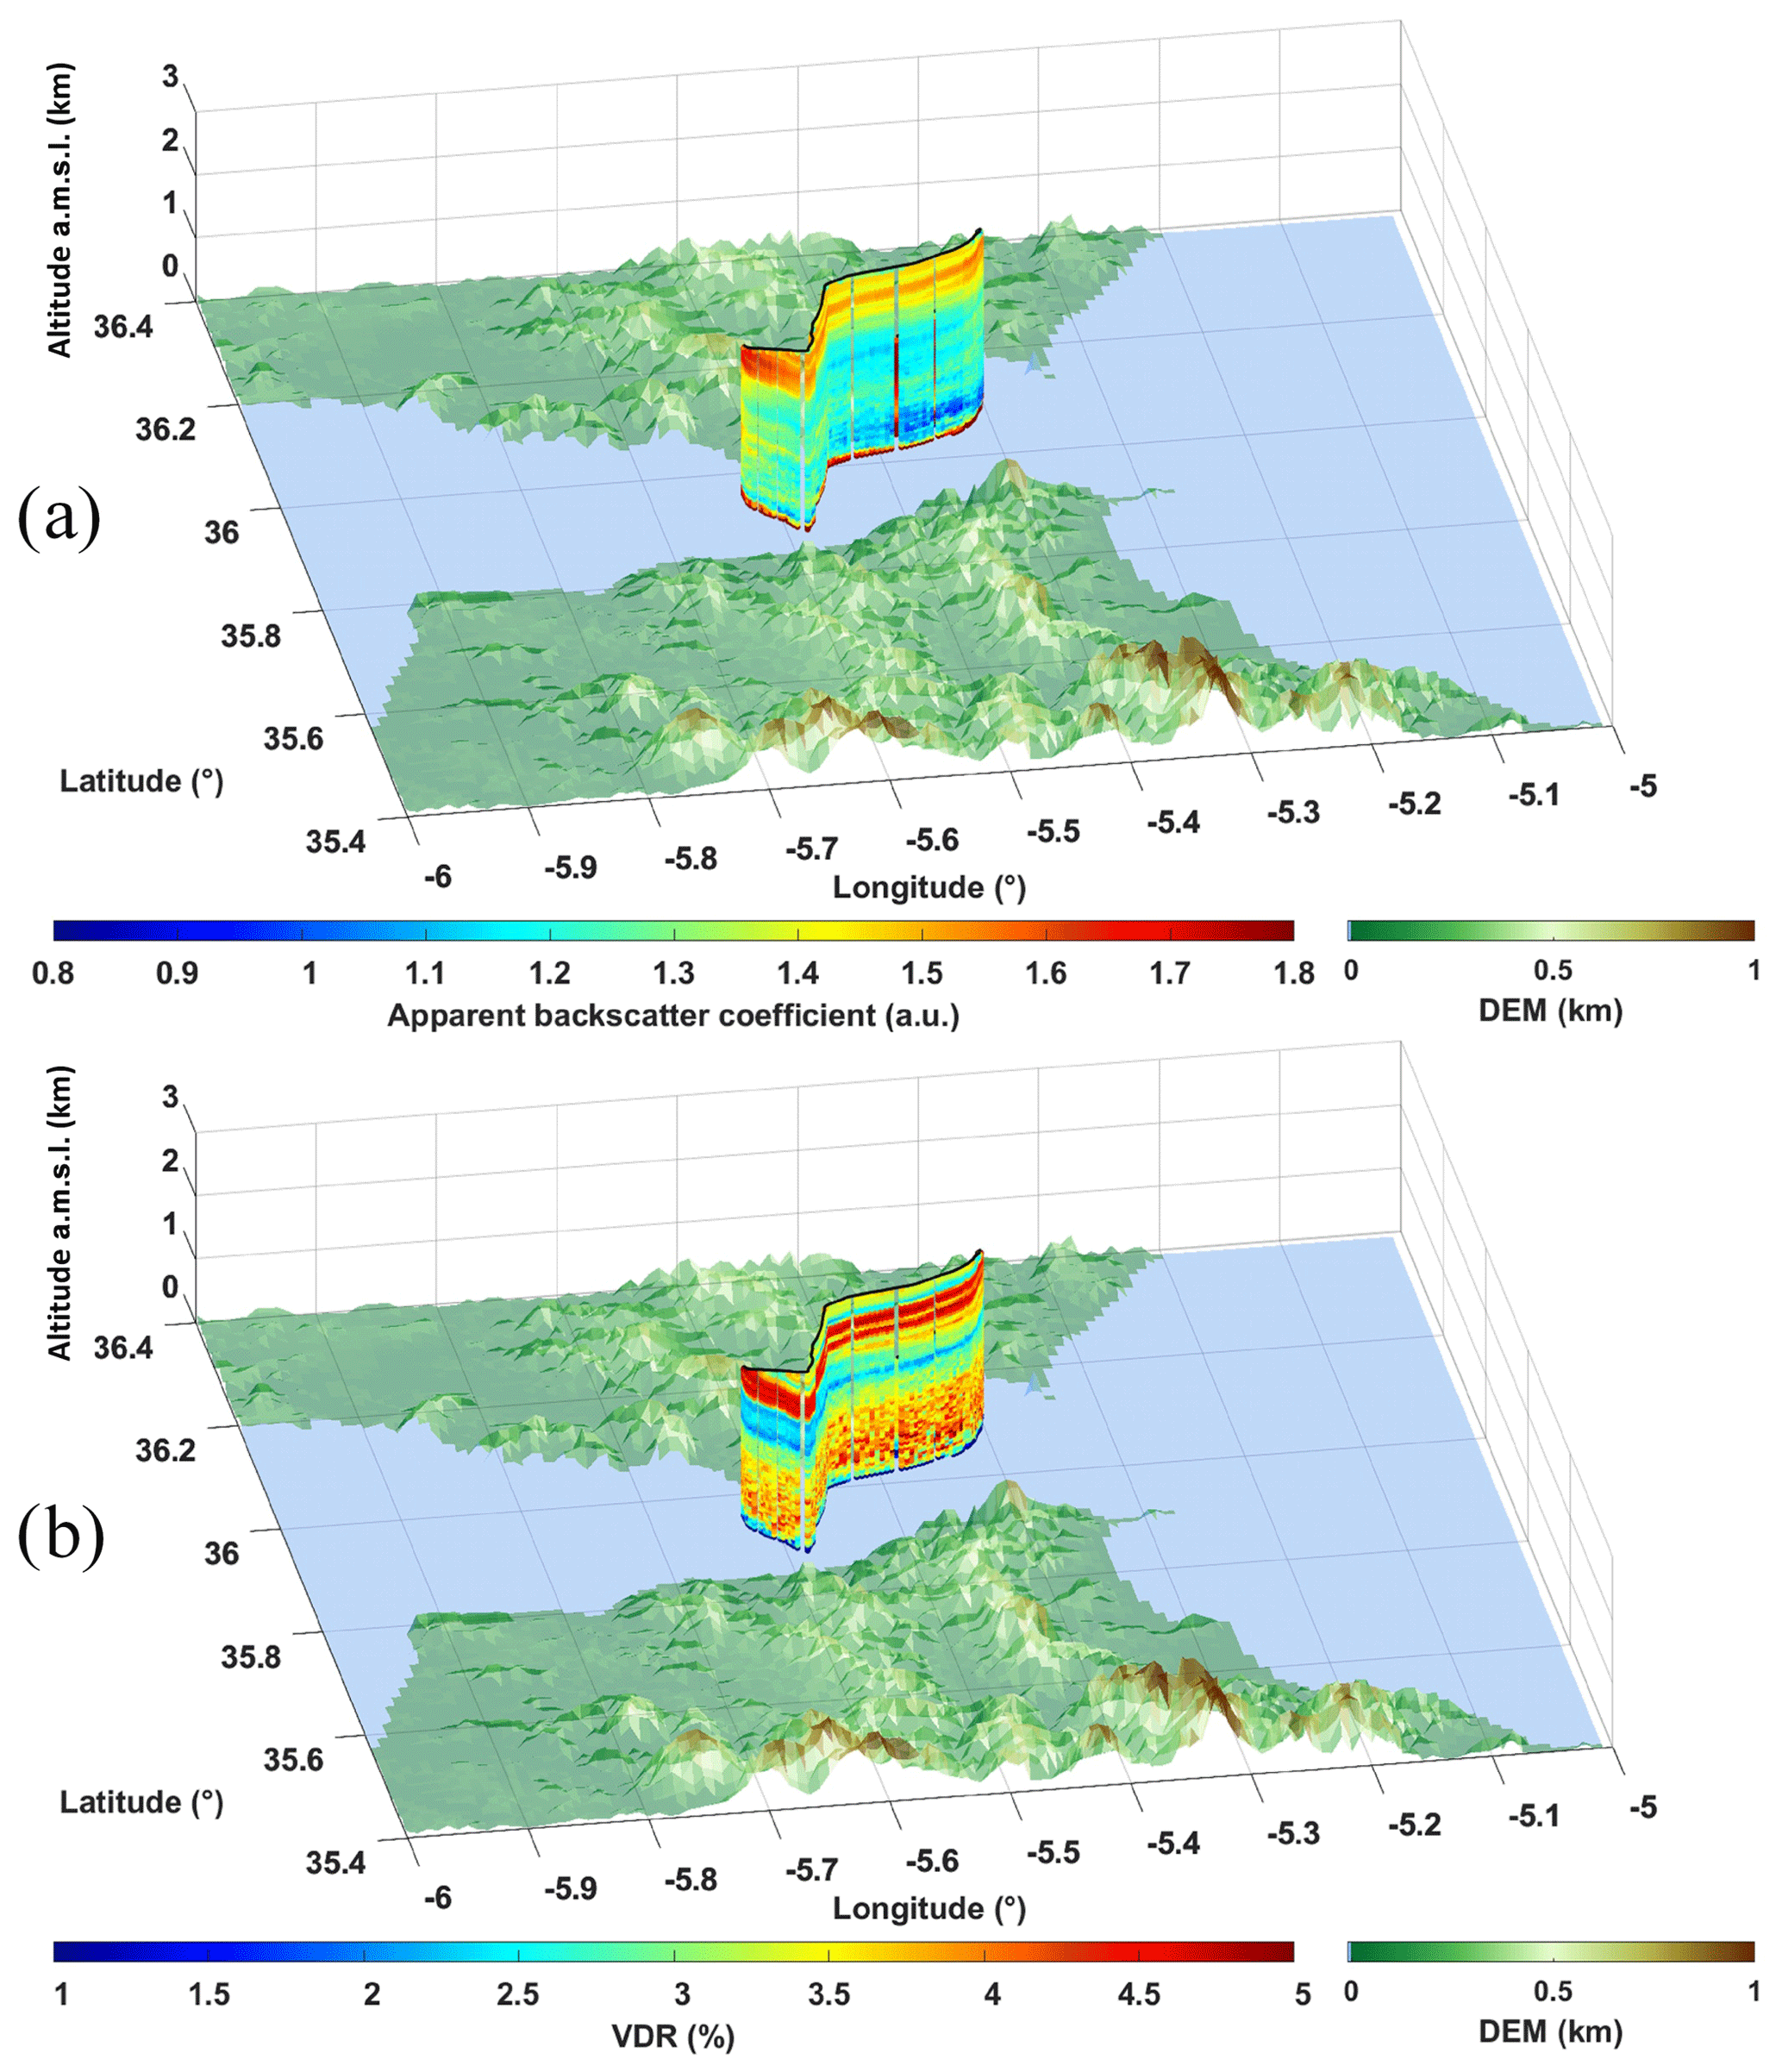
Figure 4Lidar profiles derived from ULICE on board the ULA above the Strait of Gibraltar: (a) the apparent backscatter coefficient and (b) the volume depolarization ratio (VDR). DEM stands for digital elevation model.
Figure 4 shows the vertical profiles in nadir sighting for the ABC and VDR. They are obtained in the middle of the Strait of Gibraltar. They show the presence of the two aerosol layers between the sea surface and z0∼1 km a.m.s.l., a transition to a less scattering and also low depolarizing layer, and then a second layer at an altitude above 2 km a.m.s.l. The ULA flew within the last aerosol layer, and we do not see its vertical extension that stretches beyond 3 km a.m.s.l. This layer appears more marked because the associated backscattered signal is less attenuated being close to the flight altitude. The red layer in Fig. 4, close to the sea level (∼ 200 m a.m.s.l.), corresponds to the marine boundary layer (MBL). The VDR is lower due to spherical aerosol presence. Unlike the evolution of VDR profiles along the ULA path, the layered structure of the ABC evolves significantly. The upper aerosol layer is more intense in the western part than in the eastern part of the strait of Gibraltar. There also appears to be more aerosol around 1 km a.m.s.l. on the west side.
3.2 N2-Raman lidar
The retrieval of aerosol optical properties from the N2-Raman lidar is based on the approach previously presented in various papers and used both the synergy with the sun photometer and the coupling between the elastic and N2-Raman channels of LAASURS (e.g. Chazette et al., 2016; Royer et al., 2011). The signal-to-noise ratio (SNR) of the daytime lidar profiles is insufficient to use the N2-Raman channel to reach the upper aerosol layers above 3 km a.m.s.l. and makes it difficult to identify different LR values. For this study, the inversions are performed with 30 min time averages in order to evaluate an equivalent LR value between 0.4 (excluding the residual effect of the overlap factor) and 3 km a.m.s.l. During the day, photometric data are also used assuming a constant extinction value between the ground and 0.4 km a.m.s.l. For special cases, a “two-layers” type inversion is performed as in Dieudonné et al. (2017) in order to verify that an equivalent LR does not induce significant uncertainties on the other optical parameters. As for airborne measurements, the PDR is also calculated for each lidar profile following Chazette et al. (2012).
The main sources of uncertainty for this ground-based lidar are discussed in Royer et al. (2011). The uncertainty in the determination of the equivalent LRs is in the range of 10–15 sr. The SNR limits the exploitable range of the lidar profile, as shown in Table 2 of Dieudonné et al. (2017). The relative uncertainties on the PDR are close to 10 % for the AOTs encountered at 355 nm (AOT >0.2; Fig. 3).
3.3 Cross-calibration
Apart from the overlap factor, which is determined based on horizontal sighting, it is necessary to check the calibration of the parallel and perpendicular (via the VDR) channels between the two lidars so that the derived products can be compared. VDR calibrations are carried out independently of each other according to the procedure presented in Chazette et al. (2012). They should result in identical vertical profiles for both instruments. The cross-comparison experiment was performed at the San Pedro Alcantara site on 6 August 2011 a few days before the flight. The results are shown in Fig. 5. The different vertical structures are coherent. The ABC profiles (Fig. 5a) match very well with good agreement considering the molecular signal above the aerosol layer (>4 km a.m.s.l.). The absolute deviation on the VDR is less than 0.2 % (Fig. 5b), leading to an absolute error of less than 2 % on the PDR for the aerosol layers encountered during the experiment.
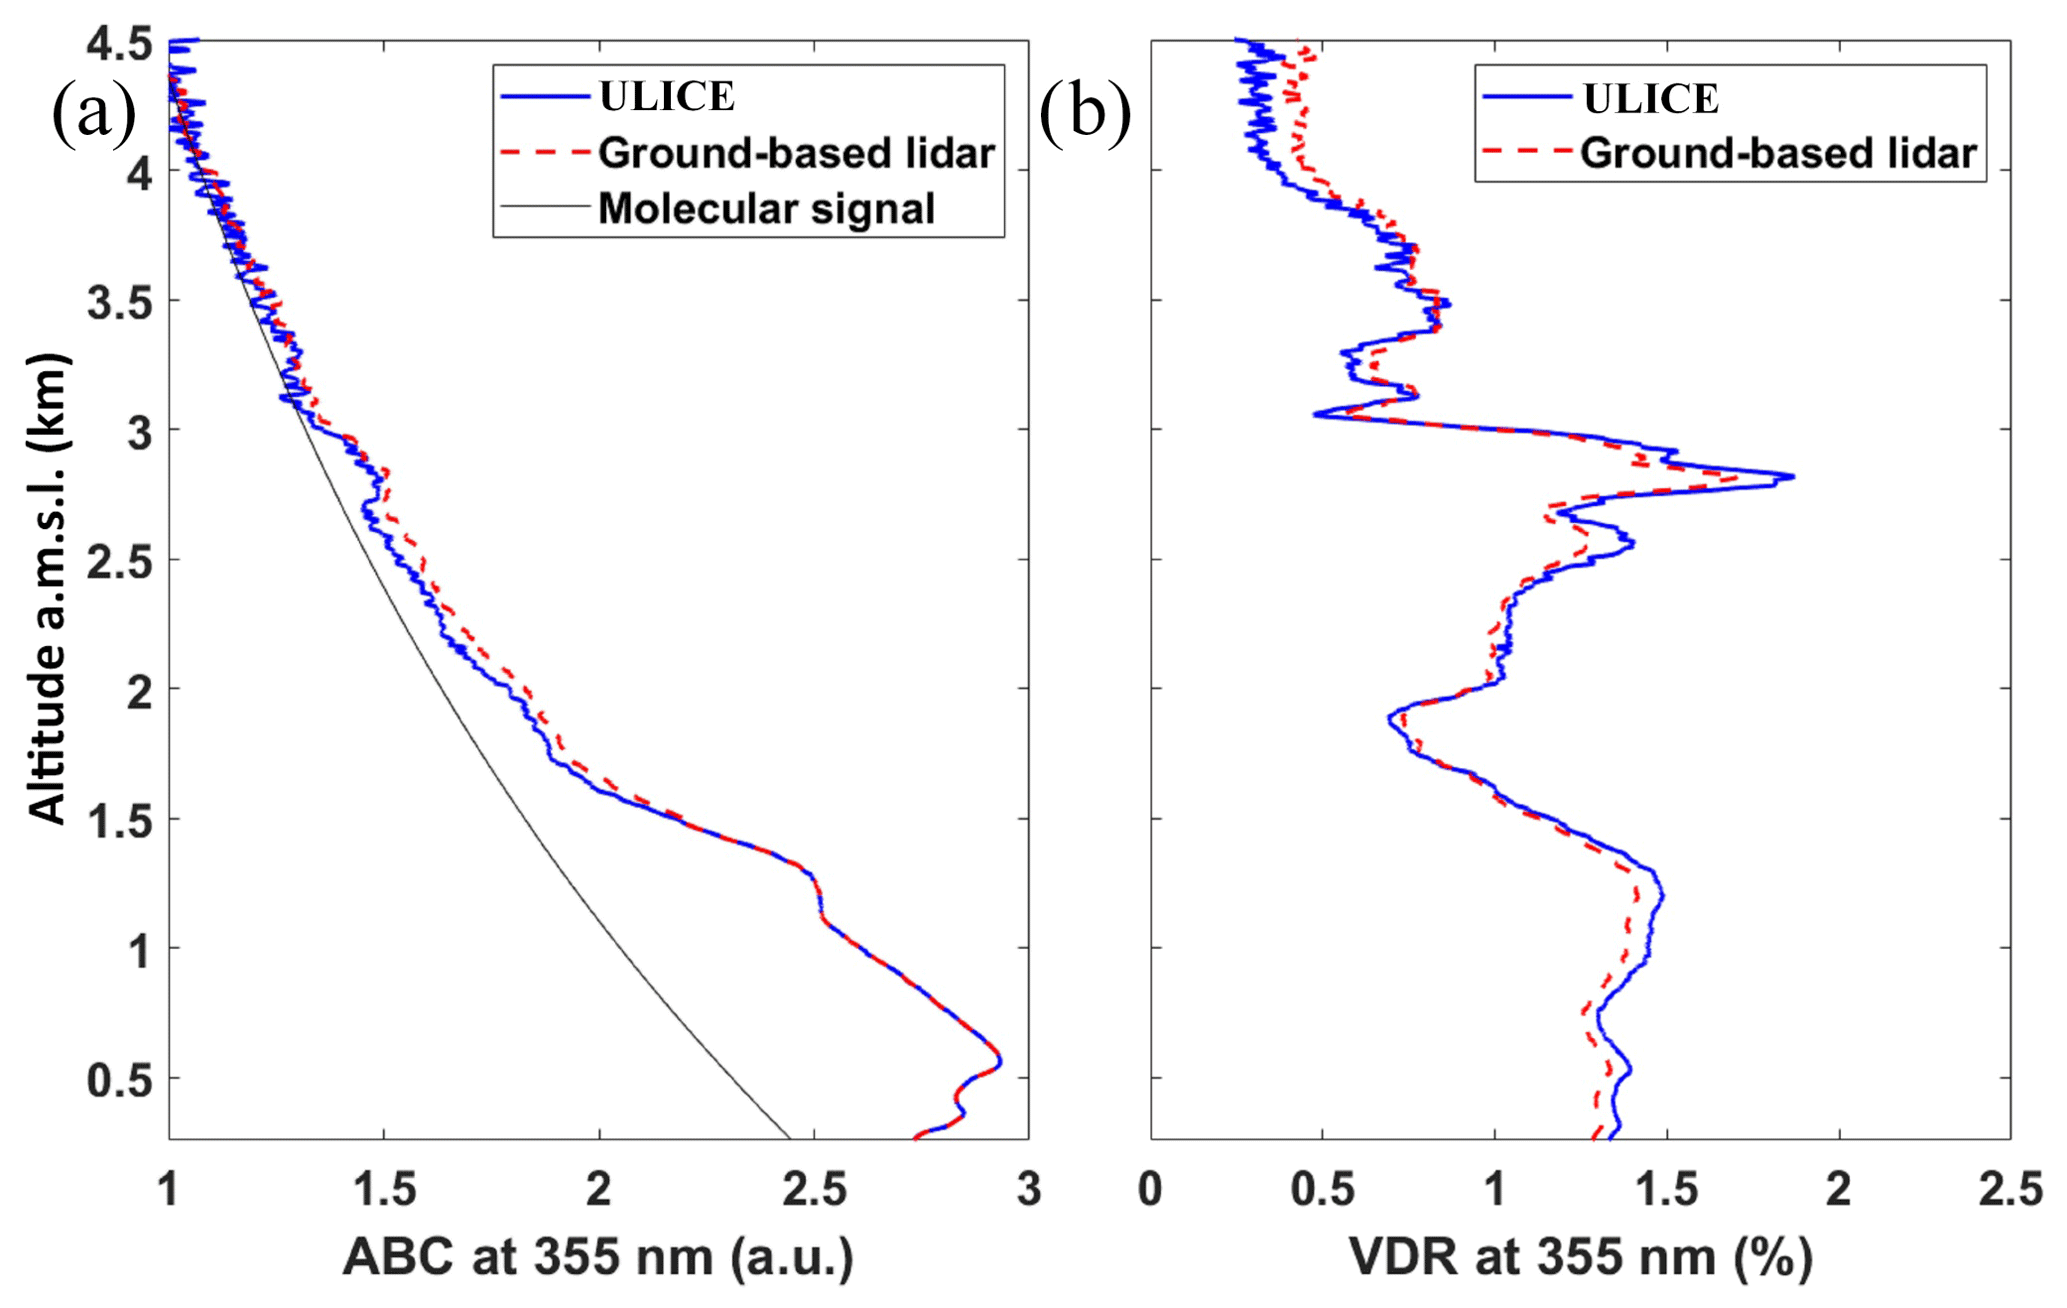
Figure 5Vertical profiles of the (a) apparent backscatter coefficient (ABC) and (b) volume depolarization ratio (VDR) derived from the ground-based N2-Raman lidar LAASURS and the lidar ULICE placed at ground level in zenith sighting.
The lidar observations will be analysed in two stages. In the first stage, the aerosol layers over the Strait of Gibraltar and their associated optical properties will be studied. The link with ground-based lidar measurements at San Pedro Alcantara will be discussed in the second stage.
4.1 Aerosol optical properties from the airborne lidar
In Fig. 6a, the vertical profile of the AEC retrieved from horizontal sighting is shown for the flight between 19:50 and 21:20 LT on 13 August 2011. A very close profile has been derived using nadir sighting when considering an LR sr below 1 km a.m.s.l. and an LR sr above this altitude. The first corresponds to what is expected for marine aerosols (e.g. Chazette et al., 2019; Flamant et al., 2000), while the second corresponds more to Saharan dust aerosols (e.g. Papayannis et al., 2008; Soupiona et al., 2018). Using both the LRs and AEC, Fig. 6b shows the corresponding vertical profile of the PDR. The two profiles match very well with a lower PDR value (∼ 5 %) within the MBL, as expected. The MBL presents a higher variability of the AEC, which may not be linked only to the heterogeneity of the wind field in the Strait of Gibraltar but also to strong maritime activity with the presence of numerous tankers. The PDR at 355 nm is between 10 % and 15 % within the dust layer, which appears low for a potential layer of Saharan aerosols for which one would expect values between 20 % and 30 % (e.g. Freudenthaler et al., 2009). Note that lower values have been reported by Papayannis et al. (2008) and Chazette et al. (2016) (∼10 %–27 %), as well as by Soupiona et al. (2019) (11±1 %–34±2 %).
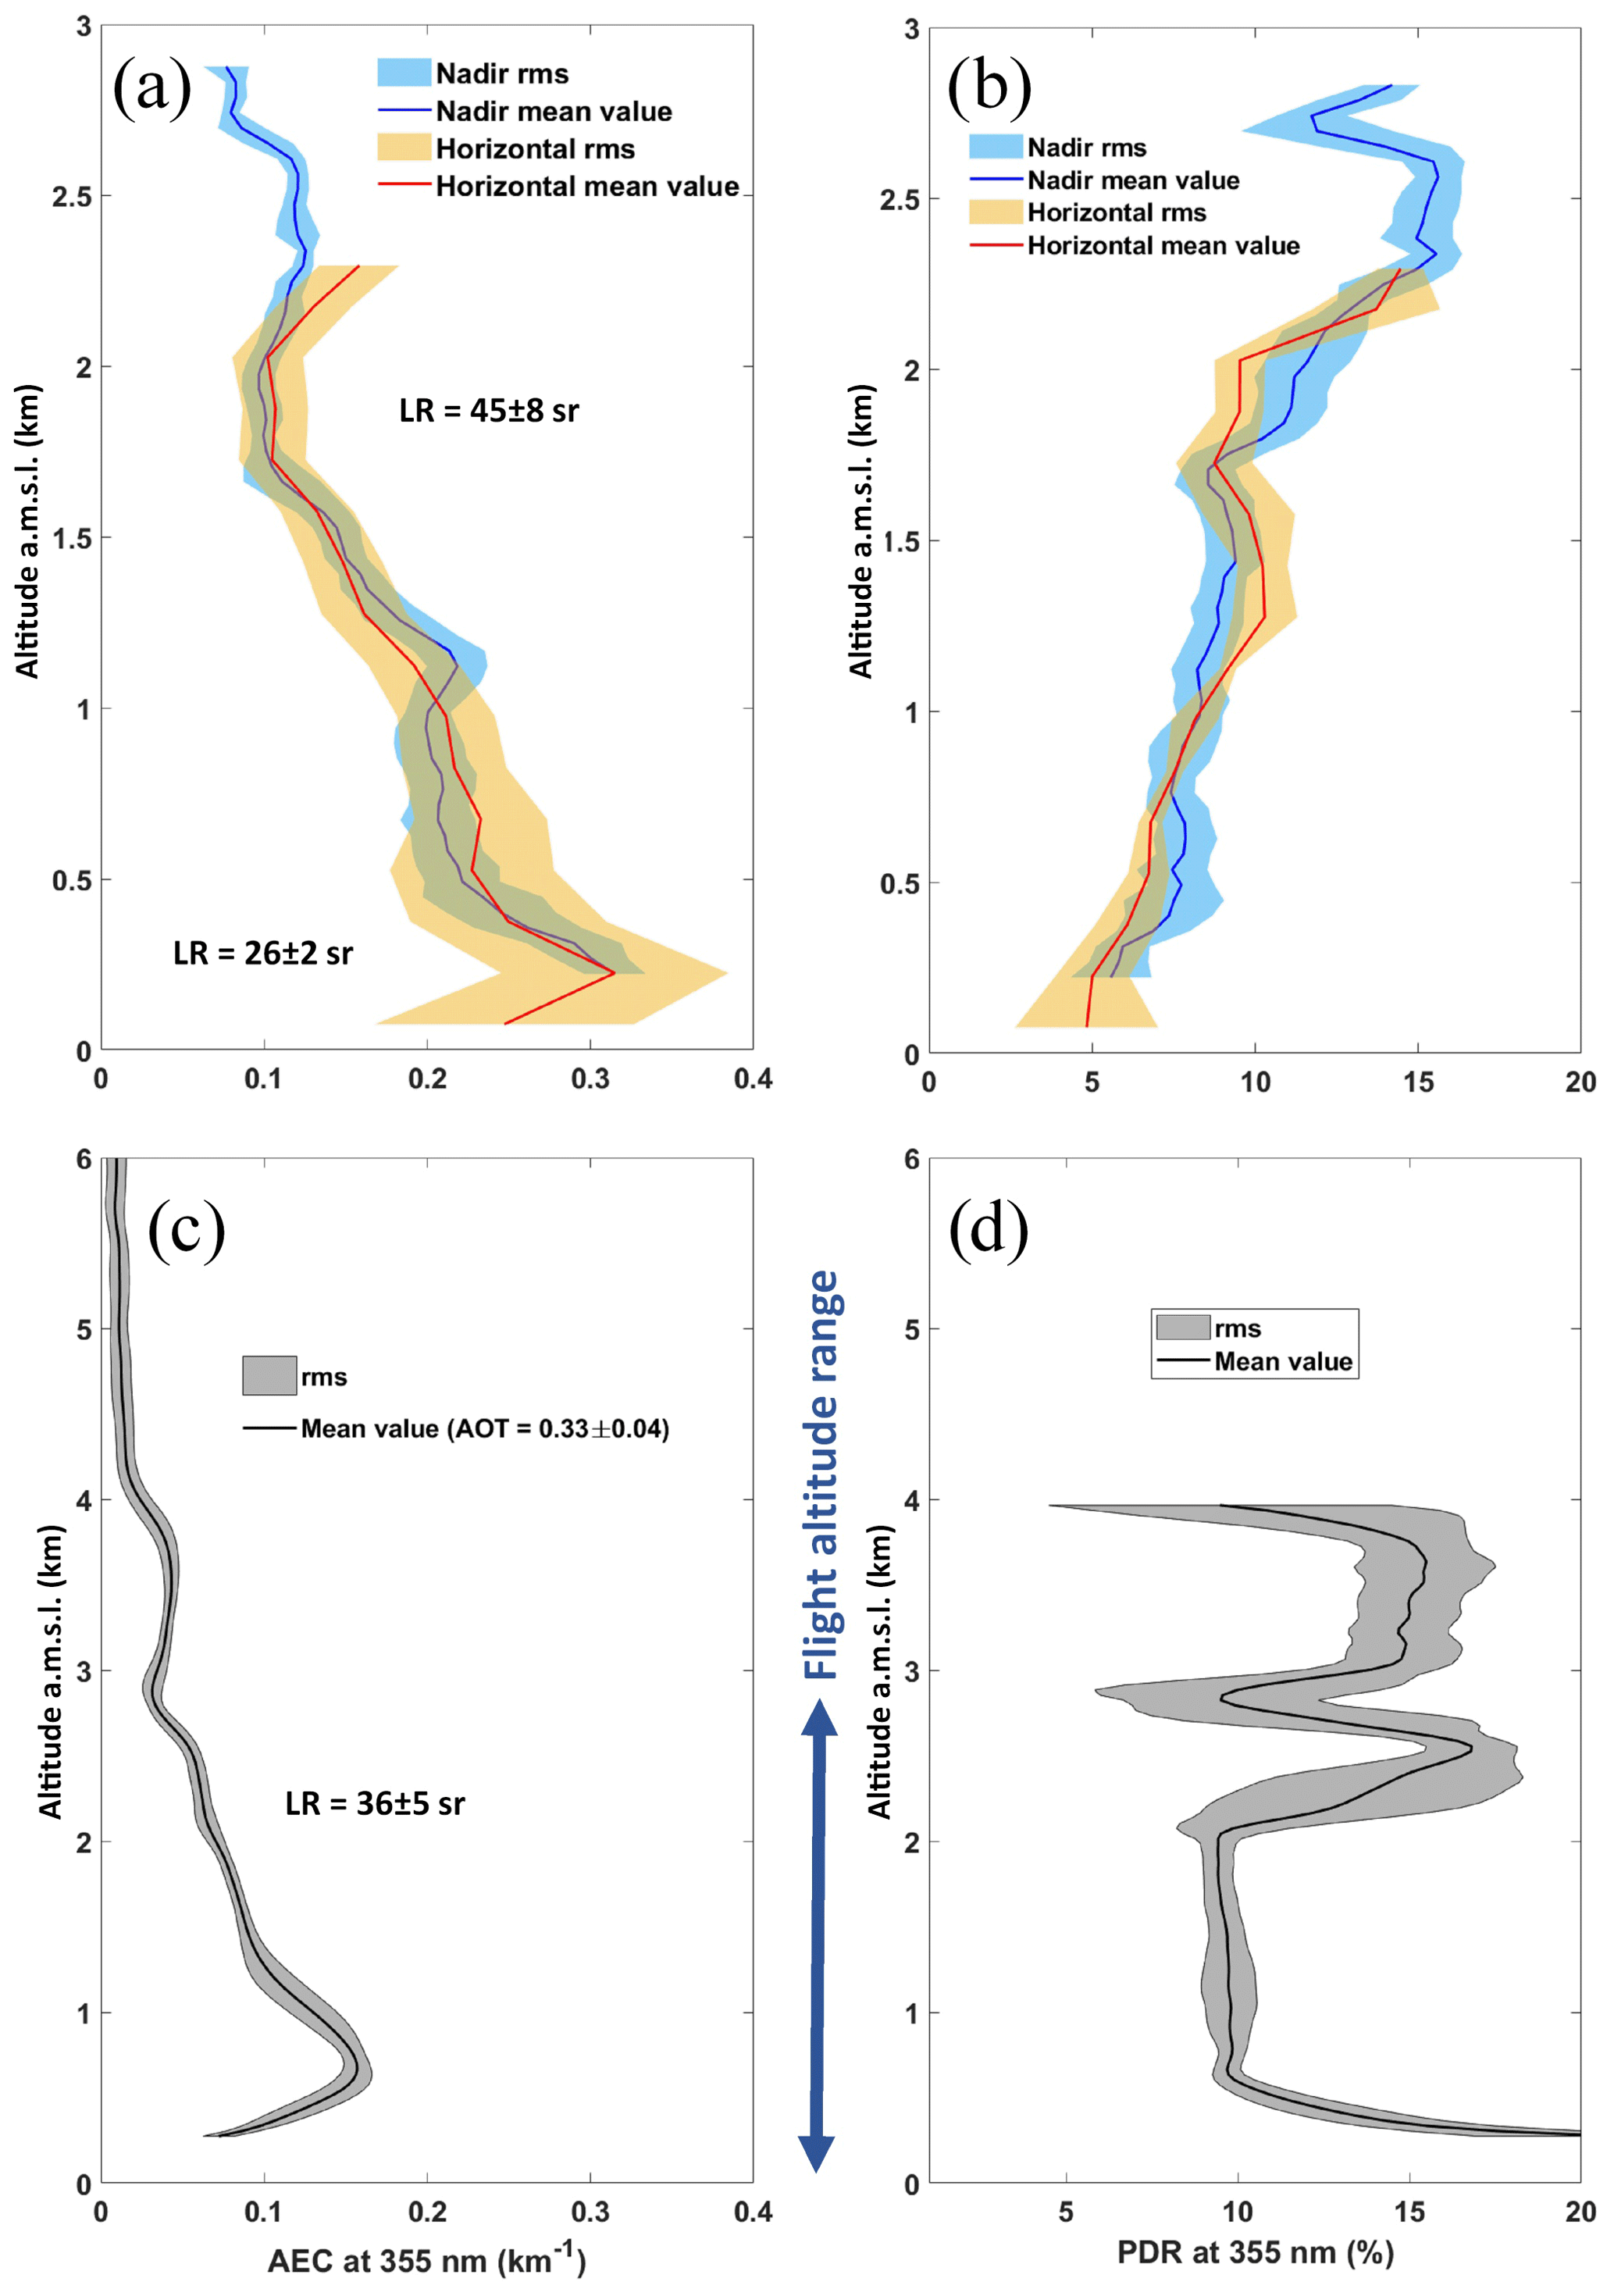
Figure 6Vertical profiles of (a) the aerosol extinction coefficient (AEC) derived from the airborne lidar for horizontal and nadir sightings, (b) the particle depolarization ratio (PDR) derived from the airborne lidar for horizontal and nadir sightings, (c) the AEC derived from the ground-based lidar, and (d) the PDR derived from the ground-based lidar. The ground-based profiles correspond to an average between 19:00 and 22:00 LT on 13 August 2011. The aerosol optical thickness (AOT) is also given in Fig. 6c. In the figure, rms stands for root mean square.
4.2 Link with the ground-based lidar
Only ground-based lidar observations between 11 and 15 August will be considered here. This period allows the framing of the airborne measurements by showing the atmospheric conditions before and after the flight. Figure 7 shows the temporal evolution of the AEC and PDR profiles, the equivalent LR in the aerosol column, and the AOT. A first event can be identified on 11 August with AOTs ∼ 0.5 at 355 nm. It appears to diminish on 12 August and to start again on 13 August. The presence of depolarizing particles is shown from the PDR to ∼ 6 km a.m.s.l. on 11 and 13 August. It is this presence, with a favourable weather forecast, that triggered the flight of 13 August in the late afternoon with an AOT ∼ 0.35 at 355 nm.

Figure 7Ground-based lidar-derived temporal evolution of the vertical profiles of (a) the aerosol extinction coefficient (AEC), the particle depolarization ratio (PDR), and (c) the lidar ratio (LR). In panel (c), the aerosol optical thickness (AOT), as derived from both the ground-based lidar and sun photometer, are also shown. The time location of the ULA flight over the Strait of Gibraltar is highlighted by the light-red area and is around 20:30 LT on 13 August 2011.
The mean AEC and PDR profiles derived from the ground-based lidar during the flight period are shown in Fig. 6c and d, respectively. Even if the shape of the AEC profile is similar to that retrieved from the airborne measurements between 0 and 3 km a.m.s.l., the amplitude is lower by a factor of more than 2. The PDR nevertheless appears consistent between the airborne and ground-based measurements in the dust-like layers with values close to 15 % in the layer between 2 and 3 km a.m.s.l. Near the surface, high PDR values (>15 %) are observed over San Pedro Alcantara. These values may be associated with local uprisings of dust aerosols (reported by visual observations at the site), which were less present before the afternoon of 13 August (Fig. 7b). In the late afternoon of 13 August, the LR value is intermediate (36±5 sr) compared to those of the two layers identified from airborne measurements (from 26±2 to 45±8 sr). Figure 8 shows the inversion of the average profile in Fig. 6c using a two-layer distribution of the LR similar to that considered for vertical profiles from ULICE. The adjustment leads to similar LR values for the upper layer (34±4 sr) compared to an inversion with a constant LR. The discrepancy with the vertical profiles retrieved above the Strait of Gibraltar is mainly in the lower layer, where the value of 45±6 sr is more in favour of the presence of dust-like aerosols than marine aerosols for San Pedro Alcantara. Nevertheless, we note the presence of aerosols of marine origin below 1 km a.m.s.l. before noon on 13 August. During the day on 12 August, low-layer structures are observed in Fig. 7b, which can suggest mixtures between marine and dust aerosols. The values of the LR can then go below 35 sr and can drop to ∼ 25 sr.

Figure 8Mean vertical profiles derived from the ground-based lidar between 19:00 and 22:00 LT on 13 August 2011: aerosol extinction coefficient (AEC), particle depolarization ratio (PDR), and lidar ratio (LR).
Since the two lidars are consistent when measuring at the same site, the observed differences are therefore related to different local emissions for the lower layers and different transport processes for the upper layers, although the distance between the two measurement points is only about 50 km. Nevertheless, it is worth noting that the range of LR values found in the literature for dusts is quite wide, ranging from 28 sr (Soupiona et al., 2019) to 80 sr (Papayannis et al., 2008). Intermediate values are reported in the Aegean Sea by Giannakaki et al. (2010) (52±18 sr) and Siomos et al. (2018) (Spring sr, Summer sr, Autumn sr). Over the Iberian Peninsula, Fernández et al. (2019) report LRs between 44 and 55 sr corresponding to an extreme Saharan dust event intrusion. Chazette et al. (2007) reported values in the order of 40 sr for pure dust aerosols above Niger. Such variability may make the LR indiscriminate in the identification of atmospheric aerosols. Veselovskii et al. (2020) explained that the lidar ratio of dust aerosols at 355 nm above Senegal strongly depends on the imaginary part of the refractive index and that such low values of LRs observed in this work may indicate an imaginary part that is too low.
Desert dust from northern Africa is one of the main sources of aerosols over the Gibraltar area. Their transport is linked to large-scale meteorological conditions. On the decadal time scale, it has already been shown that the North Atlantic Oscillation (NAO) index can play a significant role in the occurrences of desert dust transport over the western Mediterranean (Moulin et al., 1997) with higher mean optical thicknesses during periods of positive NAO. The NAO index was negative over the period of the experiment, as shown in Fig. 9 plotted from data recorded at the site https://climatedataguide.ucar.edu/climate-data/hurrell-north-atlantic-oscillation-nao-index-station-based (last access: 14 August 2020; Hurrell et al., 2004; Hurrell and Deser, 2010). Nonetheless, it is still somewhat higher than those encountered during most summer situations in the decade including the period of the experiment. This intermediate regime therefore does not provide a clear view of the specificity of summer 2011 in terms of the occurrence of dust transport events over southern Spain.

Figure 9Temporal evolution of the monthly average North Atlantic Oscillation (NAO) index. The data are those of the site https://climatedataguide.ucar.edu/climate-data/hurrell-north-atlantic-oscillation-nao-index-station-based. The grey area highlights summer 2011 when the SUSIE field campaign took place.
From a local perspective, the particles influencing mainly the planetary boundary layer (PBL) close to the Gibraltar area are related to marine emissions but also to industrial activities, as shown by Gallero et al. (2006). The region of Gibraltar, near Algeciras, is indeed significantly industrialized with a refinery, a petrochemical factory, a steel factory, a coal power plant, a heavy fuel oil power plant, and a paper factory, all of which emit particles and aerosol precursors.
5.1 Meteorological situation
During the period of the airborne experiment, the Azores high was moving strongly northward (Fig. 10) leading to a blockage in the flow from the African coast and even the establishment of a north–south circulation at 850 hPa over the Strait of Gibraltar. On 13 August 2011 (Fig. 10a), the air masses arriving over the Strait of Gibraltar were coming from the north-west, passing over the Iberian Peninsula. This type of circulation is obviously not favourable for the transport of dust from a Saharan origin. It was different on 11 August when a small depression was present west of the Strait of Gibraltar, facilitating the transport of aerosols from Morocco (Fig. 10b). These two contrasting weather patterns may explain the evolution of the LR in the upper aerosol layer between 11 and 13 August.
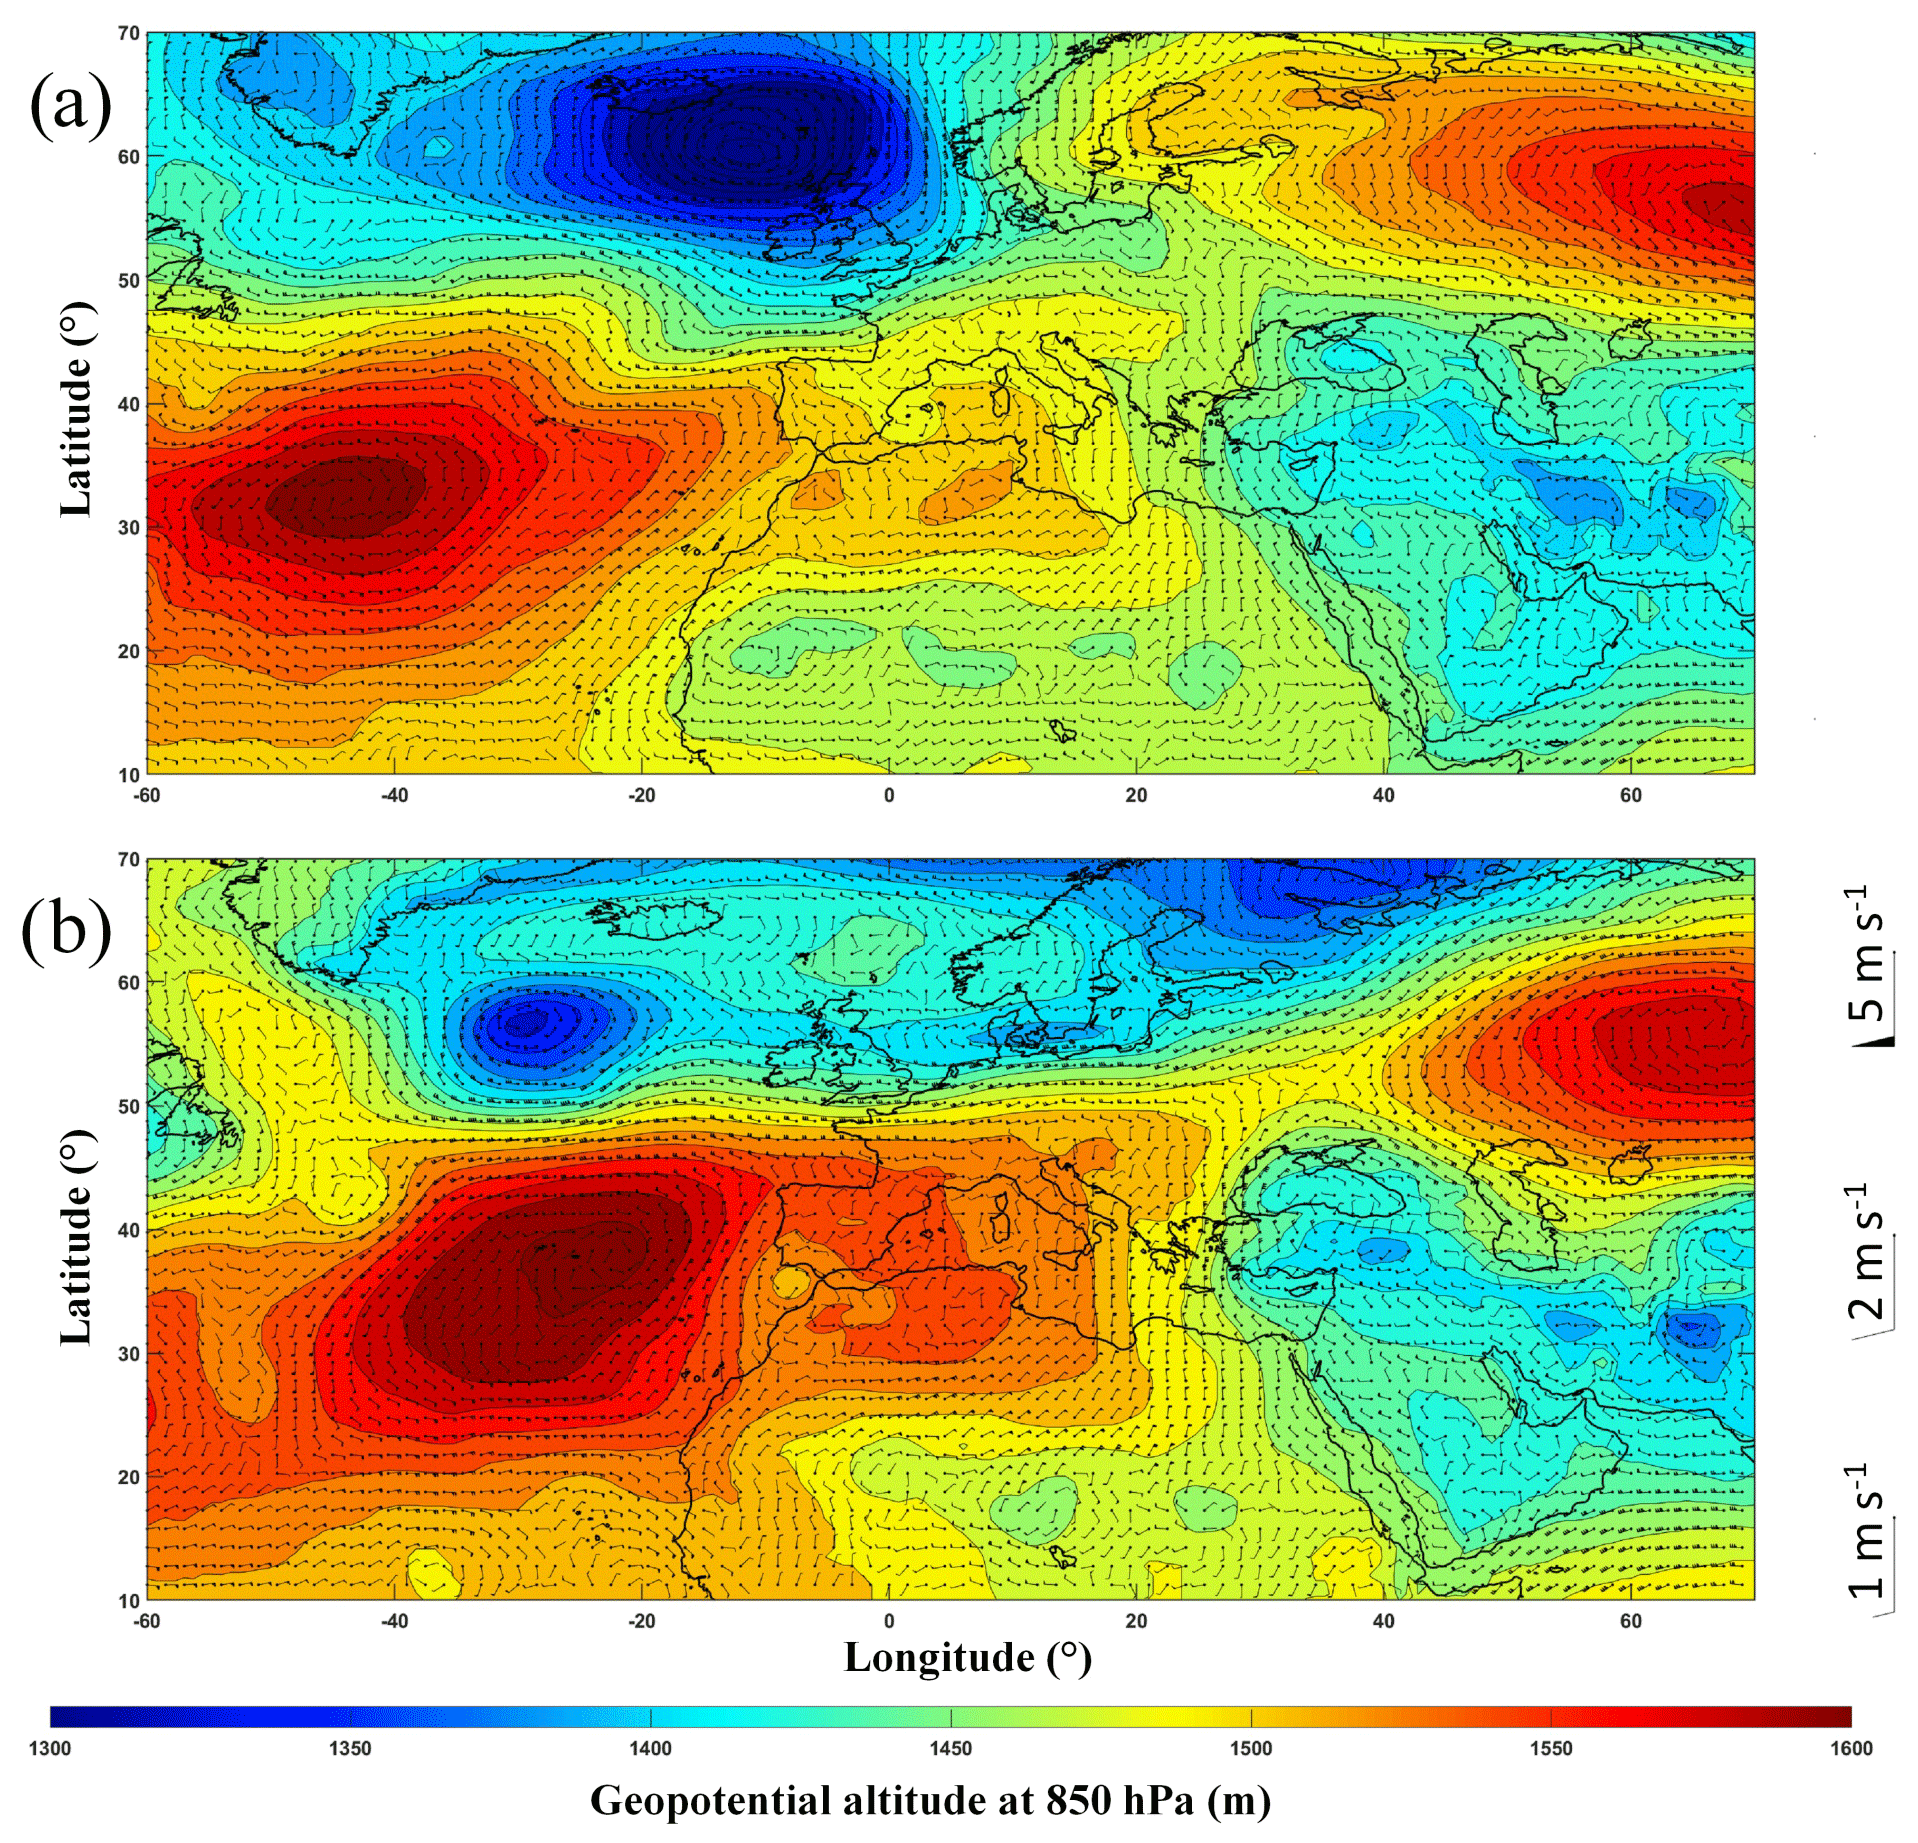
Figure 10Geopotential altitude at 850 hPa on (a) 13 August 2011 at 18:00 UTC and (b) 11 August 2011 at 18:00 UTC. The wind fields at the same pressure level are superimposed. The ERA5 reanalyses (https://www.ecmwf.int/en/forecasts/datasets/archive-datasets/reanalysis-datasets/era5, last access: 14 August 2020) with a horizontal resolution of 0.25∘ are used.

Figure 11Aerosol optical thickness (AOT) at 550 nm derived from MODIS on (a) 13 August 2011 and (b) 11 August 2011.
5.2 Spaceborne observations
The location of aerosol plumes can be highlighted by the Moderate Resolution Imaging Spectroradiometer (MODIS) on board the polar-orbiting platforms Terra and Aqua (King et al., 1992; Salmonson et al., 1989). The level-2 products are provided with a spatial horizontal resolution of 10 km×10 km (http://modis.gsfc.nasa.gov, last access: 14 August 2020). The uncertainty on the AOT is AOT over land and AOT over ocean (Chu et al., 2002). A combination of the AOT at 550 nm derived from the two satellites is given in Fig. 11. On 13 August 2011 (Fig. 11a), a significant contrast is observed between the west and east of the Strait of Gibraltar with a higher AOT (∼ 0.4) at 550 nm to the west. This is consistent with what was inferred from the airborne lidar observations compared to those made from the ground-based lidar at San Pedro Alcantara. In contrast, on 11 August, similar AOTs (>0.6) are observed over the Atlantic Ocean and the Mediterranean Sea (Fig. 11b). The higher AOTs are consistent with those retrieved from the ground-based lidar. The continuity of the aerosol plume between the Moroccan coast and the Strait of Gibraltar is more pronounced than on 13 August.
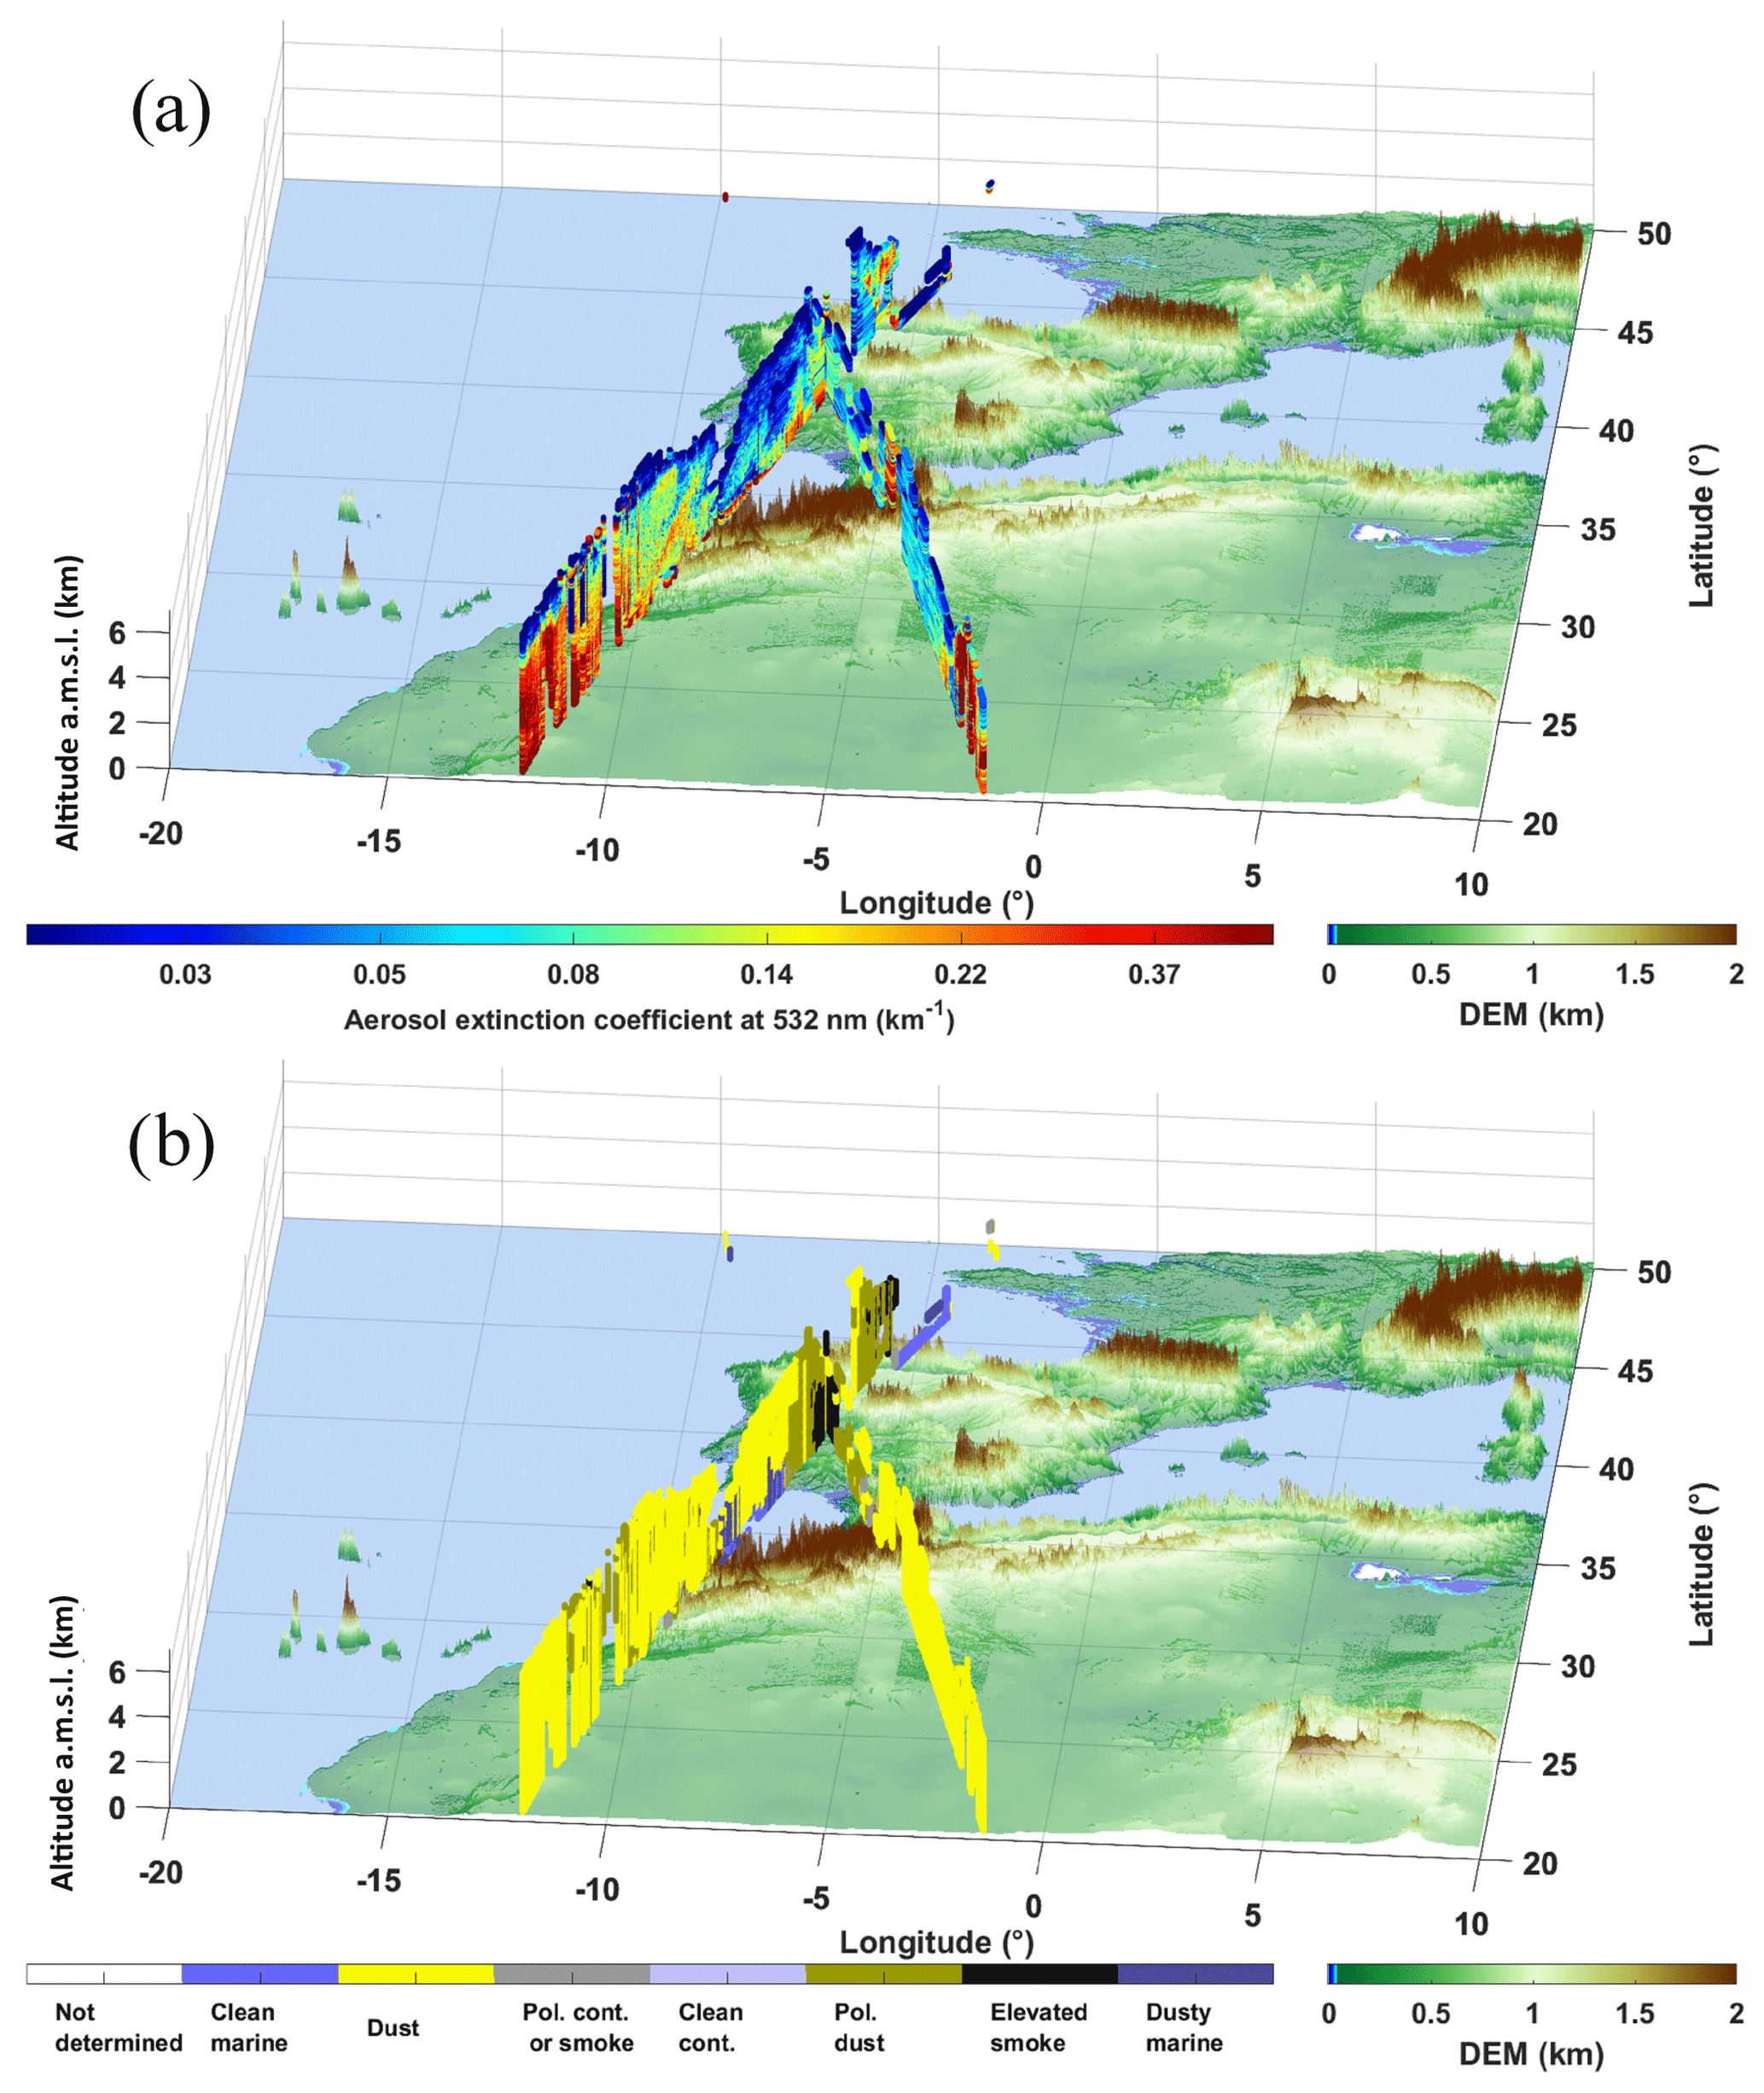
Figure 12CALIOP-derived (a) aerosol extinction coefficient at 532 nm and (b) aerosol typing. Two orbits are plotted on 13 August 2011, the first one during nighttime at ∼ 02:40 UTC (westernmost over northern Africa) and the second one during daytime at ∼ 13:40 UTC (easternmost over northern Africa). DEM stands for digital elevation model.
Complementing the data from MODIS, the vertical profiles of the aerosol layers are derived from the Cloud-Aerosol LIdar with Orthogonal Polarization (CALIOP) on board Cloud-Aerosol Lidar and Infrared Pathfinder Satellite Observation (CALIPSO; http://www-calipso.larc.nasa.gov, last access: 14 August 2020; Winker et al., 2007). The 4.10 version of CALIOP level-2 data is used, whose aerosol typing has been improved (Burton et al., 2015). A night orbit (∼ 02:40 UTC) over the Atlantic and a day orbit (∼ 12:40 UTC) just over the Strait of Gibraltar were used for 13 August. They both show aerosol layers up to ∼ 4 km a.m.s.l. for the studied area (Fig. 12a). These layers are mainly identified as dusts and polluted dusts (Fig. 12b). Over Gibraltar (daytime orbit), polluted dusts are predominant. They are also preponderant over the Iberian Peninsula with even elevated smoke over land. This is therefore consistent with what has been found as a vertical structure and LR via the airborne lidar. At this stage, the upper aerosol layer that was sampled by the airborne lidar does not appear to be pure dusts but a mix that can be associated with air masses of different origins.
5.3 Air mass origins
In order to better identify the origin of the aerosols observed during the field campaign, back trajectory studies were performed. For this, the Single Particle Lagrangian Integrated Trajectory (HYSPLIT; Stein et al., 2015) model was used. It was initialized according to lidar observations over the Strait of Gibraltar and San Pedro Alcantara. The wind fields used were taken from the Global Data Assimilation System (GDAS; http://www.ncep.noaa.gov/, last access: 14 August 2020) at the horizontal resolution of 0.5∘. HYSPLIT operated in ensemble mode; i.e. 27 back trajectories are computed for each end location and for different altitude ranges with a vertical sampling of 250 m.
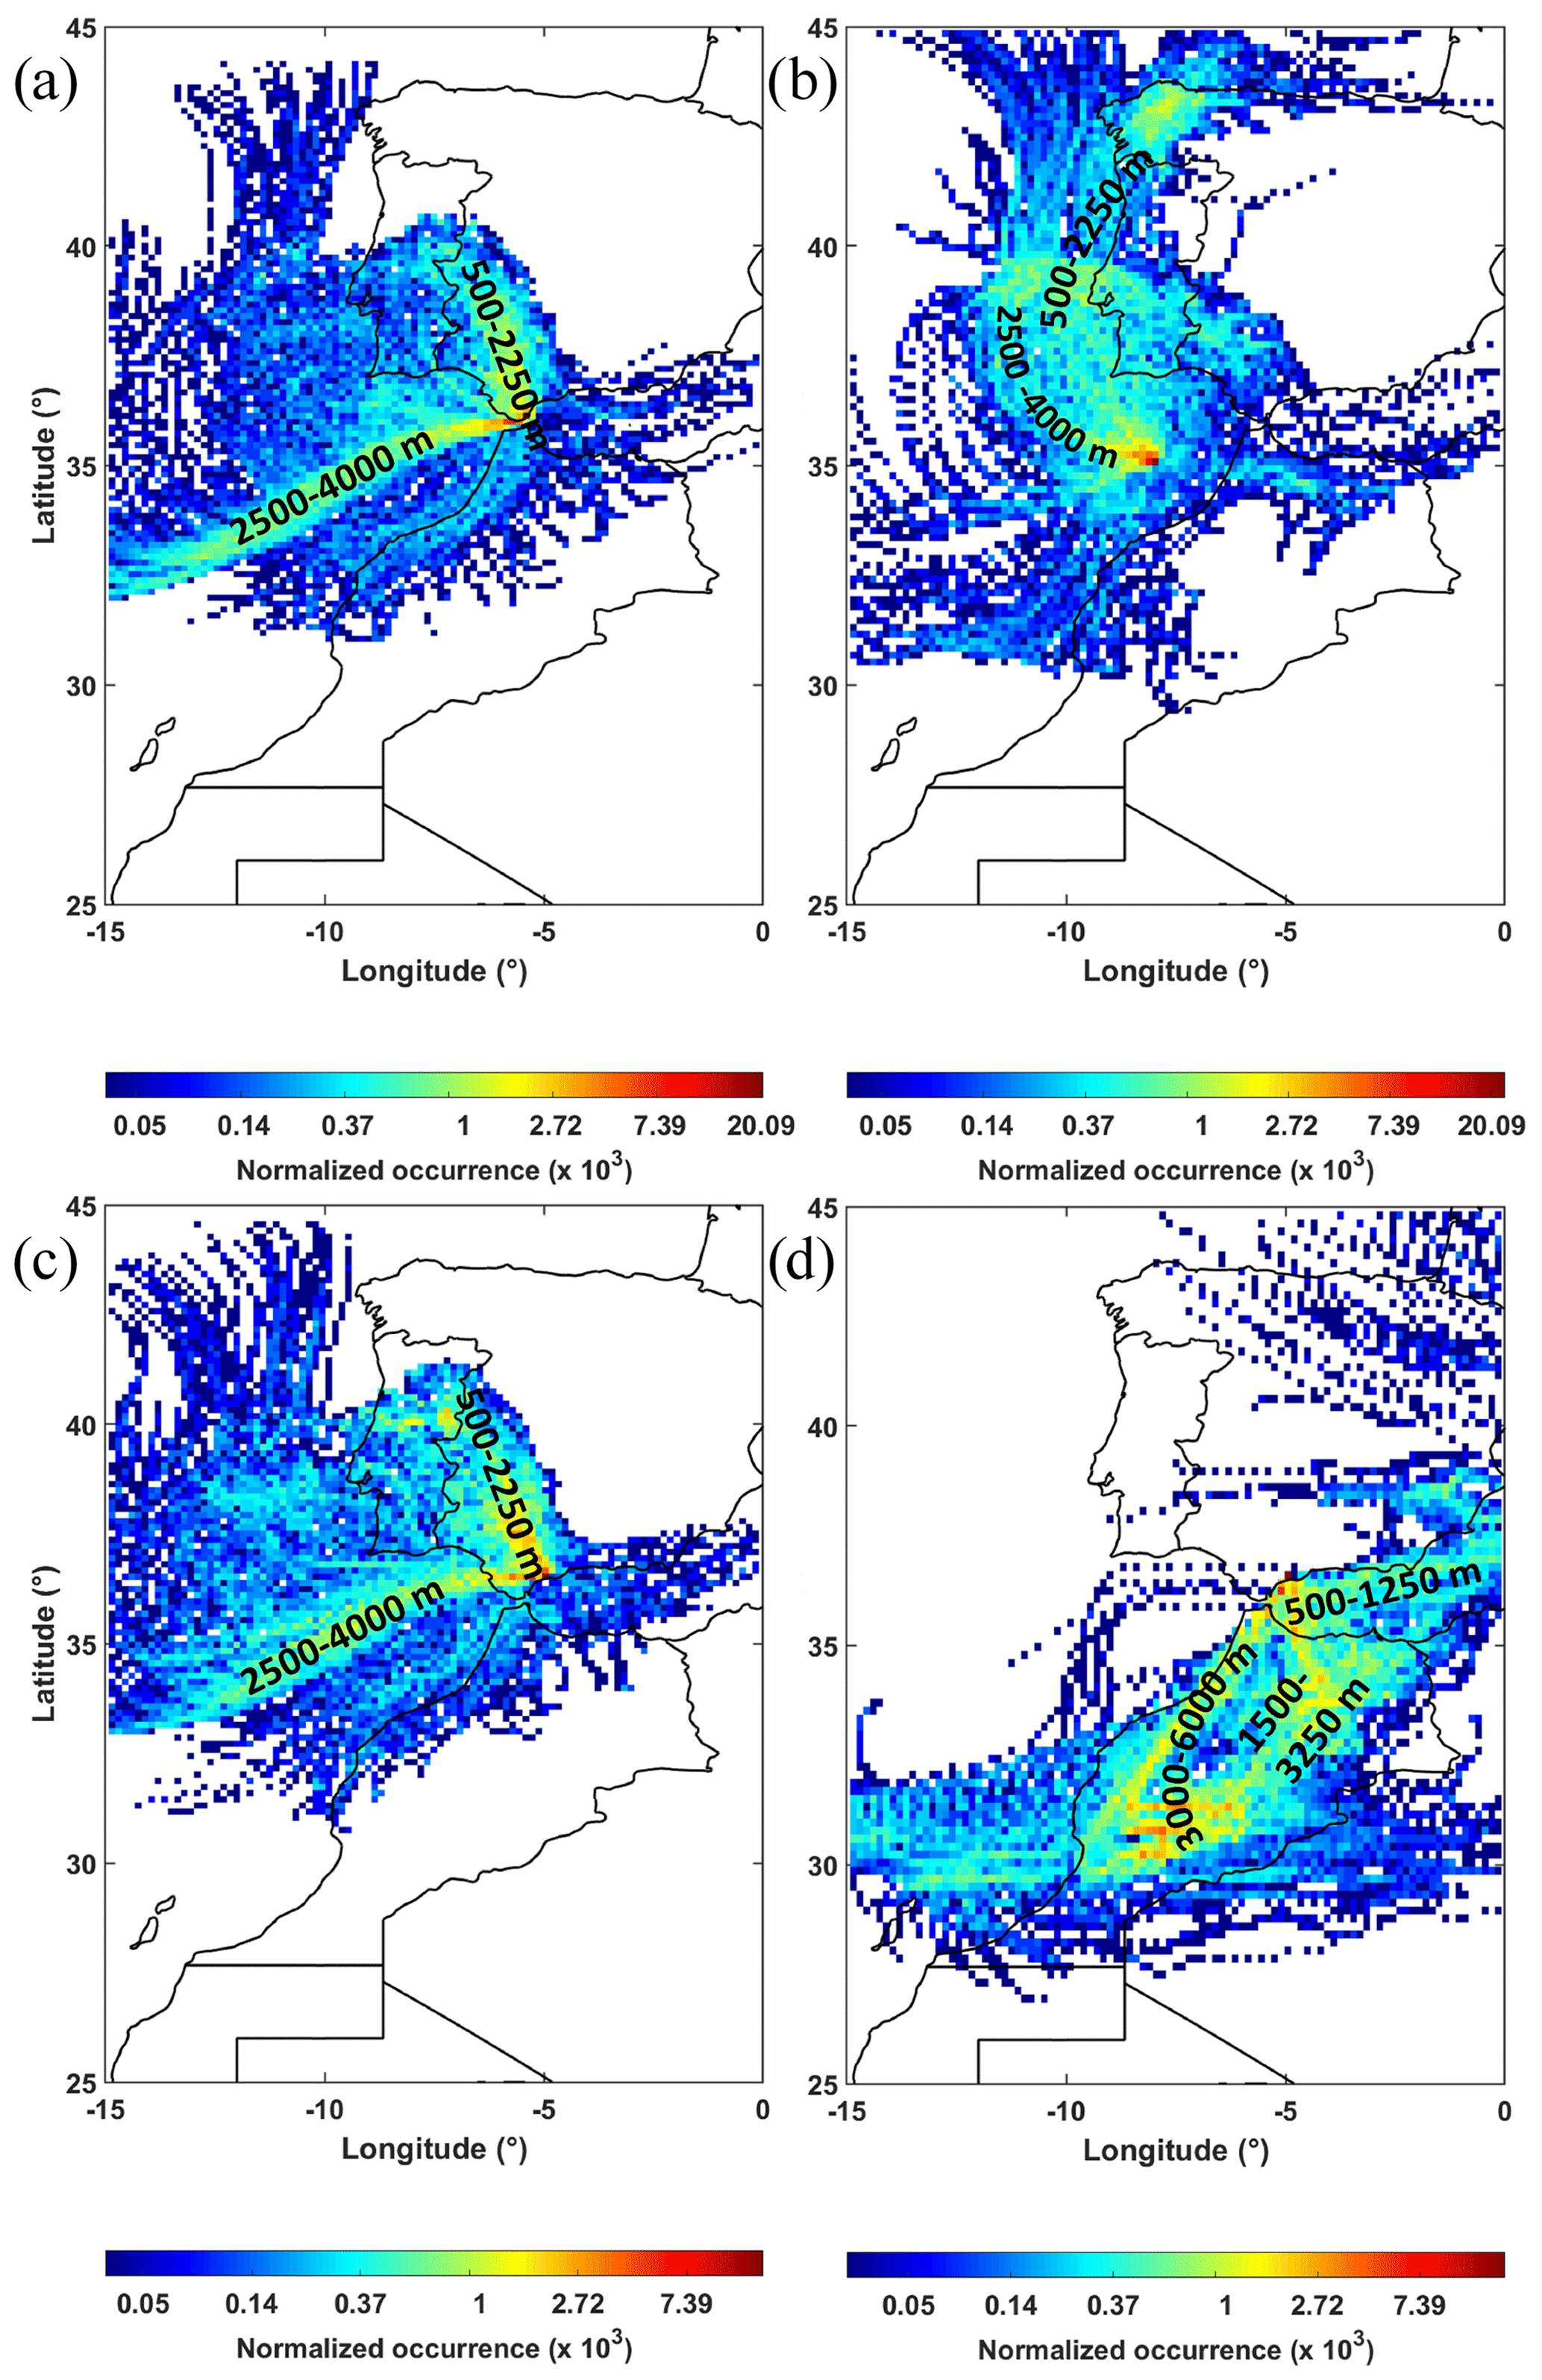
Figure 13Bi-dimensional histogram derived from back trajectories computed using HYSPLIT on (a) 13 August 21:00 UTC over the flight location, (b) 13 August 03:00 UTC at the central position of CALIOP ground track off Gibraltar, (c) 13 August 21:00 UTC over San Pedro Alcantara, and (d) 12 August 00:00 UTC over San Pedro Alcantara. The aerosol transport altitudes are indicated for each main trajectory.
Most of the aerosol layers observed by the airborne lidar and daytime orbit of CALIOP are located below 2.5 km a.m.s.l. As shown in Fig. 13a, the air mass comes very clearly from the Iberian Peninsula for these altitudes. The aerosol type is reminiscent of local uptakes of terrigenous dusts that may be mixed with pollution aerosols. Above 2.5 km a.m.s.l., the air mass comes from the tropical Atlantic and may have trapped Saharan dust aerosols. For CALIOP's night orbit on 13 August (∼ 02:40 UTC), although the trajectories are significantly different, the origin is also the Iberian Peninsula (Fig. 13b), and the same type of aerosol is likely to be observed over the Atlantic off Gibraltar until 4 km a.m.s.l. Further north, a contribution from forest fires cannot be excluded, but no satellite observations clearly identify them. Above San Pedro Alcantara, at 21:00 UTC (Fig. 13c), similar trajectories are observed as the ones over Gibraltar. The LR is nevertheless quite different because its calculation integrates layers not accessible to the airborne experiment above 2.5 km a.m.s.l. It should be noted that the back trajectories below 500 m a.m.s.l. are not taken into consideration as they are not significant with regard to the topography of the Spanish coast. The back trajectories in Fig. 13d are calculated on 11 August and show that the differences in LR and PDR observed between 11 and 13 August 2011 over San Pedro Alcantara are explained by very different origins of the air masses. On 11 August, the probable source of the aerosols is located in Morocco. This conclusion can be supported using the brightness temperature anomaly (BTA) calculated over the month of August 2011 from the 10.8 µm channel of the Spinning Enhanced Visible and InfraRed Imager (SEVIRI; Schmetz et al., 2002) following an approach similar to that proposed by Legrand et al. (1992). The BTA on 11 August is given in Fig. 14. It reveals very clearly the presence of dust aerosols north-east of Agadir, Morocco, in the way the back trajectories are plotted in Fig. 13d. It should be noted that no active source is detectable by the same approach on 13 August 2011.
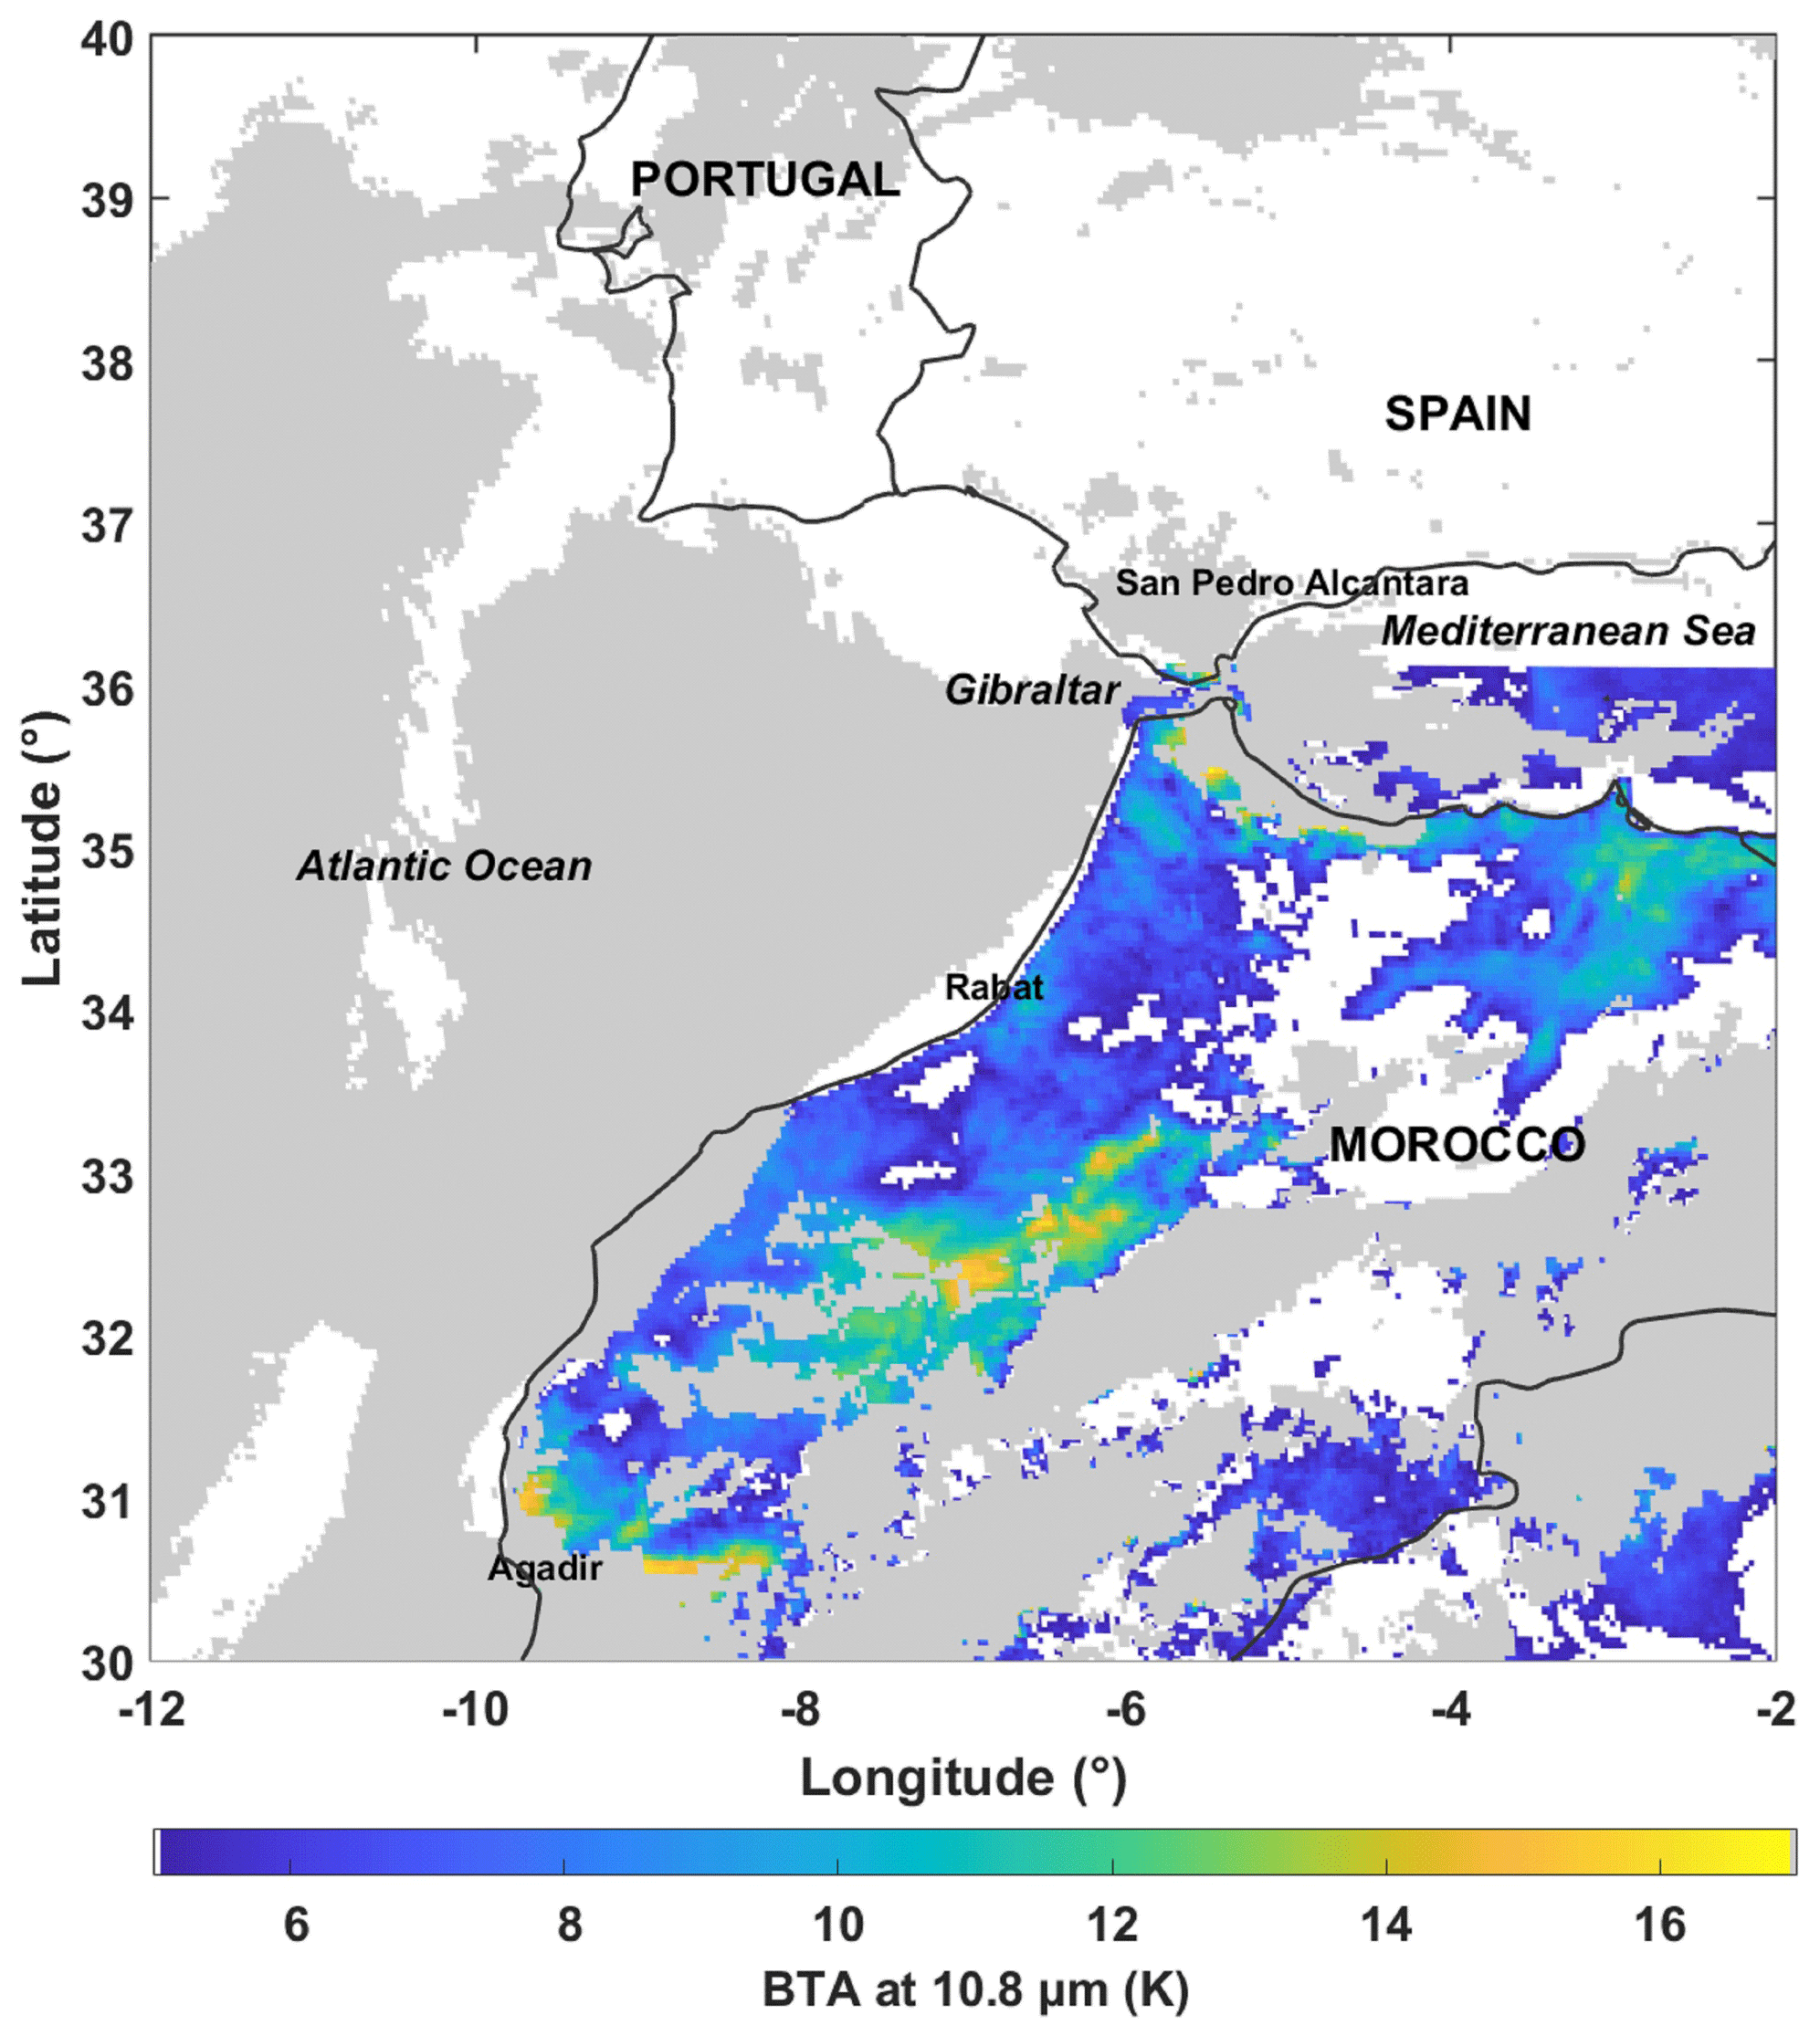
Figure 14Brightness temperature anomaly (BTA) on 11 August 2011 at 12:00 UTC. The cloud mask has been applied in grey.
The western end of the Mediterranean, which connects with the Atlantic Ocean, is one of the areas most subject to the transport of terrigenous aerosols. This can be explained by the passage of lows, which, together with the Azores high, favours the transport of desert aerosols through the Strait of Gibraltar towards the Iberian Peninsula and along an inverse path towards north-west Africa. Nevertheless, there have been few studies on the characterization of the vertical distribution of aerosols over this region. Although punctual in time, like many other studies, the SUSIE experiment has provided useful information on vertical profiles of aerosol optical properties. The profiles were obtained from airborne lidar observations over Gibraltar and ground-based N2-Raman lidar measurements near Gibraltar at San Pedro Alcantara located ∼ 50 km east of Gibraltar. Over the Strait of Gibraltar, the aerosol extinction coefficient (AEC), particle depolarization ratio (PDR), and lidar ratio (LR) were derived from a flight plan that allowed separate retrievals of the aerosol extinction and backscatter properties. Although the distance between the two measurement sites is small, the optical properties of the aerosols proved to be significantly different. The planetary boundary layer was more influenced by terrigenous aerosols over San Pedro Alcantara, whereas the marine aerosols were dominant over Gibraltar. In the lower free troposphere, the difference between the LRs, 45±8 sr for Gibraltar and 34±4 sr for San Pedro Alcantara, is somewhat less noticeable and can be attributed to a higher weighting of the upper atmospheric layers as sampled by the ground-based lidar. The back trajectories show a dichotomy between the air masses below and above 2.5 km a.m.s.l. and thus a possible mix between continental and Saharan aerosols, respectively. This would lead one to think that the continental terrigenous aerosols would have an LR of about 45 sr, while the Saharan aerosols would have an LR of about 34 sr. This is also what is found in Fig. 7 during the Saharan aerosol event of Moroccan origin on 11 August 2011. For such low values, there may be a mixture of marine particles in the upper aerosol layer. It may be generated by a recirculation at altitude above the PBL top of a certain quantity of marine aerosols above the coastal site (e.g. Chazette et al., 2019), but since no strong argument is available to claim this, that statement therefore remains speculative. As a result, we can infer that a mixture of different types of particles is likely, to which pollution or biomass burning aerosols in varying quantities may be added. All this can explain the range of variation of the LR at 355 nm that is deduced from the scientific literature.
The use of LR look-up tables for the inversion of satellite lidar measurements can therefore lead to biased results in situations such as those encountered during SUSIE. Using the CALIOP classification in the context of this work, polluted dusts should be classified with an LR ∼ 45 sr and Saharan dusts with an LR ∼ 34 sr for the wavelength of 355 nm. It is worth noting that there are numerous other Raman lidar measurements in Africa bringing an LR at 355 nm well above 40 sr (e.g. the experiments SAMUM, Ansmann et al., 2011, and SHADOW, Veselovskii et al., 2020). Here, the LR variation is inversed compared to what is considered for CALIOP (44 sr for dusts and 55 sr for polluted dust at 532 nm) and even for the Cloud-Aerosol Transport System (CATS; Yorks et al., 2016), for which the LR equals 45 sr for dusts and 35 sr for polluted dusts at 532 nm. It therefore appears important to update the classifications in the perspective of the analysis of lidar profiles from the ADM-AEOLUS mission and also from the future EarthCARE mission.
The sun photometer products were provided by the AERONET network (https://aeronet.gsfc.nasa.gov/, last access: 14 August 2020, Giles et al., 2019). MODIS data were provided by NASA Langley Research Center Atmospheric Sciences Data Center (https://modis.gsfc.nasa.gov/data/dataprod/, last access: 14 August 2020, e.g. Levy and Hsu, 2015a, b). CALIPSO data were provided by NASA's Earth Observing System Data and Information System (EOSDIS; https://www-calipso.larc.nasa.gov/products/, last access: 14 August 2020, Vaughan et al., 2004). The ERA5 dataset is provided by the European Centre for Medium-Range Weather Forecasts (ECMWF) integrated forecast system developed through the Copernicus Climate Change Service (https://climate.copernicus.eu/, last access: 14 August 2020, Copernicus Climate Change Service, 2018).
The author declares that there is no conflict of interest.
This article is part of the special issue “CHemistry and AeRosols Mediterranean EXperiments (ChArMEx) (ACP/AMT inter-journal SI)”. It is not associated with a conference.
Joseph Sanak is thanked for his help during the field experiment. The ULA flights were performed by Santi Font. The author would like to thank the AERONET network for sun photometer products (at https://aeronet.gsfc.nasa.gov/, last access: 14 August 2020), the MODIS Science, Processing and Data Support Teams for producing and providing level 2 MODIS data (at https://modis.gsfc.nasa.gov/data/dataprod/, last access: 14 August 2020), and the NASA Langley Research Center Atmospheric Sciences Data Center for the data processing and distribution of CALIPSO products (level 4.10, at https://www-calipso.larc.nasa.gov/products/, last access: 14 August 2020). The NOAA Air Resources Laboratory (ARL) is thanked for the provision of the HYSPLIT transport and dispersion model and READY website (http://www.ready.noaa.gov, last access: 14 August 2020) used in this paper. The European Centre for Medium-Range Weather Forecasts (ECMWF) is thanked for the provision of the ERA5 dataset.
This research has been supported by the Centre National d'Etude Spatiales (CNES) and the Commissariat à l'Énergie Atomique et aux Énergies Alternatives (CEA).
This paper was edited by Oleg Dubovik and reviewed by two anonymous referees.
Ancellet, G., Pelon, J., Totems, J., Chazette, P., Bazureau, A., Sicard, M., Di Iorio, T., Dulac, F., and Mallet, M.: Long-range transport and mixing of aerosol sources during the 2013 North American biomass burning episode: analysis of multiple lidar observations in the western Mediterranean basin, Atmos. Chem. Phys., 16, 4725–4742, https://doi.org/10.5194/acp-16-4725-2016, 2016.
Andersson, E., Dabas, A., Endemann, M., Ingmann, P., Källén, E., Offiler, D., and Stoffelen, A.: ADM-AEOLUS: science report, edited by: Clissold, P., ESA Communication Production Office, available at: http://esamultimedia.esa.int/docs/SP-1311_ADM-Aeolus_FINAL_low-res.pdf (last access: 14 August 2020), 2008.
Ansmann, A., Riebesell, M., Wandinger, U., Weitkamp, C., Voss, E., Lahmann, W., and Michaelis, W.: Combined raman elastic-backscatter LIDAR for vertical profiling of moisture, aerosol extinction, backscatter, and LIDAR ratio, Appl. Phys. B-Photo., 55, 18–28, 1992.
Ansmann, A., Petzold, A., Kandler, K., Tegen, I., Wendisch, M., Müller, D., Weinzierl, B., Müller, T., and Heintzenberg, J.: Saharan Mineral Dust Experiments SAMUM-1 and SAMUM-2: What have we learned?, Tellus B, 63, 403–429, https://doi.org/10.1111/j.1600-0889.2011.00555.x, 2011.
Burton, S. P., Hair, J. W., Kahnert, M., Ferrare, R. A., Hostetler, C. A., Cook, A. L., Harper, D. B., Berkoff, T. A., Seaman, S. T., Collins, J. E., Fenn, M. A., and Rogers, R. R.: Observations of the spectral dependence of linear particle depolarization ratio of aerosols using NASA Langley airborne High Spectral Resolution Lidar, Atmos. Chem. Phys., 15, 13453–13473, https://doi.org/10.5194/acp-15-13453-2015, 2015.
Chazette, P., Mégie, G., and Pelon, J.: Potential use of spaceborne lidar measurements to improve atmospheric temperature retrievals from passive sensors, Appl. Optics, 37, 7670–7679, https://doi.org/10.1364/AO.37.007670, 1998.
Chazette, P., Pelon, J., and Mégie, G.: Determination by spaceborne backscatter lidar of the structural parameters of atmospheric scattering layers., Appl. Optics, 40, 3428–3440, https://doi.org/10.1364/AO.40.003428, 2001.
Chazette, P., Sanak, J., and Dulac, F.: New approach for aerosol profiling with a lidar onboard an ultralight aircraft: application to the African Monsoon Multidisciplinary Analysis, Environ. Sci. Technol., 41, 8335–8341, https://doi.org/10.1021/es070343y, 2007.
Chazette, P., Dabas, A., Sanak, J., Lardier, M., and Royer, P.: French airborne lidar measurements for Eyjafjallajökull ash plume survey, Atmos. Chem. Phys., 12, 7059–7072, https://doi.org/10.5194/acp-12-7059-2012, 2012.
Chazette, P., Totems, J., Ancellet, G., Pelon, J., and Sicard, M.: Temporal consistency of lidar observations during aerosol transport events in the framework of the ChArMEx/ADRIMED campaign at Minorca in June 2013, Atmos. Chem. Phys., 16, 2863–2875, https://doi.org/10.5194/acp-16-2863-2016, 2016.
Chazette, P., Totems, J., and Shang, X.: Atmospheric aerosol variability above the Paris Area during the 2015 heat wave – Comparison with the 2003 and 2006 heat waves, Atmos. Environ., 170, 216–233, https://doi.org/10.1016/j.atmosenv.2017.09.055, 2017.
Chazette, P., Totems, J., and Shang, X.: Transport of aerosols over the French Riviera – link between ground-based lidar and spaceborne observations, Atmos. Chem. Phys., 19, 3885–3904, https://doi.org/10.5194/acp-19-3885-2019, 2019.
Chu, D. A., Kaufman, Y. J., Ichoku, C., Remer, L. A., Tanré, D., and Holben, B. N.: Validation of MODIS aerosol optical depth retrieval over land, Geophys. Res. Lett., 29, 8007, https://doi.org/10.1029/2001GL013205, 2002.
Copernicus Climate Change Service: ERA5 hourly data on pressure levels from 1979 to present, https://doi.org/10.24381/cds.bd0915c6, 2018.
Dieudonné, E., Chazette, P., Marnas, F., Totems, J., and Shang, X.: Raman Lidar Observations of Aerosol Optical Properties in 11 Cities from France to Siberia, Remote Sens., 9, 978–1007, https://doi.org/10.3390/rs9100978, 2017.
Fernández, A. J., Sicard, M., Costa, M. J., Guerrero-Rascado, J. L., Gómez-Amo, J. L., Molero, F., Barragán, R., Basart, S., Bortoli, D., Bedoya-Velásquez, A. E., Utrillas, M. P., Salvador, P., Granados-Muñoz, M. J., Potes, M., Ortiz-Amezcua, P., Martínez-Lozano, J. A., Artíñano, B., Muñoz-Porcar, C., Salgado, R., Román, R., Rocadenbosch, F., Salgueiro, V., Benavent-Oltra, J. A., Rodríguez-Gómez, A., Alados-Arboledas, L., Comerón, A., and Pujadas, M.: Extreme, wintertime Saharan dust intrusion in the Iberian Peninsula: Lidar monitoring and evaluation of dust forecast models during the February 2017 event, Atmos. Res., 228, 223–241, https://doi.org/10.1016/j.atmosres.2019.06.007, 2019.
Flamant, C., Pelon, J., Chazette, P., Trouillet, V., Quinn, P. K., Frouin, R., Bruneau, D., Leon, J.-F., Bates, T. S., Johnson, J., and Livingston, J.: Airborne lidar measurements of aerosol spatial distribution and optical properties over the Atlantic Ocean during a European pollution outbreak of ACE-2, Tellus B, 52, 662–677, https://doi.org/10.1034/j.1600-0889.2000.00083.x, 2000.
Freudenthaler, V., Esselborn, M., Wiegner, M., Heese, B., Tesche, M., Ansmann, A., Müller, D., Althausen, D., Wirth, M., Fix, A., Ehret, G., Knippertz, P., Toledano, C., Gasteiger, J., Garhammer, M., and Seefeldner, M.: Depolarization ratio profiling at several wavelengths in pure Saharan dust during SAMUM 2006, Tellus B, 61, 165–179, https://doi.org/10.1111/j.1600-0889.2008.00396.x, 2009.
Gallero, F. J. G., Vallejo, M. G., Umbría, A., and Baena, J. G.: Multivariate statistical analysis of meteorological and air pollution data in the “Campo De Gibraltar” Region, Spain, Environ. Monit. Assess., 119, 405–423, https://doi.org/10.1007/s10661-005-9033-4, 2006.
Giannakaki, E., Balis, D. S., Amiridis, V., and Zerefos, C.: Optical properties of different aerosol types: seven years of combined Raman-elastic backscatter lidar measurements in Thessaloniki, Greece, Atmos. Meas. Tech., 3, 569–578, https://doi.org/10.5194/amt-3-569-2010, 2010.
Giles, D. M., Sinyuk, A., Sorokin, M. G., Schafer, J. S., Smirnov, A., Slutsker, I., Eck, T. F., Holben, B. N., Lewis, J. R., Campbell, J. R., Welton, E. J., Korkin, S. V., and Lyapustin, A. I.: Advancements in the Aerosol Robotic Network (AERONET) Version 3 database – automated near-real-time quality control algorithm with improved cloud screening for Sun photometer aerosol optical depth (AOD) measurements, Atmos. Meas. Tech., 12, 169–209, https://doi.org/10.5194/amt-12-169-2019, 2019 (data available at: https://aeronet.gsfc.nasa.gov/, last access: 14 August 2020).
Giorgi, F. and Lionello, P.: Climate change projections for the Mediterranean region, Global Planet. Change, 63, 90–104, https://doi.org/10.1016/j.gloplacha.2007.09.005, 2008.
Hurrell, J. W. and Deser, C.: North Atlantic climate variability: The role of the North Atlantic Oscillation, J. Marine Syst., 79, 231–244, https://doi.org/10.1016/j.jmarsys.2009.11.002, 2010.
Hurrell, J. W., Hoerling, M. P., Phillips, A. S., and Xu, T.: Twentieth Century North Atlantic Climate Change. Part I: Assessing Determinism, Clim. Dynam., 23, 371–389, https://doi.org/10.1007/s00382-004-0432-y, 2004.
Illingworth, A. J., Barker, H. W., Beljaars, A., Ceccaldi, M., Chepfer, H., Clerbaux, N., Cole, J., Delanoë, J., Domenech, C., Donovan, D. P., Fukuda, S., Hirakata, M., Hogan, R. J., Huenerbein, A., Kollias, P., Kubota, T., Nakajima, T. Y., Nakajima, T. Y., Nishizawa, T., Ohno, Y., Okamoto, H., Oki, R., Sato, K., Satoh, M., Shephard, M. W., Velázquez-Blázquez, A., Wandinger, U., Wehr, T., and Van Zadelhoff, G. J.: The earthcare satellite?: The next step forward in global measurements of clouds, aerosols, precipitation, and radiation, B. Am. Meteorol. Soc., 96, 1311–1332, https://doi.org/10.1175/BAMS-D-12-00227.1, 2015.
IPCC: Climate Change 2014: Impacts, Adaptation, and Vulnerability. Part A: Global and Sectoral Aspects. Contribution of Working Group II to the Fifth Assessment Report of the Intergovernmental Panel on Climate Change, edited by: Field, C. B., Barros, V. R., Dokken, D. J., Mach, K. J., Mastrandresa, M. D., Bilir, T. E., Chatterjee, M., Ebi, K. L., Estrada, Y. O., Genova, R. C., Girma, B., Kissel, E. S., Levy, A. N., MacCracken, S., Mastrandrea, P. R., and White, L. L., Cambridge University Press, Cambridge, UK and New York, NY, USA, 2014.
King, M. D., Kaufman, Y. J., Menzel, W. P., and Tanré, D.: Remote Sensing of Cloud, Aerosol, and Water Vapor Properties from the Moderate Resolution Imaging Spectrometer (MODIS), IEEE T. Geosci. Remote, 30, 2–27, https://doi.org/10.1109/36.124212, 1992.
Klett, J. D.: Stable analytical inversion solution for processing lidar returns, Appl. Optics, 20, 211–220, https://doi.org/10.1364/AO.20.000211, 1981.
Legrand, M., Cautenet, G., and Buriez, J. C.: Thermal impact of Saharan dust over land. Part II: application to satellite IR remote sensing, J. Appl. Meteorol., 31, 181–193, https://doi.org/10.1175/1520-0450(1992)031<0181:TIOSDO>2.0.CO;2, 1992.
Levy, R. and Hsu, C.: MODIS Atmosphere L2 Aerosol Product (Terra), NASA MODIS Adaptive Processing System, Goddard Space Flight Center, USA, https://doi.org/10.5067/MODIS/MOD04_L2.006, 2015a.
Levy, R. and Hsu, C.: MODIS Atmosphere L2 Aerosol Product (Aqua), NASA MODIS Adaptive Processing System, Goddard Space Flight Center, USA, https://doi.org/10.5067/MODIS/MYD04_L2.006, 2015b.
Mallet, M., Dulac, F., Formenti, P., Nabat, P., Sciare, J., Roberts, G., Pelon, J., Ancellet, G., Tanré, D., Parol, F., Denjean, C., Brogniez, G., di Sarra, A., Alados-Arboledas, L., Arndt, J., Auriol, F., Blarel, L., Bourrianne, T., Chazette, P., Chevaillier, S., Claeys, M., D'Anna, B., Derimian, Y., Desboeufs, K., Di Iorio, T., Doussin, J.-F., Durand, P., Féron, A., Freney, E., Gaimoz, C., Goloub, P., Gómez-Amo, J. L., Granados-Muñoz, M. J., Grand, N., Hamonou, E., Jankowiak, I., Jeannot, M., Léon, J.-F., Maillé, M., Mailler, S., Meloni, D., Menut, L., Momboisse, G., Nicolas, J., Podvin, T., Pont, V., Rea, G., Renard, J.-B., Roblou, L., Schepanski, K., Schwarzenboeck, A., Sellegri, K., Sicard, M., Solmon, F., Somot, S., Torres, B., Totems, J., Triquet, S., Verdier, N., Verwaerde, C., Waquet, F., Wenger, J., and Zapf, P.: Overview of the Chemistry-Aerosol Mediterranean Experiment/Aerosol Direct Radiative Forcing on the Mediterranean Climate (ChArMEx/ADRIMED) summer 2013 campaign, Atmos. Chem. Phys., 16, 455–504, https://doi.org/10.5194/acp-16-455-2016, 2016.
Meloni, D., di Sarra, A., Brogniez, G., Denjean, C., De Silvestri, L., Di Iorio, T., Formenti, P., Gómez-Amo, J. L., Gröbner, J., Kouremeti, N., Liuzzi, G., Mallet, M., Pace, G., and Sferlazzo, D. M.: Determining the infrared radiative effects of Saharan dust: a radiative transfer modelling study based on vertically resolved measurements at Lampedusa, Atmos. Chem. Phys., 18, 4377–4401, https://doi.org/10.5194/acp-18-4377-2018, 2018.
Moulin, C., Dulac, F., Lambert, C. E., Chazette, P., Jankowiak, I., Chatenet, B., and Lavenu, F.: Long-term daily monitoring of Saharan dust load over ocean using Meteosat ISCCP-B2 data 2. Accuracy of the method and validation using Sun photometer measurements, J. Geophys. Res.-Atmos., 102, 16959–16969, https://doi.org/10.1029/96jd02598, 1997.
Nabat, P., Somot, S., Mallet, M., Michou, M., Sevault, F., Driouech, F., Meloni, D., di Sarra, A., Di Biagio, C., Formenti, P., Sicard, M., Léon, J.-F., and Bouin, M.-N.: Dust aerosol radiative effects during summer 2012 simulated with a coupled regional aerosol–atmosphere–ocean model over the Mediterranean, Atmos. Chem. Phys., 15, 3303–3326, https://doi.org/10.5194/acp-15-3303-2015, 2015.
Papayannis, A., Amiridis, V., Mona, L., Tsaknakis, G., Balis, D., Bösenberg, J., Chaikovski, A., De Tomasi, F., Grigorov, I., Mattis, I., Mitev, V., Müller, D., Nickovic, S., Pérez, C., Pietruczuk, A., Pisani, G., Ravetta, F., Rizi, V., Sicard, M., Trickl, T., Wiegner, M., Gerding, M., Mamouri, R. E., D'Amico, G., and Pappalardo, G.: Systematic lidar observations of Saharan dust over Europe in the frame of EARLINET (2000–2002), J. Geophys. Res.-Atmos., 113, D10204, https://doi.org/10.1029/2007JD009028, 2008.
Rodríguez, S., Querol, X., Alastuey, A., Kallos, G., and Kakaliagou, O.: Saharan dust contributions to PM10 and TSP levels in Southern and Eastern Spain, Atmos. Environ., 35, 2433–2447, https://doi.org/10.1016/S1352-2310(00)00496-9, 2001.
Royer, P., Chazette, P., Lardier, M., and Sauvage, L.: Aerosol content survey by mini N2-Raman lidar: Application to local and long-range transport aerosols, Atmos. Environ., 45, 7487–7495, https://doi.org/10.1016/j.atmosenv.2010.11.001, 2011.
Ryder, C. L., Highwood, E. J., Rosenberg, P. D., Trembath, J., Brooke, J. K., Bart, M., Dean, A., Crosier, J., Dorsey, J., Brindley, H., Banks, J., Marsham, J. H., McQuaid, J. B., Sodemann, H., and Washington, R.: Optical properties of Saharan dust aerosol and contribution from the coarse mode as measured during the Fennec 2011 aircraft campaign, Atmos. Chem. Phys., 13, 303–325, https://doi.org/10.5194/acp-13-303-2013, 2013.
Salmonson, V. V., Barnes, W. L., Maymon, P. W., Montgomery, H. E., and Ostrow, H.: MODIS: Advanced Facility Instrument for Studies of the Earth as a System, IEEE T. Geosci. Remote, 27, 145–153, https://doi.org/10.1109/36.20292, 1989.
Schmetz, J., Pili, P., Tjemkes, S., Just, D., Kerkmann, J., Rota, S., and Ratier, A.: An introduction to Meteosat Second Generation (MSG), B. Am. Meteorol. Soc., 83, 977–992, https://doi.org/10.1175/1520-0477(2002)083<0977:AITMSG>2.3.CO;2, 2002.
Shang, X., Chazette, P., Totems, J., Dieudonné, E., Hamonou, E., Duflot, V., Strasberg, D., Flores, O., Fournel, J., and Tulet, P.: Tropical Forests of Réunion Island Classified from Airborne Full-Waveform LiDAR Measurements, Remote Sens., 8, 43–63, https://doi.org/10.3390/rs8010043, 2016.
Siomos, N., Balis, D. S., Voudouri, K. A., Giannakaki, E., Filioglou, M., Amiridis, V., Papayannis, A., and Fragkos, K.: Are EARLINET and AERONET climatologies consistent? The case of Thessaloniki, Greece, Atmos. Chem. Phys., 18, 11885–11903, https://doi.org/10.5194/acp-18-11885-2018, 2018.
Soupiona, O., Papayannis, A., Kokkalis, P., Mylonaki, M., Tsaknakis, G., Argyrouli, A., and Vratolis, S.: Long-term systematic profiling of dust aerosol optical properties using the EOLE NTUA lidar system over Athens, Greece (2000–2016), Atmos. Environ., 183, 165–174, https://doi.org/10.1016/j.atmosenv.2018.04.011, 2018.
Soupiona, O., Samaras, S., Ortiz-Amezcua, P., Böckmann, C., Papayannis, A., Moreira, G. A., Benavent-Oltra, J. A., Guerrero-Rascado, J. L., Bedoya-Velásquez, A. E., Olmo, F. J., Román, R., Kokkalis, P., Mylonaki, M., Alados-Arboledas, L., Papanikolaou, C. A., and Foskinis, R.: Retrieval of optical and microphysical properties of transported Saharan dust over Athens and Granada based on multi-wavelength Raman lidar measurements: Study of the mixing processes, Atmos. Environ., 214, 116824, https://doi.org/10.1016/j.atmosenv.2019.116824, 2019.
Stein, A. F., Draxler, R. R., Rolph, G. D., Stunder, B. J. B. B., Cohen, M. D., Ngan, F., Stein, A. F., Draxler, R. R., Rolph, G. D., Stunder, B. J. B. B., Cohen, M. D., and Ngan, F.: NOAA's HYSPLIT Atmospheric Transport and Dispersion Modeling System, B. Am. Meteorol. Soc., 96, 2059–2077, https://doi.org/10.1175/BAMS-D-14-00110.1, 2015.
Stoffelen, A., Pailleux, J., Källén, E., Vaughan, J. M., Isaksen, L., Flamant, P., Wergen, W., Andersson, E., Schyberg, H., Culoma, A., Meynart, R., Endemann, M., and Ingmann, P.: The atmospheric dynamics mission for global wind field measurement, B. Am. Meteorol. Soc., 86, 73–87, https://doi.org/10.1175/BAMS-86-1-73, 2005.
Vaughan, A., Young, S. A., Winker, D. M., Powell, K. A., Omar, A. H., Liu, Z., Hu, Y., and Hostetler, C. A.: Fully automated analysis of space-based lidar data: an overview of the CALIPSO retrieval algorithms and data products, Laser Radar Techniques for Atmospheric Sensing, Proc. SPIE 5575, https://doi.org/10.1117/12.572024, 2004 (data available at: https://modis.gsfc.nasa.gov/data/dataprod/, last access: 14 August 2020).
Veselovskii, I., Hu, Q., Goloub, P., Podvin, T., Korenskiy, M., Derimian, Y., Legrand, M., and Castellanos, P.: Variability in lidar-derived particle properties over West Africa due to changes in absorption: towards an understanding, Atmos. Chem. Phys., 20, 6563–6581, https://doi.org/10.5194/acp-20-6563-2020, 2020.
Winker, D. M., Hunt, W. H., and McGill, M. J.: Initial performance assessment of CALIOP, Geophys. Res. Lett., 34, L19803, https://doi.org/10.1029/2007GL030135, 2007.
Yorks, J. E., McGill, M. J., Palm, S. P., Hlavka, D. L., Selmer, P. A., Nowottnick, E. P., Vaughan, M. A., Rodier, S. D., and Hart, W. D.: An overview of the CATS level 1 processing algorithms and data products, Geophys. Res. Lett., 43, 4632–4639, https://doi.org/10.1002/2016GL068006, 2016.
- Abstract
- Introduction
- Instrumental set-up and strategy
- Data processing for lidar measurements
- Vertical profiles of aerosol optical properties
- Origin of aerosols observed over Gibraltar
- Conclusion
- Data availability
- Competing interests
- Special issue statement
- Acknowledgements
- Financial support
- Review statement
- References