the Creative Commons Attribution 4.0 License.
the Creative Commons Attribution 4.0 License.
 | 14 Sep 2020
1.5 years of TROPOMI CO measurements: comparisons to MOPITT and ATom
Merritt Deeter
Helen Worden
Tobias Borsdorff
Ilse Aben
Róisin Commane
Bruce Daube
Gene Francis
Maya George
Jochen Landgraf
Debbie Mao
Kathryn McKain
Steven Wofsy
We have analyzed TROPOspheric Monitoring Instrument (TROPOMI) carbon monoxide (CO) data acquired between November 2017 and March 2019 with respect to other satellite (MOPITT, Measurement Of Pollution In The Troposphere) and airborne (ATom, Atmospheric Tomography mission) datasets to better understand TROPOMI's contribution to the global tropospheric CO record (2000 to present). MOPITT and TROPOMI are two of only a few satellite instruments to ever derive CO from solar-reflected radiances. Therefore, it is particularly important to understand how these two datasets compare. Our results indicate that TROPOMI CO retrievals over land show excellent agreement with respect to MOPITT: relative biases and their SD (i.e., accuracy and precision) are on average , , and compared to the MOPITT TIR (thermal infrared), NIR (near infrared), and TIR + NIR (multispectral) products, respectively. TROPOMI and MOPITT data also show good agreement in terms of temporal and spatial patterns.
Despite depending on solar-reflected radiances for its measurements, TROPOMI can also retrieve CO over bodies of water if clouds are present by approximating partial columns under cloud tops using scaled, model-based reference CO profiles. We quantify the bias of TROPOMI total column retrievals over bodies of water with respect to colocated in situ ATom CO profiles after smoothing the latter with the TROPOMI column averaging kernels (AKs), which account for signal attenuation under clouds (relative bias and its SD %). In addition, we quantify enull (the null-space error), which accounts for differences between the shape of the TROPOMI reference profile and that of the ATom true profile ( %). For comparisons of TROPOMI and MOPITT retrievals over open water we compare TROPOMI total CO columns to their colocated MOPITT TIR counterparts. Relative bias and its SD are 2.98 %±15.71 % on average.
We investigate the impact of discrepancies between the a priori and reference CO profiles (used by MOPITT and TROPOMI, respectively) on CO retrieval biases by applying a null-space adjustment (based on the MOPITT a priori) to the TROPOMI total column values. The effect of this adjustment on MOPITT and TROPOMI biases is minor, typically 1–2 percentage points.
- Article
(22678 KB) - Full-text XML
-
Supplement
(9655 KB) - BibTeX
- EndNote


Even though carbon monoxide (CO) constitutes less than one-millionth of the troposphere in volume, it is of great importance to understand climate and to monitor and predict air quality. Tropospheric CO is produced by incomplete fuel combustion, biomass burning, and oxidation of methane and other hydrocarbons. CO's main sink is oxidation by the hydroxyl radical (OH) (Spivakovsky et al., 2000; Lelieveld et al., 2016); this reaction produces greenhouse gases such as carbon dioxide and tropospheric ozone. Additionally, OH engaged in reactions with CO is not available to scavenge other greenhouse gases such as methane, which then have a longer lifetime in the atmosphere. As a consequence, CO emissions have a positive indirect radiative forcing of 0.23 W m−2 (Myhre et al., 2013). The mean lifetime of tropospheric CO (variable by season and latitude, in addition to other factors; Holloway et al., 2000) is approximately 2 months. Because of its average lifetime, which is long enough to last through horizontal and vertical transport yet short enough not to become well-mixed, it is often used as a tracer to monitor the distribution, transport, sources, and sinks of polluted plumes (e.g., Heald et al., 2003). A self-consistent, uninterrupted record of global tropospheric CO is thus key to both climate and air quality studies. The aim of this work is to facilitate the extension of the current satellite record with newly available TROPOMI (TROPOspheric Monitoring Instrument) measurements by evaluating those with respect to satellite MOPITT (Measurements Of Pollution In The Troposphere) and in situ ATom (Atmospheric Tomography mission) CO data.
The prelaunch targets for TROPOMI total CO column accuracy and precision were 15 % and 10 %, respectively, for both clear and low-altitude cloud observations (Veefkind et al., 2012; Landgraf et al., 2016). Retrieval errors are expected to be larger for cloudy conditions due to several effects, including the shape of model-based reference profiles (Borsdorff et al., 2018b). Global comparisons of TROPOMI retrievals with respect to ECMWF/IFS (European Center for Medium-Range Weather Forecast/Integrated Forecasting System) CO assimilation results (which incorporate CO retrievals from MOPITT and from IASI, the Infrared Atmospheric Sounding Interferometer; Clerbaux et al., 2009) showed a positive bias of 3.2 % with an SD of 5.5 % (Borsdorff et al., 2018a). TROPOMI CO retrievals over land have also been previously compared to ground-based measurements from nine TCCON (Total Carbon Column Observing Network; Wunch et al., 2011) stations for selected dates between 9 November 2017 and 4 January 2018; good agreement between the two datasets was found, with the TROPOMI CO product well within the mission requirements (Borsdorff et al., 2018b). Here we analyze daily global TROPOMI retrievals acquired between 7 November 2017 and 10 March 2019 with respect to MOPITT and ATom.
MOPITT is the only currently operating satellite instrument deriving CO from near-infrared (NIR), thermal-infrared (TIR), and multispectral (TIR + NIR) radiances; also, it has the longest global CO record to date (2000–present). TROPOMI was, until recently, the only other operative satellite instrument retrieving CO from NIR measurements. ENVISAT SCIAMACHY (2002–2012; Bovensmann et al., 1999) and GOSAT-2 TANSO-FTS-2 (since 2019; NIES, 2019) are two other instances. Thus, understanding how MOPITT and TROPOMI retrievals compare to each other is important. MOPITT results are systematically validated using airborne vertical profiles (Deeter et al., 2019, and references therein) and ground measurements (Buchholz et al., 2017; Hedelius et al., 2019), as well as being compared to other satellite datasets (Worden et al., 2013a; Martínez-Alonso et al., 2014; George et al., 2015). Thus, its continuity and consistency are well-understood.
Despite the low reflectivity of open water, TROPOMI CO retrievals over bodies of water are possible if clouds are present. In these cases partial CO columns under the cloud tops are approximated by scaled TROPOMI reference profiles (Borsdorff et al., 2018b). We quantify the error introduced by this approach by comparing TROPOMI CO retrievals over bodies of water to both airborne ATom-4 (fourth ATom campaign) and MOPITT TIR data.
Next we describe the datasets used (Sect. 2), detail how comparisons were performed (Sect. 3), present results from these comparisons (Sect. 4), discuss their significance (Sect. 5), and offer conclusions (Sect. 6). Additional results are available in the Supplement.
2.1 TROPOMI
TROPOMI is a push-broom imaging spectrometer onboard ESA's Sentinel-5 Precursor platform, flying in a sun-synchronous orbit at 824 km of altitude and 13:30 LST (local standard time) Equator-crossing time. Its swath width of 2600 km allows for global daily coverage at very high spatial resolution, with a 7.2×7.2 km2 footprint at nadir (Veefkind et al., 2012). (A change in the Copernicus Sentinel-5P operations scenario postdating the work presented here has resulted in a 7.2×5.6 km2 footprint at nadir, starting 6 August 2019.) TROPOMI measures radiances in the ultraviolet, visible, and solar-reflected infrared. Total CO column values are obtained from measurements of reflected solar infrared radiation in the 2.3 µm spectral range (Landgraf et al., 2016), corresponding to the first overtone of the CO stretch fundamental. Over land, retrievals are performed in both clear and cloudy conditions. TROPOMI CO retrievals over bodies of water are possible if clouds are present in the field of view (Landgraf et al., 2016); otherwise, because of the low reflectivity of open water to shortwave infrared solar radiation, insufficient radiance would be available for the instrument to measure. TROPOMI retrievals are achieved by estimating the altitude of the cloud top from the difference between measured and modeled methane, as described in Landgraf et al. (2016), and then approximating the partial CO column under the cloud top by the colocated, scaled TROPOMI reference profile partial column.
TROPOMI CO retrievals are based on SICOR (Shortwave Infrared Carbon Monoxide Retrieval) (Vidot et al., 2012). In this physics-based algorithm, the retrieval state vector includes a single scaling factor representing the ratio of the retrieved CO profile to the reference CO profile (Borsdorff et al., 2014). Reference profiles are generated with the global chemical transport model TM5 (Krol et al., 2005); they are variable with respect to location, month, and year. Retrieved total CO column values simply correspond to the vertically integrated CO profile. Over land, in the absence of clouds, the TROPOMI total CO column averaging kernel (AK; Fig. 1) is near unity over the entire vertical profile (Landgraf et al., 2016). Thus, clear-sky total CO column retrievals are negligibly affected by either the actual vertical distribution of CO or the shape of the CO reference profile. In the presence of clouds, however, over both land and bodies of water, the total CO column retrievals are mainly sensitive to the above-cloud CO partial column. The lack of sensitivity to the below-cloud CO partial column is compensated for by increasing the sensitivity to the above-cloud CO partial column. Clouds thus lead to total column AK values greater than 1 above the cloud decreasing towards zero below the cloud (Landgraf et al., 2016).
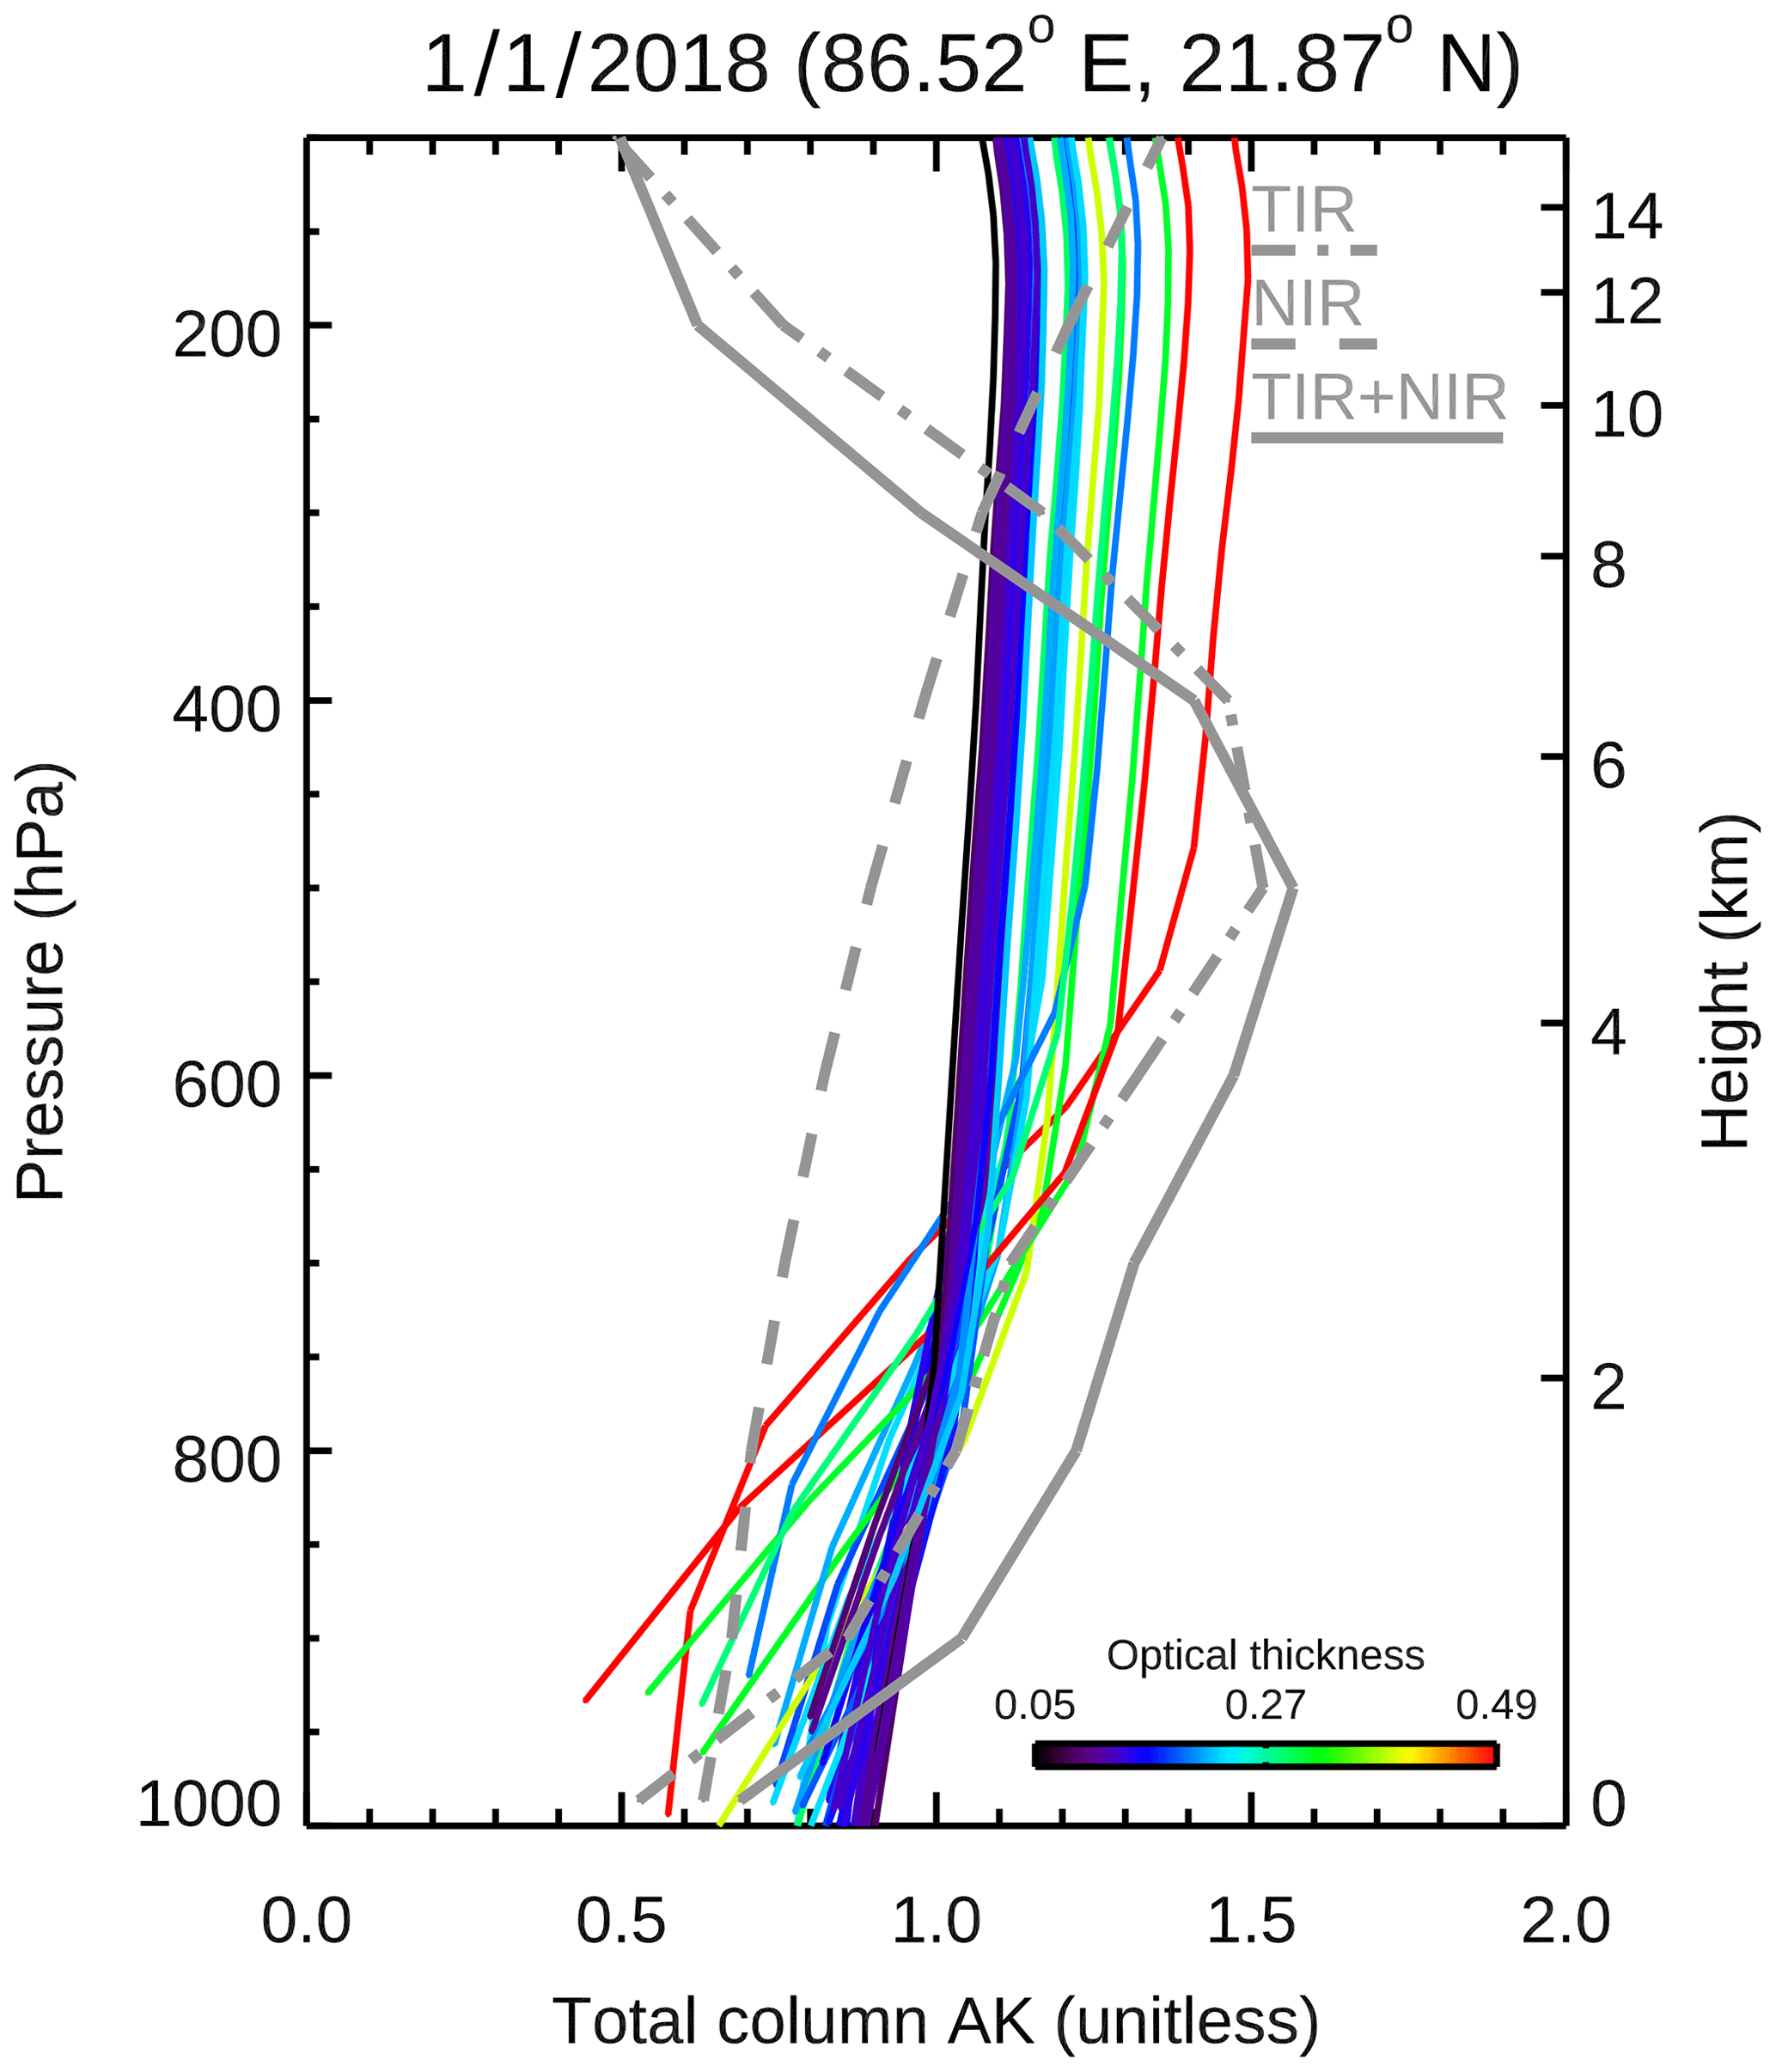
Figure 1Total column AKs (averaging kernels) from MOPITT and TROPOMI observations acquired 1 January 2018. Gray lines show AKs from a single clear MOPITT pixel. Color-coded lines show AKs from TROPOMI observations colocated with the MOPITT pixel (same-day acquisition, ≤50 km horizontal distance) with optical depth <0.5 and cloud height <5000 m (i.e., clear-sky, clear-sky-like, and mid-level cloud observations). Differences in TROPOMI AK vertical extent are due to topography.
The earliest TROPOMI CO retrievals date from 7 November 2017; therefore, this is the initial date of the period we analyze here. For any given day, we used either OFFL (offline) or RPRO (reprocessed) files, all from Collection 01, and from the most recent processor version available (10001, 10002, 10100, 10200, 10202, 10301, or 10302).
Retrievals were filtered as follows. The two most westward pixels in each granule were removed to avoid artifacts from unresolved calibration issues (Borsdorff et al., 2018a, b); daytime-only observations were selected by keeping those with solar zenith angle <80∘. Quality flag values (QA) were used to preserve clear-sky and clear-sky-like observations over land (QA = 1, corresponding to optical thickness <0.5 and cloud height <500 m) or observations with mid-level clouds over bodies of water (QA = 0.5; optical thickness ≥0.5 and cloud height <5000 m) (Landgraf et al., 2018).
2.2 MOPITT
MOPITT is a cross-track-scanning gas correlation radiometer onboard NASA's Terra satellite (Drummond and Mand, 1996; Drummond et al., 2010; Worden et al., 2013b). Terra is in a sun-synchronous orbit at 705 km of altitude and 10:30 LST Equator-crossing time. MOPITT has horizontal resolution near 22×22 km2 at nadir and a swath width of 640 km; global coverage is achieved in approximately 3 d. MOPITT observations enable retrievals of tropospheric CO vertical profiles and corresponding total column amounts from both TIR and NIR measurements in the spectral regions where the fundamental (∼4.7 µm) and first overtone (∼2.3 µm) of the CO stretch occur, respectively. TIR measurements are useful over both bodies of water and land for day and night; NIR radiances are useful only in daytime observations over land. MOPITT CO retrieval products are available in three variants (TIR-only, NIR-only, and TIR + NIR, also called multispectral) characterized by different vertical sensitivity and random retrieval noise (Deeter et al., 2019, and references therein).
Unlike TROPOMI, the MOPITT retrieval algorithm relies on optimal estimation whereby a priori information constrains the retrieved profile in the absence of information from the measured radiances (Deeter et al., 2003). MOPITT a priori profiles vary seasonally and geographically according to a multiyear (2000–2009) Community Atmosphere Model with Chemistry (CAM-Chem) model-based CO climatology (Lamarque et al., 2012). MOPITT profile retrievals are performed on a 10-level pressure grid; the reported retrieval for each level indicates the mean volume mixing ratio (VMR) in the layer immediately above that level. Reported total CO column values are obtained by integrating the retrieved VMR profiles from the surface to the top of the atmosphere. Internally, CO concentrations in the retrieval state vector are represented in terms of the logarithm of the VMR. For each retrieved CO profile, both the full retrieval AK matrix and total column AK are produced simultaneously and are provided as diagnostics. As indicated by the AK (Fig. 1), sensitivity characteristics of the three products are quite different (Deeter et al., 2012). With respect to vertical sensitivity, the total column AKs for the NIR-only product are most similar in shape to the TROPOMI total column AK, but NIR retrievals can be significantly constrained by the a priori. In comparison, TIR-only total column AKs exhibit weaker sensitivity to CO near the surface, but TIR retrievals are less strongly weighted by the a priori overall. TIR + NIR total column AKs are typically more uniform than for TIR-only retrievals, although the benefits of combining TIR and NIR measurements are only apparent in daytime observations over land.
Here we use daytime archive MOPITT data from version 8 (Deeter et al., 2019); among other improvements, V8 products do not exhibit a latitudinal dependence in partial CO column biases observed in V7. The MOPITT retrieval algorithm processes only clear-sky observations (Francis et al., 2017). The clear or cloudy status of an observation is typically determined from MOPITT radiances and a cloud mask (Ackerman et al., 1998) based on simultaneous observations by MODIS (MODerate resolution Imaging Spectroradiometer, also onboard the Terra platform). The ∼480 MODIS observations at 1×1 km2 horizontal resolution acquired at the same time as a single MOPITT observation and within the MOPITT footprint are identified and collected; relevant MODIS cloud descriptors (available in the MOPITT L2 product) are evaluated. MOPITT observations for which at least 95 % of the colocated MODIS cloud mask values are considered clear are passed to the retrieval algorithm. MOPITT archive data are those corrected with gain and offset values derived from an interpolation performed between two consecutive hot-calibration events, which are usually executed once per year. This retrospective correction alleviates large differences in total column values otherwise observed in NIR retrievals; TIR products are affected to a much lesser degree (Deeter et al., 2017). Here we use MOPITT archive data produced after the hot calibration performed between 11 and 23 March 2019; thus, the closing date for the period analyzed here is 10 March 2019. Total column validation results for version 8 products indicate that relative biases and SD are less than 1 % and 7 %, respectively (i.e., less than 0.5 and 1.5×10¹⁷ molec cm−2) (Deeter et al., 2019).
2.3 ATom-4
To analyze TROPOMI retrievals over bodies of water we use ATom (Wofsy et al., 2018) in situ CO profiles from its fourth campaign, carried out between 24 April and 21 May 2018. During ATom-4 more than 150 vertical profiles were acquired, most of them over water in the Atlantic and Pacific regions, covering a wide latitudinal range. CO concentrations along those profiles were measured with the Harvard QCLS (pulsed-Quantum Cascade Laser System) instrument (Santoni et al., 2014; McManus et al., 2010) and the NOAA Picarro cavity ring-down spectrometer (Crosson, 2008; Karion et al., 2013), both onboard NASA's DC-8 platform. Measurements were acquired from 0.2 to 12 km of altitude at a 1 Hz sampling rate. The QCLS instrument operates in the 4.59 µm region, with precision and accuracy of 0.15 and 3.5 ppb, respectively (Santoni et al., 2014). The NOAA Picarro measures radiation in the 1.57 µm region, where the second overtone of the CO stretch is located; the estimated total uncertainty of its measurements is 5.0 ppb at 1 Hz, or 3.4 ppb at 0.1 Hz (McKain and Sweeney, 2018). Here we use the merged QCLS–Picarro data product CO.X from the dataset version published 28 March 2018 and updated 25 November 2019. The quantity CO.X uses QCLS CO data with calibration gaps filled in by Picarro CO data, after subtracting the low-pass-filtered difference between the QCLS and the somewhat noisier Picarro measurement. Both instruments were calibrated to the NOAA X2014A CO scale. Measurements account for drift of CO in their field calibration tanks (ESRL, 2018) by having them measured at the central calibration laboratory before and after the campaign and applying a linear drift correction to the assigned values.
In Sect. 4 we separately present quantitative comparisons of TROPOMI total column retrievals with MOPITT total column retrievals and with in situ profiles measured from aircraft. However, different methods are required in each case (Rodgers and Connor, 2003). Comparisons with in situ profile data are generally simpler and more easily interpreted because the vertical sensitivity of the satellite measurement can be represented exactly using the retrieval AK.
3.1 MOPITT and TROPOMI algorithm differences
Fundamental differences in the MOPITT and TROPOMI retrieval algorithms result in a challenge to find consistent intercomparison methods. The MOPITT algorithm is based on optimal estimation as developed by Rodgers (2000). TROPOMI uses a profile-scaling algorithm based on Tikhonov regularization, as described in Vidot et al. (2012), Borsdorff et al. (2014), Landgraf et al. (2016), and references therein. Moreover, the MOPITT state vector and AKs are based on CO profiles of log(VMR), whereas the TROPOMI retrieval algorithm involves CO profiles expressed in column density values (molecules per unit area). For simplicity, we assume in the following discussion that MOPITT log(VMR)-based quantities can be converted to column-density-based quantities.
Thus, neglecting error terms, we can write for MOPITT
where cMOP is the retrieved total column, aMOP is the column-density-based total column AK, xtrue is the true profile, C is the total column operator, and is the a priori profile. cMOP, xtrue, and are all expressed in column density (molecules per unit area). C and aMOP are dimensionless.
For TROPOMI, however, we have
where cTROP is the retrieved total column and aTROP is the total column AK. Thus, the retrieved total column for MOPITT partially depends on a “null-space contribution” given by the term (C−aMOP) , whereas the TROPOMI total column retrieval lacks this term. For MOPITT, this term represents the weighting of the MOPITT a priori profile in the retrieved total column. As noted in Borsdorff et al. (2014), a null-space contribution term is not beneficial for data assimilation applications, but it may be added to the TROPOMI total column retrieval by the user if a particular source of a priori information is desired. This option is applied in Sect. 4.1.4 and 4.2.3 as a means of testing the influence of the a priori profile on MOPITT–TROPOMI comparisons.
3.2 In situ validation: TROPOMI vs. ATom-4
In situ profile data acquired from aircraft are well-suited for validating satellite CO retrievals. In the following we use the ATom-4 in situ dataset, which mainly includes over-ocean observations. We derived both true and retrieval-simulated (i.e., unsmoothed and smoothed) total CO column values from the ATom-4 profiles; smoothed values account for the vertical sensitivity of the TROPOMI measurements as expressed by their AK.
Prior to obtaining unsmoothed and smoothed ATom-4 total CO columns, complete (e.g., from the surface to the top of the atmosphere) ATom-4 CO profiles were generated following the standard method for MOPITT validation with airborne data. Profiles that did not cover the 400 to 800 hPa range were rejected. The remaining profiles (between 271±48 hPa and 983±32 hPa) were interpolated to match the MOPITT a priori 35-level vertical grid, which preserves high vertical resolution in the troposphere. Empty levels at the bottom of each interpolated profile (levels with no CO value) were filled with the interpolated measurement closest to the surface. Similarly, empty levels between the top of the interpolated profile and the tropopause were filled with the interpolated measurement closest to the tropopause. Finally, empty levels above the tropopause were filled with colocated MOPITT a priori CO values. Unsmoothed ATom-4 total CO column values were then calculated as follows:
where xtrue is expressed as an array of partial column values (molec cm−2), the constant 2.12×10¹³ is in , Δp is the array of partial column pressure thicknesses (hPa), and VMR is the array of VMR values (ppbv). The derivation of Eq. (3) can be found in Deeter (2009).
Smoothed ATom-4 total CO column values involve the TROPOMI AK. TROPOMI total column retrievals in cloudy scenes are more sensitive to CO above the cloud than to CO below the cloud; smoothed total column values account for this effect explicitly. Similarly to Eq. (2), smoothed ATom-4 CO profiles can be calculated by substituting xtrue with the complete ATom-4 profiles obtained as detailed above and interpolated to match the 50-level vertical grid of their colocated TROPOMI total column AK. Finally, smoothed ATom-4 total CO column values are calculated by applying Eq. (3).
Comparisons between TROPOMI total column retrievals and true (unsmoothed) ATom-4 total column values are the most direct, but they are subject to various sources of random and systematic error. Comparisons between TROPOMI total column retrievals and retrieval-simulated (smoothed) ATom-4 column values should be less affected by TROPOMI vertical sensitivity variations and can be used to investigate the overall performance of the retrieval. Relative bias values were calculated with respect to ATom in all cases (100 × (TROPOMI − ATom)∕ATom), as were column bias values (TROPOMI − ATom).
In addition, we quantified the error introduced by approximating the partial column below cloud top with the TROPOMI reference profile by calculating the null-space error of the TROPOMI retrieval process (enull) as described in Borsdorff et al. (2014) and Landgraf et al. (2016):
As discussed in Sect. 4.2.1, analysis of enull may be useful for diagnosing retrieval errors over cloudy scenes related to the shape of the TROPOMI model-calculated reference profiles.
3.3 Satellite comparisons: TROPOMI vs. MOPITT
3.3.1 Sources of error
Satellite-based retrievals of the CO total column, like other remote sensing retrievals, are subject to several sources of error (Rodgers, 2000). Prominent sources of error for both MOPITT and TROPOMI include smoothing error (related to the departure of the total column AK from the ideal dependence, which would have a value of 1 at all altitudes) and random retrieval noise. Other potentially important effects, which are not considered further, include model parameter error and forward model error (Rodgers, 2000). Retrieval averaging can be used to reduce the effects of retrieval noise but does not reduce smoothing error. Smoothing error is instrument-dependent; it also depends on details of the retrieval algorithm. For both MOPITT and TROPOMI, the total column smoothing error is related to the total column AK and true CO profile, similarly to what Eq. (4) shows.
As discussed in Sect. 2.1, smoothing error for TROPOMI retrievals in clear-sky scenes over land is generally very small since aTROP is near 1 at all altitudes. In scenes containing clouds, which includes all TROPOMI retrievals over the ocean, aTROP increases to values greater than 1 above the cloud and decreases to less than 1 below the cloud (Fig. 1). However, as a result of the profile-scaling method used by TROPOMI, smoothing error also vanishes if the shape of the true profile converges with the shape of the assumed reference profile, even in cloudy scenes (Borsdorff et al., 2014). Smoothing error for TROPOMI will thus be largest in cloudy scenes in which the reference profile and true profile exhibit a significant difference in shape.
Smoothing error associated with the MOPITT total column AK, discussed in Sect. 2.2, varies for the TIR-only, NIR-only, and TIR + NIR products. However, as indicated by Fig. 1, total column smoothing error for all MOPITT variants will typically be larger than for TROPOMI because of significant differences of aMOP from the ideal column AK.
Methods for comparing remote sensing retrievals of geophysical quantities (such as trace-gas vertical profiles) from different instruments are described in Rodgers and Connor (2003). Effects that contribute to differences in retrieved values include the use of different a priori information for each instrument, differences in AK, and differences in instrument noise. One goal of the described methods is to determine whether or not observed differences in retrievals for two instruments are statistically consistent with known differences in a priori, AK, and instrument noise. However, this goal is elusive because technically it also requires knowledge of the statistics (mean and variability) of the ensemble of true atmospheric states being used for the comparisons; this information is often unknown.
Our main goal in performing comparisons of MOPITT and TROPOMI total column retrievals is to quantify differences between the two retrieval products available to users rather than quantifying the actual bias of either product. This goal is addressed by direct “end-to-end” comparisons of the two untransformed products in various geographical regions, after appropriate matching of the MOPITT and TROPOMI retrievals in space and time. These comparisons quantify the MOPITT–TROPOMI difference statistics (e.g., bias and SD) due to all effects: AK differences, a priori differences, and instrument noise.
A secondary goal of the comparisons is to specifically investigate the influence of a priori information on MOPITT–TROPOMI retrieval differences. Unlike the AKs, which fundamentally depend on characteristics of the instrument, the source of a priori (or reference profiles in the case of TROPOMI) is a choice of the retrieval algorithm developers. The method for addressing this goal described in Rodgers and Connor (2003) assumes that both retrievals exhibit a similar a priori dependence, represented by Eq. (1), and is thus not applicable to TROPOMI. An alternative strategy, suggested in Borsdorff et al. (2014), is to add a null-space contribution to the TROPOMI total column retrievals based on the MOPITT a priori profile, i.e.,
where is the null-space-adjusted TROPOMI total column. The adjustment term effectively uses the MOPITT a priori profile to estimate the CO partial column for profile levels at which the TROPOMI measurement lacks sensitivity. This term vanishes when aTROP approaches C and when approaches the TROPOMI reference profile (because aTROP ). For MOPITT–TROPOMI comparisons, this adjustment to the TROPOMI-retrieved total columns should reduce differences due to discrepancies between the MOPITT a priori profile and TROPOMI reference profile, but it should have no effect on differences related to discrepancies in retrieval AK or other sources of retrieval bias. Results of MOPITT–TROPOMI comparisons incorporating this adjustment over land and oceanic regions are presented in Sect. 4.1.4 and 4.2.3, respectively.
3.3.2 Land retrieval comparisons
Over land, MOPITT and TROPOMI total column retrievals were compared in clear-sky scenes only. In such scenes, TROPOMI smoothing error is typically negligible since aTROP is close to 1 at all altitudes. For these comparisons, we selected six ROIs (regions of interest; Fig. 2) representative of either polluted or clean regimes. Polluted ROIs include the following: the southeastern USA (hereafter referred to as USA; 35∘ N, 95∘ W to 40∘ N, 75∘ W), central Europe (Europe; 45∘ N, 0∘ E to 55∘ N, 15∘ E), the northern half of the Indian Subcontinent (India; 20∘ N, 70∘ E to 30∘ N, 95∘ E), and northeastern China (China; 30∘ N, 110∘ E to 40∘ N, 123∘ E). Clean ROIs are northern Africa and Arabia (Sahara; 15∘ N, 20∘ W to 30∘ N, 50∘ E) and western Australia (Australia; 32∘ S, 112∘ E to 17∘ S, 138∘ E). Two additional ROIs were defined to represent most of the Northern and Southern (N and S) Hemisphere (0∘ N to 60∘ N and 60∘ S to 0∘ N, respectively). TROPOMI and MOPITT retrievals covering each of these ROIs for the period between 7 November 2017 and 10 March 2019 were gathered and filtered to keep only clear daytime data over land.
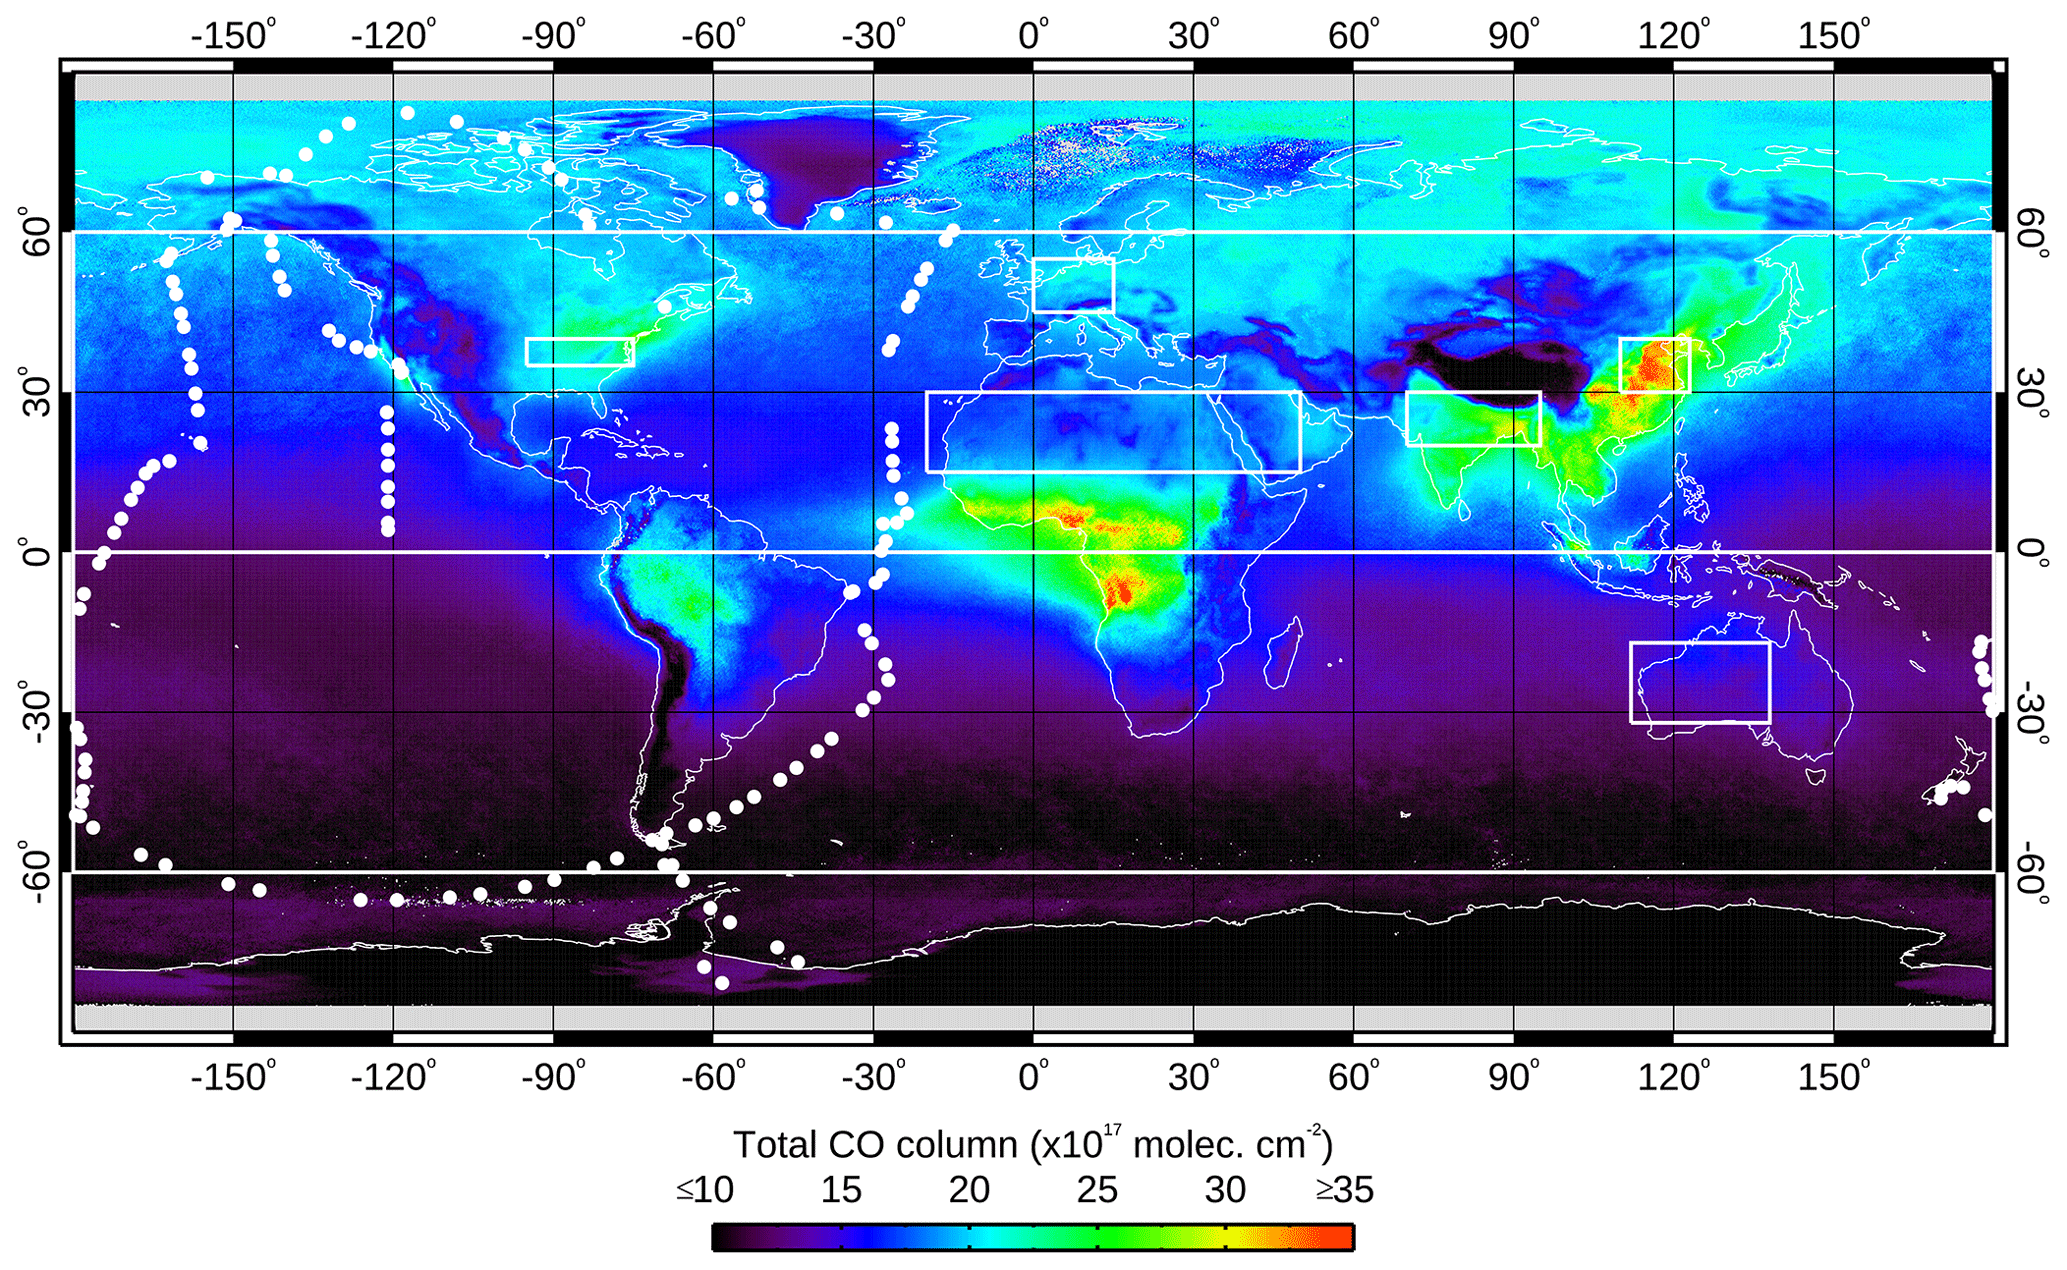
Figure 2White rectangles show the location of the land-only ROIs analyzed: N Hemisphere (0 to 60∘ N), S Hemisphere (60∘ S to 0∘ N), USA (35∘ N, 95∘ W to 40∘ N, 75∘ W), Europe (45∘ N, 0∘ E to 55∘ N, 15∘ E), India (20∘ N, 70∘ E to 30∘ N, 95∘ E), China (30∘ N, 110∘ E to 40∘ N, 123∘ E), Sahara (15∘ N, 20∘ W to 30∘ N, 50∘ E), and Australia (32∘ S, 112∘ E to 17∘ S, 138∘ E). White circles indicate the location of individual CO profiles acquired in April–May 2018 during the ATom-4 airborne campaign. The background map shows mean MOPITT TIR total CO column values for 2018.
Colocated and non-colocated retrievals from the two instruments were analyzed separately; results from the former are presented in Sect. 4.1, whereas supporting results from the latter are presented in the Supplement. We apply the term “colocated” to pairs of retrievals from two different datasets acquired on the same day and within a ≤50 km horizontal distance. In contrast, we apply the term “non-colocated” to retrievals from two different datasets acquired on the same day and inside the same ROI. Colocated samples allow for a more direct comparison, since they are more closely representative of the same atmospheric conditions. By using non-colocated retrievals we maximized the size and diversity of the populations analyzed.
Daily scatterplots for each ROI were obtained from the colocated retrievals. We quantified, among others, daily bias (i.e., accuracy) and SD (i.e., precision; calculated from individual biases between each pair of colocated observations) between TROPOMI and each of the three MOPITT products (TIR, NIR, and TIR + NIR). Relative bias values (%) were calculated with respect to MOPITT in all cases (100 × (TROPOMI − MOPITT)∕MOPITT). Column bias values (molec cm−2), also provided for completeness, were calculated with respect to MOPITT (TROPOMI − MOPITT). Thus, a negative bias would indicate that TROPOMI CO values are lower than their MOPITT counterparts.
Results from an analogous comparison of colocated MOPITT and null-space-adjusted (as described in Sect. 3.3.1) TROPOMI total column retrievals can also be found in Sect. 4.1.4.
3.3.3 Water retrieval comparisons
Two types of MOPITT–TROPOMI comparisons were made over oceanic regions. Direct comparisons, performed without any adjustments to either the MOPITT or TROPOMI total column values, are presented in Sect. 4.2.2. Comparisons incorporating the TROPOMI null-space adjustment, as described in Sect. 3.3.1, are presented in Sect. 4.2.3. Statistics for the Northern and Southern Hemisphere are analyzed separately. Given their nature, all comparisons over bodies of water used colocated observations.
Land-only comparisons have the purpose of evaluating TROPOMI's performance with respect to MOPITT TIR, NIR, and TIR + NIR. Separate comparisons were performed using either colocated data (results in Sect. 4.1; for untransformed and null-space-adjusted TROPOMI) or non-colocated data (Supplement). Water-only comparisons aim to estimate the error introduced in TROPOMI retrievals over bodies of water, only possible in cloudy conditions, by approximating CO concentrations below cloud top with colocated, scaled TROPOMI reference profile values. Two sets of water-only comparisons were performed. The first, with respect to in situ ATom-4 profiles, accounted for differences in TROPOMI vertical sensitivity as represented by its AK (Sect. 4.2.1). Second, we compared untransformed TROPOMI with respect to MOPITT TIR total column values (Sect. 4.2.2). Third, we compared null-space-adjusted TROPOMI with respect to MOPITT TIR total column values (Sect. 4.2.3). Additional comparisons with respect to MOPITT TIR and ATom-4 profiles assuming a simple scenario in which TROPOMI only had sensitivity to CO above cloud top are available in the Supplement; this approximation would be most accurate for optically thick clouds.
4.1 TROPOMI retrievals over land
Here we describe results from the comparison of daily (from 7 November 2017 to 10 March 2019) colocated TROPOMI and MOPITT retrievals over eight ROIs: two hemispheric, four representative of polluted regions, and two of clean regions (Fig. 2). Daily bias and SD values calculated between TROPOMI and each of the three MOPITT products are presented below.
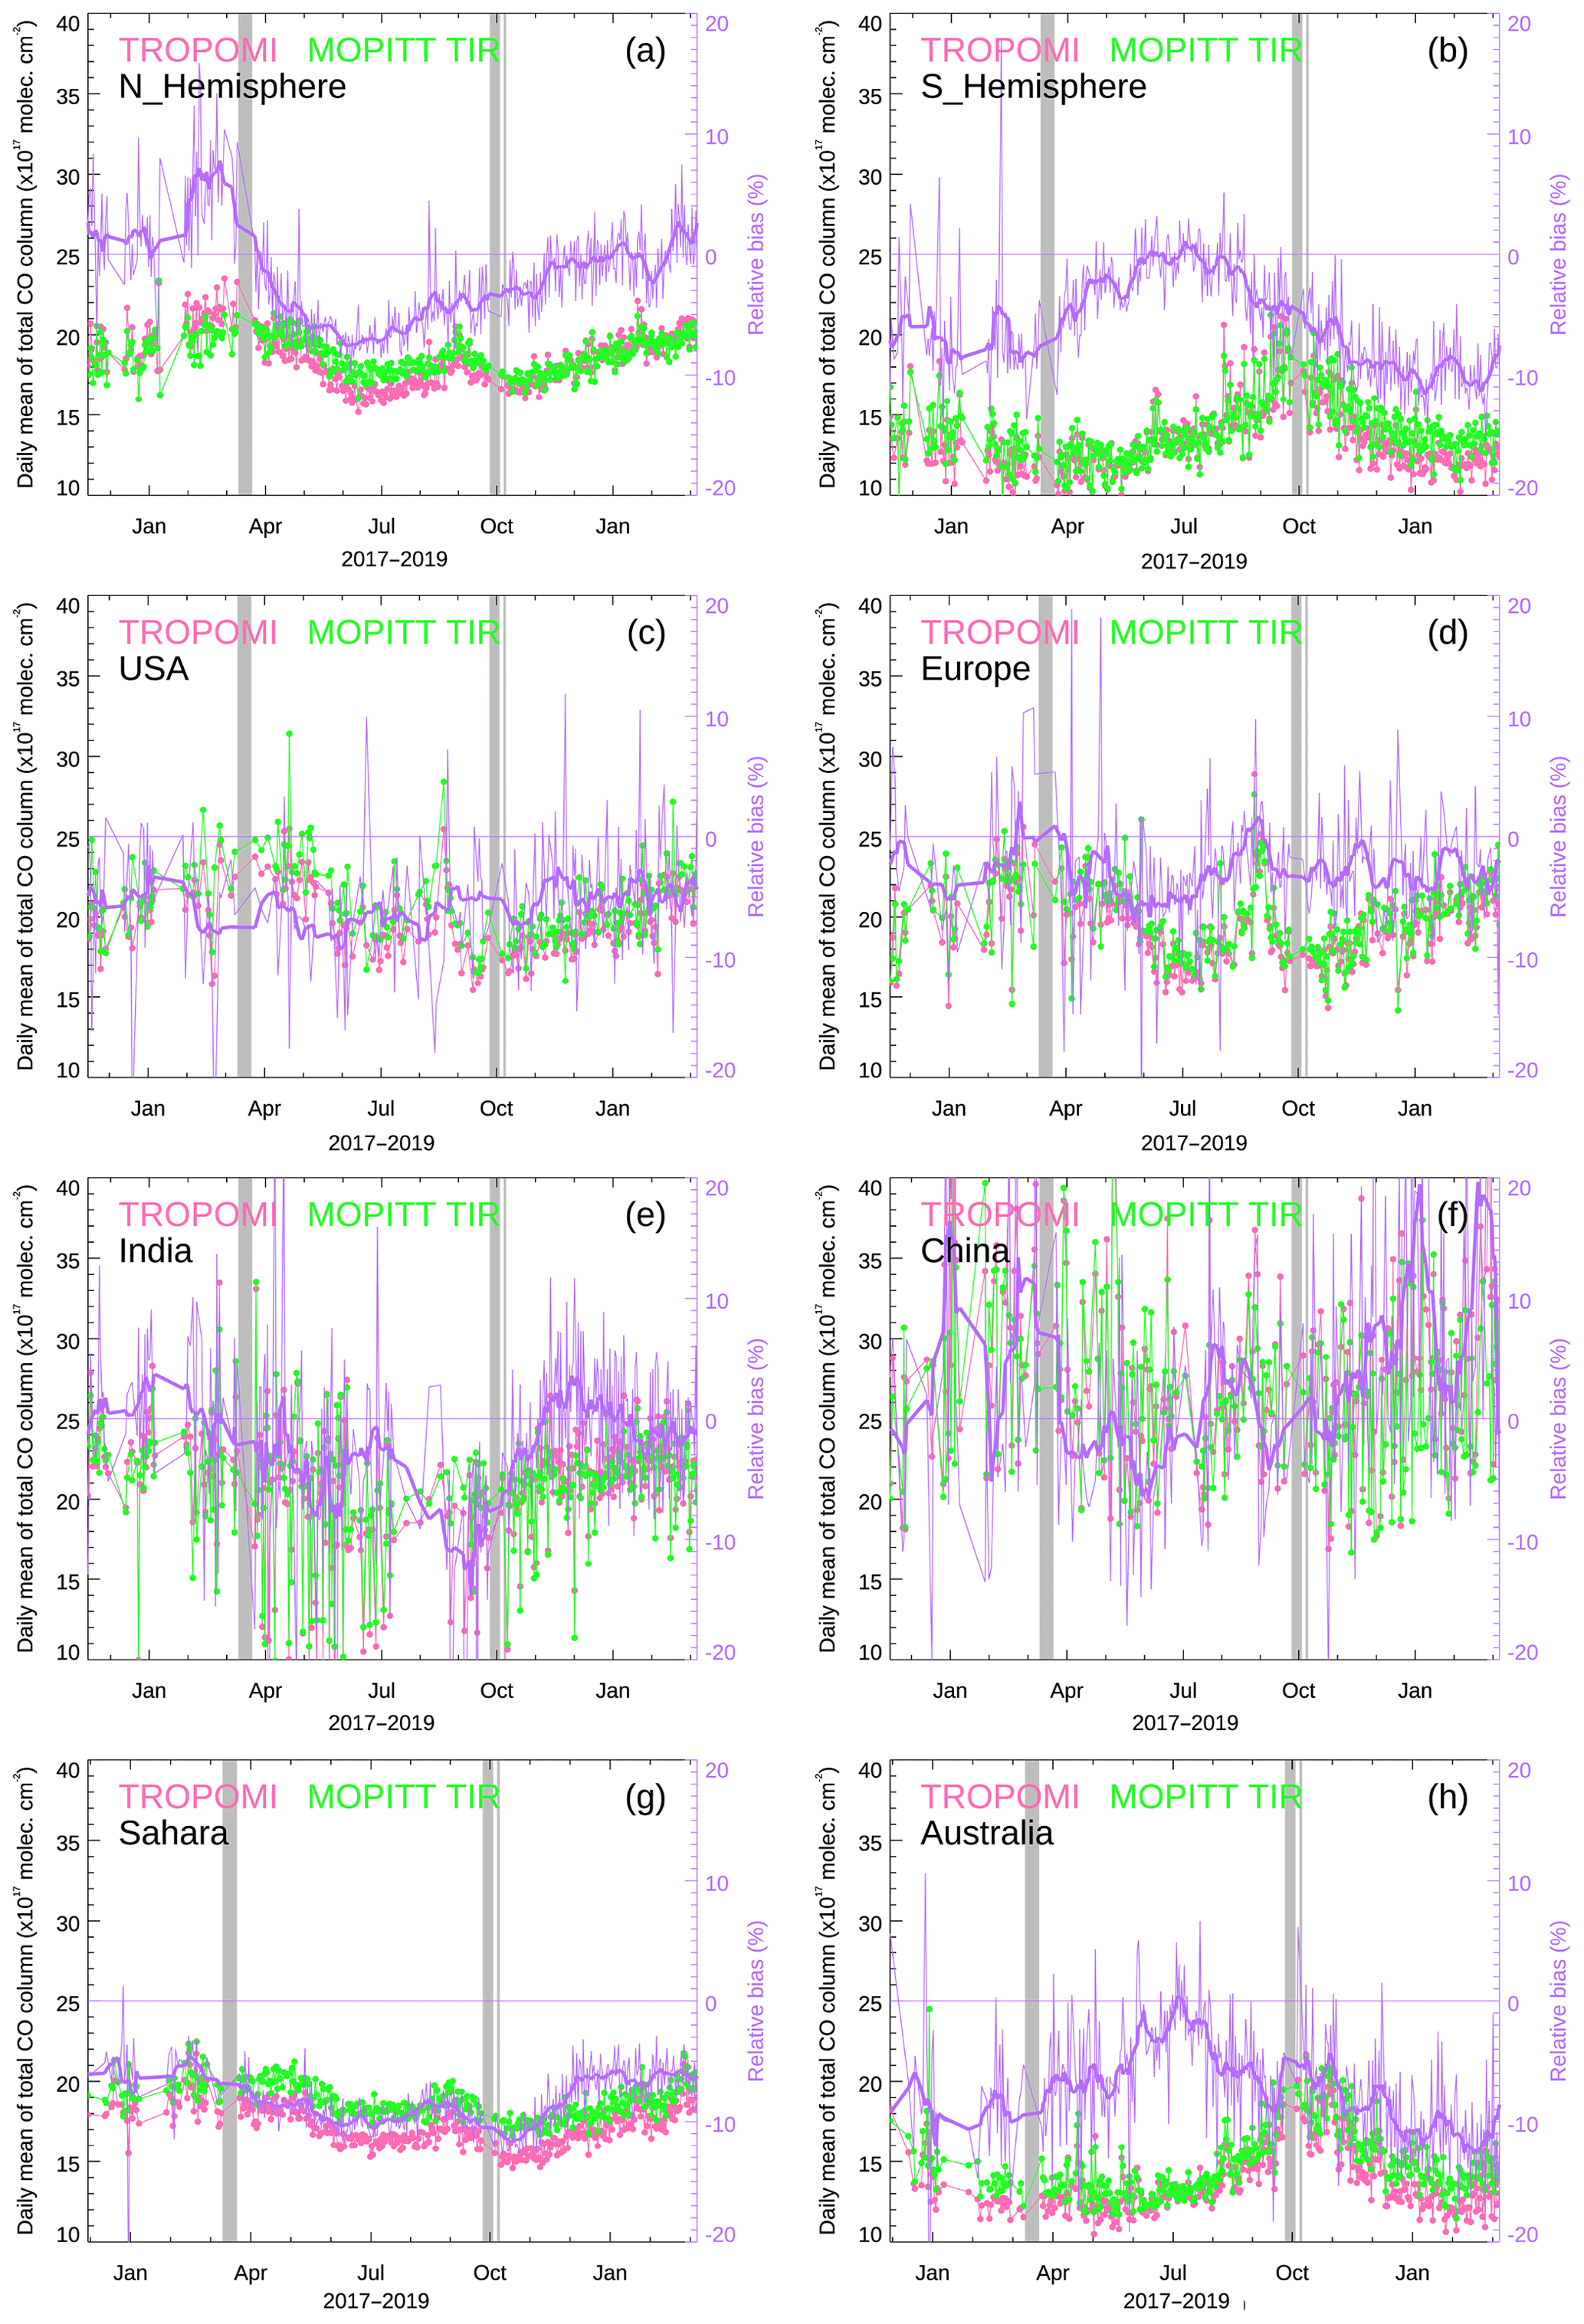
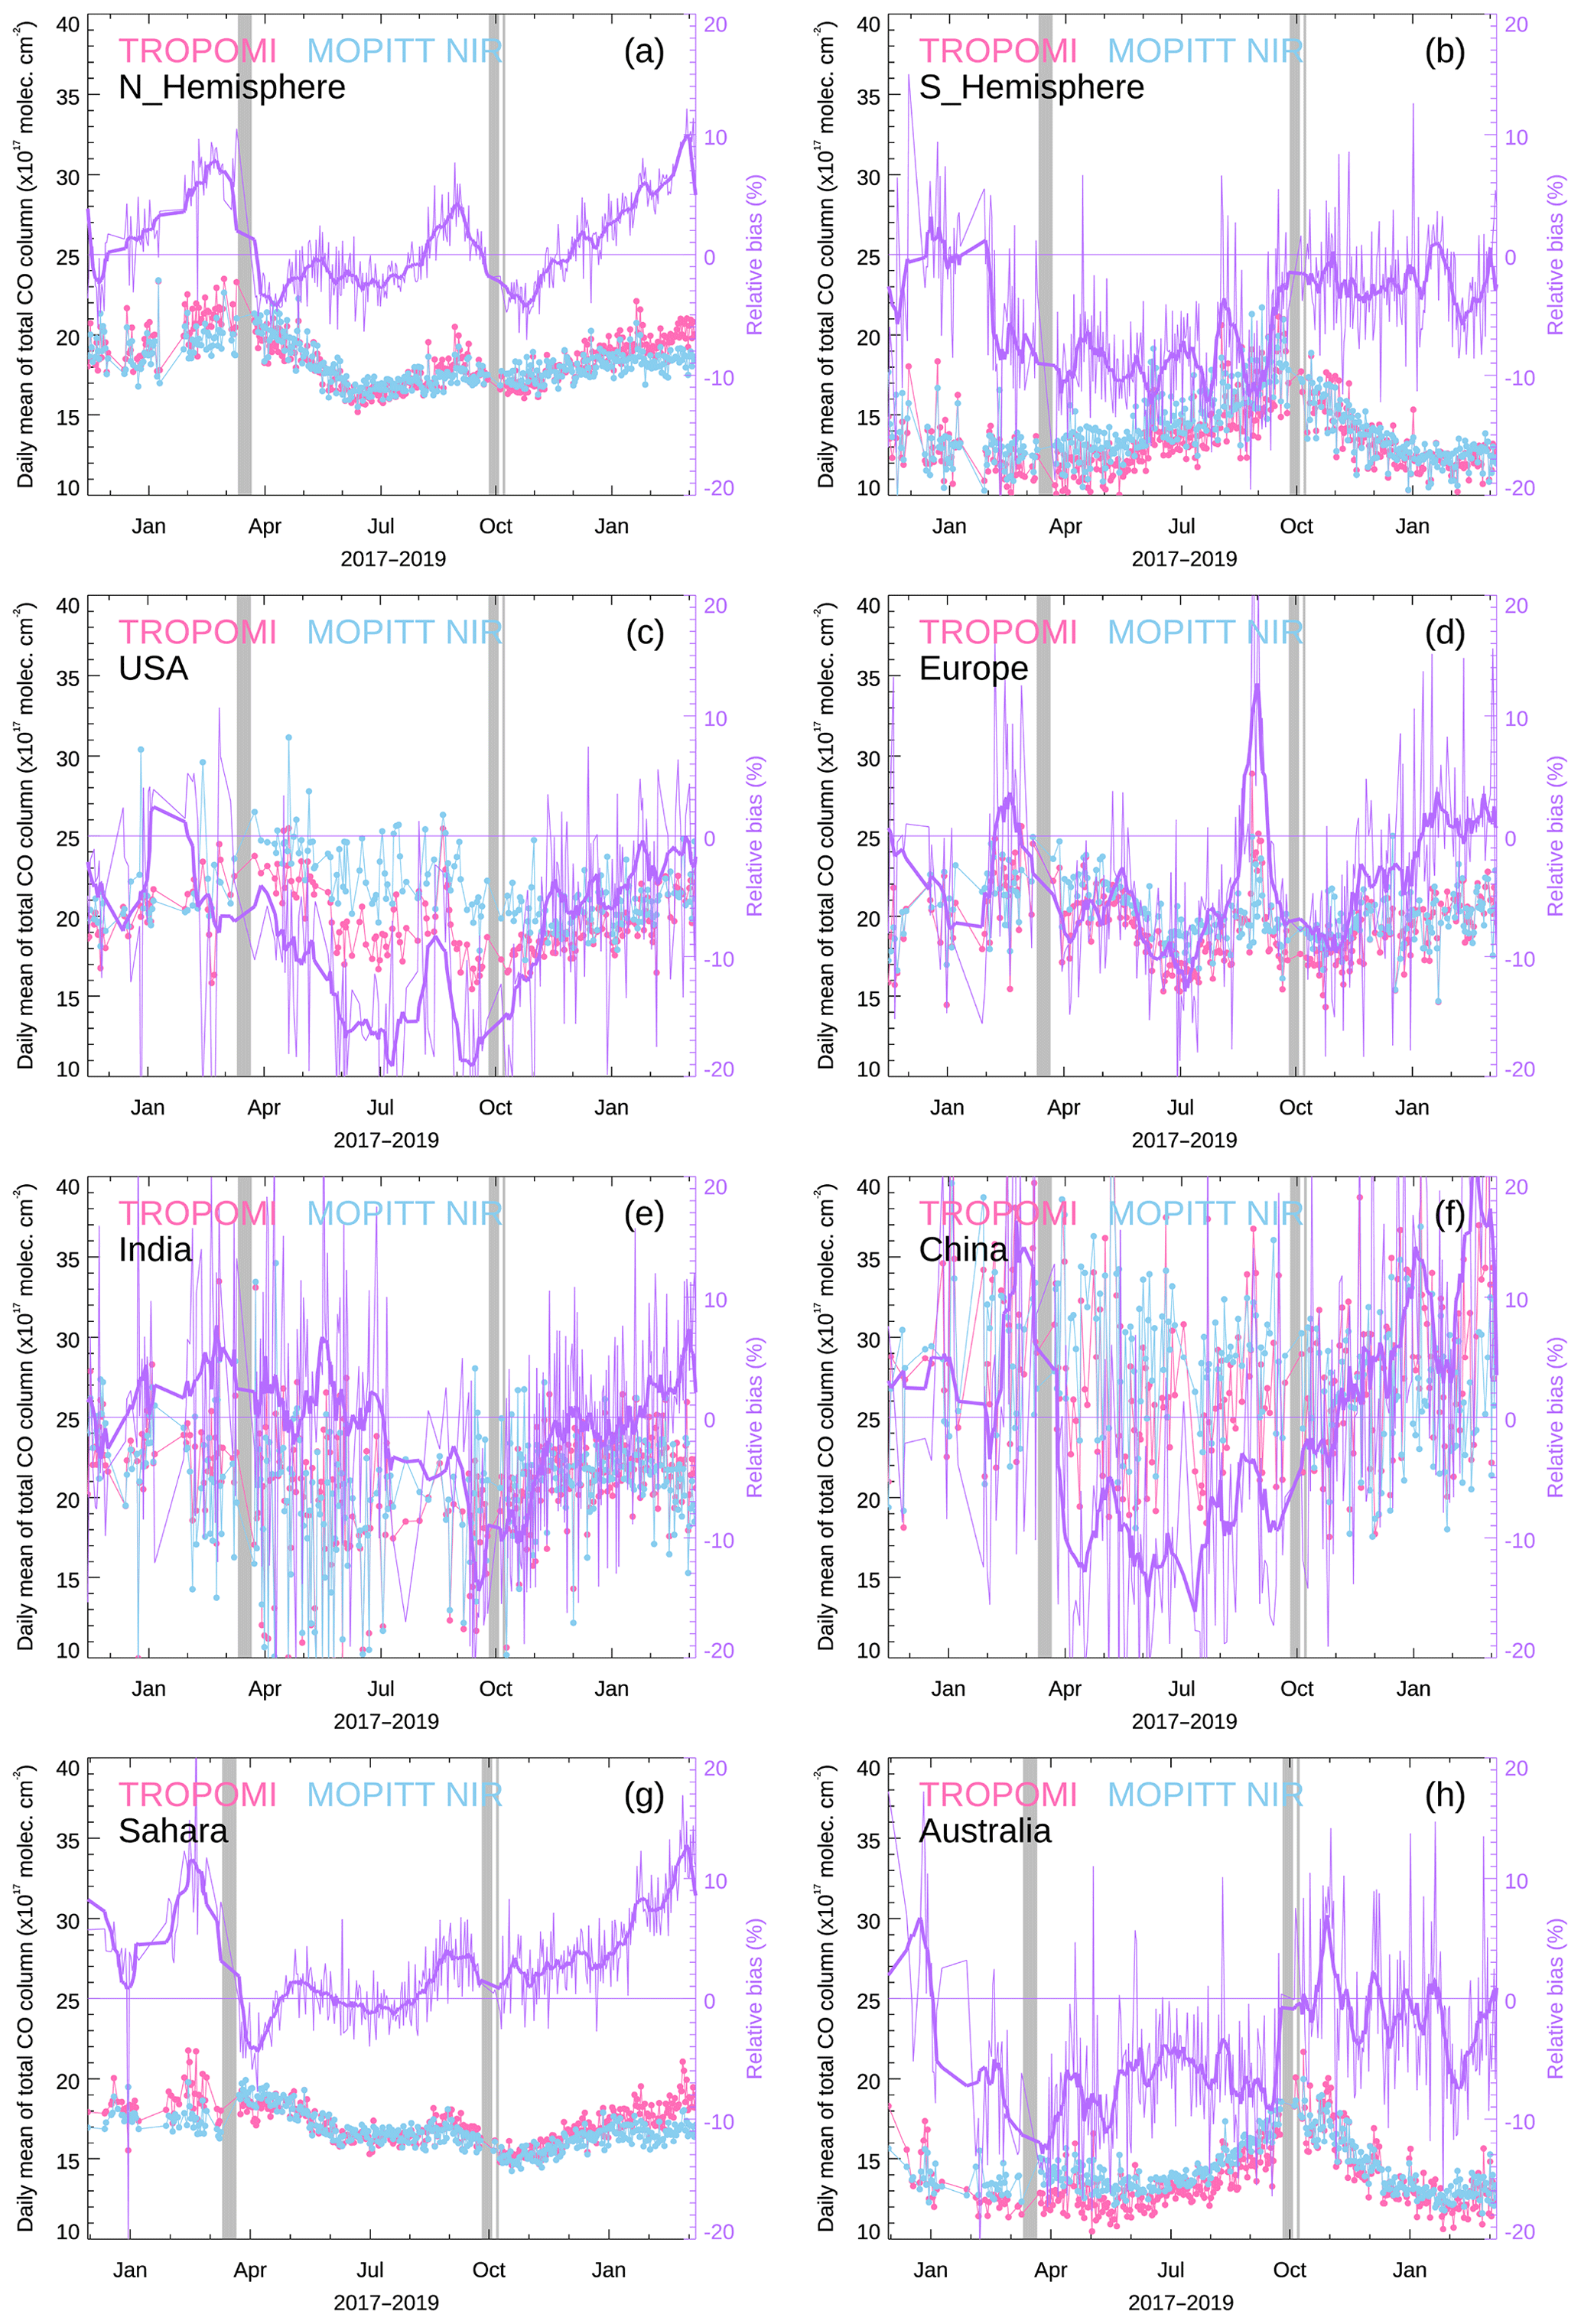
Figure 3Comparison of colocated land retrievals from TROPOMI (pink) and MOPITT TIR (green) for each ROI analyzed. Filled circles show the daily mean. Thin purple lines indicate the daily relative bias (i.e., accuracy) between the two datasets, and thick purple lines are an 11 d smoothed version with high-frequency variability removed. Gray bars show periods without MOPITT measurements because of hot calibrations (March and October 2018) or a safe-mode maneuver (October–November 2018).
4.1.1 TROPOMI vs. MOPITT TIR
Daily results from the analysis of colocated TROPOMI and MOPITT TIR data (Fig. 3) show that during the ∼1.5 years analyzed, TROPOMI and MOPITT TIR total CO column retrievals were close to each other in both magnitude and temporal variation. Both datasets agree in displaying strong differences between clean ROIs (Sahara and Australia; 10–20×1017 molec cm−2) and highly polluted ROIs (India and China; 15–40×1017 molec cm−2). They also show the expected differences between the two hemispheres: retrievals are overall lower in the S Hemisphere ROI (10–20×1017 molec cm−2 vs. 15–22×1017 molec cm−2) due to less land area, lower population, and less industrial activity. Both TROPOMI and MOPITT TIR show similar seasonal variability. ROIs located in the Northern Hemisphere present an absolute maximum during boreal winter and a secondary maximum in late boreal summer. The absolute maximum is consistent with winter CO accumulation due to shorter days and (at high latitudes) larger solar zenithal angles, resulting in less photolysis, as well as to increased emissions due to biomass burning north of the Equator in Africa. The secondary maximum is most likely due to fire emissions. Conversely, seasonal trends in Southern Hemisphere ROIs show a maximum in September–October, consistent with CO accumulation during austral winter and emissions from biomass burning south of the Equator.
Table 1Statistics from colocated TROPOMI vs. MOPITT CO retrievals over land for the period between 7 November 2017 and 10 March 2019. Relative bias and SD are in percent. Column bias and SD are in units of 1017 molec cm−2.
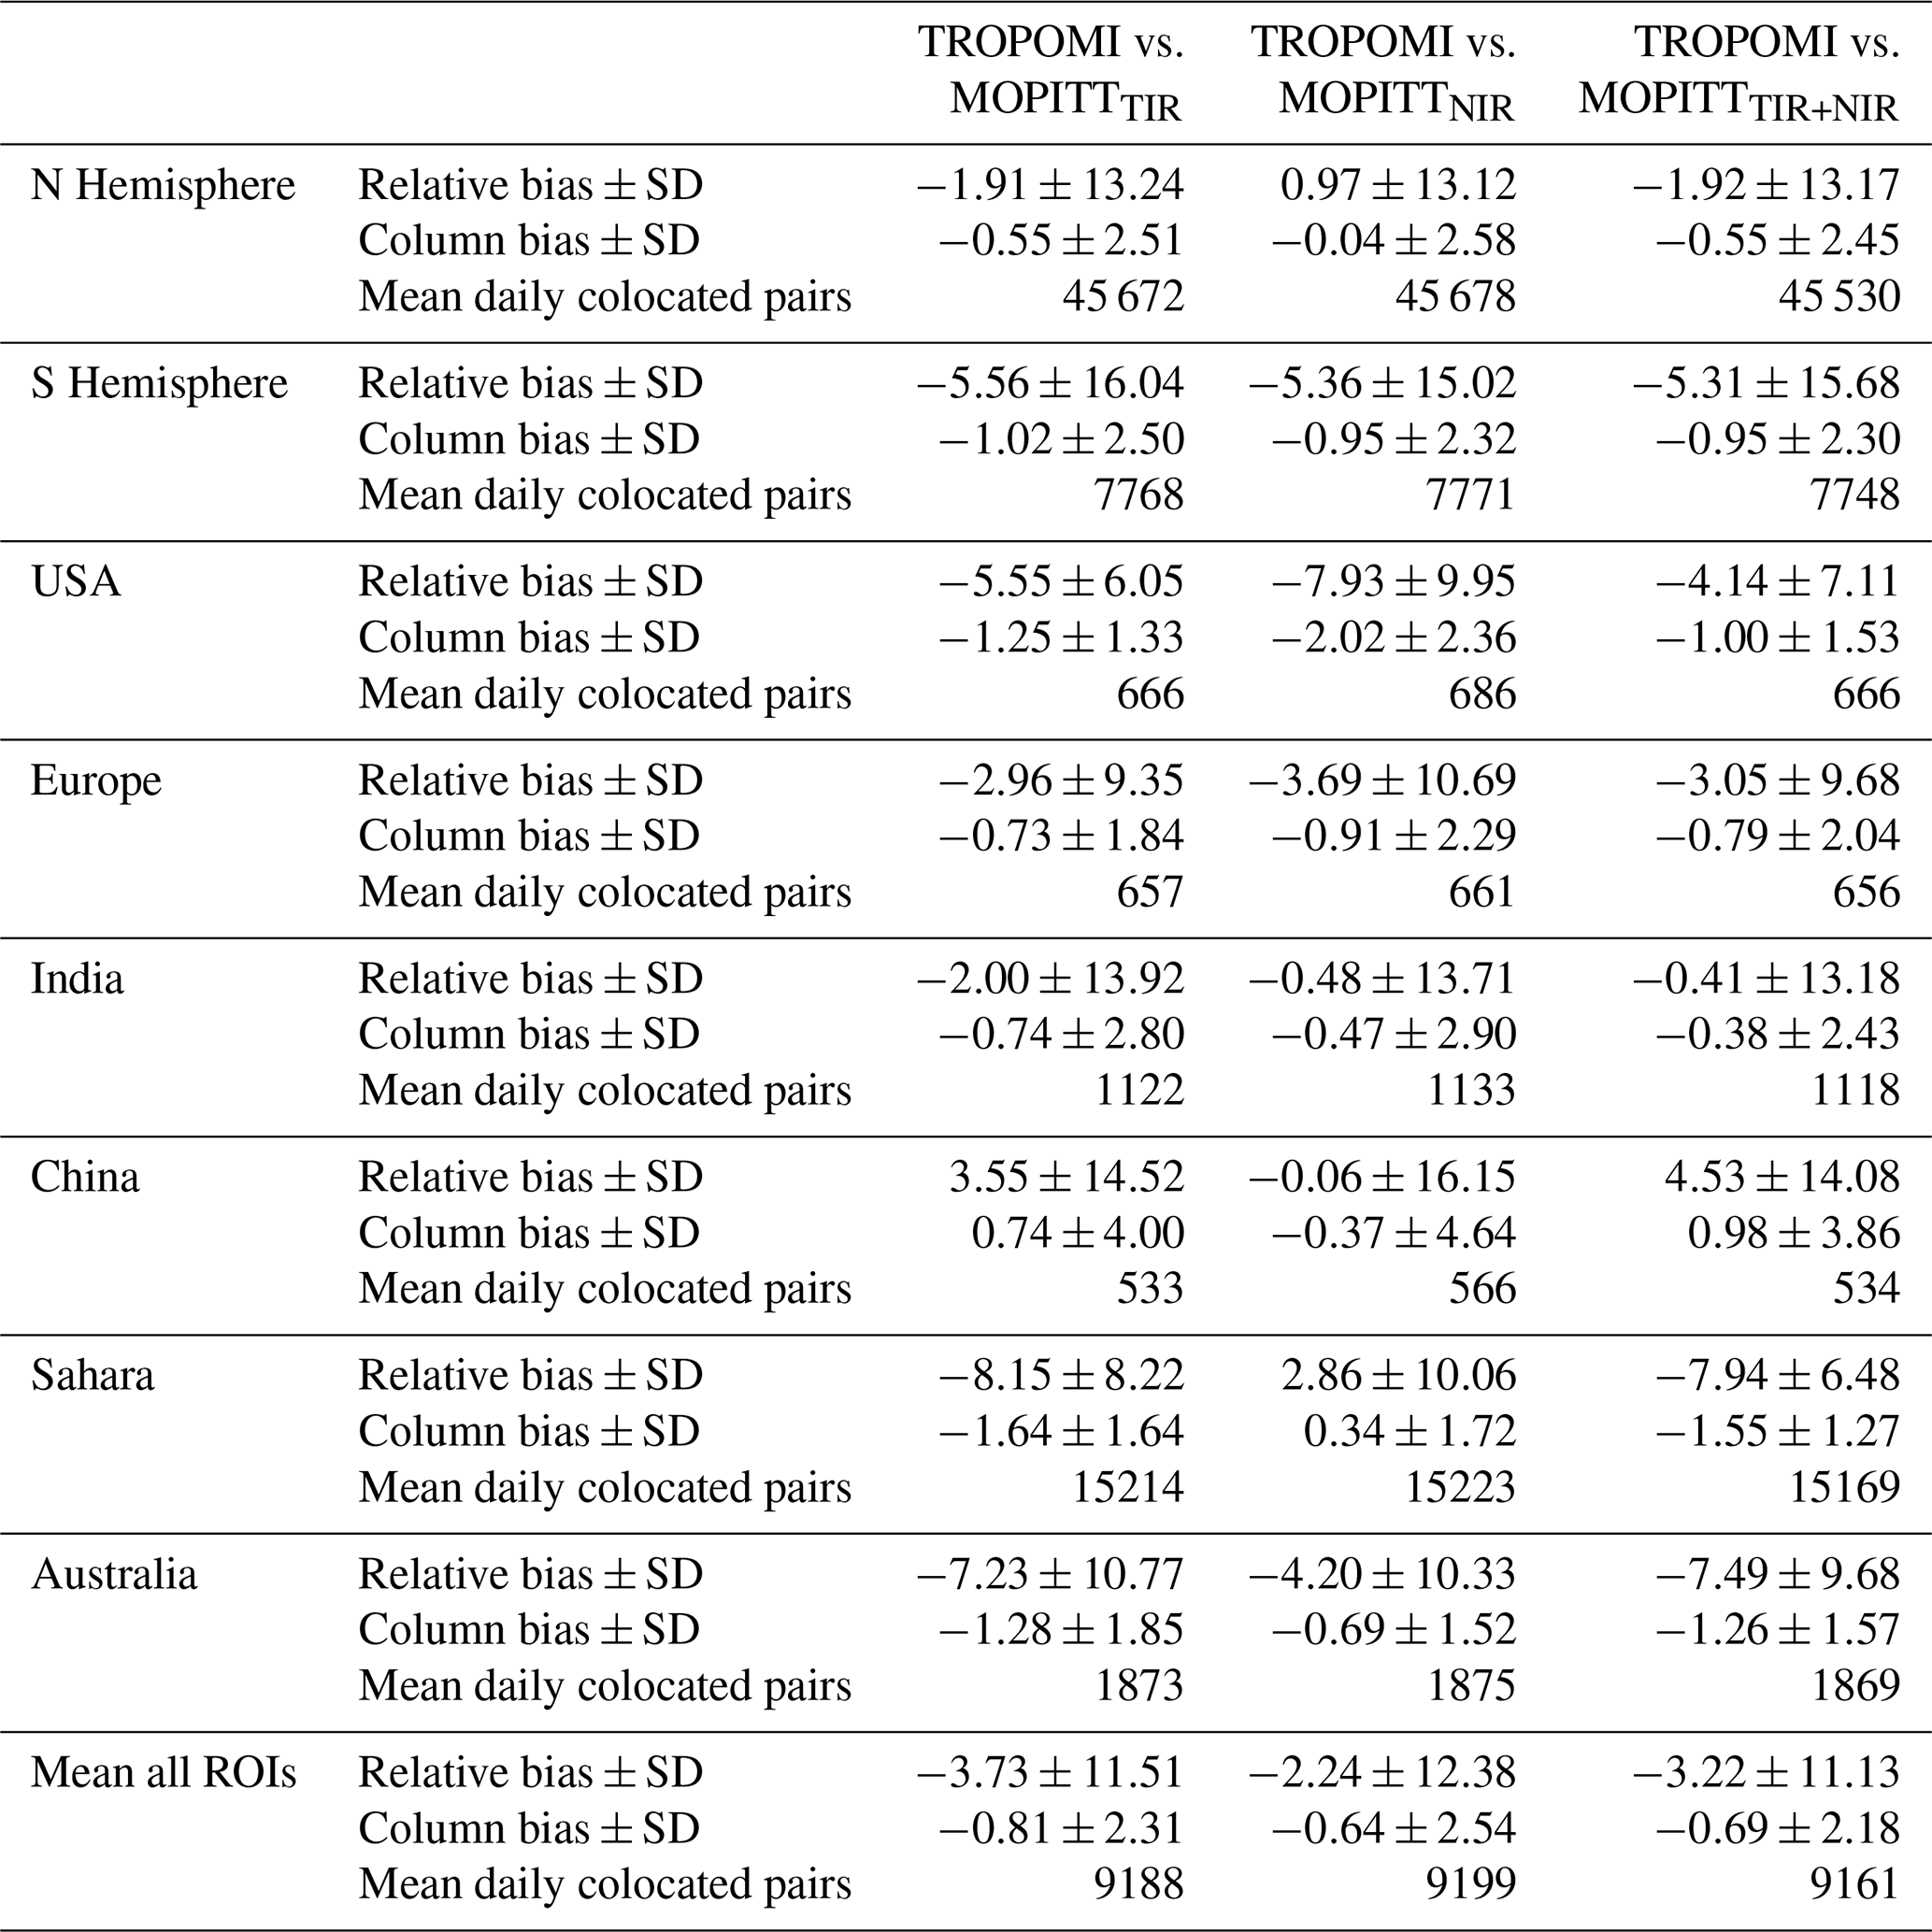
Daily relative bias values are generally within a ±10 % range for all the ROIs except the two most polluted, India and China (Fig. 3e and f), where biases reach higher values, mostly in the −20 % to 20 % range. When averaged over time (Table 1), relative biases are between −8.15 % (Sahara) and 3.55 % (China), with a mean for all the ROIs of −3.73 %. We note that biases for most ROIs are predominantly negative, except for China, where most daily biases are positive. Averaged relative SD values per ROI are between 6.05 % and 16.04 % (USA and S Hemisphere, respectively), with a mean for all ROIs of 11.51 %.
4.1.2 TROPOMI vs. MOPITT NIR
Figure 4 shows daily results from the comparison of colocated TROPOMI and MOPITT NIR land retrievals; time-averaged results are summarized in Table 1. The ranges of daily mean retrievals and seasonal trends observed in each ROI are in general analogous to those described in Sect. 4.1.1. Relative bias values averaged for the period analyzed range between −7.93 % (USA) and 2.86 % (Sahara), while the mean for all the ROIs is −2.24 %. Daily relative bias values for the Sahara ROI (−5 % to 12 % range; Fig. 4g) differ strongly from those calculated with respect to MOPITT TIR (Fig. 3g) (−12 % to −5 % range). For all the other ROIs, relative biases with respect to MOPITT NIR are broadly similar in magnitude to those with respect to MOPITT TIR, although the former present larger oscillations with time. This is consistent with the MOPITT NIR retrievals being more sensitive to geophysical noise due to changes in albedo during a MOPITT observation associated with spacecraft motion (Deeter et al., 2011). Relative SD values averaged over time are between 9.95 % and 16.15 % (USA and China, respectively), with a mean for all ROIs of 12.38 %.

4.1.3 TROPOMI vs. MOPITT TIR + NIR
Daily results from colocated TROPOMI and MOPITT TIR + NIR retrievals are shown in Fig. 5; time-averaged results are summarized in Table 1. Results are similar to those described in Sect. 4.1.1 in terms of daily mean retrieval values, retrieval seasonal trends, and relative biases. The latter range between −7.94 % (Sahara) and 4.53 % (China); the mean for all ROIs is −3.22 %. Averaged relative SD values are between 6.48 % (Sahara) and 15.68 % (S Hemisphere), with a mean for all ROIs of 11.13 %.
4.1.4 Null-space-adjusted TROPOMI vs. MOPITT
Table 4 summarizes time-averaged bias values resulting from the comparison of colocated, null-space-adjusted TROPOMI and MOPITT land retrievals. Relative bias values averaged for all ROIs are −2.52 %, −1.07 %, and −1.99 % (for MOPITT TIR, NIR, and TIR + NIR, respectively). Similarly, averaged relative SD values are 11.57 %, 12.40 %, and 11.21 %. Daily results are analogous to those shown in Figs. 3, 4, and 5 in both magnitude and temporal variation.
4.2 TROPOMI retrievals over water
Next we present results from the comparison of colocated TROPOMI and ATom-4 retrievals between 24 April and 21 May 2018 over the Atlantic and Pacific regions. Similarly, we describe results obtained from colocated TROPOMI (both untransformed and null-space-adjusted) and MOPITT TIR over-water retrievals acquired between 7 November 2017 and 10 March 2019 over the two hemispheric ROIs. The ATom-4 data offer the opportunity to compare TROPOMI retrievals to in situ measurements; the MOPITT dataset has the advantage of a substantially larger number of samples distributed over a longer period of time and a wider geographical area.
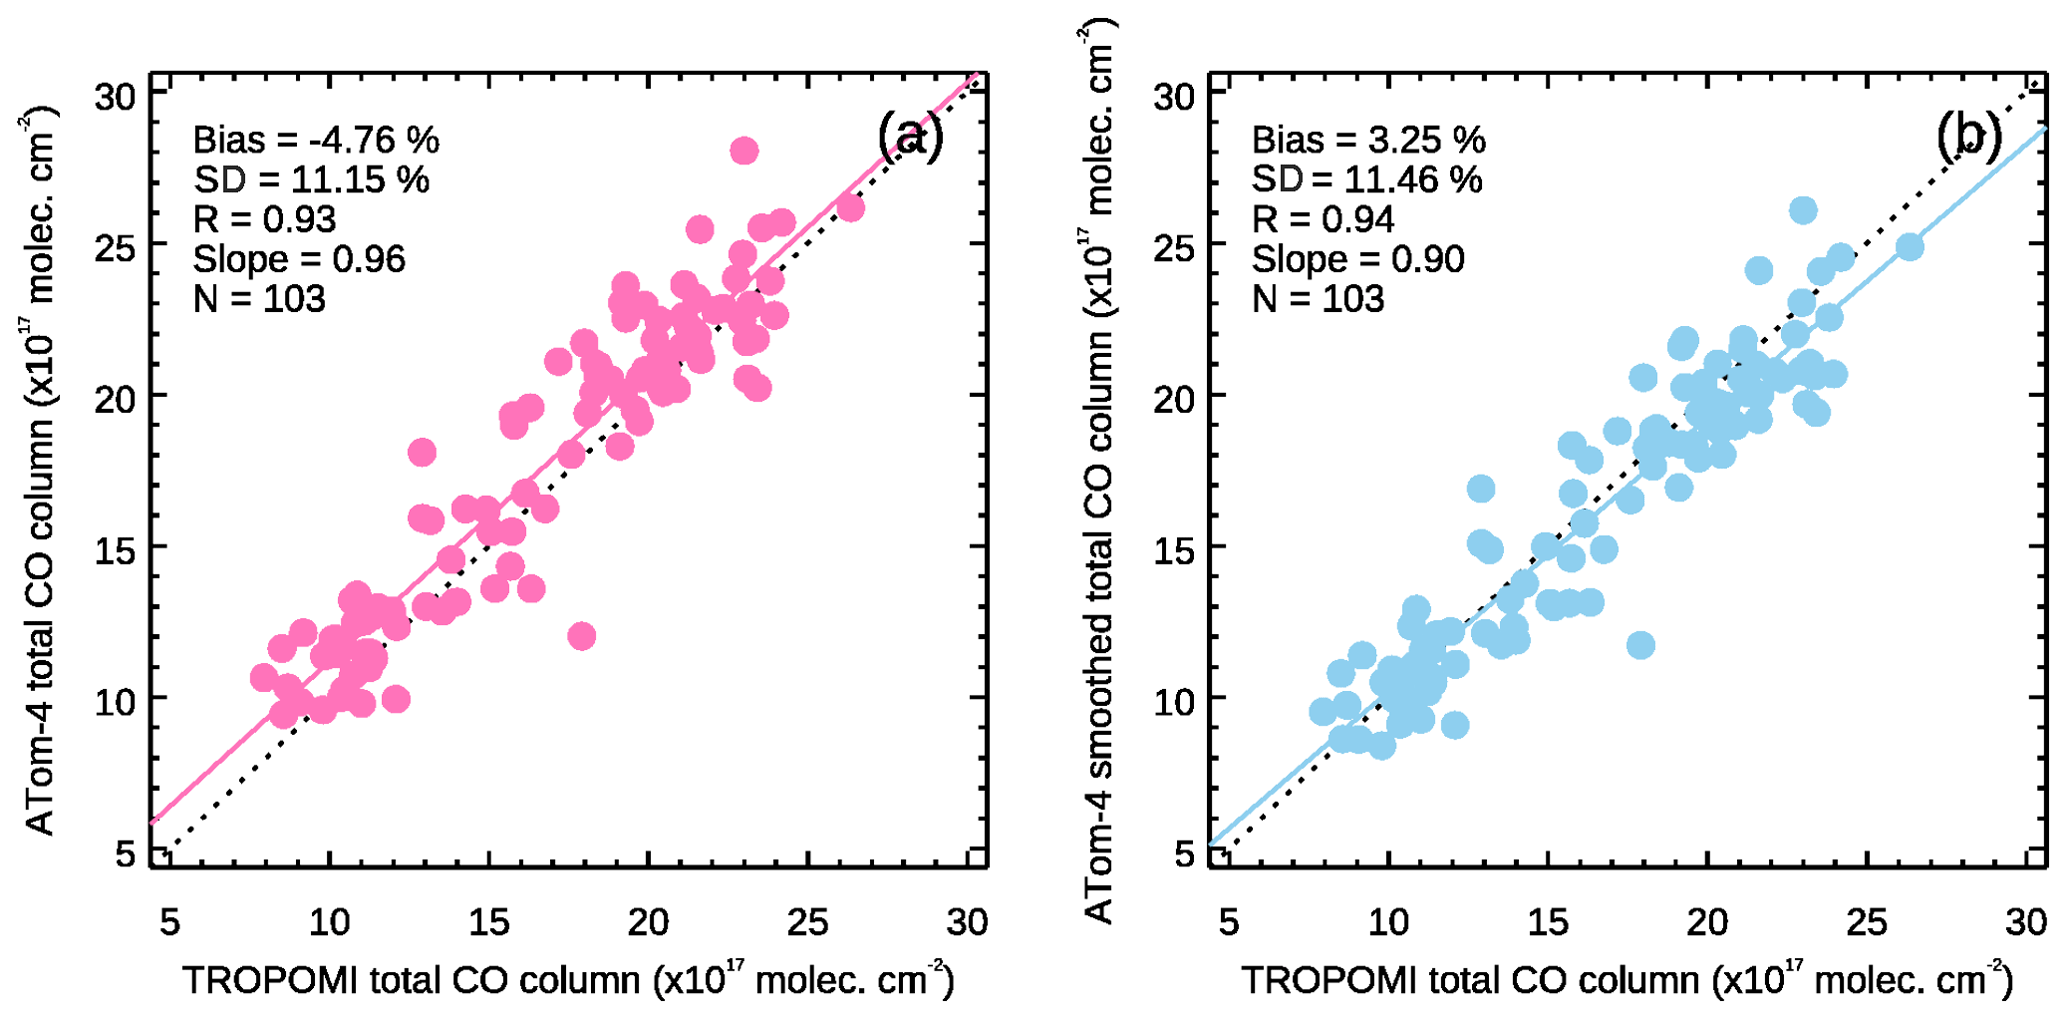
Figure 6Comparison of colocated retrievals over bodies of water from TROPOMI and ATom-4 (24 April–21 May 2018). (a) TROPOMI vs. true (unsmoothed) ATom-4. (b) TROPOMI vs. retrieval-simulated (smoothed) ATom-4.
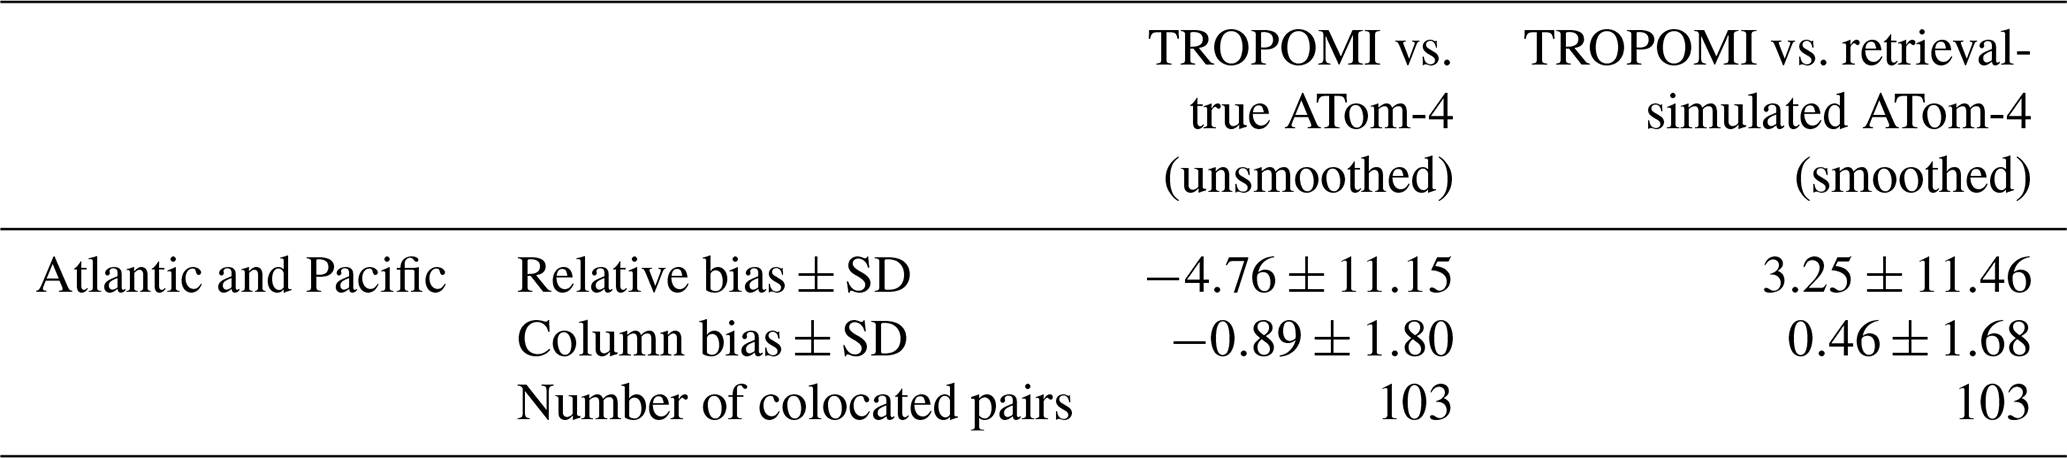
Table 2Colocated TROPOMI vs. ATom-4 CO retrievals over bodies of water: statistics from AK analysis. Relative bias and SD are in percent. Column bias and SD are in units of 1017 molec cm−2.
4.2.1 TROPOMI vs. ATom-4
Results from the TROPOMI and ATom-4 comparison over bodies of water are summarized in Fig. 6 and Table 2. As described in Sect. 3.2, comparisons were performed in terms of both true (unsmoothed) and retrieval-simulated (smoothed) ATom-4 total column values; the latter account for the vertical sensitivity of the TROPOMI retrievals. Figure 6a shows that unsmoothed ATom-4 total CO columns and TROPOMI are strongly correlated (R=0.93, slope of linear fit = 0.96) and exhibit a negative relative bias (−4.76 %) indicative of low TROPOMI values with respect to the true ATom-4. In contrast, Fig. 6b shows results for smoothed ATom-4 vs. TROPOMI. The relative bias is better in this case (3.25 %), and the fit between the two datasets has a slightly larger R (0.94) indicative of an improved correlation. The slope of the linear fit is, however, slightly lower (0.90). Figure 7 shows the smoothed ATom-4 values in the context of TROPOMI; TROPOMI clearly captures the geographical patterns of the in situ measurements. Relative biases show no latitudinal dependence (Fig. 8).
As seen in Sect. 3.2, we can separately quantify the expected difference between the true total column and the TROPOMI-retrieved total column due to the differences in shape between the true profile and the TROPOMI reference profile. In clear-sky scenes (over land), the TROPOMI radiances fundamentally measure the integrated total column, and the shape of the reference profile does not significantly affect the accuracy of the retrieved total column. In cloudy scenes (over land or water), however, the total column retrieval becomes more sensitive to above-cloud CO than to below-cloud CO; the validity of the reference profile shape in this case acts as a source of retrieval error. Values of the null-space error (enull) calculated for each ATom-4 profile using Eq. (4) vs. latitude are shown in Fig. 9. The relative mean and SD values of enull calculated with respect to true (unsmoothed) ATom-4 total columns are 2.16 %±2.23 % (i.e., molec cm−2). The prevalence of positive values for enull indicates that, on average, the reference profiles analyzed have a slight tendency to have too much CO near the surface, resulting in an overestimate of the below-cloud partial column. No clear latitudinal dependence is observed in enull.
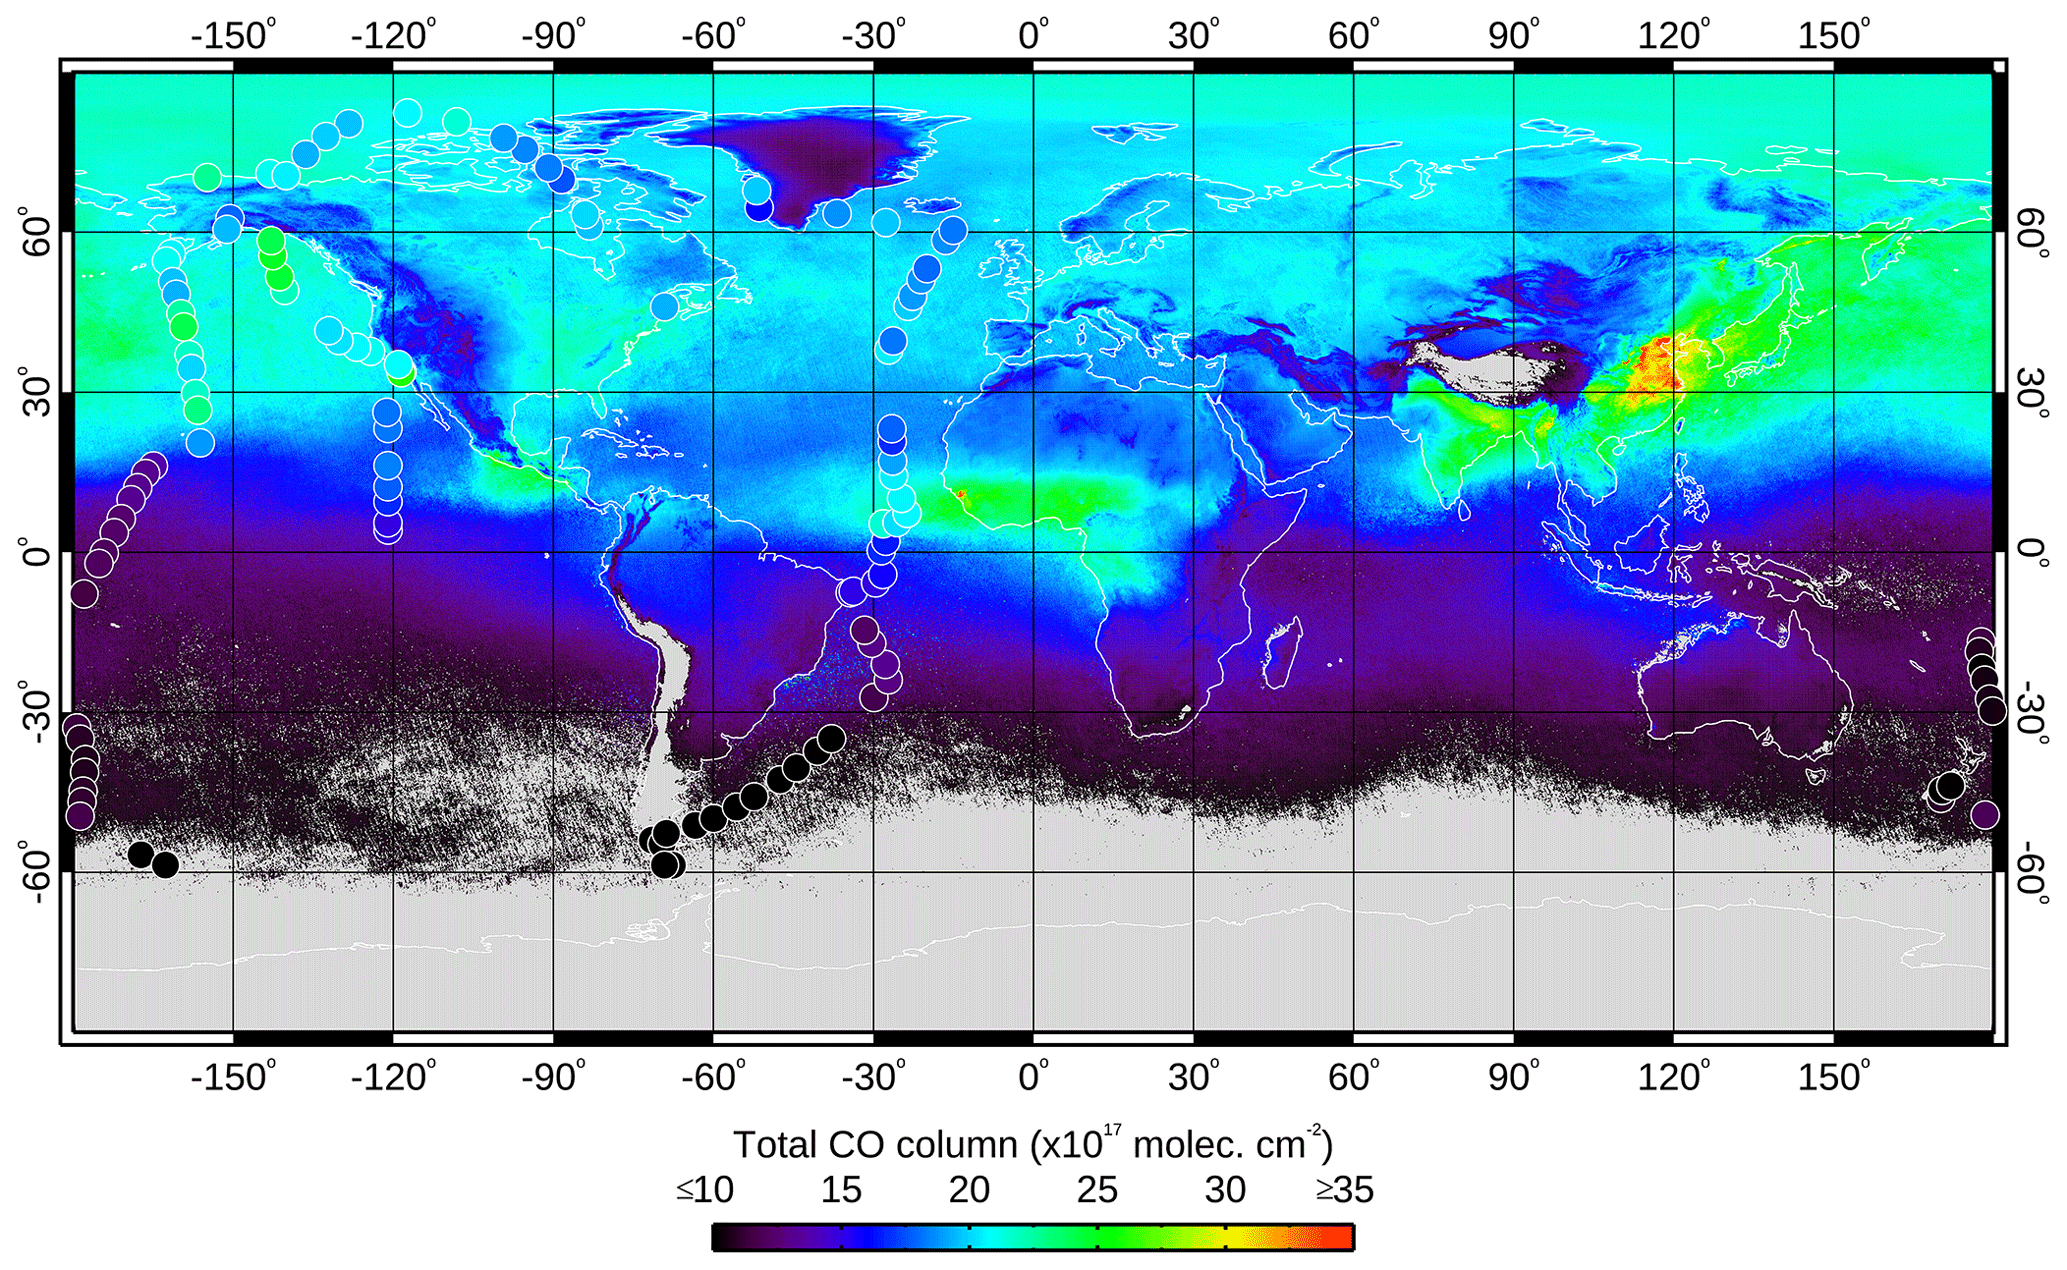
Figure 7Map of averaged TROPOMI total CO column values acquired between 24 April and 21 May 2018, the duration of the ATom-4 campaign. Circles show ATom-4 profiles spatially and temporally colocated with single TROPOMI retrievals; circles are color-coded according to their retrieval-simulated (smoothed) ATom total CO column value. There is good agreement between the two datasets, despite differences in the time span and footprint size each of them represents.
.
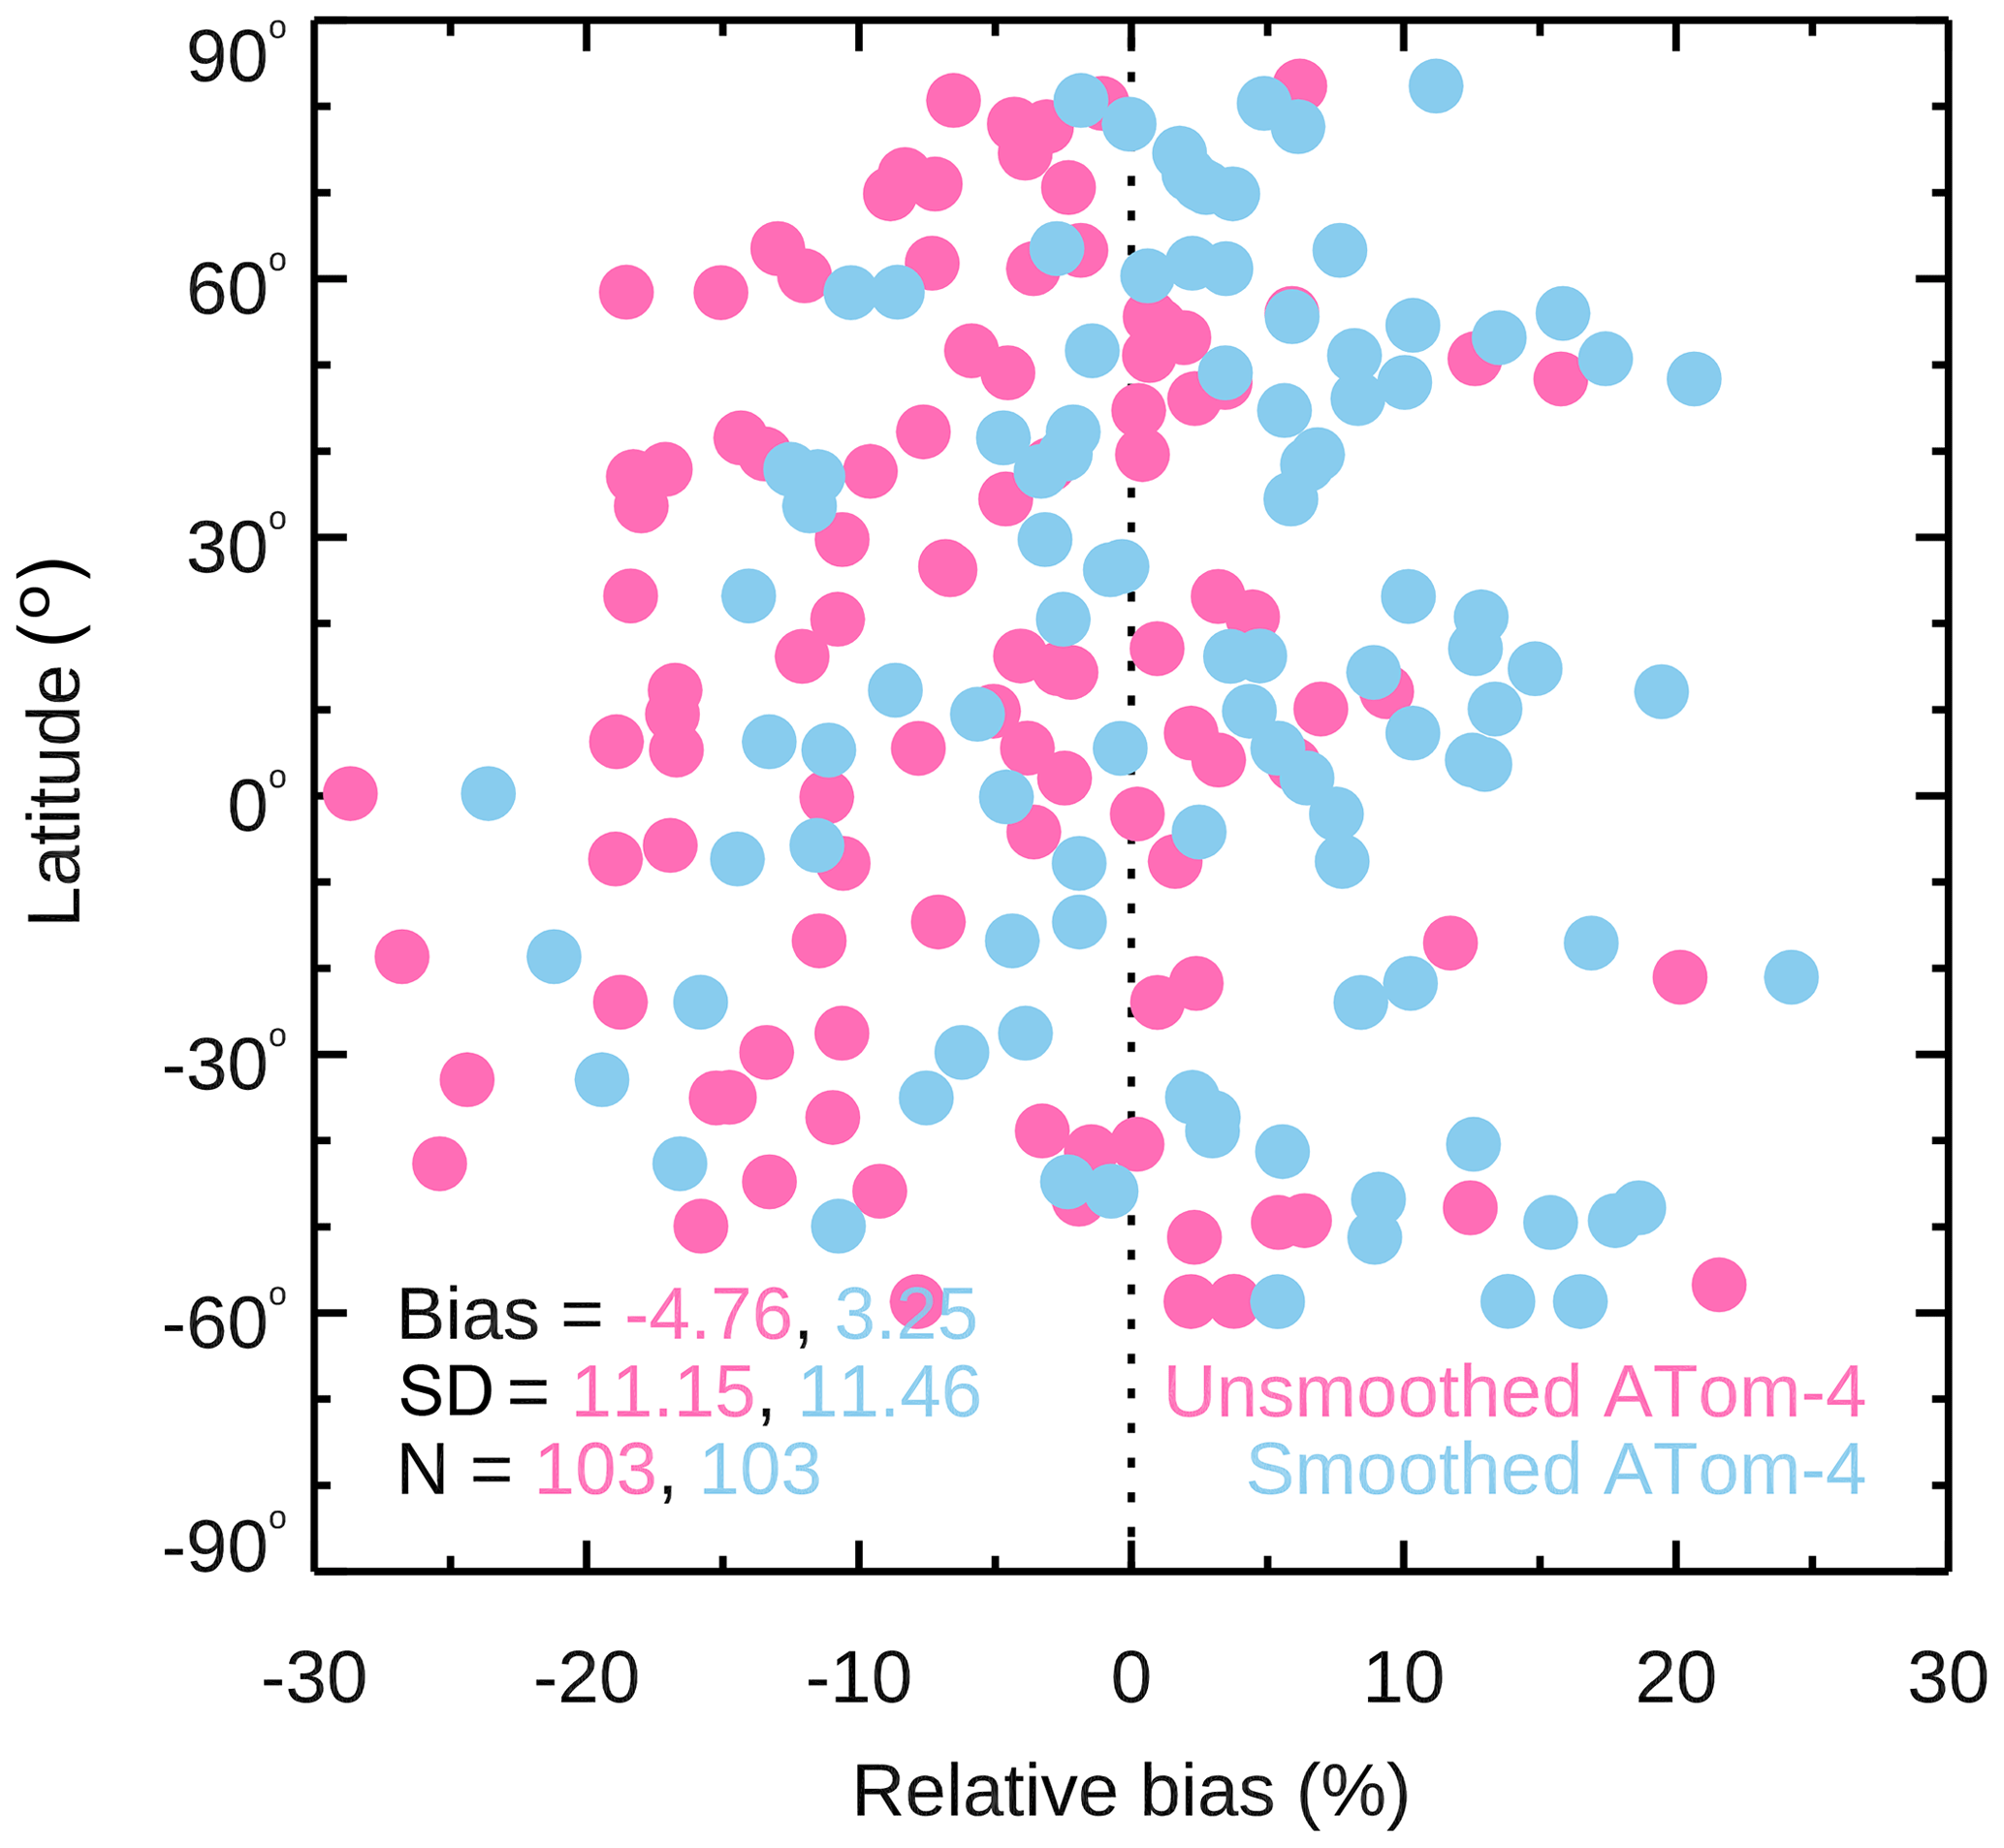
Figure 8Latitudinal distribution of relative bias between TROPOMI and ATom-4 over bodies of water. Negative bias indicates that TROPOMI retrievals are low with respect to ATom-4
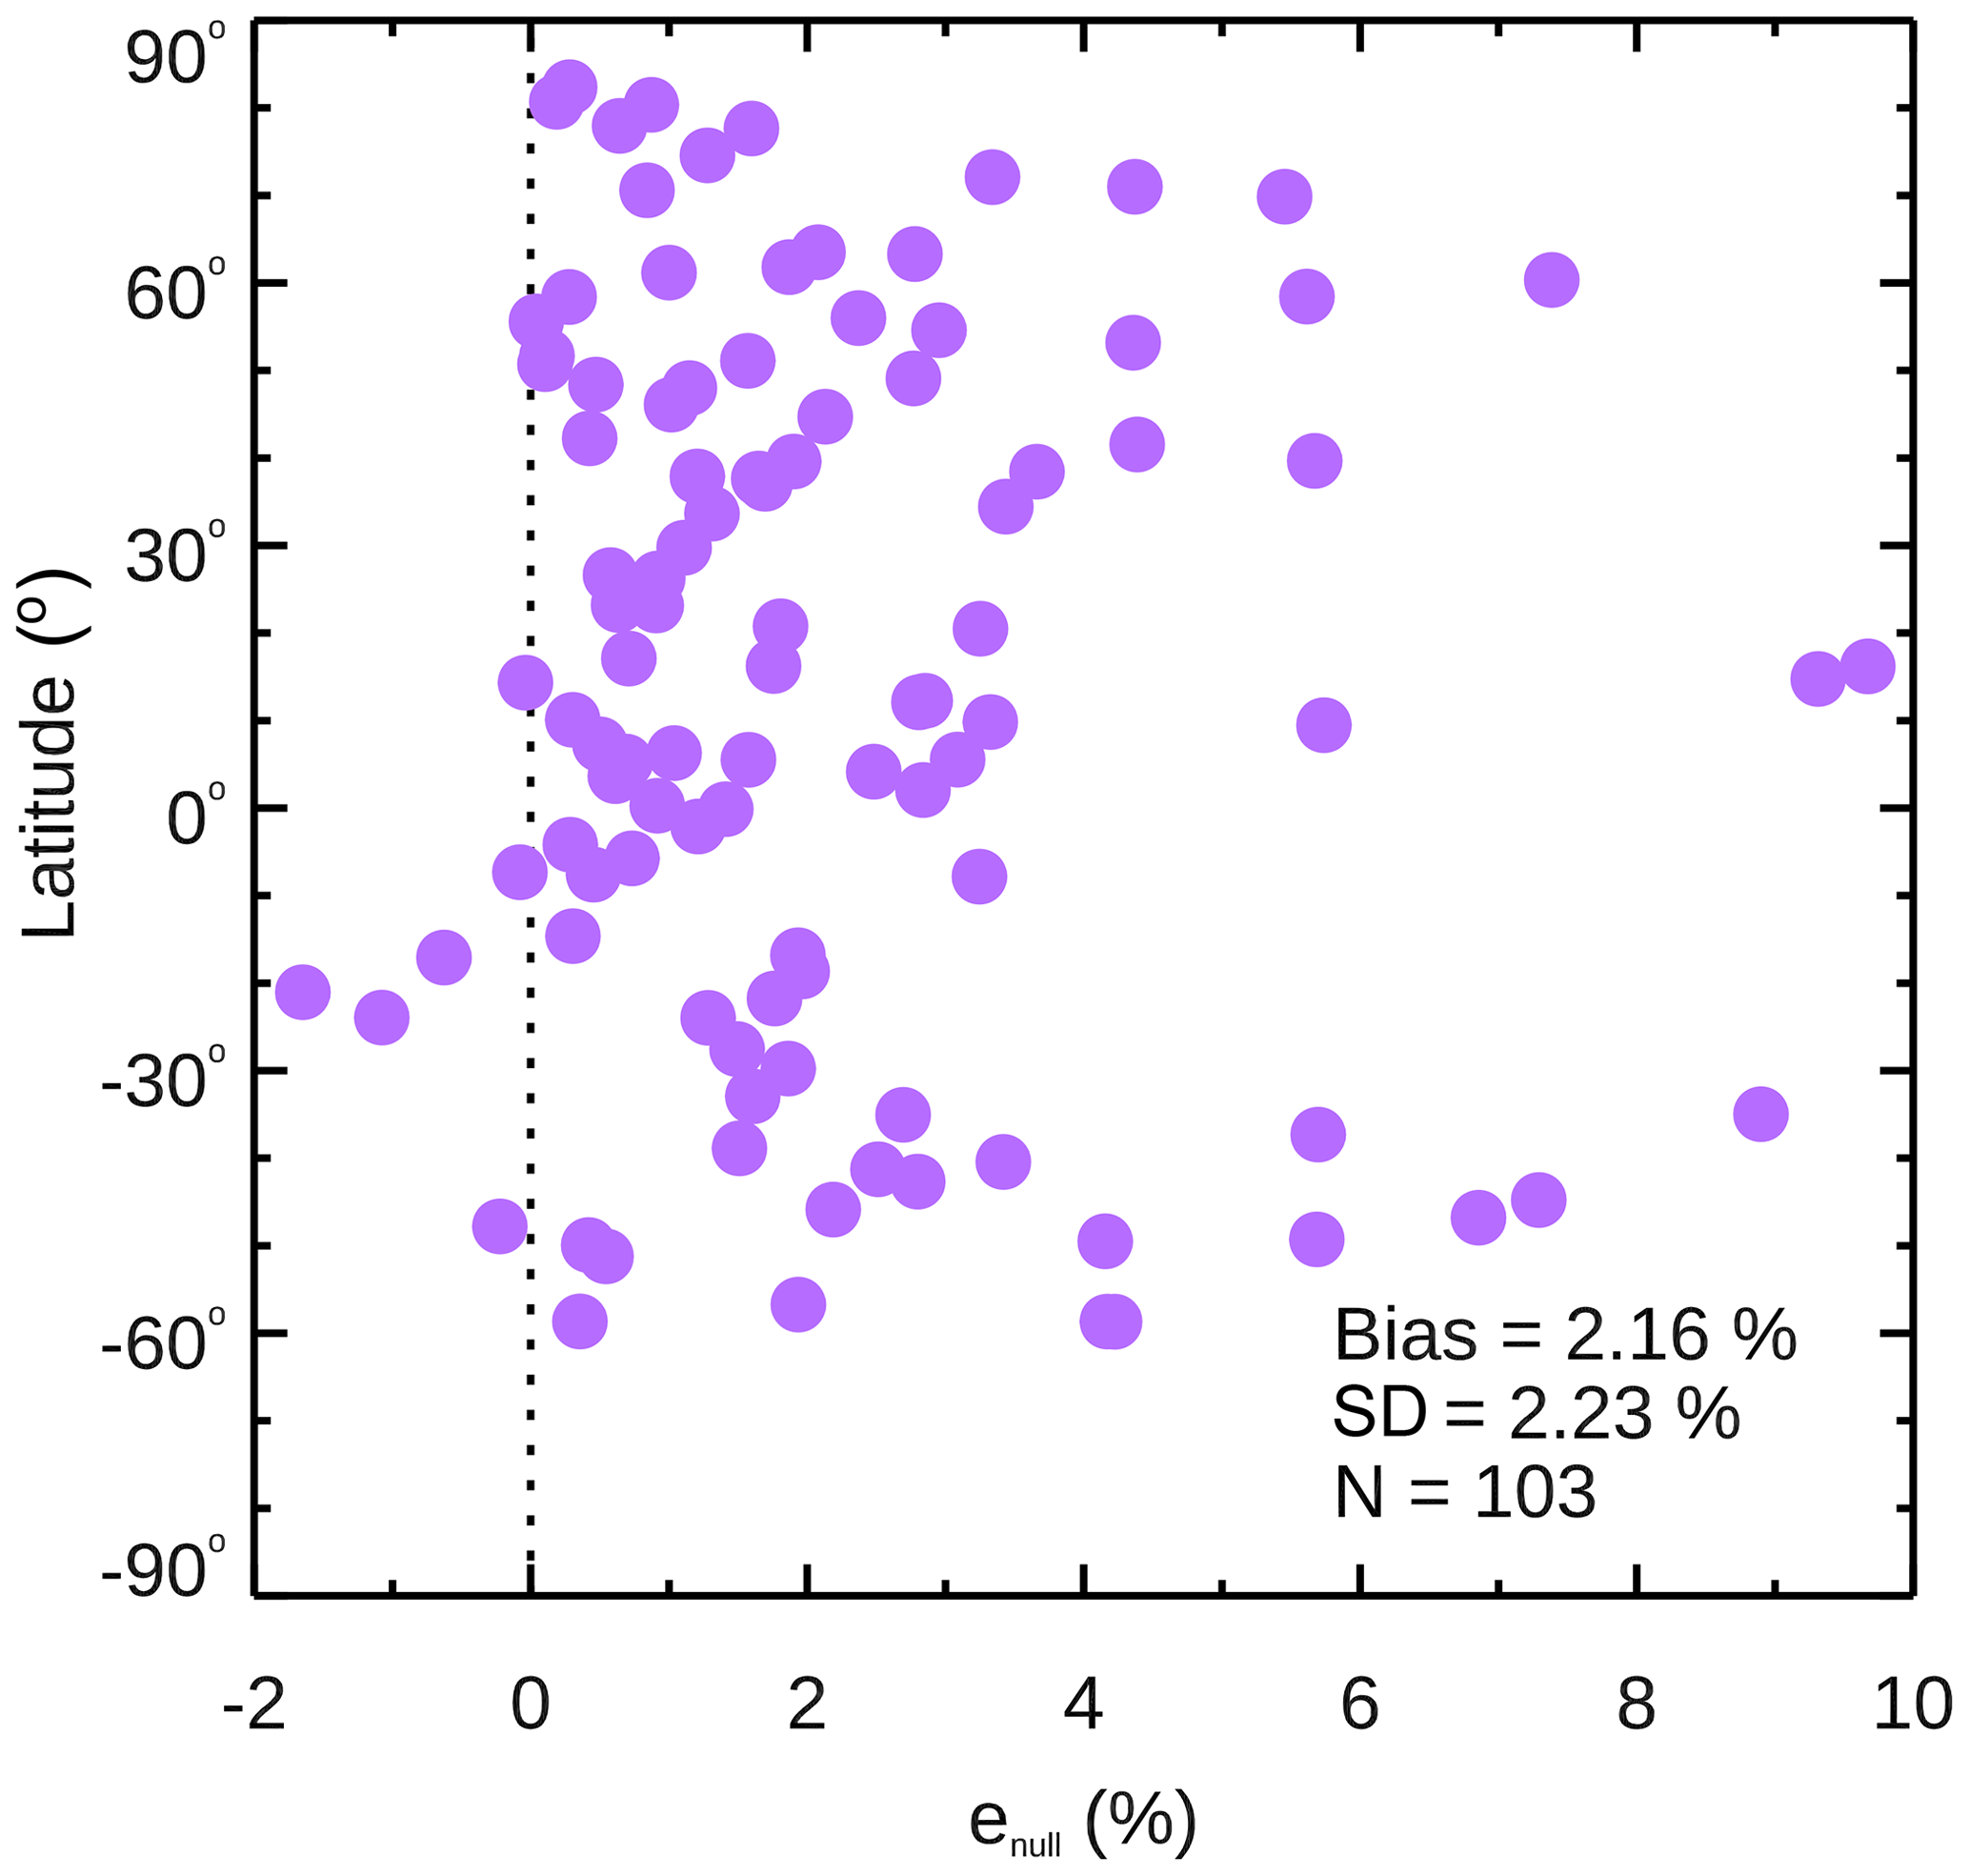
Figure 9Latitudinal distribution of enull error (see Eq. 4), which characterizes retrieval errors over cloudy scenes related to the shape of the TROPOMI model-calculated reference profiles, expressed in percentage with respect to the true (unsmoothed) ATom-4 total CO columns.
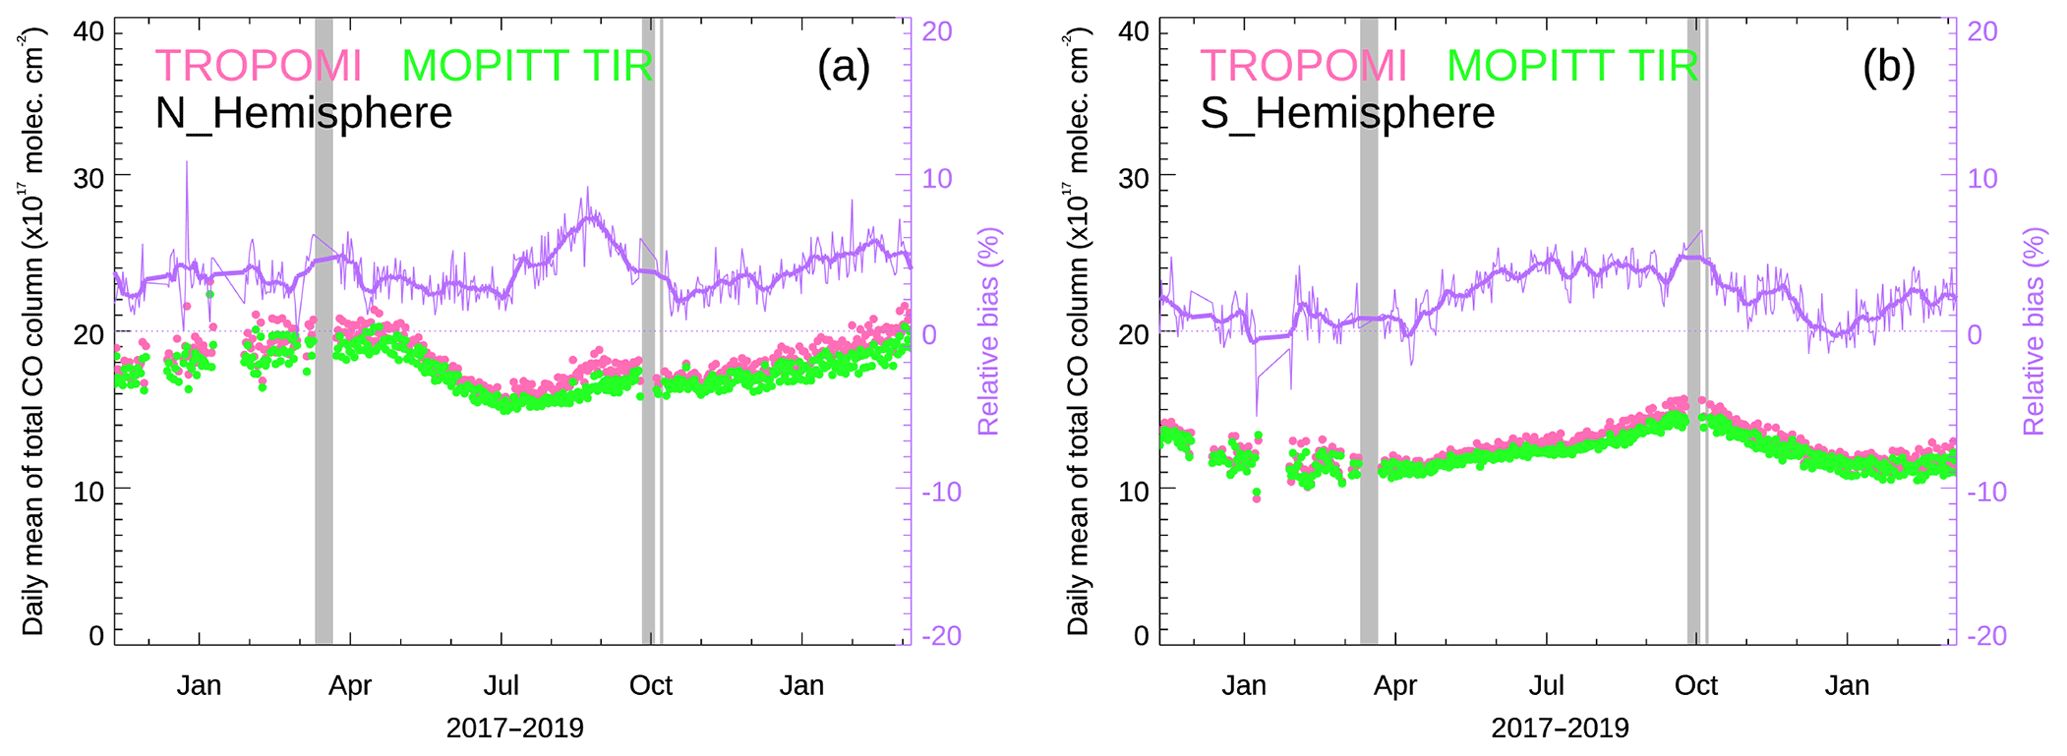
Figure 10Comparison of colocated retrievals over bodies of water from TROPOMI and MOPITT TIR. (a) Compilation of means and relative biases of total CO column values from 7 November 2017 to 10 March 2019 for the N Hemisphere ROI. (b) Same for the S Hemisphere ROI.
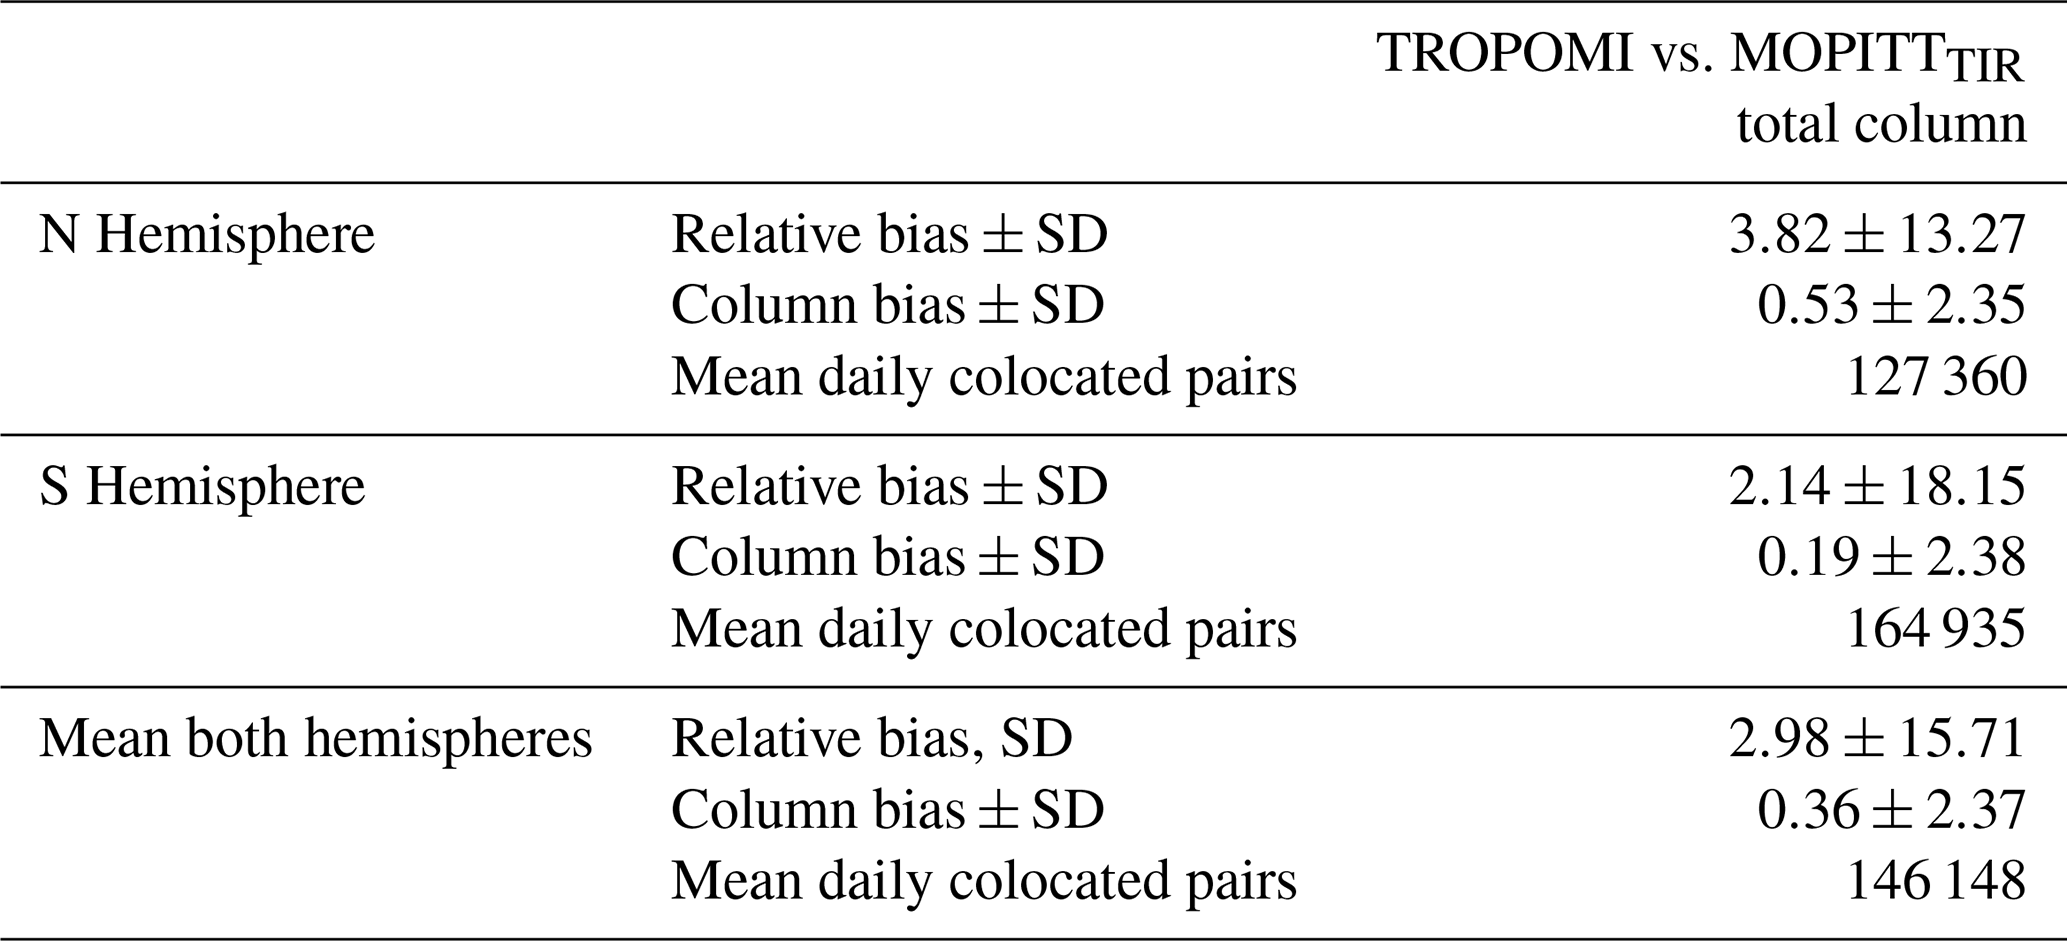
Table 3Colocated TROPOMI vs. MOPITT TIR CO retrievals over bodies of water: statistics performed for the period between 7 November 2017 and 10 March 2019. Relative bias and SD are in percent. Column bias and SD are in units of 1017 molec cm−2.
4.2.2 TROPOMI vs. MOPITT TIR
Figure 10a and Table 3 summarize results from our comparison of colocated TROPOMI and MOPITT TIR retrievals over bodies of water in the N Hemisphere ROI. Relative biases are small (3.82 % on average); the SD of the biases is 13.27 % on average. Results for the S Hemisphere ROI are summarized in Fig. 10b and Table 3. Relative biases and their SD values are similarly small (2.14 % and 18.15 % on average). As expected, retrievals are higher in the N Hemisphere due to larger emissions from the continents in that hemisphere. Seasonal patterns in daily CO means are analogous to those described for the two hemispheric land ROIs.
Table 4Statistics from colocated, null-space-adjusted TROPOMI vs. MOPITT CO retrievals over land for the period between 7 November 2017 and 10 March 2019. Relative bias and SD are in percent. Column bias and SD are in units of 1017 molec cm−2.

4.2.3 Null-space-adjusted TROPOMI vs. MOPITT TIR
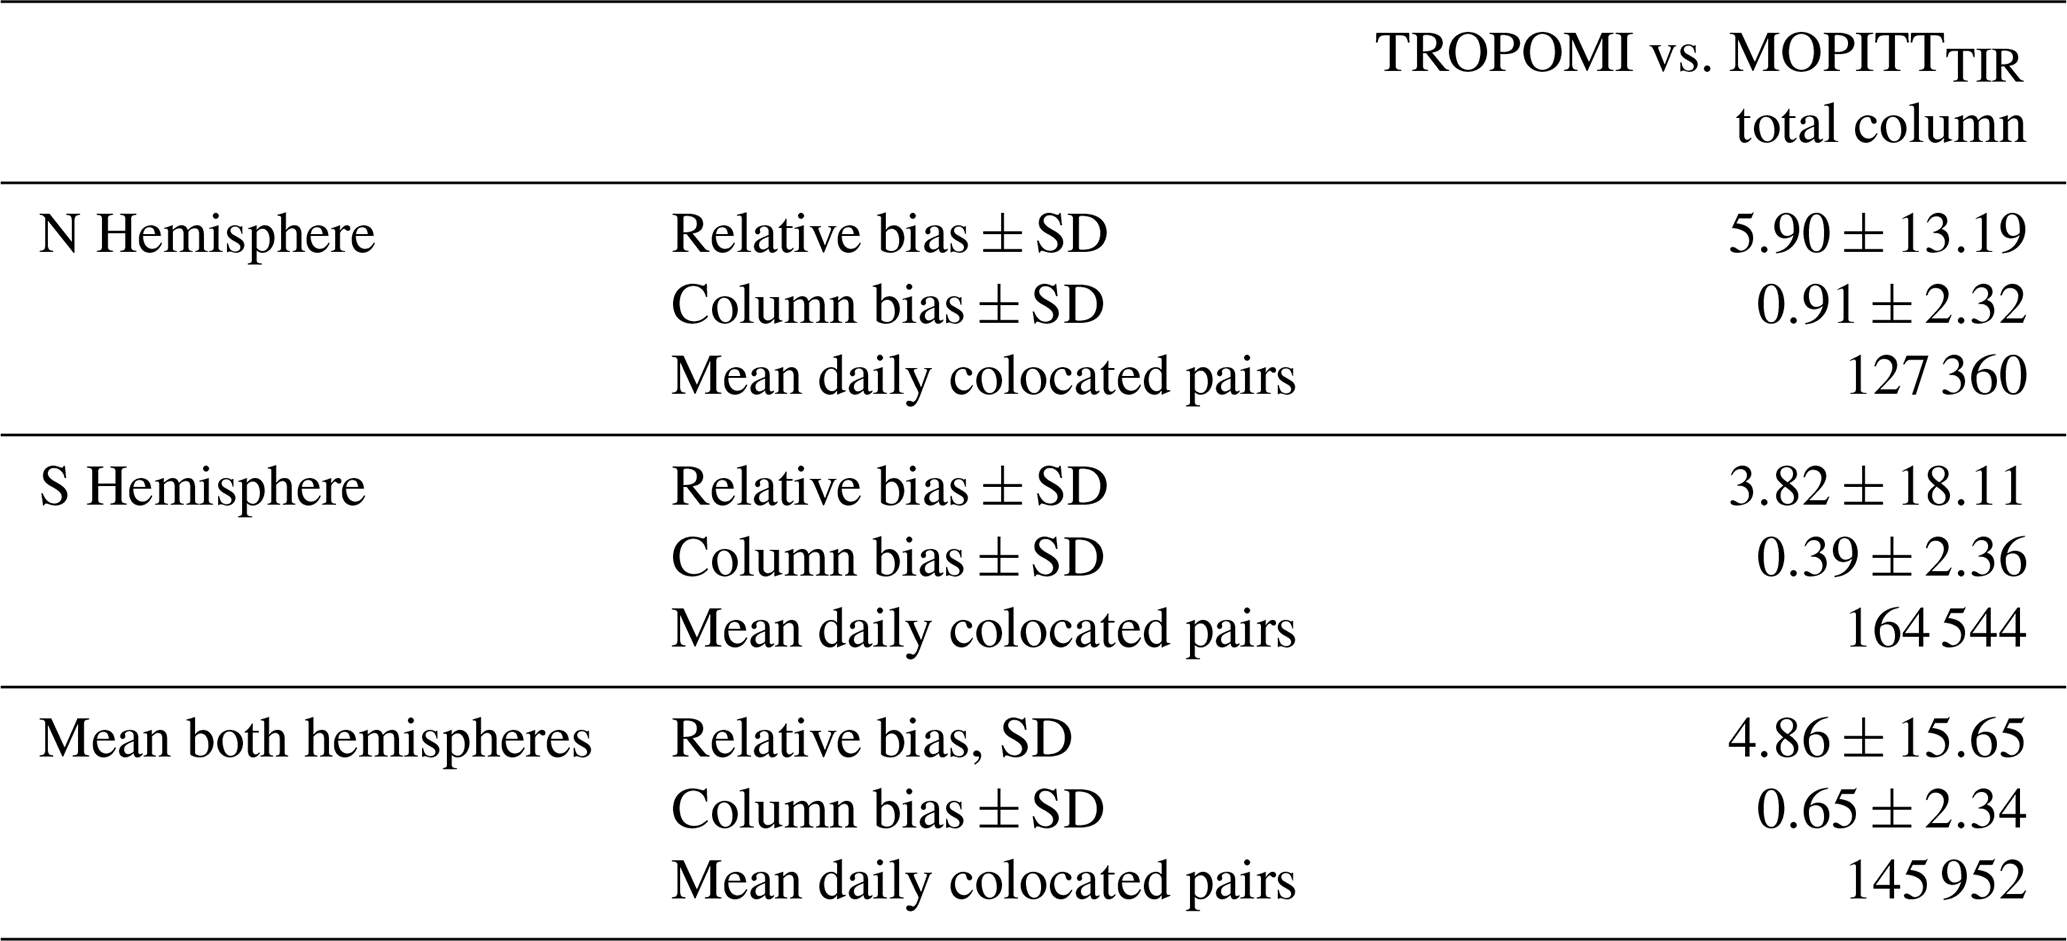
Table 5 summarizes time-averaged bias values resulting from the comparison of colocated, null-space-adjusted TROPOMI and MOPITT TIR retrievals over bodies of water. Relative bias values averaged for the period analyzed are 5.90 % and 3.82 % (N and S Hemisphere ROIs, respectively); averaged relative SD values are 13.19 % and 18.11 %. Daily results are analogous in magnitude and temporal variation to those shown in Fig. 10.
TROPOMI and MOPITT are consistent with each other in terms of the main spatial and seasonal CO features they capture, as shown by mean seasonal maps (Fig. 11). Both datasets display relatively high values in the Northern Hemisphere during boreal winter (panels a and b) and spring (c and d), similarly high values during all seasons in Africa and Asia, and relatively high values due to Amazon fires in austral summer and fall (a and b, g and h). We note differences between TROPOMI and MOPITT that we interpret as due to their contrasting daytime passing times (13:30 and 10:30, respectively): TROPOMI shows higher CO over Africa than MOPITT, consistent with higher CO emissions from afternoon fires than from morning fires. (Fires are commonly more active in the afternoon than in the morning, as observed in fire counts from same-day morning Terra MODIS vs. afternoon Aqua MODIS; Giglio et al., 2006.) We also note that TROPOMI retrievals over Amazonia are lower than MOPITT's in all seasons. Identifying the reason for this discrepancy will require further investigation.

Figure 11Seasonal averages of TROPOMI and MOPITT TIR CO retrievals. (a) December 2017 to February 2018 (DJF) TROPOMI mean. (b) Same for MOPITT. (c) March–May 2018 (MAM) TROPOMI mean. (d) Same for MOPITT. (e) June–August 2018 (JJA) TROPOMI mean. (f) Same for MOPITT. (g) September–November 2018 (SON) TROPOMI mean. (h) Same for MOPITT. Sharp discontinuities visible in some panels at 65∘ S are due to differences in the definition of the MOPITT cloud mask poleward of latitude 65∘.
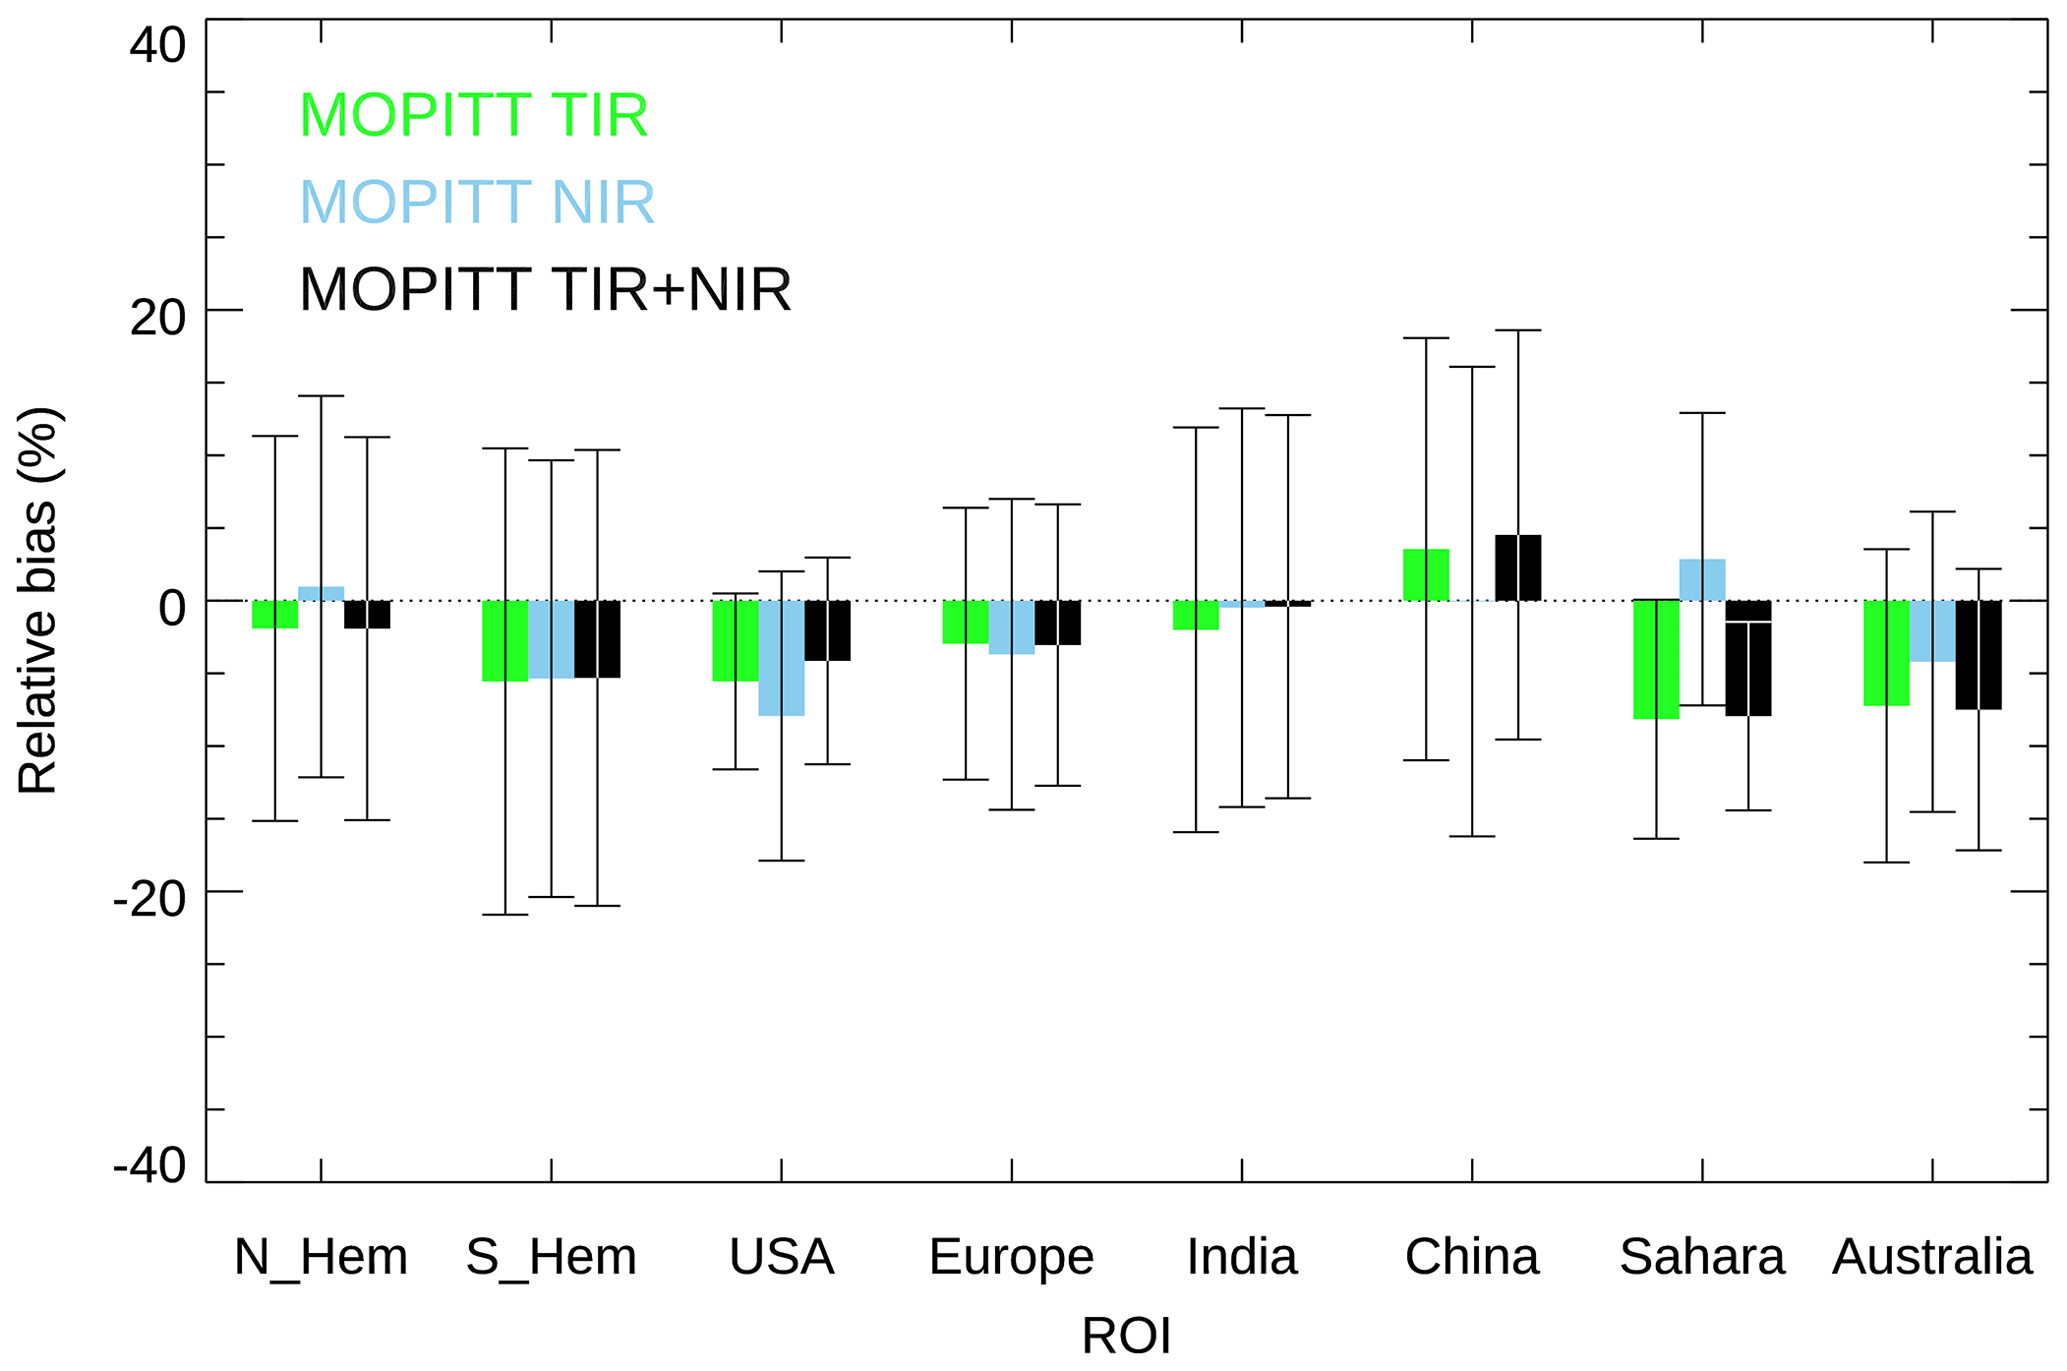
Figure 12Summary of colocated land comparison results. Colored bars represent relative bias between TROPOMI and each of the three MOPITT products (TIR, NIR, and TIR + NIR); solid lines indicate the SD of the relative bias.
Quantitative results from the analysis of colocated TROPOMI and MOPITT land retrievals, summarized in Fig. 12 and Table 1, also show good agreement. Relative biases for all ROIs (, , and compared to MOPITT TIR, NIR, and TIR + NIR, respectively) are well within TROPOMI's required 15 % accuracy and close to the 10 % precision target (Veefkind et al., 2012; Landgraf et al., 2016). We note that biases are mostly negative (i.e., TROPOMI retrievals are lower than MOPITT); further analyses would be needed to explain this observation. One exception is China, where biases are predominantly positive. Statistical results obtained from each of the three MOPITT products are consistent with each other for all the ROIs, except for the Sahara. In this case, relative biases between TROPOMI and MOPITT NIR are positive and closer to zero than biases between TROPOMI and TIR or TIR + NIR products. Results from non-colocated retrievals, available in the Supplement and summarized in Fig. 13, reinforce all these observations and provide additional insight.
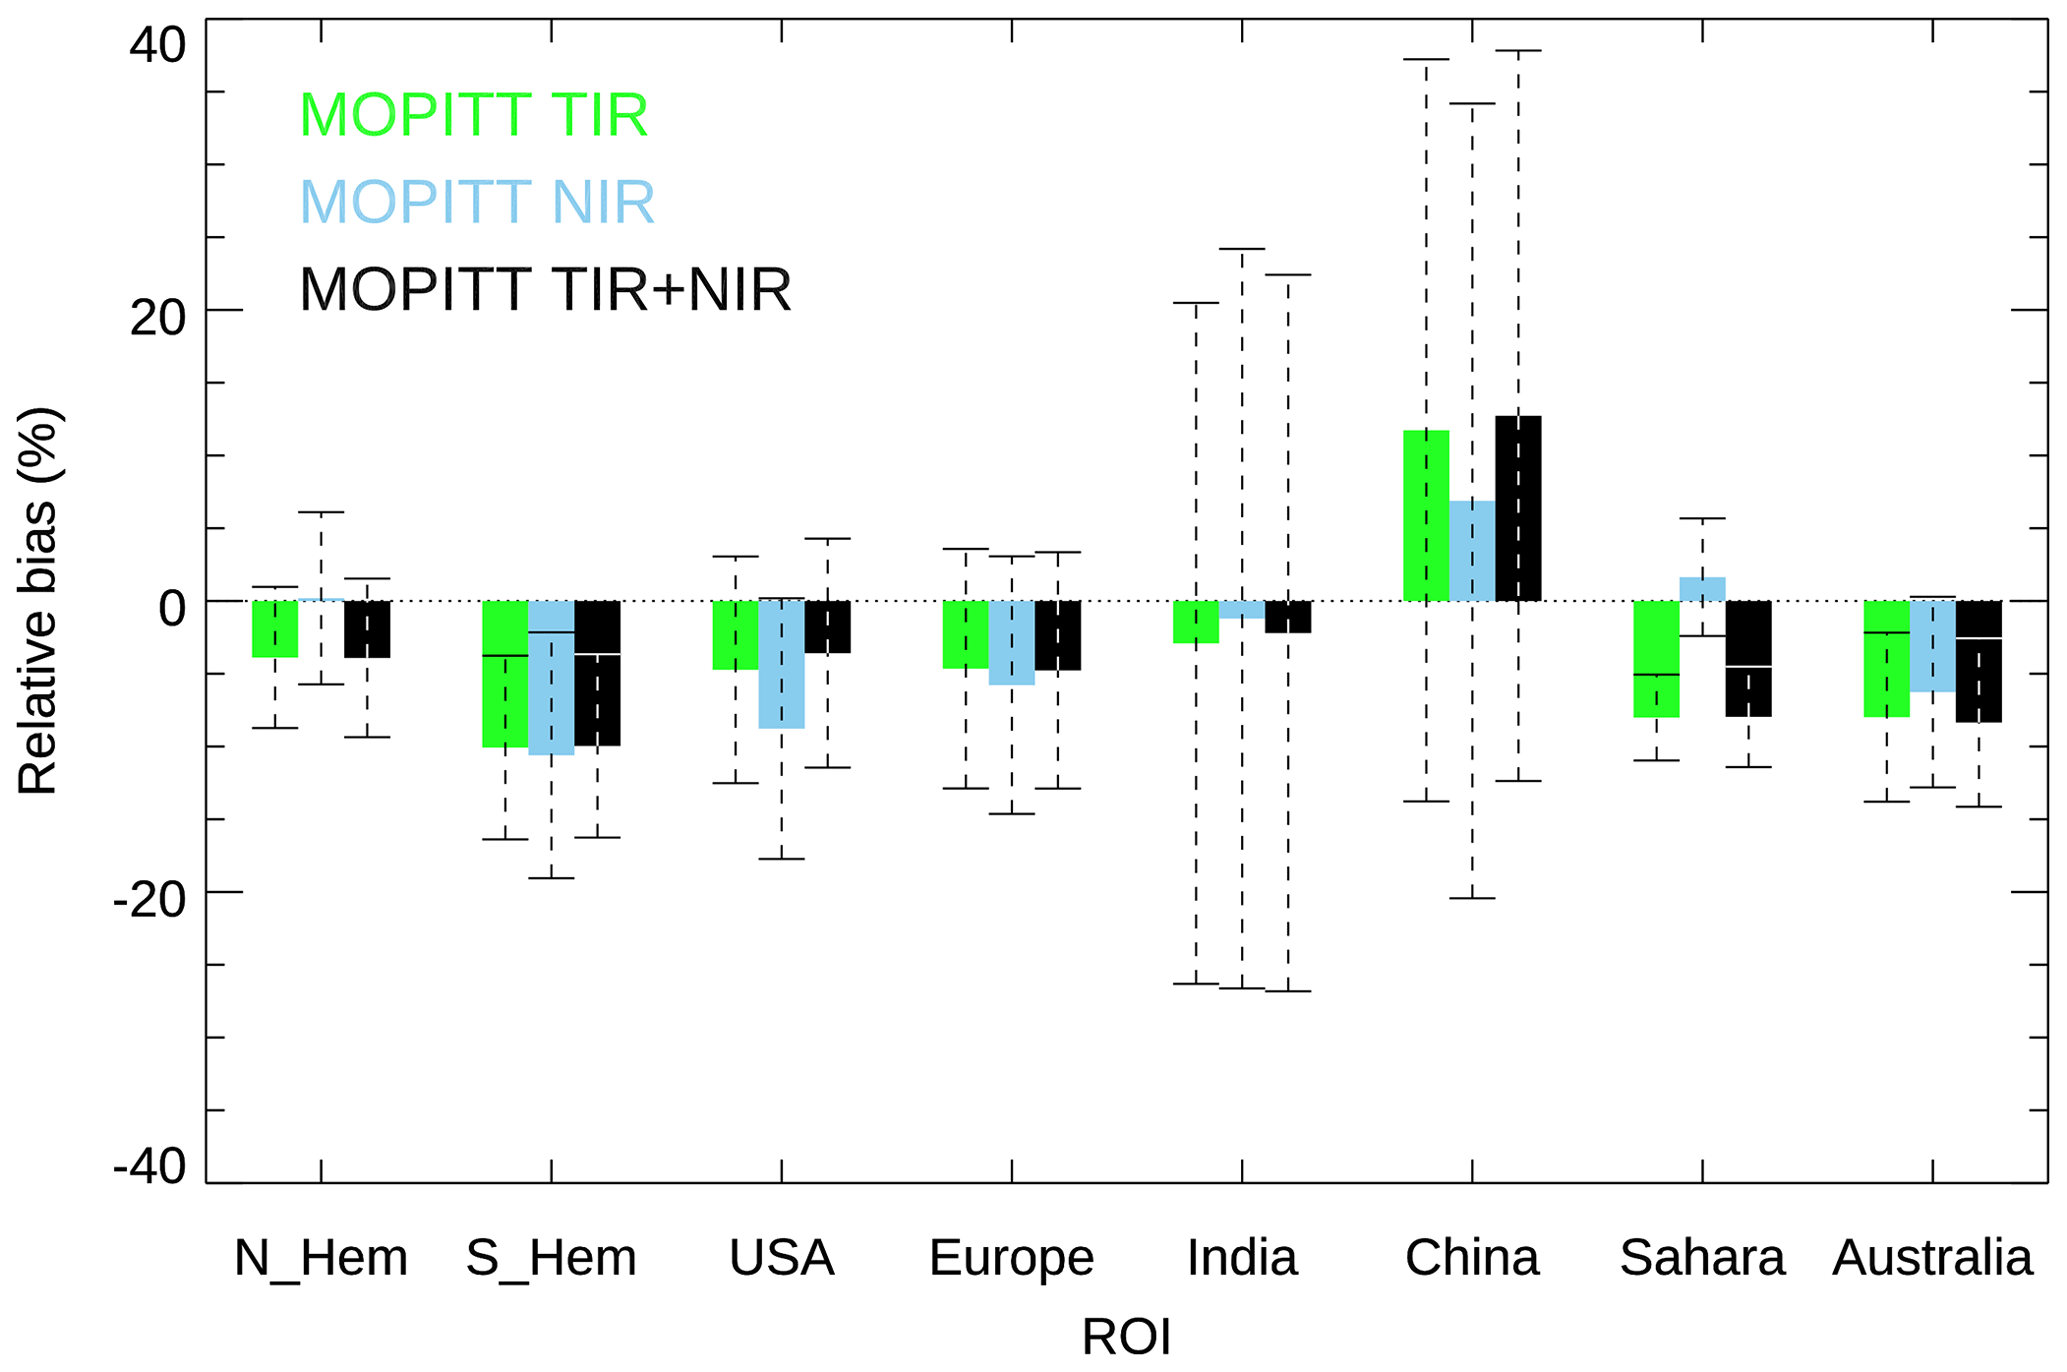
Figure 13Summary of non-colocated land comparison results. Colored bars represent relative bias between TROPOMI and each of the three MOPITT products (TIR, NIR, and TIR + NIR). Dashed lines show ±1 SD of mean daily relative biases (i.e., inter-daily bias variability).
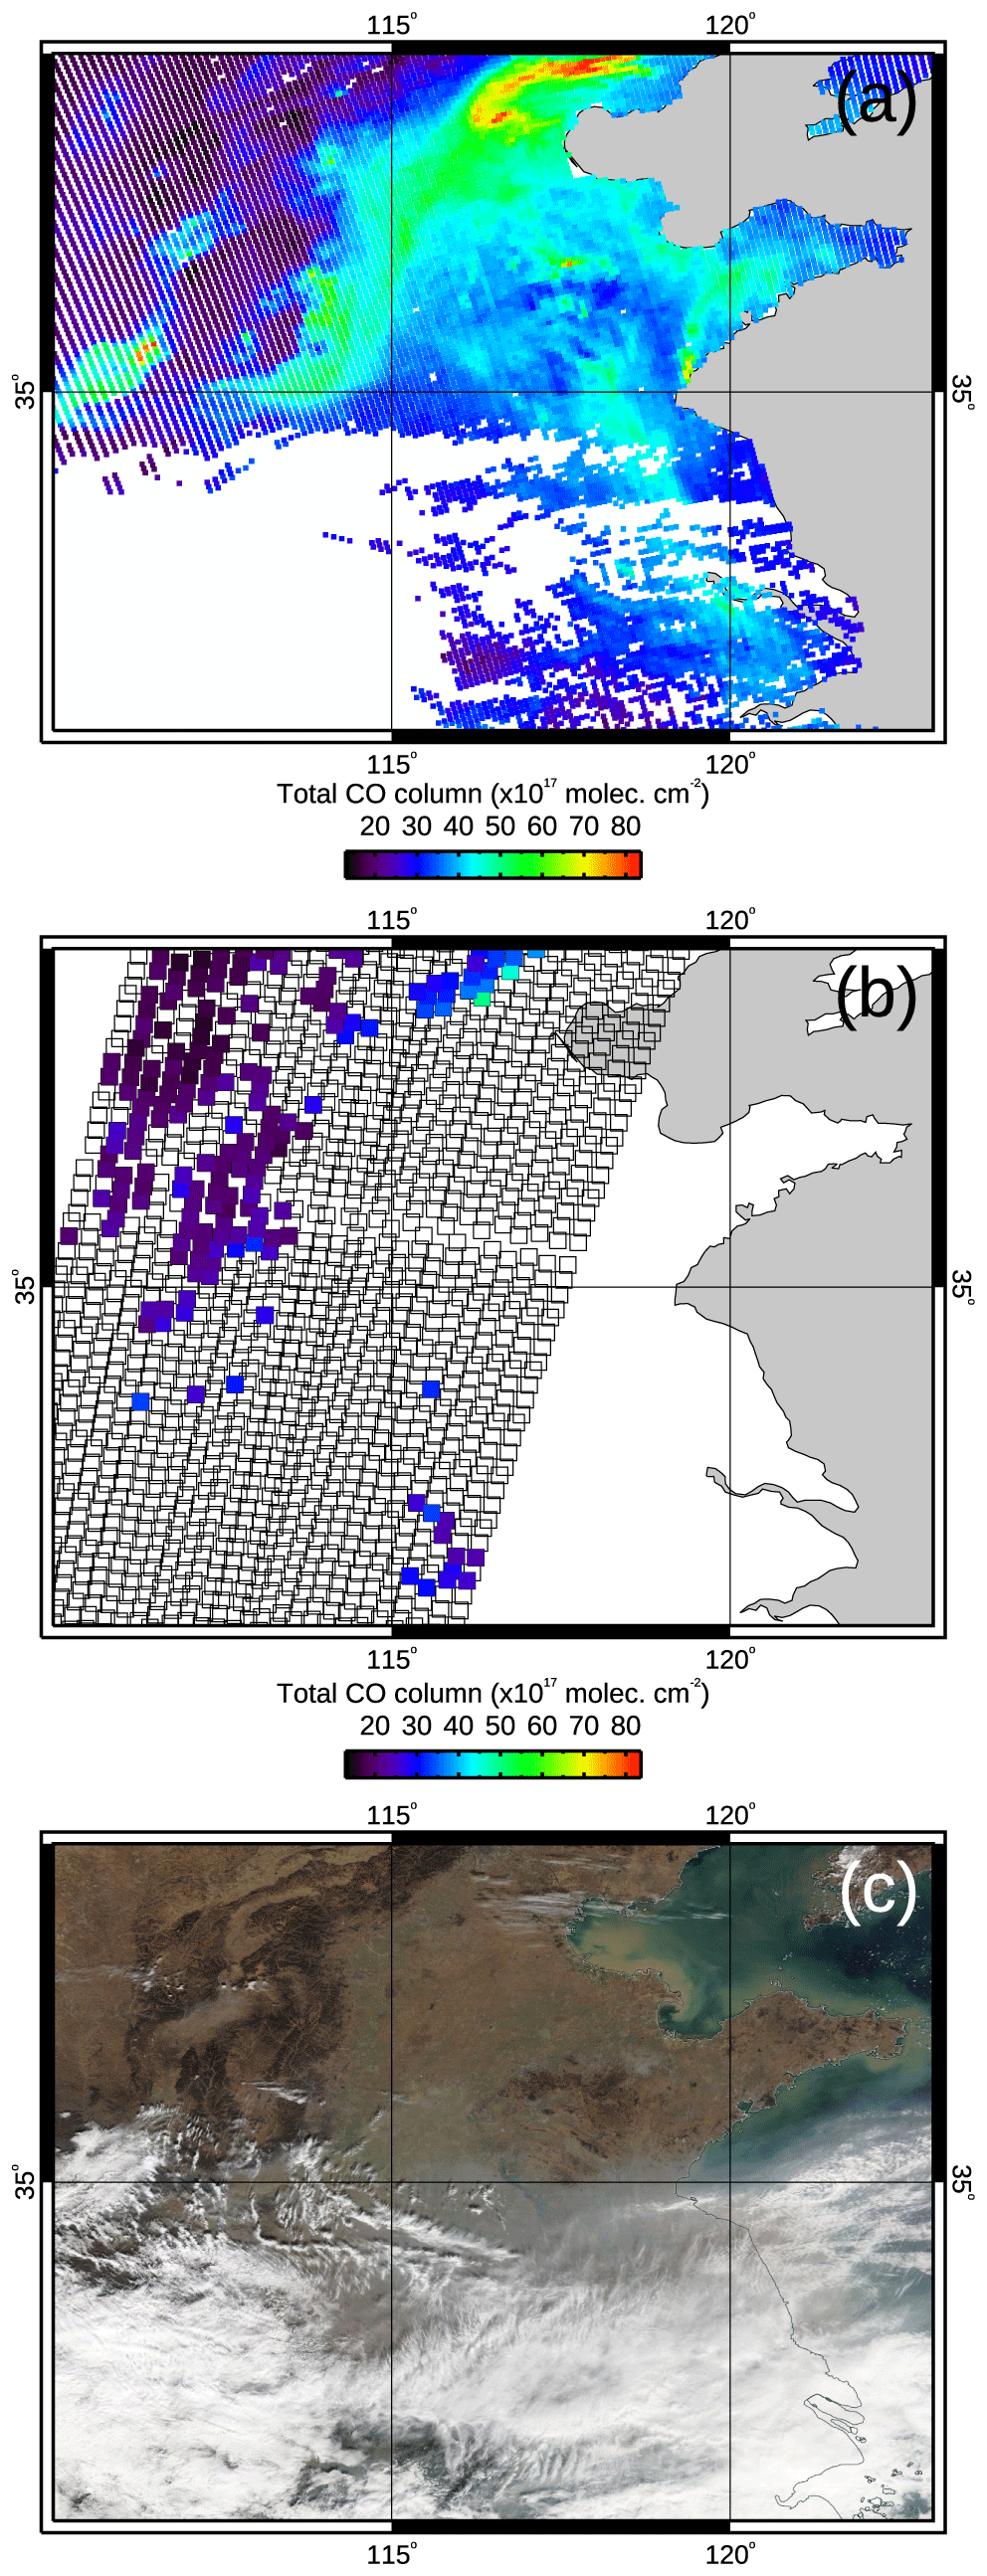
Figure 14Total CO column retrievals and visible image for the China ROI on 1 January 2018. (a) TROPOMI map. (b) MOPITT TIR + NIR map. (c) Terra-MODIS visible image acquired at the same time as the MOPITT data. Empty boxes in panel (b) correspond to MOPITT observations deemed cloudy based on MODIS cloud mask information and are thus not suitable for CO retrieval. The MODIS visible image shows clouds in the southern half of the ROI; the northern half was hazy, most probably due to pollution, but cloud-free.
Table 5Colocated, null-space-adjusted TROPOMI vs. MOPITT TIR CO retrievals over bodies of water: statistics analysis performed for the period between 7 November 2017 and 10 March 2019. Relative bias and SD are in percent. Column bias and SD are in units of 1017 molec cm−2.
Several factors may contribute to the contrasting results for the China ROI. First, because of its superior spatial resolution (7.2×7.2 km2), TROPOMI can resolve small, highly polluted plumes that would appear diluted at MOPITT's 22×22 km2 resolution. Second, TROPOMI provides daily global coverage, while MOPITT's return period is approximately 3 d; as a result, TROPOMI has more opportunities to sample highly polluted areas than MOPITT. Third, conservative MOPITT cloud mask rules may be responsible for fewer MOPITT retrievals over highly polluted regions, which are frequently hazy due to aerosols. Detailed daily maps (e.g., Fig. 14) obtained in the analysis of non-colocated observations indicate that MOPITT often fails to retrieve over highly polluted areas like Beijing (China). In this example many MOPITT observations, despite having been classified as cloud-free based on MOPITT radiances, were labeled cloudy (and no retrieval was performed) based on the MODIS cloud mask, which may be interpreting haze due to pollution or fire smoke as clouds. We note that comparisons of non-colocated retrievals are more strongly affected by these factors; this is consistent with particularly high positive biases derived from non-colocated retrievals over China (Fig. 13).
Possible causes for the contrasting relative biases obtained from the MOPITT NIR product over the Sahara include aerosol and/or surface albedo effects. Further work is needed to diagnose these effects for different wavelengths and to account for differences between MOPITT and TROPOMI measurement and retrieval methods. Determining the most accurate retrievals would require in situ CO column measurements (e.g., airborne profiles) that are not currently available for that region.
There appears to be a seasonal component in MOPITT–TROPOMI bias values in the two hemispheric ROIs and Australia. Polluted ROIs (USA, Europe, India, China) and the Sahara do not seem to be affected (Figs. 3, 4, and 5). Biases between MOPITT and null-space-adjusted TROPOMI retrievals show the same seasonal component, indicating that it is not caused by the MOPITT a priori. The seasonal variability of MOPITT has been validated in the past using ground-based measurements. In their comparison to NDACC data (Network for the Detection of Atmospheric Composition Change; De Maziere et al., 2018), Buchholz et al. (2017) found no significant seasonally dependent bias for MOPITT products. Hedelius et al. (2019) compared MOPITT to the TCCON dataset, reporting no persistent seasonal trend globally and some seasonal variability for individual sites. Further work will be needed to identify the origin of a possible seasonal component in MOPITT–TROPOMI bias values.
We have also analyzed daytime, colocated TROPOMI and ATom-4 data over the Atlantic and Pacific regions for the period between 24 April and 21 May 2018 to quantify the error introduced in TROPOMI retrievals over bodies of water (possible only under cloudy conditions) by approximating below-cloud-top partial columns with their colocated, scaled reference profiles. There is excellent agreement ( relative bias, i.e., below the mission requirement of 15 % accuracy and close to the 10 % precision target; Veefkind et al., 2012; Landgraf et al., 2016) between ATom-4 total columns calculated from the true (unsmoothed) in situ profiles and the reported TROPOMI total columns (Fig. 6a). Retrieval-simulated ATom total CO column values are even closer to the TROPOMI retrievals (3.25 %±11.46 % relative bias); this comparison accounts for the actual vertical sensitivity of the retrieval process as expressed in the TROPOMI AK and summarizes the overall performance of the retrievals. The relative contributions of enull with respect to true ATom-4 total CO columns are small (2.16 %±2.23 %) and mostly positive, indicating a slight overestimate of the below-cloud partial column in the cases analyzed. No clear latitudinal dependence is observed in the relative biases of the total CO column or in enull.
For an analysis of TROPOMI retrievals over bodies of water representative of a longer period of time (7 November 2017 to 10 March 2019) and larger region (N and S Hemisphere ROIs), we used colocated MOPITT TIR observations. Untransformed TROPOMI retrievals result in relative bias values of 2.98 % on average; relative SDs of the bias are 15.71 % on average.
The main goal of the MOPITT–TROPOMI comparisons was to quantify differences using the untransformed retrievals; results have been discussed above. A secondary goal was to analyze the contributions of different sources of retrieval bias. Two fundamental sources are differences in vertical sensitivity, as defined by the total column AK, and differences between the MOPITT a priori and TROPOMI reference profiles. We estimated the error due to differences between the shape of the TROPOMI reference profile and that of the ATom true profile by calculating enull with respect to ATom-4 measurements; this error is of the order of 2 %. Without knowing the true CO profiles, there is no obvious way to quantify how differences in the total column AK influence the MOPITT–TROPOMI retrieval differences. We can, however, use the null-space adjustment technique to examine how sensitive MOPITT–TROPOMI differences are to a priori and reference profile discrepancies. Our results indicate that biases between MOPITT and null-space-adjusted TROPOMI retrievals (Tables 4 and 5) are very close to biases between MOPITT and TROPOMI untransformed retrievals (Tables 1 and 3). By accounting for differences between a priori and reference profiles, the absolute value of relative biases over land decrease by 1.21, 1.17, and 1.23 percentage points on average (for MOPITT TIR, NIR, and TIR + NIR, respectively). The change in relative SD values is also very small (0.06, 0.02, and 0.08 percentage points on average). Similarly, relative biases over bodies of water change by 1.88 percentage points on average; the change in relative SD values is 0.06 percentage points on average. To sum up, the error introduced by discrepancies between MOPITT a priori profiles and TROPOMI reference profiles is very small, near 1–2 percentage points. As expected, this error is slightly larger under cloudy conditions, as is the case in TROPOMI retrievals over water.
A consistent global record of tropospheric CO is important for climate studies as well as for air quality monitoring and prediction. To better understand TROPOMI in the context of the current CO satellite record and thus facilitate the record's extension, we have compared TROPOMI data to other satellite (MOPITT) and airborne (ATom) datasets. Our results show that the accuracy of TROPOMI retrievals with respect to MOPITT and ATom far exceeds Sentinel-5P mission requirements (Veefkind et al., 2012; Landgraf et al., 2016). The precision values calculated for some of the ROIs analyzed surpass the target value by a few percent.
We have analyzed cloud-free, land-only TROPOMI and MOPITT retrievals from 7 November 2017 to 10 March 2019 over ROIs representative of clean, polluted, and hemispheric regions in order to compare total CO column values from the two instruments. ATom being restricted mostly to oceanic regions precludes the use of this in situ dataset for fully validating TROPOMI retrievals over land. To that end, in situ data from other airborne measurement programs are required. Ground-based measurements (e.g., NDACC, TCCON) could also be used; this would allow for the validation of seasonal variability at fixed locations. Quantitative comparisons between TROPOMI and MOPITT retrievals over land are nevertheless relevant. The MOPITT dataset represents the longest global CO record available (2000–present); because of extensive validation efforts with respect to in situ measurements and comparisons with other satellite datasets, it is well-characterized. Additionally, MOPITT products have served as the reference for many other satellite retrieval products for CO, including AIRS (Worden et al., 2013b), TES (Worden et al., 2013b), and IASI (George et al., 2009, 2015). Furthermore, TROPOMI and MOPITT were, until TANSO-FTS-2 became operational in 2019, the only working satellite instruments retrieving CO from NIR solar-reflected radiances. Thus, it is important to understand their relative behavior, particularly because we are interested in continuing the MOPITT multispectral record (which has enhanced sensitivity to near-surface CO for some land observations; Worden et al., 2010) using radiances from TROPOMI (NIR) and SNPP-CrIS (TIR), two instruments on satellites flying in loose formation (Fu et al., 2016). While our TROPOMI-MOPITT comparisons do not account for the contrasting vertical sensitivities of these two instruments, their results show that there is excellent agreement between the two datasets.
To analyze TROPOMI retrievals over bodies of water, only possible in cloudy conditions, we have used both ATom-4 in situ data (24 April to 21 May 2018) and MOPITT TIR retrievals (7 November 2017 to 10 March 2019). The ATom comparison allowed for full validation using the TROPOMI AK. This is the ideal situation, since retrieval-simulated ATom-4 column values (i.e., ATom-4 values smoothed using the TROPOMI AK) explicitly account for the TROPOMI retrieval vertical sensitivity (unlike TROPOMI–MOPITT comparisons). The MOPITT comparison provided useful information for a longer period and wider geographical extent, although with the same restrictions noted above regarding the land-only comparisons. Our analyses over bodies of water indicate that TROPOMI's use of reference profiles in cloudy conditions results in errors on the order of a few percent. Since there are no major CO sources over water, CO values closer to the surface (and therefore most likely to be below cloud top) tend to be spatially homogeneous and stable through time. Thus, they are well-characterized by the reference profiles. (Caution should be exercised in the case of sporadic CO sources near open water, e.g., fires near a coastline, which could in some cases result in plumes transported off the coast and below cloud top. Larger errors could occur in such retrievals over water if sources were not well-represented in the TM5 model.) Depending on the representativeness of the TROPOMI reference profiles, larger errors may occur in TROPOMI land retrievals under cloudy conditions, particularly near CO emission sources. These errors require further characterization with colocated in situ data and ground measurements over land.
TROPOMI level 2 CO retrievals for 7 November 2017 to 27 June 2018 were downloaded from https://s5pexp.copernicus.eu/ (last access: 27 November 2019), ESA, 2018a.; retrievals for dates after 28 June 2018 were downloaded from https://s5phub.copernicus.eu/ (last access: 27 November 2019). TROPOMI reference profiles were obtained from ftp://ftp.sron.nl/pub/jochen/TROPOMI_apriori/tm5_co/ (last access: 2 September 2020; Landgraf, 2020). MOPITT data can be downloaded from https://doi.org/10.5067/TERRA/MOPITT/MOP02T_L2.008 (Ziskin, 2019a)
(TIR), https://doi.org/10.5067/TERRA/MOPITT/MOP02N_L2.008 (Ziskin, 2019b) (NIR), and https://doi.org/10.5067/TERRA/MOPITT/MOP02J_L2.008 (Ziskin, 2019c) (TIR + NIR). ATom-4 data from the 7 September 2019 version were downloaded from https://doi.org/10.3334/ORNLDAAC/1581 (Wofsy et al., 2018).
The supplement related to this article is available online at: https://doi.org/10.5194/amt-13-4841-2020-supplement.
SM-A, HW, and MD defined the concept and methodology of the paper. SM-A performed the formal analysis of data sets, software development, and data presentation. SM-A, HW, MD, and GF oversaw the MOPITT data analysis. TB, IA, and JL oversaw the TROPOMI data analysis. RC, KM, SW, and BD oversaw the ATom data analysis. MG contributed to inter-satellite comparisons. DM produced necessary MOPITT L2 retrievals. HW was responsible for funding acquisition. SM-A and MD wrote the original draft. All authors contributed to the review and editing of this paper.
The authors declare that they have no conflict of interest.
This article is part of the special issue “TROPOMI on Sentinel-5 Precursor: first year in operation (AMT/ACP inter-journal SI)”. It is not associated with a conference.
We thank Clive Rodgers for his insightful comments regarding retrieval methods. NCAR internal reviews provided by Louisa Emmons and John Gille are greatly appreciated. This paper benefited from helpful comments from three anonymous reviewers. Sentinel-5 Precursor is part of the EU Copernicus program, and Copernicus (modified) Sentinel data for 2017–2019 have been used.
This material is based upon work supported by the National Center for Atmospheric Research (NCAR), which is a major facility sponsored by the National Science Foundation (grant no. 1852977). The NCAR MOPITT project is supported by the National Aeronautics and Space Administration (NASA) Earth Observing System (EOS) Program. This research is supported by NASA-ROSES (grant no. 80NSSC18K0687). Tobias Borsdorff is funded through the national TROPOMI program from the Netherlands Space Office (NSO). CO measurements on ATom were supported by NASA Earth Venture program funding to Harvard University (grant no. NNX15AJ23G) and to the University of Colorado (grant no. NNX16AL92A).
This paper was edited by Ben Veihelmann and reviewed by three anonymous referees.
Ackerman, S., Strabala, K., Menzel, W., Frey, R., Moeller, C., and Gumley, L.: Discriminating clear sky from clouds with MODIS, J. Geophys. Res.-Atmos., 103, 32141–32157, https://doi.org/10.1029/1998JD200032, 1998. a
Borsdorff, T., Hasekamp, O. P., Wassmann, A., and Landgraf, J.: Insights into Tikhonov regularization: application to trace gas column retrieval and the efficient calculation of total column averaging kernels, Atmos. Meas. Tech., 7, 523–535, https://doi.org/10.5194/amt-7-523-2014, 2014. a, b, c, d, e, f
Borsdorff, T., Aan de Brugh, J., Hu, H., Aben, I., Hasekamp, O., and Landgraf, J.: Measuring Carbon Monoxide With TROPOMI: First Results and a Comparison With ECMWF-IFS Analysis Data, Geophys. Res. Lett., 45, 2826–2832, https://doi.org/10.1002/2018GL077045, 2018a. a, b
Borsdorff, T., aan de Brugh, J., Hu, H., Hasekamp, O., Sussmann, R., Rettinger, M., Hase, F., Gross, J., Schneider, M., Garcia, O., Stremme, W., Grutter, M., Feist, D. G., Arnold, S. G., De Mazière, M., Kumar Sha, M., Pollard, D. F., Kiel, M., Roehl, C., Wennberg, P. O., Toon, G. C., and Landgraf, J.: Mapping carbon monoxide pollution from space down to city scales with daily global coverage, Atmos. Meas. Tech., 11, 5507–5518, https://doi.org/10.5194/amt-11-5507-2018, 2018b. a, b, c, d
Bovensmann, H., Burrows, J., Buchwitz, M., Frerick, J., Noel, S., Rozanov, V., Chance, K., and Goede, A.: SCIAMACHY: Mission objectives and measurement modes, J. Atmos. Sci., 56, 127–150, https://doi.org/10.1175/1520-0469(1999)056{<}0127:SMOAMM{>}2.0.CO;2, 1999. a
Buchholz, R. R., Deeter, M. N., Worden, H. M., Gille, J., Edwards, D. P., Hannigan, J. W., Jones, N. B., Paton-Walsh, C., Griffith, D. W. T., Smale, D., Robinson, J., Strong, K., Conway, S., Sussmann, R., Hase, F., Blumenstock, T., Mahieu, E., and Langerock, B.: Validation of MOPITT carbon monoxide using ground-based Fourier transform infrared spectrometer data from NDACC, Atmos. Meas. Tech., 10, 1927–1956, https://doi.org/10.5194/amt-10-1927-2017, 2017. a, b
Clerbaux, C., Boynard, A., Clarisse, L., George, M., Hadji-Lazaro, J., Herbin, H., Hurtmans, D., Pommier, M., Razavi, A., Turquety, S., Wespes, C., and Coheur, P.-F.: Monitoring of atmospheric composition using the thermal infrared IASI/MetOp sounder, Atmos. Chem. Phys., 9, 6041–6054, https://doi.org/10.5194/acp-9-6041-2009, 2009. a
Crosson, E. R.: A cavity ring-down analyzer for measuring atmospheric levels of methane, carbon dioxide, and water vapor, Appl. Phys. B-Lasers O., 92, 403–408, https://doi.org/10.1007/s00340-008-3135-y, 2008. a
De Mazière, M., Thompson, A. M., Kurylo, M. J., Wild, J. D., Bernhard, G., Blumenstock, T., Braathen, G. O., Hannigan, J. W., Lambert, J.-C., Leblanc, T., McGee, T. J., Nedoluha, G., Petropavlovskikh, I., Seckmeyer, G., Simon, P. C., Steinbrecht, W., and Strahan, S. E.: The Network for the Detection of Atmospheric Composition Change (NDACC): history, status and perspectives, Atmos. Chem. Phys., 18, 4935–4964, https://doi.org/10.5194/acp-18-4935-2018, 2018. a
Deeter, M., Emmons, L., Francis, G., Edwards, D., Gille, J., Warner, J., Khattatov, B., Ziskin, D., Lamarque, J., Ho, S., Yudin, V., Attie, J., Packman, D., Chen, J., Mao, D., and Drummond, J.: Operational carbon monoxide retrieval algorithm and selected results for the MOPITT instrument, J. Geophys. Res.-Atmos., 108, 4399, https://doi.org/10.1029/2002JD003186, 2003. a
Deeter, M. N.: MOPITT Measurements Of Pollution In The Troposphere validation version 4 product users guide, Tech. rep., Atmospheric Chemistry Division, National Center for Atmospheric Research, 2009. a
Deeter, M. N., Worden, H. M., Gille, J. C., Edwards, D. P., Mao, D., and Drummond, J. R.: MOPITT multispectral CO retrievals: Origins and effects of geophysical radiance errors, J. Geophys. Res.-Atmos., 116, D15303, https://doi.org/10.1029/2011JD015703, 2011. a
Deeter, M. N., Worden, H. M., Edwards, D. P., Gille, J. C., and Andrews, A. E.: Evaluation of MOPITT retrievals of lower-tropospheric carbon monoxide over the United States, J. Geophys. Res.-Atmos., 117, D13306, https://doi.org/10.1029/2012JD017553, 2012. a
Deeter, M. N., Edwards, D. P., Francis, G. L., Gille, J. C., Martínez-Alonso, S., Worden, H. M., and Sweeney, C.: A climate-scale satellite record for carbon monoxide: the MOPITT Version 7 product, Atmos. Meas. Tech., 10, 2533–2555, https://doi.org/10.5194/amt-10-2533-2017, 2017. a
Deeter, M. N., Edwards, D. P., Francis, G. L., Gille, J. C., Mao, D., Martínez-Alonso, S., Worden, H. M., Ziskin, D., and Andreae, M. O.: Radiance-based retrieval bias mitigation for the MOPITT instrument: the version 8 product, Atmos. Meas. Tech., 12, 4561–4580, https://doi.org/10.5194/amt-12-4561-2019, 2019. a, b, c, d
Drummond, J. and Mand, G.: The measurements of pollution in the troposphere (MOPITT) instrument: Overall performance and calibration requirements, J. Atmos. Ocean. Tech., 13, 314–320, https://doi.org/10.1175/1520-0426(1996)013{<}0314:TMOPIT{>}2.0.CO;2, 1996. a
Drummond, J. R., Zou, J., Nichitiu, F., Kar, J., Deschambaut, R., and Hackett, J.: A review of 9-year performance and operation of the MOPITT instrument, Adv. Space Res., 45, 760–774, https://doi.org/10.1016/j.asr.2009.11.019, 2010. a
ESA: Sentinel-5P Expert Users Data Hub, https://s5pexp.copernicus.eu/ (last access: 27 November 2019), 2018a.
ESA: Sentinel-5P Pre-Operations Data Hub, https://s5phub.copernicus.eu/ (last access: 27 November 2019), 2018b.
ESRL: Update on the WMO X2014A CO scale July 2018, available at: https://www.esrl.noaa.gov/gmd/ccl/co_scale_update.html (last access: 2 February 2020), 2018. a
Francis, G. L., Deeter, M. N., Martínez-Alonso, S., Gille, J. C., Edwards, D. P., Mao, D., Worden, H. M., and Ziskin, D.: Measurement Of Pollution In The Troposphere algorithm theoretical basis document. Retrieval of carbon monoxide profiles and column amounts from MOPITT observed radiances (Level 1 to Level 2), Tech. rep., Atmospheric Chemistry Observations and Modeling Laboratory, National Center for Atmospheric Research, 2017. a
Fu, D., Bowman, K. W., Worden, H. M., Natraj, V., Worden, J. R., Yu, S., Veefkind, P., Aben, I., Landgraf, J., Strow, L., and Han, Y.: High-resolution tropospheric carbon monoxide profiles retrieved from CrIS and TROPOMI, Atmos. Meas. Tech., 9, 2567–2579, https://doi.org/10.5194/amt-9-2567-2016, 2016. a
George, M., Clerbaux, C., Hurtmans, D., Turquety, S., Coheur, P.-F., Pommier, M., Hadji-Lazaro, J., Edwards, D. P., Worden, H., Luo, M., Rinsland, C., and McMillan, W.: Carbon monoxide distributions from the IASI/METOP mission: evaluation with other space-borne remote sensors, Atmos. Chem. Phys., 9, 8317–8330, https://doi.org/10.5194/acp-9-8317-2009, 2009. a
George, M., Clerbaux, C., Bouarar, I., Coheur, P.-F., Deeter, M. N., Edwards, D. P., Francis, G., Gille, J. C., Hadji-Lazaro, J., Hurtmans, D., Inness, A., Mao, D., and Worden, H. M.: An examination of the long-term CO records from MOPITT and IASI: comparison of retrieval methodology, Atmos. Meas. Tech., 8, 4313–4328, https://doi.org/10.5194/amt-8-4313-2015, 2015. a, b
Giglio, L., Csiszar, I., and Justice, C. O.: Global distribution and seasonality of active fires as observed with the Terra and Aqua Moderate Resolution Imaging Spectroradiometer (MODIS) sensors, J. Geophys. Res.-Biogeo., 111, G02016, https://doi.org/10.1029/2005JG000142, 2006. a
Heald, C., Jacob, D., Fiore, A., Emmons, L., Gille, J., Deeter, M., Warner, J., Edwards, D., Crawford, J., Hamlin, A., Sachse, G., Browell, E., Avery, M., Vay, S., Westberg, D., Blake, D., Singh, H., Sandholm, S., Talbot, R., and Fuelberg, H.: Asian outflow and trans-Pacific transport of carbon monoxide and ozone pollution: An integrated satellite, aircraft, and model perspective, J. Geophys. Res.-Atmos., 108, 4804, https://doi.org/10.1029/2003JD003507, 2003. a
Hedelius, J. K., He, T.-L., Jones, D. B. A., Baier, B. C., Buchholz, R. R., De Mazière, M., Deutscher, N. M., Dubey, M. K., Feist, D. G., Griffith, D. W. T., Hase, F., Iraci, L. T., Jeseck, P., Kiel, M., Kivi, R., Liu, C., Morino, I., Notholt, J., Oh, Y.-S., Ohyama, H., Pollard, D. F., Rettinger, M., Roche, S., Roehl, C. M., Schneider, M., Shiomi, K., Strong, K., Sussmann, R., Sweeney, C., TÉ, Y., Uchino, O., Velazco, V. A., Wang, W., Warneke, T., Wennberg, P. O., Worden, H. M., and Wunch, D.: Evaluation of MOPITT Version 7 joint TIRNIR XCO retrievals with TCCON, Atmos. Meas. Tech., 12, 5547–5572, https://doi.org/10.5194/amt-12-5547-2019, 2019. a, b
Holloway, T., Levy, H., and Kasibhatla, P.: Global distribution of carbon monoxide, J. Geophys. Res.-Atmos., 105, 12123–12147, https://doi.org/10.1029/1999JD901173, 2000. a
Karion, A., Sweeney, C., Wolter, S., Newberger, T., Chen, H., Andrews, A., Kofler, J., Neff, D., and Tans, P.: Long-term greenhouse gas measurements from aircraft, Atmos. Meas. Tech., 6, 511–526, https://doi.org/10.5194/amt-6-511-2013, 2013. a
Krol, M., Houweling, S., Bregman, B., van den Broek, M., Segers, A., van Velthoven, P., Peters, W., Dentener, F., and Bergamaschi, P.: The two-way nested global chemistry-transport zoom model TM5: algorithm and applications, Atmos. Chem. Phys., 5, 417–432, https://doi.org/10.5194/acp-5-417-2005, 2005. a
Lamarque, J.-F., Emmons, L. K., Hess, P. G., Kinnison, D. E., Tilmes, S., Vitt, F., Heald, C. L., Holland, E. A., Lauritzen, P. H., Neu, J., Orlando, J. J., Rasch, P. J., and Tyndall, G. K.: CAM-chem: description and evaluation of interactive atmospheric chemistry in the Community Earth System Model, Geosci. Model Dev., 5, 369–411, https://doi.org/10.5194/gmd-5-369-2012, 2012. a
Landgraf, J.: TROPOMI 2007–2009 reference profiles for carbon monoxide, available at: ftp://ftp.sron.nl/pub/jochen/TROPOMI_apriori/tm5_co/, last access: 2 September 2020.
Landgraf, J., aan de Brugh, J., Scheepmaker, R., Borsdorff, T., Hu, H., Houweling, S., Butz, A., Aben, I., and Hasekamp, O.: Carbon monoxide total column retrievals from TROPOMI shortwave infrared measurements, Atmos. Meas. Tech., 9, 4955–4975, https://doi.org/10.5194/amt-9-4955-2016, 2016. a, b, c, d, e, f, g, h, i, j, k
Landgraf, J., Borsdorff, T., Langerock, B., and Keppens, A.: S5P mission performance centre carbon monoxide (L2 CO) readme, Tech. Rep. 1.0.0, 2018-07-09, Netherlands Institute for Space Research (SRON), 2018. a
Lelieveld, J., Gromov, S., Pozzer, A., and Taraborrelli, D.: Global tropospheric hydroxyl distribution, budget and reactivity, Atmos. Chem. Phys., 16, 12477–12493, https://doi.org/10.5194/acp-16-12477-2016, 2016. a
Martínez-Alonso, S., Deeter, M. N., Worden, H. M., Gille, J. C., Emmons, L. K., Pan, L. L., Park, M., Manney, G. L., Bernath, P. F., Boone, C. D., Walker, K. A., Kolonjari, F., Wofsy, S. C., Pittman, J., and Daube, B. C.: Comparison of upper tropospheric carbon monoxide from MOPITT, ACE-FTS, and HIPPO-QCLS, J. Geophys. Res.-Atmos., 119, 14144–14164, https://doi.org/10.1002/2014JD022397, 2014. a
McKain, K. and Sweeney, C.: Readme for NOAA-Picarro on ATom-1,2,3,4, Tech. rep., Cooperative Institute for Research in the Environmental Sciences, University of Colorado and NOAA Earth System Research Laboratory, 2018. a
McManus, J. B., Zahniser, M. S., Nelson Jr., D. D., Shorter, J. H., Herndon, S., Wood, E., and Wehr, R.: Application of quantum cascade lasers to high-precision atmospheric trace gas measurements, Opt. Eng., 49, 111124, https://doi.org/10.1117/1.3498782, 2010. a
Myhre, G., Shindell, D., Bréon, F.-M., Collins, W., Fuglestvedt, J., Huang, J., Koch, D., Lamarque, J.-F., Lee, D., Mendoza, B., Nakajima, T., Robock, A., Stephens, G., Takemura, T., and Zhang, H.: Anthropogenic and natural radiative forcing, pp. 659–740, Cambridge University Press, Cambridge, UK, https://doi.org/10.1017/CBO9781107415324.018, 2013. a
NIES: Analysis result of the proxy-method based retrievals from GOSAT-2 data: methane and carbon monoxide, available at: http://www.nies.go.jp/whatsnew/20190705/20190705-e.html (last access: 8 April 2020), 2019. a
Rodgers, C. and Connor, B.: Intercomparison of remote sounding instruments, J. Geophys. Res.-Atmos., 108, 4116, https://doi.org/10.1029/2002JD002299, 2003. a, b, c
Rodgers, C. D.: Inverse Methods for Atmospheric Sounding, World Scientific, River Edge, N. J., https://doi.org/10.1142/3171, 2000. a, b, c
Santoni, G. W., Daube, B. C., Kort, E. A., JimÉnez, R., Park, S., Pittman, J. V., Gottlieb, E., Xiang, B., Zahniser, M. S., Nelson, D. D., McManus, J. B., Peischl, J., Ryerson, T. B., Holloway, J. S., Andrews, A. E., Sweeney, C., Hall, B., Hintsa, E. J., Moore, F. L., Elkins, J. W., Hurst, D. F., Stephens, B. B., Bent, J., and Wofsy, S. C.: Evaluation of the airborne quantum cascade laser spectrometer (QCLS) measurements of the carbon and greenhouse gas suite – CO2, CH4, N2O, and CO – during the CalNex and HIPPO campaigns, Atmos. Meas. Tech., 7, 1509–1526, https://doi.org/10.5194/amt-7-1509-2014, 2014. a, b
Spivakovsky, C., Logan, J., Montzka, S., Balkanski, Y., Foreman-Fowler, M., Jones, D., Horowitz, L., Fusco, A., Brenninkmeijer, C., Prather, M., Wofsy, S., and McElroy, M.: Three-dimensional climatological distribution of tropospheric OH: Update and evaluation, J. Geophys. Res.-Atmos., 105, 8931–8980, https://doi.org/10.1029/1999JD901006, 2000. a
Veefkind, J. P., Aben, I., McMullan, K., Forster, H., de Vries, J., Otter, G., Claas, J., Eskes, H. J., de Haan, J. F., Kleipool, Q., van Weele, M., Hasekamp, O., Hoogeveen, R., Landgraf, J., Snel, R., Tol, P., Ingmann, P., Voors, R., Kruizinga, B., Vink, R., Visser, H., and Levelt, P. F.: TROPOMI on the ESA Sentinel-5 Precursor: A GMES mission for global observations of the atmospheric composition for climate, air quality and ozone layer applications, Remote Sen. Environ., 120, 70–83, https://doi.org/10.1016/j.rse.2011.09.027, 2012. a, b, c, d, e
Vidot, J., Landgraf, J., Hasekamp, O. P., Butz, A., Galli, A., Tol, P., and Aben, I.: Carbon monoxide from shortwave infrared reflectance measurements: A new retrieval approach for clear sky and partially cloudy atmospheres, Remote Sens. Environ., 120, 255–266, https://doi.org/10.1016/j.rse.2011.09.032, 2012. a, b
Wofsy, S., Afshar, S., Allen, H., Apel, E., Asher, E., Barletta, B., Bent, J., Bian, H., Biggs, B., Blake, D., Blake, N., Bourgeois, I., Brock, C., Brune, W., Budney, J., Bui, T., Butler, A., Campuzano-Jost, P., Chang, C., Chin, M., Commane, R., Correa, G., Crounse, J., Cullis, P., Daube, B., Day, D., Dean-Day, J., Dibb, J., Digangi, J., Diskin, G., Dollner, M., Elkins, J., Erdesz, F., Fiore, A., Flynn, C., Froyd, K., Gesler, D., Hall, S., Hanisco, T., Hannun, R., Hills, A., Hintsa, E., Hoffman, A., Hornbrook, R., Huey, L., Hughes, S., Jimenez, J., Johnson, B., Katich, J., Keeling, R., Kim, M., Kupc, A., Lait, L., Lamarque, J.-F., Liu, J., Mckain, K., Mclaughlin, R., Meinardi, S., Miller, D., Montzka, S., Moore, F., Morgan, E., Murphy, D., Murray, L., Nault, B., Neuman, J., Newman, P., Nicely, J., Pan, X., Paplawsky, W., Peischl, J., Prather, M., Price, D., Ray, E., Reeves, J., Richardson, M., Rollins, A., Rosenlof, K., Ryerson, T., Scheuer, E., Schill, G., Schroder, J., Schwarz, J., St.Clair, J., Steenrod, S., Stephens, B., Strode, S., Sweeney, C., Tanner, D., Teng, A., Thames, A., Thompson, C., Ullmann, K., Veres, P., Vizenor, N., Wagner, N., Watt, A., Weber, R., Weinzierl, B., Wennberg, P., Williamson, C., Wilson, J., Wolfe, G., Woods, C., and Zeng, L.: ATom: Merged Atmospheric Chemistry, Trace Gases, and Aerosols, ORNL DAAC, https://doi.org/10.3334/ORNLDAAC/1581, 2018. a, b
Worden, H. M., Deeter, M. N., Edwards, D. P., Gille, J. C., Drummond, J. R., and Nedelec, P.: Observations of near-surface carbon monoxide from space using MOPITT multispectral retrievals, J. Geophys. Res.-Atmos., 115, D18314, https://doi.org/10.1029/2010JD014242, 2010. a
Worden, H. M., Deeter, M. N., Edwards, D. P., Gille, J., Drummond, J., Emmons, L. K., Francis, G., and Martinez-Alonso, S.: 13 years of MOPITT operations: lessons from MOPITT retrieval algorithm development, Ann. Geophys.-Italy, 56, https://doi.org/10.4401/ag-6330, 2013a. a
Worden, H. M., Deeter, M. N., Frankenberg, C., George, M., Nichitiu, F., Worden, J., Aben, I., Bowman, K. W., Clerbaux, C., Coheur, P. F., de Laat, A. T. J., Detweiler, R., Drummond, J. R., Edwards, D. P., Gille, J. C., Hurtmans, D., Luo, M., Martínez-Alonso, S., Massie, S., Pfister, G., and Warner, J. X.: Decadal record of satellite carbon monoxide observations, Atmos. Chem. Phys., 13, 837–850, https://doi.org/10.5194/acp-13-837-2013, 2013b. a, b, c
Wunch, D., Toon, G. C., Blavier, J.-F. L., Washenfelder, R. A., Notholt, J., Connor, B. J., Griffith, D. W. T., Sherlock, V., and Wennberg, P. O.: The Total Carbon Column Observing Network, Philos. T. R. Soc. A, 369, 2087–2112, https://doi.org/10.1098/rsta.2010.0240, 2011. a
Ziskin, D.: Measurements Of Pollution In The Troposphere (MOPITT) Level 2 Derived CO (Thermal Infrared Radiances) (MOP02T) V008, https://doi.org/10.5067/TERRA/OPITT/MOP02T_L2.008, NASA Langley Atmospheric Science Data Center DAAC, 2019a. a
Ziskin, D.: Measurements Of Pollution In The Troposphere (MOPITT) Level 2 Derived CO (Near Infrared Radiances) (MOP02N) V008, https://doi.org/10.5067/TERRA/MOPITT/MOP02N_L2.008, NASA Langley Atmospheric Science Data Center DAAC, 2019b. a
Ziskin, D.: Measurements Of Pollution In The Troposphere (MOPITT) Level 2 Derived CO (Near and Thermal Infrared Radiances) (MOP02J) V008, https://doi.org/10.5067/TERRA/MOPITT/MOP02J_L2.008, NASA Langley Atmospheric Science Data Center DAAC, 2019c. a