the Creative Commons Attribution 4.0 License.
the Creative Commons Attribution 4.0 License.
 | 07 Oct 2020
Improved chloride quantification in quadrupole aerosol chemical speciation monitors (Q-ACSMs)
Anna K. Tobler
Alicja Skiba
Dongyu S. Wang
Philip Croteau
Katarzyna Styszko
Jarosław Nęcki
Urs Baltensperger
Jay G. Slowik
André S. H. Prévôt
Particulate chloride is an important component of fine particulate matter in marine air masses. Recent field studies also report elevated concentrations of gas-phase reactive chlorine species and particulate chloride related to anthropogenic activities. This work focuses on particulate chloride detection and quantification issues observed for some quadrupole aerosol chemical speciation monitors (Q-ACSMs) which are designed for the long-term measurement of ambient aerosol composition. The ACSM reports particle concentrations based on the difference between measurements of ambient air (sample mode) and particle-free ambient air (filter mode). For our long-term campaign in Krakow, Poland, the Q-ACSM reports apparent negative total chloride concentration for most of the campaign when analyzed with the default fragmentation table. This is the result of the difference signal from m∕z 35 (35Cl+) being negative, which dominates over the positive difference signal from m∕z 36 (H35Cl+). Highly time-resolved experiments with NH4Cl, NaCl and KCl particles show that the signal response of m∕z 35 is non-ideal when the signal builds up and decreases slowly for all three salts, leading to a negative difference measurement. In contrast, the m∕z 36 signal exhibits a near step-change response for NH4Cl during the sampling and filter period, resulting in a positive difference signal. The response of m∕z 36 for NaCl and KCl is not as prompt as for NH4Cl but still fast enough to have a positive difference signal. Furthermore, it is shown that this behavior is mostly independent of vaporizer temperature. Based on these observations, this work presents an approach to correct the chloride concentration time series by adapting the standard fragmentation table coupled with a calibration of NH4Cl to obtain a relative ionization efficiency (RIE) based on the signal at m∕z 36 (H35Cl+). This correction can be applied to measurements in environments where chloride is dominated by NH4Cl. Caution should be exercised when other chloride salts dominate the ambient particulate chloride.
- Article
(1324 KB) - Full-text XML
-
Supplement
(642 KB) - BibTeX
- EndNote


Aerosols are known to have a significant influence on regional to global climate and visibility (Fuzzi et al., 2015). Furthermore, severe adverse health effects have been linked to aerosol exposure (Pope and Dockery, 2006). Therefore, a better understanding of the aerosol composition is crucial. In recent years, different types of Aerodyne aerosol mass spectrometers (AMS; Jayne et al., 2000) and aerosol chemical speciation monitors (ACSM; Ng et al., 2011) have been widely used to quantify the chemical composition of non-refractory (NR) particulate matter (PM) with high time resolution. They allow the simultaneous quantification of NR PM chloride, ammonium, nitrate, organics and sulfate. For many environments, chloride does not significantly contribute to the total mass (Jimenez et al., 2009). Exceptions include coastal regions influenced by marine aerosol masses which are rich in inorganic sea salt (Ovadnevaite et al., 2012) and polluted inland regions influenced by anthropogenic chloride emissions. Anthropogenic chloride emissions include HCl which then forms NH4Cl with ammonia (NH3). Particulate chloride can enable the heterogeneous production of ClNO2 via reactive uptake of N2O5 during nighttime, which photolyzes to produce highly reactive chlorine radicals in the daytime (Yang et al., 2018; Le Breton et al., 2018; Thornton et al., 2010). The chlorine radical undergoes hydrogen abstraction reactions with hydrocarbons to form HCl which then again forms NH4Cl (Chang and Allen, 2006). This can lead to exceptionally high chloride concentrations, as has been reported for New Delhi by Gani et al. (2019) and Tobler et al. (2020a).
Table 1The original fragmentation table is a combination of the frag_Cl and frag_HCl. Because of the non-ideal behavior of m∕z 35, it is recommended to adapt (bold) the fragmentation table for chloride so that it is only based on frag_HCl.
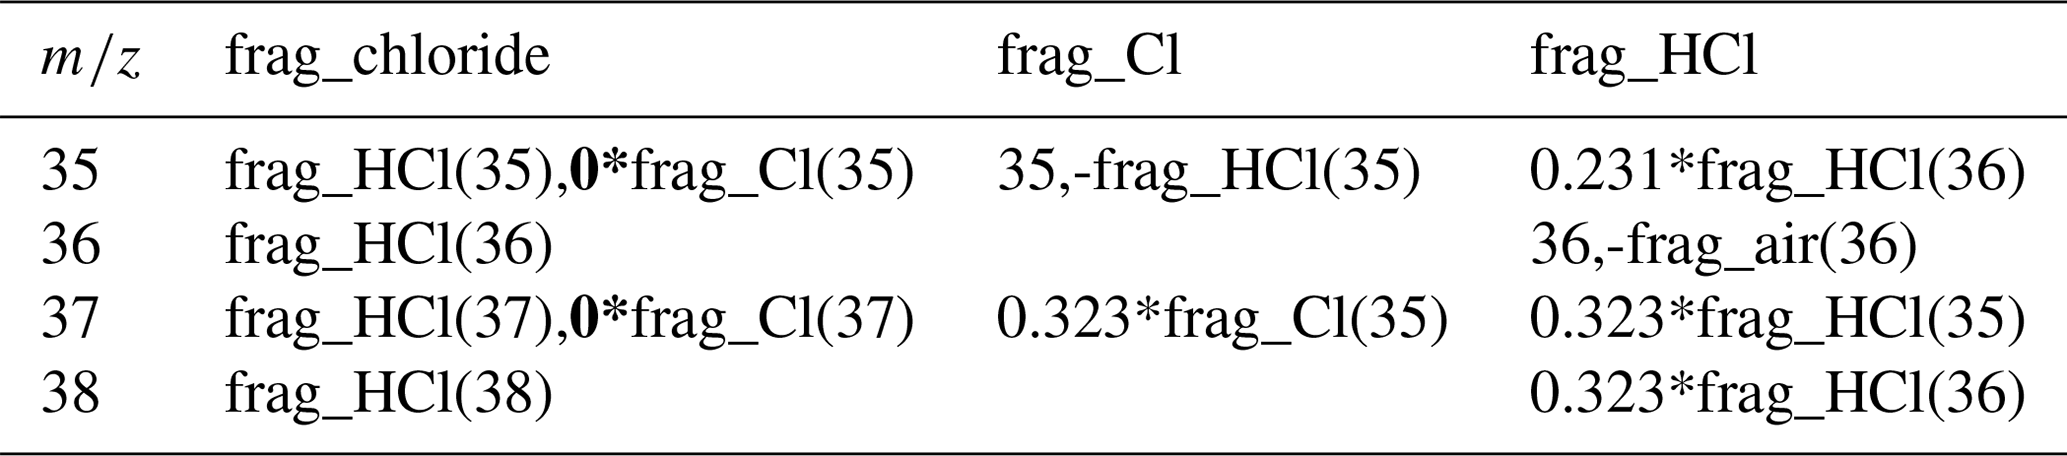
ACSMs equipped with a quadrupole mass spectrometer (Q-ACSM; Ng et al., 2011) have been used in numerous field campaigns in various environments. The first ambient intercomparison of 13 individual Q-ACSMs, carried out in the vicinity of Paris, revealed a good correlation between the Q-ACSMs for all species except chloride. It was not clear if this was due to low concentrations near the detection limit or due to the non-ideal vaporization behavior of chloride which depends on the specific conditions in the individual instruments (Crenn et al., 2015). During our long-term (>1 year) measurement campaign in Krakow, Poland, we observed significant apparent negative chloride concentrations, especially during the winter season when aerosol concentrations are high in general. The fragmentation table (Allan et al., 2004) attributes each m∕z to one or more of the bulk species, i.e., nitrate, ammonium, sulfate, organics and chloride. By default, the chloride concentration is calculated based on the measured 35Cl+ (m∕z 35) and H35Cl+ (m∕z 36) ion signals and the estimated 37Cl+ (m∕z 37) and H37Cl+ (m∕z 38) ion signals, calculated based on the natural isotope ratio of chlorine (see Table 1). Measurements with a negative signal from either m∕z 35 or 36 can therefore result in total negative chloride concentrations. The behavior of some chloride salts in the AMS has been studied. For example, Ovadnevaite et al. (2012) demonstrated that sea salt can be quantified by an AMS despite the mostly refractory nature of NaCl. Drewnick et al. (2015) showed that chloride salts appear to be sticky on the vaporizer surface and are only slowly removed. Also, chloride can undergo chemical reactions with the tungsten vaporizer surface resulting in WO2Cl2, among other compounds. Furthermore, they showed that chloride detection suffers from vaporizer memory effects as demonstrated by the presence of several iron chloride signals when iron nitrate nonahydrate was injected after chloride experiments. For the Q-ACSM, detection and quantification issues for organic chloride have been reported for isoprene-derived secondary organic aerosol (Wang and Hildebrandt Ruiz, 2017), as well as for firework-related particulate chlorides (Jiang et al., 2015). To our knowledge, there are no studies focused on the response of Q-ACSMs to inorganic chlorides.
In this study, we are able to attribute the issue of reported negative chloride concentrations in Q-ACSMs to a negative difference signal at m∕z 35. We present a highly time-resolved characterization of the Q-ACSM response to three different chloride salts at different vaporizer temperatures. Finally, we propose a calibration procedure coupled with a change in the fragmentation table to improve chloride detection and quantification using the Q-ACSM.
The operating principle of the ACSM is described in detail by Ng et al. (2011) and is briefly summarized here. The ACSM alternatively samples directly from ambient air (“sample”) and through a particle filter (“filter”), switching every 30 s. After passing through a 100 µm critical orifice, the submicron particles are focused into a narrow beam by an aerodynamic lens. Non-refractory particles are flash vaporized upon impact with the standard tungsten vaporizer at ∼600 ∘C where it is assumed that the solid particle is quickly turned into a vapor without undergoing any other processes besides thermal decomposition. For the ACSM used in this study (SN 140–145), an yttriated iridium filament was used to ionize the resulting vapors via electron impact (EI). The ions are detected by a quadrupole residual gas analyzer (RGA; Pfeiffer Vacuum PrismaPlus). The difference of the sample and the filter measurements represents the aerosol mass spectrum. The obtained mass spectrum typically ranges between m∕z 10 and 150 with unit mass resolution (UMR).
Investigations with different high-purity chloride salts were performed. Ammonium chloride (NH4Cl, ≤100 %; Merck KGaA, Darmstadt, Germany), sodium chloride (NaCl, ≥99.5 %; Fluka Chemie GmbH, Buchs, Switzerland) and potassium chloride (KCl, ≥99.5 %; Merck KGaA) were separately dissolved in ultrapure water. Particles were generated using a Topas atomizer. Subsequently, the aerosol passed through a silica diffusion gel dryer, a krypton bipolar charger and a custom-made differential mobility analyzer (DMA) for size selection at 300 nm. The particles were simultaneously injected into the ACSM and a condensation particle counter (CPC; TSI model 3022A). The standard vaporizer voltage was set to 7.7 V, corresponding to a vaporizer temperature of 720 ∘C, throughout the full campaign and was not changed unless otherwise mentioned. While using a higher temperature for the vaporizer could lead to a decreased response for NH4NO3, this will also be reflected in the calibrations as these were done under the same conditions. Therefore, the measurements should be comparable to measurements done with a vaporizer temperature of 600 ∘C. Calibrations were performed with the same setup using aqueous solutions of ammonium nitrate (NH4NO3, ≥ 99.5 %; Fluka GmbH), ammonium sulfate ((NH4)2SO4, ≥99.5 %; Fluka GmbH) and ammonium chloride (NH4Cl) following the new recommended calibration procedure which measures in full scan mode, meaning that the same scanning protocol as during ambient measurements is used during the calibration (Freney et al., 2019).
The presented ambient online measurements were conducted at the AGH University of Science and Technology in Krakow, Poland (50∘04′ N, 19∘55′ E), between 8 January 2018 and 10 April 2019. The inlet was installed 2 m above the rooftop of the building and was equipped with a 5 L min−1 PM2.5 cyclone (BGI, Mesa Labs, Inc.). The aerosol was dried through a Nafion dryer in the temperature-controlled room before being sampled by the ACSM. The data were recorded at a resolution of 10 min unless specified otherwise. All data were analyzed using ACSM Local 1.6.1.3 (Aerodyne Research Inc.) in Igor 6.37 (WaveMetrics Inc.).
3.1 Observations in ambient measurements
The Q-ACSM was installed at AGH University in Krakow for more than 14 months. The time series of chloride and the other NR-PM species are shown in Fig. 1a and b. During the first month of the measurements, significant positive chloride concentrations were measured. However, shortly after, the contribution of chloride decreased and, from the end of February 2018 until the end of the campaign, apparent negative chloride concentrations were recorded. The change to apparent negative concentrations cannot be related to a change in meteorological conditions (Fig. S1 in the Supplement).

Figure 1(a) Stacked time series of NH4, NO3, organics (Org) and SO4 and (b) time series of chloride (in µg m−3). Panels (c) and (d) show the time series of m∕z 35 and m∕z 36 in amps, respectively. The negative chloride signal is driven by the negative m∕z 35 signal.
The chloride concentration is calculated based on the m∕z 35 (35Cl+), m∕z 36 (H35Cl+), m∕z 37 (37Cl+), and m∕z 38 (H37Cl+) signals (Table 1). The 35Cl+ and H35Cl+ signals are measured, whereas the 37Cl+ and H37Cl+ signals are calculated based on the natural isotopic ratio of 35Cl to 37Cl and therefore will not be discussed further. While the signal of m∕z 36 is positive throughout the full campaign (Fig. 1c), the signal of m∕z 35 turns negative in February 2018 (Fig. 1d), which results in an apparent negative concentration of the total chloride signal (Fig. 1b). Similar observations of apparent negative chloride concentrations have been seen in Măgurele, Romania, during long-term field measurements (Luminita Marmureanu, personal communication, 2020).

Figure 2High-resolution time series (1 Hz) of the total ambient signal at m∕z 35 (blue) and m∕z 36 (green) signal. The filter was switched every 30 s to simulate normal measurements; the filter and ambient mode are indicated by the different shades of gray. The dots mark the time at which these m∕z values were scanned in the quadrupole during normal measurements, which is typically around 5 s after the filter switch.
Under typical operating conditions, the Q-ACSM scans the mass range from m∕z 10 to 150 at a scan rate of 200 ms amu−1, which produces a full mass spectrum roughly every 30 s. To better understand the transient behavior of m∕z 35 and m∕z 36, only those two ions were scanned with a high time resolution leading to a signal with 1 s resolution. To simulate the typical ambient ACSM sample–filter switching, the filter was switched every 30 s. Results shown in Fig. 2 explain how the different response times of Cl+ and HCl+ result in the apparent negative chloride; while HCl+ behaves nearly ideally and the signal instantaneously reacts after the filter change, Cl+ slowly builds up or slowly decays in the 30 s following a filter change. During normal full spectrum scans, the ions are subsequently measured in the quadrupole, meaning that the Cl+ and HCl+ signals used to calculate the difference signal are measured approximately 5 s after the filter switch, as indicated by the markers in Fig. 2. Consequently, the difference signal (i.e., sample minus filter) for m∕z 36 is positive, whereas the difference signal of m∕z 35 is negative under normal operating conditions.
3.2 Behavior of selected chloride salts in the Q-ACSM
The behaviors of the slowly vaporizing Cl+ and the rapidly vaporizing HCl+ of three of the most abundant chloride salts in the atmosphere were studied in more detail using NH4Cl, NaCl and KCl. Similar to the highly time-resolved targeted m∕z measurements for the ambient sample, only m∕z 35 and m∕z 36 were monitored on a 1 s resolution basis with the filter switching every 30 s.
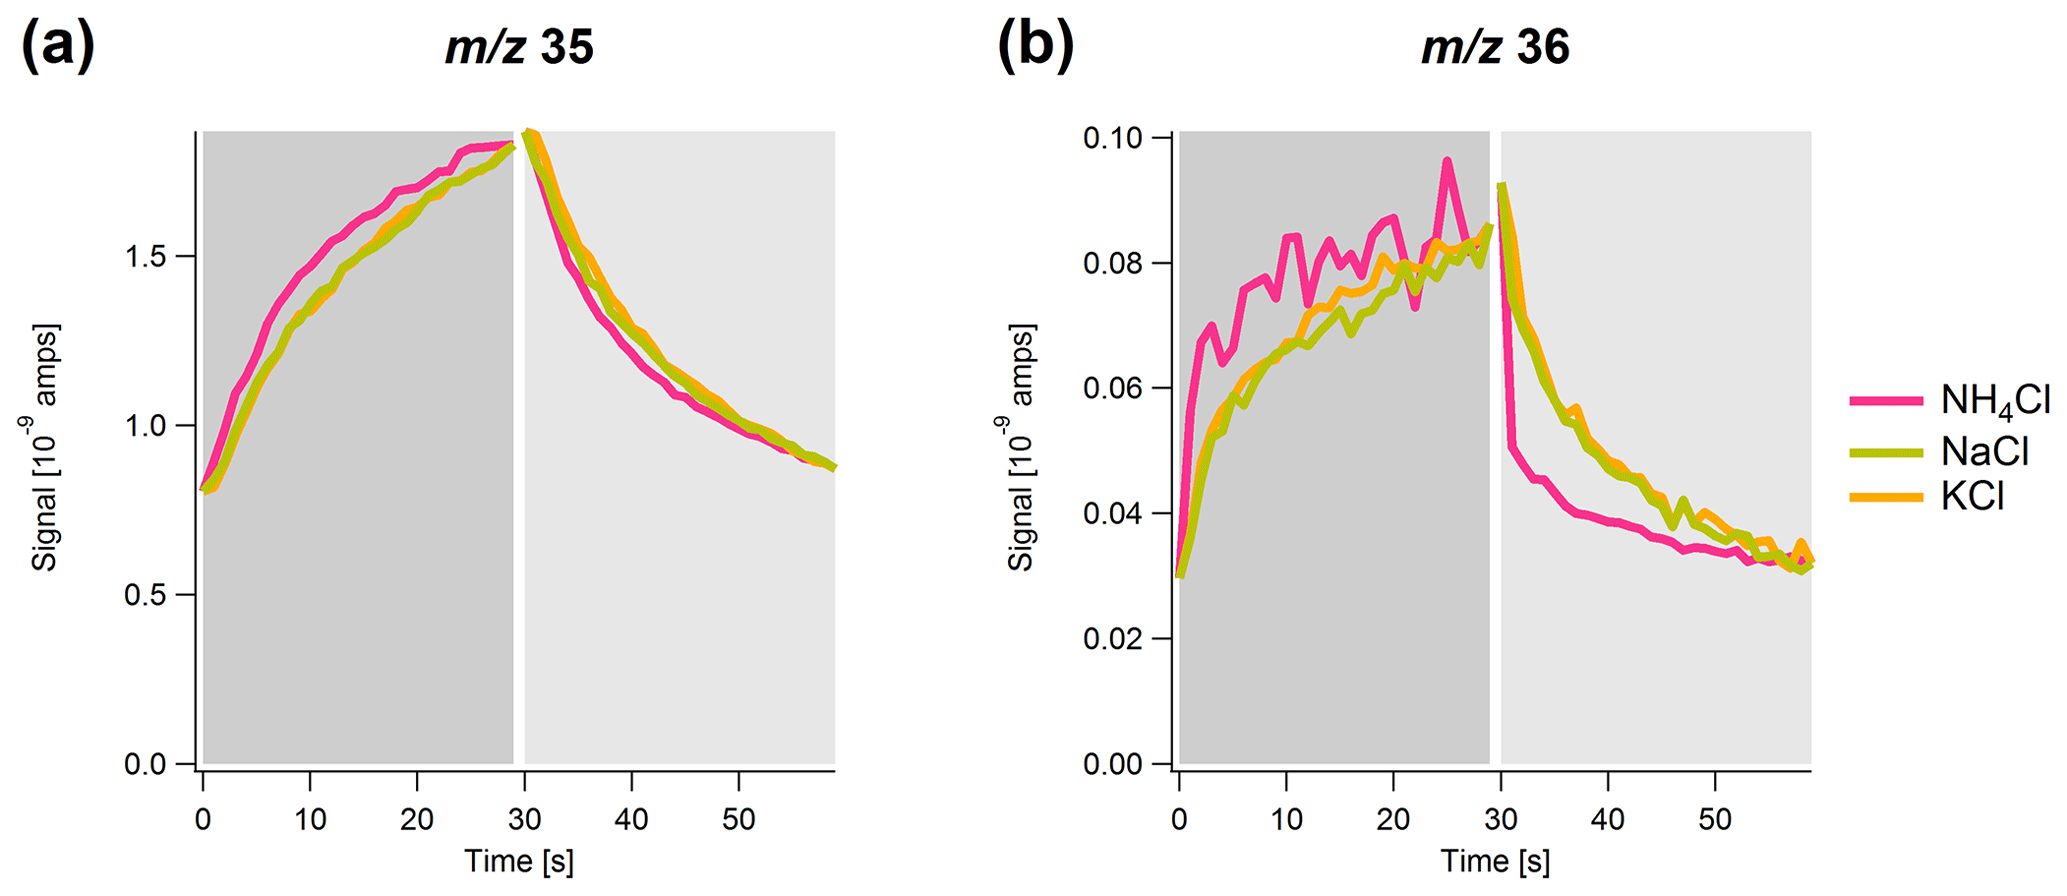
Figure 3Time series of the signal of (a) m∕z 35 and (b) m∕z 36 with 1 s resolution over a simulated sample (dark gray) and filter (light gray) cycle for NH4Cl (pink), NaCl (green) and KCl (orange). The maximum and minimum signals of NaCl and KCl are normalized to the maximum and minimum of NH4Cl.
In Fig. 3, the averaged temporal development of the signal in sample and filter mode for each of the three chloride salts is shown. The signals for NaCl and KCl are normalized to the signal for NH4Cl. There are apparent differences between NH4Cl and the other two salts, as well as between the m∕z values. The signal for NH4Cl responds faster after the filter switching, particularly for m∕z 36 for which a prompt increase and decrease in the signal after the filter switch can be observed. In contrast, the signal for NaCl and KCl evolves much more slowly. This different response time between the salts is also observed for m∕z 35, however, to a much smaller extent. The observation of the m∕z 36 (HCl+) signal for NaCl and KCl, even though their direct thermal composition products do not include HCl(g), is probably the result of heat-induced chemical reactions between chloride and background water vapor (Drewnick et al., 2015).
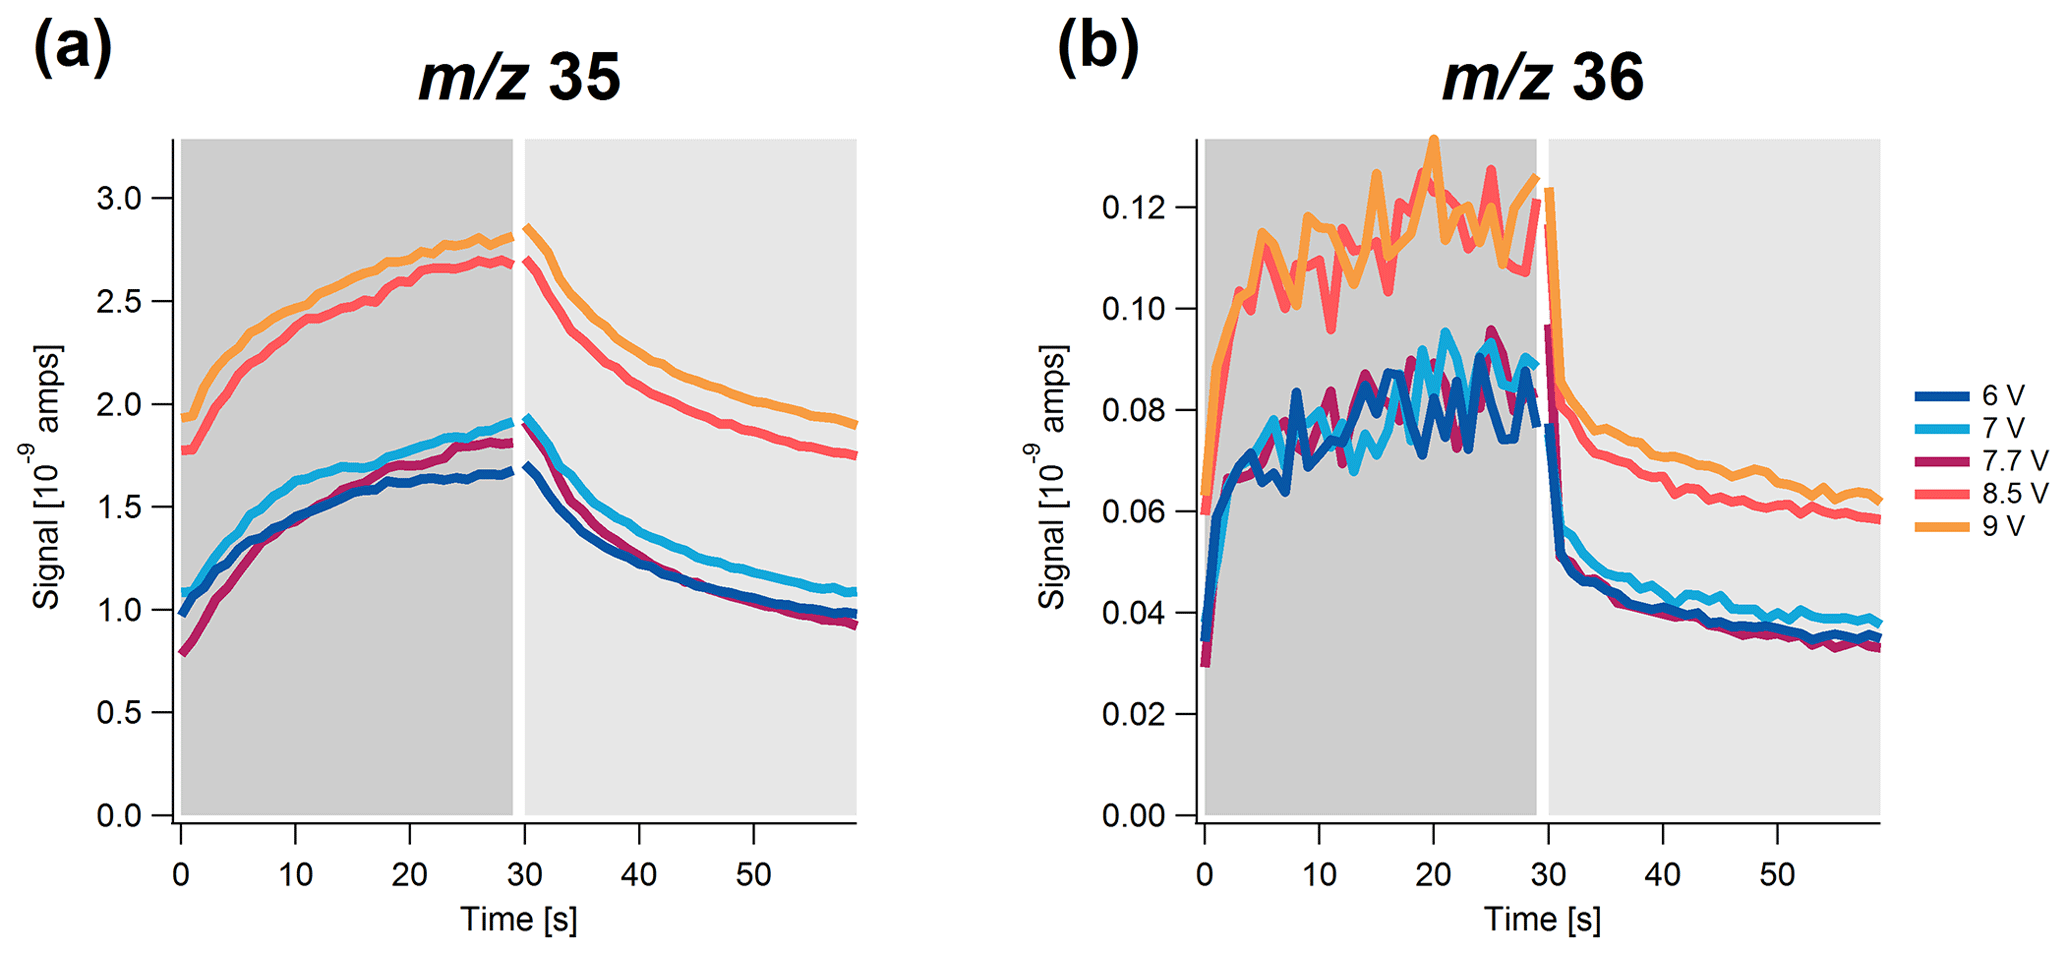
Figure 4Highly time-resolved signal of (a) m∕z 35 and (b) m∕z 36 as a function of time at different vaporizer voltages (i.e., temperatures) over a simulated sample (dark gray) and filter (light gray) cycle for NH4Cl.
In addition, the behavior of the different chloride salts at different vaporizer voltages (i.e., temperatures) was studied. The relative temporal evolution is mostly independent of the vaporizer temperature for all three salts investigated. The temporal behavior of the signal for NH4Cl is shown in Fig. 4. Similar to the usual vaporizer temperature of this instrument (7.7 V), the signal at m∕z 35 evolves much more slowly than the signal at m∕z 36 for all temperatures. Near identical temporal trends are observed for the signal at m∕z 36 for vaporizer voltages below 7.7 V. Above this voltage, a jump in the ion baseline intensity is observed. For the signal m∕z 35, a similar trend is visible; however, the differences between the signals for vaporizer voltages ≤7.7 V are larger. For NaCl and KCl, a similar trend is observed (Figs. S2 and S3), in which the background signal for NaCl is already starting to build up at 7.7 V. The signal of the background is a combination of several processes that can be expected to be enhanced or suppressed by the higher temperature, including the increased flash vaporization of chloride at the vaporizer surface, suppressed condensation at or near the vaporizer surface, enhanced re-desorption at or near the vaporizer surface, and condensation and re-desorption near the filament. To what extent each of these processes contribute to the jump in the instrument background cannot be decoupled based on the available measurements.
In the AMS (and therefore also in the ACSM), NH4Cl is expected to undergo thermal decomposition via the reaction (Hu et al., 2017, and references therein). This flash-vaporizing dissociation pathway results in a signal at m∕z 36 from HCl+. However, it is also possible that the particles can remain on the vaporizer or bounce off the vaporizer, land on a nearby, cooler surface, e.g., on the ionization chamber walls, and vaporize at a slower rate. During this process, further chemical reaction may occur; e.g., the vaporizer surface can act as a catalyst for reactions with other aerosol components or material on the vaporizer or the vaporizer material itself. For instance, the production of different tungsten oxide chlorides are reported for a porous tungsten vaporizer (standard vaporizer) (Drewnick et al., 2015). Regardless of the reactions, any of these multi-step processes would be much more likely to suppress the m∕z 36 signal and enhance the m∕z 35 signal in the background. For example, it can be expected that tungsten oxide chlorides produced by a reaction with the vaporizer will result in a Cl+ signal rather than an HCl+ signal.
The quantification of ACSM (and AMS) data relies on the imperfect assumption that all measured particles flash vaporize on the initial impact with the vaporizer. However, the behavior of some compounds such as ammonium sulfate and certain organic molecules can deviate from that of an ideal non-refractory component (Huffman et al., 2005). The behavior of semi-refractory compounds can strongly depend on the instrument history, vaporizer temperature, instrument tuning, filament material, and the physical alignment of the filament and is therefore hard to predict. The temperature in the ionization chamber is influenced by the vaporizer temperature itself, the filament temperature and the alignment of those to each other. Nowadays, ACSMs are equipped with tungsten filaments. However, older ACSMs were delivered with yttriated iridium filaments, which is also the case for the ACSM used here for all measurements. There are no direct measurements available to compare the temperature of the ion source between these two systems. However, based on the material properties, the iridium filament is expected to have a lower temperature compared to the tungsten filaments, and therefore the iridium filament is expected to have more slow-vaporizing components compared to the tungsten filament. For example, apparent negative chloride concentrations were reported for the Romanian ACSM mentioned earlier when operated with an iridium filament. After changing to a tungsten filament, the total chloride concentration was positive (Luminita Marmureanu, personal communication, 2020). Based on the observations, it is also possible that the capture vaporizer (Hu et al., 2017; Xu et al., 2017) can increase the possibility of negative m∕z 35 as there are more collisions of HCl(g) with the hot vaporizer surface which could result in more m∕z 35 signal.
Regardless of how consistent the effect is between different Q-ACSMs, the fact that a difference between m∕z 35 and m∕z 36 regarding the vaporization times can be observed suggests that the m∕z 35 signal should be utilized with caution even when negative difference signals are not detected. Analogous to Ovadnevaite et al. (2012), when the NaCl+ ion was suggested as a surrogate for sea salt due to its more rapid evaporation, here we recommend using the HCl+ ion as the signature for NH4Cl as it is the direct product of thermal decomposition and less influenced by secondary, lower-temperature vaporization. It also leads to more consistent results over time as the time response of Cl+ at m∕z 35 is hard to predict, as described above.
3.3 Corrections
The chloride calculation is based on the frag_chloride entry in the fragmentation table (Allan et al., 2004), which is actually a combination of frag_Cl and frag_HCl (Table 1, in roman type). Our experimental results suggest that the Cl+ signal originates from the slow thermal decomposition of NH4Cl and biases the calculation of the total chloride concentration. HCl, the thermal decomposition product of NH4Cl, also fragments into Cl+; however, this is calculated based on the HCl+ signal. Therefore, the Cl+ signal from frag_Cl should not be used in the calculation, and we suggest adapting the fragmentation table by multiplying the frag_Cl by 0 (Table 1, in bold). Similar suggestions were made for the quantification of organochlorides (Wang and Hildebrandt Ruiz, 2017) and firework-related particulate chlorides (Jiang et al., 2015).
As described by Ng et al. (2011), the mass concentration Cs of the species s is calculated from the ion signals I at its mass spectral fragments i, taking into account the molar weight (MWs) and the ionization efficiency (IE) of the species, the volumetric sample flow Qv, Avogadro's number NA and a conversion factor of 1012:
The slower detection electronics of a Q-ACSM do not allow a direct measurement of the IE, but the response factor (RF) of the instrument is related to the IE through Avogadro's number NA, the molar mass MW, the flow Qcal and the electron multiplier gain Gcal:
Instead of determining the IEs for each species, it is more convenient to express the IEs relative to the IE of NO3 (IE) as the so-called relative ionization efficiency (RIEs) for each species:
Routinely, the ACSM is calibrated with NH4NO3 and (NH4)2SO4 to determine the RF, RIE and RIE. Whereas the RF is based on m∕z 30 and 46, the RIE and RIE are based on all ion signals of the species. In order to quantify the chloride mass properly, the ACSM is also calibrated with NH4Cl to determine the RIE_Chl′. While the standard RIEChl is based on all ion signals for chloride assigned in the standard fragmentation table, we firstly adapted the fragmentation table as described above for the calculation of the RIE_Chl′, meaning that the RIE_Chl′ is only based on the ion signals of frag_HCl and does not include frag_Cl. Details on the calculation of the RIEs can be found in Sect. S1 in the Supplement. Five calibrations over the course of 7 months (October 2018–April 2019) resulted in averages of RIE_Chl′ , RIE and RIE with RF A (µg m−3)−1. In general, the calibrated RIE values are lower than the default values commonly used in the ACSM. Notably, the RIE_Chl′ is significantly lower than the default value of 1.3. The ACSM is recommended to be routinely calibrated not only with NH4NO3 but also with (NH4)2SO4 because it has been shown that the RIE value can be quite different from the default value of 1.2 (Budisulistiorini et al., 2014; Crenn et al., 2015; Freney et al., 2019), as is also the case for this instrument.
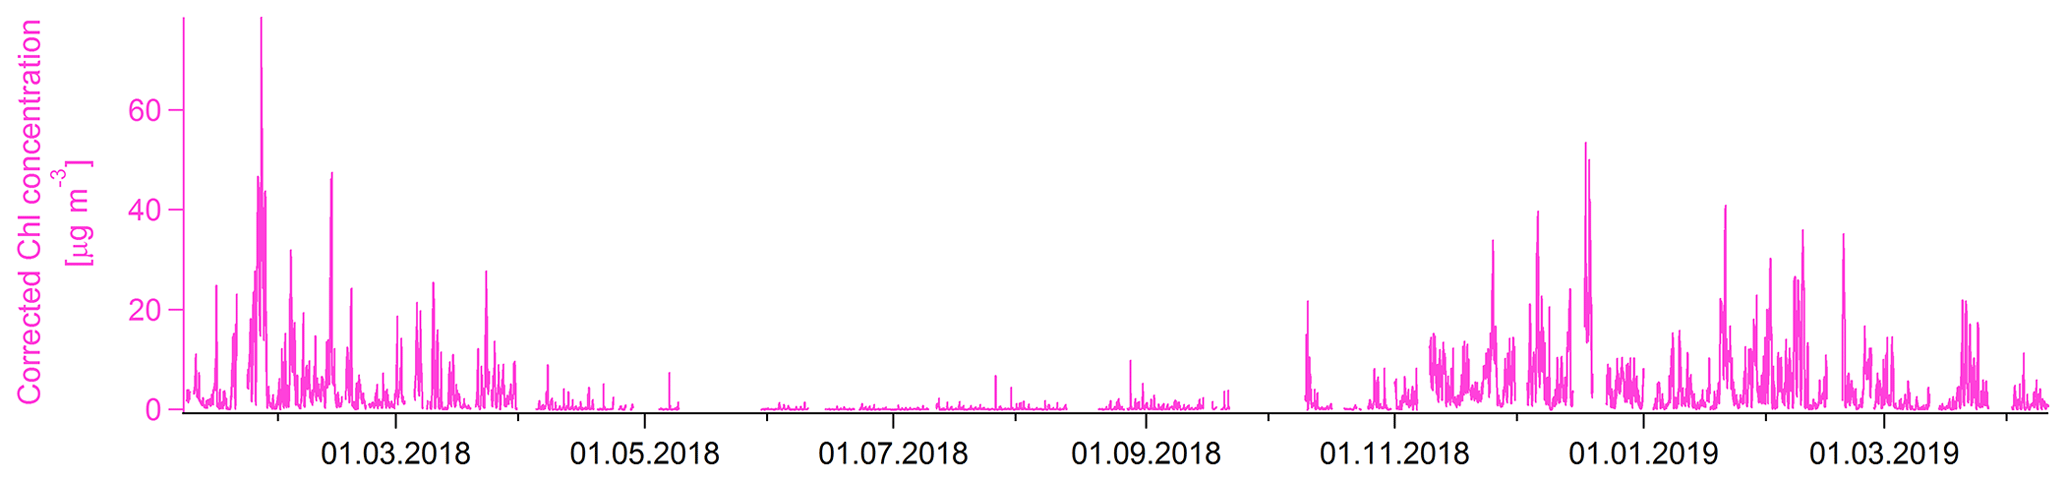
Figure 5Time series of chloride after recalculation based on fragmentation table adjustments and RIE_Chl′ derived from NH4Cl calibration.
The relation of m∕z 36 to the total chloride mass depends strongly on the chloride salt present, as discussed in Sect. 3.2. NH4Cl exhibits a prompt signal response at m∕z 36, whereas the NaCl and KCl signals build up more slowly. It still results in a slightly positive difference signal for those two chloride salts. However, the ratio of m∕z 36 to the total chloride mass will be different. Therefore, in the absence of a single dominant cation, quantification should be treated with care due to the effect of the salt-dependent vaporization kinetics on the m∕z 36 difference signal.
A comparison of the highly time-resolved chloride salt calibrations with ambient measurements, as well as the correlation of m∕z 36 with (R2=0.58), m∕z 23 with Na+ (R2=0.37) and m∕z 39 with K+ (R2=0.13, though possibly influenced by ions), suggests that NH4Cl was likely the dominant fine chloride species in the ambient aerosol in Krakow, Poland. The correlation of m∕z 36 and m∕z 58 (potentially NaCl+, R2=0.71) and m∕z 74 (potentially KCl+, R2=0.79) is high, though this is likely the result of a correlation of m∕z 36 with total organics (R2=0.60), which could produce ions at the same nominal m∕z (e.g., C3H6O+, and at m∕z 58, and , and C4H10O+ at m∕z 74) and which cannot be separated from metal halide ions with UMR data. Typical NaCl sources such as sea salt are unlikely (distance to sea >480 km). The salt mine southeast of Krakow is a potential source of chloride but only in the coarse mode. Biomass burning can be a source of KCl depending on the type of biomass material; however, conversion of KCl to KNO3 and K2SO4 in the atmosphere is likely (Li et al., 2016). Therefore, the application of the above-described correction of the fragmentation table and calibration should yield accurate quantification of chloride. Fig. 5 shows the corrected chloride time series. An average error of 26 % is estimated using the standard fragmentation table instead of the proposed correction and calibration for the time between 8 January and 15 February 2018 when positive chloride concentrations were reported with the standard fragmentation table and RIEChl (Fig. S4).
Time-of-flight instruments like the ToF-ACSM (Fröhlich et al., 2013) and ToF-AMS (Drewnick et al., 2005; DeCarlo et al., 2006) typically do not suffer from a negative m∕z 35 signal due to the different measurement technique of the detector (no scanning over the full mass range) even though similar vaporizer and ionizer configurations are used. However, one would expect to measure roughly 0 at m∕z 35 since the average value of the sample rise and the filter decay are about equal. Therefore, the calculation methodology presented here can provide a more accurate/repeatable quantification regardless of the instrument.
Apparent negative chloride concentrations were measured during a long-term campaign in Krakow, Poland, resulting from the slow vaporization of NH4Cl at m∕z 35 when using the standard ACSM fragmentation table. Highly time-resolved measurements of different chloride salts confirm a different behavior of 35Cl+ (m∕z 35) and H35Cl+ (m∕z 36). For m∕z 36, there is a prompt signal response, whereas m∕z 35 responds more slowly which may lead to a negative difference signal for that ion. The extent to which this happens can strongly depend on instrument history, tuning and alignment in the ionizer cage and is hard to predict. Even when an instrument is not apparently affected by a negative m∕z 35 signal, one should consider using the revised fragmentation table presented here for chloride quantification along with an instrument-specific RIE_Chl′ so that the total chloride mass is calculated only based on the m∕z 36 signal.
Q-ACSM users should consider modifying the fragmentation table and, when doing so, include NH4Cl in routine calibrations throughout the campaign. The RIE_Chl′ value of 0.41 presented here should be considered as a guide that is only valid for this particular instrument. We suggest that routine calibration with NH4Cl be utilized to determine this value for a particular instrument when a better quantification of chloride is desired. Future ACSM intercomparisons will provide an opportunity to study this issue in more detail.
The data presented in the text and figures and in the supplement will be available upon publication of the final paper (https://doi.org/10.5281/zenodo.3979037, Tobler et al., 2020b). Additional related data can be made available upon request.
The supplement related to this article is available online at: https://doi.org/10.5194/amt-13-5293-2020-supplement.
AKT and AS carried out the data collection and the instrument calibration. AKT analyzed the data and wrote the paper. ASHP, JGS, JN, KS and UB were involved with the supervision. ASHP, DSW, JGS, PC and UB assisted in the interpretation of the results. All coauthors contributed to the paper discussion and revision.
Philip Croteau was employed by Aerodyne Research Inc. when the experiments were conducted. The other authors declare that they have no conflict of interest.
We thank Leah R. Williams, Manjula R. Canagaratna and John T. Jayne for the discussion about technical details of the instrument and the agreement of the presented correction within other Aerodyne mass spectrometers.
This research has been supported by the EU Horizon 2020 Framework Programme via the ERA-PLANET project SMURBS (grant no. 689443), the COST action CA16109 Chemical On-Line cOmpoSition and Source Apportionment of fine aerosoLs (COLOSSAL) grant, the European Union's Horizon 2020 research and innovation program under the Marie Skłodowska-Curie grant agreement (grant no. 701647), the Swiss National Science Foundation (starting grant BSSGI0_155846), and the EU Project POWR.03.02.00-00-I004/16.
This paper was edited by Mingjin Tang and reviewed by three anonymous referees.
Allan, J. D., Delia, A. E., Coe, H., Bower, K. N., Alfarra, M. R., Jimenez, J. L., Middlebrook, A. M., Drewnick, F., Onasch, T. B., Canagaratna, M. R., Jayne, J. T., and Worsnop, D. R.: A generalised method for the extraction of chemically resolved mass spectra from aerodyne aerosol mass spectrometer data, J. Aerosol Sci., 35, 909–922, https://doi.org/10.1016/j.jaerosci.2004.02.007, 2004.
Budisulistiorini, S. H., Canagaratna, M. R., Croteau, P. L., Baumann, K., Edgerton, E. S., Kollman, M. S., Ng, N. L., Verma, V., Shaw, S. L., Knipping, E. M., Worsnop, D. R., Jayne, J. T., Weber, R. J., and Surratt, J. D.: Intercomparison of an Aerosol Chemical Speciation Monitor (ACSM) with ambient fine aerosol measurements in downtown Atlanta, Georgia, Atmos. Meas. Tech., 7, 1929–1941, https://doi.org/10.5194/amt-7-1929-2014, 2014.
Chang, S. and Allen, D. T.: Chlorine chemistry in urban atmospheres: Aerosol formation associated with anthropogenic chlorine emissions in southeast Texas, Atmos. Environ., 40, 512–523, https://doi.org/10.1016/j.atmosenv.2006.04.070, 2006.
Crenn, V., Sciare, J., Croteau, P. L., Verlhac, S., Fröhlich, R., Belis, C. A., Aas, W., Äijälä, M., Alastuey, A., Artiñano, B., Baisnée, D., Bonnaire, N., Bressi, M., Canagaratna, M., Canonaco, F., Carbone, C., Cavalli, F., Coz, E., Cubison, M. J., Esser-Gietl, J. K., Green, D. C., Gros, V., Heikkinen, L., Herrmann, H., Lunder, C., Minguillón, M. C., Močnik, G., O'Dowd, C. D., Ovadnevaite, J., Petit, J.-E., Petralia, E., Poulain, L., Priestman, M., Riffault, V., Ripoll, A., Sarda-Estève, R., Slowik, J. G., Setyan, A., Wiedensohler, A., Baltensperger, U., Prévôt, A. S. H., Jayne, J. T., and Favez, O.: ACTRIS ACSM intercomparison – Part 1: Reproducibility of concentration and fragment results from 13 individual Quadrupole Aerosol Chemical Speciation Monitors (Q-ACSM) and consistency with co-located instruments, Atmos. Meas. Tech., 8, 5063–5087, https://doi.org/10.5194/amt-8-5063-2015, 2015.
DeCarlo, P. F., Kimmel, J. R., Trimborn, A., Northway, M. J., Jayne, J. T., Aiken, A. C., Gonin, M., Fuhrer, K., Horvath, T., Docherty, K. S., Worsnop, D. R., and Jimenez, J. L.: Field-deployable, high-resolution, time-of-flight aerosol mass spectrometer, Anal. Chem., 78, 8281–8289, https://doi.org/10.1021/ac061249n, 2006.
Drewnick, F., Hings, S. S., DeCarlo, P., Jayne, J. T., Gonin, M., Fuhrer, K., Weimer, S., Jimenez, J. L., Demerjian, K. L., Borrmann, S., and Worsnop, D. R.: A new time-of-flight aerosol mass spectrometer (TOF-AMS) – Instrument description and first field deployment, Aerosol Sci. Tech., 39, 637–658, https://doi.org/10.1080/02786820500182040, 2005.
Drewnick, F., Diesch, J.-M., Faber, P., and Borrmann, S.: Aerosol mass spectrometry: particle–vaporizer interactions and their consequences for the measurements, Atmos. Meas. Tech., 8, 3811–3830, https://doi.org/10.5194/amt-8-3811-2015, 2015.
Freney, E., Zhang, Y. J., Croteau, P., Amodeo, T., Williams, L., Truong, F., Petit, J. E., Sciare, J., Sarda-Esteve, R., Bonnaire, N., Arumae, T., Aurela, M., Bougiatioti, A., Mihalopoulos, N., Coz, E., Artinano, B., Crenn, V., Elste, T., Heikkinen, L., Poulain, L., Wiedensohler, A., Herrmann, H., Priestman, M., Alastuey, A., Stavroulas, I., Tobler, A., Vasilescu, J., Zanca, N., Canagaratna, M., Carbone, C., Flentje, H., Green, D., Maasikmets, M., Marmureanu, L., Minguillon, M. C., Prevot, A. S. H., Gros, V., Jayne, J., and Favez, O.: The second ACTRIS inter-comparison (2016) for Aerosol Chemical Speciation Monitors (ACSM): Calibration protocols and instrument performance evaluations, Aerosol Sci. Tech., 53, 830–842, https://doi.org/10.1080/02786826.2019.1608901, 2019.
Fröhlich, R., Cubison, M. J., Slowik, J. G., Bukowiecki, N., Prévôt, A. S. H., Baltensperger, U., Schneider, J., Kimmel, J. R., Gonin, M., Rohner, U., Worsnop, D. R., and Jayne, J. T.: The ToF-ACSM: a portable aerosol chemical speciation monitor with TOFMS detection, Atmos. Meas. Tech., 6, 3225–3241, https://doi.org/10.5194/amt-6-3225-2013, 2013.
Fuzzi, S., Baltensperger, U., Carslaw, K., Decesari, S., Denier van der Gon, H., Facchini, M. C., Fowler, D., Koren, I., Langford, B., Lohmann, U., Nemitz, E., Pandis, S., Riipinen, I., Rudich, Y., Schaap, M., Slowik, J. G., Spracklen, D. V., Vignati, E., Wild, M., Williams, M., and Gilardoni, S.: Particulate matter, air quality and climate: lessons learned and future needs, Atmos. Chem. Phys., 15, 8217–8299, https://doi.org/10.5194/acp-15-8217-2015, 2015.
Gani, S., Bhandari, S., Seraj, S., Wang, D. S., Patel, K., Soni, P., Arub, Z., Habib, G., Hildebrandt Ruiz, L., and Apte, J. S.: Submicron aerosol composition in the world's most polluted megacity: the Delhi Aerosol Supersite study, Atmos. Chem. Phys., 19, 6843–6859, https://doi.org/10.5194/acp-19-6843-2019, 2019.
Hu, W., Campuzano-Jost, P., Day, D. A., Croteau, P., Canagaratna, M. R., Jayne, J. T., Worsnop, D. R., and Jimenez, J. L.: Evaluation of the new capture vapourizer for aerosol mass spectrometers (AMS) through laboratory studies of inorganic species, Atmos. Meas. Tech., 10, 2897–2921, https://doi.org/10.5194/amt-10-2897-2017, 2017.
Huffman, J. A., Jayne, J. T., Drewnick, F., Aiken, A. C., Onasch, T., Worsnop, D. R., and Jimenez, J. L.: Design, modeling, optimization, and experimental tests of a particle beam width probe for the aerodyne aerosol mass spectrometer, Aerosol Sci. Tech., 39, 1143–1163, https://doi.org/10.1080/02786820500423782, 2005.
Jayne, J. T., Leard, D. C., Zhang, X. F., Davidovits, P., Smith, K. A., Kolb, C. E., and Worsnop, D. R.: Development of an aerosol mass spectrometer for size and composition analysis of submicron particles, Aerosol Sci. Tech., 33, 49–70, https://doi.org/10.1080/027868200410840, 2000.
Jiang, Q., Sun, Y. L., Wang, Z., and Yin, Y.: Aerosol composition and sources during the Chinese Spring Festival: fireworks, secondary aerosol, and holiday effects, Atmos. Chem. Phys., 15, 6023–6034, https://doi.org/10.5194/acp-15-6023-2015, 2015.
Jimenez, J. L., Canagaratna, M. R., Donahue, N. M., Prevot, A. S., Zhang, Q., Kroll, J. H., DeCarlo, P. F., Allan, J. D., Coe, H., Ng, N. L., Aiken, A. C., Docherty, K. S., Ulbrich, I. M., Grieshop, A. P., Robinson, A. L., Duplissy, J., Smith, J. D., Wilson, K. R., Lanz, V. A., Hueglin, C., Sun, Y. L., Tian, J., Laaksonen, A., Raatikainen, T., Rautiainen, J., Vaattovaara, P., Ehn, M., Kulmala, M., Tomlinson, J. M., Collins, D. R., Cubison, M. J., Dunlea, E. J., Huffman, J. A., Onasch, T. B., Alfarra, M. R., Williams, P. I., Bower, K., Kondo, Y., Schneider, J., Drewnick, F., Borrmann, S., Weimer, S., Demerjian, K., Salcedo, D., Cottrell, L., Griffin, R., Takami, A., Miyoshi, T., Hatakeyama, S., Shimono, A., Sun, J. Y., Zhang, Y. M., Dzepina, K., Kimmel, J. R., Sueper, D., Jayne, J. T., Herndon, S. C., Trimborn, A. M., Williams, L. R., Wood, E. C., Middlebrook, A. M., Kolb, C. E., Baltensperger, U., and Worsnop, D. R.: Evolution of organic aerosols in the atmosphere, Science, 326, 1525–1529, https://doi.org/10.1126/science.1180353, 2009.
Le Breton, M., Hallquist, Å. M., Pathak, R. K., Simpson, D., Wang, Y., Johansson, J., Zheng, J., Yang, Y., Shang, D., Wang, H., Liu, Q., Chan, C., Wang, T., Bannan, T. J., Priestley, M., Percival, C. J., Shallcross, D. E., Lu, K., Guo, S., Hu, M., and Hallquist, M.: Chlorine oxidation of VOCs at a semi-rural site in Beijing: significant chlorine liberation from ClNO2 and subsequent gas- and particle-phase Cl–VOC production, Atmos. Chem. Phys., 18, 13013–13030, https://doi.org/10.5194/acp-18-13013-2018, 2018.
Li, W., Shao, L., Zhang, D., Ro, C.-U., Hu, M., Bi, X., Geng, H., Matsuki, A., Niu, H., and Chen, J.: A review of single aerosol particle studies in the atmosphere of East Asia: morphology, mixing state, source, and heterogeneous reactions, J. Clean. Prod., 112, 1330–1349, https://doi.org/10.1016/j.jclepro.2015.04.050, 2016.
Ng, N. L., Herndon, S. C., Trimborn, A., Canagaratna, M. R., Croteau, P. L., Onasch, T. B., Sueper, D., Worsnop, D. R., Zhang, Q., Sun, Y. L., and Jayne, J. T.: An Aerosol Chemical Speciation Monitor (ACSM) for routine monitoring of the composition and mass concentrations of ambient aerosol, Aerosol Sci. Tech., 45, 780–794, https://doi.org/10.1080/02786826.2011.560211, 2011.
Ovadnevaite, J., Ceburnis, D., Canagaratna, M., Berresheim, H., Bialek, J., Martucci, G., Worsnop, D. R., and O'Dowd, C.: On the effect of wind speed on submicron sea salt mass concentrations and source fluxes, J. Geophys. Res.-Atmos., 117, D16201, https://doi.org/10.1029/2011jd017379, 2012.
Pope, C. A. and Dockery, D. W.: Health effects of fine particulate air pollution: Lines that connect, J. Air Waste Manage., 56, 709–742, https://doi.org/10.1080/10473289.2006.10464485, 2006.
Thornton, J. A., Kercher, J. P., Riedel, T. P., Wagner, N. L., Cozic, J., Holloway, J. S., Dubé, W. P., Wolfe, G. M., Quinn, P. K., Middlebrook, A. M., Alexander, B., and Brown, S. S.: A large atomic chlorine source inferred from mid-continental reactive nitrogen chemistry, Nature, 464, 271–274, https://doi.org/10.1038/nature08905, 2010.
Tobler, A., Bhattu, D., Canonaco, F., Lalchandani, V., Shukla, A., Thamban, N., Mishra, S., Tiwari, S., Mocnik, G., Baltensperger, U., Tripathi, S. N., Slowik, J. G., and Prévôt , A. S. H.: Chemical characterization of PM2.5 and source apportionment of organic aerosol in New Delhi, India, submitted to Sci. Total Environ., 745, 140924, https://doi.org/10.1016/j.scitotenv.2020.140924, 2020a.
Tobler, A. K., Skiba, A., Wang, D. S., Croteau, P., Styszko, K., Nęcki, J., Baltensperger, U., Slowik, J. G., and Prévôt, A. S. H.: Improved chloride quantification in quadrupole aerosol chemical speciation monitors (Q-ACSMs) [Data set], Zenodo, https://doi.org/10.5281/zenodo.3979037, 2020b.
Wang, D. S. and Hildebrandt Ruiz, L.: Secondary organic aerosol from chlorine-initiated oxidation of isoprene, Atmos. Chem. Phys., 17, 13491–13508, https://doi.org/10.5194/acp-17-13491-2017, 2017.
Xu, W., Croteau, P., Williams, L., Canagaratna, M., Onasch, T., Cross, E., Zhang, X., Robinson, W., Worsnop, D., and Jayne, J.: Laboratory characterization of an aerosol chemical speciation monitor with PM2.5 measurement capability, Aerosol Sci. Tech., 51, 69–83, https://doi.org/10.1080/02786826.2016.1241859, 2017.
Yang, X., Wang, T., Xia, M., Gao, X., Li, Q., Zhang, N., Gao, Y., Lee, S., Wang, X., Xue, L., Yang, L., and Wang, W.: Abundance and origin of fine particulate chloride in continental China, Sci. Total Environ., 624, 1041–1051, https://doi.org/10.1016/j.scitotenv.2017.12.205, 2018.