the Creative Commons Attribution 4.0 License.
the Creative Commons Attribution 4.0 License.
 | 20 Oct 2020
Solar radiometer sensing of multi-year aerosol features over a tropical urban station: direct-Sun and inversion products
Katta Vijayakumar
Panuganti C. S. Devara
Sunil M. Sonbawne
David M. Giles
Brent N. Holben
Sarangam Vijaya Bhaskara Rao
Chalicheemalapalli K. Jayasankar
The AErosol RObotic NETwork (AERONET) is the most developed ground-based network for aerosol remote sensing and has been playing a significant role not only in monitoring air quality for protecting human health but also in assessing the radiative budget of our planet Earth. In this paper, we report the direct-Sun and inversion products, comprising of spectral variation of aerosol optical depth (AOD), associated Ångström exponent (AE), fine- and coarse-mode aerosol fractions, aerosol size distribution (ASD), refractive index (RI), asymmetry parameter (AP), single scattering albedo (SSA), aerosol radiative forcing (ARF) and columnar concentration of gas constituents such as water vapor (H2O), obtained from a Cimel Sun–sky radiometer, functioning in Pune, India, under the AERONET program since October 2004. These long-term measurements carried out from 2005 to 2015 could serve as an urban aerosol optical long-term average or climatology. The AOD long-term variations at all wavelengths, considered in the study, exhibited an increasing trend, implying year-to-year enhancement in aerosol loading. The mean seasonal variations in AOD from cloud-free days indicated greater values during the monsoon season, revealing dominance of hygroscopic aerosol particles over the station. Contribution by different aerosol types to AOD has also been deduced and discussed, and dominance of a mixed type of aerosols (44.85 %) found, followed by combination of biomass burning and urban industrial aerosols (22.57 %) compared to other types of aerosols during the study period. The long-term datasets, derived aerosol and trace gas products play a significant role in understanding aerosol climate forcing, trends and evaluation of regional air pollution and validation of aerosol transport models over the study region.
- Article
(16264 KB) - Full-text XML
-
Supplement
(770 KB) - BibTeX
- EndNote


Atmospheric aerosol concentration and optical properties are one of the largest sources of uncertainty in current assessments and predictions of global climatic change (Hansen et al., 2000; IPCC, 2001). Changes in the aerosol content of the atmosphere constitute a major forcing mechanism by affecting the radiative balance of the climate system (Crutzen and Andreae, 1990; Charlson et al., 1992). A thorough understanding of regionally dependent chemical and optical properties of aerosols (e.g., aerosol optical thickness, size distribution) and their spatial (both horizontal and vertical) and temporal distribution is required for accurate evaluation of aerosol effects in the climate system (Hsu et al., 2000). Systematic observational evidence is required to study the highly variable characteristics of atmospheric aerosols in time and space (IPCC, 2007). Added, long-term measurements of key aerosol optical properties are urgently needed to better understand the climate changes (Wang et al., 2001; Streets et al., 2009; Wild et al., 2009). Aerosol optical depth (AOD) data from the Advanced Very High-Resolution Radiometer (AVHRR) satellite were used to account for the dimming and brightening tendencies (Mishchenko et al., 2007a; Zhao et al., 2008). Long-term aerosol datasets with climate quality are essential in reducing the uncertainty of aerosol effects on climate. Hence, there is an immediate need to regularly monitor aerosol distributions annually and seasonally, and to find out if there is any significant trend in their changing patterns over the years and what effect they will ultimately have on the regional/global climate. Such results greatly help in better quantification of aerosol radiative effects, aerosol–climate interactions and impacts of aerosol loading on the Earth's biogeosphere.
Ground-based and space-borne optical remote sensing techniques are the most efficient means of studying aerosol particle parameters, properties, dynamics and lifetimes in the Earth's atmosphere due to local and global climate changes (King et al., 1999; Mishchenko et al., 2007b). The AErosol RObotic NETwork (AERONET; https://aeronet.gsfc.nasa.gov/, last access: 13 June 2019), a ground-based remote sensing aerosol network of well-calibrated Sun–sky radiometers established in the early 1990s, is one of the well-developed and productive facilities for passive aerosol measurements (Holben et al., 1998). Moreover, it is a well-established ground-based remote sensing aerosol monitoring network that is composed of more than 700 stations across the world. It provides standardized high-quality aerosol products (Xia, 2015), and the network continues to expand rapidly, which constitutes a valuable source of information for the establishment of local and regional aerosol characterizations (Holben et al., 2001). Further, AERONET provides continuous time series data with a very high temporal resolution for the measurement sites over many years. These datasets have been used to obtain aerosol particle properties as a function of time in atmosphere column over the place and for satellite data validation (e.g., Abdou et al., 2005; Kacenelenbogen et al., 2006; Sinyuk et al., 2007). Coordination between surface-based network observations and satellite measurements is essential to develop a long-term monitoring system of the Earth's aerosol environment. The present communication deals with such a long-term dataset composed of direct-Sun products, covering 2005–2015, archived at a site located in a tropical urban environment in central India.
Long-term aerosol data were acquired at a tropical urban site, Pune (18∘32′ N, 73∘51′ E; 559 m above mean sea level), India, as shown in Fig. 1. Pune is governed by the municipal corporation which comes under the Pune metropolitan region. Pune is the eighth largest metropolis in India and second largest in the state of Maharashtra (Source: https://pune.gov.in/, last access: 19 September 2020). It is situated on the lee side of the Western Ghats and is about 100 km inland from the west coast of India. In recent years, Pune has witnessed a substantial growth in terms of population as well as vehicular density and industrial installation due to rapid urbanization. The population of the Pune city is 31 32 143 as per the 2011 census (source: https://pmc.gov.in/en/census, last access: 19 September 2020). The city is situated centrally between the other metropolises of Mumbai and Bengaluru, and is well connected by road, rail and air. Observations were carried out on the terrace of the building at about 12 m above the surface. The site is surrounded by hillocks of variable height (up to 200 m), forming a valley-like terrain. The climate of the region is urban with a total rainfall of ∼700 mm occurring mostly during the monsoon season in the June–September period, and July is the wettest month of the year. The climatology of the area experiences four dominant seasons each year: pre-monsoon (March–May), monsoon (June–September), post-monsoon (October–November) and winter (December–February). The weather during the pre-monsoon season is very hot with mostly gusty surface winds, and the daytime temperature reaches over 40 ∘C. The air flow in the lower troposphere is predominantly westerly during the southwest (SW) monsoon season, which brings a large influx of moist air from the Arabian Sea. The westerly flow sets in during the post-monsoon season, and rich continental air masses pass over the region during this season. Fair-weather conditions, with clear skies and very low relative humidity, exist during the winter season. Low-level inversions during morning and evening hours, and dust haze during morning hours, occur during this season. More details can be found in Devara et al. (1994, 2005).
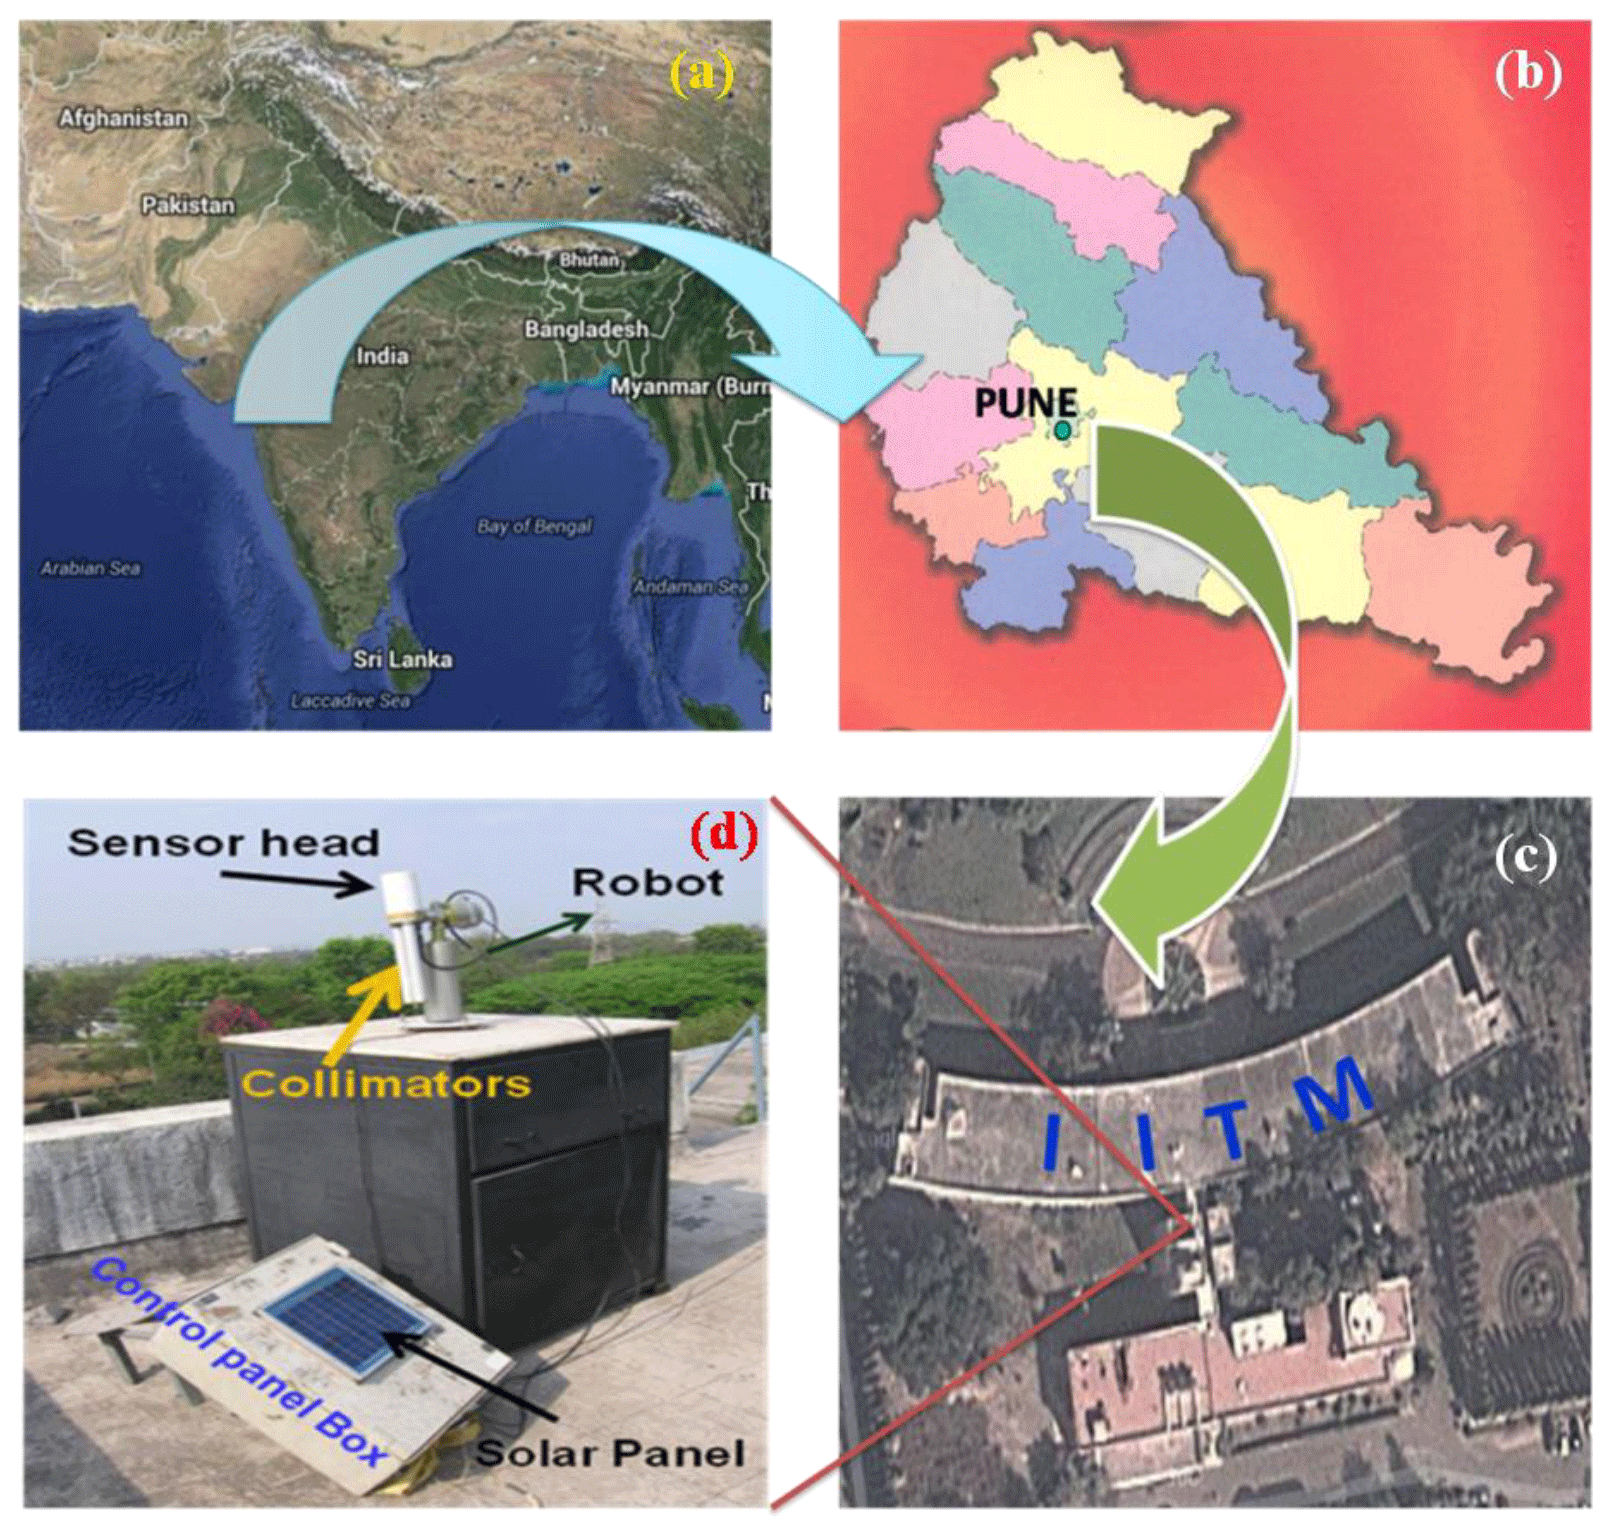
Figure 1Location of Cimel Sun–sky radiometer and its surroundings at the Indian Institute of Tropical Meteorology (IITM), Pune (18∘32′ N, 73∘51′ E; 559 m a.m.s.l.), Maharashtra State, India: (a, c) base map from © Google Earth, source: https://www.google.com/earth/, last access: 19 September 2020; (b) base map from © Google images of Maharashtra state map; (d) radiometer with mount and control panel box with solar panel at the top.
The meteorological key fields such as wind, temperature and humidity play a vital role in several stages of aerosol optical, microphysical and dynamical evolution. In order to examine these effects, European Centre for Medium-Range Weather Forecasts (ECMWF) daily reanalysis data for the study period are shown in Fig. 2 (Fig. 2a: winter; Fig. 2b: pre-monsoon; Fig. 2c: monsoon; Fig. 2d: post-monsoon and wind, air temperature and specific humidity (q) at 850 hPa pressure level, averaged over the Indian region). Winds are represented with arrows pointing toward wind direction, where length and orientation of each arrow define the magnitude (m s−1) and direction (∘), respectively. Line contours represent air temperature (∘C) and shaded color contours represent specific humidity ∕ water vapor mixing ratio (kg kg−1). It is evident from the figure that besides a large contrast between land and ocean regions, a significant seasonal variation in the above-mentioned parameters can be noted over the experimental site. Higher specific humidity values are evident over the Indo-Gangetic Plain and ocean regions during the monsoon season as compared to other three seasons. Highest moisture (q) values can be noted over the northern part of India during the monsoon season for the entire study period. In contrast, lowest q values can be seen over India during the winter season. The circulation was intense in and around India during the monsoon season as opposed to other seasons. However, anti-cyclonic circulation can be seen over India during winter and post-monsoon seasons, while the winds were mostly northwesterly during the pre-monsoon and southwesterly during the monsoon during the study period. This would further be accentuated by the absence of rainfall, so that the typical lifetime of aerosols is longer than ∼1 week in the lower troposphere. These features favor growth and intrusion of aerosol particles from longer distances to the study site, which result in greater AOD values during the monsoon season.
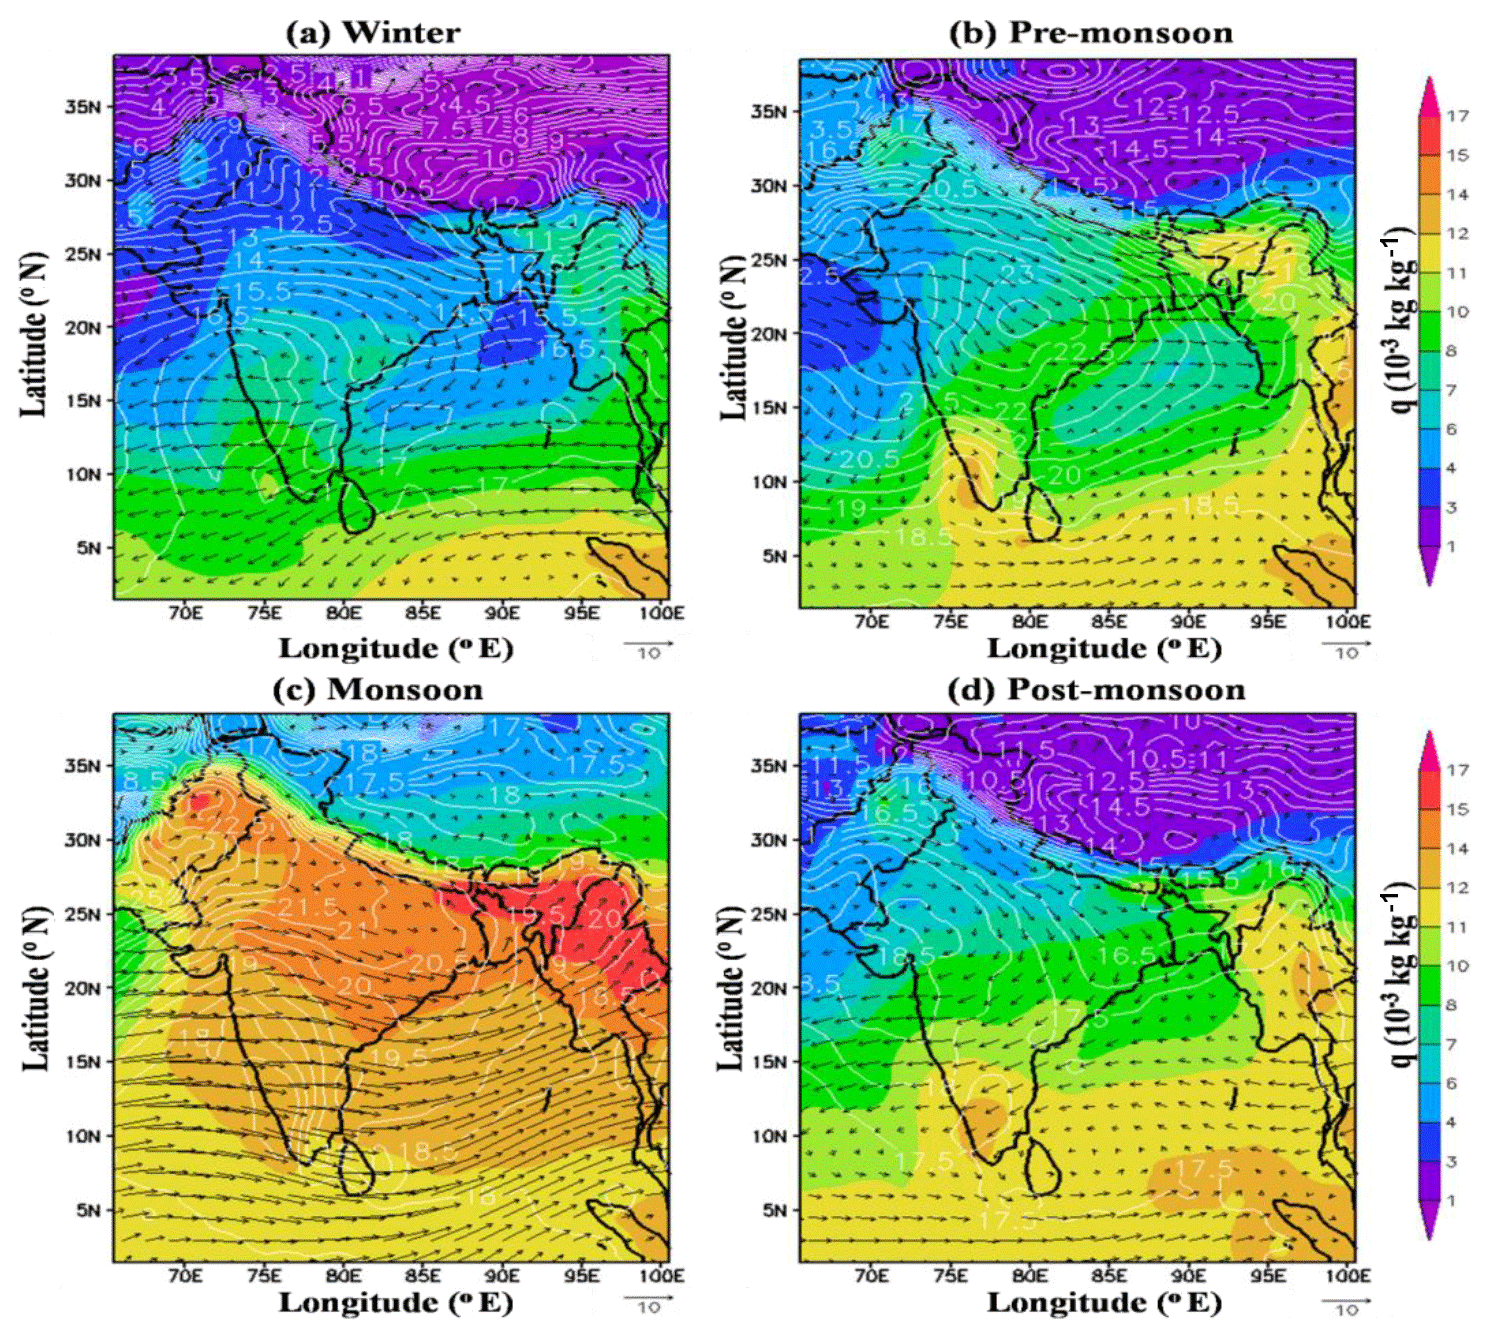
Figure 2Seasonal composite of ECMWF wind, temperature and humidity fields over India during 2005–2015.
4.1 AERONET
All the ground-based measurements reported in this paper were made with Cimel Electronique CE-318 Sun–sky radiometer, which is a part of the AERONET global network. This instrument works on the principle of measuring the solar radiation intensity at some specified wavelengths and converts them into optical depth by knowing the corresponding intensities at the top of the atmosphere (Holben et al., 1998). The Cimel Sun photometer is a solar-powered, hardy, robotically pointed Sun and sky spectral radiometer. A microprocessor computes the position of the Sun based on time, latitude and longitude, which directs the sensor head to within approximately 1∘ of the Sun, after which, a four-quadrant detector tracks the Sun precisely to a programmed measurement sequence. After the routine measurement is completed, the instrument returns to the “park” position, awaiting the next measurement sequence. A “wet sensor” exposed to precipitation will cancel any measurement sequence during rain events. Data in the memory of the Sun photometer are transferred to the PC and are sent to NASA for processing and archival of products. The columnar precipitable water content is determined based on the measurements at 940 nm (H2O absorption peak) and at 1020 nm (no absorption by water content). The details of the retrieval of water content and the types of errors involved in it can be found in the works of Schmid et al. (2001), Devara et al. (2001), Smirnov et al. (2004) and Alexandrov et al. (2009). The “Almucantar” scenario denotes a series of measurements taken at an elevation angle of the Sun for specific azimuth angles relative to the position of the Sun. These measurements are taken at 440, 675, 870 and 1020 nm channels. During Almucantar measurements, observations from a single channel are made in a sweep at a constant elevation angle across the solar disk and continue ±180∘ from the Sun in about 40 s. This is repeated for each channel to complete an almucantar sequence (Holben et al., 1998).
The calibration of the instrument was performed regularly at the Goddard Space Flight Center (GSFC) by a transfer of calibration from reference instruments that were calibrated by the Langley method at Mauna Loa Observatory (MLO), Hawaii. The combined effects of uncertainties in calibration, atmospheric pressure and total ozone amount (climatology is used) result in a total uncertainty in derived aerosol optical depth of ∼0.010–0.021, with the largest error in the UV (Eck et al., 1999). The AERONET algorithms compute the aerosol optical depth retrievals in near-real time (Holben et al., 1998). Data are quality checked and cloud screened following the methodology of Smirnov et al. (2000), which relies on the greater temporal variance of cloud optical depth vs. aerosol optical depth. The AERONET archive is divided into three quality levels: level 1.0 for raw data, level 1.5 for cloud-screened data and level 2.0 for quality-assured data (Holben et al., 1998; Smirnov et al., 2000) and can be downloaded from the AERONET website (https://aeronet.gsfc.nasa.gov/, last access: 13 June 2019). The AERONET data (from January 2005 to December 2015) used in this study belong to version 2.0 at level 2.0, which are cloud screened and have been manually screened, ensuring the data quality (Giles et al., 2019). A number of studies have already described the instrumentation, data acquisition, retrieval algorithms and calibration procedures, which conform to the standards of the AERONET global network, as well as the uncertainty in final products and the applied cloud-screening procedures (Holben et al., 1998, 2001; Eck et al., 1999; Smirnov et al., 2000, 2002a, 2002b). More details about AERONET instrument used in the present study in Pune, India, have been reported by Kumar et al. (2011).
4.2 Aerosol radiative forcing
In the present study, the aerosol radiative forcing (ARF) at bottom of the atmosphere (BOA), in the atmosphere (ATM) and at the top of the atmosphere (TOA) has been estimated by following the method reported by Xie et al. (2018). This method involves forcing calculations from broadband fluxes between 0.2 and 4.0 µm from aerosol size distribution (ASD), spectral AOD, single scattering albedo and phase function by using the radiative transfer module integrated in the AERONET inversions (García et al., 2008, 2012). In this method, the AERONET-defined RFTOA and RFBOA values have been directly used to calculate .
4.3 MODIS
The Moderate-resolution Imaging Spectroradiometer (MODIS) is a scientific instrument (radiometer) aboard the NASA Terra and Aqua satellite platforms. The Terra and Aqua satellite platforms were launched in 1999 and 2002, respectively, to study global dynamics of the Earth's atmosphere, land, ice and oceans. Thus, the instrument collects a variety of global datasets. The Terra and Aqua satellites, with MODIS instruments attached, fly on Sun-synchronous orbits at 705 km altitude and pass over the same spot of the Earth at about the same local time every day, i.e., 10:30 LT in the case of Terra and 13:30 LT for Aqua. Due to the large swath of data collected by MODIS (over 2300 km wide), it is possible to observe almost the entire Earth's surface every day. MODIS measures reflected solar and emitted thermal radiation in a total of 36 bands ranging in wavelength from 0.4 to 14.4 µm and at varying spatial resolutions (2 bands at 250 m, 5 bands at 500 m and 29 bands at 1 km). Detailed descriptions of the MODIS aerosol retrieval and its evolution since the start of MODIS operation are given in the work of Remer et al. (2005). In this study, the Deep Blue product of AOD at 550 nm and water vapor observations was used.
4.4 OMI
The Ozone Monitoring Instrument (OMI) measures the solar radiation backscattered by the Earth's atmosphere and surface over the entire wavelength range from 270 to 500 nm with a spectral resolution of about 0.5 nm. OMI measurements are highly synergistic with the other instruments on the Aura platform. The 114∘ viewing angle of the telescope corresponds to a 2600 km wide swath on the surface, which enables measurements with a daily global coverage. OMI continues the Total Ozone Mapping Spectrometer (TOMS) record for total ozone and other atmospheric parameters related to ozone chemistry and climate. Also, total columns of gases like NO2, BrO and SO2 will be derived. The US Environmental Protection Agency (EPA) has designated these atmospheric constituents as posing serious threats to human health and agricultural productivity. These measurements are made at near-urban-scale resolution and track industrial pollution and biomass burning. Furthermore, aerosol and cloud parameters will be determined from the OMI measurements. The OMI instrument is a contribution of the Netherlands's Agency for Aerospace Programs (NIVR) in collaboration with the Finnish Meteorological Institute (FMI) to the Aura mission. In this study, we used the OMAEROev003 product of AOD at 442 nm measurements for comparison with ground-based observations of AERONET data during the study period.
4.5 Heating rate
The amount of solar radiation trapped in the atmosphere by aerosols, as quantified by the atmospheric heating rate (HR; K d−1), has been analyzed. The HR due to aerosol absorption is calculated according to the first law of thermodynamics and assuming hydrostatic equilibrium, as suggested by Liou (2002):
where is the HR in K d−1, g is the acceleration due to gravity, Cp is the specific heat capacity of air at constant pressure (i.e., ∼1006 J kg−1 K−1), and ∇P is the atmospheric pressure difference between the surface and 3 km altitude, where most aerosols are present.
4.6 Discrimination of aerosol types
The discrimination of aerosol types increases accuracy of the assessment of the aerosol radiative impact and is therefore important to climate modeling (Diner et al., 1999). Previous studies showed that different aerosol types have different effects on climate because their diverse morphology, size distribution, hygroscopic properties and chemical components will lead to different aerosol optical properties (Giles et al., 2011, 2012; He et al., 2018; Kumar et al., 2018). For example, dust aerosols are often large particles and have a scattering tendency (Vijayakumar et al., 2014), whereas black carbon aerosols are usually smaller particles and have an absorbing nature (Tan et al., 2016). Various optical and microphysical parameters have been used for aerosol classification. The spectral dependence of AOD, expressed by the Ångström exponent (AE), is a good indicator of particle size. These two parameters are commonly used in aerosol remote sensing to infer dominant aerosol types given knowledge of the source region or typical aerosol transport mechanisms (Kaskaoutis et al., 2009; Pathak et al., 2012; Vijayakumar and Devara, 2013; Verma et al., 2015). Gobbi et al. (2007) used this parameter and its spectral curvature to propose a graphical method for evaluating the contribution of fine-mode particles to AOD and to track mixture of pollution containing dust. Schuster et al. (2006) determined that variation in AE wavelength pairs is sensitive to aerosol composition. In addition, the spectral AOD and AE data were used in deriving the curvatures (a1 and a2) correlated with AOD and can be effectively used for discriminating different aerosol types (Vijayakumar et al., 2012; Kumar et al., 2013) information content from these relationships varies from generic identification of major aerosol particle types (e.g., dust mixed and urban industrial pollution) to specific degrees of absorbing aerosols. In the Indian subcontinent, Kaskaoutis et al. (2009) have made the first attempt to distinguish different aerosol types originating from variety of sources over Hyderabad. Furthermore, Vijayakumar et al. (2012) over Pune and Vijayakumar and Devara (2013) over Sinhagad have discriminated different aerosol types over different regions in the Indian land mass.
For the classification of aerosols into specific types, some “appropriate” threshold values are required. Our approach to infer major aerosol types is based on the combination of particle size and absorption–scattering information, following Kaskaoutis et al. (2009), Vijayakumar et al. (2014) and Lee et al. (2010). The AOD–AE patterns have been utilized to describe different aerosol types (e.g., clean maritime, continental clean, desert dust, urban industrial/biomass burning and mixed-type aerosol). In this study, we used AOD at 440 nm and an Ångström exponent of 440–870 nm. The threshold values used in this study represented a slight adjustment from those previously used by authors, as cited above. Cases of AOD440 nm<0.2 with AE440−870 nm values of small (<0.9) or large (>1.0) represented clean maritime-influenced aerosols (CM) and continental clean type represented as background aerosols (CC), respectively. AOD440 nm>0.3 and can be used to characterize long-range-transported biomass burning/urban industrial aerosols (BB/UI) and AOD440 nm values >0.6 associated with AE440−870 nm values <0.7 are indicative of desert dust (DD) particles transported over oceanic areas. Finally, the aerosols which do not fall under any of the above categories (types) are considered as mixed aerosol type (MA), considering different effects of aerosol-mixing processes in the atmosphere (e.g., coagulation, condensation, humidification, gas-to-particle conversion). The classification method (AOD440 nm vs. AE440−870 nm) is illustrated in Fig. 3a.
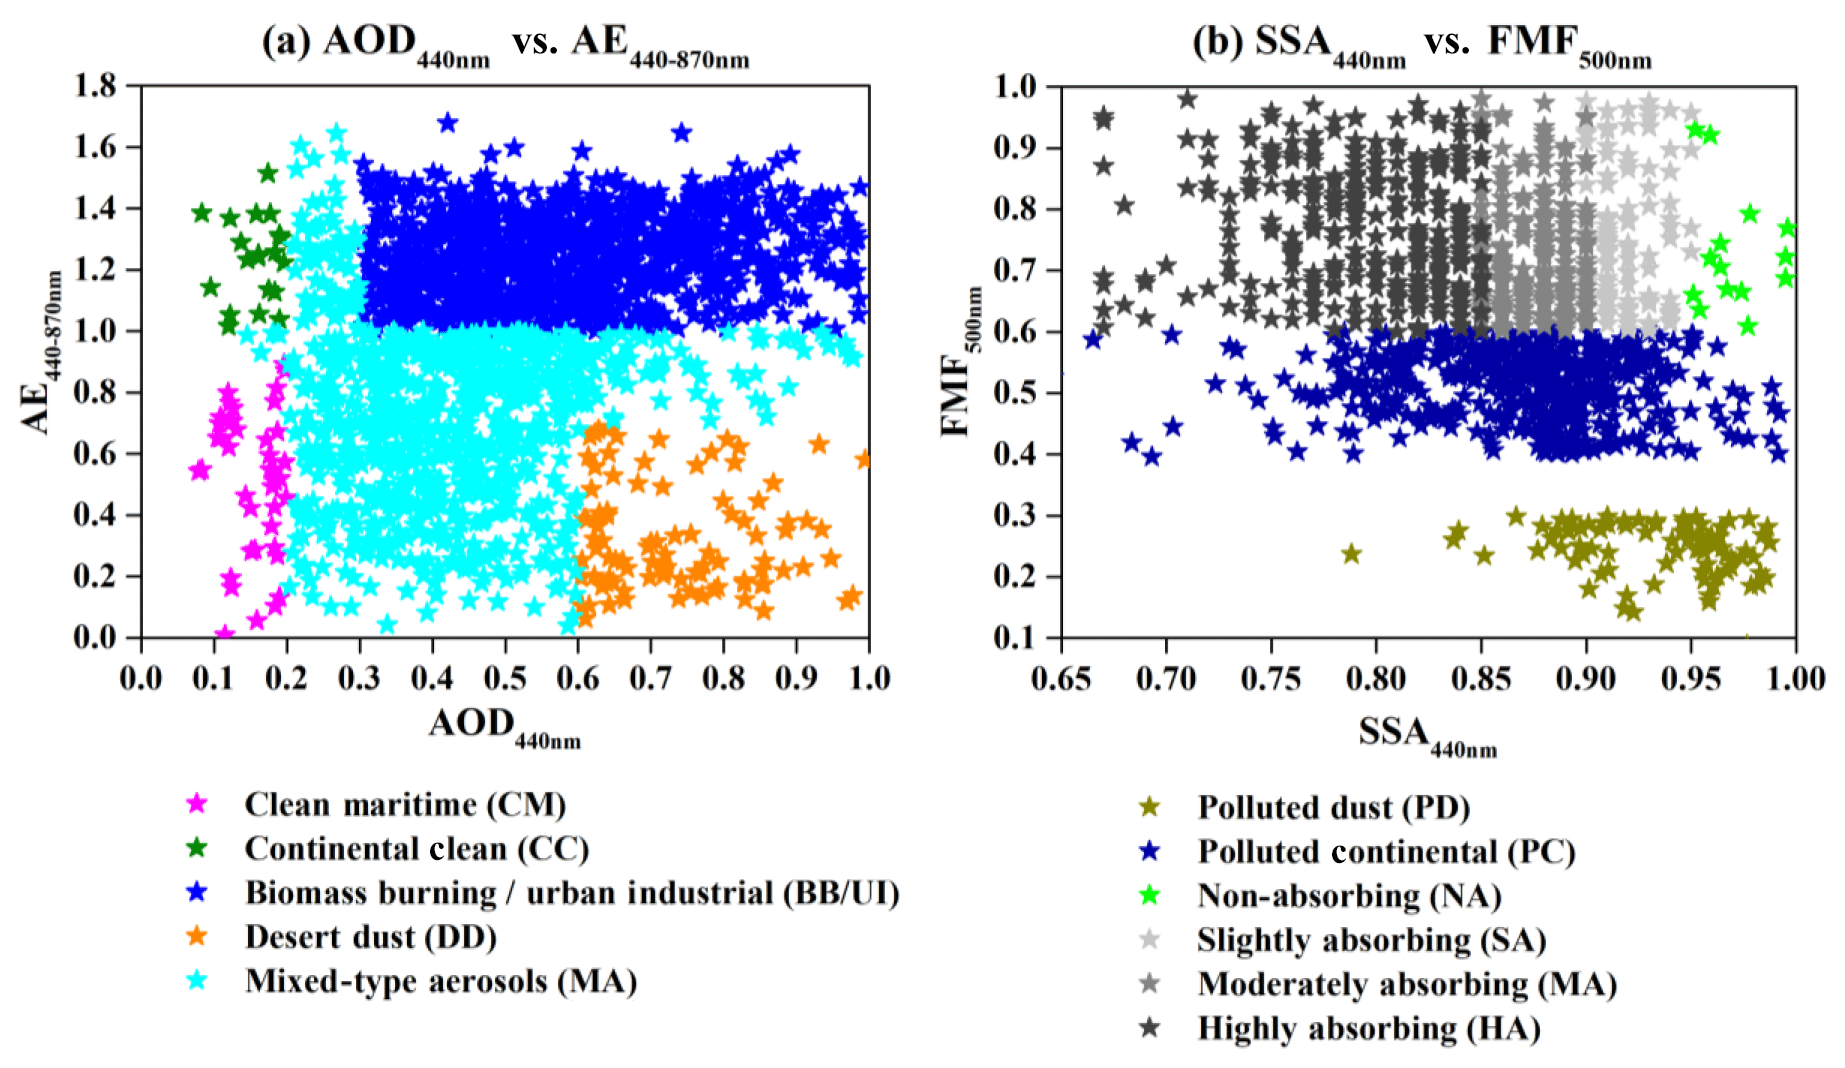
Figure 3Classification of aerosol types based on different thresholds of (a) AOD440 nm vs. AE440−870 nm and (b) SSA440 nm vs. FMF500 nm.
The Cimel Sun–sky radiometer derived fine-mode fraction (FMF) at 500 nm has been used to represent the dominant aerosol size mode, because FMF provides quantitative information for both fine- and coarse-mode aerosols. SSA has been used to quantify the aerosol absorption–scattering at 440 nm, which is the shortest wavelength of AERONET channels and generally used to distinguish absorbing from non-absorbing aerosols (Lee et al., 2010). The categories of aerosol types are distinguished between FMF500 nm and SSA440 nm is polluted dust (PD, dominantly dust with anthropogenic aerosols), polluted continental (PC, dominantly anthropogenic mixed with dust), absorbing and non-absorbing aerosols. The threshold values of groups are as follows: (i) FMF500 nm<0.4 for any range of SSA440 nm indicates predominantly coarse-mode aerosols and hence is assigned to PD, (ii) introducing a safety margin of 0.4 between fine- and coarse-mode aerosol, for any range of SSA440 nm represented PC. All FMF500 nm>0.6 were considered as fine-mode aerosols which were further discriminated as absorbing (mainly black carbon, BC) or non-absorbing depending on values of SSA440. (iii) FMF500 nm>0.6 with SSA440 nm>0.95 as non-absorbing (NA, which includes sulfates, nitrates and aged water-soluble organic carbons), (iv) FMF500 nm>0.6, as slightly absorbing (SA), (v) FMF500 nm>0.6, as moderately absorbing (MA), whereas (vi) FMF500 nm>0.6 with SSA440 nm≤0.85 represented highly absorbing (HA) fine-mode aerosols. It should be noted that this classification must be considered only qualitatively not quantitatively, since the percentages may be strongly modified with a change in the AOD440 nm, AE440−870 nm, FMF500 nm and SSA440 nm threshold values. The method of classification (SSA440 nm vs. FMF500 nm) is illustrated in Fig. 3b.
When making ground-based observations at single point, it is important to know their representativeness for the region under consideration. Long-term monitoring of aerosol optical properties over Pune AERONET site was performed, on all non-rainy days, from January 2005 to December 2015. The distribution of the number of observations in each month during the study period (one decade) is shown in a bar diagram (Fig. 4). The month-to-month variation in number of observation days and data gaps in the data series are due to unfavorable sky conditions over the study site and due to shipment of the instrument for calibration at GSFC, NASA (USA).

Figure 4Month-wise distribution of observation days during the study period from January 2005 to December 2015.
5.1 Composite average of aerosol properties
5.1.1 AOD
Aerosols originating from differing source regions are likely to have significant differences in their optical properties. However, regional distribution of aerosols, their interannual variability and detailed description of spectral aerosol optical properties are needed to understand the influence of aerosols on the climate of the study region (Eck et al., 2001). The optical properties of aerosols over Pune (one of the rapidly growing cities) show strong seasonal and interannual variations. Aerosol characteristics vary with time and region because of its different aerosol sources (e.g., aerosol types and emission intensity) and different atmospheric conditions (e.g., relative humidity and boundary layer height etc.). The Cimel Sun–sky radiometer of AERONET, used in the present study, provides the column-integrated aerosol optical depth at different wavelengths. Such columnar optical depth is appropriate for most of the radiative forcing assessments. Figure 5 depicts the composite picture of spectral variation of AOD for the entire observation period from January 2005 to December 2015. While the maximum AOD value is 0.52 at 440 nm and the minimum value is 0.28 at 1020 nm, it shows strict wavelength dependence (higher AOD at shorter wavelength, and vice versa).
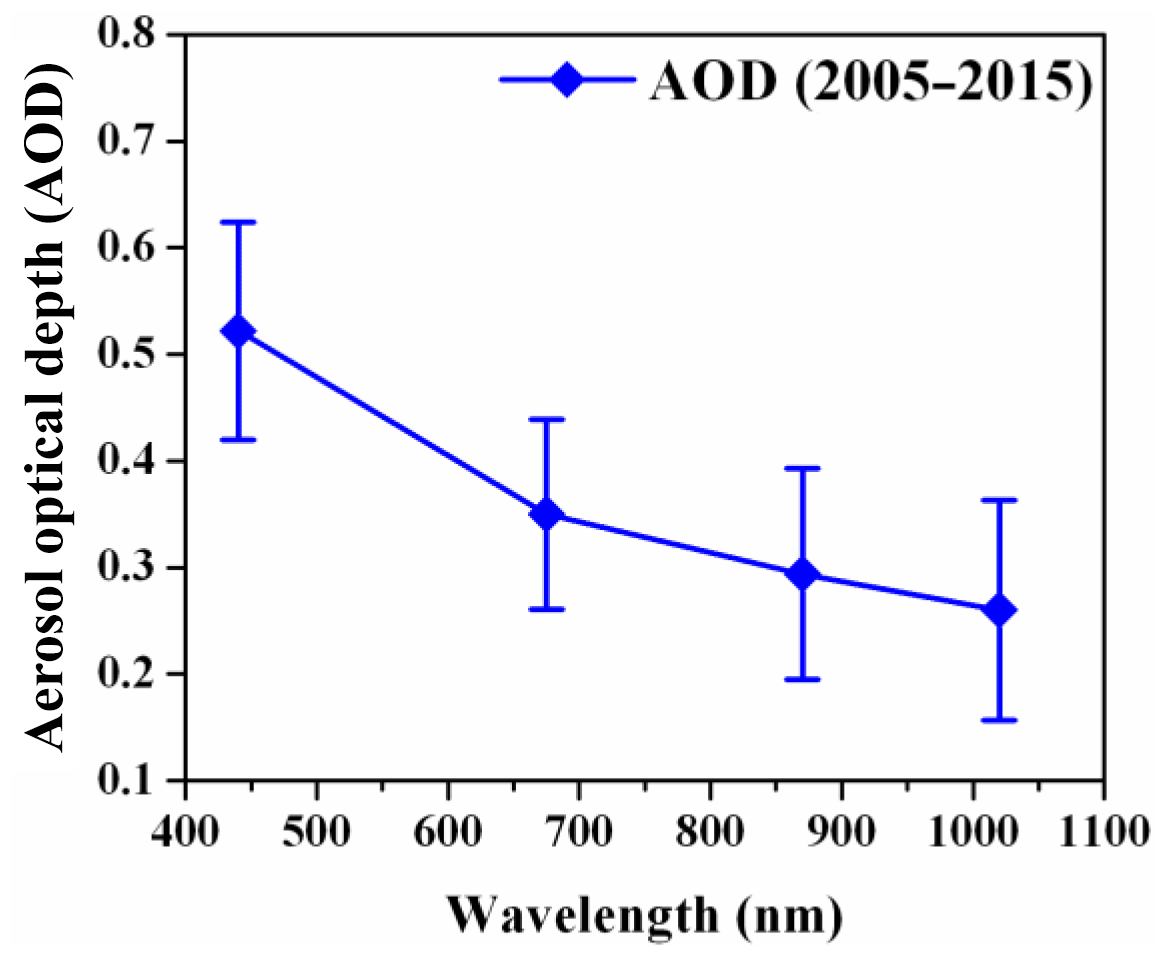
Figure 5Composite spectral AOD variations from one-decade Cimel measurements in Pune, India. The vertical bar at each data point represents the standard deviation from the mean.
5.1.2 ASD
The size distribution of aerosols is an important parameter in understanding their climate effect. The worldwide aerosol size distribution exhibits two distinct modes: fine particles with particle size <0.6 µm and coarse with particles size >0.6 µm (Dubovik et al., 2002). Thus, the fine and coarse modes can be separated by a radius of ∼0.6 µm. The bimodal structure of volume size distribution may be due to various reasons, such as mixing of two air masses with different aerosol populations (Hoppel et al., 1985), homogeneous heteromolecular nucleation of new fine particles in the air or heterogeneous nucleation and growth of large particles by condensation of gas-phase products. The AERONET aerosol size distributions are retrieved from the spectral Sun photometer using 22 radius size bins in the size range of 0.05–15 µm. Figure 6 shows the composite volume size distribution of aerosols over Pune. Here, rmin and rmax show the range of radii for corresponding modes. The value of volume size distribution in coarse mode is higher compared to fine mode likely due to atmospheric elements.

5.2 Seasonal average of aerosol properties
In order to obtain a holistic view of the regional aerosol characteristics during the period of study, the seasonal variations in aerosol quantities are grouped and shown in Fig. 7. The different panels in the figure display variations in different aerosol products. Different panels in this figure indicate variations in aerosol optical depth (Fig. 7a); water vapor (Fig. 7b); Ångström exponent (Fig. 7c); total, fine-mode and coarse-mode fractions (Fig. 7d); aerosol size distribution (Fig. 7e); single scattering albedo (Fig. 7f); asymmetry factor (Fig. 7g); aerosol refractive index, real (Fig. 7h); refractive index, imaginary (Fig. 7i); effective radius (Fig. 7j); and volume-weighted mean radius (Fig. 7k).

Figure 7a displays the seasonal variation of AOD at different wavelengths. At all wavelengths, AODs show lower values in the winter season, which could be due to strong inversions, and whatever aerosols due to various human activities (domestic cooking, vehicular and industrial emissions, etc.) are let out into the surface layer get trapped in the lower atmosphere due to less ventilation.
Also, due to calm wind conditions, aerosols of soil-dust type are less common during winter. In the pre-monsoon, the greater AOD values be attributed to the increased concentration of continental aerosol loading due to higher temperatures in the study region. Moreover, processes such as long-range transport are decreasing from winter to pre-monsoon which may be associated with air masses consisting of dust from west of the Arabian Sea (Devara et al., 2002; Kumar et al., 2011). In addition, Vijayakumar and Devara (2012) reported that the anthropogenic aerosols are abundant in the pre-monsoon season could also be due to festive celebrations. In India, a festival called “Holi” is celebrated every year during the pre-monsoon season. More popularly, this festival is also known as the “Festival of Colors”. During this festival, people play with colored powder and paste. The associated Holika Dahan (fire burning) activities will enhance the particle concentration and alter chemistry of the local environment. Higher aerosol loading during the monsoon period at all wavelengths was noticed in the present study due to paucity of useful data points and prevalence of turbid atmospheric conditions.
Figure 7b shows the seasonal variation in water vapor. The monthly mean values of the water vapor varied from 1.39 to 3.98 cm, representing a minimum value in January (1.39±0.27) and maximum in July (3.98±0.23). It is observed that water vapor is lower during the months of January and February. It starts increasing from March with the onset of the hot summer season and reaches a maximum during the months of the southwest monsoon season (June–September). However, the number of days of observations during June–September is lower because of a smaller number of clear-sky/partly clear-sky days. Therefore, the relative magnitude of water vapor during these 4 months could be partly due to sampling bias. However, the average value of water vapor during the monsoon season is still significantly higher when compared to other seasons. Water vapor starts decreasing once the monsoon season ends in September. Lower values are observed in winter, slightly increasing up to monsoon season, and thereafter water vapor decreases due to monsoon rains and decreased aerosol input due to colder ground surface. The lower possibility of hygroscopic growth of aerosols due to low water vapor content may also contribute to this. On a seasonal scale, the increase water vapor from the winter (December–February) to the pre-monsoon (March–May) season is about 39.72 % and from the pre-monsoon to monsoon (June–September) seasons is as high as 80.95 %.
Figure 7c illustrates the mean seasonal variation in Ångström exponent. The Ångström exponent (α440−870) is determined from the spectral dependence of the measured optical depth and is a measure of the relative dominance of fine (submicrometer) aerosols over the coarse (micrometer-size) aerosols (Kumar et al., 2011) as shown in Fig. 7d. Higher values of α indicate the dominance of fine particles, whereas lower values indicate the dominance of coarse particles and relatively less concentration of fine particles. It is expected that when the aerosol particles are very small, on the order of air molecules, α440−870 should approach 4, and it should approach 0 for very large particles (Holben et al., 2001). The decrease of α from winter to pre-monsoon and monsoon months is indicative of increased coarse-mode particle contribution, consistent with dust particles (>10 µm) in the aerosol loading. This strong decrease in the α440−870 value could be due to mixing of air originating from oceanic and desert regions. The notable lower values of the Ångström exponent during June–September are ascribed to cloud contamination of data retrievals caused by thin invisible cirrus (Chew et al., 2011; Huang et al., 2012).
Figure 7e portrays mean seasonal variation in aerosol size distribution. It is clear from the figure that during the monsoon season, coarse-mode volume concentration is higher than the fine mode, which suggests that there is dominance of coarse-mode aerosol particles over the site due to the monsoon activities that start during this season and also due to local meteorological conditions, land-surface and long-range transport processes. Tripathi et al. (2005) found that there was an increase of 50 % in volume concentration in coarse mode over the Indian region during the monsoon season. On the other hand, there is a very small variation in mean radius of fine-mode aerosol particles in comparison to coarse mode during post-monsoon and winter seasons, which suggest that there may be different types of sources of coarse-mode particles. The errors associated with the particle retrieval in the size range ( µm) do not exceed 10 % in the maxima of the size distribution and may increase up to about 35 % for the points corresponding to the minimum values of dV(r)∕dln r in this size range (Dubovik et al., 2002).
Figure 7f depicts the seasonal dependence of single scattering albedo (SSA) during different seasons. SSA is calculated from the scattering optical thickness which is obtained from the normalized aerosol phase function using diffuse radiance measured at different angles. The detailed method of determining the SSA was given by Dubovik et al. (1998). SSA has nearly a unit value for purely scattering aerosols (e.g., sulfate aerosols) and has low value for strongly absorbing aerosols (e.g., black carbon and/or mineral dust). The mean seasonal variation of SSA at different wavelengths during the study period shows increase in SSA from winter to monsoon due to the dominance of anthropogenic aerosols in the atmosphere. It can also be seen that during post-monsoon and winter seasons, SSA decreases with wavelength due to dominance of absorbing aerosols over the experimental site, which is attributed to presence of a mixture of aerosols from multiple sources like vehicular and industrial pollution, and biomass burning in the field. But in the pre-monsoon season, SSA values are slightly higher at 1020 nm, compared to 440 nm. This suggests that the dominance of dust and marine events, thus enhancement in the scattering contribution of coarse particle. The atmosphere contains more water-soluble particles, in conditions like those found by Singh et al. (2004) in Kanpur, India. In addition, for locations closer to the ocean, the air is more humid during summer, leading to enhanced water uptake of the water-soluble particles fraction. But from monsoon to post-monsoon, the SSA values are slightly low, which suggests a possible combination of urban industrial particles and sea salt aerosols over the region.
Figure 7g depicts the seasonal dependence of the asymmetry parameter (AP) during different seasons. Theoretically, the range of AP lies between −1 (for the backward scattered radiation) and +1 (for the forward scattered radiation). However, the zero value represents symmetric scattering. There is relatively little variation in AP among these four seasons at shorter wavelengths (440 nm), while AP was larger at 440 nm in the monsoon season compared to other wavelengths (675, 870 and 1020 nm). The greater relative contribution of coarse-mode particles to the aerosol size distribution might have resulted in a phase function shift toward greater forward scattering at the longer (infrared) wavelengths and very little change in the shorter (visible) wavelength. The AP is also wavelength dependent and varies from 0.71±0.01 to 0.65±0.04 during the whole period.
Figure 7h–i depict the wavelength dependence of real and imaginary parts of refractive index (RI), respectively, during different seasons. The refractive index is a complex quantity, expressed in terms of real n(λ) and imaginary k(λ) parts, which provide an indication of highly scattering or highly absorbing types of aerosols, with higher n(λ) values corresponding to the scattering type and higher k(λ) values corresponding to the absorbing type (Sinyuk et al., 2003). Real and imaginary parts, n(λ) and k(λ), are not independent of SSA and the retrieved size distribution of the aerosols in the region, but some differences in trends may be observed because of the presence of different types of aerosols (Dubovik et al., 2002). The useful information about the RI comes from aureole radiance, which is strongly affected by errors in the angle-pointing bias. The errors are estimated to be 30 %–50 % for the imaginary part and ±0.04 for the real part of the RI (Dubovik et al., 2002). These estimated errors are for high aerosol loading (AOD440 nm≥0.5) at a solar zenith angle >50∘.
The seasonal variation of real part of RI shows increase in the real part of values with an increase in wavelength, while n(λ) is highest (>1.52) at all wavelengths during the pre-monsoon season in the years 2005–2015, showing the higher scattering optical state of the atmosphere during this period. This is also supported by the higher SSA in the years 2005–2015. However, lower n(λ) values during the post-monsoon season could probably be associated with higher relative humidity and resultant hygroscopic growth, similar to the conditions found over Goddard Space Flight Center (Dubovik et al., 2002). During the pre-monsoon season, n(λ) values at higher wavelengths are close to the n(λ) values of dust (1.53) found from several models (WMO, 1983; Koepke et al., 1997), clearly indicating the contribution of dust to the optical properties. However, n(λ) during the monsoon and winter seasons has intermediate values. The lowest value in post-monsoon is due to the anthropogenic activities. The real part of refractive index of dust aerosol is usually greater than that of the anthropogenic aerosols (Alam et al., 2011).
The imaginary value is found to be higher in winter and lower in the monsoon season, with higher values relating to absorbing anthropogenic aerosols and the lower values to dust aerosols. The imaginary part is highest during December, which shows that anthropogenic aerosols are dominant during this period. The higher imaginary part values at the two shortest wavelengths (440 and 670 nm) are attributed to the absorption of organic carbon/black carbon (Arola et al., 2011). On the contrary, the imaginary part values are lower in the monsoon season. This suggests that dust aerosols are dominant during the monsoon season, similar to the conditions found in the Kanpur region, India (Singh et al., 2004).
Figure 7j–k indicate seasonal variation in effective radius (Reff) and volume-weighted mean radius (Rv), respectively. Effective radius (Reff) is quite representative of the optical properties of coarse-mode particles, whereas for fine particles, volume-weighted mean radius (Rv) is the more appropriate parameter (Tanré et al., 2001). Reff is found to be higher during the pre-monsoon and monsoon seasons. The high values in Reff during the monsoon season are attributed to the abundant transport of aerosols of natural origin and also the surface-level anthropogenic aerosols, which increases the loading of coarse-mode particles (Vijayakumar et al., 2012). The increase and decrease in Reff during post-monsoon and winter seasons, respectively, are interesting. Although no significant coarse-mode particle loading takes place during the post-monsoon season and the hygroscopic growth of these particles is unlikely, the effective radius of coarse-mode particles may increase if the fine-mode particles get attached to the surface of the coarse-mode particles. However, Reff has not been found to increase significantly, because it is more influenced by the number concentration compared to the volume concentration. The increase in Rv is attributed to the hygroscopic growth of the fine-mode particles. The seasonal variability in coarse-mode particles (Reff) is found to be greater than that of fine-mode particles (Rv) with a maximum during the monsoon season due to changes in circulation, land-surface and long-range transport processes.
5.3 Seasonal variation in aerosol types
Figure 8 shows the pie diagram of different aerosol types over Pune using above threshold values. The analysis reveals that the mixed-type (MT) aerosols clearly dominates in the pre-monsoon (47.07 %) and monsoon (56.82 %) seasons and in some fractions (40.55 %, 39.97 %) during winter and post-monsoon seasons, while the BB/UI type exhibits its highest presence during the post-monsoon (31.55 %) and more rarely (5.18 %) in the monsoon season. It is interesting to note that CM aerosols are absent during the post-monsoon period. Polluted continental aerosols are dominant in the pre-monsoon (16.04 %), compared to the monsoon (8.46 %) and post-monsoon (6.64 %) seasons due to rainout/washout effects.
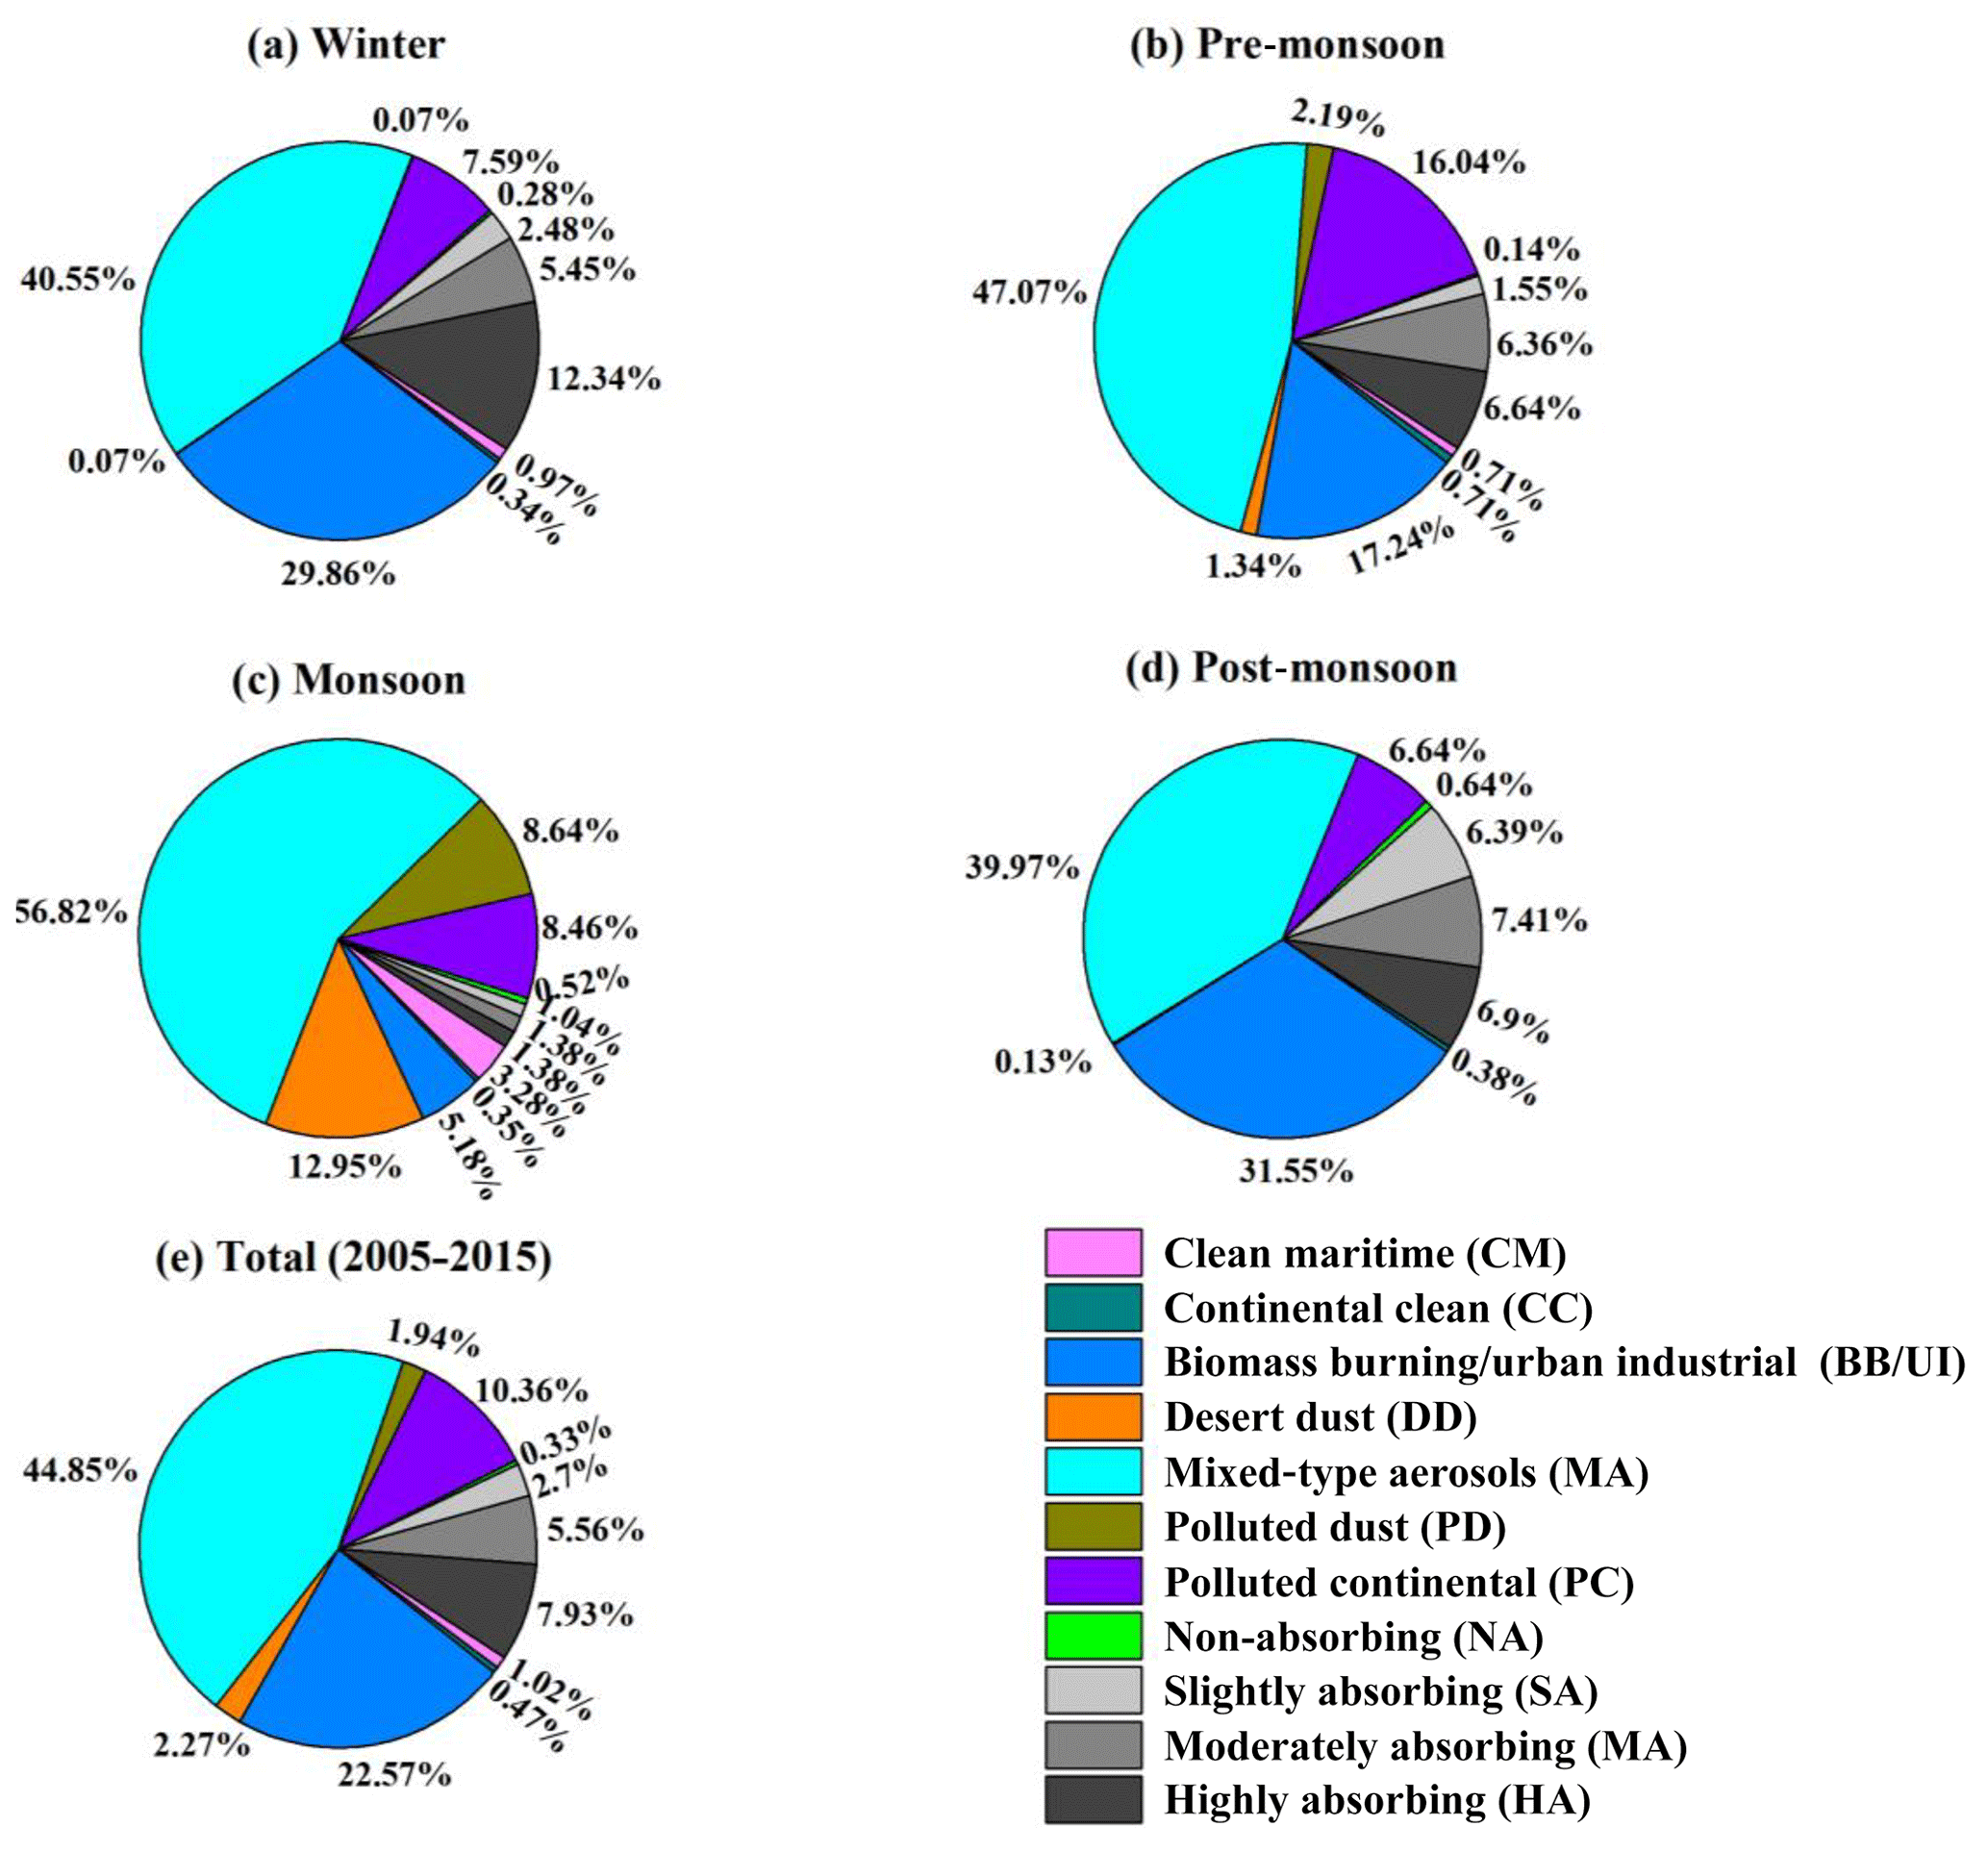
Figure 8Average proportion of different aerosol types in (a) winter, (b) pre-monsoon, (c) monsoon and (d) post-monsoon seasons, and (e) their total (2005–2015).
The absorbing aerosols have much lower contribution in the monsoon season. Overall, the MT (44.85 %) aerosols are dominant compared to other types of aerosols over study region. Furthermore, the total contribution of various types of aerosols is as follows: CM (1.02 %), CC (0.47 %), BB/UI (22.57 %), DD (2.27 %), PD (1.94 %), PC (10.36 %), SA (2.7 %), MA (5.56 %), HA (7.93 %) and NA (0.33 %). However, it should be noted that the present fractions may be considered rather qualitatively and not quantitatively, since they correspond to specific threshold values, while an alteration in the thresholds would cause changes in the fractions but not in the general pattern of the seasonal distribution of aerosol types. A comparison of the present results of Pune with those obtained from similar analyses performed over other locations on the globe is not an easy task due to different land-use and environmental characteristics as well as differences in the time periods of the observations and in the seasonal pattern of the air masses and long-range transport, the specific influence of anthropogenic pollution, etc. The aerosol types inferred from the present study are compared with those obtained from other Indian sites in Table 1.
Table 1Comparison of aerosol types at different stations in India.
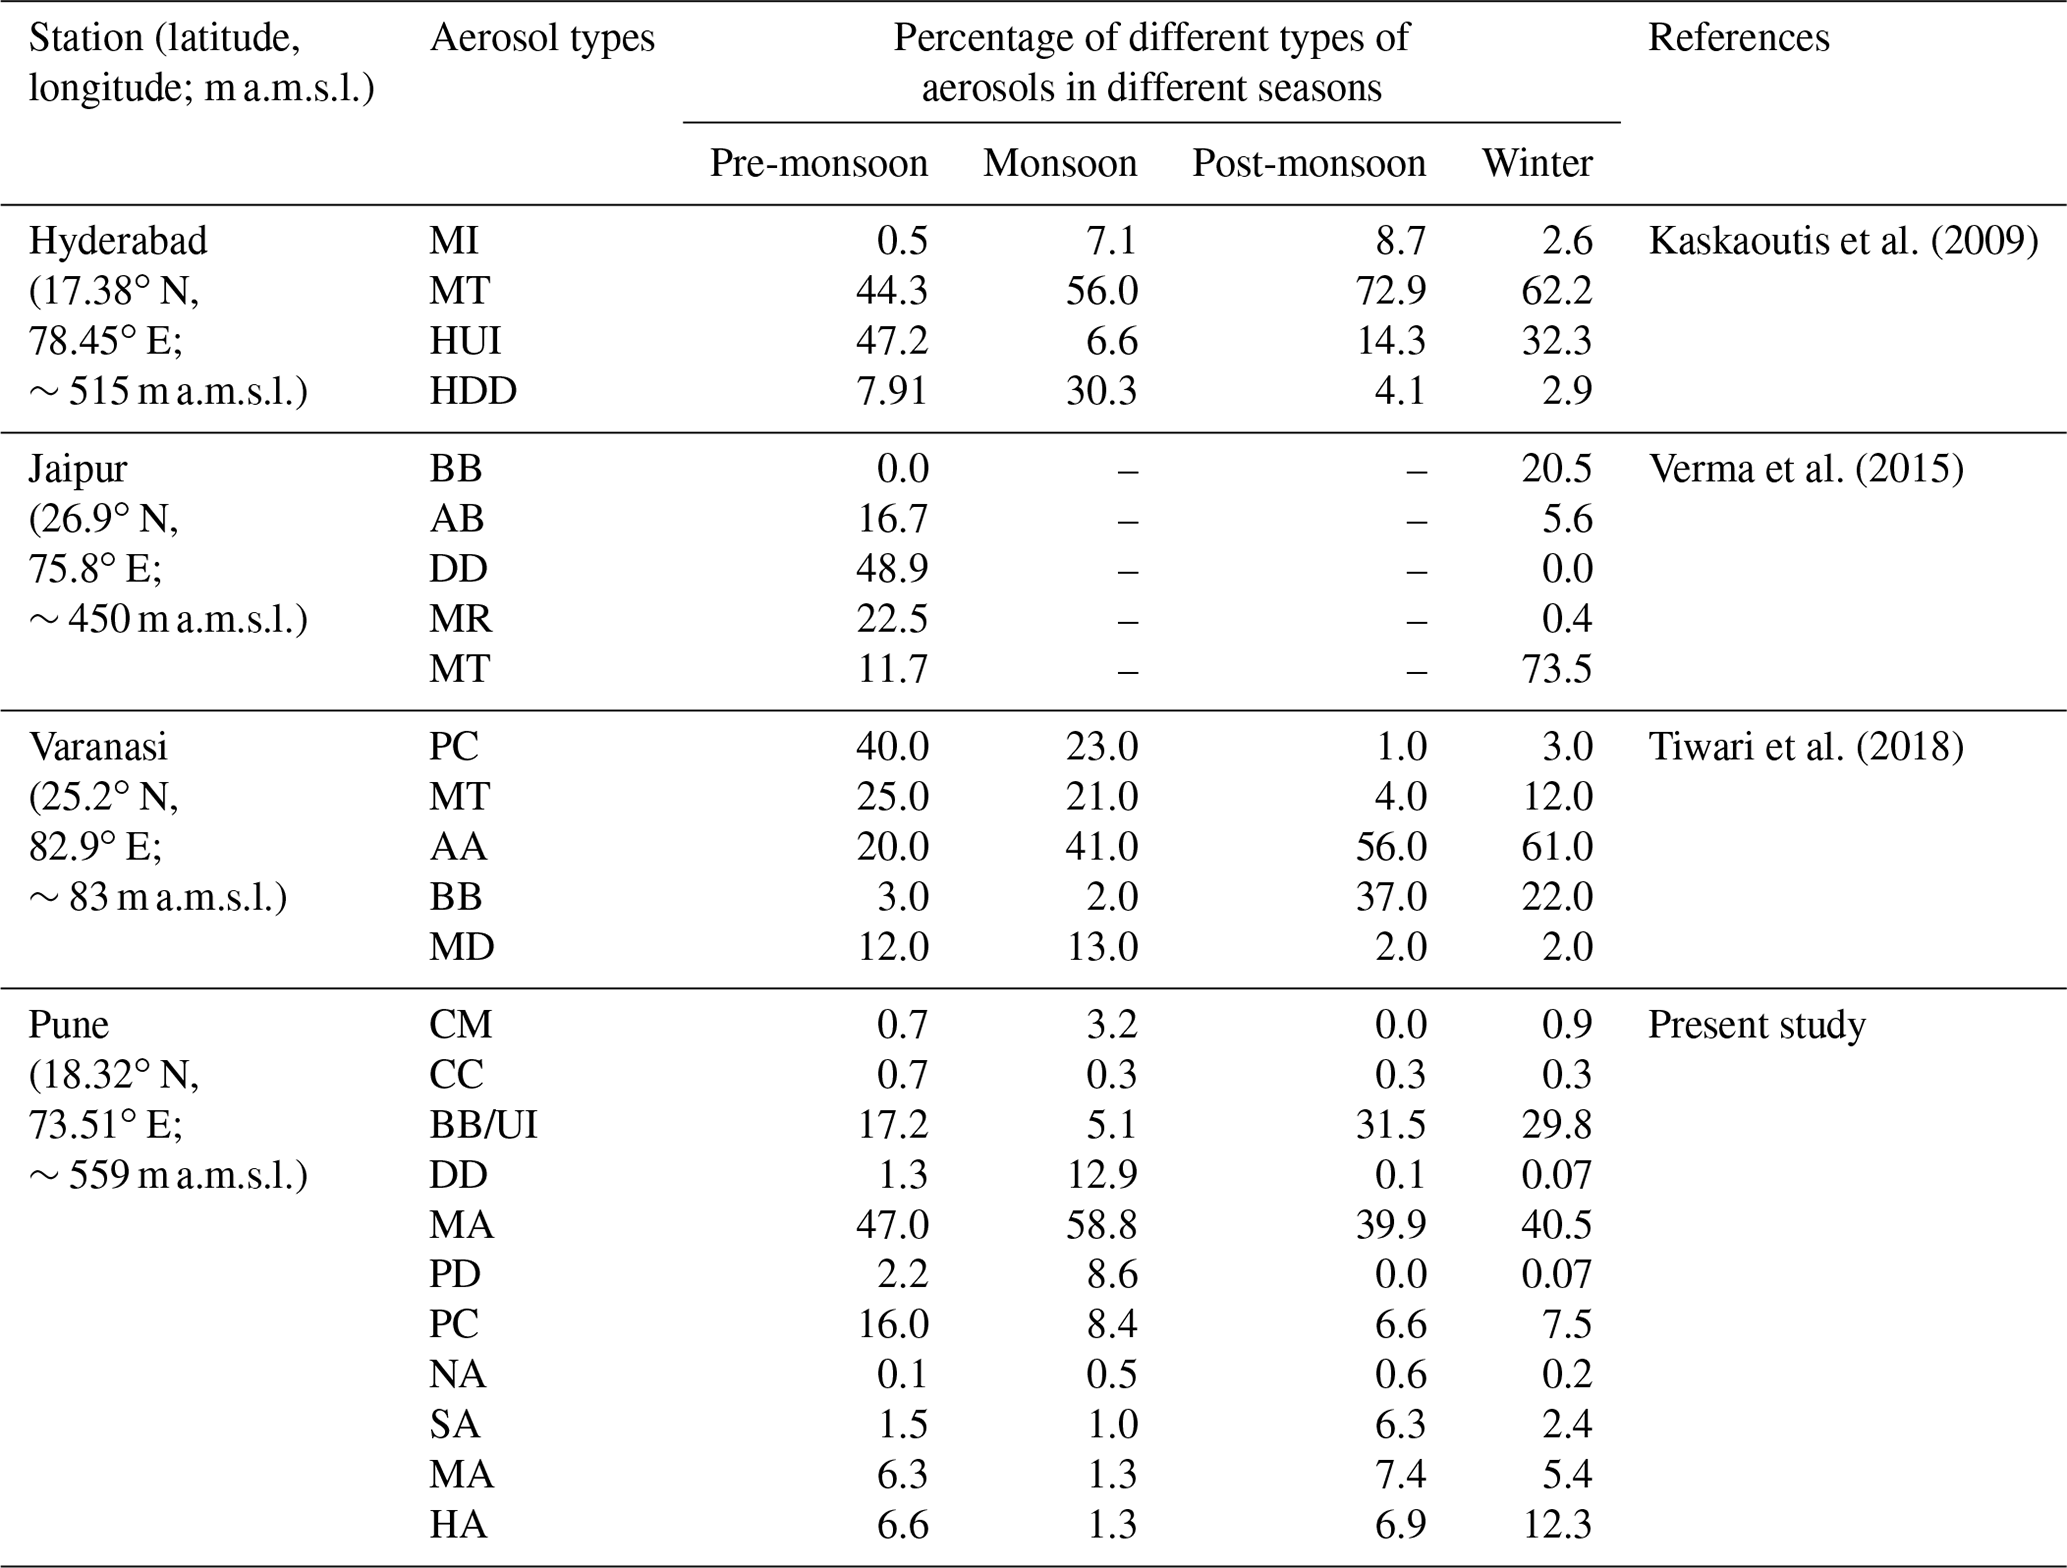
MI is maritime influenced; MT is mixed type; HUI is high-AOD urban industrial; HDD is high-AOD desert dust; BB is biomass burning; AB is arid background; DD is desert dust; MR is marine; PC is polluted continental; AA is anthropogenic aerosols; MD is mostly dust; CM is clean maritime; CC is continental clean; BB/UI is biomass burning/urban industrial; MA is mixed-type aerosols; PD is polluted dust; NA is non-absorbing; SA is slightly absorbing; MA is moderately absorbing; HA is highly absorbing.
5.4 Long-term trends in aerosol properties
5.4.1 Long-term trends in aerosol products of AOD, SSA, AP, RI (real) and RI (imaginary) at different wavelengths
The long-term trends in monthly average values have been calculated from the daily average AODs at 440, 675, 870 and 1020 nm during the study period. Figure 9 depicts the long-term trends in monthly average values, calculated from the daily average AOD (Fig. 9a), SSA (Fig. 9b), AP (Fig. 9c), RI (real) (Fig. 9d) and RI (imaginary) (Fig. 9e) at 440 nm. It is evident from Fig. 9a that the AODs are strongly dependent on receiving filter center wavelength, resembling that of a continental environment (Vijayakumar et al., 2012), whereas flat spectra are generally expected over marine and dust environments (Kumar and Devara, 2012a). AOD at 440 nm shows an increasing trend because this region is mainly affected by various kinds of aerosol sources (Vijayakumar et al., 2012) and change of meteorological patterns. The variations in SSA at 440 nm (Fig. 9b) reveal the influence of dust and urban pollution, with the SSA tending to increase rapidly with wavelength during dust events but decrease during periods of increased urban pollution (Bergstrom et al., 2007; Dubovik et al., 2002). The percentage increase in trend and other statistical parameters are provided in a table to follow. The increase in SSA with wavelength suggests an enhanced mixed aerosols and biomass-generated aerosols along with urban industrial aerosols (Bergstrom et al., 2007; Russell et al., 2010). Thus, the results clearly suggest the spectral behavior of SSA highly depends on the nature of aerosol particles. It can be seen from Fig. 9c that variations in AP at 440 nm indicate the dependency of AP on aerosol particle size and composition. The AP decreases with increasing wavelength, and the overall range varies from 0.71 to 0.65 for the four wavelengths. Zege et al. (1991) showed that the asymmetry parameter ranges from ∼0.1 to ∼0.75 for very clean atmospheres to heavily polluted conditions. The time series plot of monthly average values of asymmetry parameter over this region shows increasing trend by 0.06 % yr−1 at 440 nm. The variations in refractive index (both real and imaginary) are shown in Fig. 9d and e, respectively. The real part of RI at higher wavelengths is larger than that at shorter wavelengths (as shown in the figures to follow) due to the higher absorption at longer wavelengths by coarse particles (Cheng et al., 2006a, b).
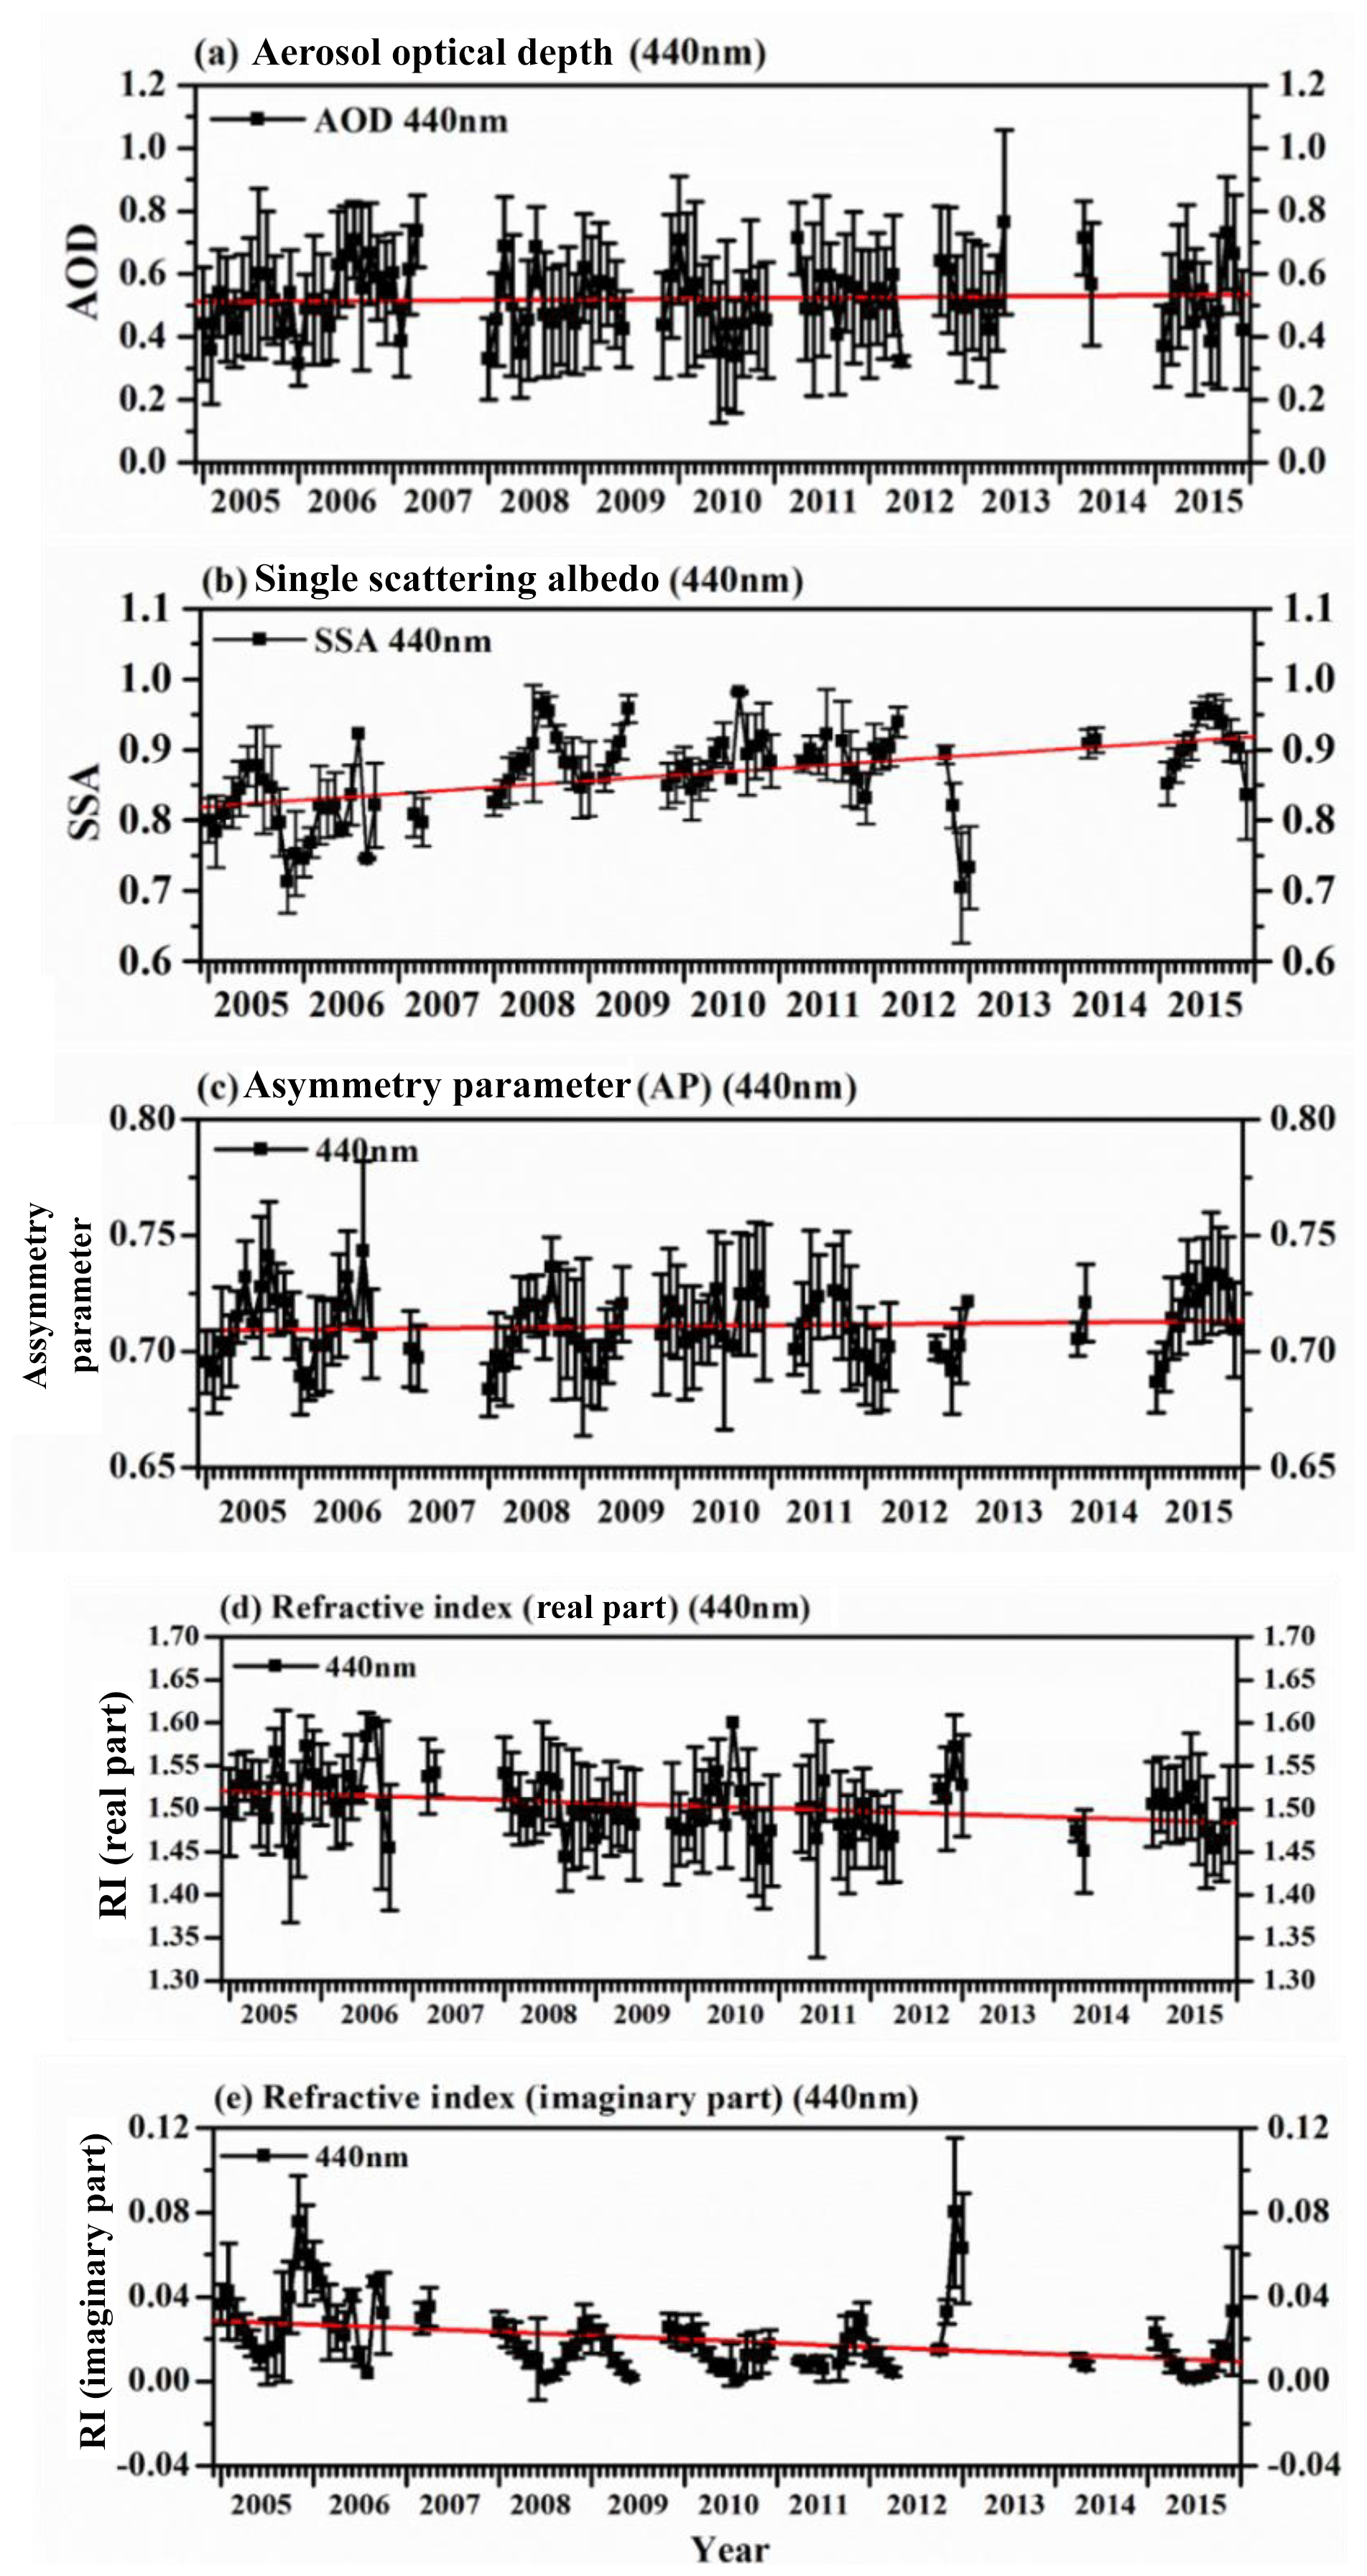
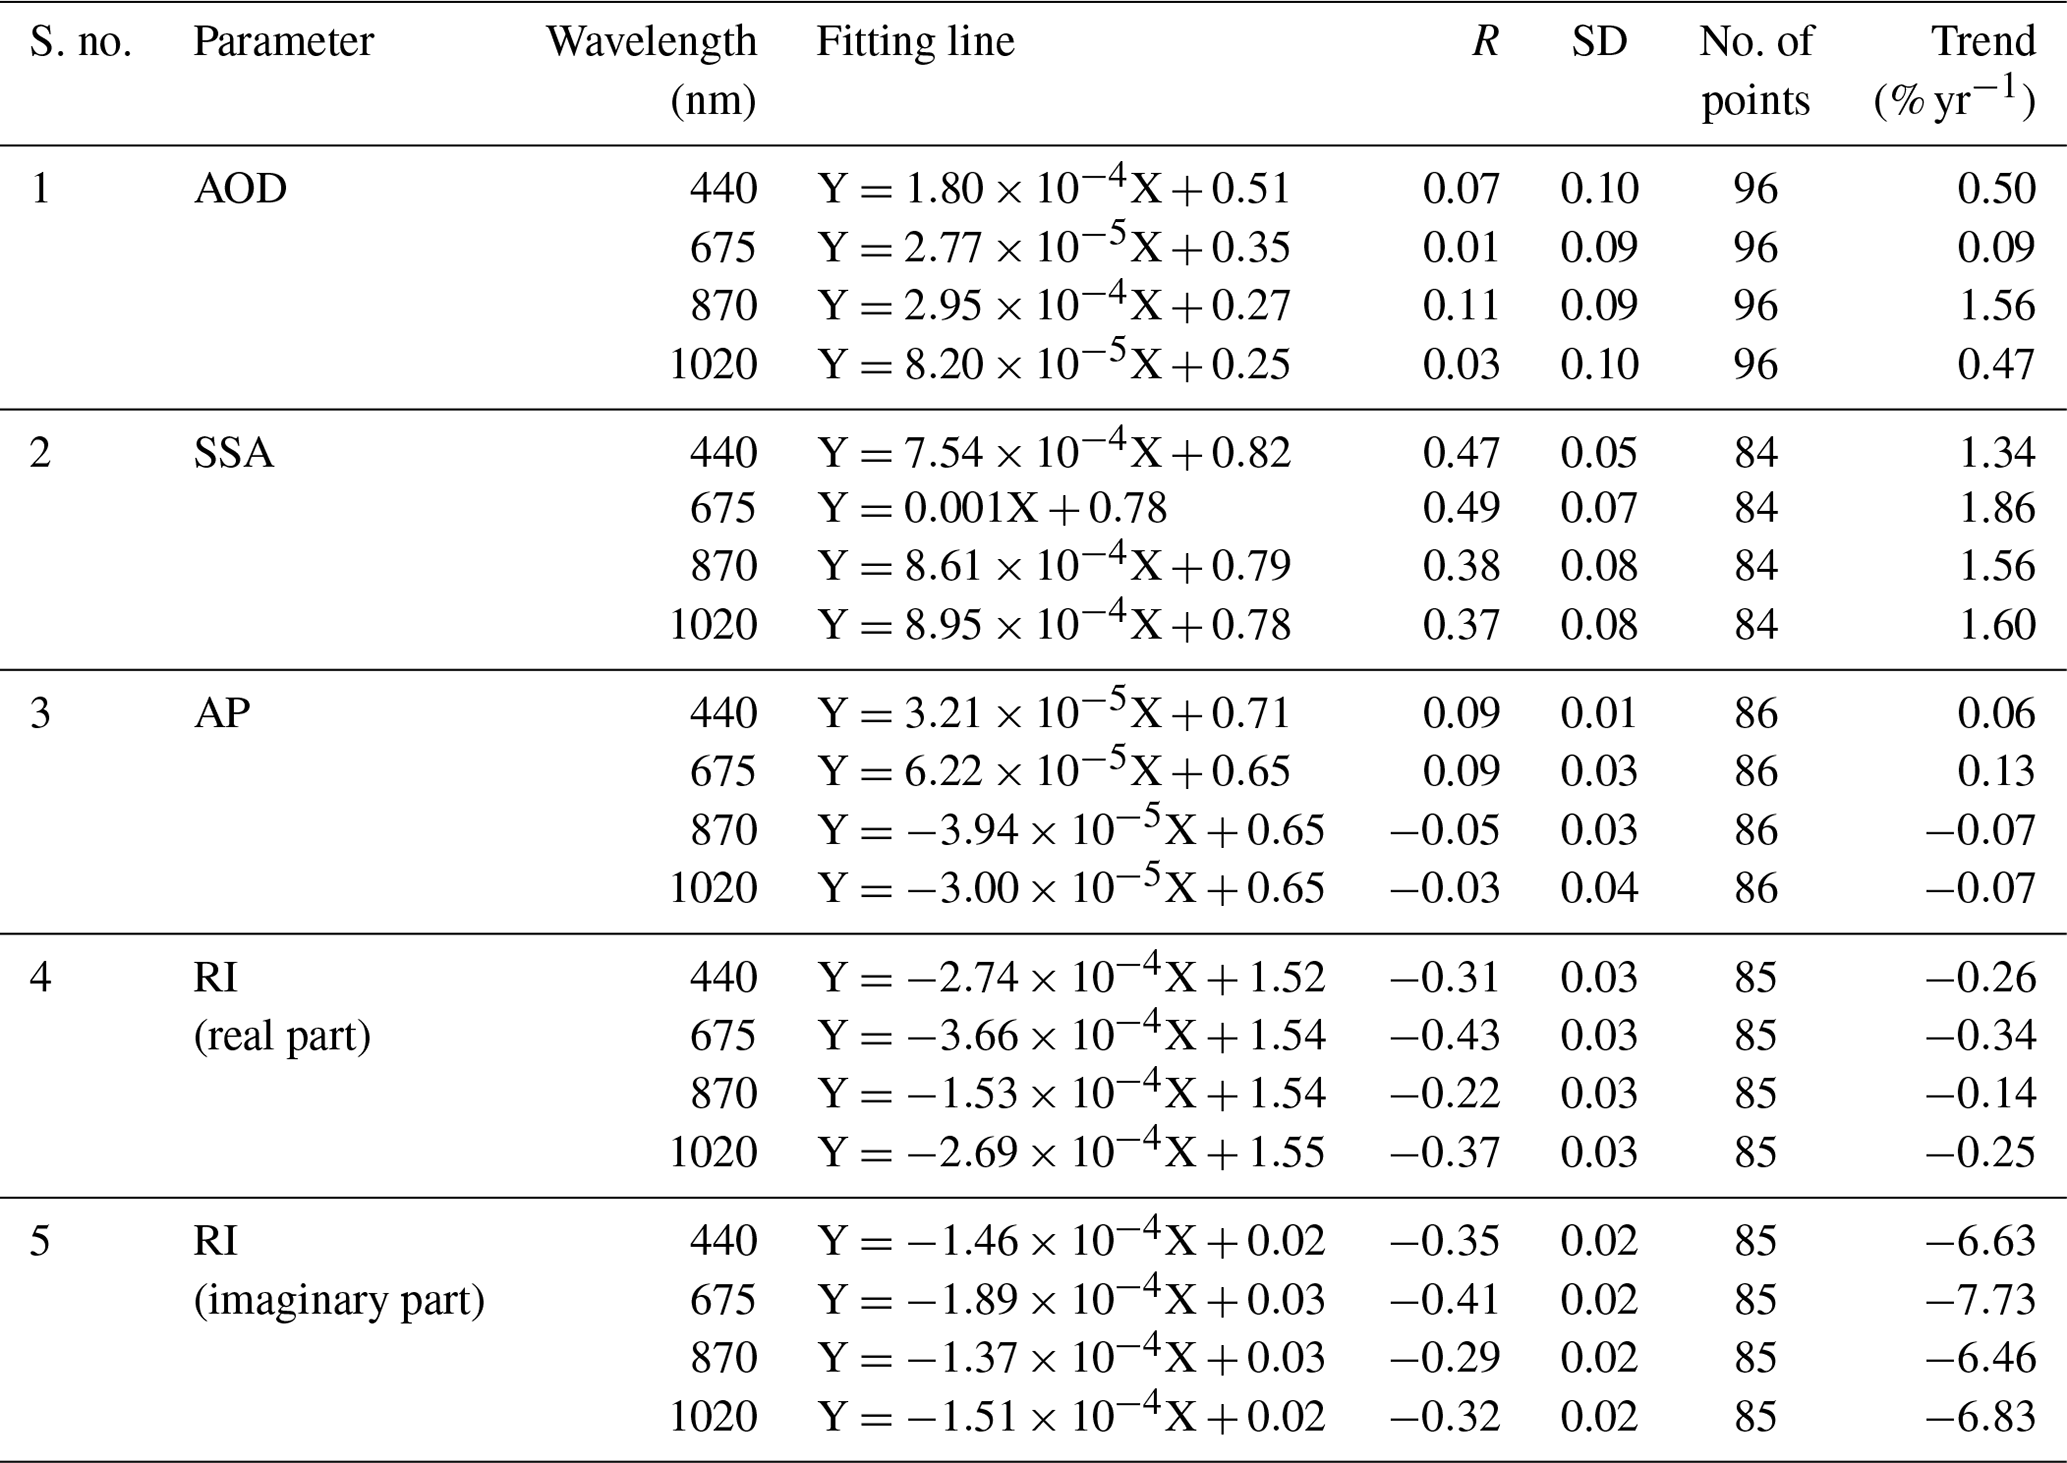
The long-term trends in monthly averages, calculated from the daily average AOD (Fig. 9a), SSA (Fig. 9b), AP (Fig. 9c), RI (real) (Fig. 9d) and RI (imaginary) (Fig. 9e) at 675, 870 and 1020 nm, are shown in Figs. S1, S2 and S3, respectively (see the Supplement). Information on the statistical parameters, involved in the aerosol products measured at 440, 675, 870 and 1020 nm in the study, is presented in Table 2.
Table 2Statistical information on the trend analysis of different aerosol products.
5.4.2 Effective radius (Reff) and volume-weighted mean radius (Rv)
The time series of monthly mean Reff (for coarse mode) and Rv (for fine mode) are shown in Fig. 10. Both parameters show a slightly decreasing trend by 0.13 % yr−1 for effective radius and an increased trend by 2.14 % yr−1 for volume-weighted mean radius due to lack of observations and unfavorable sky conditions.
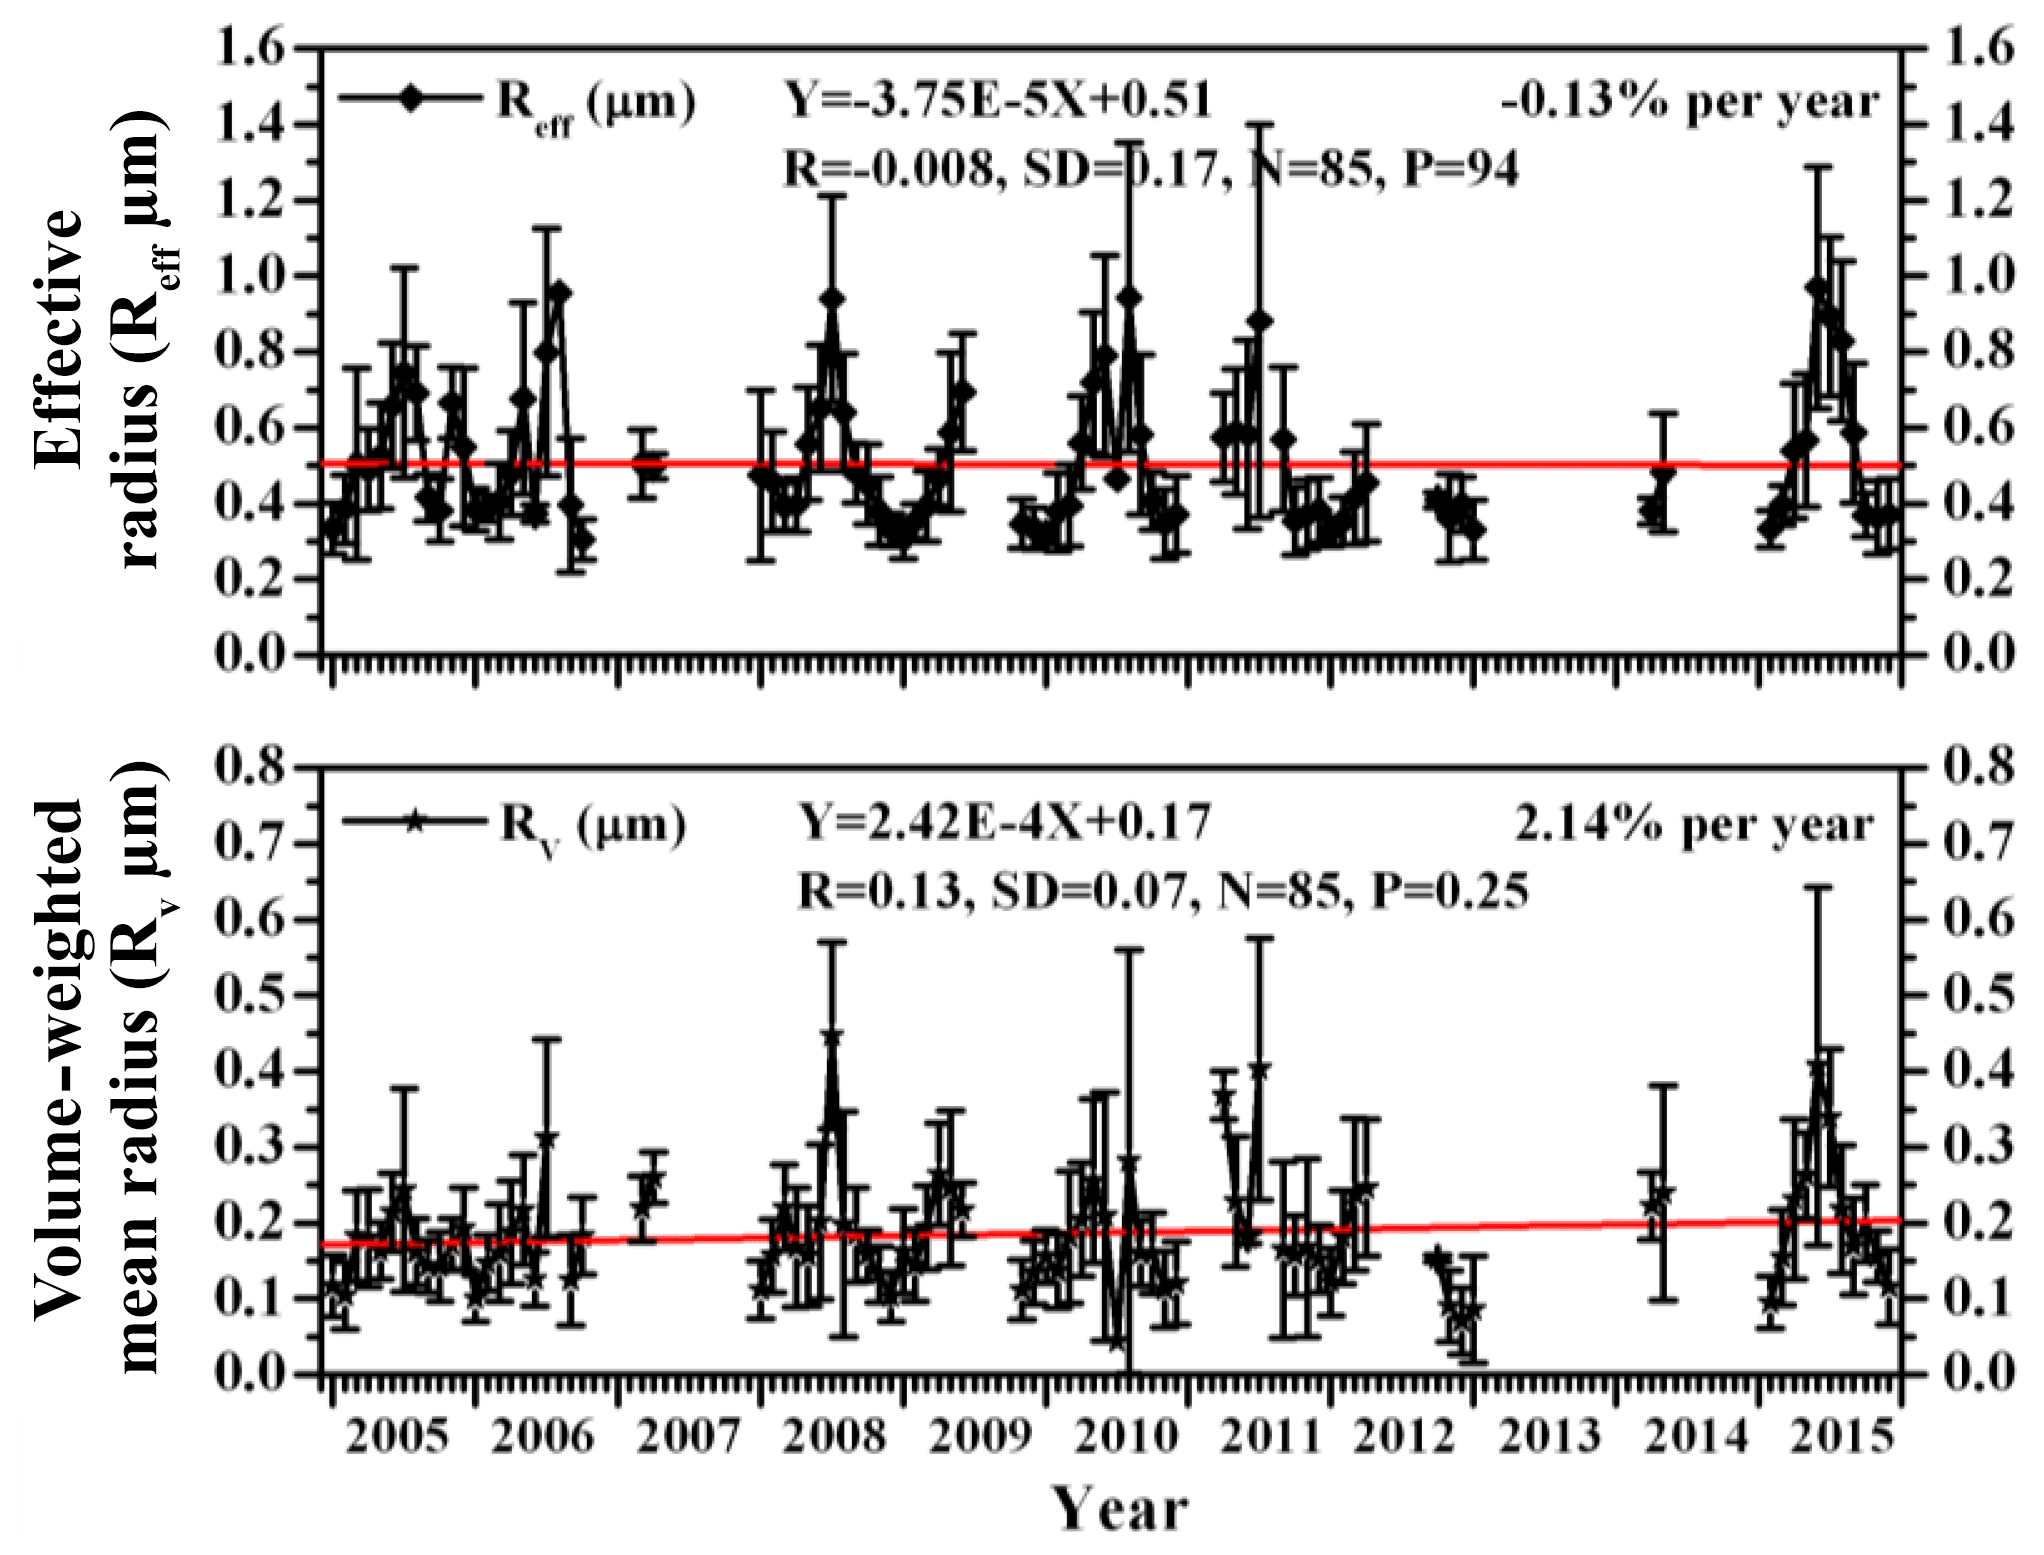
Figure 10Long-term monthly mean variation of effective radius (Reff µm) and volume-weighted mean radius (Rv µm). The vertical bar at each data point represents the standard deviation from the mean.
5.4.3 Columnar water vapor
The year-to-year variation in columnar precipitable water content is shown in Fig. 11. A monotonic increase in water vapor at a rate of 1.16 % yr−1 is evident from the figure. This feature provides additional support to attribute the increase observed in AODs that can occur because of hygroscopic growth of water-soluble aerosols, transport of larger-sized aerosols (dust and sea salt) during favorable wind conditions (Ramachandran and Cherian, 2008) and new particle formation by condensation and nucleation (Fig. 9a). The lower AOD values, observed in the post-monsoon season, could be explained due to wet soil which inhibits aerosol emissions in the lower atmosphere.
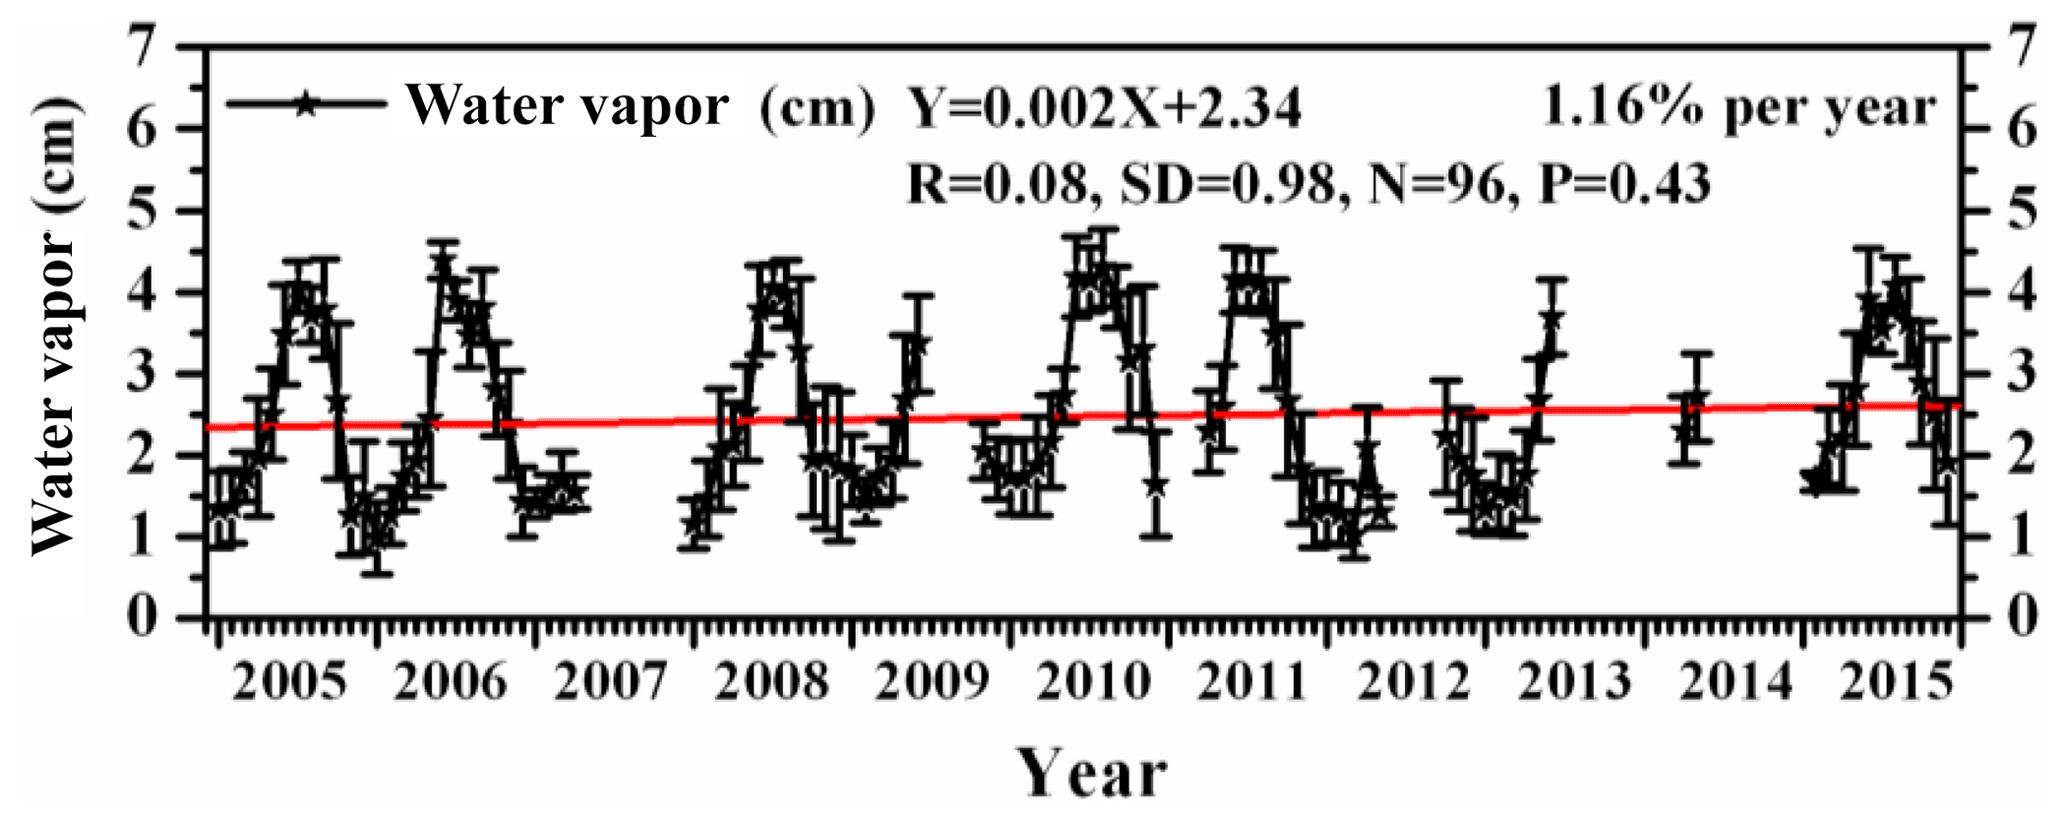
Figure 11Monthly mean variations in columnar precipitable water content during 2005–2015 over Pune, India.
5.4.4 AE, fine- and coarse-mode AOD
Greater AE values during winter and post-monsoon seasons indicate rich concentration of fine-mode particles. The strong decrease in the α440−870 value during the monsoon season could be explained by coarse-mode particles originating from the Arabian Sea (Kumar et al., 2011). Thus, the decrease of α from winter to pre-monsoon and monsoon months is indicative of increased coarse-mode particle contribution, consistent with dust particles (>10 µm) in the aerosol loading. This strong decrease in the α440−870 value could be due to mixing of air originating from oceanic and desert regions. The notable lower values of the Ångström exponent during June–September are ascribed to cloud contamination of data retrievals caused by thin invisible cirrus (Chew et al., 2011; Huang et al., 2012).
Monthly averages of the Ångström exponent, α440−870, for the whole period of observations are shown in Fig. 12. The Ångström exponent appears to have decreased by about 2.03 % yr−1 over the duration of the study period. The monthly mean values of the Ångström exponent varied from 0.21 to 1.35, representing a minimum value in January (0.21±0.07) and maximum in July (1.35±0.07), which are consistent.
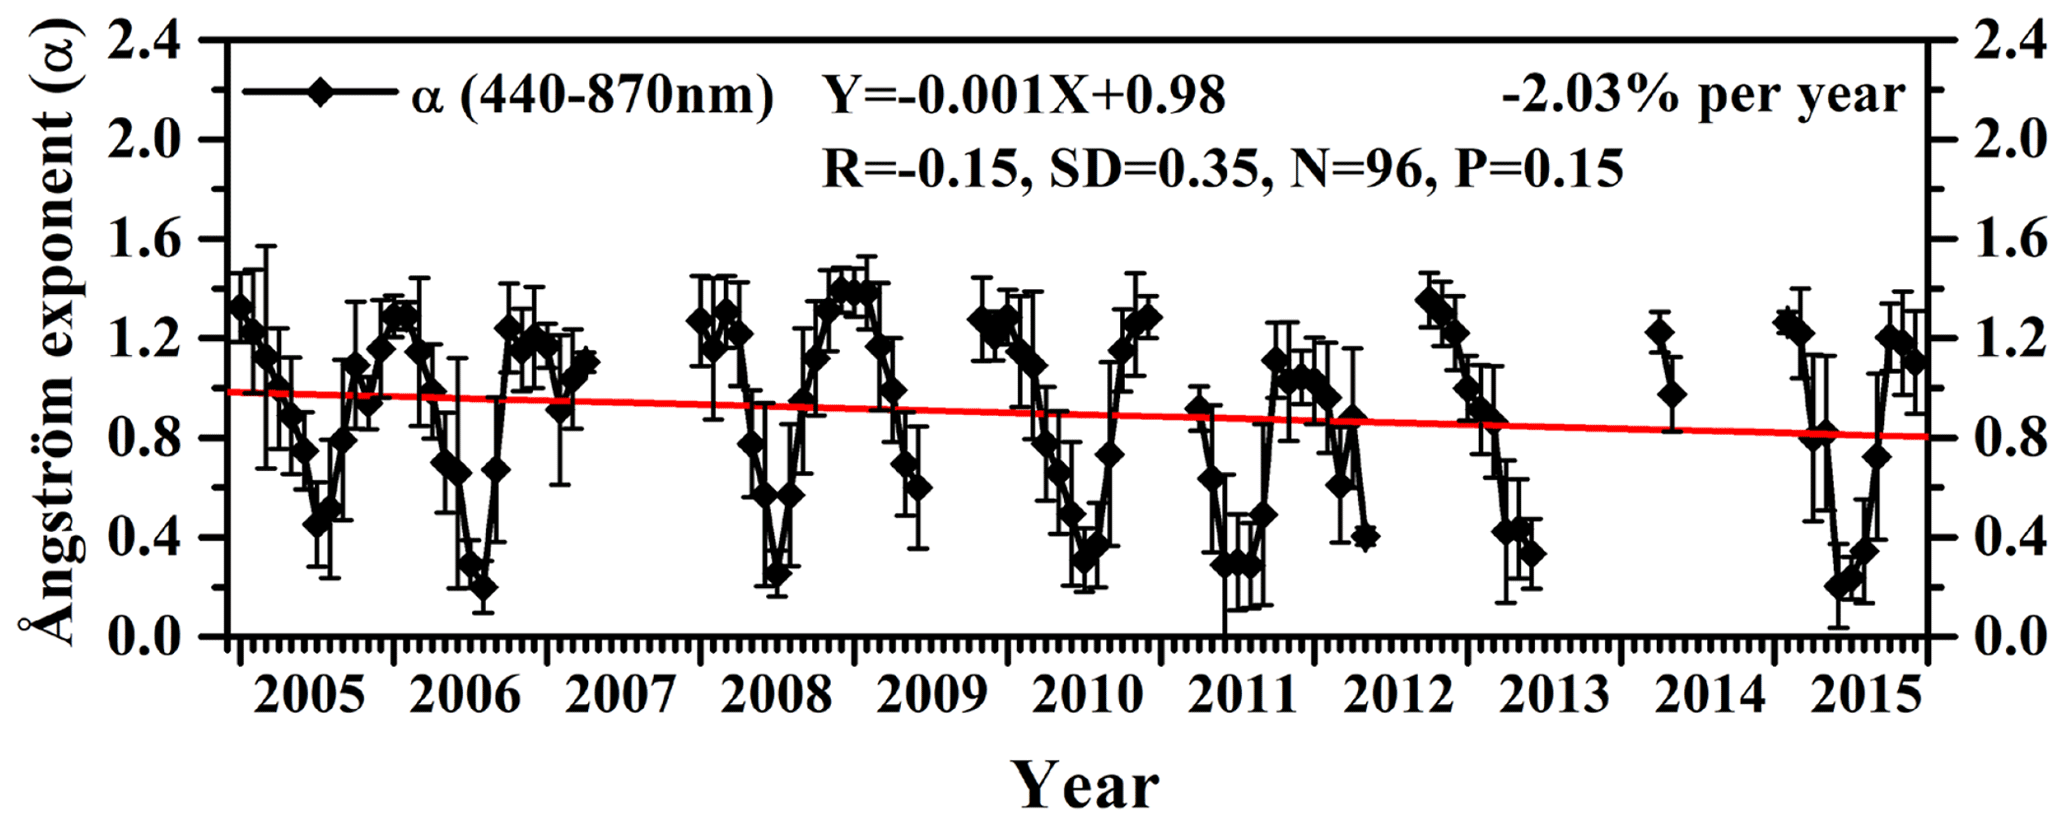
Figure 12Monthly mean variation of AE during the study period. The vertical bar at each data point represents the standard deviation from the mean. The solid red line indicates long-term decreasing trend.
The spectral deconvolution algorithm (SDA), developed by O’Neill et al. (2001, 2003), has been applied to the direct-Sun AOD analysis to partition the fine- and coarse-mode contributions to the total AOD at a standard wavelength of 500 nm. This parameter proves to be a quite effective indicator of the size distribution of the observed aerosols. Figure 13 displays the monthly mean variations of total, fine-mode and coarse-mode AOD at 500 nm. It is evident that the total AOD is almost constant throughout the period, while the fine mode shows a decreasing trend (−3.05 % yr−1) and the coarse mode shows an increasing trend (4.25 % yr−1). The decreasing trend in fine mode implies reduction in anthropogenic activity, while the increasing trend in coarse mode suggests dominance of natural sources such as dust and sea salt.
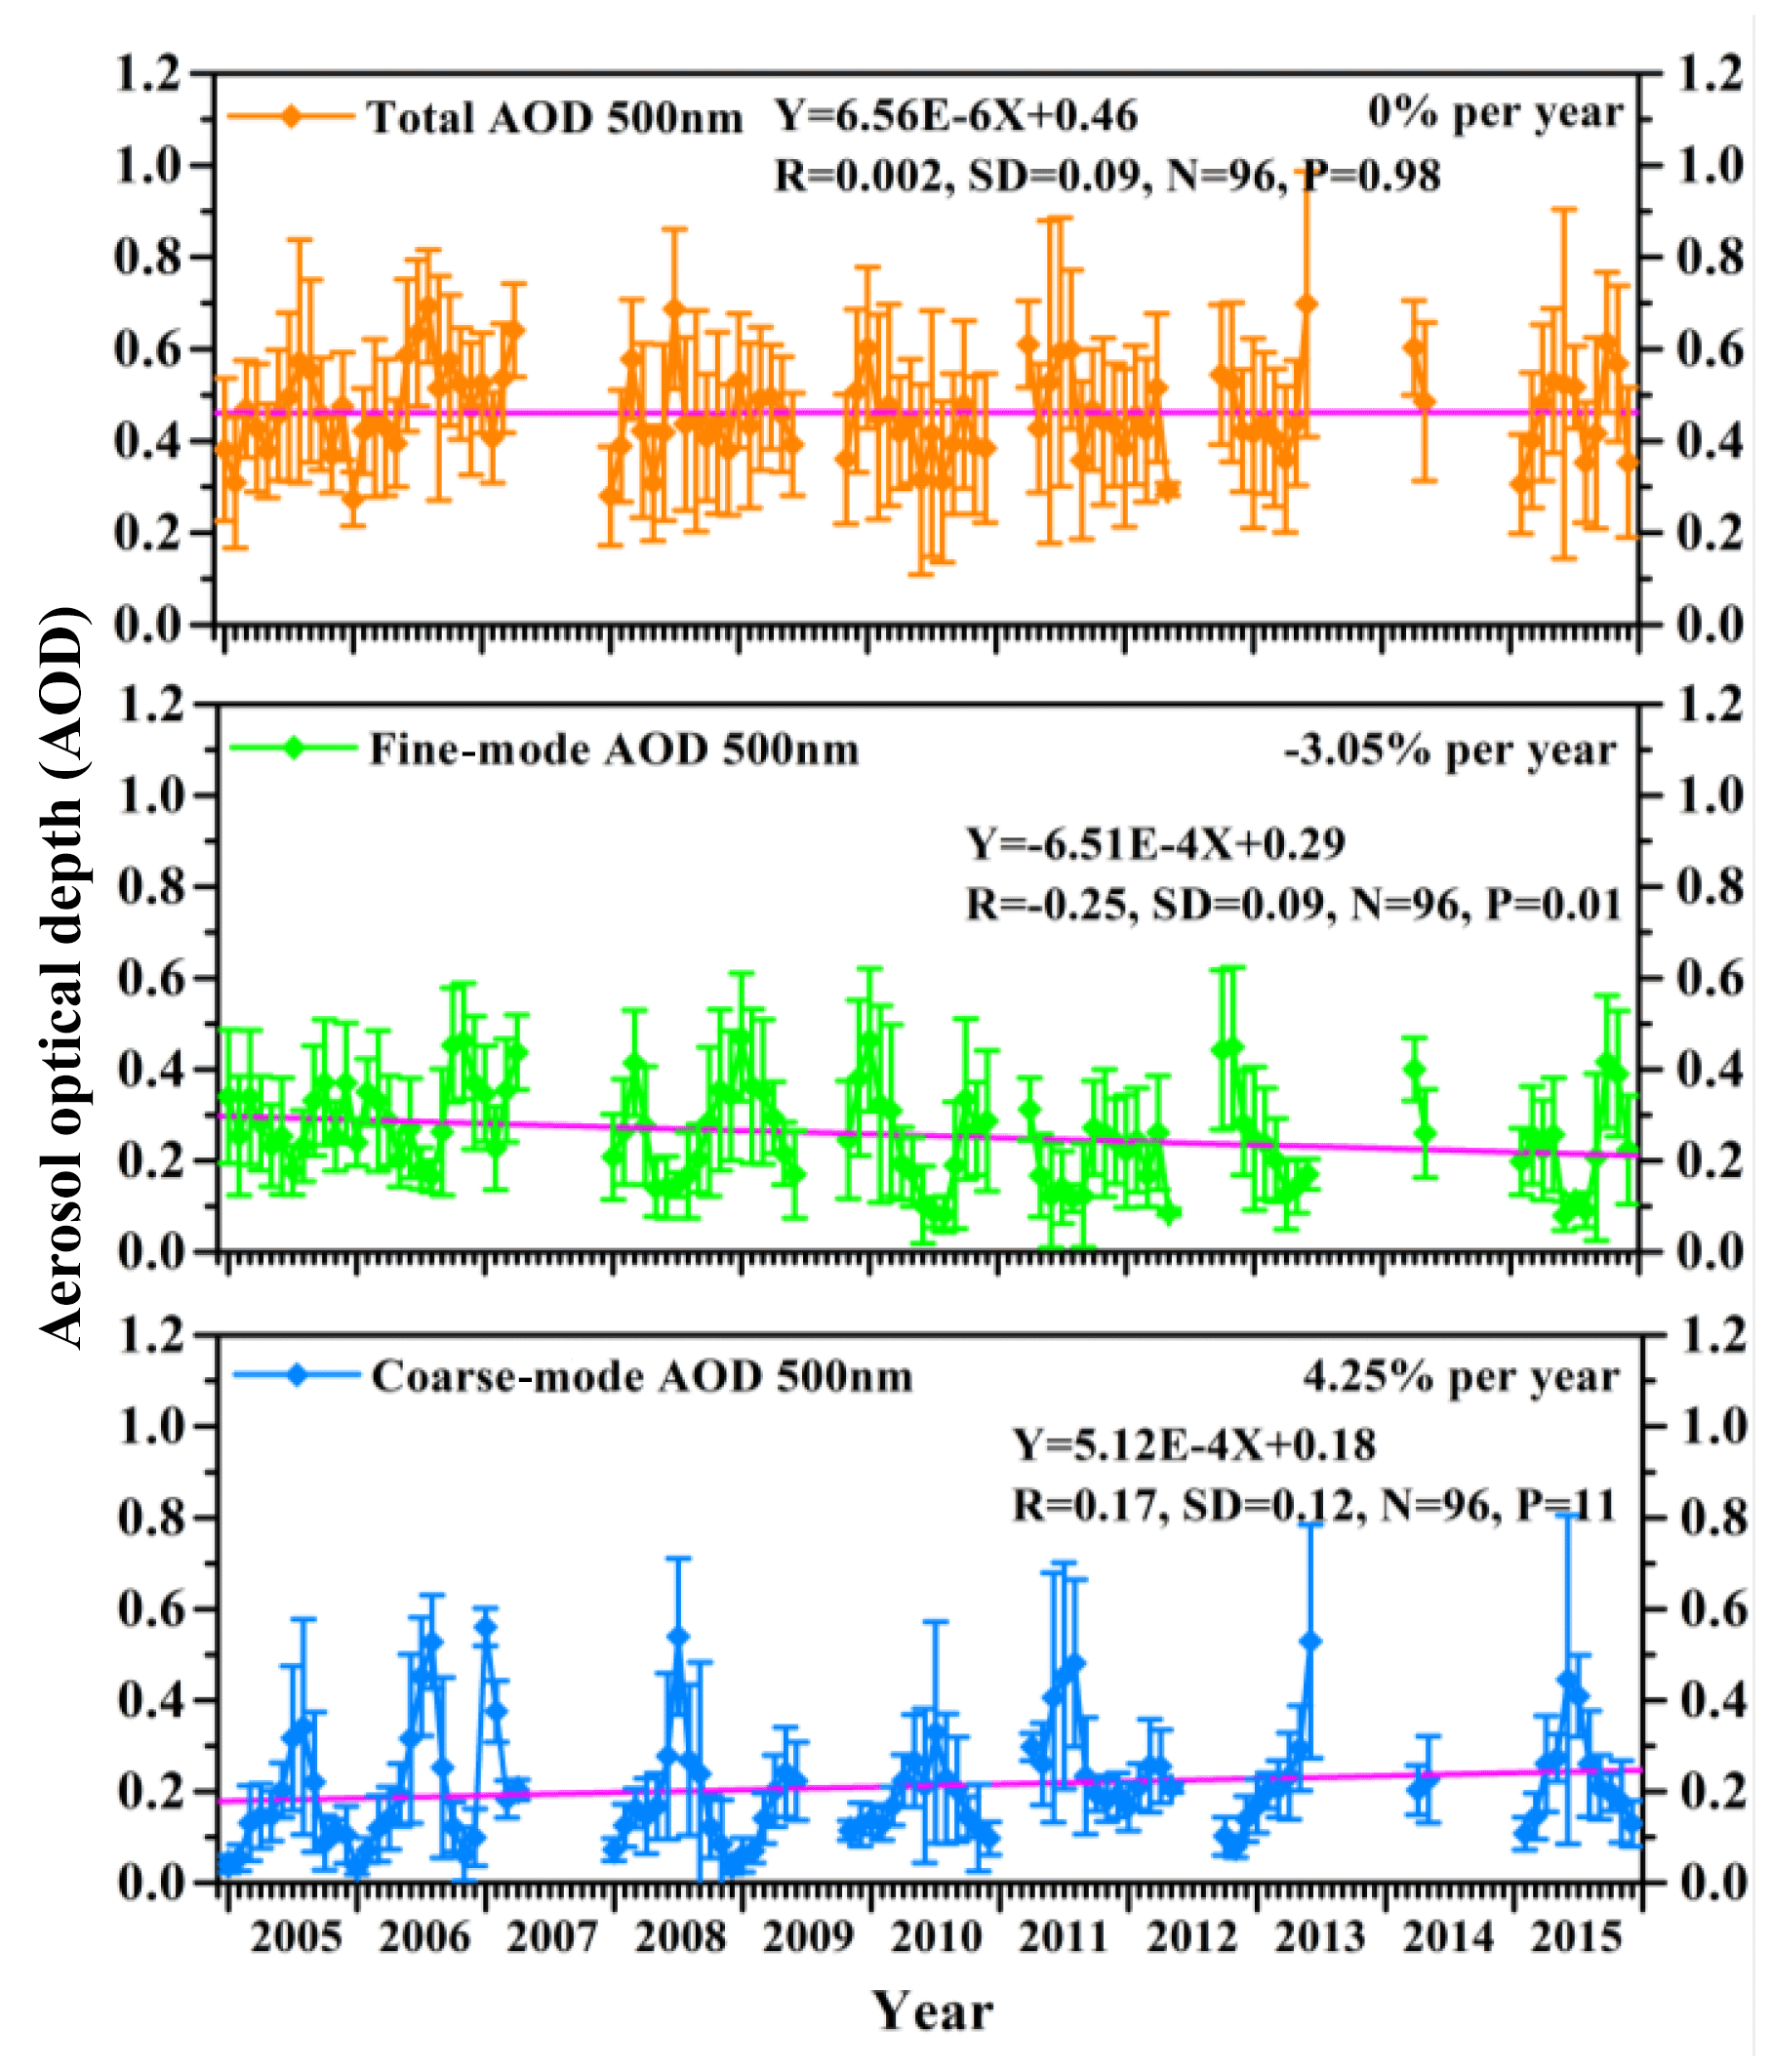
Figure 13Year-to-year variation in total, fine-mode and coarse-mode AOD during 2005–2015. The solid red lines passing through the data represent respective long-term trends. The vertical bar at each data point represents the standard deviation from the mean.
5.5 Aerosol radiative forcing (including trends in ARF)
Aerosols modify incoming solar and outgoing infrared radiation. The ARF at TOA or BOA is defined as the difference in the net solar fluxes (down minus up) (solar plus longwave; in W m−2) with and without aerosol. The difference between these two quantities gives the ARF in the whole atmosphere. Generally, negative values of TOA, implying the presence of aerosols, result in an increase in the radiation loss to the space (by enhanced backscattering), leading to a cooling in the Earth–atmosphere system, while positive values imply an atmospheric warming. At BOA, the forcing will always be negative because aerosols reduce the surface reaching solar radiation, and these values are more sensitive to aerosol loading only. The difference between the radiative forcing at TOA and BOA is defined as ATM. It represents the amount of energy trapped within the atmosphere due to the presence of aerosols. If ATM is positive, the aerosols produce a net gain of radiative flux to the atmosphere leading to a heating (warming), while negative ATM indicates loss and thereby cooling. Generally, the intensity of ARF depends on the aerosol loading, and therefore it is difficult to consistently intercompare the radiative forcing by the typical aerosol types. Seasonal variations of radiative forcing at TOA, BOA and ATM observed in the present study are compared with such studies available at other Indian sites in Table 3.
Table 3Comparison of aerosol radiative forcing (W m−2) at different stations in India.

The monthly average ARF variations at the TOA, BOA and within the ATM during the study period are plotted in Fig. 14. The decreasing trend of radiative forcing in the ATM and at TOA reveals dominance of hygroscopic (scattering) particles, whereas the increasing trend of radiative forcing at BOA indicates the dominance of hydrophobic (absorbing) aerosol particles. The BOA forcing is found to be negative, while ATM is positive for all months. These interactions between aerosols and solar radiation can be attributed to combination of aerosol properties (i.e., types), surface properties (i.e., albedo) and geographical parameters (latitude, season) (Yu et al., 2006). The large difference between TOA and BOA forcing demonstrates that solar radiation is being absorbed within the atmosphere, and as a result the atmosphere gets warmer, but the Earth's surface gets cooler (Alam et al., 2011; Kumar and Devara, 2012b). This can substantially alter the atmospheric stability and influence the dynamic system of the atmosphere (Li et al., 2010). For the ARF during winter, the BOA is more strongly negative associated with the corresponding TOA, giving rise to the highest ATM. In contrast to this, during pre-monsoon and post-monsoon seasons, ATM appears to be reduced with reduced heating rate. ATM forcing will increase if aerosol forcing at the TOA is more toward the positive side, while there is a large negative forcing at surface level. But TOA shows almost minor variation between positive and negative.
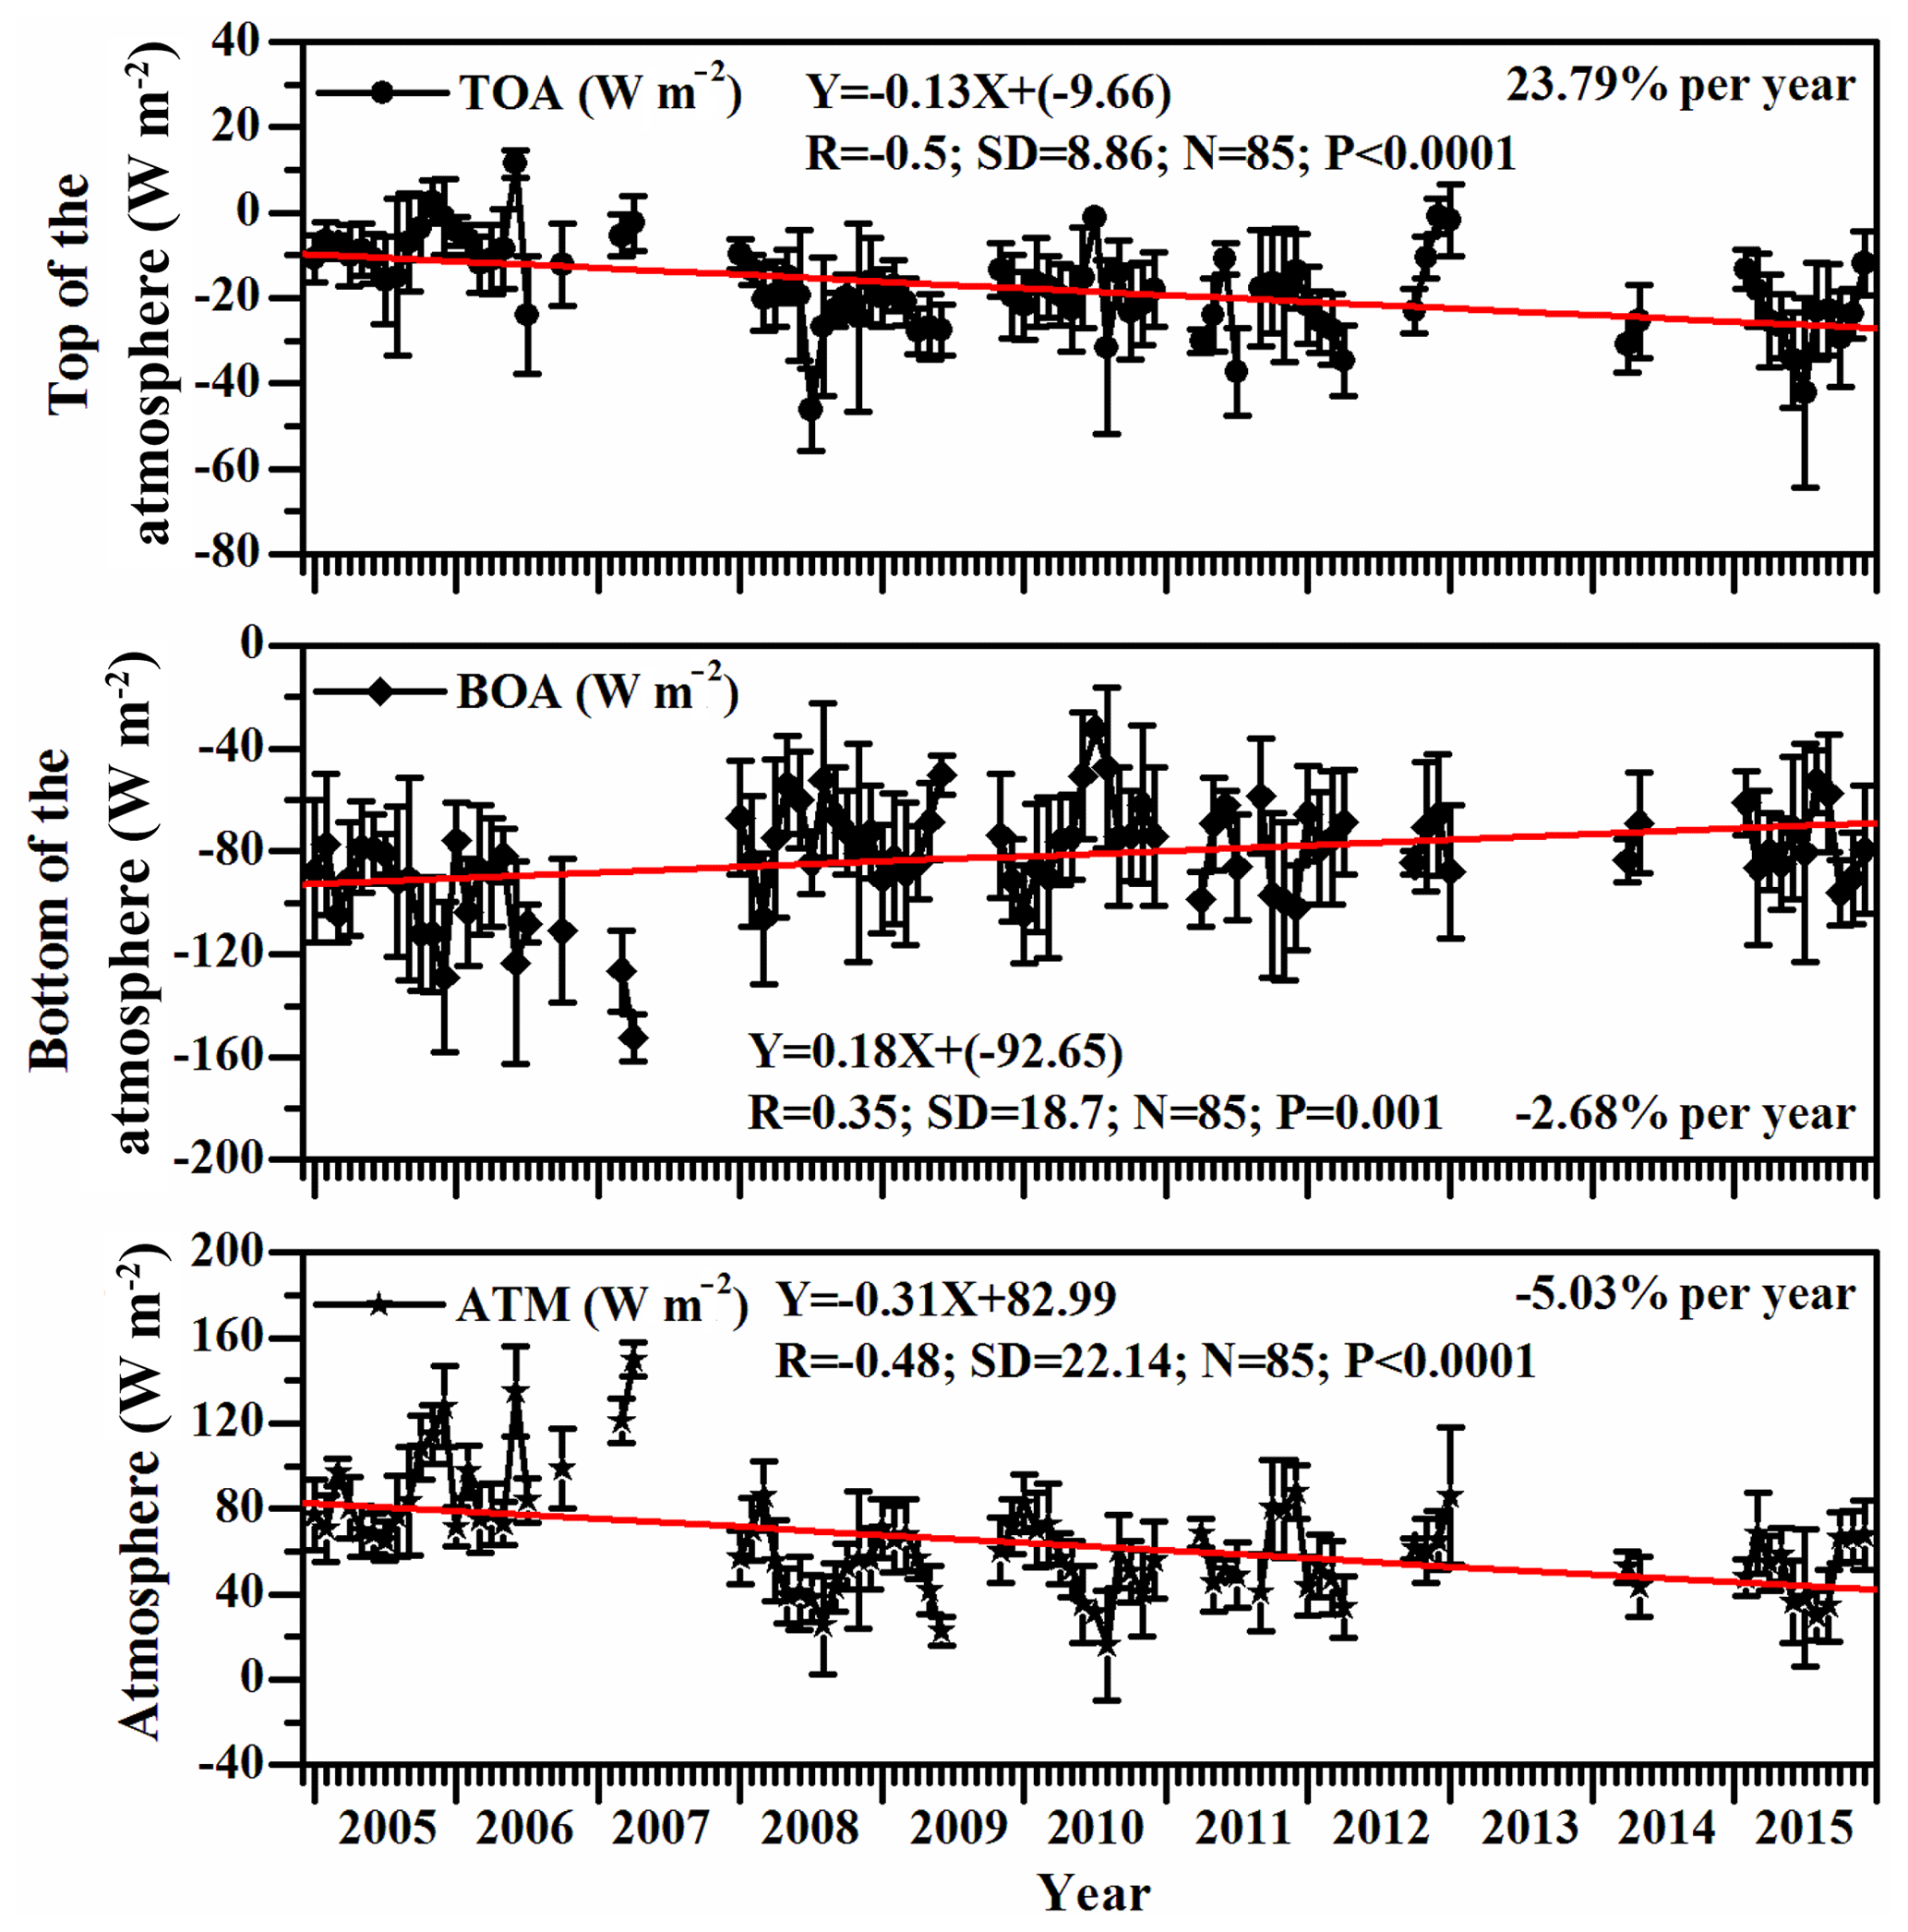
Figure 14Long-term monthly mean variation in radiative forcing at the TOA (W m−2), BOA (W m−2) and in the ATM (W m−2). The vertical bar at each data point represents the standard deviation from the mean.
The ARF for the whole observation period at the TOA is in the range of +11 to −46 W m−2 (average W m−2) and at the BOA from −32 to −152 W m−2 (average W m−2), increasing the ATM forcing from +15 to +149 W m−2 (average W m−2). But for the radiative forcing during winter, the BOA ( W m−2) is more strongly negative, associated with corresponding TOA ( W m−2), giving rise to the highest ATM value of 58.4±15.5 W m−2 with a resulting heating rate of 1.95±0.5 K d−1 during this season. In contrast to this, during pre-monsoon and post-monsoon seasons, ATM appears to be reduced with the reduced heating rates of 1.7±0.5 and 1.8±0.5 K d−1.
5.6 Comparison with satellite observations
Figure 15 depicts the comparison between long-term climatology of AOD and water vapor datasets from AERONET observations with MODIS and OMI observations. Here, the MODIS satellite gives AOD at 550 nm, while AERONET data had no corresponding wavelength to match it exactly. So, the AERONET AOD at 550 nm was obtained by interpolation between 440 and 675 nm following the Ångström equation. All figures clearly show an increasing trend except the water vapor parameter. Figure 15b clearly shows that AERONET AOD observations were relatively higher overestimations compared to OMI AOD. The possible reasons for relatively lower correlation observed between the AODs recorded by AERONET and OMI have been explained. Figure 15c shows that the AERONET H2O trend is higher compared to the satellite H2O trend, but magnitude-wise both are following similar trends. Figure 16 shows the correlation between AERONET observations and satellite observations. They show a strong correlation between satellite observations and AERONET data (Fig. 16a, c). A weak correlation (Fig. 16b) was observed between OMI AOD442 nm and AERONET AOD440 nm. Apart from a small sensing wavelength difference of 2 nm, higher AOD values by AERONET and relatively lower values by OMI have also been reported by Humera et al. (2015) due to anthropogenic activity and biomass burning. Now the correlation has been improved by reducing the scatter (eliminating the significant out-layered data points) between the observations.
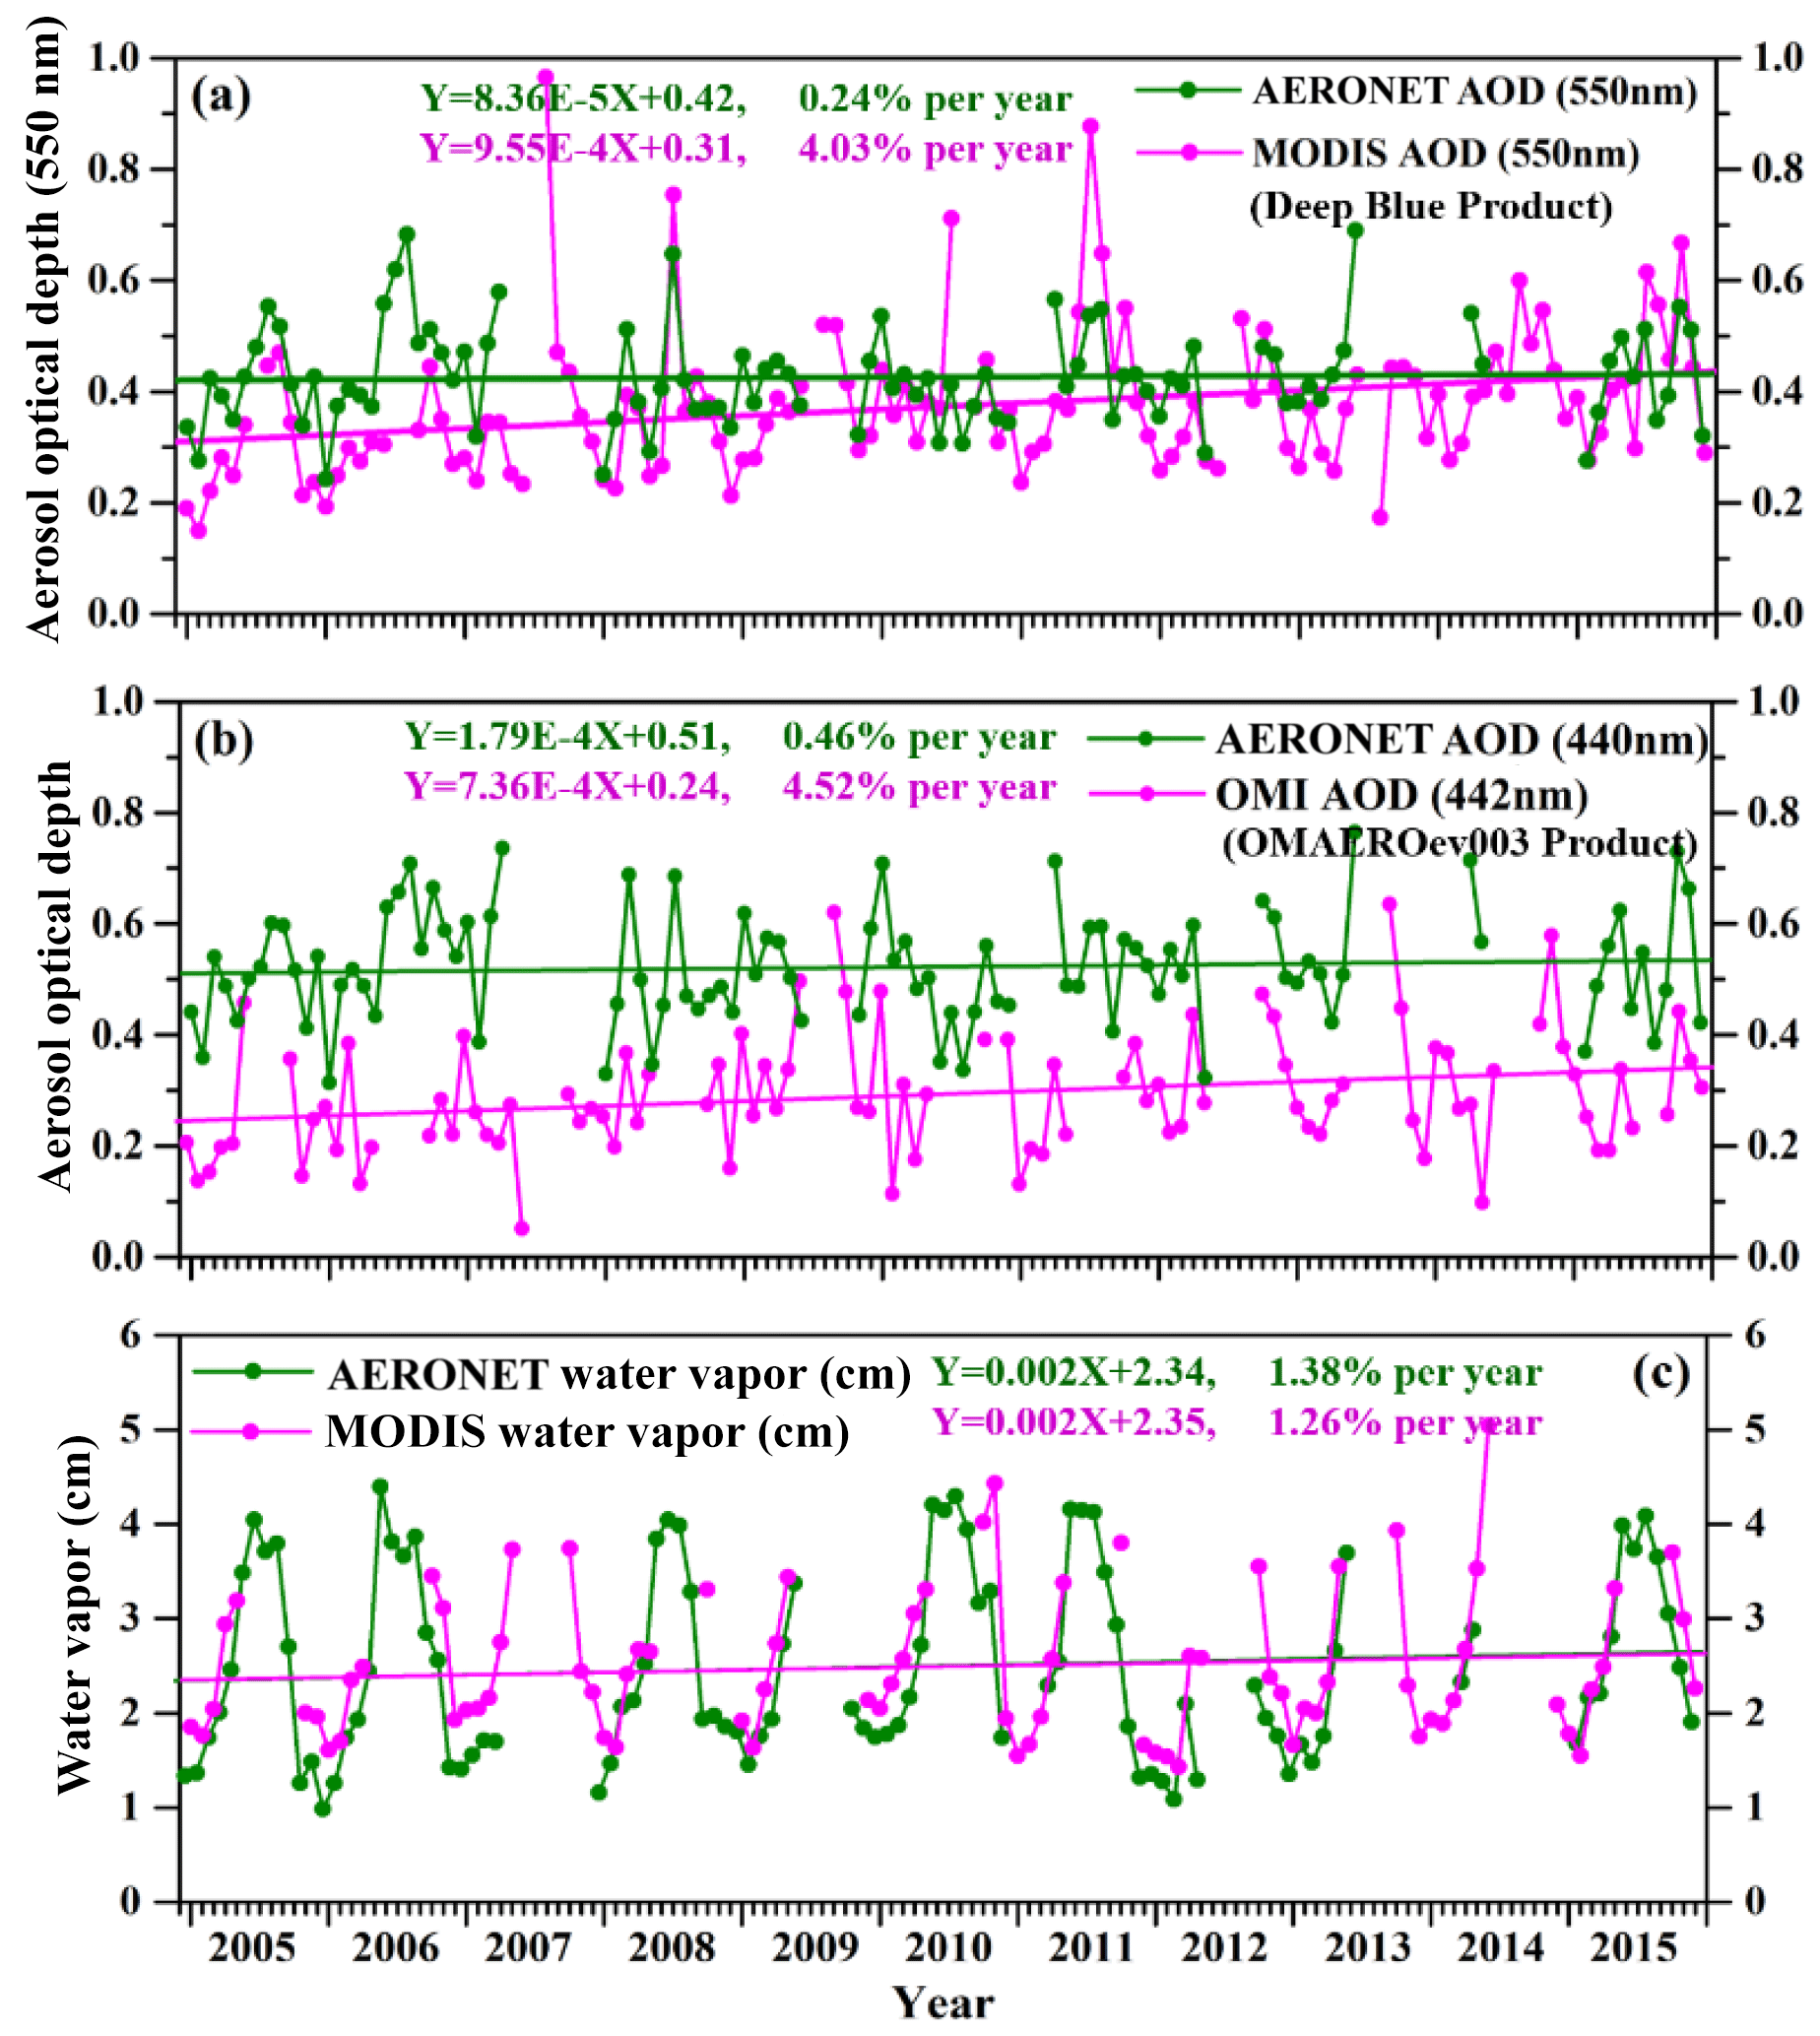
Figure 15Long-term monthly mean variation of AOD and water vapor (cm) datasets from ground-based and satellite observations.
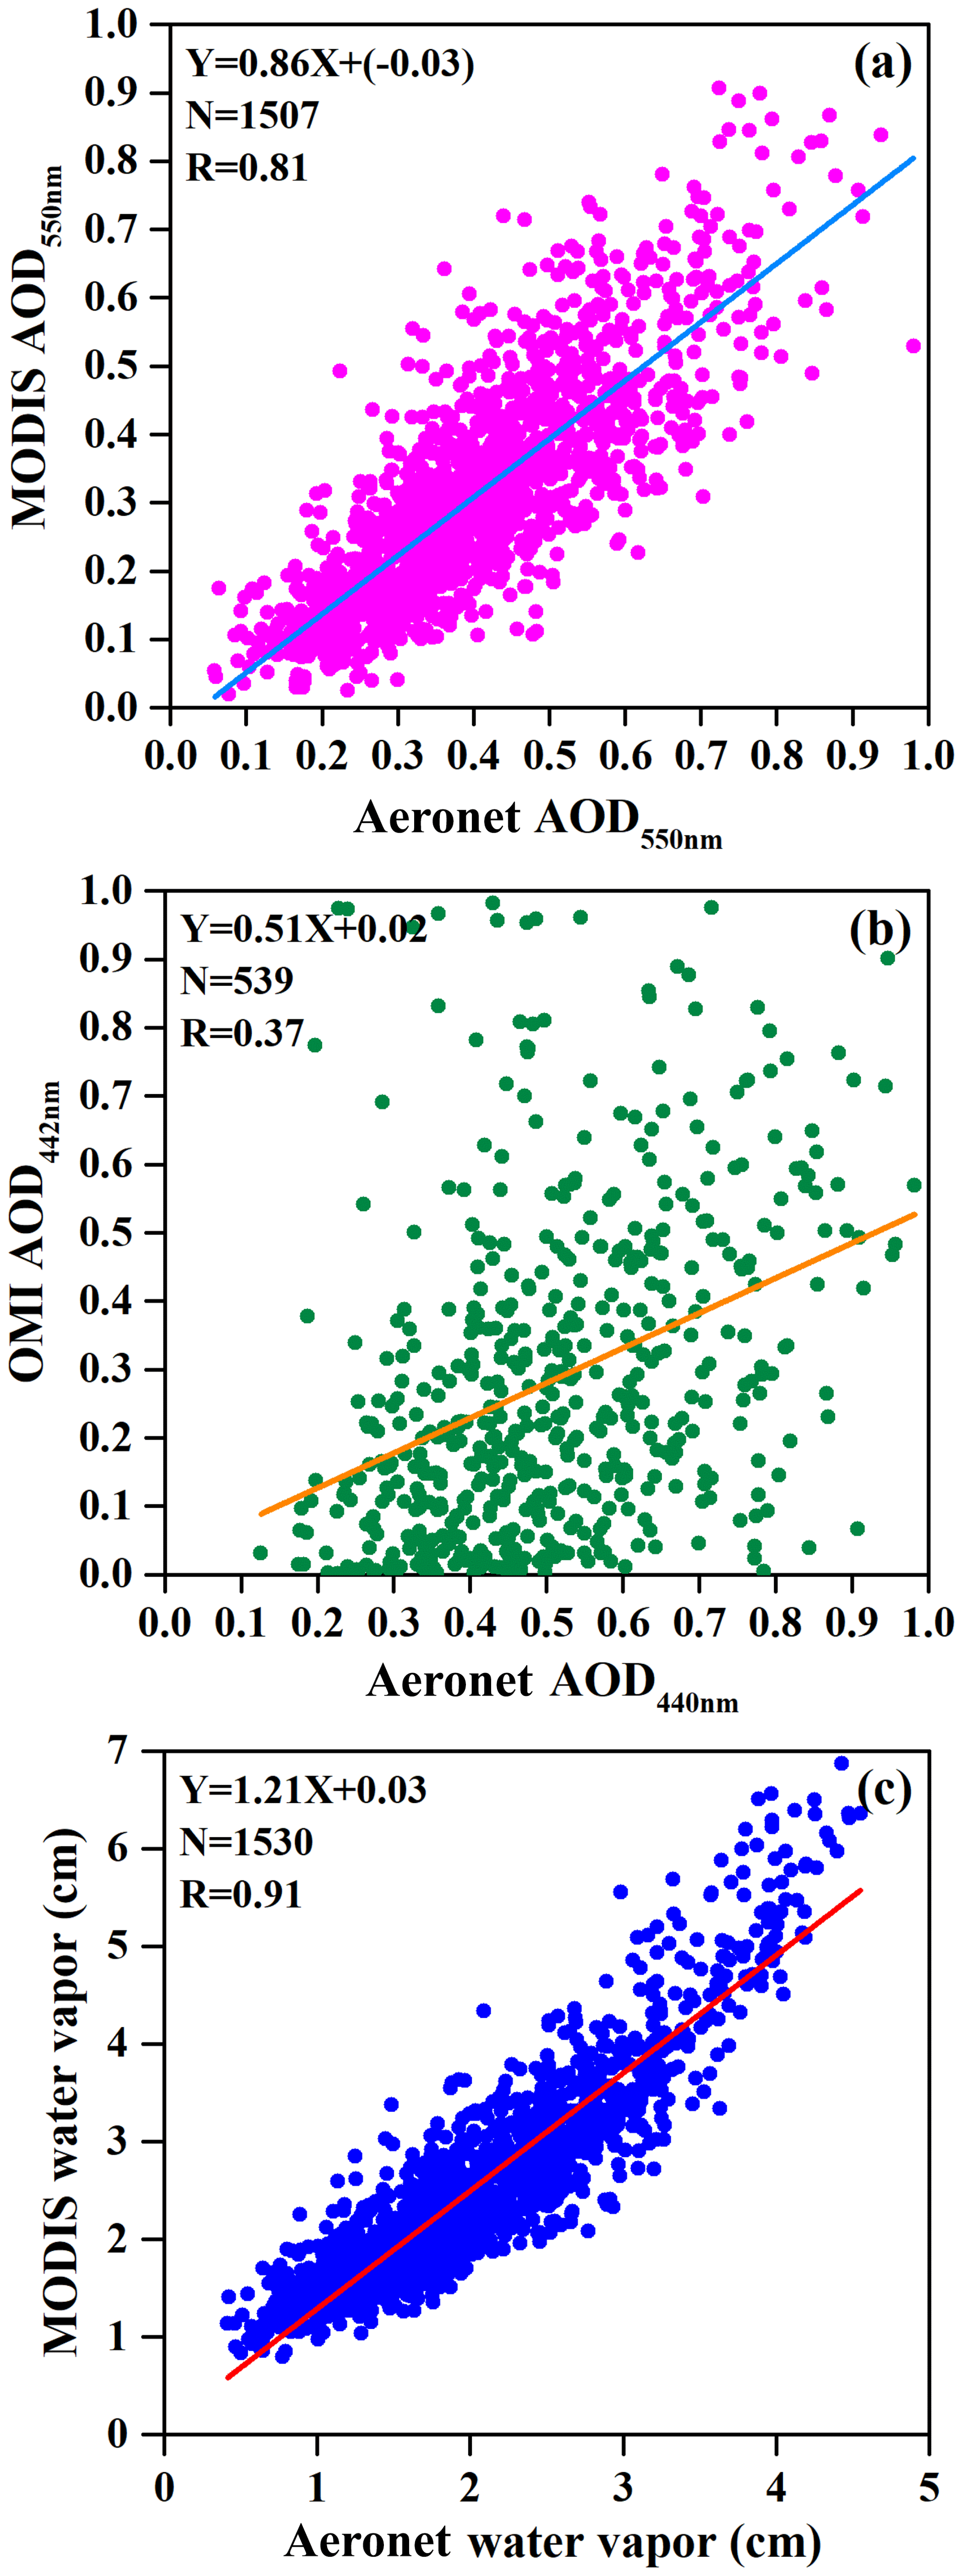
Figure 16Correlation between (a) AERONET AOD at 550 nm with MODIS AOD at 550 nm, (b) AERONET AOD at 440 nm with OMI AOD at 442 nm and (c) AERONET water vapor (cm) with MODIS water vapor (cm).
Long-term detection of changes in aerosol characteristics has been one of the key issues for researchers working on climate and environment. AERONET, the largest global network for ground-based remote sensing of aerosol optical properties, has grown rapidly, and more than 10 years of continuous observations have been maintained by a large number of independent academic and research institutions. The high quality and accuracy of AERONET observations provided a tremendous opportunity to investigate how and what causes the changes in AOD (Wu and Zeng, 2011). The main conclusions that can be drawn from the present study are summarized as follows:
- 1.
Time series of AOD exhibit an increasing trend over Pune during the study period (January 2005–December 2015), which is ascribed mainly to growth in urbanization. The daily variability of AOD was found to be higher in the monsoon season and lower in winter months, corresponding to the changes in season. The relative increase of aerosol loading during the monsoon season is considered to be due to dominance of aerosols of marine origin at the study region.
- 2.
The long-term variations in columnar water vapor also showed an increasing trend at a rate of 1.16 % yr−1, which is found to be responsible for the increasing trend in AOD, particularly during the monsoon season.
- 3.
The Ångström exponent showed decreasing trend from January 2005 to December 2015, exhibiting seasonal dependence. The relationship between AE and AOD suggests that experimental region is characterized by different types of aerosols and their transport by regional air mass changes from season to season.
- 4.
The increase in fine-mode fraction of composite aerosol is found to be marginal as compared to that of coarse mode, which reveals dominance of natural processes against anthropogenic sources at the study location.
- 5.
The seasonal variability in coarse-mode particles (Reff) is found to be greater than that of fine-mode particles (Rv) with a maximum during the monsoon season due to changes in circulation, land-surface and long-range transport and the relatively higher contribution of the coarse-mode particles to the observed AOD as compared to that of fine-mode particles.
- 6.
Long-term climatology of SSA shows an increasing trend. It is 1.34 % yr−1 at 440, 1.86 % yr−1 at 675, 1.56 % yr−1 at 870 and 1.60 % yr−1 at 1020 nm. Furthermore, the spectral mean SSA values for all wavelengths show a decrease with increasing wavelength, which suggests enhanced mixed aerosols and biomass-burning-generated aerosols along with urban industrial aerosols.
- 7.
The decrease in ASP values from monsoon to post-monsoon and winter seasons is attributed to the transport of dust, and a significant fraction of total aerosol loading in this region consists of fine anthropogenic particles.
- 8.
The ARF for the whole observation period at the TOA is in the range of +28 to −60 W m−2 (average of W m−2), at the BOA from −48 to −233 W m−2 (average W m−2), increasing the ATM forcing from +16 to +210 W m−2 (average of W m−2).
- 9.
Aerosol types showed dominance of a mixed type of aerosols (44.85 %), followed by biomass burning and urban industrial aerosols (22.57 %).
- 10.
The AERONET data provide high quality and accuracy, as compared to satellite remote sensing data, though the spatial coverage of AERONET is relatively limited. However, the ground-based networks have been widely used to validate and help interpret the results from satellite sensors and model simulations.
The work reported in this paper is part of the joint collaborative research program between Amity University Haryana (AUH), Manesar-Gurgaon, India; Sri Venkateswara University, Tirupati, India; the Indian Institute of Tropical Meteorology, Pune, India; Science Systems and Applications (SSA), Inc., Lanham, MD 20706, USA; and NASA Goddard Space Flight Center (GSFC), Greenbelt, MD 20771, USA. However, the majority of the data have already been made available in our published papers at https://doi.org/10.1002/2015JD023976 (Khatri et al., 2016) and https://doi.org/10.1029/2010JD014944 (Kumar et al., 2011).
The supplement related to this article is available online at: https://doi.org/10.5194/amt-13-5569-2020-supplement.
All authors have, directly or indirectly, participated in the installation of the Sun–sky radiometer, calibration, maintenance, data archival and analysis, attribution of results and manuscript preparation and communication.
The author declares that there is no conflict of interest.
The corresponding author (Panuganti C. S. Devara) expresses his sincere gratitude to Ashok K. Chauhan, Founder President; Aseem Chauhan, Chancellor; P.B. Sharma, Vice Chancellor; B. S. Suhag, Dy. Vice Chancellor; Padmakali Banerjee, Pro-Vice Chancellor, and all other authorities of AUH for continuous support, and appreciates his team for cooperation. The principal author (Katta Vijayakumar) acknowledges the support, in the form of Research Associate (RA) Fellowship, from the Council of Scientific and Industrial Research (CSIR), Government of India (GOI), New Delhi. The constant support from M. Rajeevan, Secretary, MoES, GOI, New Delhi is gratefully acknowledged. Thanks are due to the director of IITM (Pune) for the infrastructure facilities. The authors would also like to thank AERONET (NASA) staff for support (https://aeronet.gsfc.nasa.gov/, last access: 13 June 2019) in calibrating the instrument and processing the data. We also acknowledge the ECMWF for synoptic meteorological data used in the study. The authors would also like to thank the MODIS and OMI science teams for providing access to the excellent data products that made this study more effective. The authors are highly grateful to the editor and anonymous reviewers for their valuable comments and useful suggestions on the original manuscript.
This paper was edited by Hiren Jethva and reviewed by two anonymous referees.
Abdou, W. A., Diner, D. J., Martonchik, J. V., Bruegge, C. J., Kahn, R.A., Gaitley, B. J., Crean, K. A., Remer, L. A., and Holben, B. N.: Comparison of coincident multi angle imaging spectroradiometer and moderate resolution imaging spectroradiometer aerosol optical depths over land and ocean scenes containing AErosol RObotic NETwork sites, J. Geophys. Res., 110, D10S07, https://doi.org/10.1029/2004JD004693, 2005.
Alam, K., Trautmann, T., and Blaschke, T.: Aerosol optical properties and radiative forcing over mega-city Karachi, Atmos. Res., 101, 773–782, 2011.
Alexandrov, M. D., Schmid, B., Turner, D. D., Cairns, B., Oinas, V., Lacis, A. A., Gutman, S. I., Westwater, Ed. R., Smirnov, A., and Eilers, J.: Columnar water vapor retrievals from multi-filter rotating shadow-band radiometer data, J. Geophys. Res., 114, D02306, https://doi.org/10.1029/2008JD010543, 2009.
Arola, A., Schuster, G., Myhre, G., Kazadzis, S., Dey, S., and Tripathi, S. N.: Inferring absorbing organic carbon content from AERONET data, Atmos. Chem. Phys., 11, 215–225, https://doi.org/10.5194/acp-11-215-2011, 2011.
Aruna, K., Lakshmi Kumar, T. V., Krishna Murthy, B. V., Suresh Babu, S., Venkat Ratnam, M., and Narayana Rao, D.: Short wave Aerosol Radiative Forcing estimates over a semi urban coastal environment in south-east India and validation with surface flux measurements, Atmos. Environ., 125, 418–428, 2016.
Babu, S. S., Satheesh, S. K., and Moorthy, K. K.: Aerosol radiative forcing due to enhanced black carbon at an urban site in India, Geophys. Res. Lett. 29, 1880, https://doi.org/10.1029/2002GL015826, 2002.
Bergstrom, R. W., Pilewskie, P., Russell, P. B., Redemann, J., Bond, T. C., Quinn, P. K., and Sierau, B.: Spectral absorption properties of atmospheric aerosols, Atmos. Chem. Phys., 7, 5937–5943, https://doi.org/10.5194/acp-7-5937-2007, 2007.
Charlson, R. J., Schwartz, S. E., Hales, J. M., Cess, R. D., Coakley, Jr., J. A., Hansen, J. E., and Hofman, D. J.: Climate forcing by anthropogenic aerosols, Science, 255, 423–430, 1992.
Cheng, T., Wang, H., Xu, Y., Li, H., and Tian, L.: Climatology of aerosol optical properties in northern China, Atmos. Environ., 40, 1495–1509, 2006a.
Cheng, T., Liu, Y., Lu, D., Xu, Y., and Li, H.: Aerosol properties and radiative forcing in Hunshan Dake desert, northern China, Atmos. Environ., 40, 2169–2179, 2006b.
Chew, B. N., Campbell, J. R., Reid, J. S., Giles, D. M., Welton, E. J., Salinas, S. V., and Liew, S. C.: Tropical cirrus cloud contamination in sun photometer data, Atmos. Environ., 45, 6724–6731, https://doi.org/10.1016/j.atmosenv.2011.08.017, 2011.
Crutzen, P. J. and Andreae, M. O.: Biomass burning in tropics: impact on atmospheric chemistry and biogeochemical cycles, Science, 250, 1669–1678, 1990.
Devara, P. C. S., Raj, P. E., Sharma, S., and Pandithurai, G.: Long-term variations in lidar-observed urban aerosol characteristics and their connection with meteorological parameters, Int. J. Climatol., 14, 581–591, 1994.
Devara, P. C. S., Maheskumar, R. S., Raj, P. E., Dani, K. K., and Sonbawne, S. M.: Some features of aerosol optical depth, ozone and Precipitable water content observed over land during the INDOEX-IFP 99, Meteorol. Z., 10, 123–130, 2001.
Devara, P. C. S., Maheskumar, R. S., Raj, P. E., Pandithurai, G., and Dani, K. K.: Recent trends in aerosol climatology and air pollution as inferred from multi-year Lidar observations over a tropical urban station, Int. J. Climatol., 22, 435–449, 2002.
Devara, P. C. S., Saha, S. K., Ernest Raj, P., Sonbawne, S. M., Dani, K. K., Tiwari, K., and Maheskumar, R. S.: A four-year climatology of total column tropical urban aerosol, ozone and water vapor distributions over Pune, India, Aerosol Air Qual. Res., 5, 103–114, 2005.
Diner, D. J., Asner, G. P., Davies, R., Knyazikhin, Y., Muller, J. -P., Nolin, A. W., Pinty, B., Schaaf, C. B., and Stroeve, J.: New directions in Earth observing: Scientific applications of multiangle remote sensing, B. Am. Meteorol. Soc., 80, 2209–2228, https://doi.org/10.1175/1520-0477(1999)080<2209:NDIEOS>2.0.CO;2, 1999.
Dubovik, O., Holben, B. N., Kaufman, Y. J., Yamasoe, M., Smirnov, A., Tanré, D., and Slutsker, I.: Single-scattering albedo of smoke retrieved from the sky radiance and solar transmittance measured from ground, J. Geophys. Res., 103, 31903–31924, 1998.
Dubovik, O., Holben, B. N., Eck, T., Smirnov, A., Kaufman, Y. J., King, M., Tanré, D., and Slutsker, I.: Variability of absorption and optical properties of key aerosol types observed in worldwide locations, J. Atmos. Sci., 59, 590–608, 2002.
Eck, T. F., Holben, B. N., Reid, J. S., Dubovik, O., Smirnov, A., O'Neill, N. T., Slutsker, I., and Kinne, S.: Wavelength dependence of the optical depth of biomass burning, urban, and desert dust aerosols, J. Geophys. Res., 104, 31333–31349, https://doi.org/10.1029/1999JD900923, 1999.
Eck, T. F., Holben, B. N., Dubovik, O., Smirnov, A., Slutsker, I., Lobert, J. M., and Ramanathan, V.: Column-integrated aerosol optical properties over the Maldives during the northeast monsoon for 1998–2000, J. Geophys. Res., 106, 555–566, 2001.
Ganguly, D., Jayaraman, A., and Gadhavi, H.: Physical and optical properties of aerosols over an urban location in western India: seasonal variabilities, J. Geophys. Res., 111, D24206, https://doi.org/10.1029/2006JD007392, 2006.
García, O. E., Díaz, A. M., Expósito, F. J, Díaz, J. P., Dobovik, O., Dubuisson, P., Roger, J.-C., Eck, T. F., Sinuk, A., Derimian, Y., Dutton, E. G., Schafer, J. S., Holben, B. N., and García, C.A.: Validation of AERONET estimates of atmospheric solar fluxes and aerosol radiative forcing by ground-based broadband measurements, J. Geophys. Res., 113, D21207, https://doi.org/10.1029/2008JD010211, 2008.
García, O. E., Díaz, J. P., Expósito, F. J., Díaz, A. M., Dubovik, O., Derimian, Y., Dubuisson, P., and Roger, J.-C.: Shortwave radiative forcing and efficiency of key aerosol types using AERONET data, Atmos. Chem. Phys., 12, 5129–5145, https://doi.org/10.5194/acp-12-5129-2012, 2012.
Giles, D. M., Holben, B. N., Tripathi, S. N., Eck, T. F., Newcomb, W. W., Slutsker, I., Dickerson, R. R., Thompson, A. M., Mattoo, S., Wang, S. H., Singh, R. P., Sinyuk, A., and Schafer, J. S.: Aerosol properties over the Indo-Gangetic plain: a mesoscale perspective from the TIGERZ experiment, J. Geophys. Res., 116, D18203, https://doi.org/10.1029/2011JD015809, 2011.
Giles, D. M., Holben, B. N., Eck, T. F., Sinyuk, A., Smirnov, A., Slutsker, I., Dickerson, R. R., and Thompson, A. M., and Schafer, J. S.: An analysis of AERONET aerosol absorption properties and classifications representative of aerosol source regions, J. Geophys. Res., 117, D17203, https://doi.org/10.1029/2012JD018127, 2012.
Giles, D. M., Sinyuk, A., Sorokin, M. G., Schafer, J. S., Smirnov, A., Slutsker, I., Eck, T. F., Holben, B. N., Lewis, J. R., Campbell, J. R., Welton, E. J., Korkin, S. V., and Lyapustin, A. I.: Advancements in the Aerosol Robotic Network (AERONET) Version 3 database – automated near-real-time quality control algorithm with improved cloud screening for Sun photometer aerosol optical depth (AOD) measurements, Atmos. Meas. Tech., 12, 169–209, https://doi.org/10.5194/amt-12-169-2019, 2019.
Gobbi, G. P., Kaufman, Y. J., Koren, I., and Eck, T. F.: Classification of aerosol properties derived from AERONET direct sun data, Atmos. Chem. Phys., 7, 453–458, https://doi.org/10.5194/acp-7-453-2007, 2007.
Hansen, J., Sato, M., Ruedy, R., Lacis, A., and Oinas, V.: Global warming in the twenty-first century: An alternative scenario, P. Natl. Acad. Sci. USA, 97, 9875–9880, 2000.
He, Z. Z., Mao, J. K., and Han, X. S.: Non-parametric estimation of particle size distribution from spectral extinction data with PCA approach, Powder Technol., 325, 510–518, 2018.
Holben, B. N., Eck, T. F., Slutsker, I., Tanre, D., Buis, J. P., Setzer, A., Vermote, E., Ragan, J. A., Kaufman, Y. J., Nakajima, T., Lavenu, F., Jankowiak, I., and Smirnov, A.: AERONET–A federated instrument network and data archive for aerosol characterization, Remote Sens. Environ., 66, 1–16, https://doi.org/10.1016/S0034-4257(98)00031-5, 1998.
Holben, B. N.,Tanré, D., Smirnov, A., Eck, T. F., Slutsker, I., Abuhassan, N., Newcomb, W. W., Schafer, J. S., Chatenet, B., Lavenu, F., Kaufman, Y. J., Vande Castle, J., Setzer, A., Markham, B., Clark, D., Frouin, R., Halthore, R., Karneli, A., O`Neill, N. T., Pietras, C., Pinker, R. T., Voss, K., and Zibordi, G.: An emerging ground–based aerosol climatology: Aerosol optical depth from AERONET, J. Geophys. Res., 106, 12067–12097, https://doi.org/10.1029/2001JD900014, 2001.
Hoppel, W. A., Fitzgerald, J. W., and Larson, R. E.: Aerosol size distributions in air masses advecting off the east coast of the United States, J. Geophys. Res., 90, 2365–2379, 1985.
Hsu, N. C., Hermann, J. R., and Weaver, C.: Determination of radiative forcing of Saharan dust using combined TOMS and ERBE data, J. Geophys. Res., 108, 20649–20661, 2000.
Huang, J. F., Hsu, N. C., Tsay, S. C, Holben, B. N., Welton, E. J., Smirnov, A., Hansell, R. A., Berkoff, T. A., Liu, Z. Y., Liu, G. R., Cambell, I. R., Liew, S. C., Jeong, M. J., and Bames, I. E.: Evaluations of cirrus contamination and screening in ground aerosol observations using collocated lidar systems, J. Geophys. Res., 117, D15204, https://doi.org/10.1029/2012JD017757, 2012.
Humera, B., Khan, A., Farrukh, C., Samina, B., Imran, S., and Thomas, B.: Inter-comparison of MODIS, MISR, OMI and CALIPSO aerosol optical depth retrievals for four locations on the Indo-Gangetic plains and validation against AERONET data, Atmos. Environ., 111, 113–126, 2015.
IPCC (Intergovernmental Panel on Climate Change): Climate Change 2001: The scientific basis-contribution of Working Group I to the third assessment report of the Intergovernmental Panel on Climate Change, Cambridge Univ. Press, New York, 2001.
IPCC (Intergovernmental Panel on Climate Change): Climate Change 2007: The scientific basis-contribution of Working Group I to the fourth assessment report of the Intergovernmental Panel on Climate Change, Cambridge Univ. Press, New York, 2007.
Kacenelenbogen, M., Léon, J.-F., Chiapello, I., and Tanré, D.: Characterization of aerosol pollution events in France using ground-based and POLDER-2 satellite data, Atmos. Chem. Phys., 6, 4843–4849, https://doi.org/10.5194/acp-6-4843-2006, 2006.
Kaskaoutis, D. G., Badarinath, K. V. S., Kharol, S. K., Sharma, A. R., and Kambezidis, H. D.: Variations in the aerosol optical properties and types over the tropical urban site of Hyderabad, India, J. Geophys. Res., 114, D22204, https://doi.org/10.1029/2009JD012423, 2009.
Kaskaoutis, D. G., Sinha, P. R., Vinoj, V., Kosmopoulos, P. G., Tripathi, S. N., Misra, A., Sharma, M., and Singh, R. P.: Aerosol properties and radiative forcing over Kanpur during severe aerosol loading conditions, Atmos. Environ., 79, 7–19, 2013.
Khatri, P., Takamura, T., Nakajima, T., Estellés, V., Irie, H., Kuze, H., Campanelli, M., Sinyuk, A., Lee, S.‐M., Sohn, B. J., Padhithurai, G., Kim, S.-W., Yoon, S. C., Lozano, J. A. M., Hashimoto, M., Devara, P. C. S., and Manago, N.: Factors for inconsistent aerosol single scattering albedo between SKYNET and AERONET, J. Geophys. Res.-Atmos., 121, 1859–1877, https://doi.org/10.1002/2015JD023976, 2016.
King, M. D., Kaufman, Y. J., Tanré, D., and Nakajima, T.: Remote sensing of tropospheric aerosols from space: past, present, and future, B. Am. Meteorol. Soc., 80, 2229–2259, 1999.
Koepke, P., Hess, M., Schult, I., and Shettle, E. P.: Global aerosol data set, MPI Meteorol. Hamburg, Report No. 243, 44 pp., 1997.
Kumar, K. R., Sivakumar, V., Reddy, R. R., Gopal, K. R., and Adesina, A. J.: Inferring wavelength dependence of AOD and Ångström exponent over a sub-tropical station in South Africa using AERONET data: Influence of meteorology, long-range transport and curvature effect, Sci. Total Environ., 461, 397–408, 2013.
Kumar, K. R., Kang, N., and Yin, Y.: Classification of key aerosol types and their frequency distributions based on satellite remote sensing data at an industrially polluted city in the Yangtze River Delta, China, Int. J. Climatol., 38, 320–336, 2018.
Kumar, S., Devara, P. C. S., Dani, K. K., Sonbawne, S. M., and Saha, S. K.: Sun-sky radiometer–derived column-integrated aerosol optical and physical properties over a tropical urban station during 2004–2009, J. Geophys. Res., 116, D10201, https://doi.org/10.1029/2010JD014944, 2011.
Kumar, S. and Devara, P. C. S.: Aerosol characterization: comparison between measured and modelled surface radiative forcing over Bay of Bengal, Remote. Sens. Lett., 3, 373–381, https://doi.org/10.1080/01431161.2011.600466, 2012a.
Kumar, S. and Devara, P. C. S.: A long-term study of aerosol modulation of atmospheric and surface solar heating over Pune, India, Tellus B, 64, 18420, https://doi.org/10.3402/tellusb.v64i0.18420, 2012b.
Lee, J., Kim, J., Song, C. H., Chun, Y., Sohn, B. J., and Holben, B. N.: Characteristics of aerosol types from AERONET sunphotometer measurements, Atmos. Environ., 44, 3110–3117, 2010.
Li, Z., Lee, K. -H., Wang, Y., Xin, J., Hao, and W.-M.: First observation-based estimates of cloud-free aerosol radiative forcing across China, J. Geophys. Res. Atmos., 115(D00K18), 2010.
Liou, K. N.: An Introduction to Atmospheric Radiation, Academic Press, Oxford, UK, 583 pp., https://doi.org/10.1256/003590003102695746, 2002.
Mishchenko, M. I., Geogdzhaye, I. V., Rossow, W. B., Cairns, B., Carlson, B. E., Lacis, A. A., Liu, L., and Travis, L. D.: Long-term satellite record reveals likely recent aerosol trend, Science, 315, 1543, https://doi.org/10.1126/science.1136709, 2007a.
Mishchenko, M. I., Cairns, B., Hansen, J. E., Travis, L. D., Kopp, G., Schueler, C. F., Fafaul, B. A., Hooker, R. J., Maring, H. B., and Itchkawich, T.: Accurate monitoring of terrestrial aerosol and total solar irradiance. Introducing the GLORY mission, B. Am. Meteorol. Soc., 80, 2229–2259, https://doi.org/10.1175/BAMS-88-5-677, 2007b.
O'Neill, N. T., Dubovik, O., and Eck, T. F.: Modified Ångström coefficient for the characterization of sub-micrometer aerosols, Appl. Optics, 40, 2368–2375, https://doi.org/10.1364/AO.40.002368, 2001.
O'Neill, N. T., Eck, T. F., Smirnov, A., Holben, B. N., and Thulasiraman, S.: Spectral discrimination of coarse and fine mode optical depth, J. Geophys. Res., 108, 4559–4573, https://doi.org/10.1029/2002JD002975, 2003.
Pandithurai, G., Dipu, S., Dani, K. K., Tiwari, S., Bisht, D. S., Devara, P. C. S., and Pinker, R. T.: Aerosol radiative forcing during dust events over New Delhi, India, J. Geophys. Res., 113, D13209, https://doi.org/10.1029/2008JD009804, 2008.
Pathak, B., Kalita, G., Bhuyan, P., and Moorthy, K.: Aerosol temporal characteristics and its impact on short wave radiative forcing at a location in the northeast of India, J. Geophys. Res., 115, D19204, https://doi.org/10.1029/2009JD013462, 2010.
Pathak, B., Bhuyan, P. K., Gogoi, M. M., and Bhuyan, K.: Seasonal heterogeneity in aerosol types over Dibrugarh, North – Eastern India, Atmos. Environ., 47, 307–315, https://doi.org/10.1016/j.atmosenv.2011.10.061, 2012.
Ramachandran, S. and Cherian, R.: Regional and seasonal variations in aerosol optical characteristics and their frequency distributions over India during 2001–2005, J. Geophys. Res., 113, D08207, https://doi.org/10.1029/2007JD008560, 2008.
Remer, L. A., Kaufman, Y. J., Tanré, D., Mattoo, S., Chu, D. A., Martins, J. V., Li, R.-R., Ichoku, C., Levy, R. C., Kledman, R. G., Eck, T. F., Vermote, E., and Holben, B. N.: The MODIS aerosol algorithm, products, and validation, J. Atmos. Sci., 62, 947–973, https://doi.org/10.1175/JAS3385.1, 2005.
Russell, P. B., Bergstrom, R. W., Shinozuka, Y., Clarke, A. D., DeCarlo, P. F., Jimenez, J. L., Livingston, J. M., Redemann, J., Dubovik, O., and Strawa, A.: Absorption Angstrom Exponent in AERONET and related data as an indicator of aerosol composition, Atmos. Chem. Phys., 10, 1155–1169, https://doi.org/10.5194/acp-10-1155-2010, 2010.
Schmid, J., Michalsky, J. J., Slater, D. W., Bernard, J. C., Halthore, R. N., Liljegren, J. C., Holben, B. N., Eck, T. F., Livingston, J. M., Russell, J. B., Ingold, T., and Slustsker, I.: Comparison of columnar water-vapor measurements from solar transmittance methods, Appl. Optics, 40, 1886–1896, https://doi.org/10.1364/AO.40.001886, 2001.
Schuster, G. L., Dubovik, O., and Holben, B. N.: Angstrom exponent and bimodal aerosol size distributions, J. Geophys. Res., 111, D07207, https://doi.org/10.1029/2005JD006328, 2006.
Singh, R. P., Dey, S., Tripathi, S. N., Tare, V., and Holben, B. N.: Variability of aerosol parameters over Kanpur, Northern India, J. Geophys. Res., 109, D23206, https://doi.org/10.1029/2004JD004966, 2004.
Sinha, P. R., Kaskaoutis, D. G., Manchanda, R. K., and Sreenivasan, S.: Characteristics of aerosols over Hyderabad in southern Peninsular India: synergy in the classification techniques, Ann. Geophys., 30, 1393–1410, https://doi.org/10.5194/angeo-30-1393-2012, 2012.
Sinyuk, A., Torres, O., and Dubovik, O.: Combined use of satellite and surface observations to infer the imaginary part of the refractive index of Saharan dust, Geophys. Res. Lett., 30, 1081, https://doi.org/10.1029/2002GL016189, 2003.
Sinyuk, A., Dubovik, O., Holben, B. N., Eck, T. F., Breon, F-M., Martonchik, J., Khan, R., Diner, D. J., Verrmote, E. F., Roger, J.-C., Lapyonok, T., and Ilya, S.: Simultaneous retrieval of aerosol and surface properties from a combination of AERONET and satellite data, Remote Sens. Environ., 107, 90–108, 2007.
Smirnov, A., Holben, B. N., Eck, T. F., Dubovik, O., and Slutsker, I.: Cloud screening and quality control algorithms for the AERONET data base, Remote Sens. Environ., 73, 337–349, 2000.
Smirnov, A., Holben, B. N., Dubovic, O, O'Neill, N. T., Eck, T. F., Westphal, D. L., Goroth, A. K., Pietras, C., and Slutsker, I.: Atmospheric aerosol optical properties in the Persian Gulf, J. Atmos. Sci., 59, 620–634, https://doi.org/10.1175/1520-0469(2002)059<0620:AAOPIT>2.0.CO;2, 2002a.
Smirnov, A., Holben, B. N., Kaufman, Y. J., Dubovic, O., Eck, T. F., Slutsker, I., Pietras, C., and Halthore, R. N.: Optical properties of atmospheric aerosol in maritime environments, J. Atmos. Sci., 59, 501–523, https://doi.org/10.1175/1520-0469(2002)059<0501:OPOAAI>2.0.CO;2, 2002b.
Smirnov, A., Holben, B. N., Lyapustin, A., Slutsker, I., and Eck, T. F.: AERONET processing algorithms refinement, AERONET 2004 Workshop, 10–14 May 2004, El Arenosillo, Spain, 2004.
Streets, D. G., Yan, F., Chin, M., Diehl, T., Mahowald, N., Schultz, M., Wild, M., Wu, Y., and Yu, C.: Anthropogenic and natural contributions to regional trends in aerosol optical depth, 1980–2006, J. Geophys. Res., 114, D00D18, https://doi.org/10.1029/2008JD011624, 2009.
Suresh Babu, S., Krishna Moorthy, K., and Satheesh, S. K.: Temporal heterogeneity in aerosol characteristics and the resulting radiative impacts at a tropical coastal station – Part 2: Direct short wave radiative forcing, Ann. Geophys., 25, 2309–2320, https://doi.org/10.5194/angeo-25-2309-2007, 2007.
Tan, H., Liu, L., Fan, S., Li, F., Yin, Y., Cai, M., and Chan, P. W.: Aerosol optical properties and mixing state of black carbon in the Pearl River Delta, China, Atmos. Environ., 131, 196–208, 2016.
Tanré, D., Bréon, F. M., Deuzé, J. L., Herman, M., Goloub, P., Nadal, F., and Marchand, A.: Global observation of anthropogenic aerosols from satellite, Geophys. Res. Lett., 28, 4555–4558, 2001.
Tiwari, S., Kaskaoutis, D., Soni, V. K., Attri, S. D., and Singh, A. K.: Aerosol columnar characteristics and their heterogeneous nature over Varanasi, in the central Ganges valley, Environ. Sci. Pollut. R., 25, 24726–24745, https://doi.org/10.1007/s11356-018-2502-4, 2018.
Tripathi, S. N., Dey, S., Chandel, A., Srivastava, S., Singh, R. P., and Holben, B. N.: Comparison of MODIS and AERONET derived aerosol optical depth over the Ganga Basin, India, Ann. Geophys., 23, 1093–1101, https://doi.org/10.5194/angeo-23-1093-2005, 2005.
Verma, S., Prakash, D., Ricaud, P., Payra, S., Attie, J.-L., and Soni, M.: A new classification of aerosol sources and types as measured over Jaipur, India, Aerosol Air Qual. Res., 15, 985–993, 2015.
Vijayakumar, K., Devara, P. C. S., and Simha, C. P.: Aerosol features during drought and normal monsoon years: A study undertaken with multi-platform measurements over a tropical urban site. Aerosol Air Qual. Res., 12, 1444–1458, https://doi.org/10.4209/aaqr.2012.01.0005, 2012.
Vijayakumar, K. and Devara, P. C. S.: Variations in aerosol optical and microphysical properties during an Indian festival observed with space-borne and ground-based observations, Atmósfera, 25, 381–395, 2012.
Vijayakumar, K. and Devara, P. C. S.: Study of aerosol optical depth, ozone, and precipitable water vapour content over Sinhagad, a high-altitude station in the Western Ghats, Int. J. Remote Sens., 34, 613–630, 2013.
Vijayakumar, K., Devara, P. C. S., and Sonbawne, S. M.: Type-segregated aerosol effects on regional monsoon activity: A study using ground-based experiments and model simulations, Atmos. Environ., 99, 650–659, 2014.
Wang, M., Zhang, R., and Pu, Y.: Recent researches on aerosol in China, Adv. Atmos. Sci., 18, 576–586, 2001.
Wild, M., Trüssel, B., Ohmura, A., Long, C. N., König-Langlo, G., Dutton, E. G., and Tsvetkov, A.: Global dimming and brightening: An update beyond 2000, J. Geophys. Res., 114, D00D13, https://doi.org/10.1029/2008JD011382, 2009.
WMO: Radiation Commission of IAPAM Meeting of Experts on Aerosol and Their Climatic Effects,Williamsburg, VA, WCP55, 28–30, 1983.
Wu, L. and Zeng, Q.-C.: Study on probability distributions of multi-timescale aerosol optical depth using AERONET data, Atmospheric and Oceanic Science Letters, 4, 216–222, 2011.
Xia, X.: Parameterization of clear-sky surface irradiance and its implications for estimation of aerosol direct radiative effect and aerosol optical depth, Scientific Reports, 5, 14376, https://doi.org/10.1038/srep14376, 2015.
Xie, Y., Li, Z., and Li, L.: Aerosol optical, microphysical, chemical and radiative properties of high aerosol load cases over the Arctic based on AERONET measurements, Scientific Reports, 8, 9376, https://doi.org/10.1038/s41598-018-27744-z, 2018.
Yu, H., Kaufman, Y. J., Chin, M., Feingold, G., Remer, L. A., Anderson, T. L., Balkanski, Y., Bellouin, N., Boucher, O., Christopher, S., DeCola, P., Kahn, R., Koch, D., Loeb, N., Reddy, M. S., Schulz, M., Takemura, T., and Zhou, M.: A review of measurement-based assessments of the aerosol direct radiative effect and forcing, Atmos. Chem. Phys., 6, 613–666, https://doi.org/10.5194/acp-6-613-2006, 2006.
Zege, E. P., Ivanov, A. P., and Katzev, I. L.: Image transfer through a scattering medium, Springer, Berlin, New York, USA, 1991.
Zhao, T. X., Laszlo, P. I., Guo, W., Heidinger, A., Cao, C., Jelenak, A., Tarpley, D., and Sullivan, J.: Study of long-term trend in aerosol optical thickness observed from operational AVHRR satellite instrument, J. Geophys. Res., 113, D07201, https://doi.org/10.1029/2007JD009061, 2008.