the Creative Commons Attribution 4.0 License.
the Creative Commons Attribution 4.0 License.
A miniature Portable Emissions Measurement System (PEMS) for real-driving monitoring of motorcycles
Michal Vojtisek-Lom
Alessandro A. Zardini
Martin Pechout
Lubos Dittrich
Fausto Forni
François Montigny
Massimo Carriero
Barouch Giechaskiel
Giorgio Martini
We present an exploratory study carried out with a new miniature portable emission measurement system (Mini-PEMS) specifically designed at the Technical University of Liberec (CZ) for applications on two-wheeler vehicles owing to its reduced size () and weight (≈15 kg). It measures the exhaust gas concentrations of hydrocarbons and carbon mono- and dioxide with a nondispersive infrared method and nitrogen mono- and dioxides and oxygen using an electrochemical cell. In addition, the instrument acquires the engine speed, manifold absolute pressure, inlet and exhaust gas temperature, geo-localization, and vehicle speed. The exhaust mass flow rate is calculated from engine and emission data. The Mini-PEMS was validated on three two-wheelers (one moped and two motorcycles) against laboratory-grade instrumentation in the Vehicle Emissions Laboratory of the European Commission in terms of measured concentrations, exhaust flow, fuel consumption, and mass emission of pollutants. The mean absolute deviations of gas concentrations were 8 % for HC, 8 % for CO, 13 % for NOx, and 2 % for CO2, while the mass emissions (which include the exhaust flow determination uncertainty) were 7 % for HC, 7 % for CO, 9 % for NOx, and 5 % for CO2. An agreement of 2 % was achieved between the fuel consumption measured in the laboratory and calculated by the Mini-PEMS. As an application, the instrument was tested on board the vehicles during on-road trips. The emissions measured on the road were consistent among repeated runs, with differences between laboratory and on-road tests much larger than those between the Mini-PEMS and laboratory. We found similar or larger HC and NOx real-driving emissions and larger CO emissions from motorcycles and smaller ones for the moped. Considering its size and weight, the Mini-PEMS proved to be an efficient tool for vehicle monitoring, research and development and could be tested for in-service monitoring applications related to carbon monoxide and nitrogen oxides emissions. A tentative approach to characterize particulate mass and particle number was presented and compared to the existing filter method and nonvolatile particle number protocol.
- Article
(4980 KB) - Full-text XML
-
Supplement
(1230 KB) - BibTeX
- EndNote
Exhaust emissions from internal combustion engines remain one of the primary sources of air pollution in populated areas and are believed to be responsible in the European Union (EU) for an order of magnitude more premature deaths than traffic accidents (EEA, 2018).
Two-wheelers such as mopeds and motorcycles are known to be strong emitters of particulate matter, hydrocarbons, and carbon monoxide, and their contribution to air pollution can be amplified by their mode of use, mainly urban and with cold engine conditions (e.g., Kumar et al., 2011; Platt et al., 2014 and references therein). In addition, the aged exhaust emissions from two-stroke mopeds were demonstrated to be active in the production of secondary organic aerosols, so that the term “asymmetric pollution” was introduced to describe the low share of the total vehicle fleet along with the large contribution to air pollution (Platt et al., 2014). The use of alkylated fuels with only trace content of aromatic compounds (< 1 % v∕v concentration compared to 29 %–35 % v∕v concentration in standard gasoline) proved to be extremely beneficial in terms of particulate emissions and secondary aerosol formation as demonstrated by Zardini et al. (2014).
Improvements in engines and exhaust after-treatment technology for two-wheelers and recent legislative development (introduction of Euro 3 emission standards for mopeds in 2014 and Euro 4 for all two-wheelers in 2016–2018) have considerably enlarged the distribution width of emissions (Clairotte et al., 2016). As a result, the circulating fleet of two-wheelers is very heterogeneous in terms of exhaust emissions, including older Euro 2 mopeds (registered in the period 2002–2013) together with the new Euro 4 motorcycles (introduced in 2016). In addition, the presence of tampered vehicles, which are modified for better performance by acting on the propulsion unit and/or after treatment system, may further increase the emission distribution width (Zardini et al., 2016a).
Exhaust emissions from vehicles need to be carefully addressed during laboratory type-approval tests, but they generally tend to be higher during real-driving conditions because of various factors such as driving style (maximum speed, accelerations, and gear-shift strategy), ambient conditions (e.g., temperature, humidity, wind, altitude, and road friction), engine, and vehicle general conditions (e.g., tire pressure, additional weight, aging of the after-treatment system) (Weiss et al., 2011). In order to reduce the discrepancy between real-driving emissions (RDE) and type-approval emissions, the characterization of RDE using portable emissions monitoring systems (PEMSs) has been introduced into legislation in the United States and EU for heavy-duty vehicles and passenger cars (US EPA, 2005; EC, 2011, 2012, 2017, 2018).
The EU type-approval legislation has been recently updated for what concerns two-wheelers, tricycles, and quadricycles such as mini cars and quads (EC, 2013, 2014). These vehicles are grouped in the so called “L-category” family for which two environmental packages were introduced: Euro 4 from 2016 and Euro 5 from 2020. Additional features to be assessed for post-Euro 5 environmental measures are stipulated in recital 12 of Regulation EU 168/2013 (EC, 2013) and involve the feasibility of particle number measurements (Giechaskiel et al., 2015) and off-cycle emissions, i.e., non-type-approval driving cycles run on a chassis dynamometer. The baseline concept promoted by the European Commission is that an L-category vehicle should be clean and energy efficient in each point of its possible operation range, in addition to the type-approval driving cycle (Zardini et al., 2016b).
Before the introduction of Euro 5 for the L-category, the European Commission undertook an environmental effect study (Zardini et al., 2016b; Ntziachristos et al., 2017) which included a preliminary assessment of RDE. The effect study concluded that the concentrations of pollutants can be measured with a marketable, small, portable system exhibiting an average discrepancy of about 10 % during chassis dynamometer tests, except for hydrocarbons affected by more than 50 % discrepancy. The disagreement in hydrocarbons measurements stems from different applied techniques: flame ionization detector with the use of a hydrogen cylinder in the test-cell and nondispersive infrared in the PEMS (in order to exclude safety issues related to the transportation of a hydrogen cylinder on a two-wheeler). Mass emissions during lab tests and RDE on-road tests compared to lab tests were instead vehicle and compound dependent and affected by larger uncertainty and discrepancy due to the additional estimate of the exhaust flow. Exhaust mass flowmeters mounted on passenger cars are still too heavy and energy consuming to be deployed on two-wheelers during RDE tests (see Ntziachristos et al., 2017, for further details), and exhaust pulsations might be an issue for them.
PEMSs use analyzers to continuously measure the concentrations of the pollutants of interest and methods to measure or estimate the instantaneous flow of exhaust. The data are then synchronized and concentrations multiplied by the corresponding exhaust flow to obtain instantaneous mass emissions of the measured pollutants. Early PEMSs relied on simple automotive exhaust analyzers such as those used in the California Air Resources Board periodic inspection programs, with the exhaust flow neglected (Kelly and Groblicki, 1993), inferred from engine operating data (Vojtisek-Lom, 1997), or measured by a Pitot tube (Breton, 2000) or similar device.
With few exceptions (e.g., Lenaers, 2003), the majority of PEMSs use standard nondispersive infrared (NDIR) analyzers to monitor carbon monoxide (CO) and dioxide (CO2), chemiluminescence or nondispersive ultraviolet spectroscopy for nitrogen monoxide (NO) and dioxide (NO2), and flame ionization detection (FID) for hydrocarbons (HC). Some early PEMSs (Vojtisek-Lom and Cobb, 1997; Breton, 2000) were based on analytical components from garage-grade analyzers (HC, CO, and CO2 measured with NDIR; NO and O2 with electrochemical cells). Despite the considerable miniaturization and improvements in recent PEMS technology, only a couple of PEMS models are at present marketable featuring technical specifications suitable for the L-category: light weight, small size, and simultaneous measurements of multi-gas concentrations, engine parameters, and geo-localization. The systems designed for passenger cars and heavy-duty vehicles weigh tens of kilograms (about 100 kg including exhaust flowmeter and batteries, thus disproportionally increasing emissions when on board an L-category vehicle) and are excessively bulky for safe installation on a two-wheeler.
To our knowledge, the peer-reviewed scientific literature about tailpipe emissions from L-category vehicles relies entirely on laboratory measurements using chassis dynamometers. In some cases, the speed profile was recorded during real-world driving and used for subsequent emissions measurement in a laboratory (Zamboni et al., 2011; Murena et al., 2019).
The goals of this study were to (i) demonstrate a miniature PEMS device (Mini-PEMS, hereafter) suitable to be fitted on motorcycles, scooters, and mopeds, (ii) compare it against standard laboratory instrumentation during roller bench tests, and (iii) assess its performance during on-road tests of three two-wheelers – one moped and two motorcycles. The validation was conducted with the intended use of the Mini-PEMS as a tool for research and development, road worthiness (periodical inspections), and screening for the market surveillance (e.g. Regulation EU 2017/1151).
Tailpipe exhaust emissions from three L-category vehicles (one moped, two motorcycles) were characterized during (i) legislative driving cycles on a roller bench in the Vehicle Emissions Laboratory of the European Commission – Joint Research Centre (JRC) and (ii) real-driving tests with a miniature on-board measurement system (Mini-PEMS, Technical University of Liberec, Czech Republic). A schematic summary of the deployed techniques in the test cell and in the Mini-PEMS is presented in Supplement Table S1. Overall, eight laboratory emission tests and nine on-road trips were performed.
2.1 Test cell
The test facility has already been described in Zardini et al. (2014, and references therein). Here, briefly, the vehicles were driven on a 48 in. (1.22 m) roller bench (Zoellner GmbH), and their raw and diluted exhaust was analyzed in accordance with Regulation EU 134/2014 (EC, 2014); see schematic in Fig. 1. Total hydrocarbons (THC), carbon monoxide (CO), and nitrogen oxides (NOx) are regulated by the EU legislation on two-wheelers aiming at reducing air pollution. Carbon dioxide (CO2) is instead reported for energy efficiency assessment and global-warming-related issues but not yet regulated for this class of vehicles. We monitored the raw exhaust at 1 Hz via a 190 ∘C heated line with the following techniques (integrated in the AMA i60 exhaust measurement system, AVL List GmbH, Graz, Austria): flame ionization detector for THC, chemiluminescence detector for NOx, and nondispersive infrared for CO and CO2. The same online techniques were deployed at the constant volume sampler (CVS) after dilution of the exhaust through a Venturi nozzle dilution tunnel (CVS flow ≈5 m3 min−1; average dilution ≈ 25). Finally, a constant volume sample taken from the CVS flow was collected in Tedlar bags and analyzed offline after the test. The results of the bag analysis yield the legislative emission factors (EFs) given in mass-per-distance unit. Following a well-established methodology, bag values were corrected for exhaust extracted from the tailpipe due to raw-exhaust sampling by multiple devices. For instance, the range of mass extracted per total mass of CO2 is between 9 % for Vehicle 2 % and 21 % for the moped. In particular, the laboratory setup can provide three sets of EFs obtained from (i) the raw-exhaust concentrations and flow rate, (ii) the diluted exhaust concentrations and constant flow rate, and (iii) the offline analysis of bag sampling as prescribed by the EU legislation. In the laboratory, two methods are typically applied for the determination of the exhaust flow: (i) the difference between the CVS constant flow and the dilution airflow and (ii) the well-established CO2 tracer method based on raw (tailpipe) and diluted (CVS) CO2 simultaneous measurements (Wiers et al., 1972). Due to the low exhaust flow rate of two-wheelers, the difference between two flows of similar magnitude (CVS and dilution air) measured by different flowmeters results in large uncertainty. Therefore, the CO2 tracer is the method of choice in the present work.
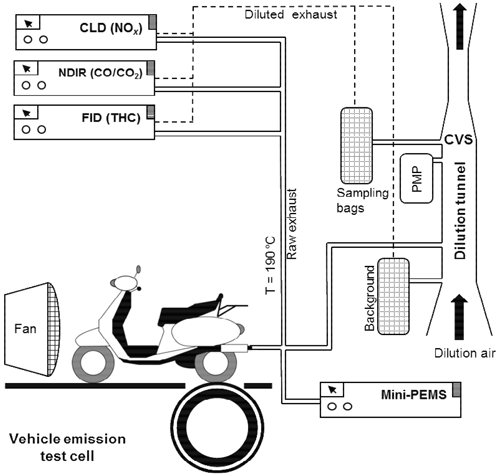
Figure 1Schematic of the test cell and laboratory instrumentation. Exhaust emission measurements are performed at the tailpipe and after dilution through a constant volume sampler (flow rate ≈5 m3 min−1) by two independent gas analyzer systems. The Mini-PEMS collects part of the raw exhaust; see text for details.
The AVL particle counter (APC) 489 (AVL List GmbH, Graz, Austria), compliant with the light-duty vehicle regulations, was connected to the dilution tunnel to measure nonvolatile particles > 23 and > 10 nm (Giechaskiel et al., 2009, 2010). Particulate matter mass was measured on Teflon-coated glass fiber; Pallflex TX40 HI20WW filters according to the regulation (available only for the cold-start cycles).
2.2 Vehicles and driving cycles
The technical specifications of the vehicles under investigation are given in Table 1. We have chosen three popular in-use two-wheelers that are type-approved and sold in the European market based on the stocktaking and market sales analysis in Clairotte et al. (2016): one moped and two medium performance motorcycles, as per EU terminology (EC, 2013). The EU legislation sets the emission limit values for the gaseous pollutants THC, NOx, and CO depending on the Euro standard of homologation and the vehicle L-subcategory, as summarized in Table S2. Note that the provisions for the durability of after-treatment devices, i.e., compliance with limit values within a prescribed mileage, were not enforced for Euro 2 and Euro 3 L-category vehicles. Therefore it could be possible not to comply with emission limits at the time of testing. The two-wheelers were fueled with E5 reference petrol containing ≈5 % v∕v of ethanol (see EC, 2014, for reference fuel specifications) and their fuel consumption measured with a fuel consumption measurement system (KMA, AVL). Supplement Fig. S1 and Table 2 describe the two driving cycles for tailpipe emission monitoring: the United Nations ECE-R47 (UNECE, 1981) driving cycle run for the moped and the Worldwide-harmonized Motorcycle Test Cycle (WMTC) for motorcycles (EC, 2014). The ECE-R47 test cycle consists of eight elementary, consecutive cycles and lasts 896 s in total. Only during Phase 2, also called hot phase (the latter four elementary cycles), the exhaust gas should be sampled to produce the EFs described above for type-approval purposes of Euro 2 mopeds (as of July 2014, the type approval of vehicles requires the sampling of the entire cycle – Euro 3 test procedure for mopeds). However, we sampled and reported both cold and hot phases of the ECE-R47 cycle in order to maximize the range of application of the Mini-PEMS and to report more realistic EFs. The WMTC cycle is mandatory from the introduction of the Euro 4 step for motorcycles, while it was an alternative option for type approval of Euro 3 motorcycles as those in our study. The prescribed WMTC for a specific vehicle is assigned depending on engine displacement and vehicle maximum speed out of a set of five different driving cycle types (EC, 2014): Vehicles 2 and 3 performed the WMTC type 2-2 and type 2-1, respectively (see Fig. S1). The moped was additionally emission-tested over a wide-open throttle cycle consisting of running the vehicles at constant roller speeds with the throttle plate fully open in order to increase the dynamic range of Mini-PEMS measurements.
Table 1Vehicles' technical specifications. All vehicles were equipped with a four-stroke, spark-ignition engine and a continuously variable transmission. The reported driving cycle is the actual test cycle used in this work and not the type approval; see text for details.
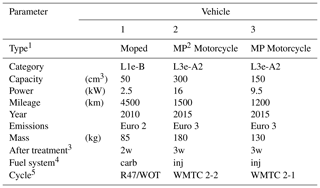
Notes: 1 Type and category according to Regulation EU No. 134 (EC, 2014). 2 MP: medium performance. 3 2w: two-way oxidation catalyst; 3w: three-way catalyst. 4 Carb: carburettor; inj: injection. 5 WOT: wide-open throttle.
Table 2Roller bench driving cycles and on-road trip parameters. Notes:

* Calculated from speed profiles as in UNECE Regulation No. 47 and Regulation EU 134/2014 (EC, 2014).
The real-driving tests were performed for each vehicle by repeating three times a 2.24 km nearly flat land loop (average altitude ≈200 m above sea level; altitude range ≈10 m), mimicking urban and/or suburban driving with cold or hot engine start; see details in Table 2 and Fig. S2. The loops were chosen purely for the Mini-PEMS validation and were designed neither to be comparable to legislative driving cycles on the roller bench nor to fulfill PEMS legislation requirements in EU, which at present are specific only to passenger cars and heavy-duty vehicles.
2.3 Mini-PEMS
The on-road tests were conducted with a miniature portable on-board emissions monitoring system (Mini-PEMS), according to a general concept developed by Vojtisek-Lom et al. (1997, 2009), where instantaneous emissions are determined as a product of the measured concentrations of the pollutants of interest and the estimated mass flow rate of the exhaust. The parameters of the system are given in Table 3 and a schematic in Fig. 2. The system samples undiluted raw exhaust at nominally 8 L min−1. The sample is cooled down by natural convection in the sample line, passed through a condensation bowl from which the condensate is continuously removed by a pump, and reheated in a copper tube immersed in a bath of transformer oil heated by resistance heating to approximately 60 ∘C. The sample is then divided into two paths. In one path, the sample is filtered, passed through a nondispersive infrared (NDIR) analyzer to measure the concentrations of HC, CO, and CO2, and subsequently divided into three electrochemical cells measuring the concentration of oxygen, nitrogen monoxide (NO), and nitrogen dioxide (NO2). In the second path, the sample runs through a semi-condensing integrating nephelometer (635 nm; 45∘ forward scattering) tuned to provide readings proportional to particle mass concentrations and is subsequently run through a heated ionization chamber (241Am, 30 kBq), where the particles present in the chamber deplete the ions, decreasing the current between two electrodes on which a small voltage differential is applied. The change in ionization current has been shown to correlate with the total particle length (independently of the particle size), with a useful measurement range starting at levels corresponding to particle number concentrations of approximately 5×10⁵ particles cm−3 (Vojtisek-Lom, 2011). These methods, although not measuring directly mass or number, can be correlated well to the current methods, i.e., gravimetry of filters and condensation particle counters, respectively (Giechaskiel et al., 2014).
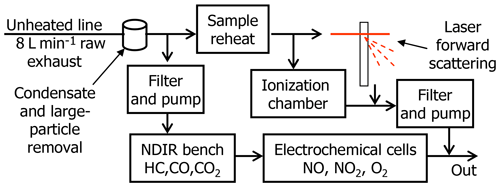
Figure 2Schematic of the miniature portable on-board emissions monitoring system (Mini-PEMS); see text for details.
Table 3Mini-PEMS technical details.
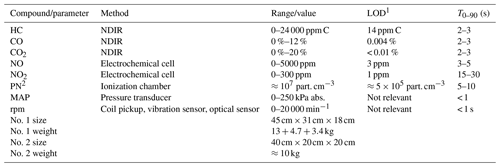
1 LOD – limit of detection, calculated as 3× standard deviation of noise when sampling ambient air. 2 Particle number from total particle length.
The engine speed was measured by an optical sensor pointed at a reflective tape placed on the engine cooling fan mounted on the crankshaft. Alternatively, the setup can determine the engine speed by sensing signals from spark plug or injector wiring – or using vibration sensors. Access to the intake manifold was obtained either from the existing vacuum system or, in its absence, by drilling a small hole into the intake manifold downstream of the throttle plate; see Picture S1.
Vehicle speed and position were measured by a Global Positioning System (GPS) receiver. All data were acquired by a built-in industrial computer. The system has a footprint of 45 cm×31 cm, a height of 18 cm, and mass of 13 kg and operates on 9–14 V with a consumption of approximately 50 W. The total mass of the system, including power electronics, sensors, cables, and sample lines, was 17.7 kg. The setup was mounted on the luggage rack of the two-wheelers and powered by an external battery (12 V; 20Ah LiFeYPo; 3.4 kg; allowing 3–4 h of autonomy) attached to the platform for the rider's feet. The installation of the system is shown in Picture S1, with details of the engine speed sensor, intake manifold pressure sampling point, and exhaust sampling given in Picture S2.
A second Mini-PEMS system (Mini-PEMS No. 2) based on the same measurement techniques explained above – and using the same key components (except for the light scattering sensor, which was omitted) but smaller and lighter than Mini-PEMS No. 1 – was deployed in parallel during the three roller bench tests of Vehicle 2; see Picture S3. It featured a built-in battery allowing 3–4 h of autonomous run time, a footprint of 40 cm×20 cm, height of 20 cm, and total mass of less than 10 kg.
The fuel consumption measured by the KMA flowmeter was compared to the fuel consumption inferred from the emissions measured by the Mini-PEMS and by the laboratory. In both cases, the mass emissions of carbon were calculated from THC, CO, and CO2 emissions and then divided by the 86.6 % carbon content of the fuel to obtain fuel mass flow rate (MFR):
where Mx is the molar mass of carbon (C), CO, CO2 and HC, x (g s−1) is the mass flow of compound x, 0.866 represents the mass fraction of carbon in the fuel. A molar weight of HC = 14 g mol−1 was calculated from fuel properties. Emissions over a test run are obtained by integrating the instantaneous emissions and dividing the total emissions (in grams per test) by the total distance driven to obtain emission factors in grams per kilometer (g km−1). Note that the EU legislation prescribes fuel consumption calculations based on integrated offline bag results, partly to avoid the uncertainty caused by synchronization and dynamic correction of instantaneous data.
The exhaust flow rate is inferred from the intake airflow, which is estimated using the speed-density method from measured engine speed and intake manifold pressure and temperature, engine displacement and known or assumed engine volumetric efficiency (Vojtisek-Lom, 1997; Vojtisek-Lom and Cobb, 1997). The original formula assumed general volumetric efficiency (0.9–0.95 at higher loads) of automotive engines, which is excessively high for small engines. Empirical adjustments were therefore introduced based on laboratory tests to account for considerable lower volumetric efficiencies for small motorcycle engines, especially in the lower end of their rpm range. The intake flow rate can therefore be obtained from
where mair is the intake mass flow rate, 0.0289 is the molar weight of ambient air in the standard atmosphere, V is the engine displacement, ηvol is the engine volumetric efficiency, rpm is the engine rotational speed, MAP is the manifold absolute pressure, pbar is the barometric pressure, CR is the dimensionless engine compression ratio, and Tint is the intake air temperature.
Two scenarios were considered:
- a.
constant volumetric efficiency of ηvol-const=0.5 for all combinations of engine speed and load; this approach is believed to provide a reasonable estimate for naturally aspirated engines without exhaust gas recirculation (see Sect. 3)
- b.
engine speed- and load-dependent volumetric efficiency ηvol-var calculated using the empirical formula derived by comparing instantaneous fuel consumption obtained by direct measurement and calculated from Mini-PEMS data as follows:
where CR is the dimensionless engine compression ratio, and pbar is the barometric pressure in kPa.
In both scenarios, the empirical values were obtained iteratively by comparing instantaneous mass fuel flow rate calculated by the Mini-PEMS with the instantaneous fuel consumption measured by the laboratory (results not reported here).
While exhaust flow can be inferred from known exhaust and fuel composition and from either fuel or intake airflow (Vojtisek-Lom and Cobb, 1997), for simplicity, the intake flow as described above was used in lieu of the exhaust flow in Mini-PEMS fuel flow and exhaust calculations. Additionally, the volumetric efficiency included a variable dry-to-wet correction (Giechaskiel et al., 2019a) applied to measured CO2 and CO.
The emission factors from PEMS measurements were finally calculated as follows:
where mair is the molar flow of the intake air, [X] is the volume fraction of the X compound in the undiluted exhaust, and Mx is the molar weight of the X compound.
The validation of the Mini-PEMS against laboratory instrumentation over roller bench tests performed in accordance with Regulation 134/2014 (EC, 2014) was based on the comparison of (i) the pollutant concentration profiles from the raw exhaust, (ii) the exhaust flow rates and (iii) the emission factors. Ultimately, EFs obtained on the road with the Mini-PEMS should be compared with (i) laboratory EFs originated from the legislative method to assess the severity of the test cycle with respect to real-driving and/or with (ii) emission limit values prescribed by the legislation in order to validate the environmental performance of the vehicle, as prescribed in the recent Euro 6 legislation dealing with in-service conformity of passenger cars (EC, 2018; Varella et al., 2018). As expected from basic principles governing the combustion of small gasoline engines, NO2 emissions were negligible (up to 1 % of NO) and therefore not reported.
3.1 Mini-PEMS versus laboratory
3.1.1 Pollutant concentrations
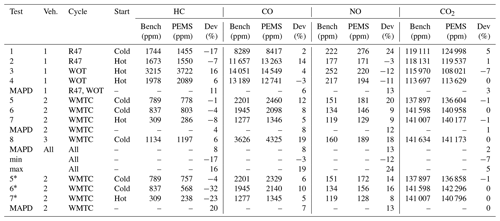
Table 4 compares gaseous average concentrations of THC, CO, NOx, and CO2 obtained with laboratory instrumentation (bench) against those from the two Mini-PEMSs during eight roller bench tests according to the methods described in Sect. 2. Single-test percentage deviations, mean absolute percentage deviations (MAPD) for each vehicle and overall for the fleet, and maximum and minimum deviations are included. Considering Mini-PEMS No. 1, the overall MAPD was 2 % for CO2, 8 % for HC and CO, and 13 % for NOx, indicating very good agreement with laboratory instruments. The best agreement was obtained for CO2, which typically exhibits the largest and most stable concentration profile during emission testing from internal combustion engines. The worst single-test deviation was for NOx in Test 1 (24 %) due to substantial zero drift of the Mini-PEMS sensor.
Table 4Comparison of HC, CO, NOx, and CO2 raw-exhaust concentrations (ppm) measured with the standard test cell instrumentation (bench) and the Mini-PEMS No.1 during legislative test cycles (WMTC and R47) and wide-open throttle tests (Vehicle 1) on the roller bench. Dev: deviation; MAPD: mean absolute percentage deviation; min/max: minimum/maximum deviations. * Tests performed with additional Mini-PEMS No. 2.
An example of raw-exhaust concentration profiles during Test 5 and associated one-to-one plots with linear regression coefficients are plotted in Figs. S3 and S4, respectively. The two Mini-PEMSs followed the dynamic emission pattern well down to a few seconds resolution. The largest discrepancies were related to the signal peaks where the longer or different response time of the Mini-PEMS results in peak magnitude underestimation and subtle shifts in instantaneous values during transients, which negatively affects the coefficients of determination (R2) in Fig. S4.
Table S3 summarizes the comparison between the two Mini-PEMSs and the bench in terms of coefficients of determination. The results vary substantially among the tests. Differences in instantaneous readings during transients and peaks due to limited 1 Hz resolution and different time response constants of the respective instruments, possible dilution of the exhaust sample at idle due to comparable amounts of available exhaust and sampling lines (about 20 L min−1 for the moped), and, in the case of HC, deposition of semivolatile hydrocarbons (known as hydrocarbon hang-up) in the Mini-PEMS sampling train were identified as the main responsible to lower values of coefficients of determination.
In order to assess the performance of the two Mini-PEMSs during the cold phase of the test cycles when the temperature of the sampled exhaust increases from about 25 up to 200–300 ∘C in about 3 min, the approach above was repeated for separate cold- and hot-cycle phases as shown in Table S4. Looking at cold-start Tests 1, 5, 6, and 8, the sampling of the cold phase did not represent a critical issue for the two Mini-PEMSs as the performance is comparable or better than in the hot phase. However, the phase split highlights a large discrepancy between laboratory and Mini-PEMS No. 1 in Test 8. The average HC concentrations measured by Mini-PEMS No. 1 during Test 8 were, compared to the laboratory, lower during the first phase of the test and higher during the second phase. This demonstrates a shortcoming of the unheated sampling and measurement system used in the portable system, in which semivolatile organic species (i.e., fuel and oil vapors) present in high concentrations during a cold start partially condense within the system, causing the readings to be initially lower, and are later re-entrained into the sampling stream, causing readings to be higher. This phenomenon occurs initially in the exhaust system, but it is partially dampened by the heated gas line of the FID used as a reference. Concerning Mini-PEMS No. 2, the mean concentrations reported in Table 4 show excellent CO2 correlation with the laboratory (MAPD < 1 %) and very good agreement in terms of CO and NOx (MAPD = 7 % and 13 %, respectively). This good performance, along with similar results from Mini-PEMS No. 1, confirmed the reliability of the setup design when measuring the concentration of pollutants in vehicular exhaust. The larger deviation for HC (MAPD = 20 %, with largest single-test deviation of 32 %) can be explained with the condensation of semivolatile compounds in the sampling system (hydrocarbon hang-up) and different sensitivity of the NDIR sensors used in the two Mini-PEMSs to individual hydrocarbons.
3.1.2 Exhaust flow rates
The determination of the exhaust flow is the second key parameter involved in the calculation of mass-per-distance emission factors and fuel consumption from instantaneous data, beyond the chemical concentration discussed above. The legislative emission factors calculations do not rely on the exhaust flow, while those from the Mini-PEMS do (see Sect. 2). The laboratory exhaust flow calculated with the CO2 tracer method should not be considered as a legislative reference against which to validate the two Mini-PEMSs but rather as the state-of-the-art estimate available. Figure 3a shows the comparison between the exhaust flows calculated from laboratory instrumentation and from the two Mini-PEMSs for Test 5. The agreement is qualitatively good considering that the two approaches were completely different (see Sect. 2 for details). The largest deviations occurred during idle (very low flow rate ≈30 L min−1) and during quick deceleration phases when the abrupt change in CO2 concentrations causes narrow peaks in the tracer method curve. On average for all tests, the coefficients of determination between the two methods are fairly good (R2≈0.7) as reported in Table S3, confirming that (i) the Mini-PEMS applies an approach which gives similar results to the CO2 tracer method commonly used when sampling directly from the tailpipe and that (ii) the exhaust flow remains the critical parameter to assess when performing raw-exhaust measurements. The validation of the CO2 tracer method is discussed below in terms of emission factors. Note that at the moment there are no exhaust flowmeters to be deployed on two-wheelers on the road. Future technical developments may fulfill this gap; however, exhaust flows from two-wheelers are intrinsically difficult to measure precisely due to small flow rates (especially at low engine loads) and, in the presence of one cylinder, to flow pulsations.
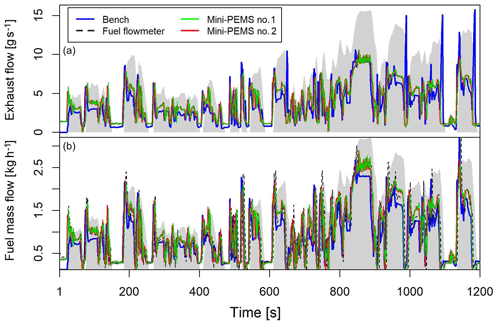
Figure 3(a) Comparison of the exhaust flow from bench instrumentation calculated with the CO2 tracer method and from the two Mini-PEMSs during Test 5. (b) Comparison of fuel consumption (i) measured by a dedicated fuel flowmeter (KMA); (ii) calculated with the carbon balance method using HC, CO, and CO2 mass emissions rates from bench instrumentation; and (iii) calculated from Mini-PEMSs No. 1 and No. 2.
3.1.3 Fuel consumption
Fuel efficiency of vehicles is officially reported in EU type-approval certificates and calculated from integrated emissions over the entire legislative emission tests (test type VII; EC, 2014). Neither instantaneous fuel consumption during roller bench tests nor real-driving fuel consumption (both calculated from instantaneous emissions; see Sect. 2.3) is required. Nevertheless, great attention was recently paid to real-driving fuel consumption data (see e.g., Fontaras et al., 2017, and references therein) especially when results differ from the official values reported by manufacturers.
Table 5Fuel consumption calculated from laboratory instrumentation (bench) and Mini-PEMS compared to the KMA fuel flowmeter (reference). Volumetric and mass consumption from the bench were derived from Regulation EU 134/2014 (carbon balance, diluted emissions) and from instantaneous mass emissions, respectively.

The fuel consumption calculated with the carbon balance method from the Mini-PEMS and laboratory HC, CO, and CO2 emissions is compared with the fuel consumption measured by the fuel flowmeter (reference) in Fig. 3. The agreement was good except for the underestimated relative maxima of laboratory results compared to the fuel flowmeter. Table 5 compares fuel consumption results from three tests for (i) the fuel flowmeter, both in mass and volume of fuel (with instantaneous control of fuel density and temperature); (ii) the laboratory instrumentation (legislative results from bag analysis of diluted emissions and integrated instantaneous results from raw emissions); and (iii) the two Mini-PEMSs. In all cases the deviation from the reference was ≤10 %, with an excellent performance of the two Mini-PEMSs (deviation < 5 %). This indicates the following conclusions:
-
The legislative method based on carbon balance and diluted emissions is a good approximation to determine fuel consumption during roller bench tests. Note that the relatively high difference is probably due to the extracted flow from the tailpipe, which increases the uncertainty.
-
The same method applied to raw-exhaust sampling is in good agreement with the reference.
-
The Mini-PEMS is a valuable instrument to assess the fuel consumption and can provide useful insights during real-driving tests. Error attributed to using assumed rather than actual volumetric efficiency contributes substantially to the differences between PEMS and laboratory data and can be reduced by experimental determination of the engine volumetric efficiency in the laboratory from emissions or fuel consumption data.
3.1.4 Mass emissions
As an example, mass flow rates of HC, CO, NOx, and CO2, during Test 5 from the two Mini-PEMSs are compared against the laboratory instrumentation in Fig. 4 assuming variable (engine speed and load-dependent) volumetric efficiency (see Sect. 2.3). The agreement is qualitatively very good considering that mass flows are affected by combined uncertainties in the chemical concentration and in the exhaust flows previously discussed. Clearly, the Mini-PEMS could be used to monitor dynamic exhaust mass flows and for instance to spot tampered vehicles (see Zardini et al., 2016a) or to investigate on-road, after-treatment strategies for pollution reduction. Table 6 summarizes the emission factors for laboratory tests performed on the legislative test cycles ECE-R47 and WMTC assuming variable volumetric efficiency. WOT Tests 3 and 4 were excluded from the analysis to avoid reporting artificially high EFs. Similarly to the assessment of concentration profiles, EFs were in very good agreement; the overall MAPD for Mini-PEMS No. 1 was below 10 % for all compounds and down to 5 % for CO2. The worst single-test deviation was −22 % for NOx in Test 2. Mini-PEMS No. 2 exhibited a generally lower performance in terms of deviations due to lower sample flow during the tests and to the smaller specific data set. Nevertheless, a MAPD < 20 % for all compounds indicated good agreement between instruments.
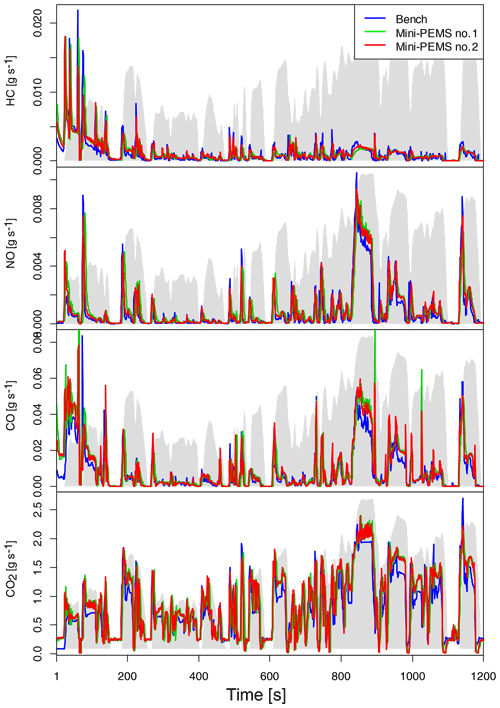
Figure 4Mass flow rates of HC, NOx, CO, and CO2 from bench instrumentation and from the two Mini-PEMSs for Vehicle 2 during Test 5 (WMTC).
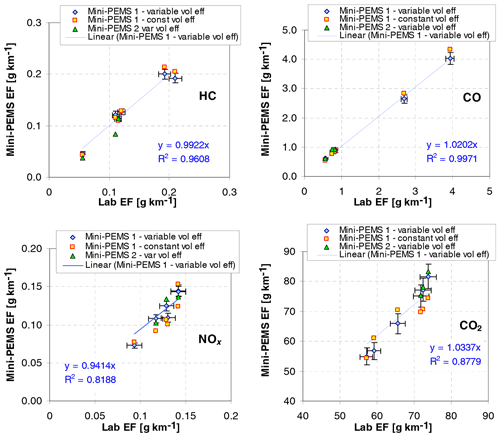
Figure 5Emission factors of HC, NOx, CO, and CO2 from bench instrumentation (horizontal axis) and Mini-PEMS No. 1 (vertical axis) obtained during roller bench tests. For Mini-PEMS No. 1, variable volumetric efficiency, error bars represent estimated known measurement uncertainty of 5 % for Mini-PEMS and for laboratory, 3 % for CO and CO2, 5 % (10 % for 50 mg km−1) for HC, and 7.5 mg km−1 for NOx.
Table 6Comparison of emissions factors measured with the standard test cell instrumentation (bench) and the two Mini-PEMSs during legislative test cycles (WMTC and R47) on the roller bench. Variable volumetric efficiency was assumed (see text for details). * Tests performed with the additional Mini-PEMS No. 2.
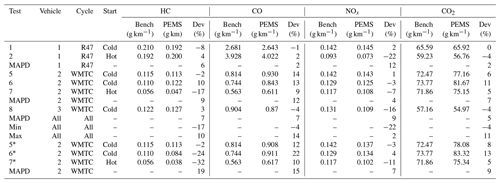
Table 7Exhaust concentrations (average), real-driving emissions factors, and fuel consumption during on-road trips.

The estimated measurement uncertainty for the laboratory measurement (bag data) of (i) NOx is 10 % at 80 mg km−1 and 5 % at 150 mg km−1, (ii) HC is 10 % at 50 mg km−1 and 5 % at 200 mg km−1, and (iii) CO and CO2 is 3 % for all emission levels. This uncertainty is shown in Fig. 6 as a separate arrow rather than being added to each point. The largest components of uncertainty for the Mini-PEMS are the engine volumetric efficiency (affecting the exhaust flow calculations), the uncertainty in HC and PM measurements due to the limitations of the approach chosen (unheated sampling train, surrogate measurements for PM), and the uncertainty associated with dynamic events (rapid changes in both exhaust flow and pollutant concentrations). These noncontrollable uncertainties were estimated ex post to be overall in the range from 10 % up to 20 % (see MAPD, mean absolute percentage differences, in Tables 4 and 6). The known uncertainty in gaseous-component measurements at steady state, above the detection limit, is 3 %–5 %, and the combined uncertainty in engine rpm and intake manifold pressure and temperature is 1 %–2 %. We estimated this known uncertainty to be about 5 % for all measurements. These known uncertainties are shown as error bars in Fig. 7 for Mini-PEMS No. 1, variable volumetric efficiency data.
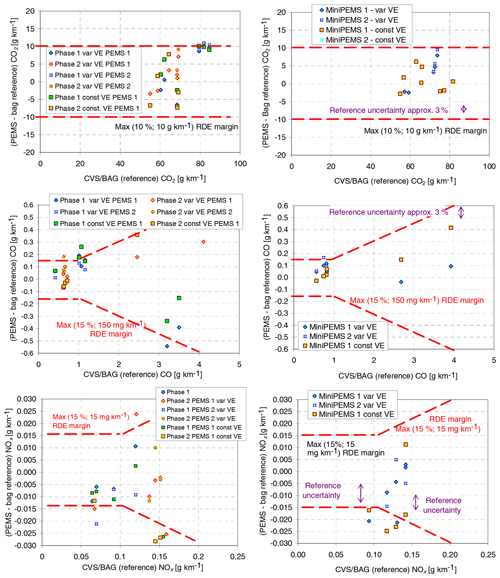
Figure 6Relative deviations (%) between PEMS and laboratory emission factors during roller bench tests. Red dashed lines represent the PEMS validation tolerances as per Regulation EU 2018/1832 (EC, 2018a); see text for details.
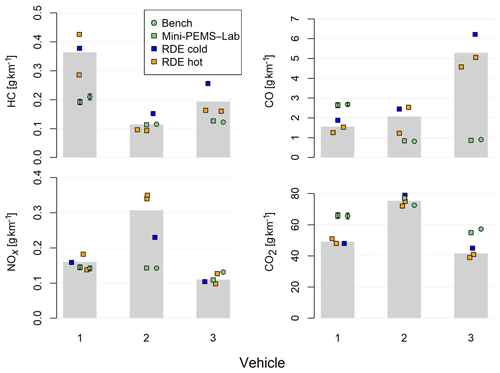
Figure 7Summary of real-driving and laboratory emission factors. Roller bench emissions were obtained with laboratory instrumentation (green circles) and the Mini-PEMS (green squares). Grey bars are average real-driving emission factors obtained with the Mini-PEMS from on-road cold-start (blue squares) and hot-start tests (orange squares). Error bars appear only on the first column in order to preserve readability.
The EFs of HC, CO, NOx, and CO2 for each cycle as calculated by the two Mini-PEMSs and as measured by the laboratory are compared in Fig. 5 for a total of six tests. Three sets of EFs from Mini-PEMSs were compared against the laboratory: EFs from Mini-PEMS No. 1 were obtained using both variable (speed- and load-dependent) and constant engine volumetric efficiency. For Mini-PEMS No. 2, the comparison is plotted only for variable volumetric efficiency in order to retain clarity. Individual data points represent the emissions factors for each test, with laboratory and Mini-PEMS data on the horizontal and vertical axes, respectively. Linear regression is shown for Mini-PEMS No. 1 variable volumetric efficiency. It is apparent that except for HC, there is little discrepancy between EFs calculated by Mini-PEMSs No. 1 and No. 2. The calculations using constant volumetric efficiency in Table S5 show a higher – but still relatively small (overall average < 10 %) – deviation from the laboratory data.
In our analysis, the EFs from the legislative method were chosen as a reference against which the Mini-PEMS was compared in line with current real-driving emission legislation and in order to assess the performance of the instrument in typical cases when only the diluted exhaust sampling is present in the laboratory (e.g., type approval). For sake of completeness, mass emissions were also calculated from the raw exhaust with laboratory instrumentation, and further comparison between EFs from Mini-PEMS, EFs from bag sampling, and EFs from the raw exhaust sampled with bench instrumentation was carried out. Figure S5 displays the EFs with the three methods broken down by driving cycle phase. The bag and raw-exhaust methods with laboratory instrumentation were in good agreement (NOx MAPD = 16 %; THC MAPD = 13 %, averaged on the cold- and hot-cycle phases of all vehicles) or very good agreement (MAPD = 8 % for CO and 4 % for CO2), in line with the historical records of the JRC laboratory. The Mini-PEMS performed well against the raw-exhaust method, slightly worse than against the legislative method discussed above due to the propagation of uncertainties in the exhaust flow. NOx MAPD per phase, shown in Tables S6 and S7 for variable and fixed volumetric efficiency, remained unchanged, but averaged MAPD for HC, CO, and CO2 increased up to 20 %, 15 %, and 10 %, respectively.
In order to contextualize our work in the current EU real-driving legislative framework laid down in Regulation EU 2017/1151 (EC, 2017) and Regulation EU 2018/1832 (EC, 2018) applicable to passenger cars, the Mini-PEMS-derived EFs were compared to the legislative EFs in Fig. 6. For each pollutant apart from THC (not included in the EU RDE legislation), two graphs are plotted: for each phase of the test separately on the left and for the whole test on the right. The compound-specific tolerances introduced by Regulation EU 1151/2017 (EC, 2017) to account for the additional measurement uncertainty in PEMS relative to standard laboratory equipment are plotted as dashed red lines. It is apparent from Fig. 6 that in most cases, the differences between the PEMS and the laboratory fall within the margins of uncertainty applicable to type-approval-grade PEMS, and outer values are relatively close to the margins. The tests outside the margins are mostly of Vehicle 1 (50 cc engine), confirming the experimental challenge posed by measuring emissions from small vehicles.
Even though the Mini-PEMS does not always comply with the light-duty vehicle PEMS tolerances, it should be noted that the deviations are still at acceptable levels and that the Mini-PEMS is considerably smaller and simpler than the type-approval-grade PEMS. The mass of the regulatory PEMS would affect the performance and the emissions of small motorcycles, which are type-approved with driver weight of 75 kg. It should also be noted that pulsations in the exhaust flow of small single-cylinder engines pose a considerable challenge to the direct exhaust flow measurement prescribed for type-approval RDE tests of automobiles and heavy vehicles.
The particulate matter measured with the Mini-PEMS was compared with the number of nonvolatile particles from the tailpipe and the dilution tunnel (Giechaskiel et al., 2019b), as applicable to recent diesel and direct-injection passenger cars and heavy-duty vehicles (Giechaskiel et al., 2018a). Note that the Mini-PEMS measures particles by light scattering and by an ionization chamber in a sample of raw exhaust, without removal of the semivolatile compounds. Light scattering is typically sensitive only to particles with a diameter over 100 nm, with the response being dominated by larger particles; on the ionization chamber, there is no lower limit on the particle size. While there is no upper limit for the particle diameter detected, as few particles are larger than 1 µm, particles larger than several micrometers are likely to be trapped in the condensation bowl. In Table S8, the nonvolatile particles sampled at the dilution tunnel and at the tailpipe are compared to the total number (including volatiles) inferred from ionization chamber measurements and particulate mass emissions inferred from laser scattering (based on calculated exhaust flow and concentrations measured in the raw exhaust). For the two R47 tests listed in Table S8, the comparison of second-by-second particle number emissions (particles per second) is plotted in Fig. S6.
The total particle number emissions measured by the Mini-PEMS is in the range of similar up to double relative to nonvolatile particle number emissions > 10 nm (Giechaskiel et al., 2015). The specific vehicle had emissions on the same order of magnitude as the limit value (6×10¹¹ particles km−1) applicable to recent passenger cars.
Table S9 gives nonvolatile particle number and particulate mass for cold-start cycles as measured in the laboratory and as measured by the Mini-PEMS. It should be highlighted that the tests were conducted on different days; thus they include the repeatability variability. The Mini-PEMS particle number is between the 23 and 10 nm emissions and lower than the total particle number. The estimated mass is also lower than the mass determined gravimetrically with the filter method. This is partly expected because the filter method can also be influenced by artifacts due to the presence of volatile species (Chase et al., 2004; Giechaskiel et al., 2019c).
3.1.5 Mini-PEMS No. 1 vs. Mini-PEMS No. 2
The accuracy of the instantaneous mass emissions rates is dependent on the quality of the concentration data, exhaust flow data, and synchronization between the two data streams (Giechaskiel et al., 2018b; Vojtisek-Lom et al., 2018). The principal uncertainty associated with the exhaust flow data is the estimation of the engine volumetric efficiency. The uncertainty associated with the measurement of engine speed and intake air pressure and temperature is rather small, the sensor response relatively fast, and uncertainty in the sensor outputs relatively small. The uncertainties associated with the concentration data are comparable between the two PEMS instruments, as they use the same detection principles and similar components. The synchronization of the data is comparable between the instruments. The difference between the two Mini-PEMS, as apparent from Tables 4 and 6 and Figs. 3 and 4, is therefore closer to the unit-to-unit variance than to a difference between two different technologies. Both the concentration and the mass emissions data presented here suggest that the difference between the two Mini-PEMS units is relatively small (up to 0.04 g km−1 HC; 0.01–0.07 g km−1 CO; < 0.01 g km−1 NOx) and slightly smaller or comparable to the differences between the Mini-PEMS and laboratory (up to 0.03 g km−1 HC; 0.06–0.17 g km−1 CO; < 0.02 g km−1 NOx), suggesting that systematic errors (such as bias caused by using NDIR technology for HC detection or by estimating engine volumetric efficiency) represent a substantial part of the overall uncertainty in the Mini-PEMS measurement.
3.2 Real-driving emissions
The PEMS emission factors during on-road trips are typically compared to those obtained in the test cell in order to identify discrepancies between real-driving and laboratory emissions (e.g., during in-service conformity checks). We applied the same procedure with a few notes of caution. Two-wheelers have so far very limited on-board diagnostics (OBD); the introduction of emission monitoring OBD is planned in 2020. The presence of a defeat device to reduce the emissions during type-approval test cycles can be therefore excluded a priori, i.e., large discrepancies between roller bench and on-road tests due to artificial modification of the engine map were not expected. Secondly, the real-driving emission test is not included in the current legislation for two-wheelers, and there are no comprehensive studies from which to derive the technical definition of an agreed typical on-road trip for two-wheelers with associated boundary conditions and tolerances. Agreement between contracting parties was reached during the definition of the legislative laboratory WMTC of subcategory L3e-A3 (high-performance motorcycles) which was then applied and adapted to the other members of the L-category family (EMISIA, 2013). Finally, mopeds (subcategory L1e-B) are subject to legislative limitation of maximum speed (typically 45 km h−1, 25 km h−1 in some EU countries), which corresponds to their maximum WMTC speed; their laboratory emission testing covers the entire speed range. Our on-road trips are neither based on average driving nor contain a prescribed mix of low, middle, and high speed – nor do they respect validity criteria; they are simple tools to demonstrate the capabilities of the Mini-PEMS. Vehicle speed and positive acceleration of on-road trips as a function of the actual distance relative to the start are given in Fig. S2.
Exhaust concentration and real-driving emission factors during on-road trips of the three vehicles are reported in Table 7. By comparing on-road against laboratory data in Tables 4 and 6, it is apparent that the mean concentrations of HC for Vehicle 1 on the road (3603–4037 ppm) are comparable to the WOT test (2089–3722 ppm) and higher than the R47 test (1455–1550 ppm) in the laboratory. Similarly, the concentration of HC was doubled during the on-road, cold-start test (2089 ppm) than in the laboratory cold-start WMTC (1197 ppm) for Vehicle 3. The concentrations of CO on the road were lower for Vehicle 1 (0.5 %–0.9 %) than in the laboratory (0.8 %–1.4 %) and higher for the other two vehicles. Concentrations of NOx were, for all three vehicles, higher on the road (238–382 ppm) than in the laboratory (129–276 ppm). This is in agreement with positive acceleration data in Table 2; our on-road trips resulted in being more severe than the WMTC and less severe than the R47 legislative cycles due to a combination of trip composition and driving behavior.
The on-road emission factors calculated with the Mini-PEMS assuming variable volumetric efficiency relative to the laboratory were higher for HC from Vehicle 1 (0.29–0.43 g km−1 on the road; 0.19–0.20 g km−1 laboratory) likely due to lower ambient temperature and comparable for the other two vehicles. CO emissions in the laboratory were higher from Vehicle 1 due to prolonged wide-open throttle operations and lower for the other two vehicles which instead could easily follow the WMTC speed trace. NOx emissions in the lab and on the road were comparable for Vehicle 1 and 3 but larger on the road for Vehicle 2 (0.11–0.14 g km−1 in laboratory; 0.23–0.35 g km−1 on the road). The emissions of CO2 on the road were lower (48–51 g km−1 for Vehicle 1; 39–45 g km−1 for Vehicle 3) or comparable (72–79 g km−1 for Vehicle 2) to the laboratory tests (55–66 g km−1 for Vehicles 1 and 3; 75–82 g km−1 for Vehicle 2). The particle mass emissions on the road (0.35–0.44 g km−1) were comparable to being slightly higher than in the laboratory (0.18–0.40 g km−1 as measured by Mini-PEMS), while particle number emissions (including volatiles) on the road (3.4–4.4×10¹¹ particles km−1) were comparable to being slightly lower relative to the 5.5×10¹¹–1.5×10¹² particles km−1 measured by the Mini-PEMS in the laboratory (Table S8).
As an example, the instantaneous emission rates of HC, CO, and NOx are given in Fig. S7 for Vehicle 2. The sharp accelerations after a stop are clearly visible in terms of HC and CO emissions; while HC large emissions decrease after few seconds of acceleration, the CO emissions remain high during wide-open throttle operations, indicating that this mode of driving (potentially frequent on small motorcycles) dominates with respect to the amount of CO emissions.
A comparison of emissions between laboratory and on-road trips both calculated with the Mini-PEMS is plotted in Fig. 7; laboratory results are averaged on cold- and hot-start tests for readability; detailed results can be found in Table 6. Pollutants in real-driving emissions are generally larger than during legislative tests with HC and CO deviations enhanced during on-road, cold-start tests and larger NOx deviations during hot-start tests. One exception is the large CO emission factor of Vehicle 1 in the laboratory for the reasons explained above. The behavior of CO2 emissions, in the opposite direction, with larger values related to laboratory tests for Vehicle 1 and 3, indicated better after-treatment operations in the lab than on the road as well as smaller fuel consumption on the road for the two vehicles. This is supported by the comparison between fuel consumption on the road and on the roller bench for Vehicle 2 (Tables 6 and 7; driving distance of WMTC = 13.1 km); a comparable fuel consumption is related to comparable CO2 emissions (Fig. 7).
In conclusion, the Mini-PEMS can be deployed on the road with minimum effort and few safety precautions (secured rack and fastened cables) and has enough resolution to distinguish different test severity, driving behavior, and cold/hot engine start conditions.
We presented an exploratory study aiming at assessing a miniature portable emission measuring system (Mini-PEMS) suitable to be installed on board two-wheelers (such as scooters and motorcycles) given its small size and weight. The Mini-PEMS, designed at the Technical University of Liberec, is capable of measuring the exhaust concentrations of hydrocarbons (HC), carbon monoxide (CO) and dioxide (CO2), and nitrogen oxides (NO and NO2) using nondispersive infrared and electrochemical cell techniques. In addition, it acquires a series of engine and vehicle parameters such as exhaust and inlet air temperatures, manifold absolute pressure, engine and vehicle speed, and GPS coordinates of on-road trips. These are used by the Mini-PEMS to calculate the exhaust flow and the emission factors in mass-per-distance units.
The Mini-PEMS was tested on three two-wheelers (one moped and two motorcycles) and compared with standard bench instrumentation inside the emission test cell of the European Commission Joint Research Centre (JRC, VELA laboratories) during legislative driving cycles. As an application, the Mini-PEMS was deployed on board the same vehicles during repeated on-road trips in order to measure real-driving emissions. The mean absolute deviations of exhaust gas concentrations were 8 % for HC (range −17 % to +16 %), 8 % for CO (−3 % to +19 %), 13 % for NOx (−12 % to +24 %), and 2 % for CO2 (−7 % to +5 %) In terms of emission factors, which include the exhaust flow uncertainty, the differences were 7 % (−17 % to +10 %) for HC, 7 % (−4 to +14 %) for CO, 9 % (−22 to +2 %) for NOx, and 5 % (−4 % to +11 %) for CO2. For one vehicle where fuel consumption was measured directly with a dedicated fuel flowmeter, the absolute deviations between fuel consumption over the legislative driving cycle measured in the laboratory and calculated by the Mini-PEMS with a carbon balance method (mass emissions of HC, CO, and CO2) were in the range of 1 %–3 %.
On-road tests were not designed to be representative of typical operation of two-wheelers (which at present are neither agreed nor proposed in the scientific literature and EU legislation). The real-driving emissions had larger variability than in the laboratory (up to a factor of 2 against typically 10 %). HC and NOx emissions on the road were similar or larger than in the laboratory; CO emissions were larger on the road for the motorcycles and smaller for the moped (because of shorter periods of high engine load in the laboratory). At present, it is not possible to draw general conclusions about the real-driving emission results as they were vehicle- and compound-specific, but there are indications on what to focus on for future studies, namely HC emissions after cold engine start or cold ambient conditions and CO emissions during prolonged periods of high engine loads.
All in all, the results are satisfactory considering that (i) the size and weight of the Mini-PEMS is smaller than standard PEMS instruments deployed in passenger cars, (ii) the detectors are different, simpler, and cheaper, (iii) the external gas line is unheated, (iv) the exhaust flow is calculated and not directly measured, (v) the exhaust flow is not kept at 190 ∘C inside the instrument, and (vi) large vibrations and the presence of frequent bumps on the road. The Mini-PEMS has certainly the potential to be employed for research and development purposes, in periodical road worthiness tests when excessive emissions indicate malfunctioning of after-treatment devices and in the preliminary phases of an in-service monitoring.
Most of the data are available in the tables. Additional data may be available upon request to the corresponding author.
The supplement related to this article is available online at: https://doi.org/10.5194/amt-13-5827-2020-supplement.
MV, LD, and MP have designed and fabricated the Mini-PEMS. MV performed the Mini-PEMS data analysis and prepared the paper. AAZ performed the analysis of roller bench emissions data, drove the vehicles outdoors, and contributed to text and figures. LD and MP adapted the vehicles and installed the Mini-PEMS on board. FF, FM, and MC assisted during Mini-PEMS installation and followed the vehicle on the road for safety reasons. BG and MG supervised the experimental activity and reviewed and edited the paper.
Disclaimer for the authors affiliated with the European Commission.
The opinions expressed in this paper are those of the authors and should in no way be considered to represent an official opinion of the European Commission. Mention of trade names or commercial products does not constitute endorsement or recommendation by the authors.
The authors declare that they have no conflict of interest.
The authors would like to thank the technical staff of VELA and in particular Gaston Lanappe and Philippe Le Lijeour.
This research has been supported by the Czech Ministry of Education, Youth and Sports (grant no. LO1311). Visits by the authors from the Czech Republic at the JRC were funded in part by the Technical University of Liberec staff mobility grant (MP) and by the Czech Ministry of Education project LO1311 (MV). Analysis of Mini-PEMS data by Michal Vojtisek-Lom was funded in part by H2020 project 815002 uCARe (“You can also reduce emissions”).
This paper was edited by Pierre Herckes and reviewed by four anonymous referees.
Breton, L.: Real-time on-road vehicle exhaust gas modular flowmeter and emissions reporting system, United States patent no. 6148656, 2000.
Chase, R. E., Duszkiewicz, G. J., Richert, J. F. O., Lewis, D., Maricq, M. M., and Xu, N.: PM Measurement Artifact: Organic Vapor Deposition on Different Filter Media, SAE Tech. Pap., 2004-01-0967, https://doi.org/10.4271/2004-01-0967, 2004.
Clairotte, M., Zardini, A., and Martini, G.: Phase 1 of the Environmental Effect Study on the Euro 5 step of L-category vehicles – Stocktaking and data mining, European commission – Joint Research Centre Technical Report, EUR 27994 EN, https://doi.org/10.2790/008963, 2016.
EC (European Commission): Regulation (EU) No. 582/2011 of May 2011, implementing and amending Regulation (EC) No. 595/2009 of the European Parliament and of the Council with respect to emissions from heavy-duty vehicles (Euro VI) and amending Annexes I to III to Directive 2007/46/EC of the European Parliament and Council, Official J. Eur. Union, L 167, 2011.
EC (European Commission): Regulation (EU) No. 64/2012 of 23 January 2012, amending Regulation (EU) No. 582/2011 implementing and amending Regulation (EC) No. 595/2009 of the European Parliament and of the Council with respect to emissions from heavy-duty vehicle (Euro VI), Official J. Eur. Union, L 28, 2012.
EC (European Commission): Regulation (EU) No. 168/2013 of the European Parliament and of the Council of 15 January 2013 on the approval and market surveillance of two- or three-wheel vehicles and quadricycles, Official J. Eur. Union, L60, 2013.
EC (European Commission): Regulation (EU) No. 134/2014 supplementing Regulation (EU) No. 168/2013 of the European Parliament and of the Council with regard to environmental and propulsion unit performance requirements and amending Annex V thereof, Official J. Eur. Union, L53, 2014.
EC (European Commission): Regulation (EU) 2017/1151 on type-approval of motor vehicles with respect to emissions from light passenger and commercial vehicles (Euro 5 and Euro 6) and on access to vehicle repair and maintenance information, Official J. Eur. Union, L175, 2017.
EC (European Commission): Regulation (EU) 2018/1832 of 5 November 2018 amending Directive 2007/46/EC of the European Parliament and of the Council, Commission Regulation (EC) No 692/2008 and Commission Regulation (EU) 2017/1151 for the purpose of improving the emission type approval tests and procedures for light passenger and commercial vehicles, including those for in-service conformity and real-driving emissions and introducing devices for monitoring the consumption of fuel and electric energy, Official J. Eur. Union, L 175, 2018.
EEA (European Environment Agency): Air Quality in Europe – 2018, Report, No. 12/2018, Luxembourg, 88 pp., https://doi.org/10.2800/777411, 2018.
Fontaras, G., Zacharof, N. G., and Ciuffo B.: Fuel consumption and CO2 emissions from passenger cars in Europe – Laboratory versus real-world emissions, Prog. Energy Combust. Sci., 60, 97–131, https://doi.org/10.1016/j.pecs.2016.12.004, 2017.
Giechaskiel, B., Wang, X., Horn, H., Spielvogel, J., Gerhart, C., Southgate, J., Jing, L., Kasper, M., Drossinos, Y., and Krasenbrink, A.:. Calibration of condensation particle counters for legislated vehicle number emission measurements, Aerosol Sci. Tech., 43, 1164–1173, https://doi.org/10.1080/02786820903242029, 2009.
Giechaskiel, B., Cresnoverh, M., Jörgl, H., and Bergmann, A.: Calibration and accuracy of a particle number measurement system, Meas. Sci. Technol., 21, 045102, https://doi.org/10.1088/0957-0233/21/4/045102, 2010.
Giechaskiel, B., Maricq, M., Ntziachristos, L., Dardiotis, C., Wang, X., Axmann, H., Bergmann, A., and Schindler W.:. Review of motor vehicle particulate emissions sampling and measurement: From smoke and filter mass to particle number, J. Aerosol Sci., 67, 48–86, https://doi.org/10.1016/j.jaerosci.2013.09.003, 2014.
Giechaskiel, B., Zardini, A. A., and Martini, G.: Particle Emission Measurements from L-Category Vehicles, SAE Int. J. Engines., 8, 2322–2337, https://doi.org/10.4271/2015-24-2512, 2015.
Giechaskiel, B., Lahde, T., Suarez-Bertoa, R., Clairotte, M., Grigoratos, T., Zardini, A., Perujo, A., and Martini, G.:, Particle number measurements in the European legislation and future JRC activities, Combustion Engines, 57, 3–16, https://doi.org/10.19206/CE-2018-301, 2018a.
Giechaskiel, B., Clairotte, M., Valverde-Morales, V., Bonnel, P., Kregar, Z., Franco, V., and Dilara, P.:. Framework for the assessment of PEMS (Portable Emissions Measurement Systems) uncertainty, Environ. Res., 166, 251–260, https://doi.org/10.1016/j.envres.2018.06.012, 2018b.
Giechaskiel, B., Zardini, A., and Clairotte, M.:. Exhaust Gas Condensation during Engine Cold Start and Application of the Dry-Wet Correction Factor, Appl. Sci., 9, 2263, https://doi.org/10.3390/app9112263, 2019a.
Giechaskiel, B., Lähde, T., and Drossinos, Y.:. Regulating particle number measurements from the tailpipe of light-duty vehicles: The next step?, Environ. Res., 172, 1–9, https://doi.org/10.1016/j.envres.2019.02.006, 2019b.
Giechaskiel, B., Zardini, A. A., Lähde, T., Perujo, A., Kontses, A., and Ntziachristos, L.: Particulate Emissions of Euro 4 Motorcycles and Sampling Considerations, Atmosphere, 10, 421, https://doi.org/10.3390/atmos10070421, 2019c.
Kelly, N. A. and Groblicki, P. J.: Real-world emissions from a modern production vehicle driven in Los Angeles, J. Air Waste Manage., 43, 1351–1357, https://doi.org/10.1080/1073161X.1993.10467209, 1993.
Kumar R., Durai B.K., Saleh W., and Boswell C.: Comparison and evaluation of emissions for different driving cycles of motorcycles: A note, Transp. Res. D Transp. Environ., 16, 61–64, https://doi.org/10.1016/j.trd.2010.08.006, 2011.
Lenaers, G., Pelkmans, L., and Debal, P.: The Realisation of an On-board Emission Measuring System Serving as a R&D Tool for Ultra Low Emitting Vehicles, Int. J. Veh. Design, 31, 253–268, https://doi.org/10.1504/IJVD.2003.003358, 2003.
Murena, F., Prati, M. V., and Costagliola, M. A.:. Real driving emissions of a scooter and a passenger car in Naples city, Transp. Res. D Transp. Environ., 73, 46–55, https://doi.org/10.1016/j.trd.2019.06.002, 2019.
Ntziachristos, L., Vonk, W., Papadopoulos, G., Mensch, P., Geivanidis, S., Mellios, G., Papadimitriou, G., Steven, H., Elstgeest, M., Ligterink, N., and Kontses, A.: Effect study of the environmental step Euro 5 for L-category vehicles, TNO Report for the European Commission, Directorate-General for Internal Market, Industry, Entrepreneurship and SMEs, Luxembourg, 609 pp., https://doi.org/10.2873/397876, 2017.
Platt, S. M., El Haddad, I., Pieber, S. M., Zardini, A. A., Huang, R.-J., Clairotte, M., Suarez-Bertoa, R., Barmet, P., Pfaffenberger, L., Wolf, R., Slowik, J. G., Fuller, S. J., Kalberer, M., Chirico, R., Dommen, J., Astorga, C., Zimmermann, R., Marchand, N., Hellebust, S., Temime-Roussel, B., Baltensperger, U., and Prévôt, A. S. H.: Two-stroke scooters are a dominant source of air pollution in many cities, Nat. Commun., 5, 3749, https://doi.org/10.1038/ncomms4749, 2014.
UNECE (United Nations Economic Commission for Europe): Regulation No. 47, Uniform provisions concerning the approval of mopeds equipped with a positive ignition engine with regard to the emission of gaseous pollutants by the engine, 1E/ECE/324 Rev.1/Add.46 E/ECE/TRANS/505, 1981.
US EPA (United States Environmental Protection Agency): Engine Testing Procedures, Code of Federal Regulations, Title 40, Volume 1065, Subpart J – Field Testing and Portable Emission Measurement Systems, available at: https://www.law.cornell.edu/cfr/text/40/part-1065/subpart-J (last access: 30 August 2020), 2005.
Varella, R., Giechaskiel, B., Sousa, L., and Duarte, G.:. Comparison of portable emissions measurement systems (PEMS) with laboratory grade equipment, Appl. Sci., 8, 1633, https://doi.org/10.3390/app8091633, 2018.
Vojtisek-Lom, M.:. Total Diesel Exhaust Particulate Length Measurements Using a Modified Household Smoke Alarm Ionization Chamber, J. Air Waste Manage., 61, 126–134, https://doi.org/10.3155/1047-3289.61.2.126, 2011.
Vojtisek-Lom, M. and Cobb, J. T.: Vehicle mass emissions measurement using portable 5-gas exhaust analyzer and engine computer data. Presented at the EPA Emission Inventory: Planning for the Future conference, Research Triangle Park, NC, 28–30 October, 1997.
Vojtisek-Lom, M., Fenkl, M., Dufek, M., and Mareš, J.: Off-cycle, Real-World Emissions of Modern Light Duty Diesel Vehicles, SAE Tech. Pap., 2009-24-0148, https://doi.org/10.4271/2009-24-0148, 2009.
Vojtisek-Lom, M., Beranek, V., Klir, V., Jindra, P., Pechout, M., and Vorisek, T.: On-road and laboratory emissions of NO, NO2, NH3, N2O and CH4 from late-model EU light utility vehicles: Comparison of diesel and CNG, Sci. Total Environ., 616–617, 774–784, https://doi.org/10.1016/j.scitotenv.2017.10.248, 2018.
Weiss, M., Bonnel, P., Hummel, R., Provenza, A., and Manfredi, U.,: On-road emissions of light-duty vehicles in Europe, Environ. Sci. Technol., 45, 8575–8581, https://doi.org/10.1021/es2008424, 2011.
Wiers, W. and Scheffler, C.: Carbon Dioxide (CO2) Tracer Technique for Modal Mass Exhaust Emission Measurement, SAE Tech. Pap., 720126, https://doi.org/10.4271/720126, 1972.
Zamboni, G., Carraro, C., and Capobianco, M.: On-road instantaneous speed measurements on powered two-wheelers for exhaust emissions and fuel consumption evaluation, Energy, 36, 1039–1047, https://doi.org/10.1016/j.energy.2010.12.004, 2011.
Zardini, A. A., Platt, S. M., Clairotte, M., El Haddad, I., Temime-Roussel, B., Marchand, N., Jezek, I., Drinovec, L., Mocnik, G., Slowik, J. G., Manfredi, U., Prevot, A. S. H, Baltensperger, U., and Astorga, C.: Effects of alkylated fuel on exhaust emissions and secondary aerosol formation of a 2-stroke and a 4-stroke scooter, Atmos. Environ., 94, 307–315, https://doi.org/10.1016/j.atmosenv.2014.03.024, 2014.
Zardini, A. A., Suarez-Bertoa, R., Dardiotis, C., and Astorga C.: Unregulated pollutants from tampered two-wheelers, Transport. Res. Rec., 14, 3109–3118, https://doi.org/10.1016/j.trpro.2016.05.251, 2016a.
Zardini, A. A., Clairotte, M., Lanappe G., Giechaskiel, B., and Martini, G.: Preparatory work for the Environmental Effect Study on the Euro 5 step of L-category vehicles, Joint Research Centre Science for Policy Report, Publications Office of the European Union, 142 pp., https://doi.org/10.2790/777240, 2016b.


