the Creative Commons Attribution 4.0 License.
the Creative Commons Attribution 4.0 License.
 | 18 Nov 2020
Validation of tropospheric NO2 column measurements of GOME-2A and OMI using MAX-DOAS and direct sun network observations
Michel Van Roozendael
François Hendrick
Nicolas Theys
Nader Abuhassan
Alkiviadis Bais
Folkert Boersma
Alexander Cede
Jihyo Chong
Sebastian Donner
Theano Drosoglou
Anatoly Dzhola
Henk Eskes
Udo Frieß
José Granville
Jay R. Herman
Robert Holla
Jari Hovila
Hitoshi Irie
Yugo Kanaya
Dimitris Karagkiozidis
Natalia Kouremeti
Jean-Christopher Lambert
Jianzhong Ma
Enno Peters
Ankie Piters
Oleg Postylyakov
Andreas Richter
Julia Remmers
Hisahiro Takashima
Martin Tiefengraber
Pieter Valks
Tim Vlemmix
Thomas Wagner
Folkard Wittrock
Multi-axis differential optical absorption spectroscopy (MAX-DOAS) and direct sun NO2 vertical column network data are used to investigate the accuracy of tropospheric NO2 column measurements of the GOME-2 instrument on the MetOp-A satellite platform and the OMI instrument on Aura. The study is based on 23 MAX-DOAS and 16 direct sun instruments at stations distributed worldwide. A method to quantify and correct for horizontal dilution effects in heterogeneous NO2 field conditions is proposed. After systematic application of this correction to urban sites, satellite measurements are found to present smaller biases compared to ground-based reference data in almost all cases. We investigate the seasonal dependence of the validation results as well as the impact of using different approaches to select satellite ground pixels in coincidence with ground-based data. In optimal comparison conditions (satellite pixels containing the station) the median bias between satellite tropospheric NO2 column measurements and the ensemble of MAX-DOAS and direct sun measurements is found to be significant and equal to −34 % for GOME-2A and −24 % for OMI. These biases are further reduced to −24 % and −18 % respectively, after application of the dilution correction. Comparisons with the QA4ECV satellite product for both GOME-2A and OMI are also performed, showing less scatter but also a slightly larger median tropospheric NO2 column bias with respect to the ensemble of MAX-DOAS and direct sun measurements.
- Article
(3516 KB) - Full-text XML
-
Supplement
(3881 KB) - BibTeX
- EndNote


Nitrogen dioxide (NO2) is a key species for atmospheric chemistry, present both in the stratosphere and in the troposphere. In the troposphere, nitrogen oxides () together with volatile organic compounds are key ingredients for ozone and photochemical smog formation in polluted regions. By reaction with the hydroxyl radical (OH), NO2 forms nitric acid (HNO3), which leads to acid rain and consequently acidifies soils and waterbodies with negative impacts on the environment. In addition to its important role in air quality (human health and environmental acidification), NO2 is also relevant for climate processes at high concentrations, contributing to direct radiative forcing and the extension of atmospheric lifetimes of gases such as CH4. The main sources of NOx include anthropogenic and natural emissions, such as fossil fuel combustion, biomass burning, lightning and microbial soil emissions. There is a need for accurate NO2 measurements to assess and forecast its impact on air quality.
NO2 can be measured by several methods, such as in situ sampling and active or passive remote sensing. The differential optical absorption spectroscopy (DOAS) technique (Platt and Stutz, 2008) is widely used to retrieve NO2 in the atmosphere from measurements taken from satellites, from balloons and from the ground. Since the mid-nineties, NO2 has been measured from space by mid-morning low earth orbit (LEO) nadir satellite instruments, such as GOME on ERS-2 (1996–2003; Burrows et al., 1999), SCIAMACHY on ENVISAT (2002–2012; Bovensmann et al., 1999) and GOME-2 on MetOp A, B and C (since 2006, 2012 and November 2018 respectively; Munro et al., 2016). From 2004 onwards, NO2 measurements in the early afternoon have also been performed from the OMI imaging spectrometer on the EOS-Aura platform (Levelt et al., 2006) and since the end of 2017 from the Sentinel-5P TROPOMI instrument (Veefkind et al., 2012). In the last 15 years, ground-based MAX-DOAS (multi-axis differential optical absorption spectroscopy) instruments have been developed to measure tropospheric trace gases (Hönninger and Platt, 2002; Hönninger et al., 2004; Sinreich et al., 2005). Combined with profiling algorithms, this technique has been successfully applied to retrieve tropospheric columns and information on the vertical distribution of NO2, HCHO, SO2, BrO, IO, HONO, CHOCHO and aerosols (e.g., Bobrowski et al., 2003; Wittrock et al., 2004; Wagner et al., 2004; Heckel et al., 2005; Frieß et al., 2006, 2016; Sinreich et al., 2007; Theys et al., 2007; Irie et al., 2008b, 2009; Clémer et al., 2010; Galle et al., 2010; Hendrick et al., 2014). Direct sun observations in the UV–visible, which provide total column measurements (Cede et al., 2006; Wenig et al., 2008; Herman et al., 2009; Wang et al., 2010), are also used for monitoring atmospheric NO2. In particular, the recently developed Pandora instrument (SciGlob, http://www.sciglob.com/, last access: 29 October 2020) operationally provides direct sun measurements of O3 and NO2 and SO2 and HCHO in a scientific mode (Herman et al., 2009, 2018, 2019; Wang et al., 2010; Tzortziou et al., 2015; Fioletov et al., 2016; Spinei et al., 2018) at a growing number of sites.
One of the strengths of LEO nadir satellite instruments with wide swath width, like OMI and GOME-2, is their daily global coverage. Their main drawback is their limited revisit frequency and associated sampling of the diurnal cycle (typically one overpass per day for midlatitudes) and coarse spatial resolution (from a few to several hundreds of kilometers). The accuracy of the different satellite datasets is also of concern, e.g., for trend analysis or diurnal variation studies. Validation activities, which are an essential part of any satellite program, aim at deriving independently a set of indicators characterizing the quality of the data product. They encompass the monitoring of instrumental stability as well as the inter-sensor consistency needed to ensure continuity between different satellite missions. Satellite validation also contributes to the improvement of retrieval algorithms through investigation of the accuracy of the data products and their sensitivity to retrieval parameter choices. Tropospheric satellite data products depend on various sources of ancillary data, e.g., a priori vertical distribution of the absorbing and scattering species, surface albedo and information on clouds and aerosols (Boersma et al., 2004; Lin et al., 2015; Lorente et al., 2017; Liu et al., 2019a). In the case of NO2, separation between stratospheric and tropospheric contributions is an additional source of complexity in the retrieval, and there is considerable debate on the importance of the role of free tropospheric (background) NO2 in the retrieval process (Jiang et al., 2018; Silvern et al., 2019). As discussed by Richter et al. (2013), the validation of tropospheric reactive gases (such as NO2, HCHO and SO2) is also challenging because short atmospheric lifetimes, local emission sources and transport can lead to a large variability of their concentrations in time and space (both vertically and horizontally). Active photochemistry and transport processes lead to important diurnal variations cycles (Boersma et al., 2008) that need to be considered for validation studies. MAX-DOAS and direct sun remote-sensing techniques have large potential capacities for the validation of satellite trace gas observations, as they measure all day long and provide accurate measurements of integrated column amounts (i.e., a quantity close to that measured by spaceborne instruments). Remote sensing measurements also match the horizontal resolution of satellite observations better than e.g., surface in situ monitoring networks. The spatial averaging of MAX-DOAS measurements has been quantified and shown to range from a few kilometers to tens of kilometers depending on aerosol content and measurement wavelength (Irie et al., 2011, 2012; Wagner et al., 2011; Wang et al., 2014; Gomez et al., 2014; Ortega et al., 2015).
In the last decade, several studies have compared different SCIAMACHY, GOME-2 and OMI NO2 data products (generated by both operational and scientific prototype processors) to MAX-DOAS measurements at various stations (e.g., Brinksma et al., 2008; Hains et al., 2010; Vlemmix et al., 2010; Irie et al., 2008a; Ma et al., 2013; Lin et al., 2014; Wang et al., 2017; Drosoglou et al., 2017, 2018; Liu et al., 2019a, b, 2020). JAMSTEC data from the MADRAS network have been used in Kanaya et al. (2014) for the validation of the OMI DOMINO and NASA tropospheric NO2 data. BIRA-IASB MAX-DOAS stations have been regularly used for the validation of GOME-2 GDP (GOME Data Processor) products from MetOp-A and MetOp-B (Valks et al., 2011; Pinardi et al., 2011, 2014, 2015; Liu et al., 2019b) as part of the AC SAF activities (Hassinen et al., 2016; see also https://cdop.aeronomie.be/validation/valid-results, last access: 29 October 2020). Pandora datasets have also been used in satellite validation of total and tropospheric NO2 columns (Herman et al., 2009; Tzortziou et al., 2014, 2015; Judd et al., 2019, and a recent study of Herman et al. (2019) presented an overview at 14 Pandora sites showing that NASA OMI NO2 overpass data consistently underestimate the Pandora-derived NO2 amounts. One general conclusion of these exercises was to find a low bias of the satellites tropospheric NO2 columns in urban conditions and, in contrast, a better agreement with ground-based data in background and pristine locations (Celarier et al., 2008; Halla et al., 2011; Kanaya et al., 2014). However Irie et al. (2012) also reported low OMI NO2 column values over China in summer, when the spatial distribution of NO2 was likely homogeneous.
In the present study, we validate GOME-2A and OMI tropospheric NO2 column measurements using data from a large number of MAX-DOAS and direct sun instruments operating in Europe, Asia, North America and Africa under a wide variety of atmospheric conditions and pollution patterns. Some of these datasets have already been used in the past for tropospheric NO2 validation of different satellites and products and participated in the CINDI-1 and/or 2 intercomparison campaigns (Piters et al., 2012; Kreher et al., 2020). In the present study we combine them in a coordinated way, allowing for a global approach to satellite validation, sampling different NO2 levels in various locations around the globe. In addition the smearing (or dilution) of the NO2 field due to the limited horizontal resolution of satellite measurements is investigated. A method for the quantification and correction of the dilution effect is proposed, and its impact on validation results is quantitatively evaluated. Our validation approach is applied to operational OMI DOMINO and AC SAF GOME-2A products as well as to climate data record OMI and GOME-2A NO2 data products generated within the EU QA4ECV project.
The paper is structured as follows: Sects. 2 and 3 describe the OMI and GOME-2A sensors and datasets as well as the reference ground-based measurements. Section 4 presents the comparison methodology, and comparison results are discussed in Sect. 5. In Sect. 6, we concentrate on the quantification of horizontal dilution effects in satellite measurements performed around the measurement sites, and we show how these effects impact the validation results in urban conditions. Section 7 presents a summary of the validation results, and conclusions are detailed in Sect. 8.
Tropospheric NO2 data products from spaceborne sensors are generally retrieved via three main steps: firstly, a DOAS spectral analysis, yielding the total column amount of NO2 along the slant optical path; secondly an estimation of the stratospheric NO2 column, to be subtracted from the total column to derive the tropospheric contribution (so-called “residual” technique); and finally a conversion from slant (SCD) to vertical (VCD) column densities. The last step is based on air mass factor (AMF) calculations which require a priori knowledge of the NO2 vertical distribution, pressure and temperature, surface albedo and aerosols and information on (effective) cloud cover and height (Boersma et al., 2004). The retrieval of tropospheric NO2 is given by
Different data products have been generated for each satellite instrument, using different assumptions for each of the three aforementioned steps (see Boersma et al., 2004; Richter et al., 2011; Lin et al., 2014; Bucsela et al., 2013; Lamsal et al., 2014; van Geffen et al., 2015; Krotkov et al., 2016; Lorente et al., 2017; Liu et al., 2019a, b, 2020). In addition to instrument-specific differences, structural uncertainties arising from the application of different retrieval methodologies to the same satellite observations (sometimes also called forward model uncertainties) can introduce differences in the retrieved tropospheric NO2 columns (VCDtropo) of 10 %–50 % (e.g., van Noije et al., 2006; Lorente et al., 2017; Zara et al., 2018). SCD structural uncertainties generally do not exceed 1×10¹⁵ molecules cm−2, while the AMF calculation leads to more significant uncertainties (Boersma et al., 2004), which can be separated into implementation differences (when different groups use identical ancillary data for the calculation of tropospheric NO2 AMFs) of about 6 % and structural differences, due to ancillary data selection, which can reach 31 %–42 % (Lorente et al., 2017). The uncertainty in separating the stratospheric and tropospheric columns is about 0.5×10¹⁵ molecules cm−2 (Dirksen et al., 2011; Lorente et al., 2017).
In the present study, we focus on the ground-based validation of the mid-morning GOME-2A and the early afternoon OMI data. Illustration of the validation method and step-by-step results along the paper are given for the GOME-2A GDP (GOME Data Processor) 4.8 NO2 operational data product (Valks et al., 2011) and the OMI DOMINO v2.0 data product (Boersma et al., 2011), while final validation results and discussion also gather results for the GOME-2A and OMI QA4ECV products (Boersma et al., 2018; Zara et al., 2018). All products are briefly presented in Table 1 and in the following subsections.
Table 1Description of the satellite retrievals algorithms involved in this study.
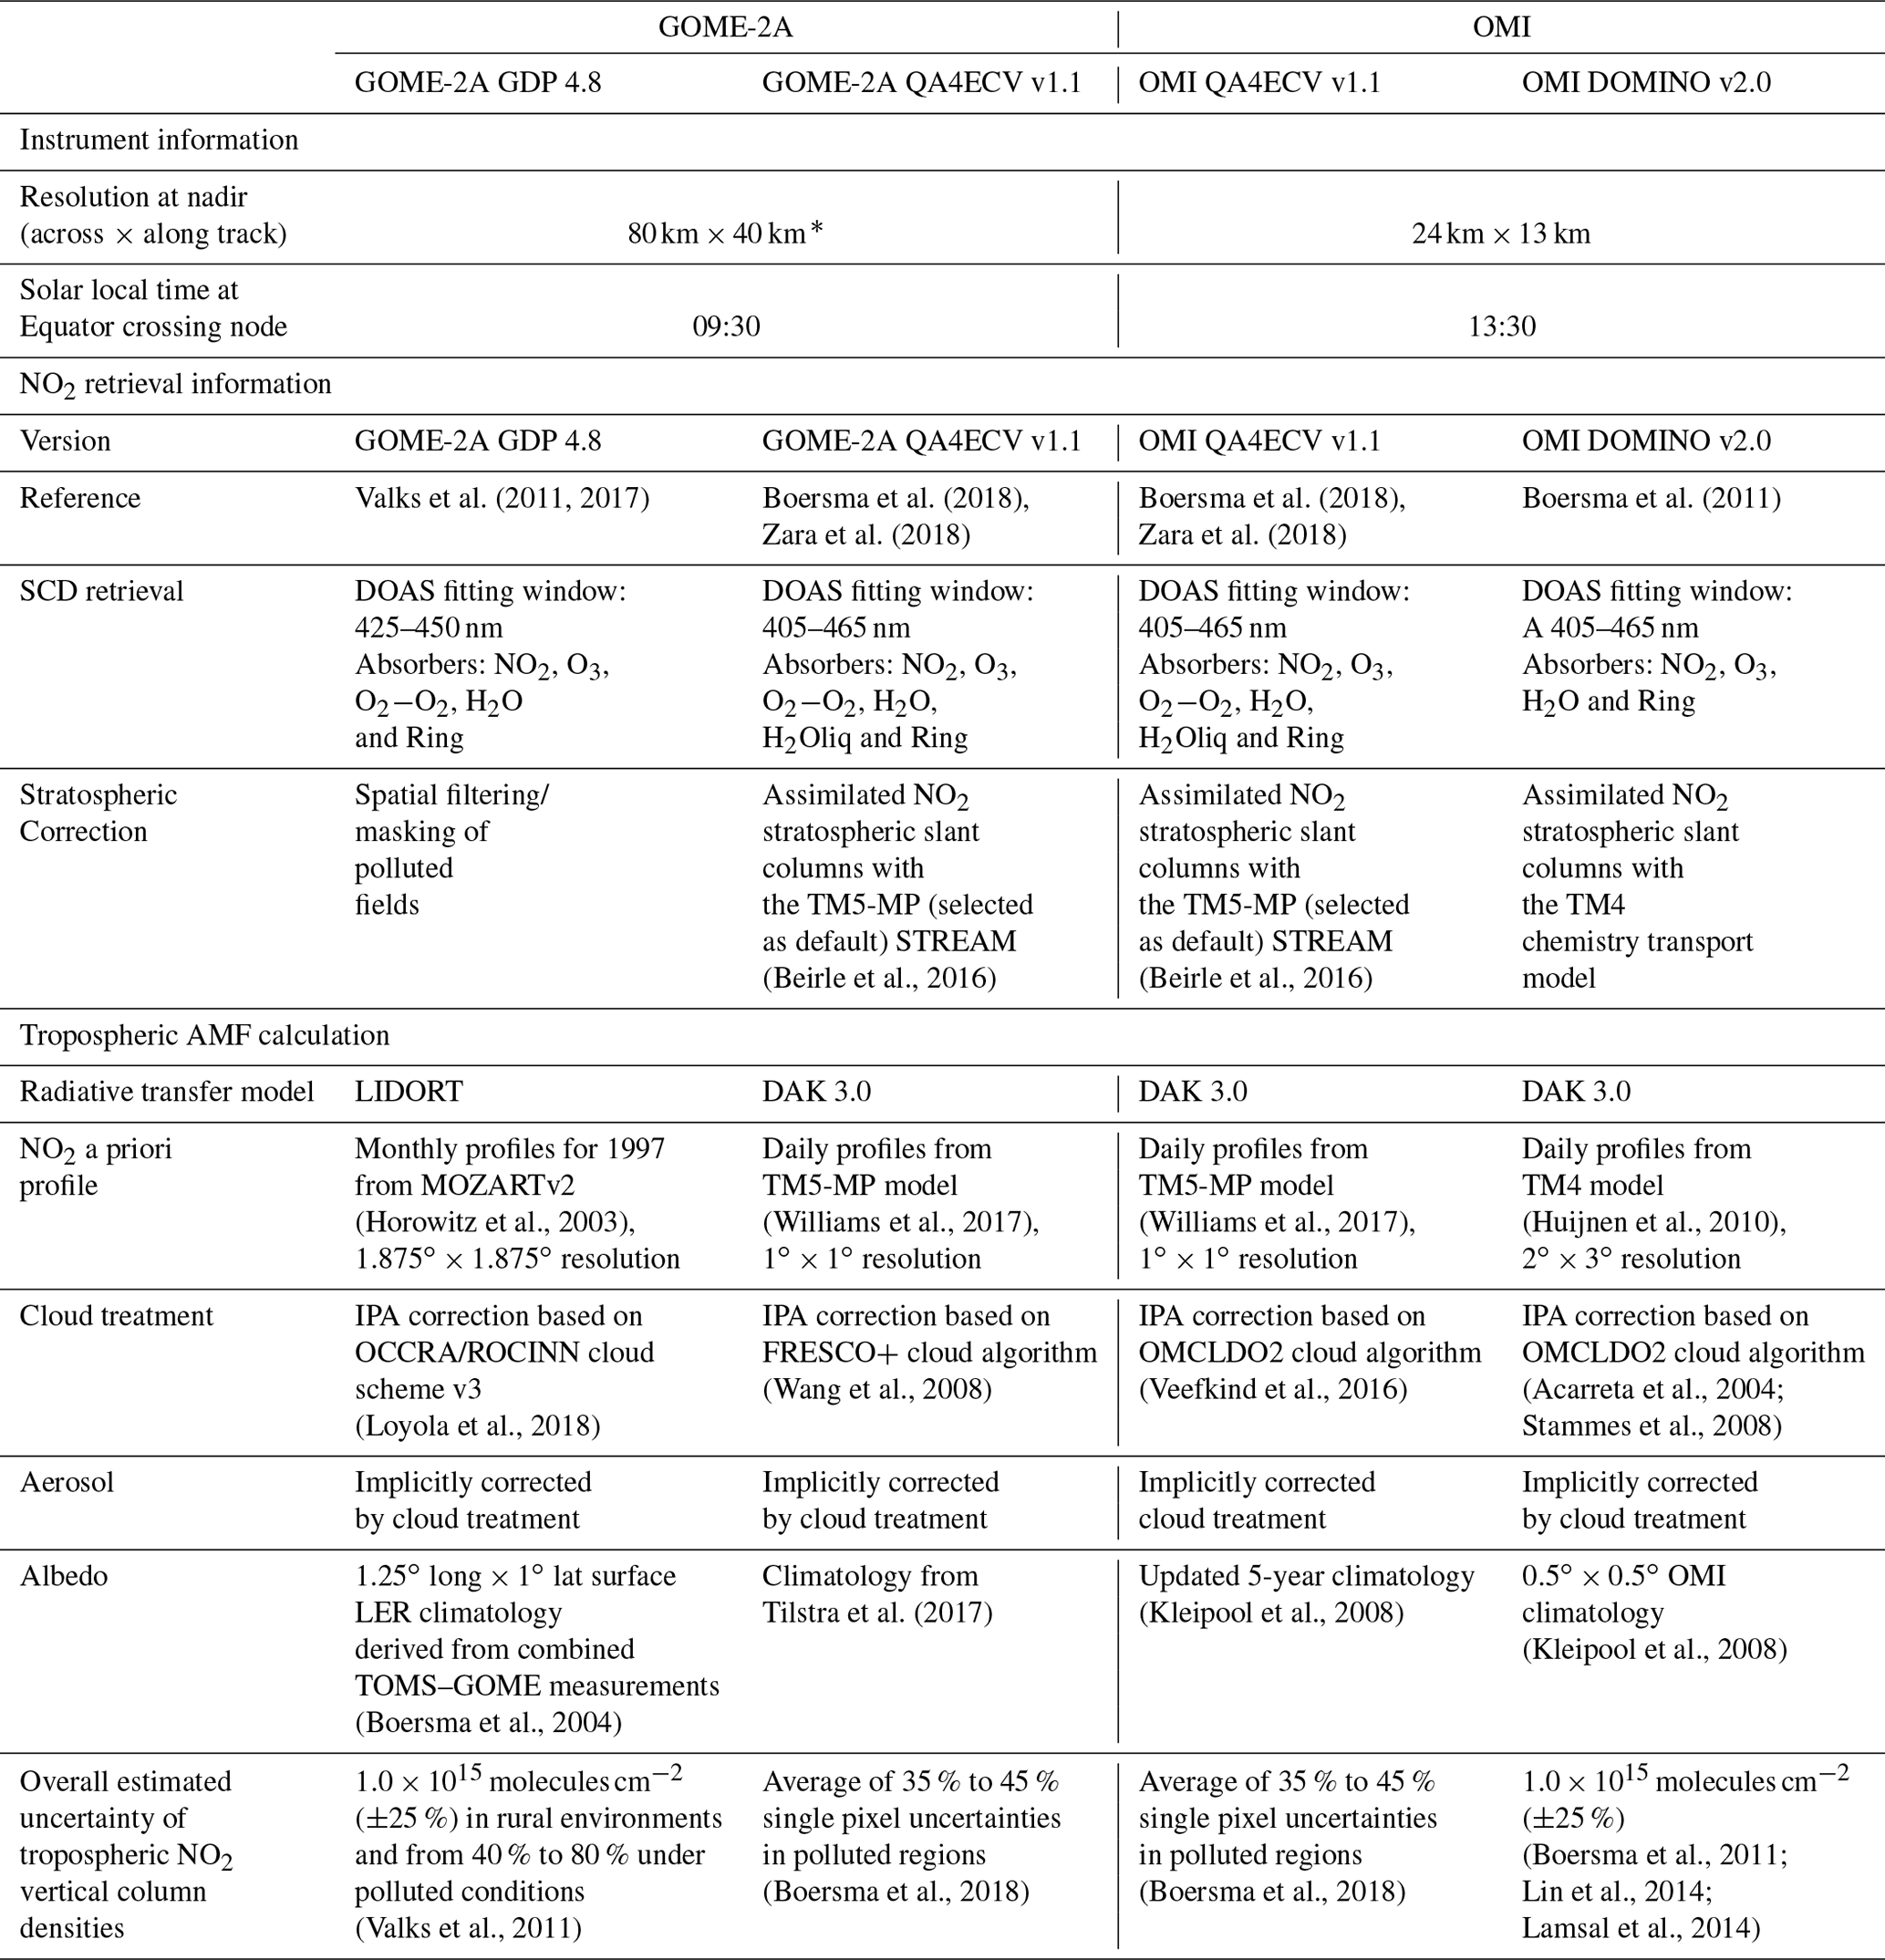
* Since 15 July 2013 GOME-2A has been operating in a reduced swath mode, corresponding to a ground pixel size of 40 km×40 km.
2.1 GOME-2 products
The second Global Ozone Monitoring Instrument (GOME-2) is a nadir-looking UV–visible spectrometer measuring the solar radiation backscattered by the atmosphere and reflected by the Earth and clouds in the 240–790 nm wavelength interval, with a spectral resolution of 0.2–0.5 nm full width at half maximum (FWHM; Munro et al., 2016). There are three versions of GOME-2 instruments flying on a sun-synchronous polar orbit on board the Meteorological Operational satellites (MetOp-A, MetOp-B and MetOp-C, launched respectively in October 2006, September 2012 and November 2018). They have an Equator crossing time of 09:00–09:30 local time in the descending node. In this study we concentrate on the GOME-2A instrument (that is on MetOp-A), which presents the longest data record. The default swath width of the GOME-2A across-track scan is 1920 km, allowing global Earth coverage within 1.5–3 d at the Equator, with a nominal ground pixel size of 80 km×40 km. Since 15 July 2013, GOME-2A has been measuring in a reduced swath mode of 960 km, with a ground pixel size of 40 km×40 km.
Operational products are retrieved from GOME-2 measurements in the framework of the Atmospheric Composition Satellite Application Facility AC SAF (https://acsaf.org/, last access: 29 October 2020; formerly O3M SAF; see also Hassinen et al., 2016). Total, tropospheric and stratospheric NO2 columns are operationally retrieved with the GOME Data Processor (GDP, and a description of this algorithm can be found in Valks et al. (2011) and Liu et al. (2019b). Within the QA4ECV (Quality Assurance for Essential Climate Variables) project, a coherent offline NO2 dataset has been created for GOME, SCIAMACHY, GOME-2A and OMI (Boersma et al., 2018; Zara et al., 2018; Lorente et al., 2017), and comparisons with this dataset are also included at the end of this study.
Table 1 summarizes the main retrieval steps for the various tropospheric NO2 products considered here. The main differences are related to the methods to obtain the stratospheric NO2 column, the cloud parameters and the a priori information used to calculate the tropospheric air mass factor. In the Q4ECV case, stratospheric columns are derived using two different approaches (assimilation in TM4 and STREAM). The stratospheric separation method has an estimated uncertainty in the 0.15–0.3×10¹⁵ molec cm−2 range (Valks et al., 2011). The typical overall uncertainty for individual retrievals of tropospheric NO2 vertical column densities is estimated to be 1.0×10¹⁵ molecules cm−2 (±25 %) in rural environments and from 40 % to 80 % under polluted conditions (Valks et al., 2011).
Previous validation of GOME-2A GDP 4.8 data can be found in Valks et al. (2011), Hassinen et al. (2016) and Liu et al. (2019b) for a few MAX-DOAS stations, and results of regular validation exercises can be found at http://cdop.aeronomie.be/validation/valid-results (last access: 29 October 2020). Satellite-to-satellite comparisons of the GOME-2A QA4ECV data have been performed by Zara et al. (2018), Lorente et al. (2017) and Liu et al. (2019b). Previous GOME-2 validation highlighted the effect of GOME-2 large pixels and the aerosol shielding effect, leading, e.g., to differences of 5 % to 25 % over China (Ma et al., 2013; Wu et al., 2013; Wang et al., 2017; Drosoglou et al., 2018). Liu et al. (2019b) showed possible improvements of the GDP 4.8 product, leading to reduced discrepancies of the satellite-to-ground-based biases of the order of 10 % to 25 % for several MAX-DOAS stations.
2.2 OMI products
OMI (Ozone Monitoring Instrument) is a nadir-viewing imaging spectrometer with a spectral resolution of about 0.5 nm FWHM (Levelt et al., 2006). The light entering the telescope is depolarized using a scrambler and split into two spectral bands: a UV channel (wavelength range 270–380 nm) and a visible channel (wavelength range 350–500 nm). The 114∘ viewing angle of the telescope corresponds to a 2600 km wide swath on the Earth's surface distributed over 60 cross-track positions, which enables quasi-global coverage in 1 d. In the nominal global operation mode, the OMI ground pixel size varies from 13 km×24 km at true nadir to 28 km×150 km on the edges of the swath. OMI is on board the EOS-Aura satellite that was launched in July 2004, in a sun-synchronous polar orbit crossing the Equator around 13:45 LT (in ascending node). The radiometric stability of the OMI instrument is exceptionally good (Schenkeveld et al., 2017); however, since June 2007, several rows of the detector have been affected by a signal reduction, the so-called “row anomaly” (http://www.knmi.nl/omi/research/product/rowanomaly-background.php, last access: 29 October 2020), reducing the usable swath coverage (see Boersma et al., 2018).
The DOMINO (Derivation of OMI tropospheric NO2) product is distributed in NRT via the TEMIS (Tropospheric Emission Monitoring Internet Service; http://www.temis.nl, last access: 29 October 2020) project (Boersma et al., 2011). The offline OMI QA4ECV v1.1 product (Boersma et al., 2018) is very similar to the GOME-2A product, as can be seen in Table 1. For OMI, the stratospheric separation is performed using a data assimilation scheme based on the TM4 or TM5-MP chemistry transport models. Its uncertainty is estimated to be about 0.2–0.3×10¹⁵ molec cm−2 (Boersma et al., 2004; Dirksen et al., 2011). Stratospheric NO2 vertical columns used in our study are derived from assimilated stratospheric slant columns divided by a geometrical air mass factor, as described in Hendrick et al. (2012). For the OMI QA4ECV dataset, two estimates of the stratospheric column are reported (data assimilation and STREAM), and Boersma et al. (2018) illustrated the differences for both approaches, with differences of up to 1×10¹⁵ molec cm−2. Compernolle et al. (2020) showed best agreement with ZSL-DOAS NDACC measurements for the STREAM stratospheric dataset, with mean differences between the two datasets of the order of 0.2×10¹⁵ molec cm−2 on average.
OMI DOMINO v2.0 has been widely used in the past, and several validation exercises (Brinksma et al., 2008; Hains et al., 2010; Vlemmix et al., 2010; Irie et al., 2008a, 2012; Lin et al., 2014; Wang et al., 2017; Drosoglou et al., 2017, 2018; Liu et al., 2019a) found underestimation of the OMI tropospheric NO2 columns in urban conditions and a better agreement in background locations (Celarier et al., 2008; Halla et al., 2011; Kanaya et al., 2014). Kanaya et al. (2014) showed close correlations with MAX-DOAS observations at seven stations but found low biases of up to ∼50 %. Regarding the OMI QA4ECV product, Boersma et al. (2018) reported a first validation at the Tai'an station (China) in 1 summer month, finding good agreement (bias of −2 %) with respect to MAX-DOAS NO2 columns (better than the agreement found for DOMINO v2 of −11 % bias). Liu et al. (2019a) investigated the impact of correcting for aerosol vertical profiles in the OMI data and compared four OMI datasets (POMINO and POMINO v1.1, DOMINO v2.0 and QA4ECV) with respect to data of three Chinese stations. Results suggested a significant improvement of the OMI NO2 retrieval when correcting for aerosol profiles, in general and for hazy days. This is consistent with the previous finding that the accuracy of DOMINO v2.0 is reduced for polluted, aerosol-loaded scenes (Boersma et al., 2011; Kanaya et al., 2014; Lin et al., 2014; Chimot et al., 2016). Liu et al. (2019a) also established discrepancies in DOMINO v2.0 for very high NO2 values (>70×1015 molec cm−2). For 18 cloud-free days, they found smaller differences between the four products with respect to MAX-DOAS, with the QA4ECV dataset having the highest R2 (0.63) and the lowest bias ( %). An extended validation of the QA4ECV OMI product is reported in the recent Compernolle et al. (2020) study, showing a negative bias (from −1 to −4×10¹⁵ molec cm−2) with respect to 10 MAX-DOAS instruments, a feature also found for the OMI OMNO2 standard data product. They also found that the tropospheric VCD discrepancies between satellite and ground-based data exceed the combined measurement uncertainties and that, depending on the site, this discrepancy could be attributed to a combination of comparison errors (horizontal smoothing difference error, error related to clouds and aerosols and differences due to a priori profile assumptions).
3.1 MAX-DOAS technique
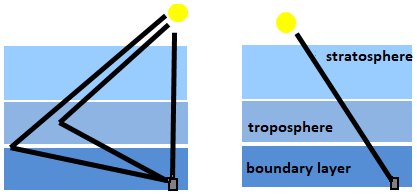
A MAX-DOAS instrument measures the scattered sunlight under a sequence of viewing elevation angles extending from the horizon to the zenith (Fig. 1a). At low elevation angles, the observed sunlight travels a long path in the lower troposphere (under aerosol-free conditions, the lower the elevation angle, the longer the path), while all observations have approximately the same light path in the stratosphere, independently of viewing elevation. By taking the difference in SCD between off-axis observations and a (nearly) simultaneously acquired zenith reference spectrum (the differential slant column), the stratospheric contribution can therefore be eliminated. Tropospheric absorbers can be measured along the day, generally up to a solar zenith angle (SZA) of approximately 85∘ (Hönninger et al., 2004; Sinreich et al., 2005).
Radiance spectra acquired at different elevation angles are analyzed using the DOAS method (Platt and Stutz, 2008), which gives integrated trace gas concentrations along the atmospheric absorption path. The resulting differential slant columns (dSCDs) can be converted to vertical columns and/or vertical profiles using methods of different levels of complexity. Table 2 presents details about the retrieval strategy adopted by different teams. They generally belong to one of the following categories:
- -
Geometrical approximation (GA). The vertical column is determined under the assumption that a single-scattering approximation can be made for moderately high elevation angles α (typically 30∘) so that a simple geometrical air mass factor () (Hönninger et al., 2004; Brinksma et al., 2008; Ma et al., 2013) can be used.
- -
QA4ECV datasets. The vertical column is calculated using tropospheric AMFs based on climatological profiles and aerosol situations as developed during the QA4ECV project (http://uv-vis.aeronomie.be/groundbased/QA4ECV_MAXDOAS/QA4ECV_MAXDOAS_readme_website.pdf, last access: 29 October 2020). These data are less sensitive to the relative azimuth angle than the purely geometric approximation presented above.
- -
Vertical profile algorithms using an optimal estimation method (OEM; Rodgers, 2000). These make use of a priori vertical profiles and associated uncertainties (Frieß et al., 2006; Clémer et al., 2010; Hendrick et al., 2014; Wang et al., 2017; Friedrich et al., 2019; Bösch et al., 2018).
- -
Vertical profile algorithms based on parameterized profile shape functions. These make use of analytical expressions to represent the trace gas profile using a limited number of parameters (Irie et al., 2008a, b; 2011; Li et al., 2010; Vlemmix et al., 2010; Wagner et al., 2011; Beirle et al., 2019).
Table 2MAX-DOAS tropospheric NO2 datasets included in this study (23 stations, 15 with profiles). GA stands for geometrical approximation, OEM for optimal estimation method and PP for parameterized profiling.
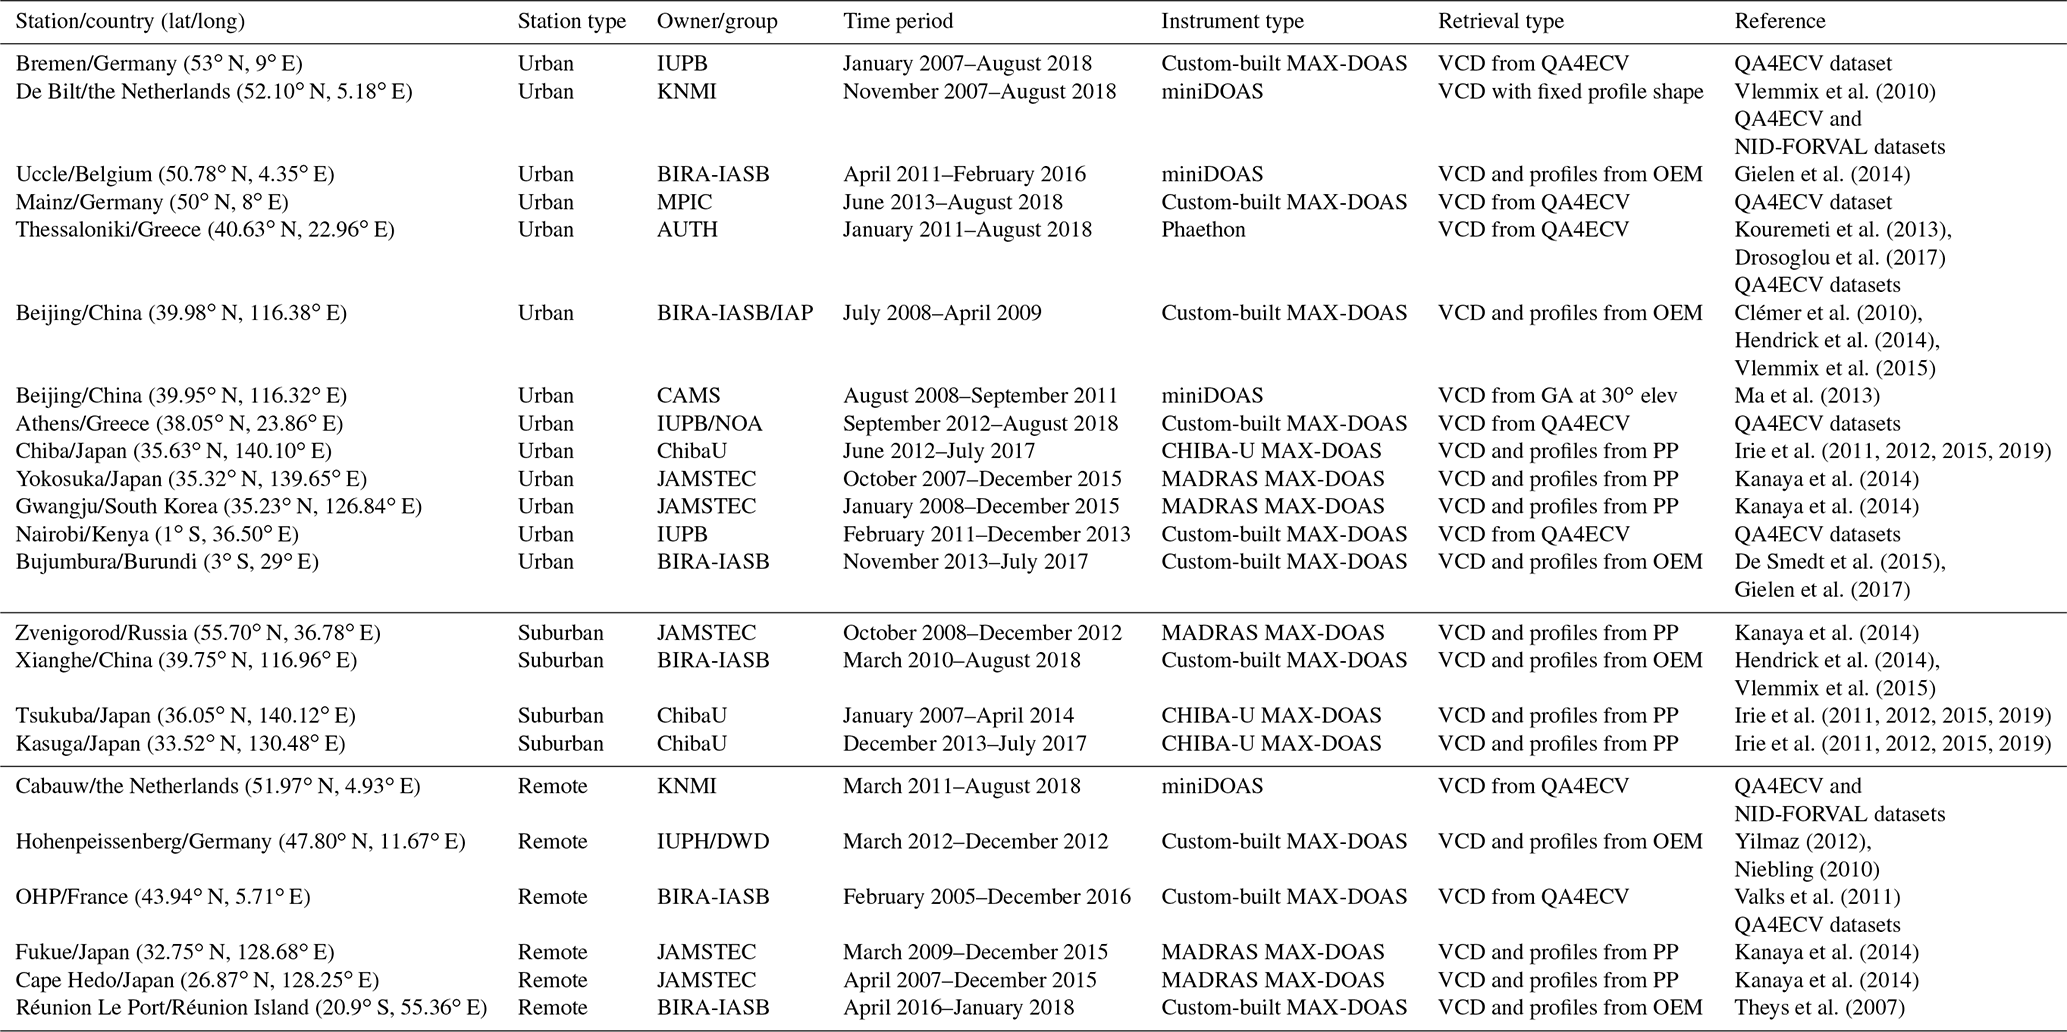
MAX-DOAS profile inversion algorithms use a two-step approach: in the first step, aerosol extinction profiles are retrieved from the measured absorption of the oxygen dimer O4 (Wagner et al., 2004; Frieß et al., 2006). In a second step, trace gas profiles are retrieved from the measured trace gas absorptions, taking into account the aerosol extinction profiles retrieved in the first step. Both OEM and parameterized profiling approaches provide vertical profiles of aerosols and NO2 with a sensitivity typically in the 0–4 km altitude range, with generally between 1.5 and 3 independent pieces of information in the vertical dimension (Vlemmix et al., 2015; Frieß et al., 2016, 2019; Tirpitz et al., 2020). This complementary information on the vertical distribution of gases and aerosols in the atmosphere has been used in some studies to test some key assumptions made in the satellite data retrieval, in particular the a priori NO2 profile and aerosols content, providing therefore more insight into the quality of the satellite data (e.g., Wang et al., 2017b; Liu et al., 2019b, 2020; Compernolle et al., 2020). Recent intercomparison studies (Vlemmix et al., 2015; Frieß et al., 2019; Tirpitz et al., 2020) show that both OEM and parameterized inversion approaches lead to consistent results in terms of tropospheric vertical column but larger differences in terms of profiles. In this study, every data provider submitted data retrieved with their own tools and formats, without any harmonization. Our study focuses therefore only on the vertical column, which is the more robust and reliable retrieved quantity. The time coverage of the different datasets used in this study is presented in Fig. S1 in the Supplement.
The accuracy of the MAX-DOAS technique depends on the SCD retrieval noise, the uncertainty of the NO2 absorption cross sections and most importantly the uncertainty of the tropospheric AMF calculation. The estimated total error on NO2 VCD is of the order of 7 %–17 % in polluted conditions. This includes both random (around 3 % to 10 % depending on the instruments) and systematic (11 % to 14 %) contributions (e.g., Irie et al., 2008, 2011, 2012; Wagner et al., 2011; Hendrick et al., 2014; Kanaya et al., 2014). In extreme cases, the error can however reach ∼30 % depending on geometry and aerosols.
3.2 Direct sun technique
Equipped with a 2-axis positioner, direct-sun-capable DOAS instruments measure non-scattered photons. Such instruments are equally sensitive to both tropospheric and stratospheric absorptions (Fig. 1b). They have a very small uncertainty in AMF and can provide accurate total column measurements with a minimum of a priori assumptions.
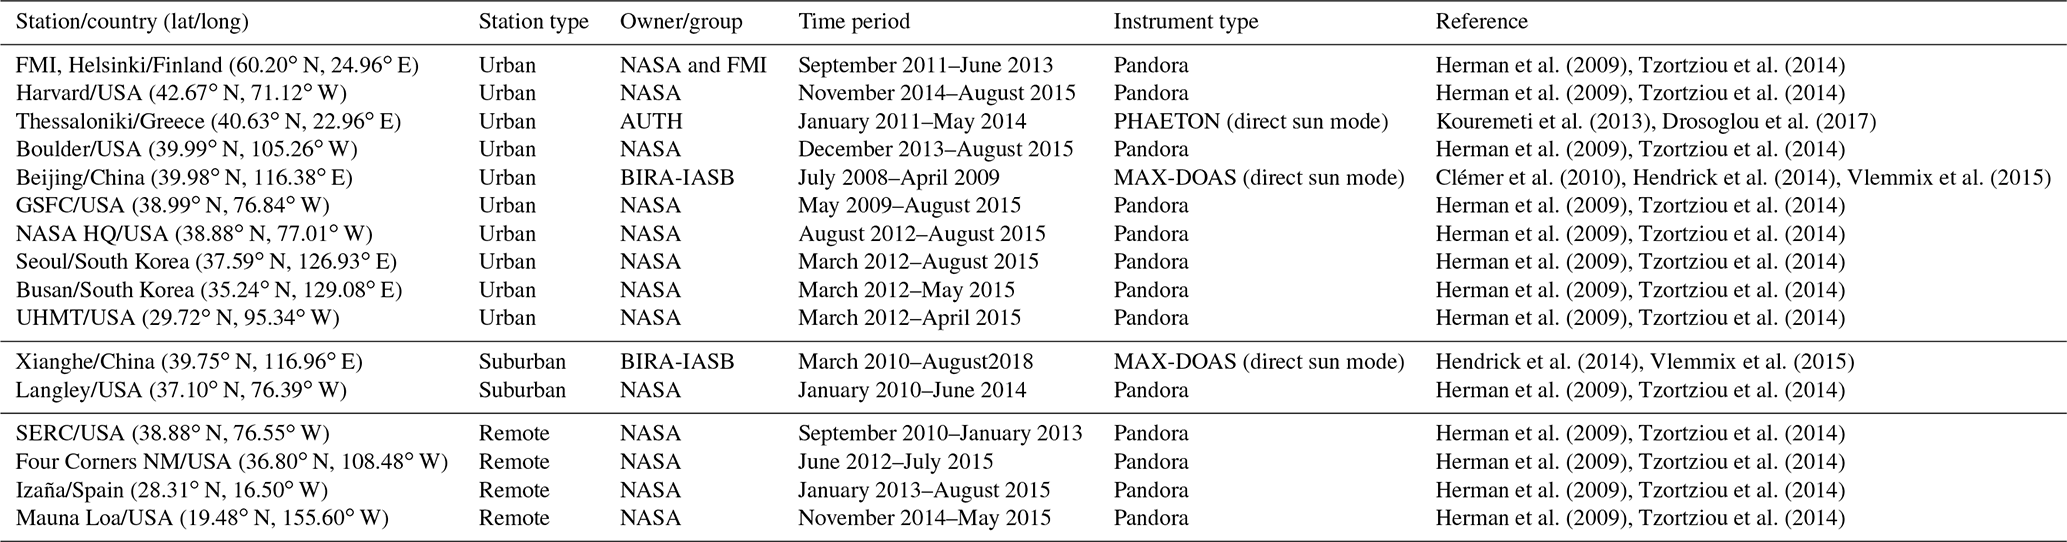
Direct sun (DS) observations are routinely available from Pandora spectrometer instruments. A standardized Pandora network has been set up by NASA (Herman et al., 2009; Tzortziou et al., 2014; Pandora project: http://pandora.gsfc.nasa.gov, last access: X29 October 2020) and extended by ESA and LuftBlick to form the PGN (Pandonia Global Network; http://www.pandonia-global-network.org/, last access: 29 October 2020). Pandora data used in this study originate mostly from the original NASA network, which includes more than 60 different sites covering different time periods (mostly campaign-based). In total, 15 Pandora direct sun instruments delivering at least 3 months of data have been considered here. They are listed in Table 3 with an indication of their location, ownership, availability (see also Fig. S2 in the Supplement) and references. Pandora instruments are generally operated in polluted areas (urban or suburban); however the network also contains a few background/remote sites located in Europe, Asia and the United States. Valid data were selected for a normalized root-mean square of weighted spectral fitting residuals (WRMS) of less than 0.005; uncertainty in NO2 retrievals less than 0.05 DU was kept (Alexander Cede, personal communication, 2015).
Table 3Direct sun instruments measuring total NO2 VCD included in this study (16 stations).
Recent detailed studies in US and South Korean sites during DISCOVER-AQ have shown good agreement of Pandora instruments with aircraft in situ measurements, within 20 % on average, although larger differences are observed for individual sites (Choi et al., 2020), the largest discrepancies being found in Texas (Nowlan et al., 2018). Good agreement of a few percent between Pandora and GeoTASO has been reported by Judd et al. (2019), while differences increase when resampling the comparisons for larger simulated pixel sizes, up to about 40 % bias for 18 km×18 km, similar to the bias found with OMI (50 %).
The Pandora spectrometers provide NO2 total vertical column observations, with a random uncertainty of about 2.7×10¹⁴ molec cm−2 and a systematic uncertainty of 2.7×10¹⁵ molec cm−2 (Herman et al., 2009). These account for DOAS fit systematic errors, random noise and uncertainties related to the estimation of the residual gas amount in the reference spectra. In the present study, direct sun tropospheric VCDs are derived from the measured total NO2 content after subtraction of the stratospheric part estimated using satellite data (SAT) (alone or within assimilation scheme; see Sect. 2), interpolated to the geolocation of the Pandora spectrometer:
Summing the Pandora error uncertainty and the error uncertainty on the stratospheric column in quadrature, this approach leads to an error uncertainty of about molec cm−2 on the tropospheric column from direct sun data. It should be noted that this approach leads to retrieval of the total tropospheric column from the direct sun, while the tropospheric column from MAX-DOAS represents mainly the boundary layer.
For the comparison, GOME-2A and OMI data were extracted within a radius of 50 km around the 36 stations listed in Tables 2 and 3, with only pixels having a cloud radiance fraction <50 % and an (Boersma et al., 2018) being selected. In the case of OMI, pixels affected by the row anomaly were filtered out (Boersma et al., 2018). As the pointing direction and horizontal sensitivity length are not reported for all ground-based instruments, our baseline approach is to consider only pixels encompassing the station location. However, a sensitivity test has been performed at the Xianghe station (where both parameters are provided in the data files) by selecting all pixels crossing the MAX-DOAS line of sight. Comparison results were found to be close to those from the baseline case, with only 10 additional coincident days.
To reduce the differences in spatial resolution of the satellite measurements (GOME-2A: 40 km×80 km; OMI: 13 km×24 km at best) compared to the ground-based sensitivity (horizontal length of the probed air mass up to ∼20 km), the largest pixels from each instrument dataset were removed: only pixels with an across-track width smaller than 100 km for GOME-2A and smaller than 40 km for OMI were kept in the comparisons. Previous studies have investigated the use of stricter coincidence criteria as a way to overcome spatial resolution differences. For example, Irie et al. (2008a) showed differences of up to 25 % in satellite VCD between pixels located 5 to 50 km away from the site, and only OMI pixels centered within of the MAX-DOAS stations were considered in the validation. Other approaches have averaged MAX-DOAS VCDs made in several azimuth directions (Brinksma et al., 2008; Celarier et al., 2008; Ortega et al., 2015) or have excluded MAX-DOAS measurements with a relative uncertainty ≥10 % (Vlemmix et al., 2010).
Ground-based (GB) MAX-DOAS data were interpolated to the satellite overpass time, and a verification of the presence of data within ±1 h was performed in order to avoid large interpolation errors. Pandora direct sun measurements have a much higher acquisition rate (approximately 30 acquisitions per hour compared to typically one to four MAX-DOAS measurements) with sometimes strong NO2 variations not perfectly removed with the data filtering, so Pandora measurements within 1 h (±30 min) of the satellite overpass time were averaged. On this basis, in addition to the daily comparisons at each station, corresponding monthly averages were also compared.
As an example, Fig. 2 shows the results of our analysis for the Xianghe MAX-DOAS site. Pollution episodes are well captured by both GOME-2A and OMI as well as seasonal variations characterized by high NO2 VCDs in winter and low values in summer. Quantitatively, the comparison of the whole time series is good, with correlation coefficient R values of 0.88 and 0.94 and linear regression slopes of about 0.79 and 0.93, for the monthly GOME-2A and OMI data respectively. VCDtropo differences (SAT–GB in ×1015 molec cm−2) and percent relative difference in %) were calculated for each site. For Xianghe the median bias is about molec cm−2 (−8 %) and 0.7×10¹⁵ molec cm−2 (−4.4 %) for GOME-2A and OMI data respectively. Values for each site are reported in Table S1 in the Supplement for GOME-2A and OMI, with daily and monthly statistics for correlation coefficient R, slope S and intercept I of a linear regression and mean and median monthly absolute and relative biases. Depending on the length of the ground-based time series, the number of daily comparison points can vary significantly, from at least 3 months of data to several years of continuous measurements.
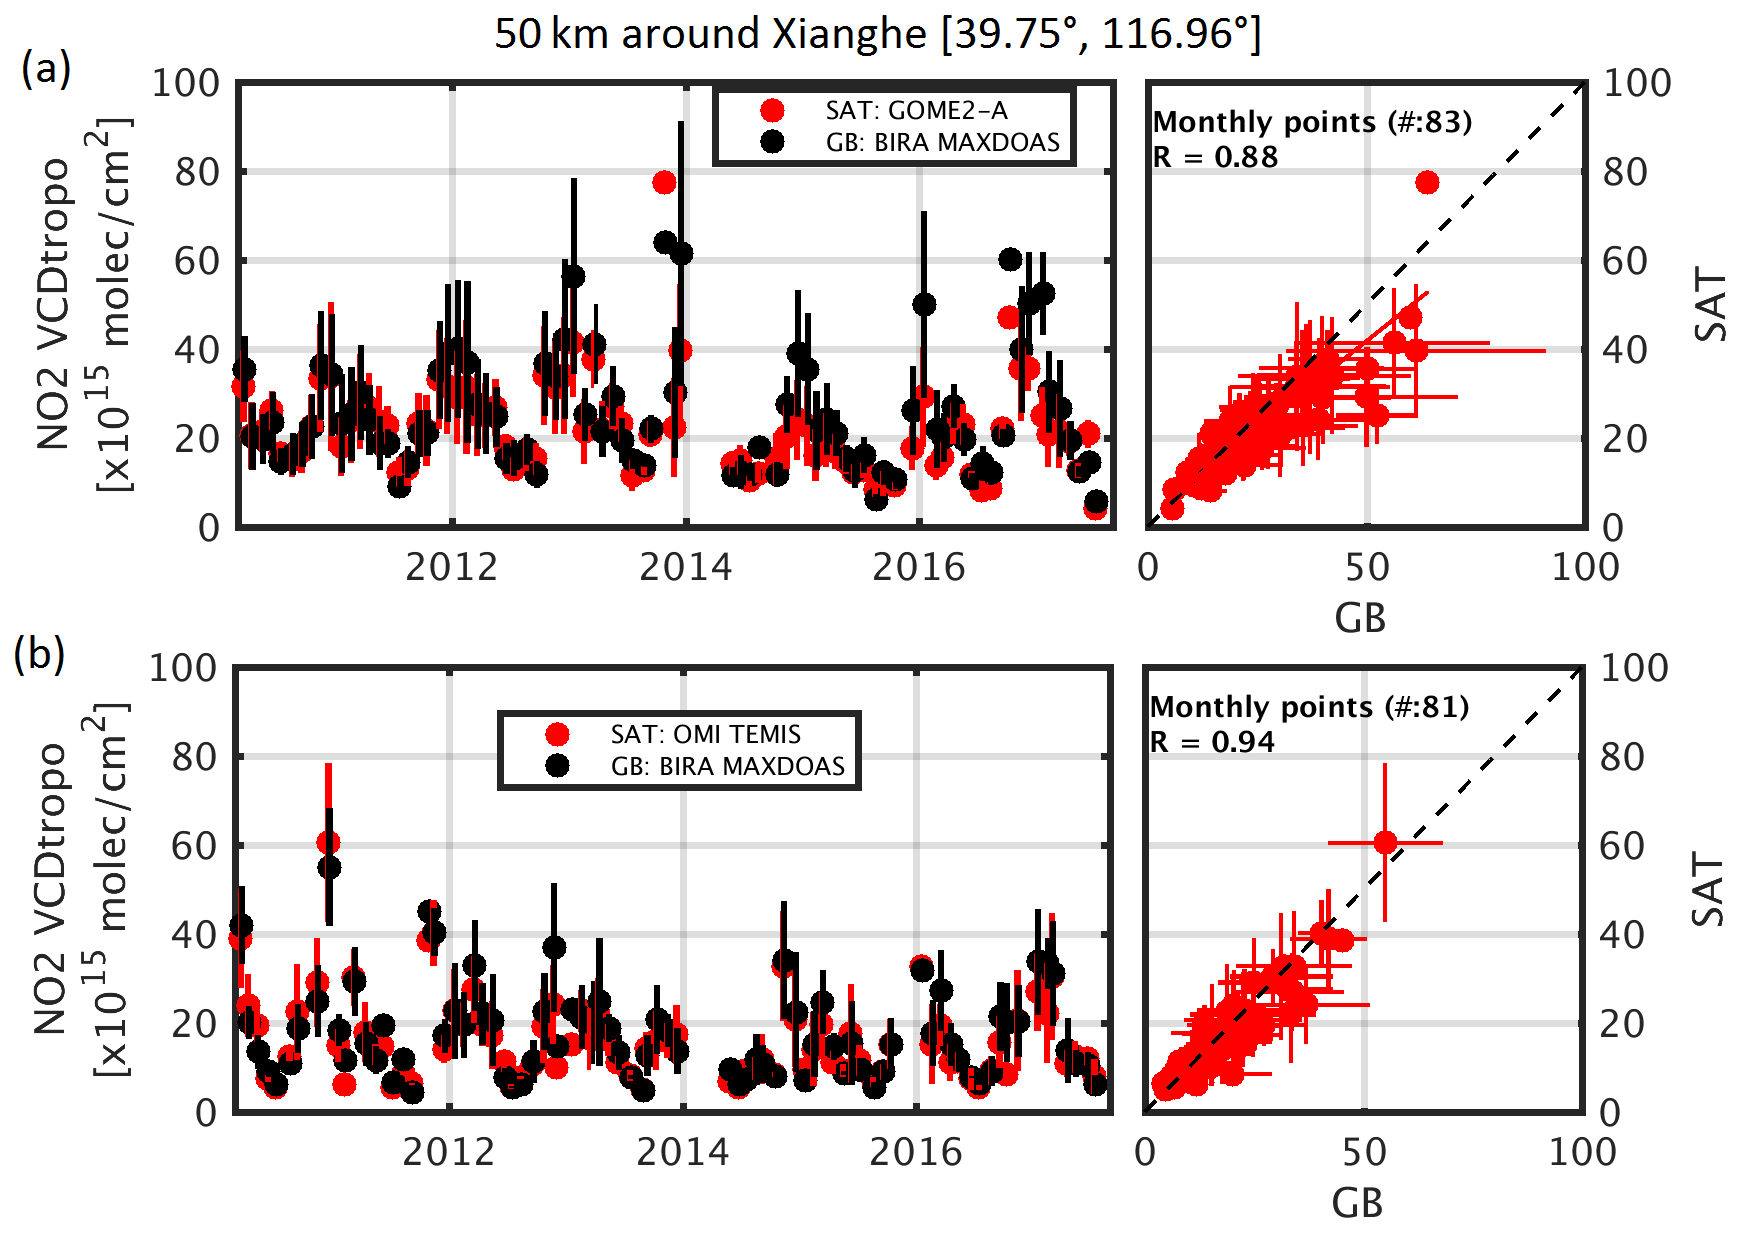
Figure 2Comparison of monthly mean tropospheric NO2 VCDs at the Xianghe station for (a) GOME-2A GDP 4.8 data and (b) OMI DOMINO v2.0 versus MAX-DOAS data, over the period March 2010 to July 2017. Correlation coefficients R are given as an inset in the scatterplots on the right column. The variability (standard deviation of the monthly mean) is given as error bars for both datasets.
5.1 Overview of the ground-based datasets
Figure 3 presents an overview of the tropospheric and stratospheric NO2 columns measured at each station, as obtained from the satellite-to-ground-based coincidences. The tropospheric columns correspond to the ground-based data as selected in Sect. 4 (including, for the direct sun case, the subtraction of the satellite-estimated stratospheric content; see Sect. 3), while the stratospheric columns are the satellite estimations. As can be seen from the box-and-whisker plot, the tropospheric content varies strongly among the stations, the observed median columns ranging from 1×10¹⁵ molec cm−2 in rural places (Hohenpeissenberg, Réunion, Cape Hedo, Mauna Loa, Izaña) to about 30 to 40×1015 molec cm−2 in highly polluted sites (Beijing, Seoul, Beijing-CMA). As can also be seen, tropospheric columns selected at GOME-2A overpass times (i.e., in the morning) are usually larger than those selected at OMI overpass time (13:30±0:90), which is explained by lower OH levels and somewhat higher NOx emissions, leading to slower NO2 chemical loss mid-morning (09:30) compared to noon (13:30) (Boersma et al., 2008; Kim et al., 2009). Note that the median tropospheric column is negative at the mountaintop stations of Izaña and Mauna Loa. This is either caused by a slight underestimation of the Pandora total columns or a slight overestimation of the stratospheric columns derived from satellite. This discrepancy is under investigation and will be the subject of a future study.
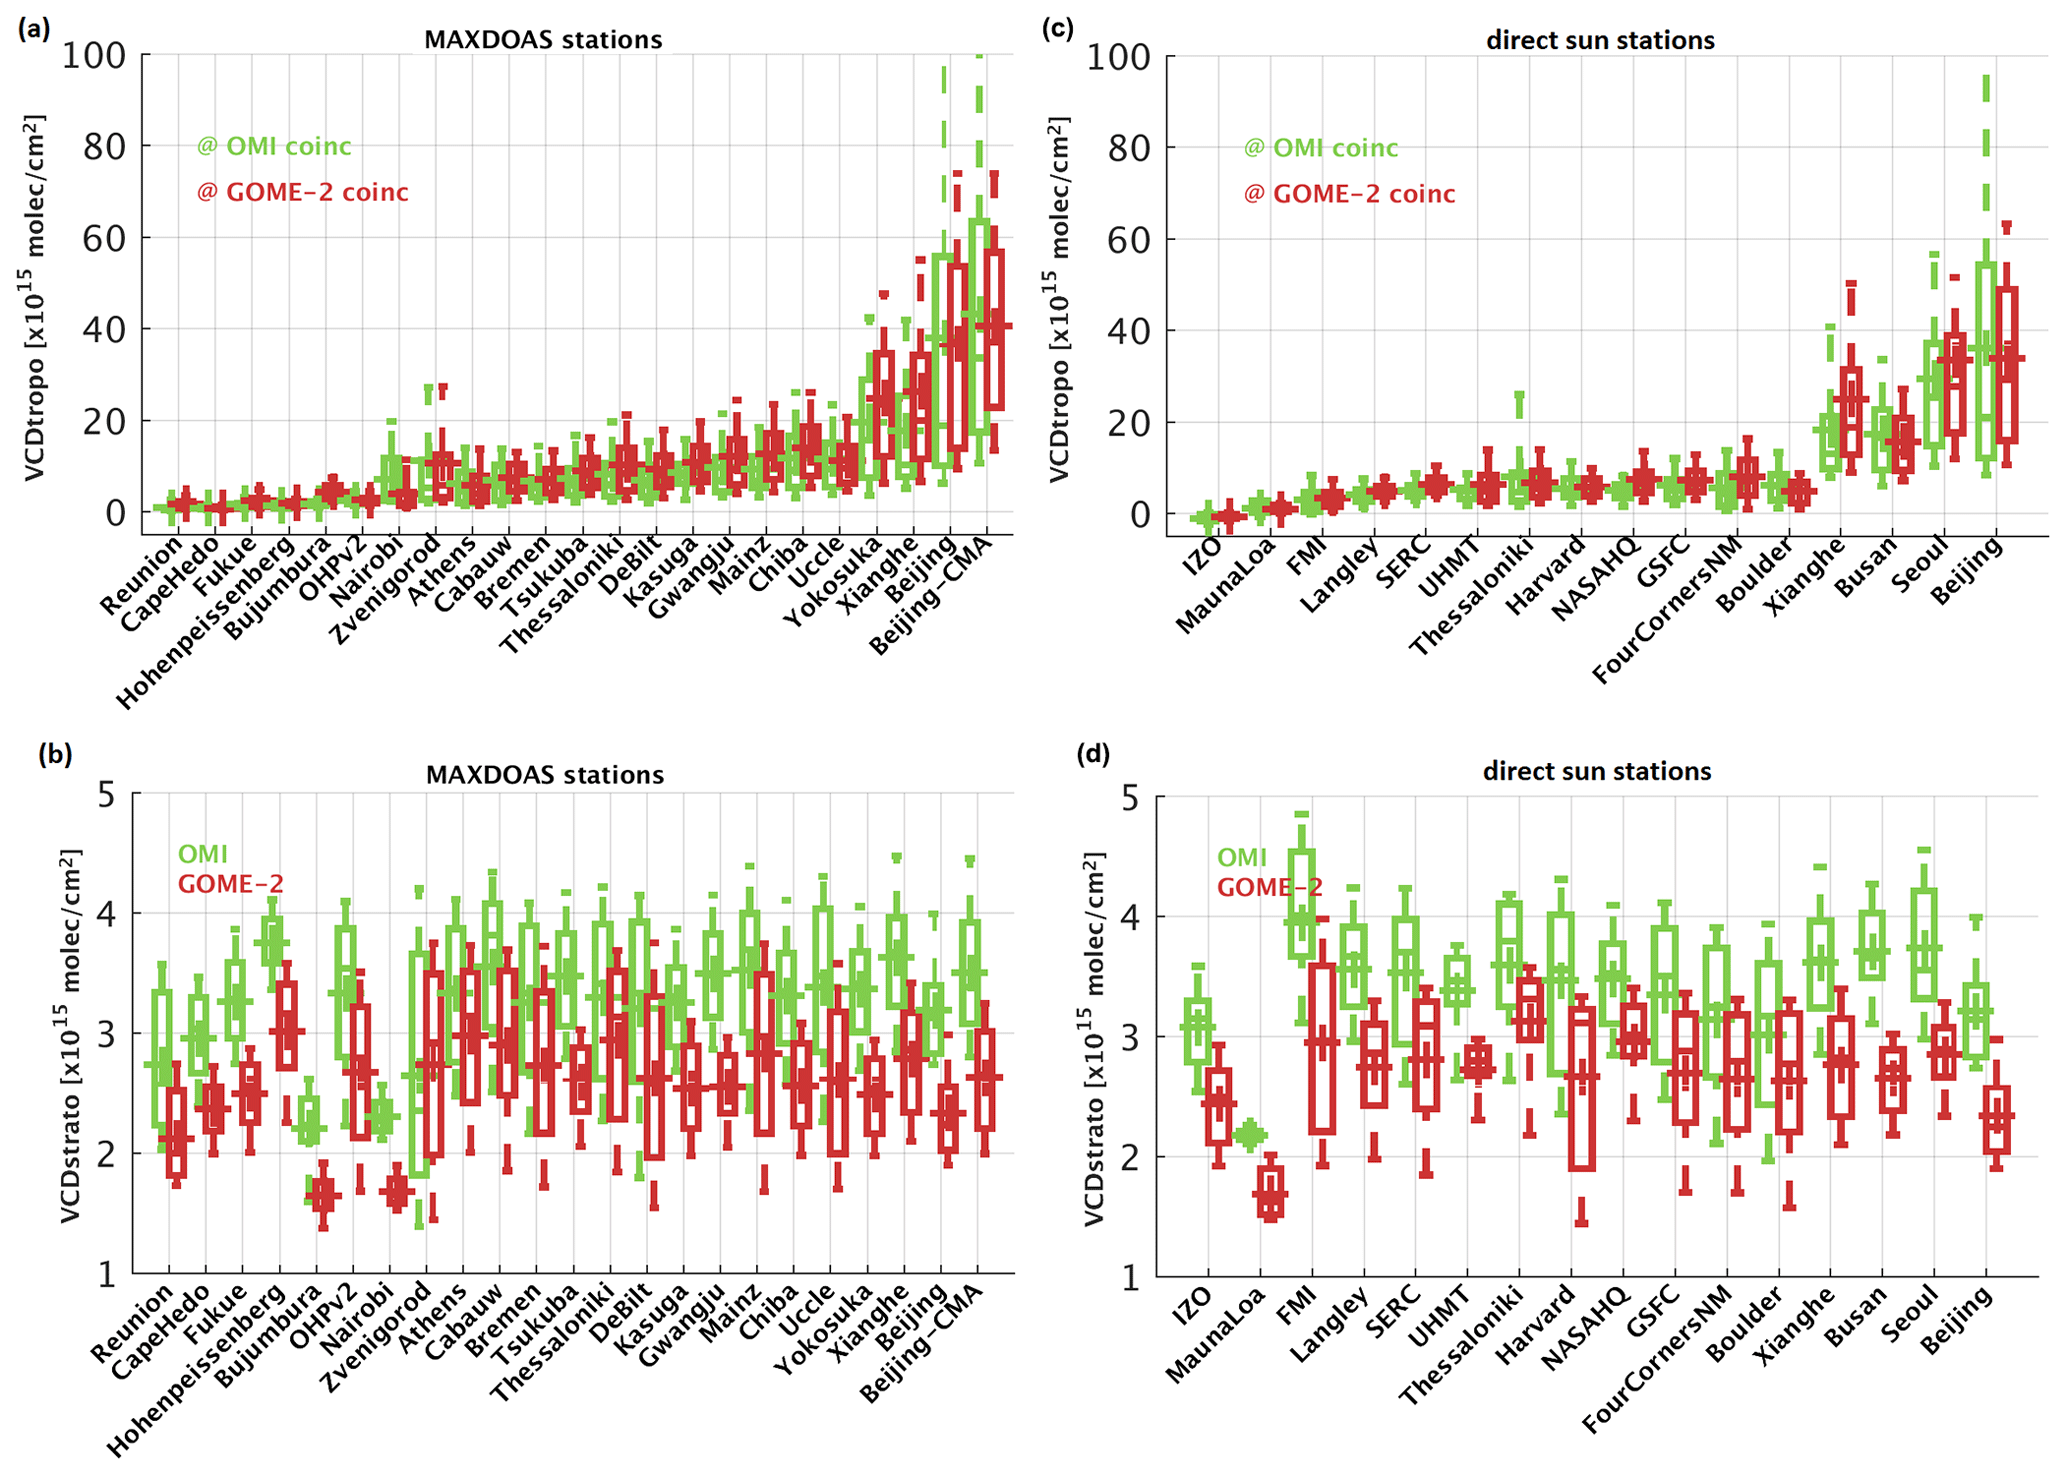
Figure 3NO2 columns at the various ground-based stations (MAX-DOAS in panels a, b and direct sun in panels c, d). (a) Box-and-whisker plot of the ground-based tropospheric NO2 columns (obtained by subtracting the satellite VCDstrato in the case of direct sun data) and (b) box-and-whisker plot of the stratospheric NO2 content derived from satellite instruments. OMI data in green; GOME-2A data in dark red. The box-and-whisker plots are defined as follows: crosses for the mean values, horizontal lines for the median, boxes for the 25 and 75 percentile and vertical lines for the 9 and 91 percentile. Stations are ordered by increasing values of the VCDtropo columns.
Due to different deployment strategies, the direct-sun-measuring instruments (especially Pandora instruments) were located closer to strong NO2 emission sources than MAX-DOAS instruments that sample both polluted and background sites. The MAX-DOAS ensemble of stations measured NO2 tropospheric columns in the 2 to 20×1015 range (about 18 MAX-DOAS stations and 10 direct sun stations). Moreover, being able to also measure under partially cloudy conditions, MAX-DOAS sites tend to sample the full variability of the NO2 field at measurement sites, while direct sun data preferentially sample clear-sky conditions. As a result, MAX-DOAS sites tend to display a larger variability, as can be judged from the larger boxes (25 % to 75 %) and lines (9 % to 91 %) in the box-and-whisker plots of Fig. 3a.
Figure 3b presents the stratospheric columns derived from the two satellites. Values typically range between 2×10¹⁵ and 3.5×10¹⁵ molec cm−2. The difference of about 0.6 (up to 1) ×1015 molec cm−2 between the GOME-2A and OMI data is consistent with the known diurnal variation of the stratospheric NO2, which results from the NO∕NO2 equilibrium and the progressive photodissociation of N2O5 during the day (Dirksen et al., 2011; Belmonte Rivas et al., 2014; van Geffen et al., 2015). Minimum values of the stratospheric column are obtained over the equatorial sites (Nairobi, Bujumbura and Mauna Loa).
The validity of the tropospheric estimation approach applied to the direct sun data (see Sect. 3.2 and Eq. 2) was verified at stations where both MAX-DOAS and direct sun measurements are performed. This is the case for three sites: Beijing, Xianghe and Thessaloniki. Combining these three datasets, Fig. 4 displays a scatterplot of the tropospheric NO2 columns measured by both techniques. Results are shown separately for GOME-2A and OMI overpass times. In both cases, a high level of correlation is obtained (linear correlation coefficient >0.95). The corresponding linear regression slopes are 1.09±0.02 and 1.06±0.01 for OMI and GOME-2A overpasses respectively, with intercepts of and molec cm−2. These results suggest that MAX-DOAS and direct sun data show a small relative bias of about 10 %–15 %. Part of this bias, which could change depending on pollution levels, may arise from the satellite-based stratospheric correction applied to direct sun data. However, it should be noted that MAX-DOAS and direct sun measurements are not synchronized, with typical differences in measuring time of about half an hour for these stations. The NO2 variability (which can be large in polluted sites) therefore probably contributes to the observed scatter and apparent bias. Furthermore, MAX-DOAS and direct sun instruments observe different air masses, which might lead to differences in the presence of horizontally inhomogeneous air masses.
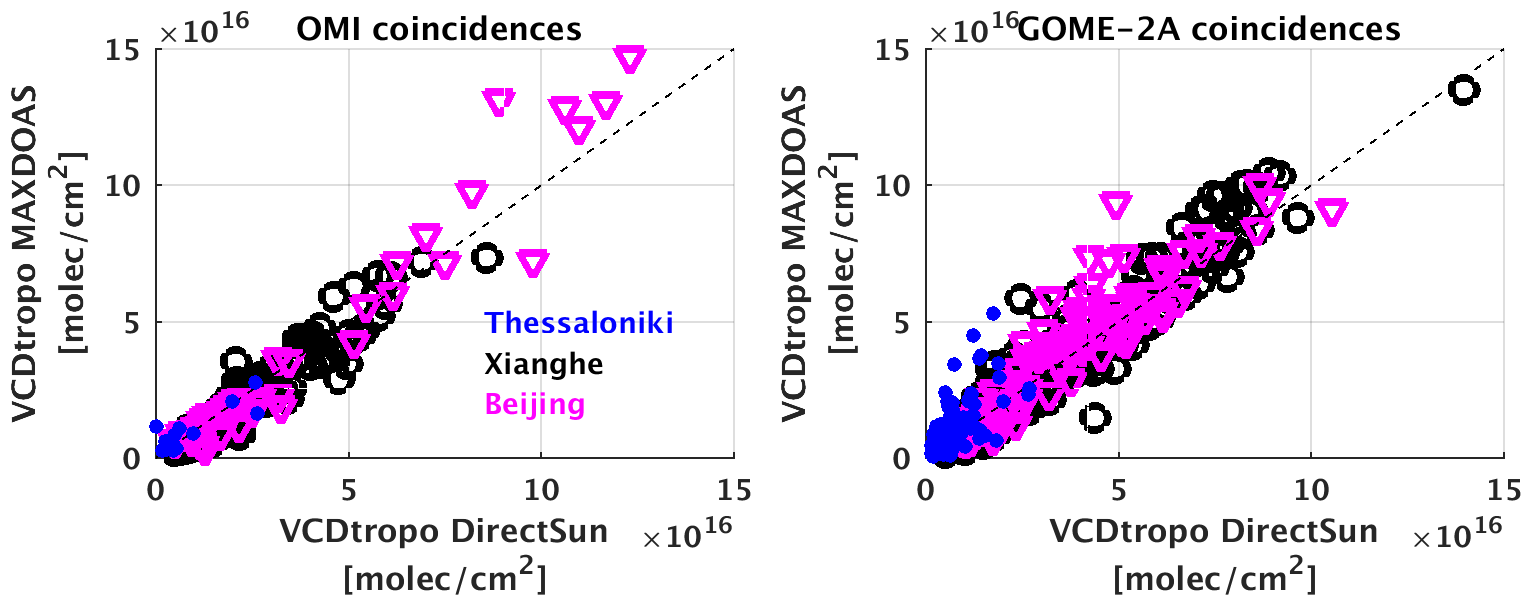
Figure 4MAX-DOAS and direct sun tropospheric NO2 columns in Thessaloniki, Xianghe and Beijing. At these sites, ground-based measurements are performed in both geometries.
Another approach to verify the consistency of the ground-based dataset is to investigate the coherence between measurements at sites that are geographically close to each other. For example, NASA-HQ and GSFC are very close to each other, but measurements were performed by different Pandora instruments and during different time periods. Their median VCDtropo differences for the overlapping days are about 4.4 and 7.8×10¹⁴ molec cm−2 at the OMI and GOME-2A overpasses respectively, in line with the expected uncertainty/variability of these ground-based data. Beijing and Beijing-CMA sites are interesting to compare since both are located inside the city, at a mutual distance of about 6 km. The first instrument has been measuring on the roof of the Institute of Atmospheric Physics (IAP) (Clémer et al., 2010), the second at the China Meteorological Administration (Ma et al., 2013). Both instruments have already been compared in Hendrick et al. (2014), showing good agreement (differences of about −2 % in winter and 3 % to 4 % for the rest of the period). When comparing their columns for the satellite's colocations, they present differences of about 1.7 and 6×10¹⁵ molec cm−2 at OMI and GOME-2A overpass times, respectively (12 % to 15 %). Another example is Chiba and Yokosuka. Both of these sites are situated in the urban area of Tokyo Bay but at about 53 km distance from each other. Their median differences from OMI and GOME-2A are 5.7 and 14.2×10¹⁵ molec cm−2 respectively (69 % to 82 %).
5.2 Comparison of ground-based and satellite datasets
The comparison methodology illustrated in Fig. 2 has been extended to the 23 MAX-DOAS and 16 direct sun stations gathered in this study. As expected, results show a clear dependence on the location of the comparison site. The best agreement is obtained in background/remote conditions, while comparisons are more challenging close to the sources, where the NO2 field is more heterogeneous (Chen et al., 2009; Irie et al., 2012; Ma et al., 2013; Pinardi et al., 2014). To illustrate this point, the different stations have been qualitatively classified by the station PIs into urban, suburban and background sites (see Tables 2 and 3), based on their location with respect to known pollution sources. This classification is not based on NO2 levels but reflects the influence of the surrounding areas. For example, Xianghe station is in a polluted background with high NO2 levels (see Fig. 3), but it is located at a relatively large distance from surrounding urban areas and is thus classified as suburban.
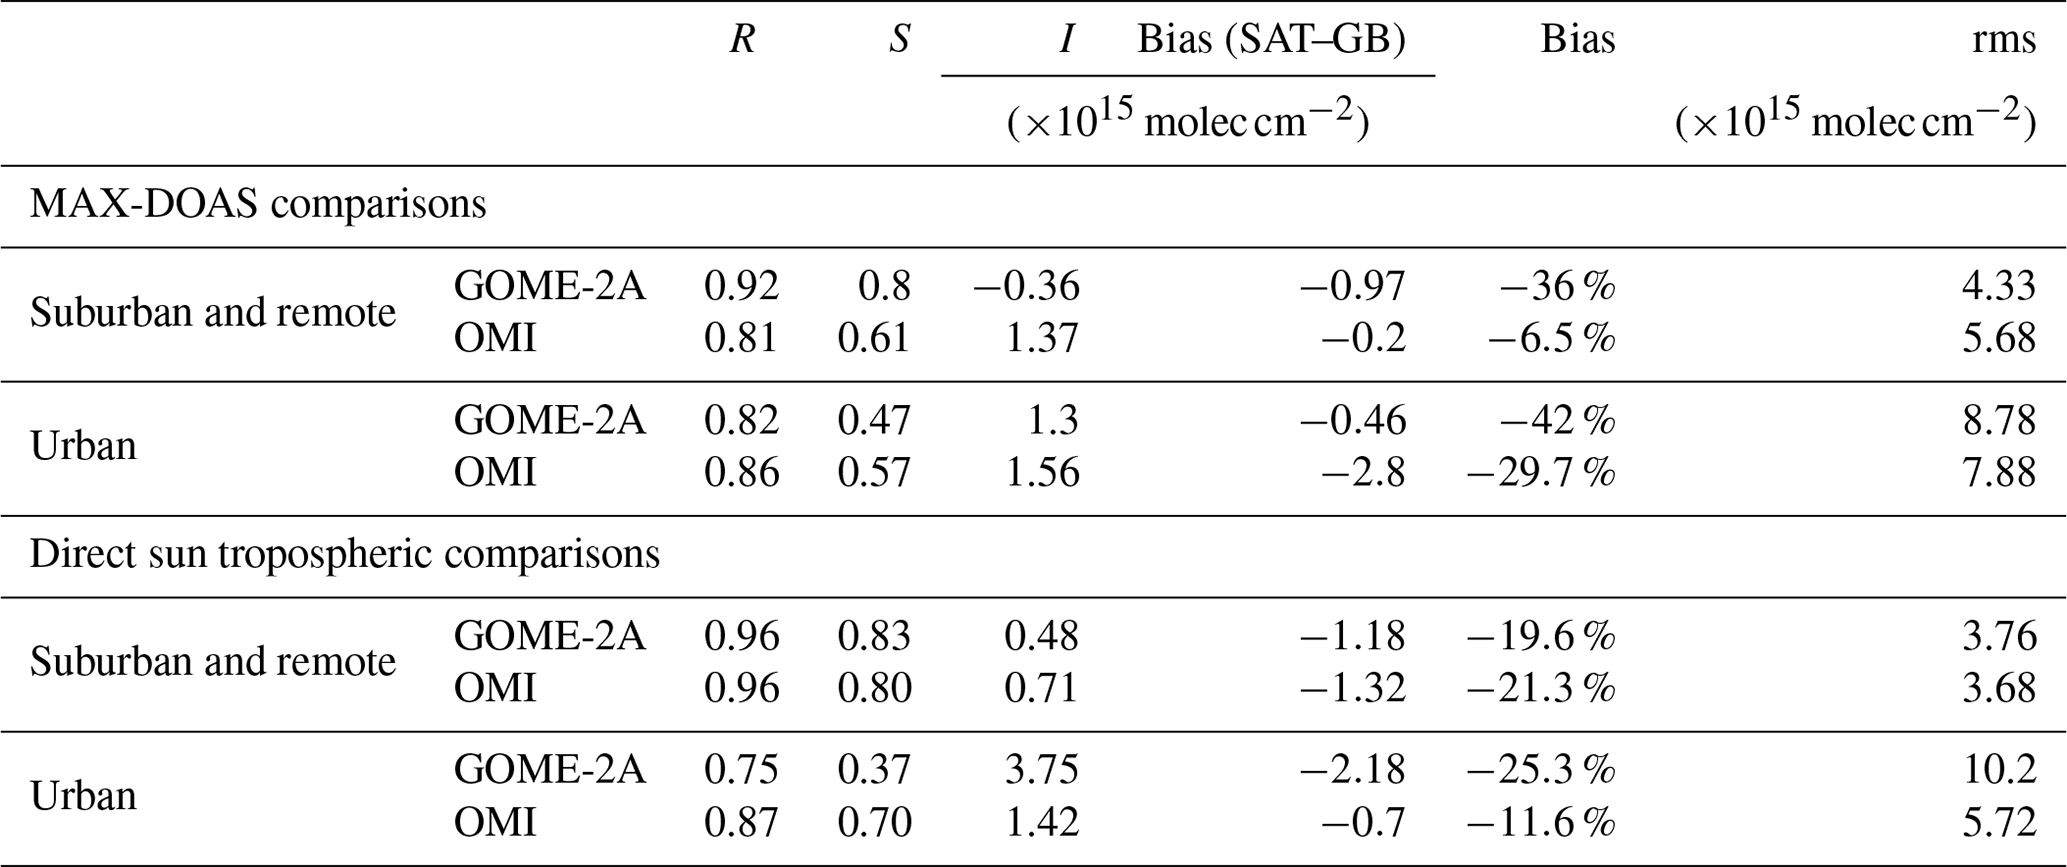
Figure 5 presents monthly mean scatterplots of the GOME-2A GDP 4.8 data against ground-based measurements at the different stations. Different sites are plotted in different colors, and results are grouped separately for MAX-DOAS and direct sun data as well as for urban and background/suburban stations. As can be seen, satellite and ground-based data generally correlate well, with correlation coefficients ranging between 0.75 and 0.96 and linear regression slopes between 0.37 and 0.83. For more details on the statistical analysis of the regressions, see Table 4. It is clear that smaller slopes, larger biases and larger root mean square (rms) values are found at urban locations compared to background/suburban ones. Note also that smaller biases are obtained for OMI than for GOME-2A in all cases except for the case of the comparisons against direct sun data in background/suburban sites, where the differences among the two satellites are small (about −19.6 % and −21.3 %).
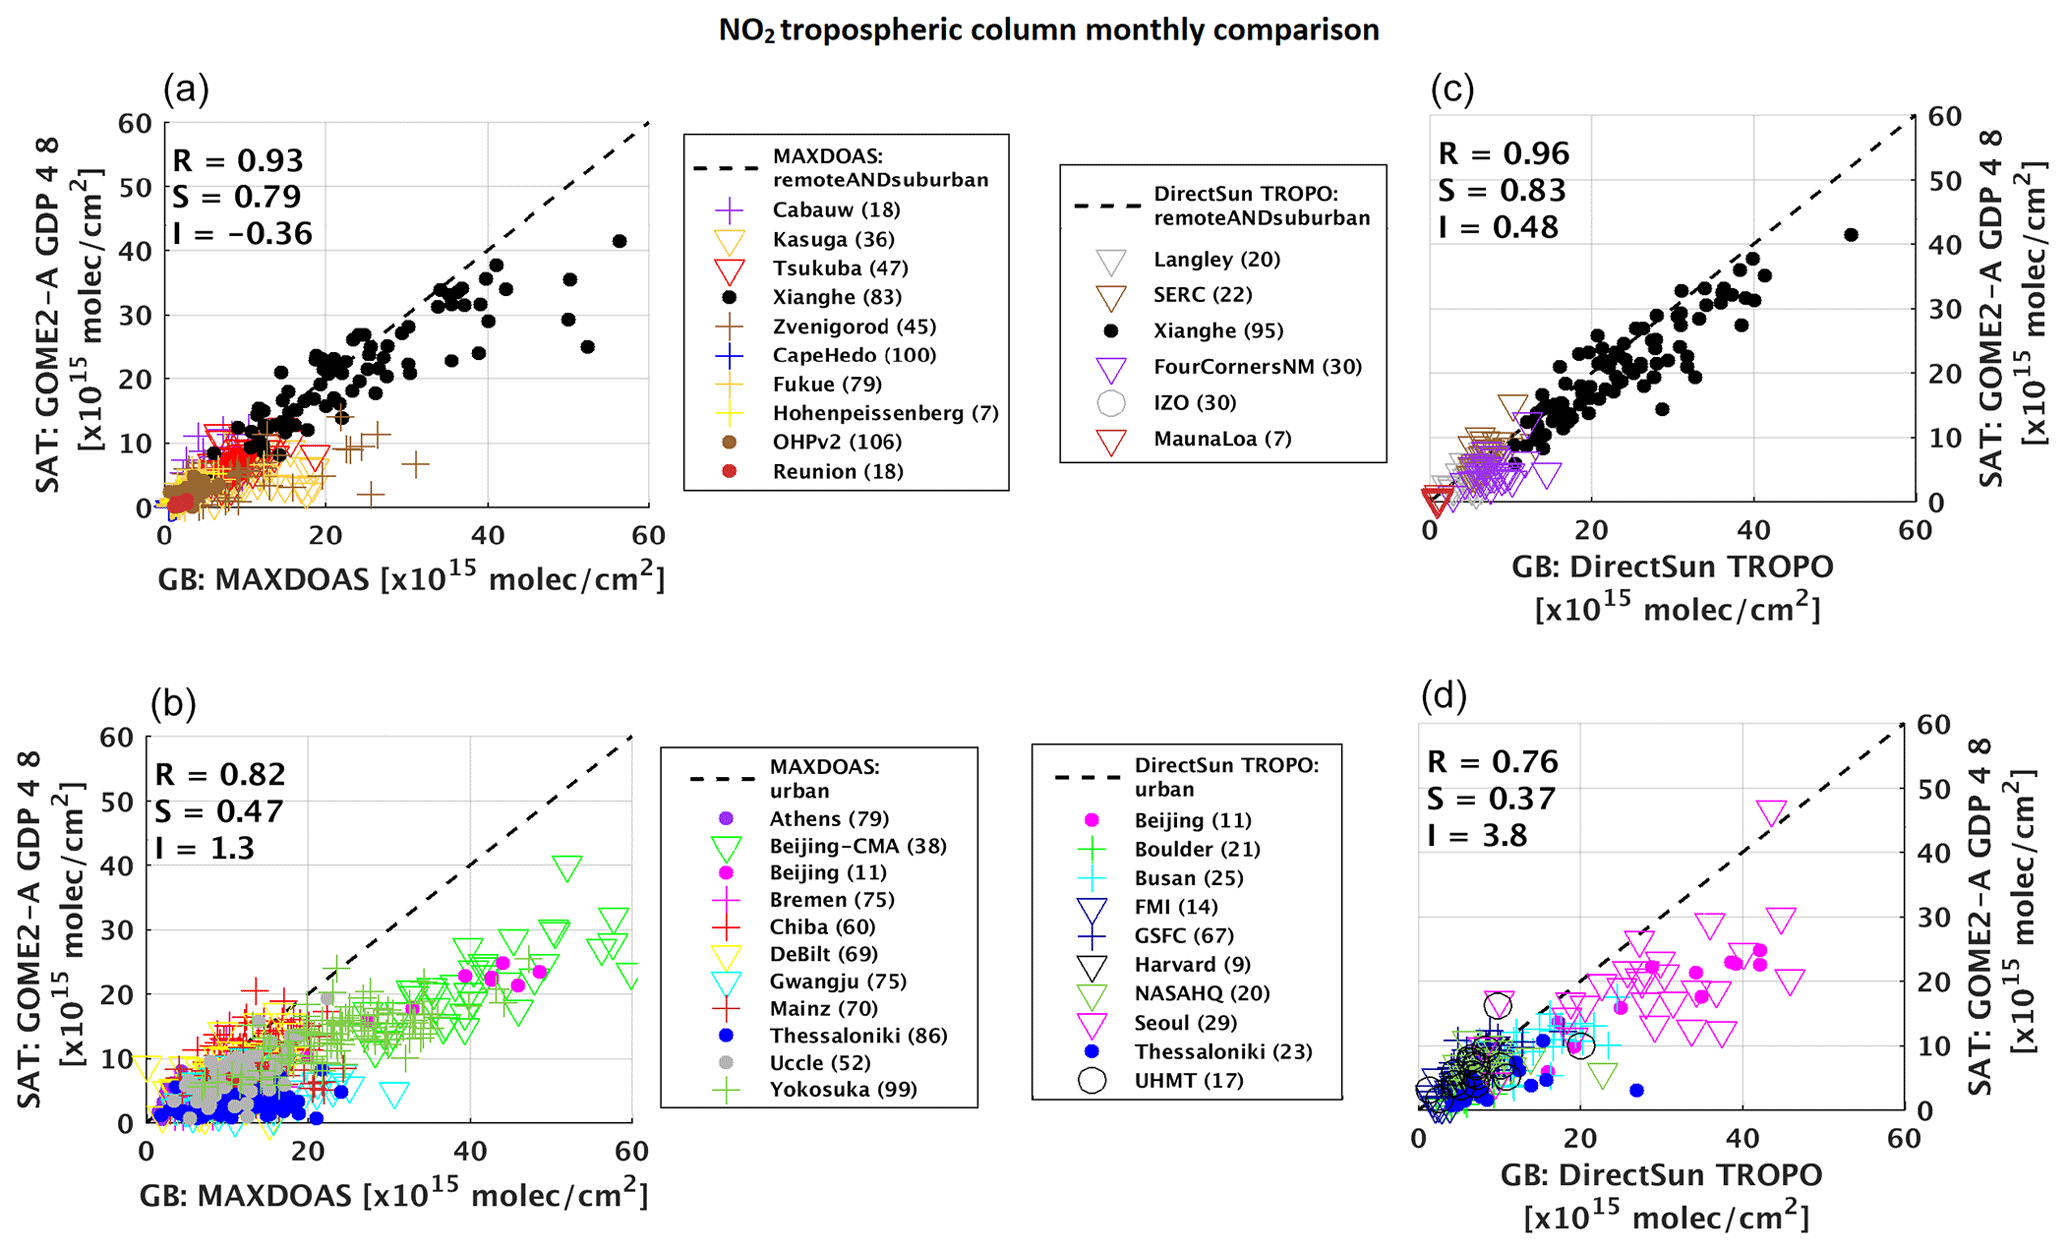
Figure 5Scatterplot of GOME-2A GDP 4.8 NO2 tropospheric columns with respect to MAX-DOAS instruments (a, b) and direct sun instruments (c, d). Panels (a, c) display background and suburban stations, while urban stations are represented in (b, d). Linear regression values are given as an inset for each case (correlation coefficient R, slope S and intercept I), and the number of months for each station is given in brackets in the legend. Pixel selection: GOME-2A pixel size <100 km (i.e., removing backscans) over the stations.
Table 4Statistics of the monthly median comparisons per station type for the satellite baseline (small pixel over station) versus ground-based comparisons. Linear regression slope S and intercept I are presented.
The median relative biases (SAT–GB)/GB at each site are presented as a color-coded map in Fig. 6. Satellite data display a negative bias against ground-based reference data at all stations, except UHMT-Houston, which is a coastal site, highly heterogeneous in nature (Tzortziou et al., 2014; 2015; 2018; Loughner et al., 2014; Martins et al., 2016). Negative biases of about −80 % are observed in Bujumbura and Nairobi, which can be related to the small NO2 signal and the localized nature of the sources at these sites, combined with a complex orography (Gielen et al., 2017; Compernolle et al., 2020). Systematic uncertainties in the estimation of the stratospheric column in satellite datasets could also contribute to the observed underestimation, considering the overall small tropospheric NO2 signals at these locations. For example, Valks et al. (2011) have shown that small-scale variations visible in the IFS-MOZART stratospheric NO2 field could not be captured by the GOME-2A stratosphere–troposphere separation algorithm, due to limitations of the spatial filtering approach. In particular this might be the case at the Izaña and Mauna Loa stations (see Fig. 3a), where the satellite stratospheric column is found to exceed the total column NO2 derived from ground-based direct sun measurements. Finally, issues related to the use of inadequate ancillary datasets might also affect the accuracy of the satellite NO2 columns. This can be due to the coarse spatial resolution of models used as a priori information (from 1.875 to 3∘ here; see Table 1) or their temporal sampling (monthly values from 1997 or daily profiles; see Table 1), leading to unrealistic representation of the sources and errors on the AMF calculation of up to 50 % (Heckel et al., 2011; Lin et al., 2014; Kuhlman et al., 2015; Laughner et al., 2016, 2019; Judd et al., 2019). Also Liu et al. (2020) showed that known uncertainties in albedo climatologies result in NO2 column uncertainties of 3 %–6 %, while errors in model input are responsible for up to 20 % of error on the retrieved NO2 columns.
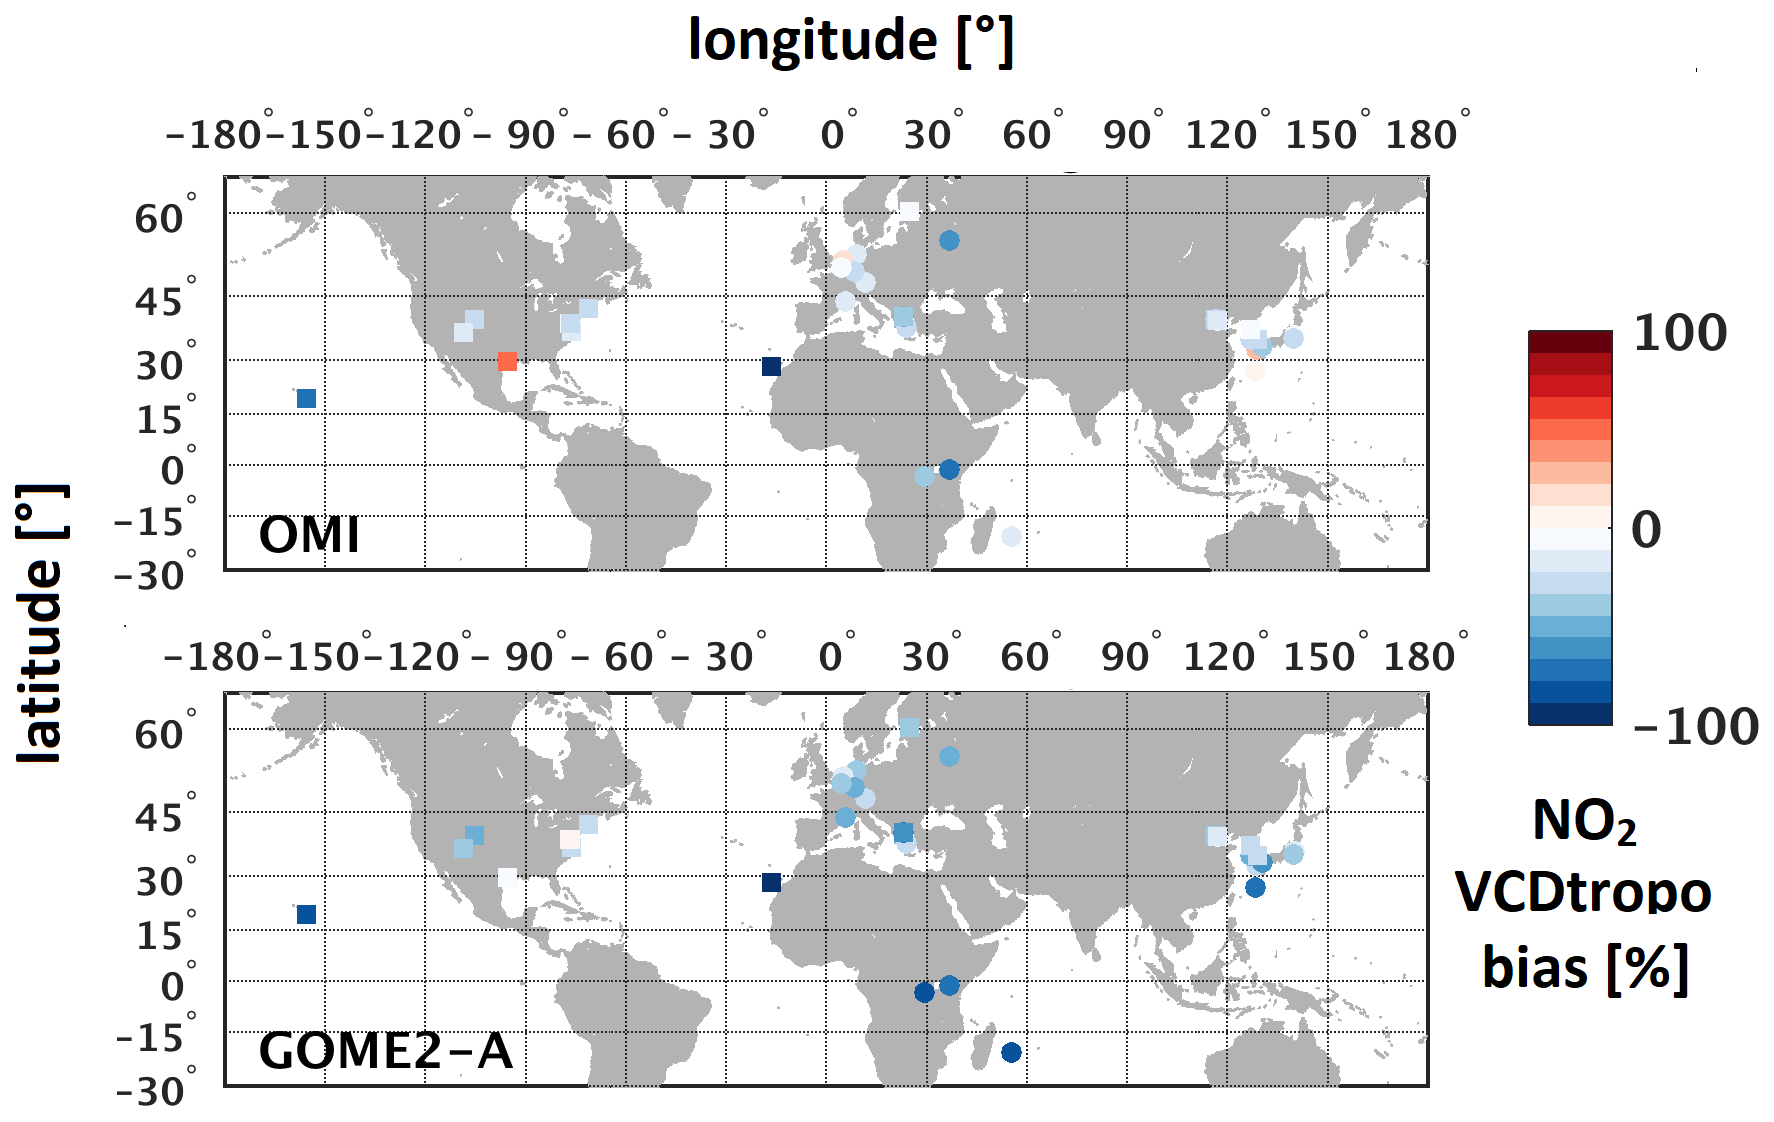
Figure 6Daily median relative bias at each station for OMI DOMINO v2 and GOME-2A GDP tropospheric NO2 columns. MAX-DOAS stations are represented with circles and direct sun stations with squares.
Looking at the details of the comparison results at each station (Fig. 6 and values in Table S1 in the Supplement), we find that GOME-2A and OMI present a similar behavior at a significant number of stations. Biases, however, tend to be slightly larger for GOME-2A. For example, in the megacity of Beijing, the median monthly mean bias is −32 % for OMI and −42 % for GOME-2A when considering direct sun cases, −24 % and −45 % for the Beijing MAX-DOAS case and −33 % and −49 % for the Beijing-CMA MAX-DOAS case. In Xianghe, which is a suburban site, the biases are smaller (−4 % and −8 % for MAX-DOAS), as expected. Table S1 provides a complete overview of the monthly bias results obtained when comparing OMI and GOME-2A to MAX-DOAS and direct sun instruments. Aside from the stations showing coherent validation results for OMI and GOME-2A (about 9 out of 16 direct sun sites and 8 out of 23 MAX-DOAS sites with differences in the satellite-to-ground validation results bias of less than 15 %), others are characterized by much larger differences, especially in remote sites such as OHP, Réunion, Cape Hedo, Fukue, Tsukuba and Bujumbura. A few mountaintop or high-altitude sites present very large relative biases, such as Nairobi (about −80 %), Mauna Loa (about −60 %) and Izaña (−200 % to −210 %). At Réunion and Bujumbura, only GOME-2A results display large biases (−76 % compared to 5 % for Réunion, and −84 % compared to −46 % for Bujumbura). Significant differences between ground-based MAX-DOAS and both OMI QA4ECV and OMI NASA were also reported by Compernolle et al. (2020) in OHP, Bujumbura, Nairobi and Mainz.
However, for some of these stations, these results only rely on a very small subset of comparison points (5 d for OMI comparisons at Mauna Loa, 14 d for Thessaloniki direct sun, 3 d for Nairobi, 11 d for Réunion, 12 d for Hohenpeissenberg), and in the next section we test the impact of relaxing the comparison criteria, to select the closest pixel per day, within the maximum radius of 50 km.
5.3 Impact of the satellite pixel selection
As to be expected, for a large number of stations, selecting pixels that do not contain the stations increases the comparison statistics but also changes the comparison results. This is especially the case for OMI. The change in coincidence selection is presented in Table S1 for each station. The following conclusions can be drawn for OMI.
- -
Direct sun measurements: for 9 sites out of 16 there is a significant (more than 5 %) difference between results obtained using all the pixels and only those intersecting the stations. For six of them, the median bias is strongly increased: Seoul (from −4 % to −29 %), Boulder (from −36 % to −54 %), GSFC (from 6.2 % to −8.5 %), Harvard (from −12 % to −29 %), Four Corners (from −7 % to −17 %) and Mauna Loa (from −60 % to −120 %). At three sites, it is reduced: Izaña (from −210 % to 190 %), FMI (from 90 % to −31 %) and UHMT (43 % to 15 %).
- -
MAX-DOAS measurements: for 15 sites out of 23 there is a significant (more than 5 %) difference between results obtained using all the pixels and only those intersecting the stations. For 10 of them, the median bias is larger: Athens (from −38 % to −48 %), Bremen (from −8 % to −36 %), Gwangju (from −34 % to −44 %), Kasuga (from −44 % to −52 %), Réunion (from 5 % to 14 %), Uccle (from −16 % to −28 %), Beijing (from −24 % to −39 %), Thessaloniki (from −30 % to −44 %) and OHP (from −12 % to −19 %). For five of the sites, the bias is improved: Hohenpeissenberg (from 17 % to −1.3 %), Tsukuba (from −6 % to 3 %), Bujumbura (from −46 % to −31 %) and Fukue (18 % to −6.8 %).
At most stations, the stricter colocation criterion results in smaller biases (by up to ∼20 %). In order to better understand the impact of changing the pixel selection criteria, additional tests were performed for two megacities characterized by extremely high NO2 levels (see Fig. 3).
Figure 7 illustrates, for Beijing, Beijing-CMA, Xianghe and Seoul, the impact of making different choices on the OMI pixel size and location. For the most strict selection criterion (OMI pixels smaller than 40 km and located above the stations), we see a significant smaller bias and spread of the comparison in Seoul for direct sun data and only a slight difference in the median bias for the Beijing/Beijing-CMA data. For Xianghe, the impact appears to be moderate or even negligible, as expected due to the suburban nature of this site. Differences in the results for the two Beijing sites are to be considered in light of the different measurement times (Table 1) and NO2 levels (Fig. 3): measurements in Beijing (median NO2 of about 20×1015 molec cm−2) were performed in 2008–2009 during the Olympic Games, while measurements at the CMA building (median of ) covered the period from 2009 to 2011. For Seoul, where measurements were performed in 2012–2015 (median NO2 of ), the metropolitan area extends over more than 11700 km2. In this case, as can be seen in Fig. S23 in the Supplement, the NO2 signal is inhomogeneously spread over the city, and the instrument is not centered at the maximum of the satellite NO2 observations. As a result, the selection of pixels in strict overpass with the site has a larger impact than for Beijing, where the MAX-DOAS instrument is located in the center of the city (Fig. 7). This is in line with the findings of Duncan et al. (2016). Analyzing OMI data over the period from 2005 to 2014, they found a complex spatial distribution of the NO2 trends characterized by a decrease in the Seoul metropolitan area and an increase outside of the city center. The heterogeneity of changing emissions leads to a high dependence of the trend calculation across the city (change from about −30 % to +10 %). For the Beijing case, Duncan et al. (2016) also showed a reduction of the tropospheric NO2 (by about −10.3 % from 2005 to 2014), with a minimum in 2008 at the time of the Olympic Games.
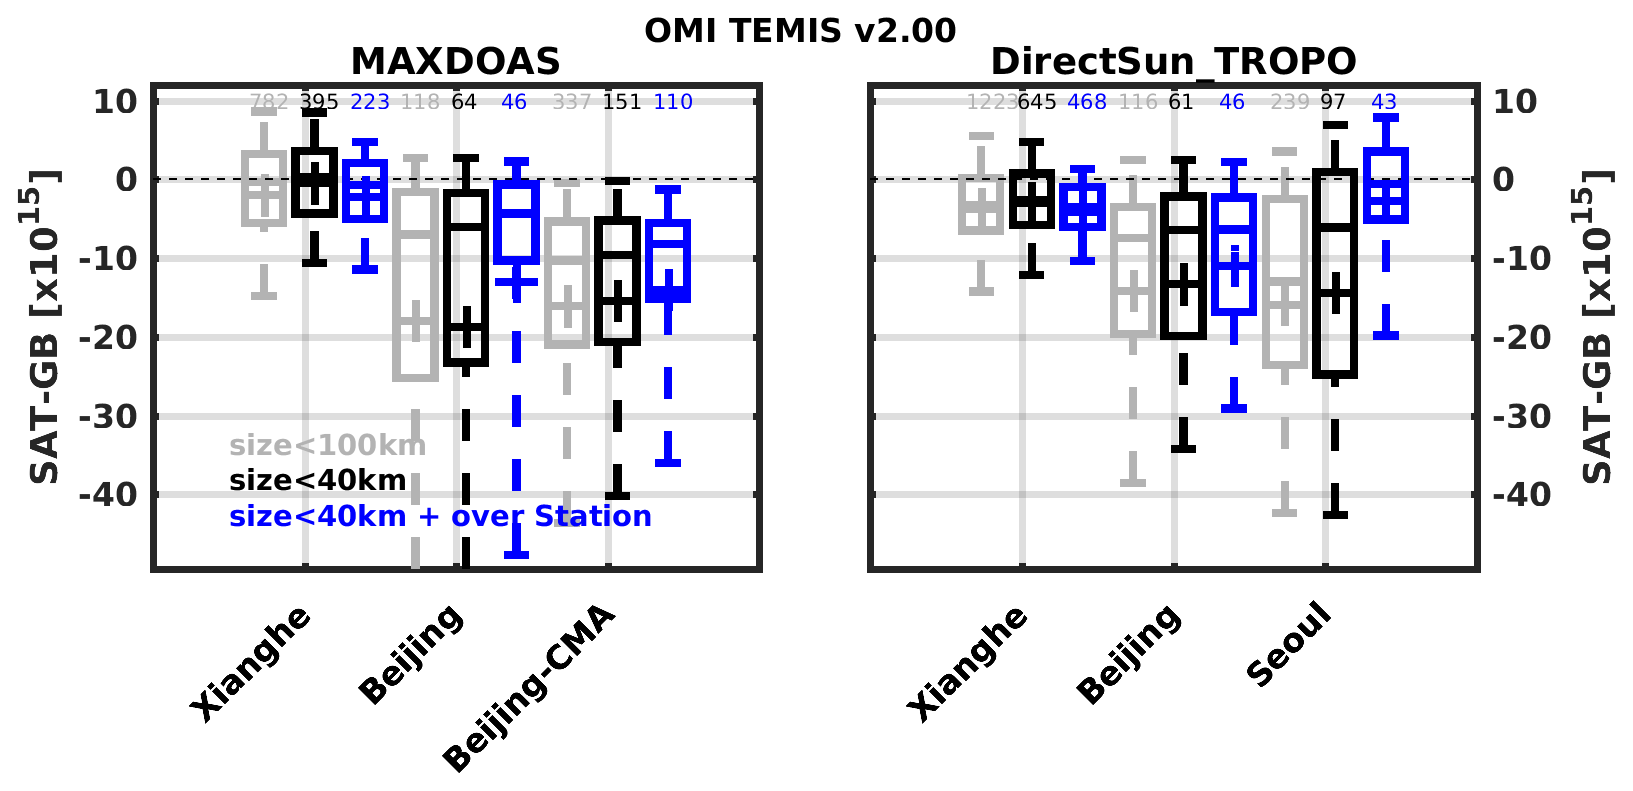
Figure 7Impact of the OMI pixel size (pixels smaller than 100 and 40 km in grey and black respectively) and with filtering on pixels only above the station (blue) on the differences' deviation between satellite and ground-based data at a few stations: Xianghe, Beijing, Beijing-CMA and Seoul. The number of comparison points is indicated on top with the corresponding colors. The box-and-whisker plots are defined as follows: crosses for the mean values, horizontal lines for the median, boxes for the 25 and 75 percentile and vertical lines for the 9 and 91 percentile.
Figure 8 summarizes the change in biases for the station ensemble, for the three pixel selection cases presented for OMI. As can be seen, restricting the comparison to small pixel sizes (from 100 to 40 km) improves the median bias, and it reduces the comparison spread. Further focusing on pixels in strict overpass with the stations, the spread is also reduced, but the median bias not so much, at the expense of a large number of comparison days.
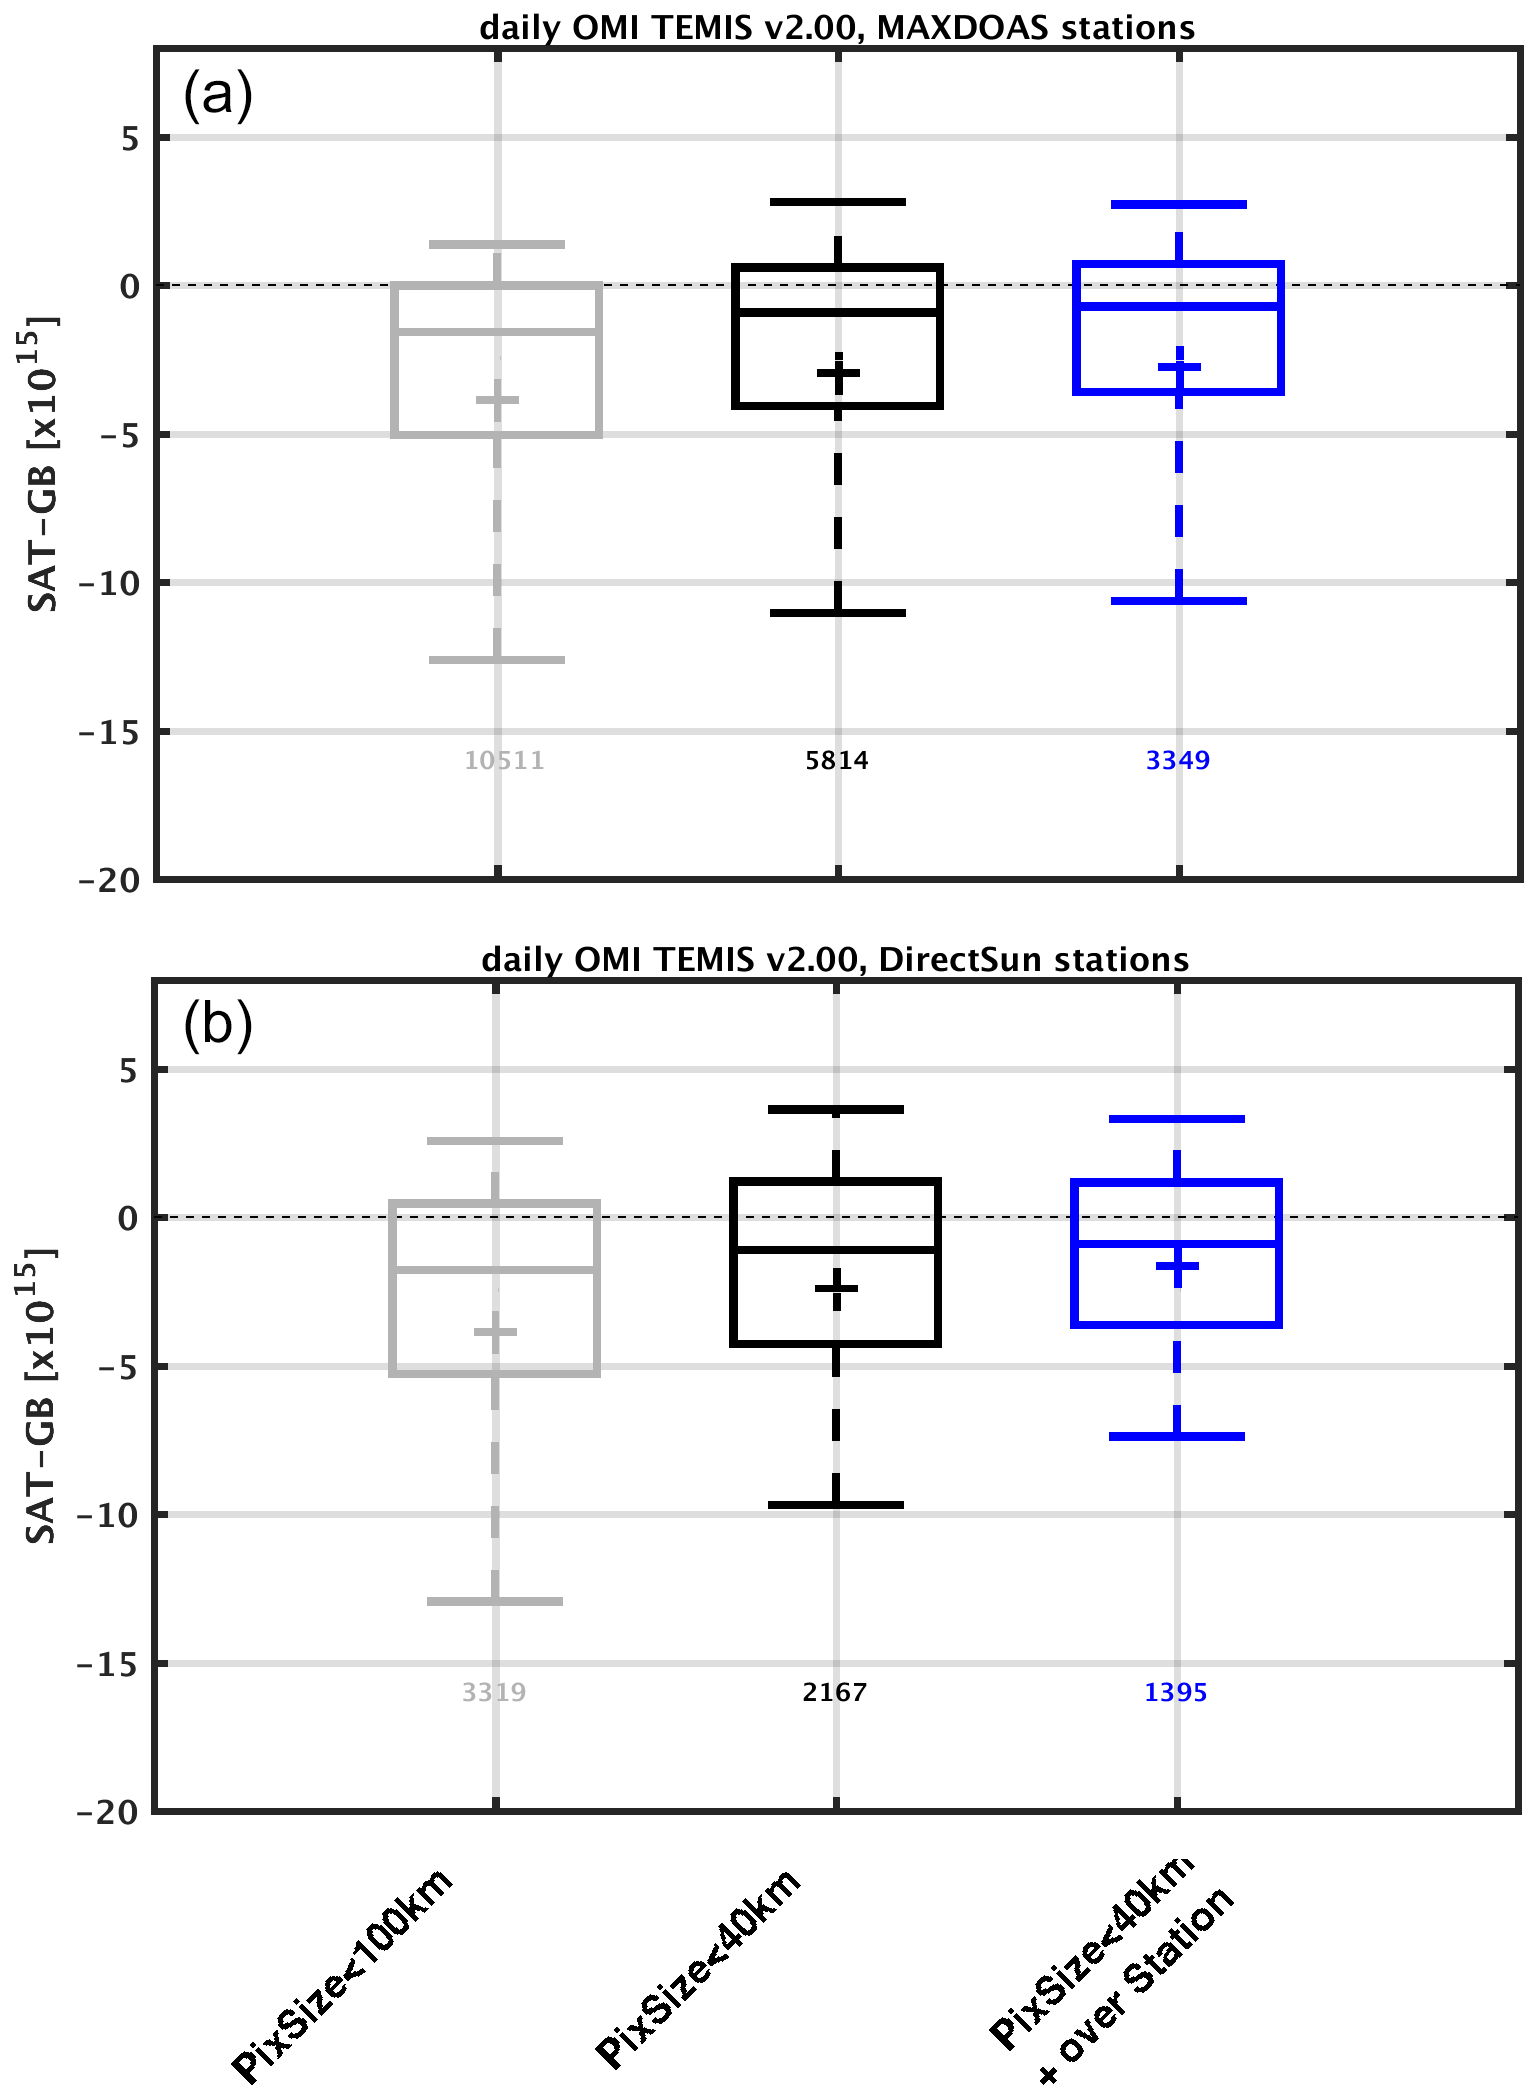
Figure 8Box-and-whisker plot of the daily OMI DOMINO v2.0 biases for all the stations and for different possibilities of pixel size selection (pixels smaller than 100 km in grey, smaller than 40 km in black and with filtering on pixels only above the station in blue). First row: ensemble of MAX-DOAS stations; second row: ensemble of direct sun stations. The box-and-whisker plots are defined as in Fig. 7. The number of comparison points for each case is shown in the corresponding color.
For GOME-2A (not shown), both of these effects are much smaller, as the pixel side size is always about 80 km, and as such, when the pixel center is within 50 km radius, usually part of the pixel covers the station.
When considering the results as a whole, the most prominent feature is the systematic underestimation of ground-based data by both satellite datasets for most of the sites. This underestimation is mostly prominent at urban sites close to the sources, but it is also found at background/suburban sites and cannot be fully explained by the satellite uncertainties (see Sect. 2). The differences observed between OMI and GOME-2A can be related to instrumental characteristics (e.g., differences in pixel size) but also to details of the applied retrieval methods (see Table 1 and Sect. 2). Several studies have discussed in detail the impact of algorithmic differences on the NO2 column uncertainty, which can reach 42 %, mainly due to tropospheric AMF uncertainties (Lorente et al., 2017). The underestimation of the NO2 satellite products identified here at a large number of stations confirms what was obtained in previous validation exercises using fewer sites and different satellite products (Celarier et al., 2008; Brinksma et al., 2008; Vlemmix et al., 2010; Irie et al., 2008a, 2012; Lin et al., 2014; Halla et al., 2011; Shaiganfar et al., 2011; Ma et al., 2013; Kanaya et al., 2014; Wang et al., 2017b; Mendolia et al., 2013; Tzortziou et al., 2014; Lamsal et al., 2014; Drosoglou et al., 2017; Herman et al., 2019; Judd et al., 2019; Compernolle et al., 2020). These studies generally reported small negative or positive biases over rural (unpolluted) measurement sites and stronger (systematic) negative biases over urban polluted sites.
One way to understand these results is to consider the impact of the spatial resolution of the satellite measurements. For the case of rural sites, coincident satellite pixels can include areas with higher NO2 columns, leading to positive biases in the comparisons. In contrast at urban locations characterized by strong NO2 sources, coincident pixels generally tend to include surrounding (suburban) areas. This effect is especially significant for satellite instruments measuring at coarse spatial resolution, such as GOME-2A. It can be attenuated in validation studies making use of long time periods and many stations; however large localized NO2 concentrations will always tend to be underestimated. This is particularly true for satellite instruments characterized by horizontal resolution much coarser than the size of typical urban agglomerations (see Table 1). Note that the effect can be somewhat mitigated in the case of satellite retrievals using a priori profiles specified at high temporal and spatial resolution (Huijnen et al., 2010; Russell et al., 2011; Heckel et al., 2011; Lin et al., 2014; McLinden et al., 2014; Kuhlmann et al., 2015; Laughner et al., 2019; Goldberg et al., 2017; 2019). In the next section, we present an attempt to quantify the smearing effect around urban sites and use it to extend the validation pixel selection method, in order to increase the comparison statistic.
In order to investigate the horizontal variability of the NO2 field at the 36 different stations, 1 full year (2005) of the OMI NO2 QA4ECV dataset v1.1 (Boersma et al., 2018) was extracted to map the average NO2 column distribution at a grid of in latitude–longitude. Such highly resolved gridded maps were obtained using a realistic representation of the OMI point spread function allowing the native OMI pixels to be subsampled (Sihler et al., 2017). Only the smallest OMI pixels (rows 11 to 49) were retained for this analysis. Corresponding high-resolution grids were used to quantify the systematic change in tropospheric NO2 between the position of the satellite pixels and the location of the stations, what we call hereafter the “dilution effect”. The approach used here is an extension of a similar method introduced by Chen et al. (2009) and Ma et al. (2013) based on high-resolution city night light maps used as a proxy for NO2 sources. Judd et al. (2019) also accurately quantified this effect in the New York area using airborne NO2 mapping data from the GeoTASO instrument. In our approach, the variation of the tropospheric NO2 VCD is sampled in concentric circles of different radii around each of the stations. Figure 9 illustrates the method for the Beijing (urban, Fig. 9a) and Xianghe (suburban, Fig. 9c) sites, which both present strongly inhomogeneous NO2 fields. Figure 9b and d show the NO2 VCD variation in concentric circles around the stations. In Beijing, the ground-based instrument is located close to the urban NO2 hotspot, so that the NO2 level decreases rapidly outwards. In contrast, a different behavior is found at the Xianghe station, which is located about 60 km to the east of the city center of Beijing. In this case, due to the influence of the surrounding emission sources, the mean NO2 column tends to slightly increase when moving away from the site in the direction of Beijing. For background sites, one expects the NO2 content to remain roughly constant around the station value. Horizontal variability effects have been documented in previous studies dealing with ozone and water vapor (Lambert et al., 2013; Verhoelst et al., 2015), as well as with tropospheric NO2 (Irie et al., 2012; Duncan et al., 2016; Kim et al., 2016; Boersma et al., 2018), mostly to illustrate the impact of collocation mismatch errors on validation results. In our study, we propose a correction method applied to satellite data, which aims at reducing the impact of the smearing effect on comparisons.
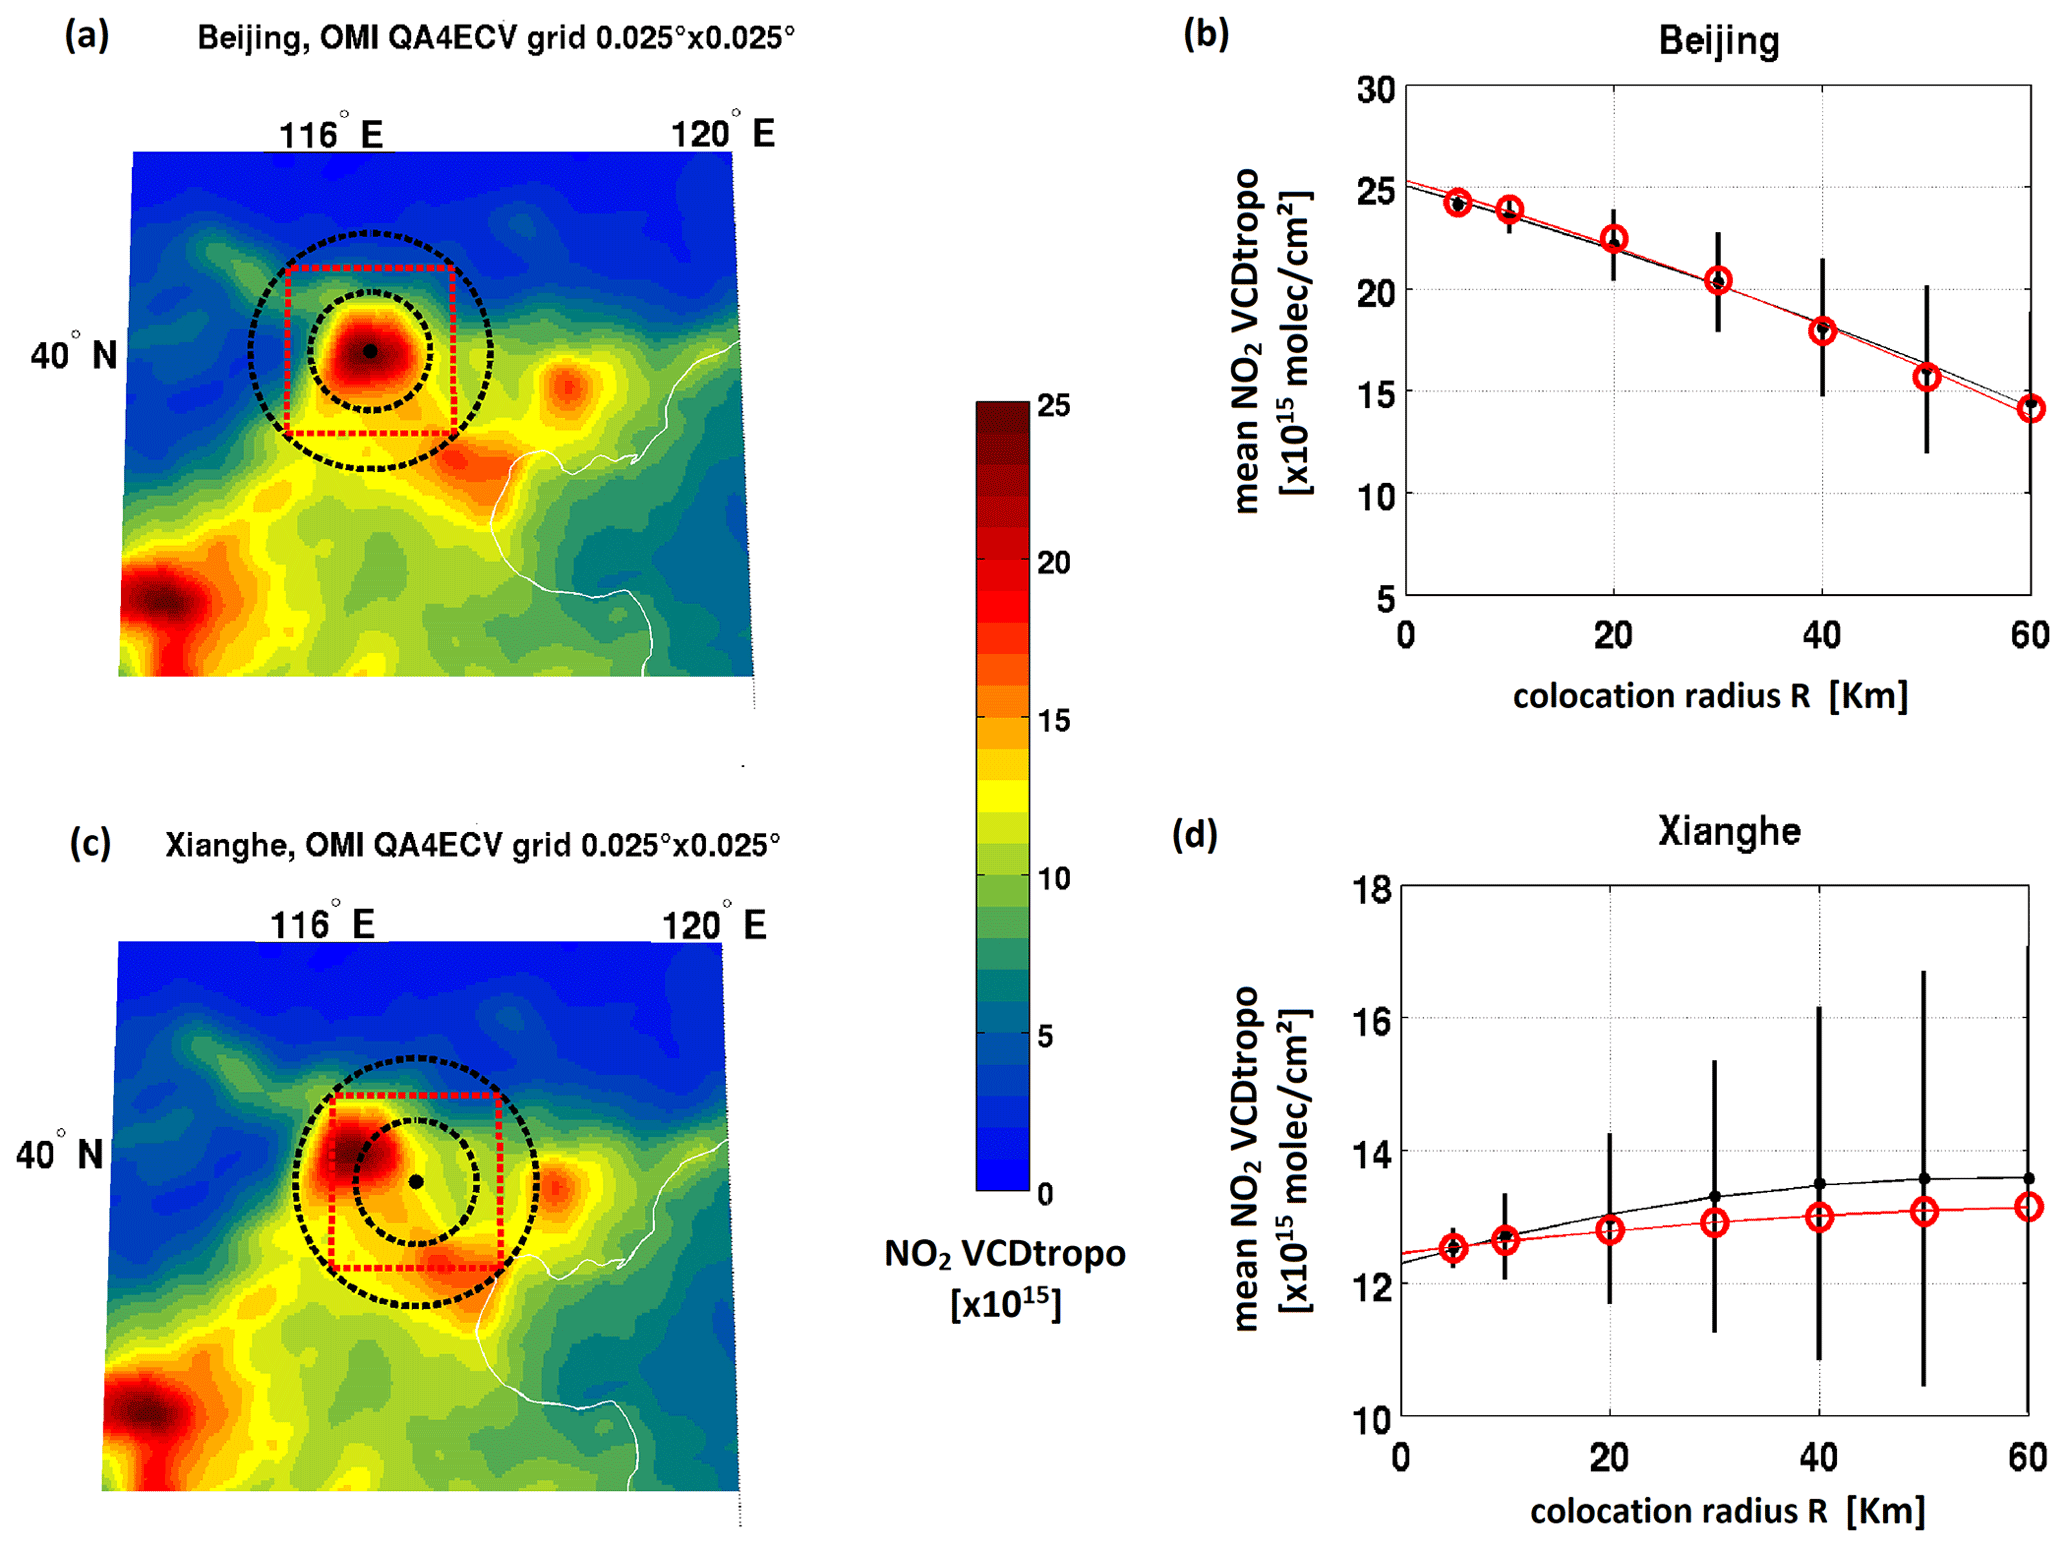
Figure 9Dilution effect illustration for a typical urban (Beijing, a, b) and suburban (Xianghe, c, d) case. Panels (a, c) represent the 2005 yearly mean tropospheric NO2 gridded from OMI QA4ECV data at the resolution of 0.025∘ latitude × 0.025∘ longitude. The black dot indicates the station location, the two circles denote 50 and 100 km radii around the station and the red box represents the outer extent of any 80 km×40 km GOME-2A pixels whose centers are within the 50 km radius. Panels (b, d) display the mean (black) and median (red) NO2 values at increasing colocation radii (expressed in kilometers), with the variability (1 standard deviation) given as an error bar around the mean.
6.1 Dilution correction method
Similarly to the studies of Chen et al. (2009) and Ma et al. (2013), a correction factor is calculated to quantify the change in NO2 between the ground-based site and the satellite pixel location. In our approach, the dilution factor (Fdil) is obtained from the OMI gridded files by taking the ratio between the average (mean or median) NO2 VCD at increasing distances from the site and the VCD value at the site. A second-order polynomial is then fitted to these ratio values as illustrated in Fig. 9 (panels b and d). Accordingly, Fdil is calculated using the following equation, where R represents the distance from the site:
In practice, Fdil is calculated as the median values of the gridded NO2 field for values of R from 0 to 50 km. For sites showing a negative slope in the dilution factor (i.e., a clear dilution effect; see Figs. S3 and S6 to S30 in Supplement), a dilution correction (DC) is applied to the satellite data according to
This correction is applied to individual satellite measurements according to their respective distances. Typically, it is applied to large urban sites, stations isolated on small islands such as Réunion Island (Fig. S18 in the Supplement), Izaña (Fig. S15 in the Supplement) and Mauna Loa (Fig. S27 in the Supplement), stations close to a large power plant such as Four Corners (Fig. S11 in the Supplement) and generally speaking sites characterized by a NO2 hotspot surrounded by a clean area. The stations where a dilution correction was applied are (from north to south) Helsinki FMI, Bremen, De Bilt, Uccle, Mainz, Harvard, Thessaloniki, Boulder, Beijing, Beijing-CMA, NASA-HQ (headquarters), GSFC, Athens, Seoul, Yokosuka, Langley, Four Corners (New Mexico), Chiba, Busan, Gwangju, Kasuga, UHMT, Izaña (IZO), Mauna Loa and Réunion Island (Le Port station). This ensemble is referred to as UIPP (urban, island and power plant) in the rest of the paper.
6.2 Impact of the dilution correction
The improvement brought by the dilution correction is illustrated in Fig. 10, where the slopes of the linear regressions from daily scatterplots are presented for each station separately with and without dilution correction. In order to limit the impact of outliers (especially the large columns that strongly affect the regression analysis), daily comparison points are filtered for values larger than the 75th percentile of the ground-based values of each station. This selection excludes large local values that cannot be captured by satellite measurements and allows for a more robust statistical regression analysis. In each panel, the case denoted “all” corresponds to a combined analysis including the data from all stations together. This is different than averaging the stations' slopes, as the different sites have a varying number of points. After application of the dilution correction, regression slopes improve (and come closer to unity) for all cases except De Bilt. However, for some sites, there seems to be an overcorrection effect (Athens/GOME-2A, UHMT/GOME-2A, Beijing (both sites)/OMI and Réunion/OMI), while a negative slope is obtained at a few other sites (e.g., Mauna Loa/GOME-2A and Réunion/GOME-2A). As already discussed in Sect. 5.1, for direct sun stations this could be related to issues with the determination of stratospheric columns in the satellite algorithm. UHMT is a peculiar site, where several studies performed during the DISCOVER-AQ 2013 Texas campaign (Nowlan et al., 2018; Choi et al., 2020) suggested that those Pandora NO2 measurements tend to be too low. Finally, some sites (e.g., Nairobi, Bujumbura, Thessaloniki, Izaña) display very small slopes, probably due to the fact that these sites are characterized by very local sources or by nonsymmetric NO2 distributions. This is clearly the case for isolated islands where the NO2 can be locally trapped due to orography (see Figs. S19, S22, S24 in the Supplement).
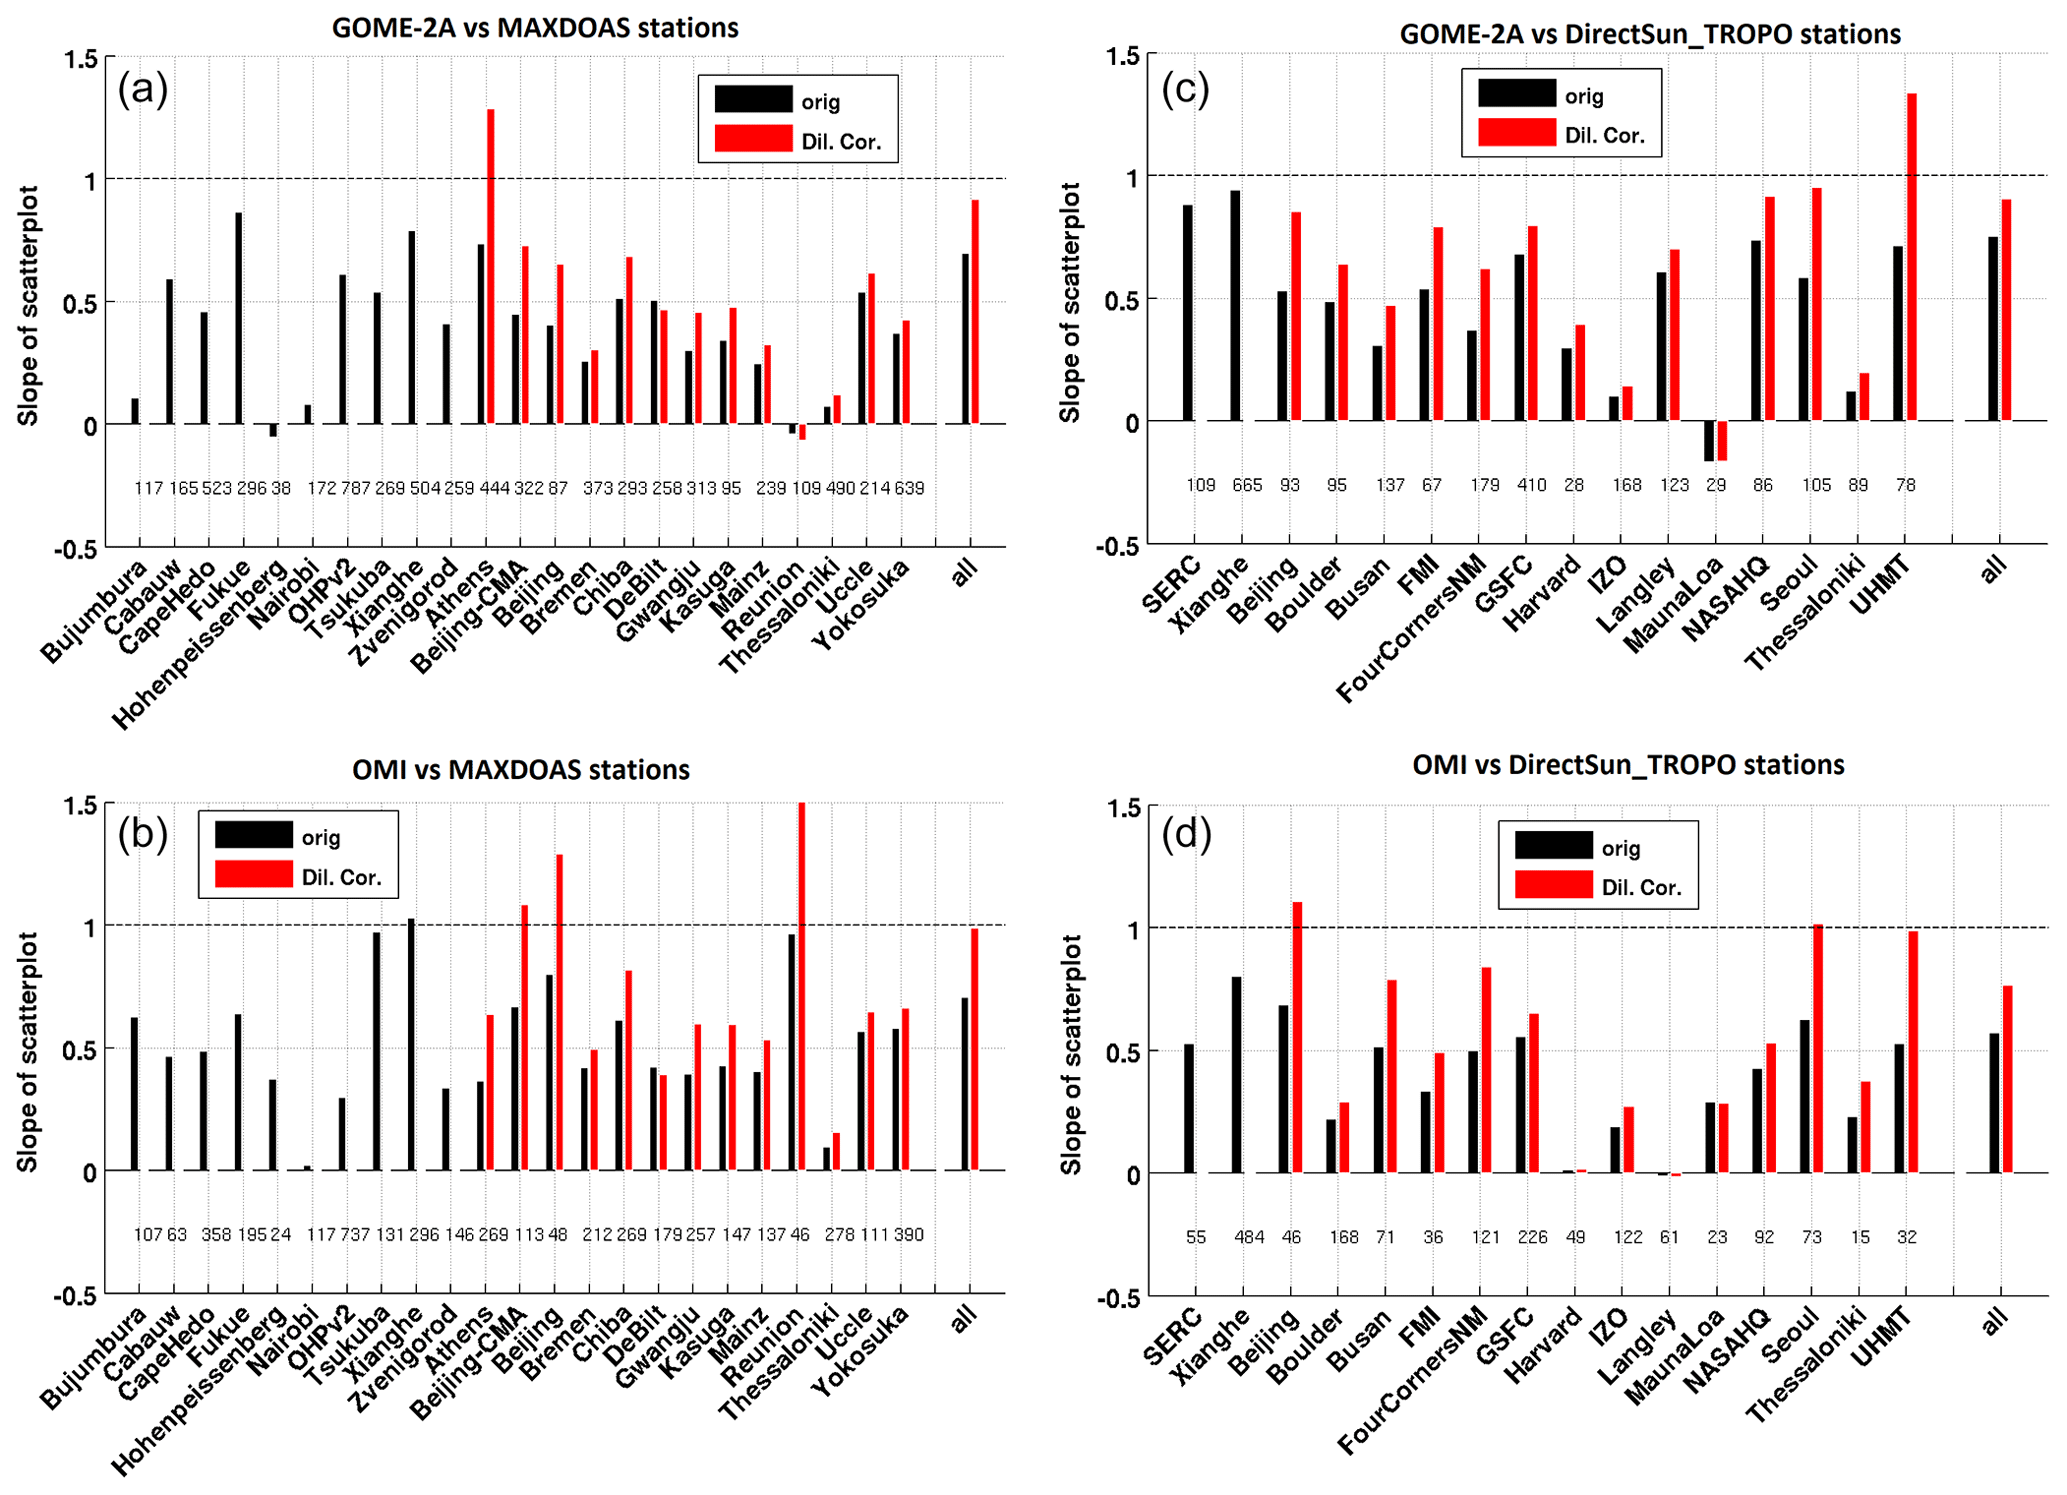
Figure 10Bar plot of the daily regression slopes at each station for the original (black bars) and the dilution-corrected data (red bar, for the UIPP stations). In order to reduce the weight of large columns on the regression line and to remove local effects, data are filtered to keep only points smaller than the 75 percentile. (a) GOME-2A GDP vs. MAX-DOAS stations, (b) OMI DOMINO v2.0 vs. MAX-DOAS stations, (c) GOME-2A GDP vs. direct sun stations and (d) OMI DOMINO v2.0 vs. direct sun stations.
An alternative dilution correction approach taking into account the geographical extent of the satellite pixel and its localization in the NO2 field has been tested. In order to estimate an uncertainty on our correction method, we applied this modified scheme to two extreme urban cases (Beijing and UHMT) and two moderate cases (Xianghe and Uccle). Differences amounting to about half the value of the current dilution correction are obtained.
Figure 11 displays monthly scatterplots of GOME-2A and ground-based data for all the UIPP stations, i.e., those at which a dilution correction was applied. Data points corresponding to values larger than the 75 percentile are represented as grey points. The two upper plots show results without correction for MAX-DOAS (left) and direct sun (right) datasets, while corrected data are represented similarly in the lower plots. Again, the impact of the dilution correction is clearly apparent. The regression slope increases from 0.52 to 0.76 for MAX-DOAS and from 0.67 to 1.1 for direct sun data. The impact of excluding the largest columns from the regression analysis can be judged by comparing the grey and black lines, respectively obtained without and with filtering. As can be seen, direct sun data are more affected by this filtering (slope increase from 0.38 to 0.67) than MAX-DOAS ones (slope increase from 0.49 to 0.52). This is likely related to the fact that, as already mentioned, direct sun instruments (especially Pandora instruments) tend to be located closer to strong NO2 emission sources than MAX-DOAS instruments. Other potential reasons are (1) the higher uncertainty in determining the true NO2 column amount in the reference spectrum and (2) the more spatially localized direct sun measurements, especially at high sun. Moreover, the Pandora DOAS analysis is performed with the NO2 absorption cross section at a temperature corresponding to the effective temperature of 254 K, while MAX-DOAS is typically analyzed for a temperature of 298 K. Spinei et al. (2014) showed that at polluted sites during hot summer months this could result in 5 %–10 % of underestimation in NO2 total column derived from the direct sun data compared to the retrieval results at the true effective temperature.
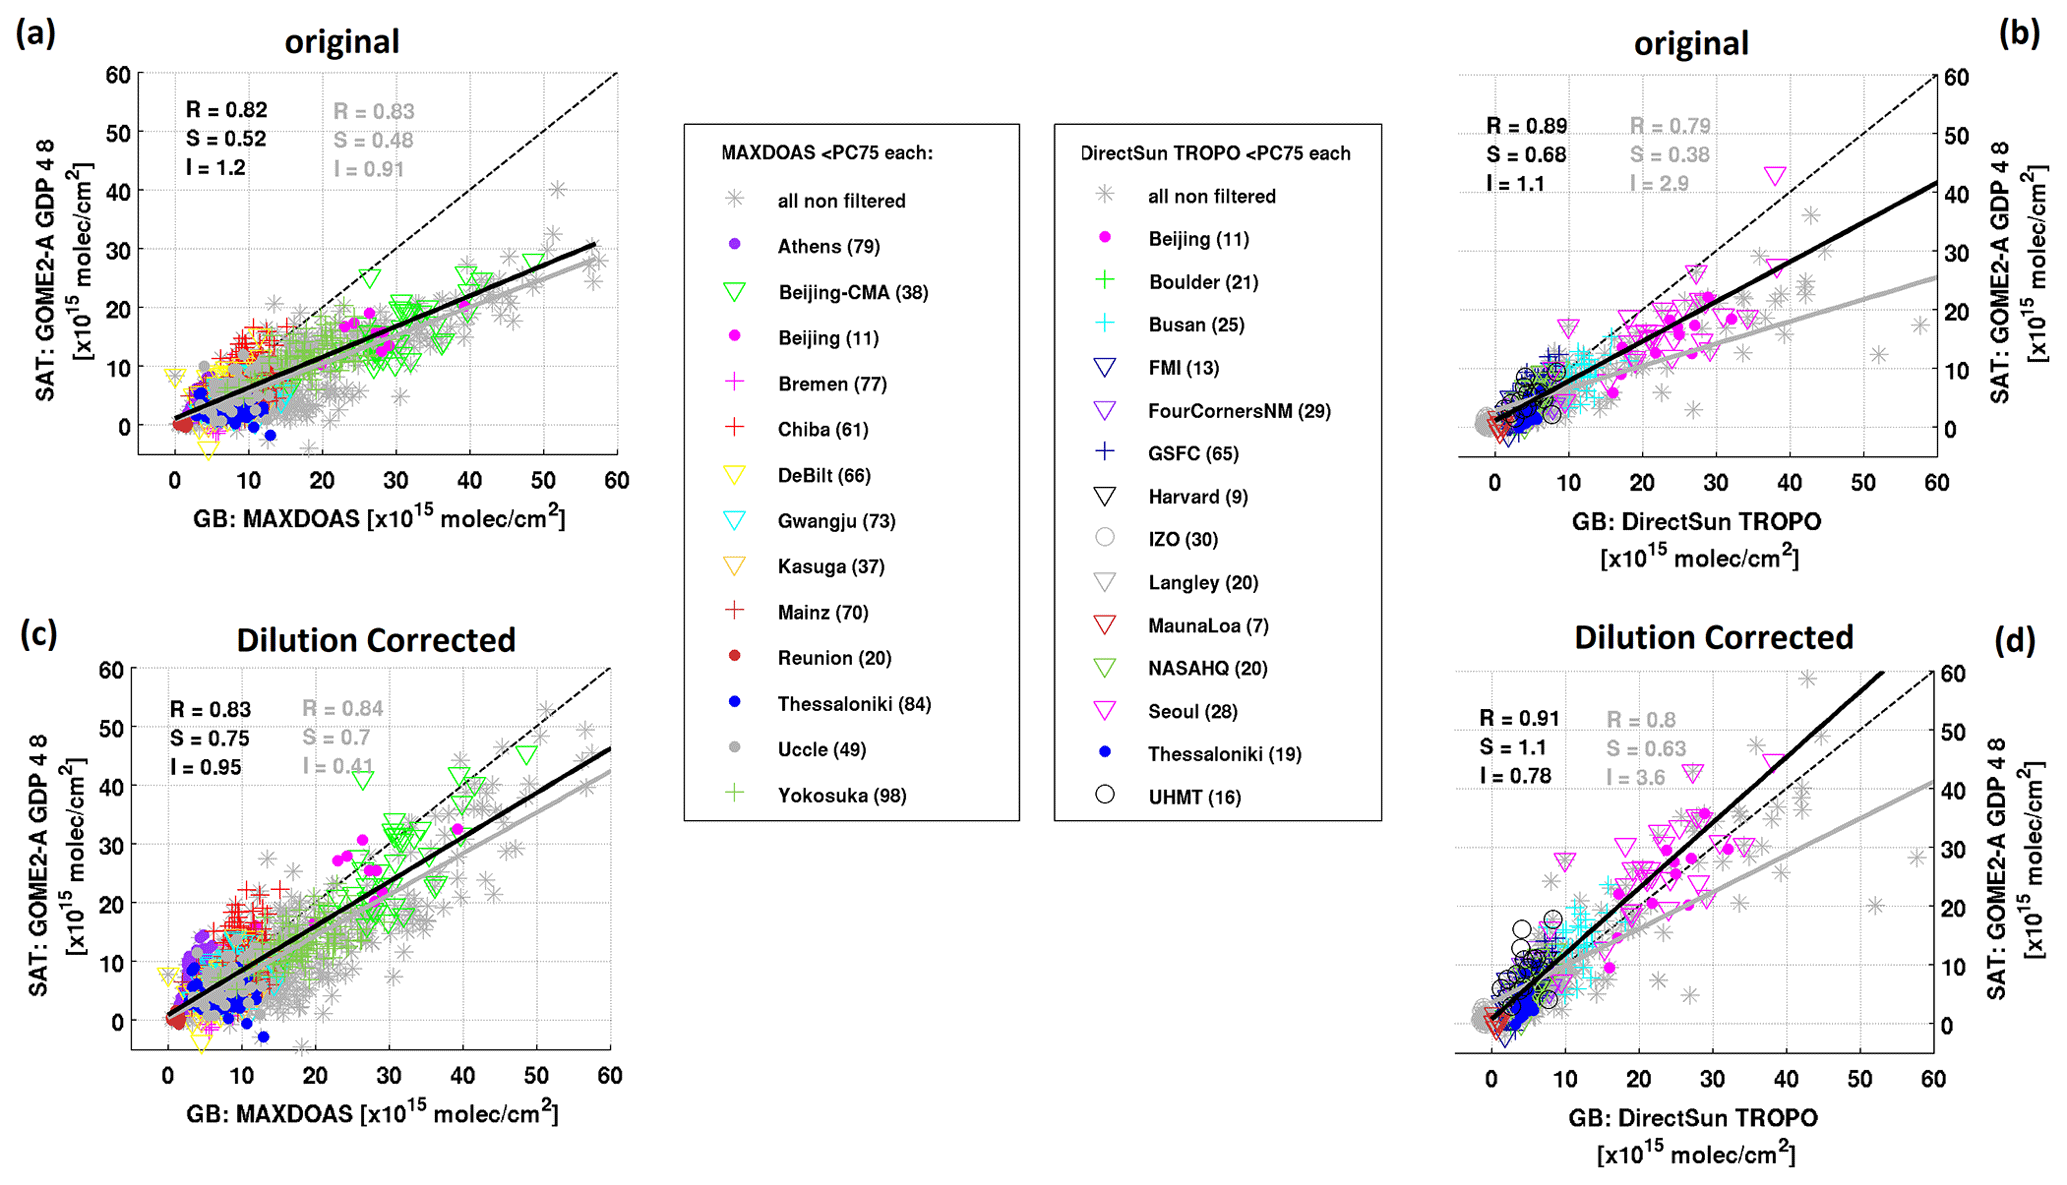
Figure 11Scatterplot of monthly mean GOME-2A GDP 4.8 NO2 columns versus UIPP ground-based stations (MAX-DOAS instruments in (a, c) and direct sun instruments in (b, d)). Panels (a, b) present the original comparisons, and panels (c, d) those after applying the dilution correction. Calculations of the monthly mean values are performed after removal of the daily ground-based points larger than the 75 percentile of each station dataset. The monthly means without the filtering are presented in grey to illustrate the impact, and the number of remaining months for each station is given in brackets in the legend. Linear regression values are shown on each plot.
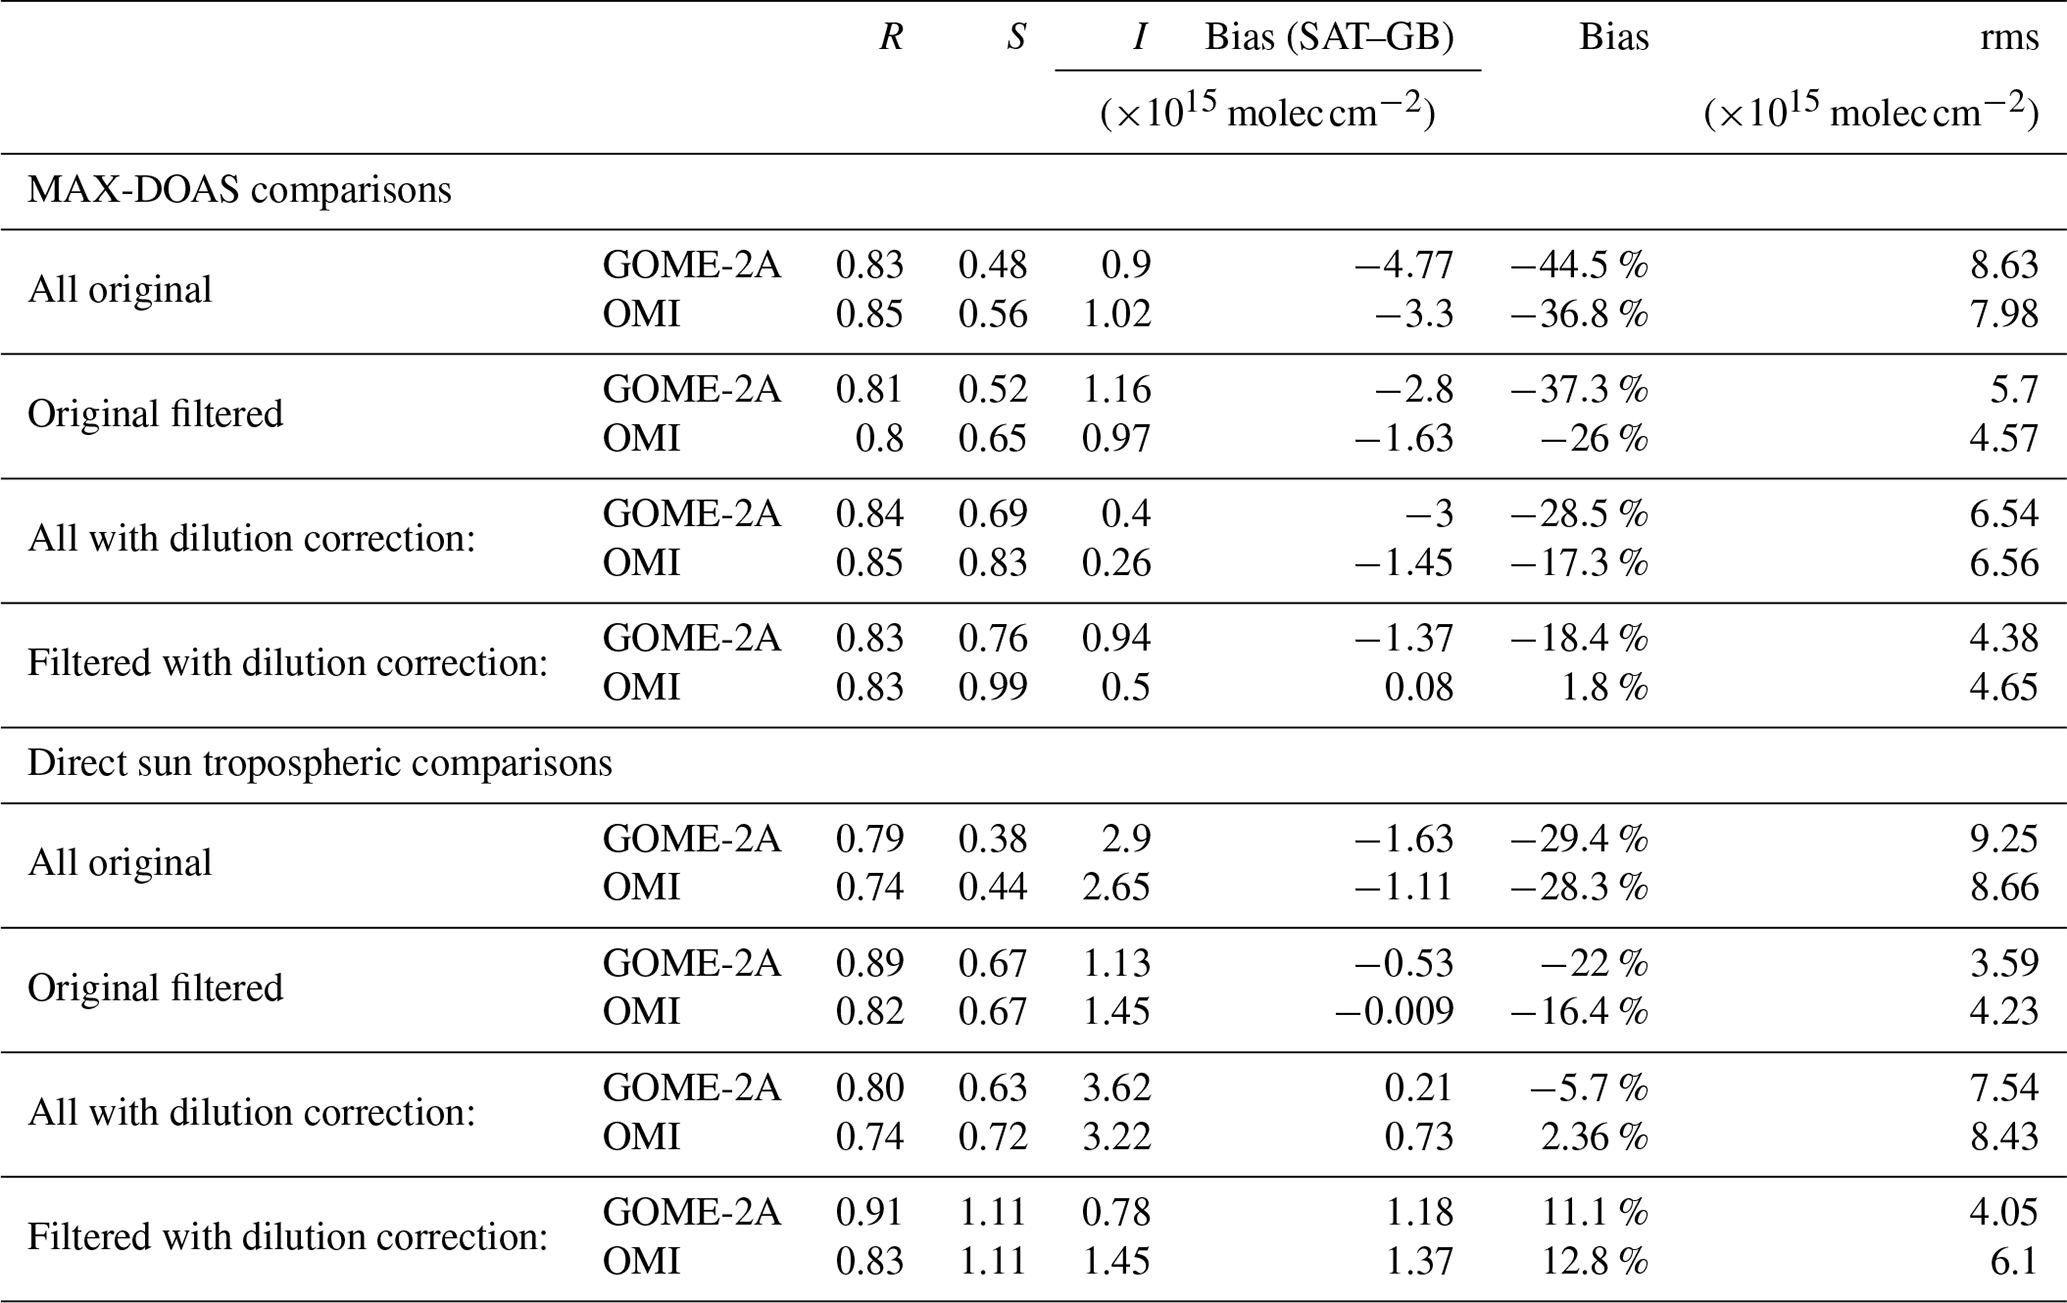
Table 5 lists the statistical parameters from regression analyses performed with and without the dilution correction for all the UIPP stations and the different satellite products. Generally speaking, validation results obtained using both MAX-DOAS and direct sun systems appear to be consistent, although direct sun observations tend to agree slightly better with the satellite data. In the case of direct sun data, however, we note that the dilution correction tends to overcorrect satellite measurements (see also Fig. 11), also resulting in slightly larger rms values for the dilution-corrected cases. It is also interesting to note in Table 5 that the intercepts are always positive, which could point to a systematic additive bias, possibly coming from an underestimation of the stratospheric (slant) columns. A bias of about molec cm−2 has been reported by Compernoelle et al. (2020) when comparing the OMI QA4ECV assimilated stratospheric columns (based on an approach similar to the one used in the OMI DOMINO algorithm) to ground-based zenith-sky data. This bias was reduced to about molec cm−2 when using the STREAM (Beirle et al., 2016) approach. Investigation of the impact of the smoother STREAM stratosphere on the tropospheric validation results is out of the scope of this study but would be interesting as the small stratospheric errors can be amplified by the AMFs.
Table 5Statistics of the monthly median comparisons of ground-based with satellite data for UIPP ensembles, before and after the 75 percentile filtering and the dilution correction are applied.
Considering all the stations together, Fig. 12 presents an overview of the differences between satellite and ground-based datasets, for the original comparisons (in black) and after dilution correction (in red). We make the distinction between two different approaches for the selection of the coincident pixels: closest cloud-free (cloud radiance fraction <50 %) pixel and mean value of all cloud-free pixels within a radius of 50 km. Results are also given separately for MAX-DOAS sites (upper plot) and direct sun sites (lower plot).

Figure 12Box-and-whisker plot of the daily biases for all the stations with (red) and without (black) dilution correction (see Sect. 6.1). First row: ensemble of MAX-DOAS stations; second row: ensemble of direct sun stations. For each row, several cases are shown: closest pixel and mean value within the 50 km radius for OMI DOMINO v2.0 and GOME-2A GDP 4.8. The box-and-whisker plots are defined as in Fig. 7.
As can be seen, the overall agreement between satellite and ground-based datasets is better for OMI comparisons, and, after dilution correction, it is slightly better for direct sun than for MAX-DOAS sites. Again, this is likely related to the fact that direct sun instruments (of Pandora type) tend to be located closer to strong NO2 emission sources. Moreover, as also discussed previously, MAX-DOAS sites report measurements under a larger variability of conditions (both clear-sky and cloudy), leading to an increased spread of the comparisons. Generally speaking the dilution correction pushes biases closer to zero and often reduces the spread of the differences. The best results are obtained with OMI, when comparing direct sun tropospheric columns to the closest pixel of the satellite. In this case, the median bias of molec cm−2 obtained is reduced to molec cm−2 after application of the dilution correction. A similar improvement is found for the MAX-DOAS comparisons, from −0.95 to molec cm−2. We find that the selection of the daily closest pixel leads to smaller biases and spreads and a better agreement between median and mean values for both OMI and GOME-2A comparisons. Therefore, in the rest of the study, comparison results are exclusively based on coincidences determined using daily closest pixels.
Several sites submitted data for time periods longer than 1 year (see Tables 2 and 3 for details), allowing the seasonal dependence of the comparisons to be investigated. In Fig. 13, seasonally sorted bias values of GOME-2A and OMI against MAX-DOAS measurements are presented for six selected stations (Uccle, OHP, Beijing, Xianghe, Bujumbura and La Réunion). A dilution correction was applied to satellite datasets at three of these sites (La Réunion, Uccle and Beijing). Although comparison results are roughly consistent for all seasons, smaller biases seem to be observed in summer time at several stations of the Northern Hemisphere. This might be related to the shorter lifetime of NO2 in the warm season and the associated reduced variability of its concentration. As already discussed in Sect. 5, for Bujumbura and Réunion Island, one observes larger negative biases for GOME-2A than for OMI, despite the dilution correction applied in both sites. Note that a large underestimation of QA4ECV OMI NO2 VCDs was also reported by Compernolle et al. (2020) in Bujumbura. Our validation results do not point to major seasonal effects; however it is general good practice to base validation studies on complete annual cycles in order to properly sample all observational conditions.
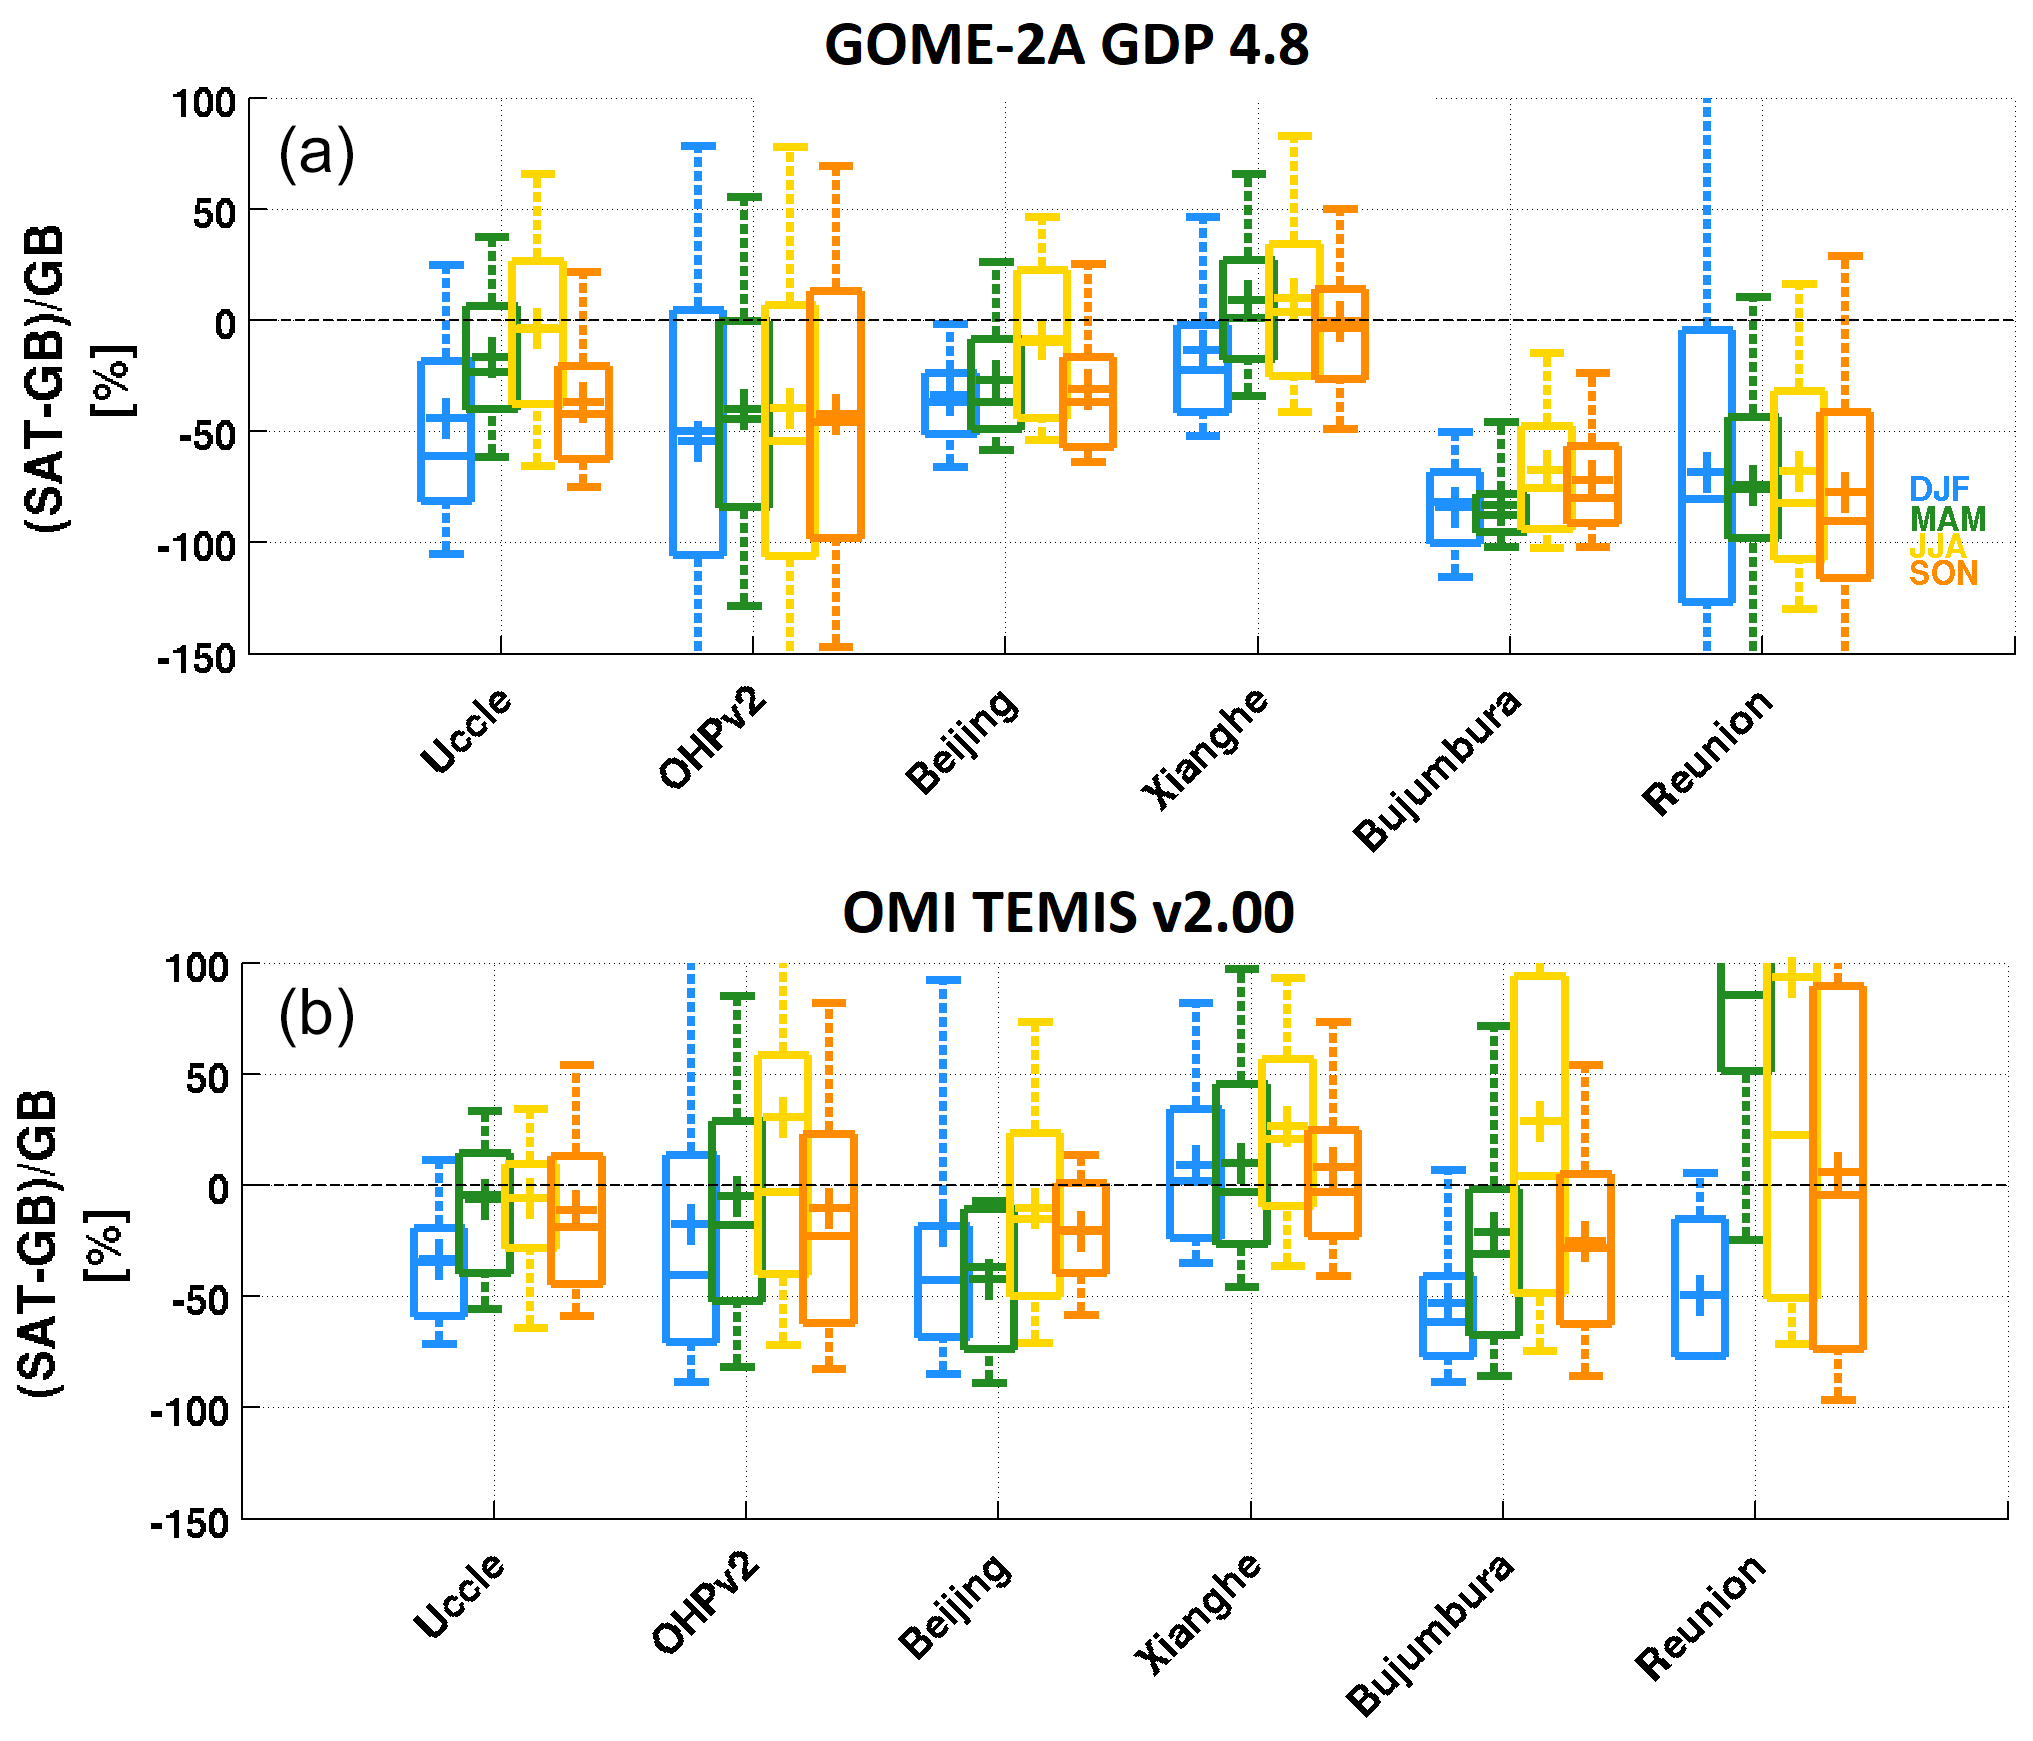
Figure 13Bias (in percent) between daily tropospheric NO2 columns from satellites, (a) GOME-2A and (b) OMI, and a selection of BIRA-IASB MAX-DOAS stations, for the different seasons. A dilution correction is applied to the satellite data when relevant. The box-and-whisker plots are defined as in Fig. 7.
Although the dilution correction improves the agreement between the ground-based and satellite measurements, significant negative biases persist at some of the validation sites (see Fig. 10). This could be related to satellite retrieval issues but also to shortcomings in our correction approach, which relies on average NO2 fields derived using 1 year (2005) of OMI data. These average fields are not necessarily representative of the actual day-to-day variability at all sites. This certainly contributes to the scatter of the comparisons but should have relatively little systematic effect on regression slopes. Seasonal behavior differences, not taken into account here, could also play a role. Moreover the OMI QA4ECV dataset (Boersma et al., 2018), which has been selected as a source for estimating the correction factors, might have its own limitations. Trends in the last decades in NO2 values worldwide (Duncan et al., 2016; Georgoulias et al., 2019) can be a limiting factor for some of the stations. Using OMI for the correction also implies that the afternoon NO2 is representative of the morning GOME-2A overpass, which is not entirely true. Another issue is the limited spatial resolution of OMI data and of its a priori profiles' assumption. High-resolution models (Drosoglou et al., 2017) or airborne imaging DOAS measurements (Judd et al., 2019) could provide a better source of information to correct the NO2 distributions around the stations, but such data are currently not available at the global scale.
Finally, ground-based instruments are assumed to provide point source measurements, while in reality the horizontal sensitivity area of MAX-DOAS measurements can be as large as several tens of kilometers (Irie et al., 2011). The provision of this information for all ground-based measurements would thus be very valuable to further improve the comparison method. Note that in urban areas, the representativeness of MAX-DOAS observations for comparison with satellite data could be improved by making use of measurements in different azimuth directions (Ortega et al., 2015; Gratsea et al., 2016; Schreier et al., 2019; Dimitropoulou et al., 2020).
Figures 14 and 15 present an overview of the absolute deviations and relative differences between OMI and GOME-2A tropospheric NO2 column measurements and the reference ground-based MAX-DOAS and direct sun measurements considered in our study. For each sensor, deviations obtained without dilution correction are presented in panel (a), while biases and relative differences after application of the dilution correction are given in panels (b) and (c). For panels (a) and (b), the total median instrumental errors (satellite and ground-based errors summed in quadrature) are also given as grey bars. When comparing the deviation in (a) and (b), the improvement by the dilution correction is clear. One can also see that results obtained using MAX-DOAS and direct sun stations are consistent within the comparison uncertainties. Note that for a few urban sites (e.g., UHMT, Seoul), the dilution correction seems to overcorrect the satellite NO2 columns, especially for OMI data. This is less clear for GOME-2A, indicating that the correction approach might be slightly too aggressive for the OMI case. It can also be seen that except for a few cases, both satellite data products behave similarly at the different stations. Once corrected for the dilution effect, satellite measurements agree with ground-based data to within 25 % (black dotted lines). The blue lines represent the median bias of satellite measurements against all station data, when including the dilution correction and for ground-based molec cm−2. The latter filtering is applied to remove outliers, leading to unphysical mean percent values. Resulting median residual biases are −23.5 % for GOME-2A and −18 % for OMI. For the sake of completeness, the same analysis was also performed on QA4ECV v1.1 OMI and GOME-2A datasets, using the same selection criteria. Corresponding figures can be found in the Supplement (Figs. S4 and S5 in the Supplement). Similar results are found, although the QA4ECV products tend to display slightly larger residual bias values, both for the original comparisons and after dilution correction.
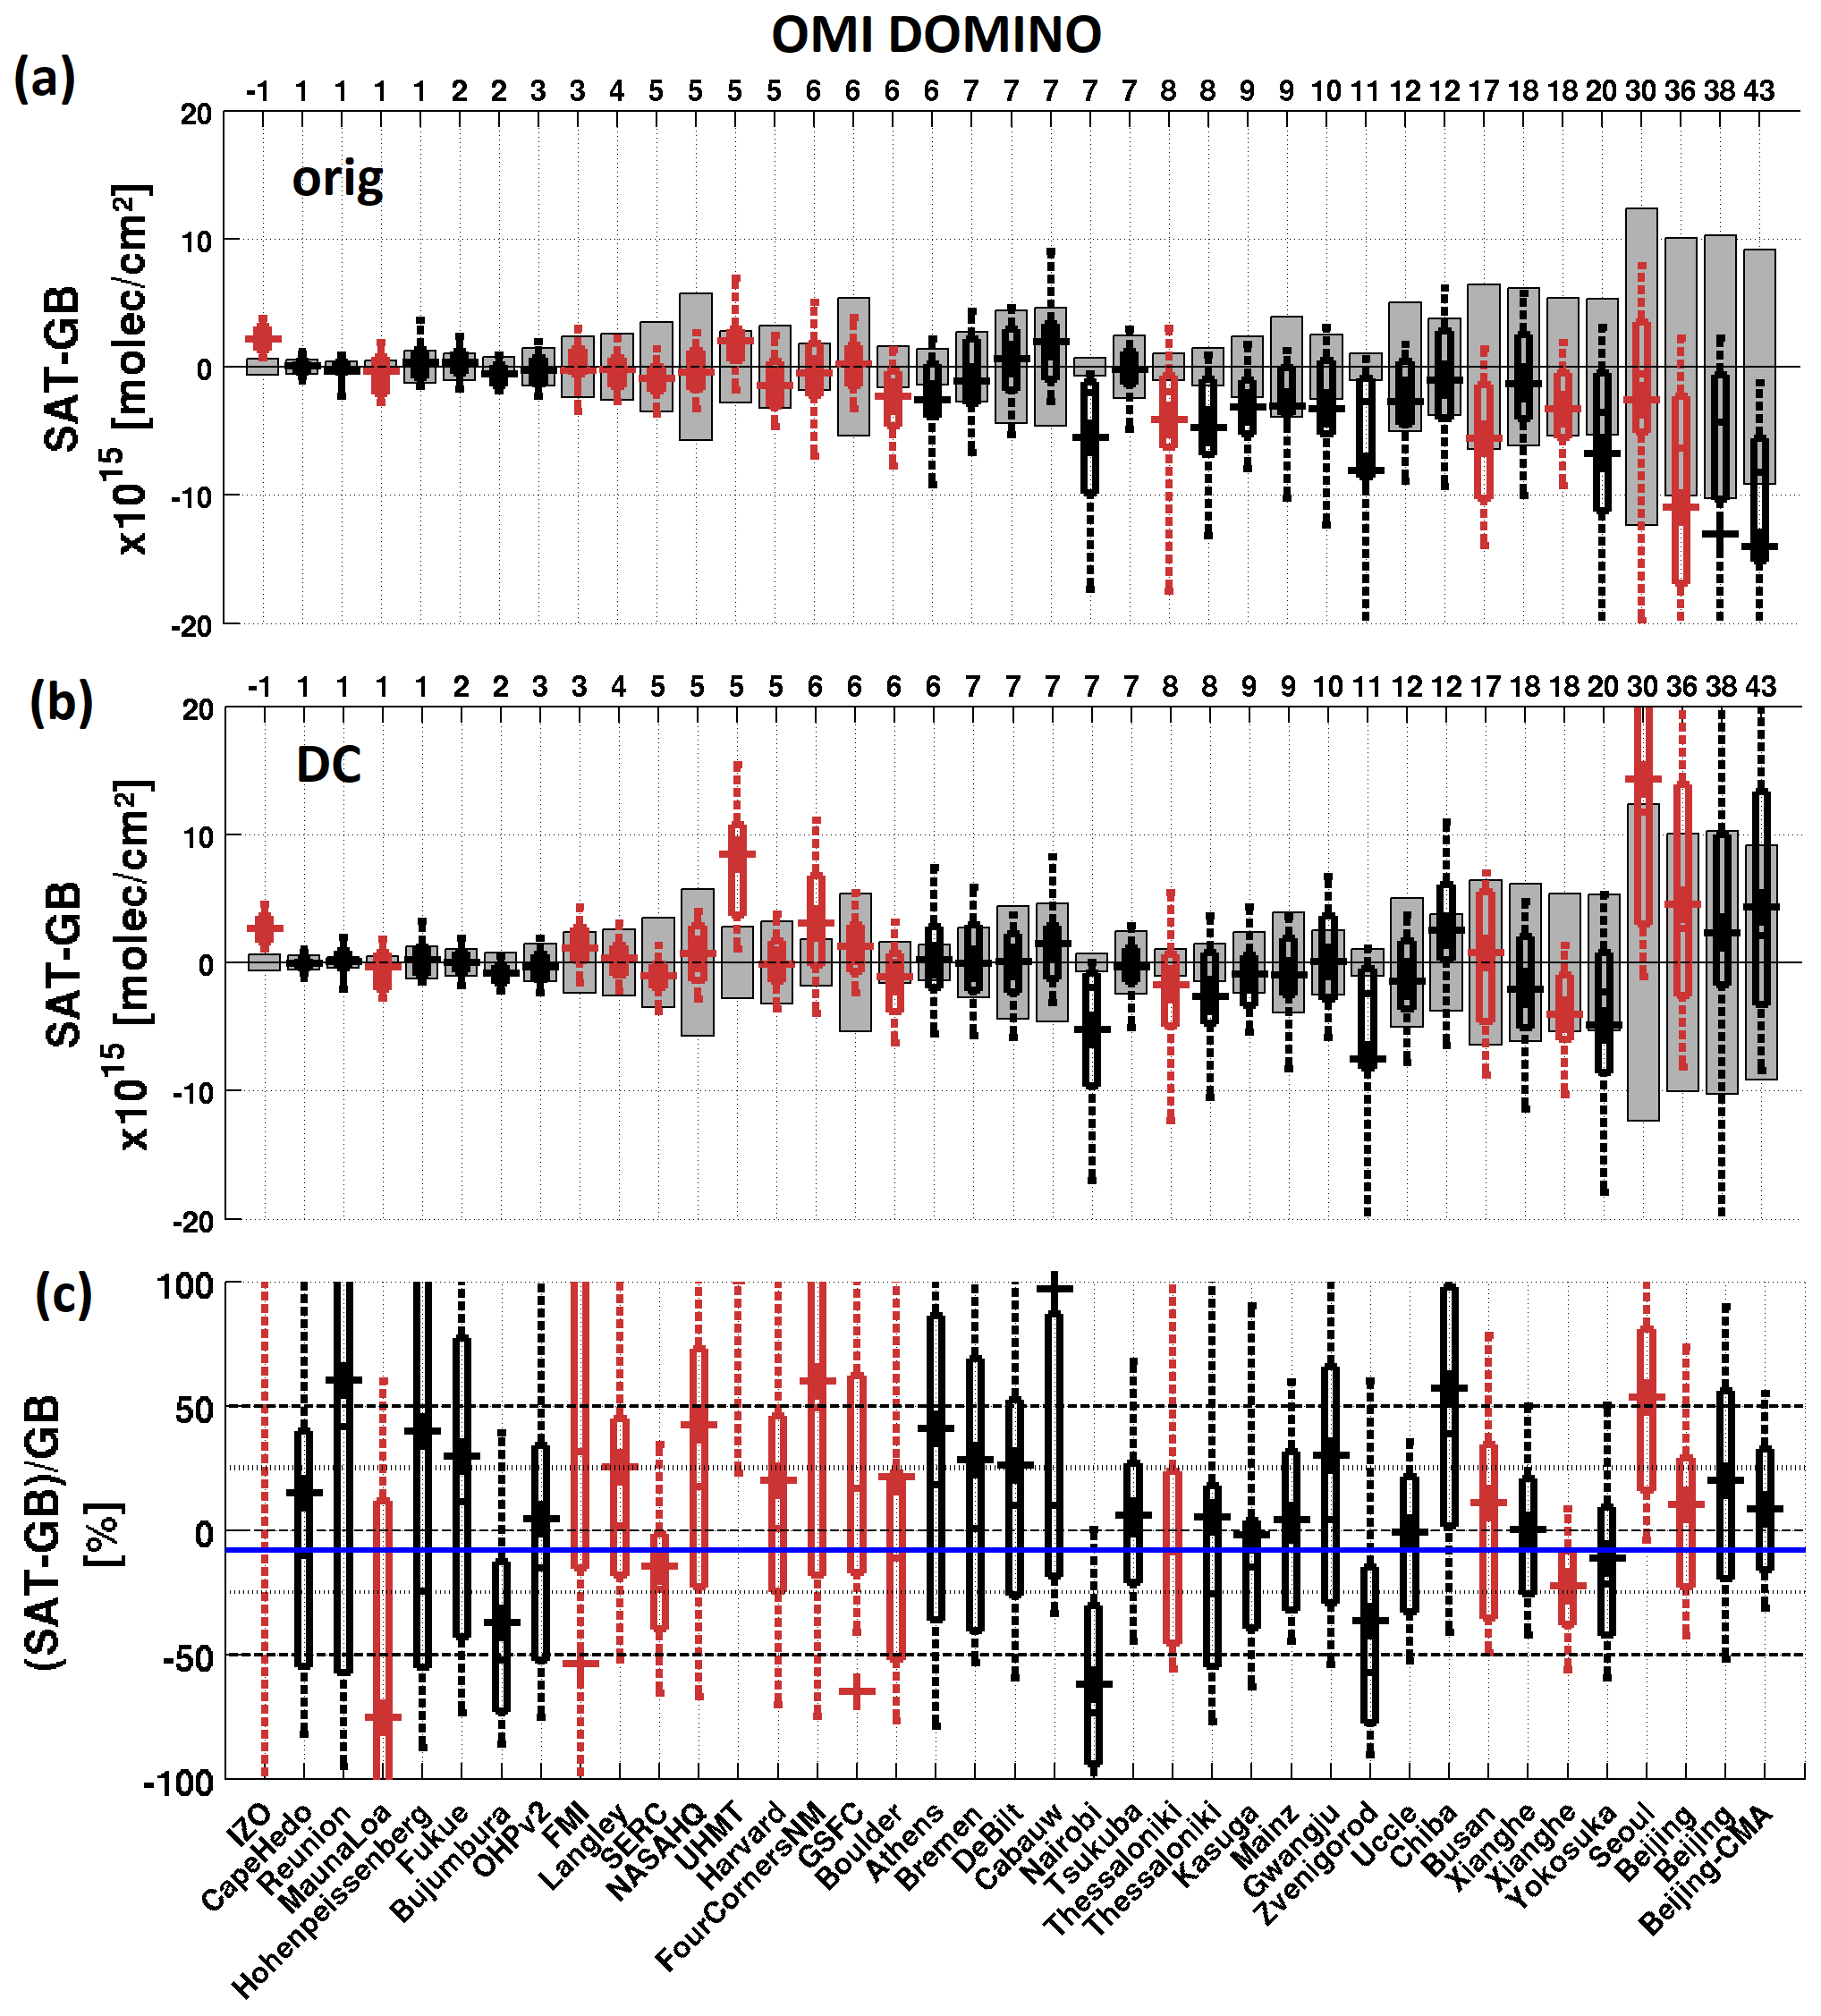
Figure 14Box-and-whisker plot of the daily OMI TEMIS/DOMINO v2.0 biases for each station (a) for the original comparisons and (b, c) when correcting for the dilution effect, in absolute and relative values. MAX-DOAS stations are presented in black; direct sun stations in dark red. The stations are ordered by increasing values of the ground-based VCDtropo, and corresponding values are given on the upper horizontal axis. The box-and-whisker plots are defined as in Fig. 7. In (a, b), grey bars are the ± comparison error, calculated adding in quadrature the satellite and ground-based VCDtropo errors.
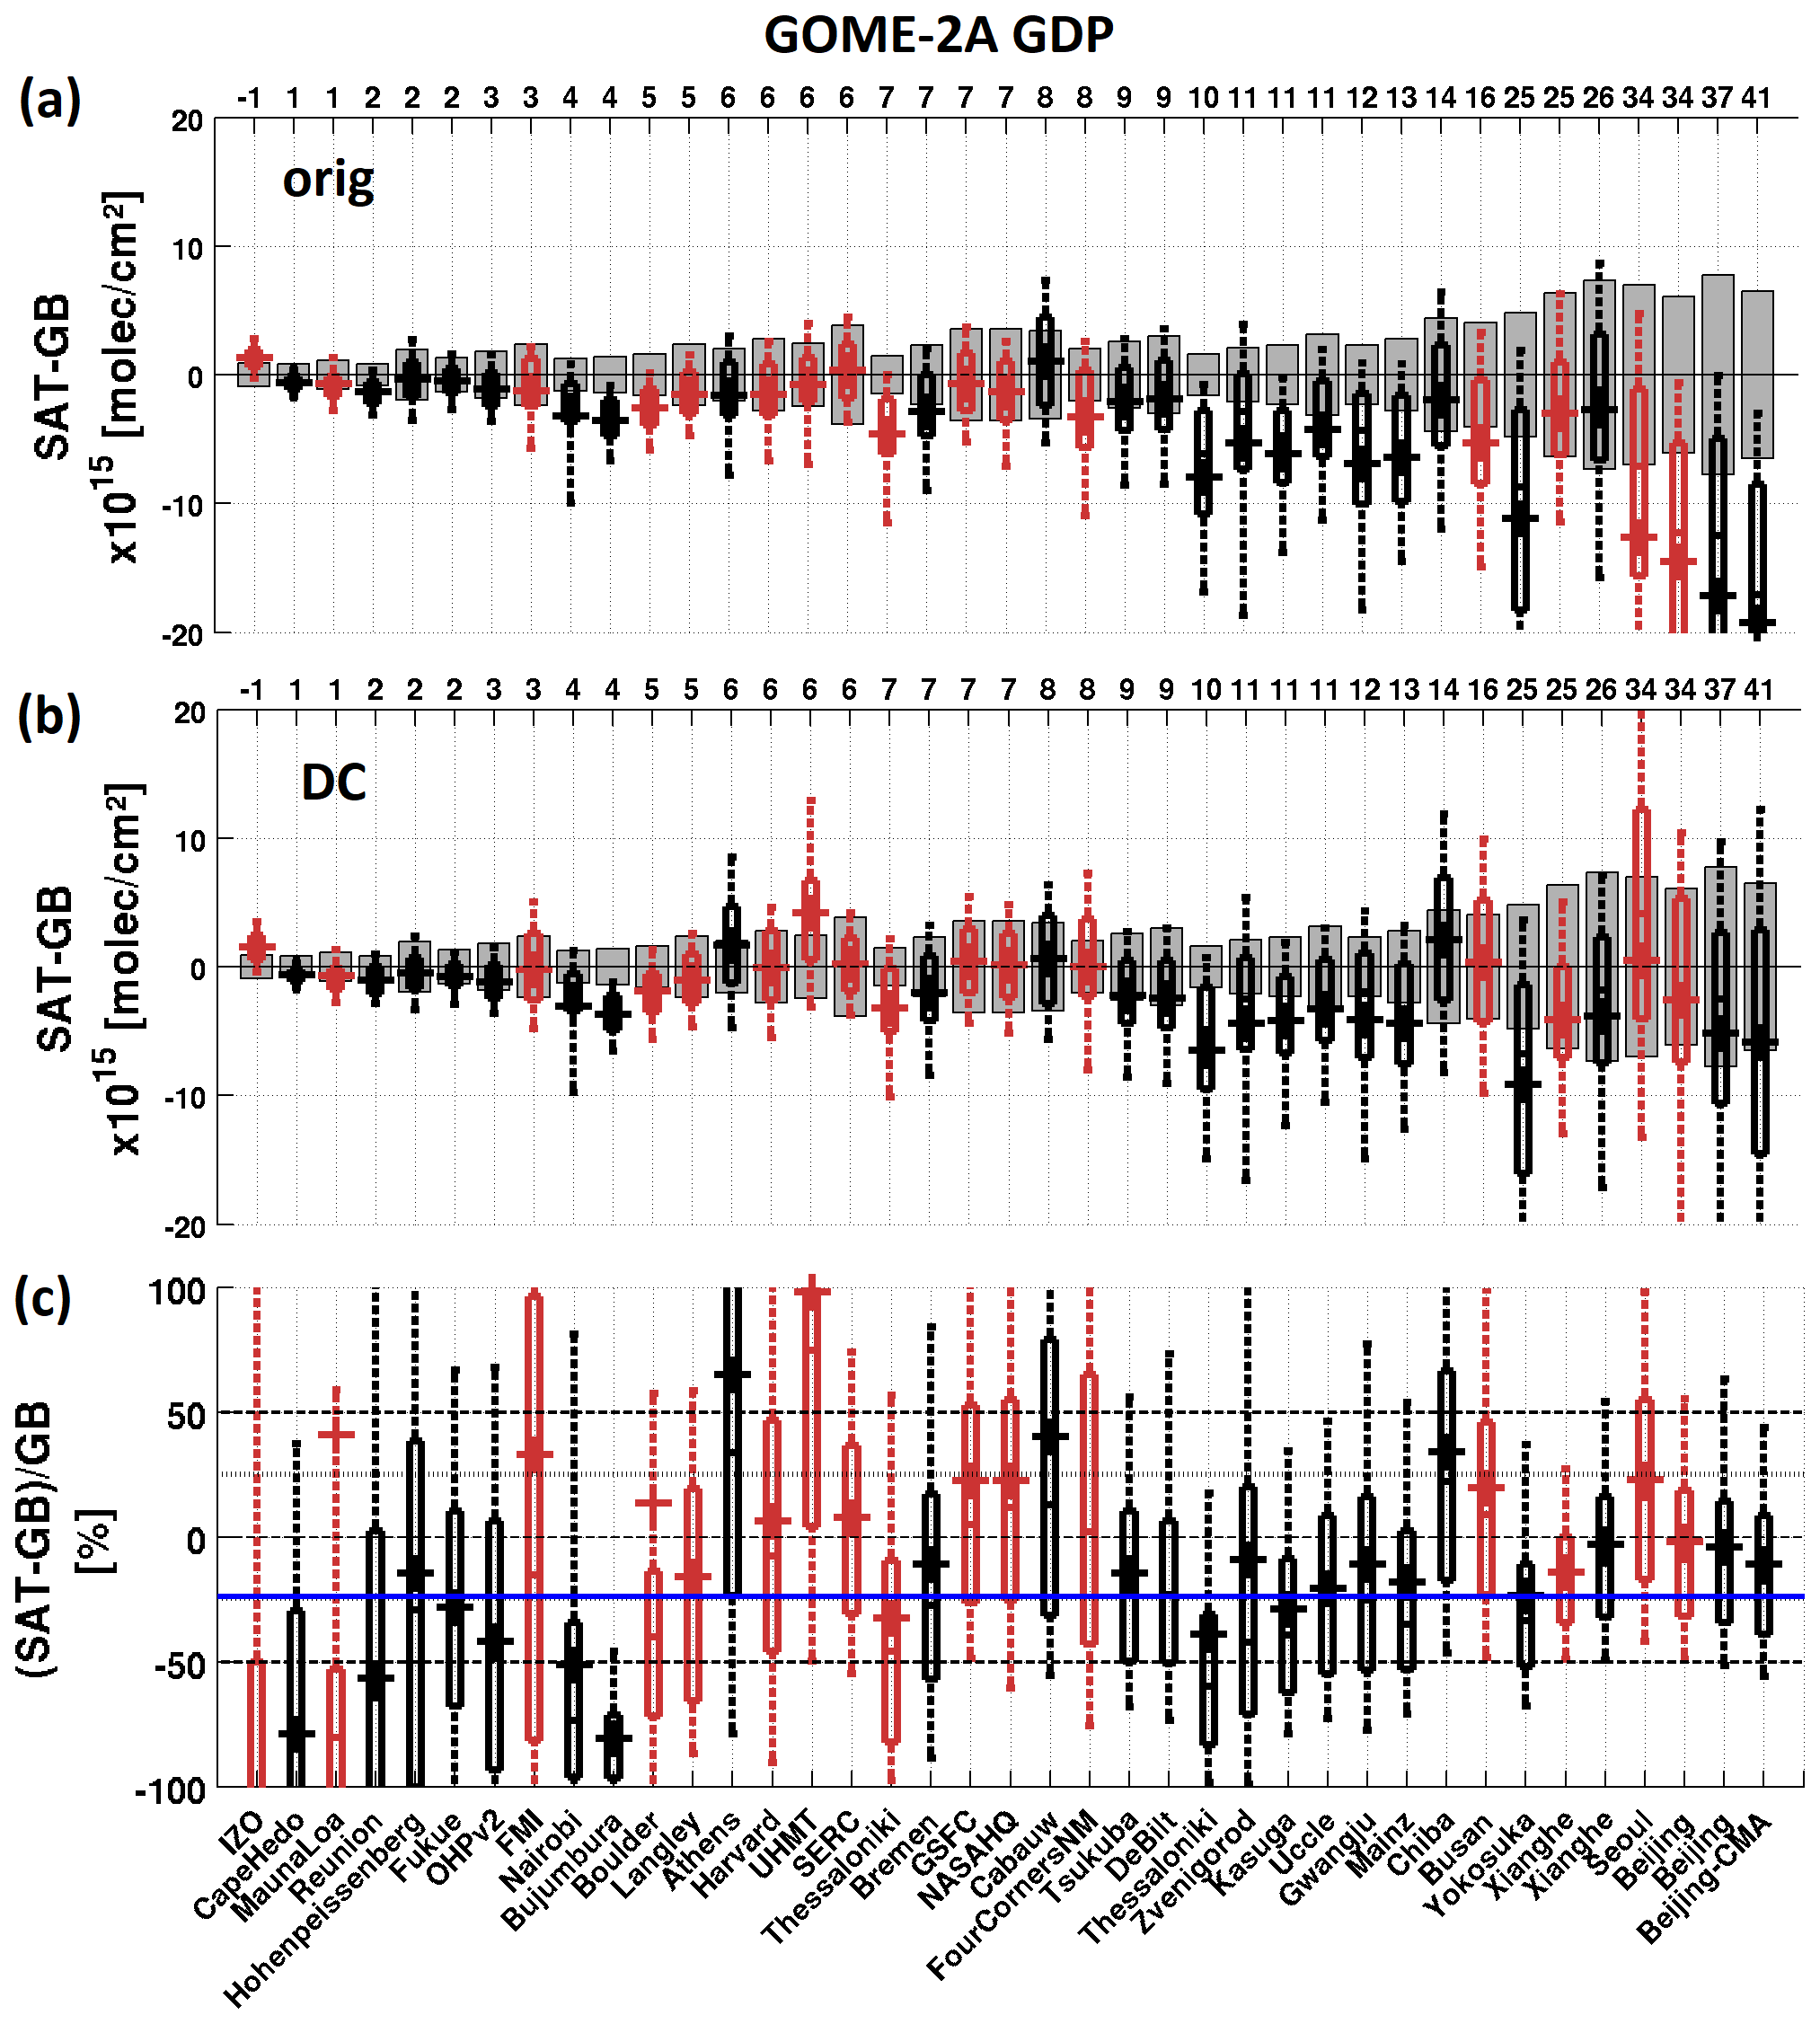
Figure 15Box-and-whisker plot of the daily GOME-2A GDP 4.8 biases for each station (a) for the original data and (b, c) when correcting for the dilution effect, in absolute and relative values. MAX-DOAS stations are presented in black; direct sun stations in dark red. The stations are ordered by increasing values of the ground-based VCDtropo for the satellite overpasses coincidences, and corresponding values are given on the upper horizontal axis. The box-and-whisker plots are defined as in Fig. 7. In panels (a, b), grey bars are the ± comparison error, calculated by adding in quadrature the satellite and ground-based VCDtropo errors.
Figure 16 presents the overall GOME-2A and OMI biases for the different GDP, DOMINO and QA4ECV data products, for satellite pixels in strict coincidence with the stations. In the SAT–GB panel, grey bars present the estimated error on the median bias for each comparison case, estimated as
where n is the number of comparisons of each case (which can be different), and MAD is the median absolute deviation (see Huber, 1981), a robust indicator:
where k=1.4826, for a correspondence of MAD with the 1σ SD in case of normal distribution without outliers. We note that the errors on the median values are significantly smaller (around 2×10¹⁴ molec cm−2) than the median values themselves (a few 1×10¹⁵ molec cm−2), indicating that the derived residual biases are significant.
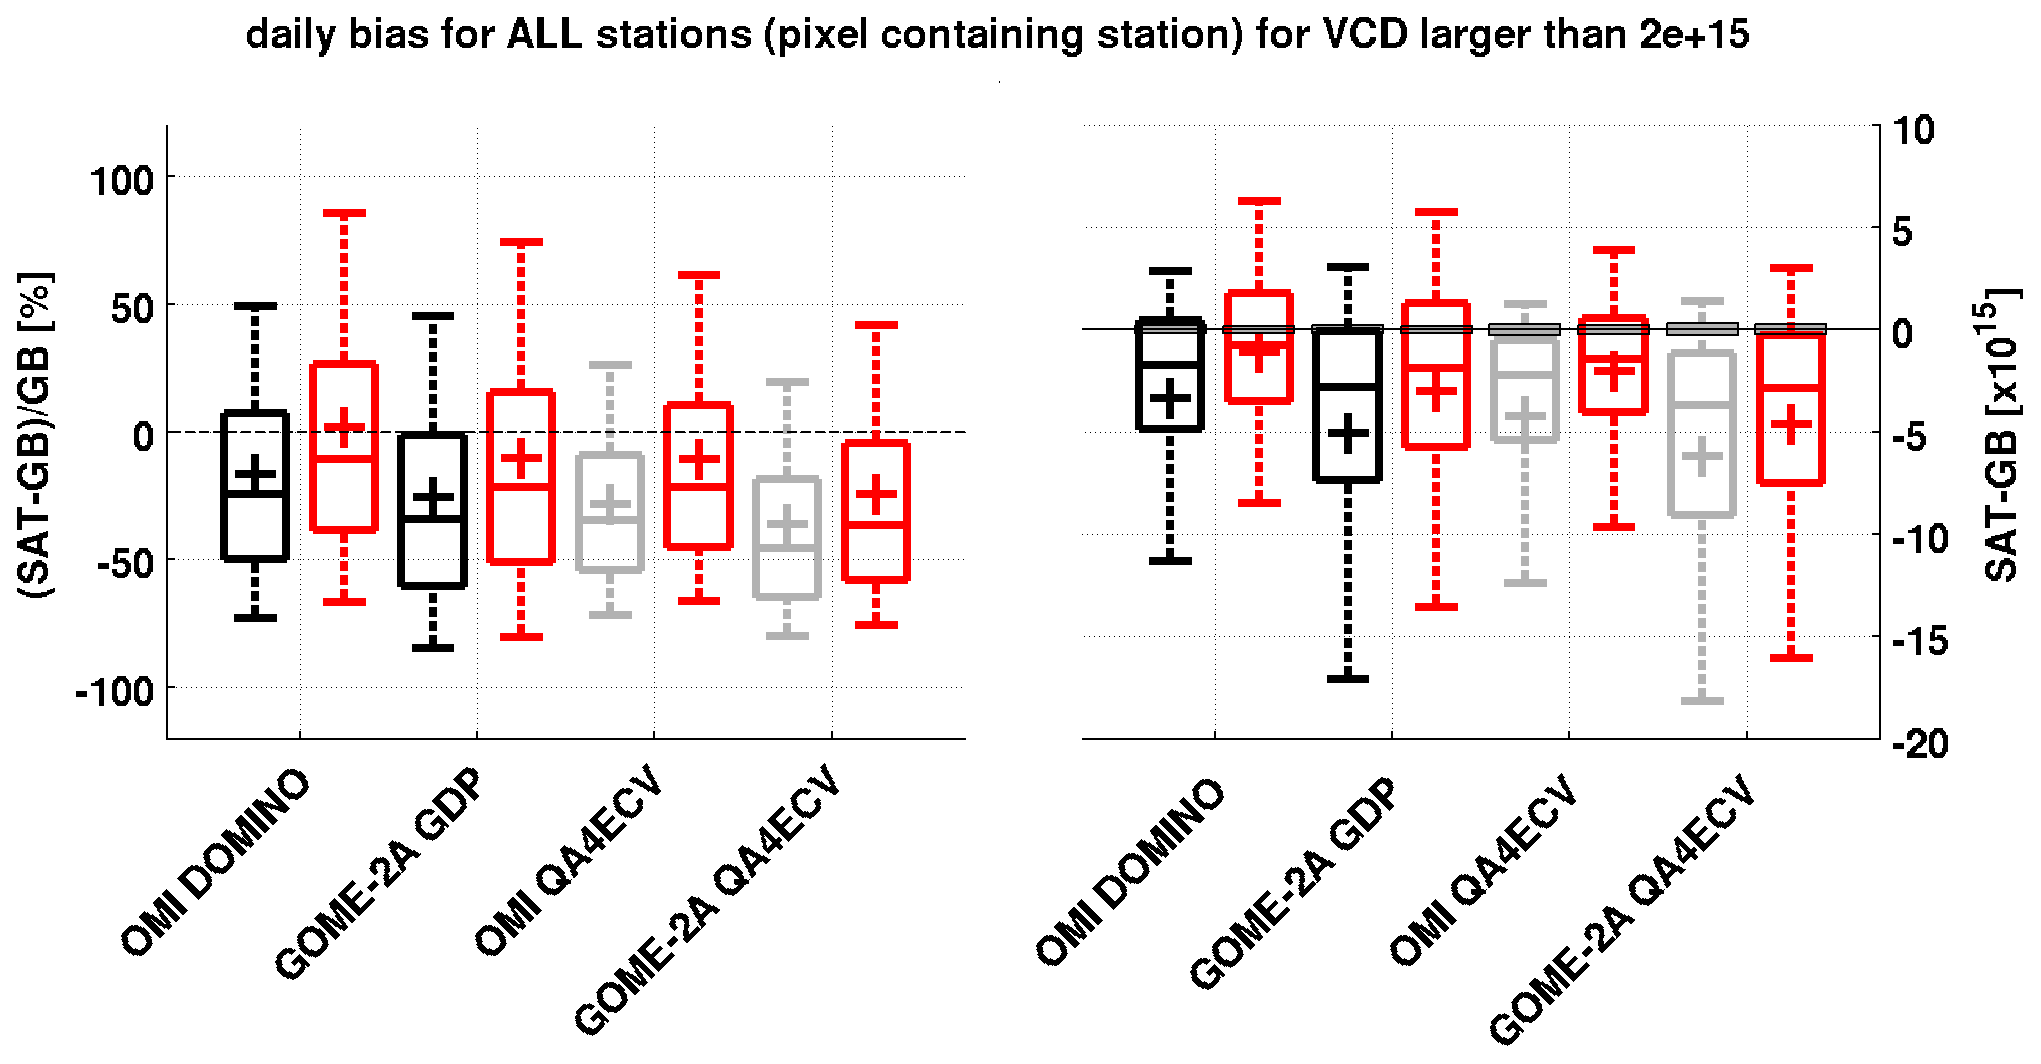
Figure 16Box-and-whisker plot of the daily satellite biases for all stations together, in absolute and relative values. The box-and-whisker plots are defined as in Fig. 7. Red is used for the dilution-corrected data, while black is used for the previously presented products (OMI DOMINO and GOME-2A GDP), and grey is used for the QA4ECV products.
Table 6 summarizes the median biases for all the cases. As already stated, the dilution correction improves the validation results for both sensors, by about 10 % to 13 % in total over the station ensemble, with an overall uncertainty due to the method estimated at about 5 %. The impact of relaxing the comparison criteria from only pixels over the stations to the daily closest pixels selection is to increase the bias by 4 % to 6 % for OMI, but it has a negligible effect on GOME-2A (about 2 %), probably due to the large size of the GOME-2A pixels (40 km×80 km). When considering the best comparison conditions including dilution correction (last column of Table 6), we come to the conclusion that satellite tropospheric NO2 measurements tend to underestimate ground-based reference data by the following:
- -
23 % for GOME-2A GDP4.8
- -
39 % for GOME-2A QA4ECV
- -
18 % for OMI DOMINO
- -
27 % for OMI QA4ECV.
It should be noted that in addition to this relative bias, the previously found positive intercepts and slopes smaller than 1 (see Table 5) could point to a twofold effect, involving a multiplicative error source (e.g., the AMF) and an additive error source (e.g., the stratosphere–troposphere separation). This question should be further investigated in future studies using more extended validation data, in particular of the stratospheric NO2 column (see, e.g., Compernolle et al., 2020).
Table 6Daily median biases for all the stations together for the baseline (pixels above the stations) and when relaxing the comparison criteria for the original and dilution-corrected comparison (in molec cm−2). Values are reported after filtering out GBi values smaller than 2×10¹⁵ molec cm3.
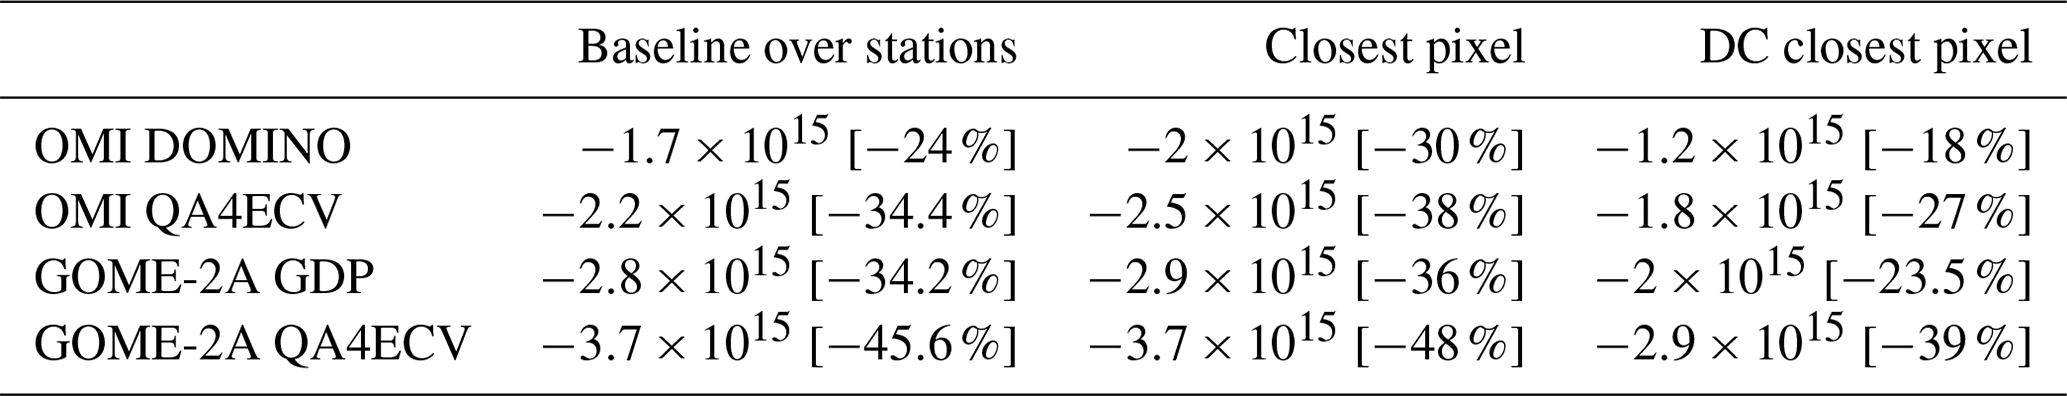
Tropospheric NO2 column data from 39 ground-based remote-sensing instruments worldwide were used to validate results from GOME-2A GDP 4.8 and QA4ECV v1.1 and OMI DOMINO v2 and QA4ECV v1.1 data products. Although the ground-based retrievals are not yet fully harmonized at network level, the ground-based datasets are treated coherently for the different stations, and the study illustrates the potential capacity of MAX-DOAS and the direct sun network for tropospheric NO2 validation. The interest of such a network resides in the large number of stations sampling different pollution levels and scenarios, corresponding to remote, suburban and urban conditions. Typically, suburban polluted stations (e.g., Xianghe) provide the best conditions for the validation of satellite NO2, owing to their good representativeness of the size of the OMI or GOME-2A pixel spatial extent. Validation at more remote stations can be challenging due to usually low levels of tropospheric NO2, leading to difficulties in the stratosphere–troposphere separation step in the satellite retrieval. Other challenging cases are cities and islands surrounded by a pristine atmosphere, such as Izaña, Réunion Island, Nairobi or Bujumbura, leading to large biases (up to ∼80 %) due to smearing of the local tropospheric NO2 emissions content in otherwise clean surroundings.
The baseline comparison keeping only satellite pixels covering the stations presents the smaller bias and spread at urban locations and the comparison spread at suburban sites for OMI data. Relaxing the collocation criteria increases the statistics but at the expense of larger biases and spread. Comparisons at urban sites or close to strong NOx sources may suffer from smoothing difference errors due to the horizontal dilution of the measured NO2 field. Therefore, a quantitative correction for the dilution effect has been developed based on the spatial distribution of tropospheric NO2 columns probed by OMI and averaged over 1 year. This dilution correction generally improves the comparison, reducing biases due to the spatial mismatch between ground-based and satellite observations. Generally OMI DOMINO v2 data agree better with ground-based data than GOME-2A GDP 4.8, especially for comparisons with MAX-DOAS data. The dilution correction improves the station-per-station comparisons with a few exceptions, generally at remote sites with local emissions surrounded by clean areas.
A large reduction of the bias is obtained when applying the dilution correction. In terms of validation results, MAX-DOAS and direct sun measurements are found to be highly consistent, and therefore they have been used as an ensemble to assess the accuracy of GOME-2A and OMI data. Results based on this ensemble indicate that, even after correction for the horizontal dilution effect, satellite tropospheric NO2 columns are systematically biased low in comparison to ground-based measurements by 23 % to 39 % for GOME-2A and 18 % to 27 % for OMI, depending on the selected satellite product. A summary of the validation results is given in Table 6.
The dilution correction developed here is parameterized according to the distance from the station and is based on 1 year of OMI NO2 measurements (2005). This approach has several identified limitations, such as assumptions made on the radial nature of the NO2 distribution around the sites and the overall applicability of the NO2 field derived in 2005. Another limitation is the different intra-pixel dilution expected for the OMI and GOME-2A measurements. It has been tested on a few extreme cases by taking into account the pixels' corner positions, showing improvement in the comparisons and elimination of the overestimation. Despite its simplicity and shortcomings, our dilution correction was shown to significantly improve validation results, and we anticipate that future developments will lead to further improvements. For example, possibilities exist to use estimates of the horizontal extent of MAX-DOAS measurements to improve the colocation with satellite data. MAX-DOAS instruments can also be operated in multiple azimuthal scan mode, which could be used to further refine the colocation with satellite pixels (Brinksma et al., 2008; Gratsea et al., 2016; Ortega et al., 2015; Schreier et al., 2019; Dimitropoulou et al., 2020). Finally, imaging MAX-DOAS systems such as the IMPACT instrument (Peters et al., 2019), which provides fast sampling of the full (360∘) azimuthal range, may lead to significant improvements in tropospheric NO2 validation close to source regions.
To further improve validation studies, information on the vertical distribution of NO2 and aerosols is also needed to test the impact of a priori assumptions in satellite data retrieval. To some extent, this can be provided by MAX-DOAS instruments, making use of vertical profiling techniques for the inversion of tropospheric profiles of NO2 and aerosols.
Finally, improving and further extending existing networks are essential requirements for future operational air quality satellite validation (Veihelmann et al., 2019). In this context, important steps include the following:
- -
the further development of the PGN network of Pandora instruments, to better cover source regions in all continents and in the measurement areas of all current and future satellites;
- -
the inclusion of MAX-DOAS instruments in the Network for the Detection of Atmospheric Composition Change (NDACC; De Mazière et al, 2018), based on ongoing efforts to harmonize retrieval methods and develop facilities for central data processing;
- -
the systematic adoption of harmonized uncertainty characterization and reporting and of harmonized data reporting formats, another crucial point for data usage.
On this basis, it is anticipated that significant progress will be achieved in the near future towards the development of harmonized and quality-controlled global networks of UV-VIS MAX-DOAS and direct sun instruments. The development of such networks is an essential element for the validation and cross-mission consistency of the atmospheric composition satellite constellation bridging low-earth (LEO) and geostationary (GEO) orbits, in particular the ESA/EUMETSAT Copernicus Sentinel-4 (GEO) and -5 (LEO) series (planned for launch in from 2023 to 2036), the NOAA/NASA LEO Suomi-NPP/JPSS OMPS series (started in 2011, with JPSS launches planned to 2031), the CNSA LEO GaoFen-5 Environment Monitoring Instrument (2018) and the geostationary missions GEMS (2020) and TEMPO (2022) developed by the United States and South Korea and the United States, respectively.
The datasets generated and analyzed in the present work are available from the corresponding author on request, and data per station can be requested from the individual PIs.
The supplement related to this article is available online at: https://doi.org/10.5194/amt-13-6141-2020-supplement.
GP and MVR planned this study. GP performed the validation and the associated investigations and wrote the manuscript. MVR and FH contributed to the scientific discussions and to the manuscript writing. NT participated in the OMI gridded maps' creation. JG keeps the GOME-2 GDP station overpass database up-to-date. All other co-authors provided ground-based data for the station(s) they are responsible for or support for the satellite data or the validation method. All co-authors were involved in the discussion of the results.
The authors declare that they have no conflict of interest.
EUMETSAT and the AC SAF are acknowledged for the production of GOME-2A GDP 4.8 data. KNMI is acknowledged for the production of OMI DOMINO v2.0 data, freely available from http://www.temis.nl (last access: 29 October 2020). QA4ECV data were obtained as part of the EC FP7 project Quality Assurance for Essential Climate Variables (QA4ECV; FP-SPACE-2013-1 project no. 607405). The Pandora data used in this work were obtained partly through the Pandonia Global Network (PGN) and are available publicly.
This work has been supported by EUMETSAT through the AC SAF Continuous Development and Operations Phase (CDOP-3) and by the Belgian Federal Science Policy Office (BELSPO) via the ProDEx B-ACSAF contribution to the AC-SAF. Work done by Hitoshi Irie was supported by the Environment Research and Technology Development Fund (fund no. 2-1901) of the Environmental Restoration and Conservation Agency of Japan, JSPS KAKENHI (grant nos. JP19H04235 and JP17K00529), JAXA 2nd Research Announcement on the Earth Observations (grant no. 19RT000351).
This paper was edited by Karin Kreher and reviewed by two anonymous referees.
Acarreta, J. R., de Haan, J. F., and Stammes, P.: Cloud pressure retrieval using the O2-O2 absorption band at 477 nm, J. Geophys. Res., 109, D05204, https://doi.org/10.1029/2003JD003915, 2004.
Beirle, S., Hörmann, C., Jöckel, P., Liu, S., Penning de Vries, M., Pozzer, A., Sihler, H., Valks, P., and Wagner, T.: The STRatospheric Estimation Algorithm from Mainz (STREAM): estimating stratospheric NO2 from nadir-viewing satellites by weighted convolution, Atmos. Meas. Tech., 9, 2753–2779, https://doi.org/10.5194/amt-9-2753-2016, 2016.
Beirle, S., Dörner, S., Donner, S., Remmers, J., Wang, Y., and Wagner, T.: The Mainz profile algorithm (MAPA), Atmos. Meas. Tech., 12, 1785–1806, https://doi.org/10.5194/amt-12-1785-2019, 2019.
Belmonte Rivas, M., Veefkind, P., Eskes, H., and Levelt, P.: OMI tropospheric NO2 profiles from cloud slicing: constraints on surface emissions, convective transport and lightning NOx, Atmos. Chem. Phys., 15, 13519–13553, https://doi.org/10.5194/acp-15-13519-2015, 2015.
Bobrowski, N., Hönninger, G., Galle, B., and Platt, U.: Detection of bromine monoxide in a volcanic plume, Nature, 423, 273–276, 2003.
Boersma, K. F., Eskes, H. J., and Brinksma, E. J.: Error analysis for tropospheric NO2 from space, J. Geophys. Res., 109, D04311, https://doi.org/10.1029/2003JD003962, 2004.
Boersma, K. F., Jacob, D. J., Eskes, H. J., Pinder, R. W., Wang, J., and van der A, R. J.: Intercomparison of SCIAMACHY and OMI tropospheric NO2 columns: Observing the diurnal evolution of chemistry and emissions from space, J. Geophys. Res., 113, D16S26, https://doi.org/10.1029/2007JD008816, 2008.
Boersma, K. F., Eskes, H. J., Dirksen, R. J., van der A, R. J., Veefkind, J. P., Stammes, P., Huijnen, V., Kleipool, Q. L., Sneep, M., Claas, J., Leitão, J., Richter, A., Zhou, Y., and Brunner, D.: An improved tropospheric NO2 column retrieval algorithm for the Ozone Monitoring Instrument, Atmos. Meas. Tech., 4, 1905–1928, https://doi.org/10.5194/amt-4-1905-2011, 2011.
Boersma, K. F., Eskes, H. J., Richter, A., De Smedt, I., Lorente, A., Beirle, S., van Geffen, J. H. G. M., Zara, M., Peters, E., Van Roozendael, M., Wagner, T., Maasakkers, J. D., van der A, R. J., Nightingale, J., De Rudder, A., Irie, H., Pinardi, G., Lambert, J.-C., and Compernolle, S. C.: Improving algorithms and uncertainty estimates for satellite NO2 retrievals: results from the quality assurance for the essential climate variables (QA4ECV) project, Atmos. Meas. Tech., 11, 6651–6678, https://doi.org/10.5194/amt-11-6651-2018, 2018.
Bösch, T., Rozanov, V., Richter, A., Peters, E., Rozanov, A., Wittrock, F., Merlaud, A., Lampel, J., Schmitt, S., de Haij, M., Berkhout, S., Henzing, B., Apituley, A., den Hoed, M., Vonk, J., Tiefengraber, M., Müller, M., and Burrows, J. P.: BOREAS – a new MAX-DOAS profile retrieval algorithm for aerosols and trace gases, Atmos. Meas. Tech., 11, 6833–6859, https://doi.org/10.5194/amt-11-6833-2018, 2018.
Bovensmann, H., Burrows, J. P., Buchwitz, M., Frerick, J., Noël, S., Rozanov, V. V., Chance, K. V., and Goede, A. P. H.: SCIAMACHY: Mission objectives and measurement modes, J. Atmos. Sci., 56, 127–150, https://doi.org/10.1175/1520-0469(1999)056<0127:SMOAMM>2.0.CO;2, 1999.
Brinksma, E. J., Pinardi, G., Volten, H., Braak, R., Richter, A., Scho, A., Van Roozendael, M., Fayt, C., Hermans, C., Dirksen, R. J., Vlemmix, T., Berkhout, A. J. C., Swart, D. P. J., Oetjen, H., Wittrock, F., Wagner, T., Ibrahim, O. W., Leeuw, G. De, Moerman, M., Curier, R. L., Celarier, E. A., Cede, A., Knap, W. H., Veefkind, J. P., Eskes, H. J., Allaart, M., Rothe, R., Piters, A., and Levelt, P. F.: The 2005 and 2006 DANDELIONS NO2 and aerosol intercomparison campaigns, J. Geophys. Res., 113, D16S46, https://doi.org/10.1029/2007JD008808, 2008.
Bucsela, E. J., Krotkov, N. A., Celarier, E. A., Lamsal, L. N., Swartz, W. H., Bhartia, P. K., Boersma, K. F., Veefkind, J. P., Gleason, J. F., and Pickering, K. E.: A new stratospheric and tropospheric NO2 retrieval algorithm for nadir-viewing satellite instruments: applications to OMI, Atmos. Meas. Tech., 6, 2607–2626, https://doi.org/10.5194/amt-6-2607-2013, 2013.
Burrows, J., Weber, M., Buchwitz, M., Rozanov, V., Ladstatter-Weißenmayer, A., Richter, A., Debeek, R., Hoogen, R., Bramstedt, K., Eichmann, K.-U., and Eisinger, M.: The Global Ozone Monitoring Experiment (GOME): Mission concept and first scientific results, J. Atmos. Sci., 56, 151–175, 1999.
Cede, A., Herman, J. R., Richter, A., Krotkov, N., and Burrows, J. P.: Measurements of nitrogen dioxide total column amounts using a Brewer double spectrophotometer in direct sun mode, J. Geophys. Res., 111, D05304, https://doi.org/10.1029/2005JD006585, 2006.
Celarier, E. A., Brinksma, E. J., Gleason, J. F., Veefkind, J. P., Cede, A., Herman, J. R., Ionov, D., Pommereau, J.-P., Goutail, F., Lambert, J.-C., Pinardi, G., Van Roozendael, M., Wittrock, F., Schonhardt, A., Richter, A., Ibrahim, O. W., Wagner, T., Bojkov, B., Mount, G., Spine, E., Chen, C. M., Pongett, T. J., Sander, S. P., Bucsela, E. J., Wenig, M. O., Swart, D. P. J., Volten, H., Levelt, P. F., and Kroon, M.: Validation of Ozone Monitoring Instrument nitrogen dioxide columns, J. Geophys. Res., 113, D15S15, https://doi.org/10.1029/2007JD008908, 2008.
Chen, D., Zhou, B., Beirle, S., Chen, L. M., and Wagner, T.: Tropospheric NO2 column densities deduced from zenith-sky DOAS measurements in Shanghai, China, and their application to satellite validation, Atmos. Chem. Phys., 9, 3641–3662, https://doi.org/10.5194/acp-9-3641-2009, 2009.
Chimot, J., Vlemmix, T., Veefkind, J. P., de Haan, J. F., and Levelt, P. F.: Impact of aerosols on the OMI tropospheric NO2 retrievals over industrialized regions: how accurate is the aerosol correction of cloud-free scenes via a simple cloud model?, Atmos. Meas. Tech., 9, 359–382, https://doi.org/10.5194/amt-9-359-2016, 2016.
Choi, S., Lamsal, L. N., Follette-Cook, M., Joiner, J., Krotkov, N. A., Swartz, W. H., Pickering, K. E., Loughner, C. P., Appel, W., Pfister, G., Saide, P. E., Cohen, R. C., Weinheimer, A. J., and Herman, J. R.: Assessment of NO2 observations during DISCOVER-AQ and KORUS-AQ field campaigns, Atmos. Meas. Tech., 13, 2523–2546, https://doi.org/10.5194/amt-13-2523-2020, 2020.
Clémer, K., Van Roozendael, M., Fayt, C., Hendrick, F., Hermans, C., Pinardi, G., Spurr, R., Wang, P., and De Mazière, M.: Multiple wavelength retrieval of tropospheric aerosol optical properties from MAXDOAS measurements in Beijing, Atmos. Meas. Tech., 3, 863–878, https://doi.org/10.5194/amt-3-863-2010, 2010.
Compernolle, S., Verhoelst, T., Pinardi, G., Granville, J., Hubert, D., Keppens, A., Niemeijer, S., Rino, B., Bais, A., Beirle, S., Boersma, F., Burrows, J. P., De Smedt, I., Eskes, H., Goutail, F., Hendrick, F., Lorente, A., Pazmino, A., Piters, A., Peters, E., Pommereau, J.-P., Remmers, J., Richter, A., van Geffen, J., Van Roozendael, M., Wagner, T., and Lambert, J.-C.: Validation of Aura-OMI QA4ECV NO2 climate data records with ground-based DOAS networks: the role of measurement and comparison uncertainties, Atmos. Chem. Phys., 20, 8017–8045, https://doi.org/10.5194/acp-20-8017-2020, 2020.
De Mazière, M., Thompson, A. M., Kurylo, M. J., Wild, J. D., Bernhard, G., Blumenstock, T., Braathen, G. O., Hannigan, J. W., Lambert, J.-C., Leblanc, T., McGee, T. J., Nedoluha, G., Petropavlovskikh, I., Seckmeyer, G., Simon, P. C., Steinbrecht, W., and Strahan, S. E.: The Network for the Detection of Atmospheric Composition Change (NDACC): history, status and perspectives, Atmos. Chem. Phys., 18, 4935–4964, https://doi.org/10.5194/acp-18-4935-2018, 2018.
De Smedt, I., Stavrakou, T., Hendrick, F., Danckaert, T., Vlemmix, T., Pinardi, G., Theys, N., Lerot, C., Gielen, C., Vigouroux, C., Hermans, C., Fayt, C., Veefkind, P., Müller, J.-F., and Van Roozendael, M.: Diurnal, seasonal and long-term variations of global formaldehyde columns inferred from combined OMI and GOME-2 observations, Atmos. Chem. Phys., 15, 12519–12545, https://doi.org/10.5194/acp-15-12519-2015, 2015.
Dimitropoulou, E., Hendrick, F., Pinardi, G., Friedrich, M. M., Merlaud, A., Tack, F., De Longueville, H., Fayt, C., Hermans, C., Laffineur, Q., Fierens, F., and Van Roozendael, M.: Validation of TROPOMI tropospheric NO2 columns using dual-scan multi-axis differential optical absorption spectroscopy (MAX-DOAS) measurements in Uccle, Brussels, Atmos. Meas. Tech., 13, 5165–5191, https://doi.org/10.5194/amt-13-5165-2020, 2020.
Dirksen, R. J., Boersma, K. F., Eskes, H. J., Ionov, D. V., Bucsela, E. J., Levelt, P. F., and Kelder, H. M.: Evaluation of stratospheric NO2 retrieved from the Ozone Monitoring Instrument: Intercomparison, diurnal cycle, and trending, J. Geophys. Res., 116, D08305, https://doi.org/10.1029/2010JD014943, 2011.
Drosoglou, T., Bais, A. F., Zyrichidou, I., Kouremeti, N., Poupkou, A., Liora, N., Giannaros, C., Koukouli, M. E., Balis, D., and Melas, D.: Comparisons of ground-based tropospheric NO2 MAX-DOAS measurements to satellite observations with the aid of an air quality model over the Thessaloniki area, Greece, Atmos. Chem. Phys., 17, 5829–5849, https://doi.org/10.5194/acp-17-5829-2017, 2017.
Drosoglou, T., Koukouli, M. E., Kouremeti, N., Bais, A. F., Zyrichidou, I., Balis, D., van der A, R. J., Xu, J., and Li, A.: MAX-DOAS NO2 observations over Guangzhou, China; ground-based and satellite comparisons, Atmos. Meas. Tech., 11, 2239–2255, https://doi.org/10.5194/amt-11-2239-2018, 2018.
Duncan, B. N., Lamsal, L. N., Thompson, A. M., Yoshida, Y., Lu, Z., Streets, D. G., Hurwitz, M. M., and Pickering, K. E.: A space-based, high-resolution view of notable changes in urban NOx pollution around the world (2005–2014), J. Geophys. Res.-Atmos., 121, 1–21, https://doi.org/10.1002/2015JD024121, 2016.
Fioletov, V. E., McLinden, C. A., Cede, A., Davies, J., Mihele, C., Netcheva, S., Li, S.-M., and O'Brien, J.: Sulfur dioxide (SO2) vertical column density measurements by Pandora spectrometer over the Canadian oil sands, Atmos. Meas. Tech., 9, 2961–2976, https://doi.org/10.5194/amt-9-2961-2016, 2016.
Friedrich, M. M., Rivera, C., Stremme, W., Ojeda, Z., Arellano, J., Bezanilla, A., García-Reynoso, J. A., and Grutter, M.: NO2 vertical profiles and column densities from MAX-DOAS measurements in Mexico City, Atmos. Meas. Tech., 12, 2545–2565, https://doi.org/10.5194/amt-12-2545-2019, 2019.
Frieß, U., Monks, P. S., Remedios, J. J., Rozanov, A., Sinreich, R., Wagner, T., and Platt, U.: MAX-DOAS O 4 measurements: A new technique to derive information on atmospheric aerosols: 2. Modeling studies, J. Geophys. Res., 111, D14203, https://doi.org/10.1029/2005JD006618, 2006.
Frieß, U., Klein Baltink, H., Beirle, S., Clémer, K., Hendrick, F., Henzing, B., Irie, H., de Leeuw, G., Li, A., Moerman, M. M., van Roozendael, M., Shaiganfar, R., Wagner, T., Wang, Y., Xie, P., Yilmaz, S., and Zieger, P.: Intercomparison of aerosol extinction profiles retrieved from MAX-DOAS measurements, Atmos. Meas. Tech., 9, 3205–3222, https://doi.org/10.5194/amt-9-3205-2016, 2016.
Frieß, U., Beirle, S., Alvarado Bonilla, L., Bösch, T., Friedrich, M. M., Hendrick, F., Piters, A., Richter, A., van Roozendael, M., Rozanov, V. V., Spinei, E., Tirpitz, J.-L., Vlemmix, T., Wagner, T., and Wang, Y.: Intercomparison of MAX-DOAS vertical profile retrieval algorithms: studies using synthetic data, Atmos. Meas. Tech., 12, 2155–2181, https://doi.org/10.5194/amt-12-2155-2019, 2019.
Galle, B., Johansson, M., Rivera, C., Zhang, Y., Kihlman, M., Kern, C., Lehmann, T., Platt, U., Arellano, S., and Hidalgo, S.: Network for Observation of Volcanic and Atmospheric Change (NOVAC) – A global network for volcanic gas monitoring: Network layout and instrument description, J. Geophys. Res., 115, D05304, https://doi.org/10.1029/2009JD011823, 2010.
Georgoulias, A. K., van der A, R. J., Stammes, P., Boersma, K. F., and Eskes, H. J.: Trends and trend reversal detection in 2 decades of tropospheric NO2 satellite observations, Atmos. Chem. Phys., 19, 6269–6294, https://doi.org/10.5194/acp-19-6269-2019, 2019.
Gielen, C., Van Roozendael, M., Hendrick, F., Pinardi, G., Vlemmix, T., De Bock, V., De Backer, H., Fayt, C., Hermans, C., Gillotay, D., and Wang, P.: A simple and versatile cloud-screening method for MAX-DOAS retrievals, Atmos. Meas. Tech., 7, 3509–3527, https://doi.org/10.5194/amt-7-3509-2014, 2014.
Gielen, C., Hendrick, F., Pinardi, G., De Smedt, I., Fayt, C., Hermans, C., Stavrakou, T., Bauwens, M., Müller, J.-F., Ndenzako, E., Nzohabonayo, P., Akimana, R., Niyonzima, S., Van Roozendael, M., and De Mazière, M.: Characterisation of Central-African aerosol and trace-gas emissions based on MAX-DOAS measurements and model simulations over Bujumbura, Burundi, Atmos. Chem. Phys. Discuss., https://doi.org/10.5194/acp-2016-1104, in review, 2017.
Goldberg, D. L., Lamsal, L. N., Loughner, C. P., Swartz, W. H., Lu, Z., and Streets, D. G.: A high-resolution and observationally constrained OMI NO2 satellite retrieval, Atmos. Chem. Phys., 17, 11403–11421, https://doi.org/10.5194/acp-17-11403-2017, 2017.
Goldberg, D. L., Saide, P. E., Lamsal, L. N., de Foy, B., Lu, Z., Woo, J.-H., Kim, Y., Kim, J., Gao, M., Carmichael, G., and Streets, D. G.: A top-down assessment using OMI NO2 suggests an underestimate in the NOx emissions inventory in Seoul, South Korea, during KORUS-AQ, Atmos. Chem. Phys., 19, 1801–1818, https://doi.org/10.5194/acp-19-1801-2019, 2019.
Gomez, L., Navarro-Comas, M., Puentedura, O., Gonzalez, Y., Cuevas, E., and Gil-Ojeda, M.: Long-path averaged mixing ratios of O3 and NO2 in the free troposphere from mountain MAX-DOAS, Atmos. Meas. Tech., 7, 3373–3386, https://doi.org/10.5194/amt-7-3373-2014, 2014.
Gratsea, M., Vrekoussis, M., Richter, A., Wittrock, F., Schönhardt, A., Burrows, J., Kazadzis, S., Mihalopoulos, N., Gerasopoulos, E., Slant Column MAX-DOAS measurements of nitrogen dioxide, formaldehyde, glyoxal and oxygen dimer in the urban environment of Athens, Atmos. Environ., 135, 181–131, https://doi.org/10.1016/j.atmosenv.2016.03.048, 2016.
Hains, J. C., Boersma, K. F., Kroon, M., Dirksen, R. J., Cohen, R. C., Perring, A. E., Bucsela, E., Volten, H., Swart, D. P. J., Richter, A., Wittrock, F., Schoenhardt, A., Wagner, T., Ibrahim, O. W., van Roozendael, M., Pinardi, G., Gleason, J. F., Veefkind, J. P., and Levelt, P.: Testing and improving OMI DOMINO tropospheric NO2 using observations from the DANDELIONS and INTEX-B validation campaigns, J. Geophys. Res., 115, D05301, https://doi.org/10.1029/2009JD012399, 2010.
Halla, J. D., Wagner, T., Beirle, S., Brook, J. R., Hayden, K. L., O'Brien, J. M., Ng, A., Majonis, D., Wenig, M. O., and McLaren, R.: Determination of tropospheric vertical columns of NO2 and aerosol optical properties in a rural setting using MAX-DOAS, Atmos. Chem. Phys., 11, 12475–12498, https://doi.org/10.5194/acp-11-12475-2011, 2011.
Hassinen, S., Balis, D., Bauer, H., Begoin, M., Delcloo, A., Eleftheratos, K., Gimeno Garcia, S., Granville, J., Grossi, M., Hao, N., Hedelt, P., Hendrick, F., Hess, M., Heue, K.-P., Hovila, J., Jønch-Sørensen, H., Kalakoski, N., Kauppi, A., Kiemle, S., Kins, L., Koukouli, M. E., Kujanpää, J., Lambert, J.-C., Lang, R., Lerot, C., Loyola, D., Pedergnana, M., Pinardi, G., Romahn, F., van Roozendael, M., Lutz, R., De Smedt, I., Stammes, P., Steinbrecht, W., Tamminen, J., Theys, N., Tilstra, L. G., Tuinder, O. N. E., Valks, P., Zerefos, C., Zimmer, W., and Zyrichidou, I.: Overview of the O3M SAF GOME-2 operational atmospheric composition and UV radiation data products and data availability, Atmos. Meas. Tech., 9, 383–407, https://doi.org/10.5194/amt-9-383-2016, 2016.
Heckel, A., Richter, A., Tarsu, T., Wittrock, F., Hak, C., Pundt, I., Junkermann, W., and Burrows, J. P.: MAX-DOAS measurements of formaldehyde in the Po-Valley, Atmos. Chem. Phys., 5, 909–918, https://doi.org/10.5194/acp-5-909-2005, 2005.
Heckel, A., Kim, S.-W., Frost, G. J., Richter, A., Trainer, M., and Burrows, J. P.: Influence of low spatial resolution a priori data on tropospheric NO2 satellite retrievals, Atmos. Meas. Tech., 4, 1805–1820, https://doi.org/10.5194/amt-4-1805-2011, 2011.
Hendrick, F., Mahieu, E., Bodeker, G. E., Boersma, K. F., Chipperfield, M. P., De Mazière, M., De Smedt, I., Demoulin, P., Fayt, C., Hermans, C., Kreher, K., Lejeune, B., Pinardi, G., Servais, C., Stübi, R., van der A, R., Vernier, J.-P., and Van Roozendael, M.: Analysis of stratospheric NO2 trends above Jungfraujoch using ground-based UV-visible, FTIR, and satellite nadir observations, Atmos. Chem. Phys., 12, 8851–8864, https://doi.org/10.5194/acp-12-8851-2012, 2012.
Hendrick, F., Müller, J.-F., Clémer, K., Wang, P., De Mazière, M., Fayt, C., Gielen, C., Hermans, C., Ma, J. Z., Pinardi, G., Stavrakou, T., Vlemmix, T., and Van Roozendael, M.: Four years of ground-based MAX-DOAS observations of HONO and NO2 in the Beijing area, Atmos. Chem. Phys., 14, 765–781, https://doi.org/10.5194/acp-14-765-2014, 2014.
Herman, J. R., Cede, A., Spine, E., Mount, G., Tzortziou, M., and Abuhassan, N.: NO2 column amounts from ground-based Pandora and MFDOAS spectrometers using the direct sun DOAS technique: Intercomparisons and application to OMI validation, J. Geophys. Res., 114, D13307, https://doi.org/10.1029/2009JD011848, 2009.
Herman, J., Spinei, E., Fried, A., Kim, J., Kim, J., Kim, W., Cede, A., Abuhassan, N., and Segal-Rozenhaimer, M.: NO2 and HCHO measurements in Korea from 2012 to 2016 from Pandora spectrometer instruments compared with OMI retrievals and with aircraft measurements during the KORUS-AQ campaign, Atmos. Meas. Tech., 11, 4583–4603, https://doi.org/10.5194/amt-11-4583-2018, 2018.
Herman, J., Abuhassan, N., Kim, J., Kim, J., Dubey, M., Raponi, M., and Tzortziou, M.: Underestimation of column NO2 amounts from the OMI satellite compared to diurnally varying ground-based retrievals from multiple PANDORA spectrometer instruments, Atmos. Meas. Tech., 12, 5593–5612, https://doi.org/10.5194/amt-12-5593-2019, 2019.
Hönninger, G. and Platt, U.: Observations of BrO and its vertical distribution during surface ozone depletion at Alert, Atmos. Environ., 36, 2481–2489, 2002.
Hönninger, G., von Friedeburg, C., and Platt, U.: Multi axis differential optical absorption spectroscopy (MAX-DOAS), Atmos. Chem. Phys., 4, 231–254, https://doi.org/10.5194/acp-4-231-2004, 2004.
Horowitz, L. W., Walters, S., Mauzerall, D. L., Emmons, L. K., Rasch, P. J., Granier, C., Tie, X., Lamarque, J.-F., Schultz, M. G., Tyndall, G. S., Orlando, J. J., and Brasseur, G. P.: A global simulation of tropospheric ozone and related tracers: Description and evaluation of MOZART, version 2, J. Geophys. Res., 108, 4784, https://doi.org/10.1029/2002JD002853, 2003.
Huber, P. J.: Robust Statistics, Wiley, New York, 1981.
Huijnen, V., Eskes, H. J., Poupkou, A., Elbern, H., Boersma, K. F., Foret, G., Sofiev, M., Valdebenito, A., Flemming, J., Stein, O., Gross, A., Robertson, L., D'Isidoro, M., Kioutsioukis, I., Friese, E., Amstrup, B., Bergstrom, R., Strunk, A., Vira, J., Zyryanov, D., Maurizi, A., Melas, D., Peuch, V.-H., and Zerefos, C.: Comparison of OMI NO2 tropospheric columns with an ensemble of global and European regional air quality models, Atmos. Chem. Phys., 10, 3273–3296, https://doi.org/10.5194/acp-10-3273-2010, 2010.
Irie, H., Kanaya, Y., Akimoto, H., Tanimoto, H., Wang, Z., Gleason, J. F., and Bucsela, E. J.: Validation of OMI tropospheric NO2 column data using MAX-DOAS measurements deep inside the North China Plain in June 2006: Mount Tai Experiment 2006, Atmos. Chem. Phys., 8, 6577–6586, https://doi.org/10.5194/acp-8-6577-2008, 2008a.
Irie, H., Kanaya, Y., Akimoto, H., Iwabuchi, H., Shimizu, A., and Aoki, K.: First retrieval of tropospheric aerosol profiles using MAX-DOAS and comparison with lidar and sky radiometer measurements, Atmos. Chem. Phys., 8, 341–350, https://doi.org/10.5194/acp-8-341-2008, 2008b.
Irie, H., Takashima, H., Kanaya, Y., Boersma, K. F., Gast, L., Wittrock, F., Brunner, D., Zhou, Y., and Van Roozendael, M.: Eight-component retrievals from ground-based MAX-DOAS observations, Atmos. Meas. Tech., 4, 1027–1044, https://doi.org/10.5194/amt-4-1027-2011, 2011.
Irie, H., Boersma, K. F., Kanaya, Y., Takashima, H., Pan, X., and Wang, Z. F.: Quantitative bias estimates for tropospheric NO2 columns retrieved from SCIAMACHY, OMI, and GOME-2 using a common standard for East Asia, Atmos. Meas. Tech., 5, 2403–2411, https://doi.org/10.5194/amt-5-2403-2012, 2012.
Irie, H., Nakayama, T., Shimizu, A., Yamazaki, A., Nagai, T., Uchiyama, A., Zaizen, Y., Kagamitani, S., and Matsumi, Y.: Evaluation of MAX-DOAS aerosol retrievals by coincident observations using CRDS, lidar, and sky radiometer inTsukuba, Japan, Atmos. Meas. Tech., 8, 2775–2788, https://doi.org/10.5194/amt-8-2775-2015, 2015.
Irie, H., Hoque, H. M. S., Damiani, A., Okamoto, H., Fatmi, A. M., Khatri, P., Takamura, T., and Jarupongsakul, T.: Simultaneous observations by sky radiometer and MAX-DOAS for characterization of biomass burning plumes in central Thailand in January–April 2016, Atmos. Meas. Tech., 12, 599–606, https://doi.org/10.5194/amt-12-599-2019, 2019.
Jiang, Z., McDonald, B. C., Worden, H., Worden, J. R., Miyazaki, K., Qu, Z., Henze, D. K., Jones, D. B. A., Arellano, A. F., Fischer, E. V., Zhu, L., and Boersma, K. F.: Unexpected slowdown of US pollutant emission reduction in the past decade, P. Natl. Acad. Sci. USA, 115, 5099–5104, https://doi.org/10.1073/pnas.1801191115, 2018.
Judd, L. M., Al-Saadi, J. A., Janz, S. J., Kowalewski, M. G., Pierce, R. B., Szykman, J. J., Valin, L. C., Swap, R., Cede, A., Mueller, M., Tiefengraber, M., Abuhassan, N., and Williams, D.: Evaluating the impact of spatial resolution on tropospheric NO2 column comparisons within urban areas using high-resolution airborne data, Atmos. Meas. Tech., 12, 6091–6111, https://doi.org/10.5194/amt-12-6091-2019, 2019.
Kanaya, Y., Irie, H., Takashima, H., Iwabuchi, H., Akimoto, H., Sudo, K., Gu, M., Chong, J., Kim, Y. J., Lee, H., Li, A., Si, F., Xu, J., Xie, P.-H., Liu, W.-Q., Dzhola, A., Postylyakov, O., Ivanov, V., Grechko, E., Terpugova, S., and Panchenko, M.: Long-term MAX-DOAS network observations of NO2 in Russia and Asia (MADRAS) during the period 2007–2012: instrumentation, elucidation of climatology, and comparisons with OMI satellite observations and global model simulations, Atmos. Chem. Phys., 14, 7909–7927, https://doi.org/10.5194/acp-14-7909-2014, 2014.
Kim, H. C., Lee, P., Judd, L., Pan, L., and Lefer, B.: OMI NO2 column densities over North American urban cities: the effect of satellite footprint resolution, Geosci. Model Dev., 9, 1111–1123, https://doi.org/10.5194/gmd-9-1111-2016, 2016.
Kim, S. W., Heckel, A., Frost, G. J., Richter, A., Gleason, J., Burrows, J. P., McKeen, S., Hsie, E. Y., Granier, C., and Trainer, M.: NO2 columns in the western United States observed from space and simulated by a regional chemistry model and their implications for NOx emissions, J. Geophys. Res.-Atmos., 114, 1–29, https://doi.org/10.1029/2008JD011343, 2009.
Kleipool, Q. L., Dobber, M. R., de Haan, J. F., and Levelt, P. F.: Earth surface reflectance climatology from 3 years of OMI data, J. Geophys. Res., 113, D18308, https://doi.org/10.1029/2008JD010290, 2008.
Kouremeti, N., Bais, A. F., Balis, D., and Zyrichidou, I.: Phaethon, A System for the Validation of Satellite Derived Atmospheric Columns of Trace Gases, in: Advances in Meteorology, Climatology and Atmospheric Physics, edited by: Helmis, C. G. and Nastos, P. T., Springer, Berlin, Heidelberg, 1081–1088, https://doi.org/10.1007/978-3-642-29172-2_151, 2013.
Kreher, K., Van Roozendael, M., Hendrick, F., Apituley, A., Dimitropoulou, E., Frieß, U., Richter, A., Wagner, T., Lampel, J., Abuhassan, N., Ang, L., Anguas, M., Bais, A., Benavent, N., Bösch, T., Bognar, K., Borovski, A., Bruchkouski, I., Cede, A., Chan, K. L., Donner, S., Drosoglou, T., Fayt, C., Finkenzeller, H., Garcia-Nieto, D., Gielen, C., Gómez-Martín, L., Hao, N., Henzing, B., Herman, J. R., Hermans, C., Hoque, S., Irie, H., Jin, J., Johnston, P., Khayyam Butt, J., Khokhar, F., Koenig, T. K., Kuhn, J., Kumar, V., Liu, C., Ma, J., Merlaud, A., Mishra, A. K., Müller, M., Navarro-Comas, M., Ostendorf, M., Pazmino, A., Peters, E., Pinardi, G., Pinharanda, M., Piters, A., Platt, U., Postylyakov, O., Prados-Roman, C., Puentedura, O., Querel, R., Saiz-Lopez, A., Schönhardt, A., Schreier, S. F., Seyler, A., Sinha, V., Spinei, E., Strong, K., Tack, F., Tian, X., Tiefengraber, M., Tirpitz, J.-L., van Gent, J., Volkamer, R., Vrekoussis, M., Wang, S., Wang, Z., Wenig, M., Wittrock, F., Xie, P. H., Xu, J., Yela, M., Zhang, C., and Zhao, X.: Intercomparison of NO2, O4, O3 and HCHO slant column measurements by MAX-DOAS and zenith-sky UV–visible spectrometers during CINDI-2, Atmos. Meas. Tech., 13, 2169–2208, https://doi.org/10.5194/amt-13-2169-2020, 2020.
Krotkov, N. A., McLinden, C. A., Li, C., Lamsal, L. N., Celarier, E. A., Marchenko, S. V., Swartz, W. H., Bucsela, E. J., Joiner, J., Duncan, B. N., Boersma, K. F., Veefkind, J. P., Levelt, P. F., Fioletov, V. E., Dickerson, R. R., He, H., Lu, Z., and Streets, D. G.: Aura OMI observations of regional SO2 and NO2 pollution changes from 2005 to 2015, Atmos. Chem. Phys., 16, 4605–4629, https://doi.org/10.5194/acp-16-4605-2016, 2016.
Kuhlmann, G., Lam, Y. F., Cheung, H. M., Hartl, A., Fung, J. C. H., Chan, P. W., and Wenig, M. O.: Development of a custom OMI NO2 data product for evaluating biases in a regional chemistry transport model, Atmos. Chem. Phys., 15, 5627–5644, https://doi.org/10.5194/acp-15-5627-2015, 2015.
Lambert J.-C., De Clercq, C., and von Clarmann, T.: Combining and Merging Water Vapour Observations: A Multi-dimensional Perspective on Smoothing and Sampling Issues, in: Monitoring Atmospheric Water Vapour, edited by: Kämpfer, N., Springer, New York, NY, ISSI Scientific Report Series, 10, 215–242, https://doi.org/10.1007/978-1-4614-3909-7, 2013.
Lamsal, L. N., Krotkov, N. A., Celarier, E. A., Swartz, W. H., Pickering, K. E., Bucsela, E. J., Gleason, J. F., Martin, R. V., Philip, S., Irie, H., Cede, A., Herman, J., Weinheimer, A., Szykman, J. J., and Knepp, T. N.: Evaluation of OMI operational standard NO2 column retrievals using in situ and surface-based NO2 observations, Atmos. Chem. Phys., 14, 11587–11609, https://doi.org/10.5194/acp-14-11587-2014, 2014.
Laughner, J. L., Zare, A., and Cohen, R. C.: Effects of daily meteorology on the interpretation of space-based remote sensing of NO2, Atmos. Chem. Phys., 16, 15247–15264, https://doi.org/10.5194/acp-16-15247-2016, 2016.
Laughner, J. L., Zhu, Q., and Cohen, R. C.: Evaluation of version 3.0B of the BEHR OMI NO2 product, Atmos. Meas. Tech., 12, 129–146, https://doi.org/10.5194/amt-12-129-2019, 2019.
Levelt, P. F., Hilsenrath, E., Leppelmeier, G. W., van den Oord, G. B. J., Bhartia, P. K., Tamminen, J., de Haan, J. F., and Veefkind, J. P.: Science Objectives of the Ozone Monitoring Instrument, IEEE T. Geosci. Remote, 44, 1199–1208, https://doi.org/10.1109/TGRS.2006.872333, 2006.
Li, X., Brauers, T., Shao, M., Garland, R. M., Wagner, T., Deutschmann, T., and Wahner, A.: MAX-DOAS measurements in southern China: retrieval of aerosol extinctions and validation using ground-based in-situ data, Atmos. Chem. Phys., 10, 2079–2089, https://doi.org/10.5194/acp-10-2079-2010, 2010.
Lin, J.-T., Martin, R. V., Boersma, K. F., Sneep, M., Stammes, P., Spurr, R., Wang, P., Van Roozendael, M., Clémer, K., and Irie, H.: Retrieving tropospheric nitrogen dioxide from the Ozone Monitoring Instrument: effects of aerosols, surface reflectance anisotropy, and vertical profile of nitrogen dioxide, Atmos. Chem. Phys., 14, 1441–1461, https://doi.org/10.5194/acp-14-1441-2014, 2014.
Lin, J.-T., Liu, M.-Y., Xin, J.-Y., Boersma, K. F., Spurr, R., Martin, R., and Zhang, Q.: Influence of aerosols and surface reflectance on satellite NO2 retrieval: seasonal and spatial characteristics and implications for NOx emission constraints, Atmos. Chem. Phys., 15, 11217–11241, https://doi.org/10.5194/acp-15-11217-2015, 2015.
Liu, M., Lin, J., Boersma, K. F., Pinardi, G., Wang, Y., Chimot, J., Wagner, T., Xie, P., Eskes, H., Van Roozendael, M., Hendrick, F., Wang, P., Wang, T., Yan, Y., Chen, L., and Ni, R.: Improved aerosol correction for OMI tropospheric NO2 retrieval over East Asia: constraint from CALIOP aerosol vertical profile, Atmos. Meas. Tech., 12, 1–21, https://doi.org/10.5194/amt-12-1-2019, 2019a.
Liu, S., Valks, P., Pinardi, G., De Smedt, I., Yu, H., Beirle, S., and Richter, A.: An improved total and tropospheric NO2 column retrieval for GOME-2, Atmos. Meas. Tech., 12, 1029–1057, https://doi.org/10.5194/amt-12-1029-2019, 2019b.
Liu, S., Valks, P., Pinardi, G., Xu, J., Argyrouli, A., Lutz, R., Tilstra, L. G., Huijnen, V., Hendrick, F., and Van Roozendael, M.: An improved air mass factor calculation for nitrogen dioxide measurements from the Global Ozone Monitoring Experiment-2 (GOME-2), Atmos. Meas. Tech., 13, 755–787, https://doi.org/10.5194/amt-13-755-2020, 2020.
Lorente, A., Folkert Boersma, K., Yu, H., Dörner, S., Hilboll, A., Richter, A., Liu, M., Lamsal, L. N., Barkley, M., De Smedt, I., Van Roozendael, M., Wang, Y., Wagner, T., Beirle, S., Lin, J.-T., Krotkov, N., Stammes, P., Wang, P., Eskes, H. J., and Krol, M.: Structural uncertainty in air mass factor calculation for NO2 and HCHO satellite retrievals, Atmos. Meas. Tech., 10, 759–782, https://doi.org/10.5194/amt-10-759-2017, 2017.
Loughner, C. P., Tzortziou, M., Follette-Cook, M., Pickering, K. E., Goldberg, D., Satam, C., Weinheimer, A., Crawford, J. H., Knapp, D. J., Montzka, D. D., Diskin, G. S., and Dickerson, R. R.: Impact of bay-breeze circulations on surface air quality and boundary layer export, J. Appl. Meteorol. Clim., 53, 1697–1713, https://doi.org/10.1175/JAMC-D-13-0323.1, 2014.
Loyola, D. G., Gimeno García, S., Lutz, R., Argyrouli, A., Romahn, F., Spurr, R. J. D., Pedergnana, M., Doicu, A., Molina García, V., and Schüssler, O.: The operational cloud retrieval algorithms from TROPOMI on board Sentinel-5 Precursor, Atmos. Meas. Tech., 11, 409–427, https://doi.org/10.5194/amt-11-409-2018, 2018.
Ma, J. Z., Beirle, S., Jin, J. L., Shaiganfar, R., Yan, P., and Wagner, T.: Tropospheric NO2 vertical column densities over Beijing: results of the first three years of ground-based MAX-DOAS measurements (2008–2011) and satellite validation, Atmos. Chem. Phys., 13, 1547–1567, https://doi.org/10.5194/acp-13-1547-2013, 2013.
Martins, D. K., Najjar, R. G., Tzortziou, M., Abuhassan, N., Thompson, A. M., and Kollonige, D. E.: Spatial and temporal variability of ground and satellite column measurements of NO2 and O3 over the Atlantic Ocean during the Deposition of Atmospheric Nitrogen to Coastal Ecosystems Experiment, J. Geophys. Res.-Atmos., 121, 14175–14187, https://doi.org/10.1002/2016JD024998, 2016.
McLinden, C. A., Fioletov, V., Boersma, K. F., Kharol, S. K., Krotkov, N., Lamsal, L., Makar, P. A., Martin, R. V., Veefkind, J. P., and Yang, K.: Improved satellite retrievals of NO2 and SO2 over the Canadian oil sands and comparisons with surface measurements, Atmos. Chem. Phys., 14, 3637–3656, https://doi.org/10.5194/acp-14-3637-2014, 2014.
Mendolia, D., D'Souza, R. J. C., Evans, G. J., and Brook, J.: Comparison of tropospheric NO2 vertical columns in an urban environment using satellite, multi-axis differential optical absorption spectroscopy, and in situ measurements, Atmos. Meas. Tech., 6, 2907–2924, https://doi.org/10.5194/amt-6-2907-2013, 2013.
Munro, R., Lang, R., Klaes, D., Poli, G., Retscher, C., Lindstrot, R., Huckle, R., Lacan, A., Grzegorski, M., Holdak, A., Kokhanovsky, A., Livschitz, J., and Eisinger, M.: The GOME-2 instrument on the Metop series of satellites: instrument design, calibration, and level 1 data processing – an overview, Atmos. Meas. Tech., 9, 1279–1301, https://doi.org/10.5194/amt-9-1279-2016, 2016.
Niebling, S.: Messungen von Spurengasen und Aerosolen mittels Multi-Axis-DOASauf dem Hohenpeißenberg, Diploma thesis, Institut für Umweltphysik, Universität Heidelberg, Germany, 2010.
Nowlan, C. R., Liu, X., Janz, S. J., Kowalewski, M. G., Chance, K., Follette-Cook, M. B., Fried, A., González Abad, G., Herman, J. R., Judd, L. M., Kwon, H.-A., Loughner, C. P., Pickering, K. E., Richter, D., Spinei, E., Walega, J., Weibring, P., and Weinheimer, A. J.: Nitrogen dioxide and formaldehyde measurements from the GEOstationary Coastal and Air Pollution Events (GEO-CAPE) Airborne Simulator over Houston, Texas, Atmos. Meas. Tech., 11, 5941–5964, https://doi.org/10.5194/amt-11-5941-2018, 2018.
Ortega, I., Koenig, T., Sinreich, R., Thomson, D., and Volkamer, R.: The CU 2-D-MAX-DOAS instrument – Part 1: Retrieval of 3-D distributions of NO2 and azimuth-dependent OVOC ratios, Atmos. Meas. Tech., 8, 2371–2395, https://doi.org/10.5194/amt-8-2371-2015, 2015.
Peters, E., Ostendorf, M., Bösch, T., Seyler, A., Schönhardt, A., Schreier, S. F., Henzing, J. S., Wittrock, F., Richter, A., Vrekoussis, M., and Burrows, J. P.: Full-azimuthal imaging-DOAS observations of NO2 and O4 during CINDI-2, Atmos. Meas. Tech., 12, 4171–4190, https://doi.org/10.5194/amt-12-4171-2019, 2019.
Pinardi, G., Lambert, J.-C., Granville, J., Clemer, K., Delcloo, A., Hao, N., and Valks, P.: O3M SAF validation report, Tech. rep., SAF/O3M/IASB/VR/NO2/095TN-IASB-GOME2-O3MSAF-NO2-v4-2011, available at: https://cdop.aeronomie.be/ProjectDir/documents/Internal/Validation_reports/Validation_Report_NO2_MetopA_201102.pdf, (last access: 30 October 2020), 2011.
Pinardi, G., Van Roozendael, M., Abuhassan, N., Adams, C., Cede, A., Clémer, K., Fayt, C., Frieß, U., Gil, M., Herman, J., Hermans, C., Hendrick, F., Irie, H., Merlaud, A., Navarro Comas, M., Peters, E., Piters, A. J. M., Puentedura, O., Richter, A., Schönhardt, A., Shaiganfar, R., Spinei, E., Strong, K., Takashima, H., Vrekoussis, M., Wagner, T., Wittrock, F., and Yilmaz, S.: MAX-DOAS formaldehyde slant column measurements during CINDI: intercomparison and analysis improvement, Atmos. Meas. Tech., 6, 167–185, https://doi.org/10.5194/amt-6-167-2013, 2013.
Pinardi, G., Van Roozendael, M., Lambert, J.-C., Granville, J., Hendrick, F., Tack, F., Yu, H., Cede, A., Kanaya, Y., Irie, I., Goutail, F., Pommereau, J.-P., Pazmino, A., Wittrock, F., Richter, A., Wagner, T., Gu, M., Remmers, J., Frieß, U., Vlemmix, T., Piters, A., Hao, N., Tiefengraber, M., Herman, J., Abuhassan, N., Bais, A., Kouremeti, N., Hovila, J., Holla, R., Chong, J., Postylyakov, O., and Ma, J.: GOME-2 total and tropospheric NO2 validation based on zenith-sky, direct-sun and multi-axis DOAS network observations, in: Proc. of the 2014 EUMETSAT Meteorological Satellite Conference, Geneva, Swizerland, 22–26 September 2014, EUMETSAT, 2014.
Pinardi, G., Lambert, J.-C., Granville, J., Yu, H., De Smedt, I., van Roozendael, M., and Valks, P.: O3M-SAF validation report, Tech. rep., SAF/O3M/IASB/VR/NO2/TN-IASB-GOME2-O3MSAF-NO2-2015, 1/1, BIRA-IASB, available at: https://cdop.aeronomie.be/ProjectDir/documents/ValidationReports/Validation_Report_NO2_ORR_GDP4.8reprocessing_Dec2015.pdf (last access: 30 October 2020), 2015.
Piters, A. J. M., Boersma, K. F., Kroon, M., Hains, J. C., Van Roozendael, M., Wittrock, F., Abuhassan, N., Adams, C., Akrami, M., Allaart, M. A. F., Apituley, A., Beirle, S., Bergwerff, J. B., Berkhout, A. J. C., Brunner, D., Cede, A., Chong, J., Clémer, K., Fayt, C., Frieß, U., Gast, L. F. L., Gil-Ojeda, M., Goutail, F., Graves, R., Griesfeller, A., Großmann, K., Hemerijckx, G., Hendrick, F., Henzing, B., Herman, J., Hermans, C., Hoexum, M., van der Hoff, G. R., Irie, H., Johnston, P. V., Kanaya, Y., Kim, Y. J., Klein Baltink, H., Kreher, K., de Leeuw, G., Leigh, R., Merlaud, A., Moerman, M. M., Monks, P. S., Mount, G. H., Navarro-Comas, M., Oetjen, H., Pazmino, A., Perez-Camacho, M., Peters, E., du Piesanie, A., Pinardi, G., Puentedura, O., Richter, A., Roscoe, H. K., Schönhardt, A., Schwarzenbach, B., Shaiganfar, R., Sluis, W., Spinei, E., Stolk, A. P., Strong, K., Swart, D. P. J., Takashima, H., Vlemmix, T., Vrekoussis, M., Wagner, T., Whyte, C., Wilson, K. M., Yela, M., Yilmaz, S., Zieger, P., and Zhou, Y.: The Cabauw Intercomparison campaign for Nitrogen Dioxide measuring Instruments (CINDI): design, execution, and early results, Atmos. Meas. Tech., 5, 457–485, https://doi.org/10.5194/amt-5-457-2012, 2012.
Platt, U. and Stutz, J.: Differential Optical Absorption Spectroscopy, Springer, Berlin, Heidelberg, 2008.
Richter, A., Begoin, M., Hilboll, A., and Burrows, J. P.: An improved NO2 retrieval for the GOME-2 satellite instrument, Atmos. Meas. Tech., 4, 1147–1159, https://doi.org/10.5194/amt-4-1147-2011, 2011.
Richter, A., Weber, M., Burrows, J. P., Lambert, J. C., and Van Gijsel, A.: Validation strategy for satellite observations of tropospheric reactive gases, Ann. Geophys., 56, 1–10, https://doi.org/10.4401/AG-6335, 2013.
Rodgers, C. D.: Inverse Methods for Atmospheric Sounding: Theory and Practice, World Sci., Singapore, 2000.
Russell, A. R., Perring, A. E., Valin, L. C., Bucsela, E. J., Browne, E. C., Wooldridge, P. J., and Cohen, R. C.: A high spatial resolution retrieval of NO2 column densities from OMI: method and evaluation, Atmos. Chem. Phys., 11, 8543–8554, https://doi.org/10.5194/acp-11-8543-2011, 2011.
Schenkeveld, V. M. E., Jaross, G., Marchenko, S., Haffner, D., Kleipool, Q. L., Rozemeijer, N. C., Veefkind, J. P., and Levelt, P. F.: In-flight performance of the Ozone Monitoring Instrument, Atmos. Meas. Tech., 10, 1957–1986, https://doi.org/10.5194/amt-10-1957-2017, 2017.
Schreier, S. F., Richter, A., and Burrows, J. P.: Near-surface and path-averaged mixing ratios of NO2 derived from car DOAS zenith-sky and tower DOAS off-axis measurements in Vienna: a case study, Atmos. Chem. Phys., 19, 5853–5879, https://doi.org/10.5194/acp-19-5853-2019, 2019.
Shaiganfar, R., Beirle, S., Sharma, M., Chauhan, A., Singh, R. P., and Wagner, T.: Estimation of NOx emissions from Delhi using Car MAX-DOAS observations and comparison with OMI satellite data, Atmos. Chem. Phys., 11, 10871–10887, https://doi.org/10.5194/acp-11-10871-2011, 2011.
Sihler, H., Lübcke, P., Lang, R., Beirle, S., de Graaf, M., Hörmann, C., Lampel, J., Penning de Vries, M., Remmers, J., Trollope, E., Wang, Y., and Wagner, T.: In-operation field-of-view retrieval (IFR) for satellite and ground-based DOAS-type instruments applying coincident high-resolution imager data, Atmos. Meas. Tech., 10, 881–903, https://doi.org/10.5194/amt-10-881-2017, 2017.
Silvern, R. F., Jacob, D. J., Mickley, L. J., Sulprizio, M. P., Travis, K. R., Marais, E. A., Cohen, R. C., Laughner, J. L., Choi, S., Joiner, J., and Lamsal, L. N.: Using satellite observations of tropospheric NO2 columns to infer long-term trends in US NOx emissions: the importance of accounting for the free tropospheric NO2 background, Atmos. Chem. Phys., 19, 8863–8878, https://doi.org/10.5194/acp-19-8863-2019, 2019.
Sinreich, R., Frieß, U., and Platt, U.: Multi axis differential optical absorption spectroscopy (MAX-DOAS) of gas and aerosol distributions, Faraday Discuss., 130, 153–164, https://doi.org/10.1039/b419274p, 2005.
Sinreich, R., Volkamer, R., Filsinger, F., Frieß, U., Kern, C., Platt, U., Sebastián, O., and Wagner, T.: MAX-DOAS detection of glyoxal during ICARTT 2004, Atmos. Chem. Phys., 7, 1293–1303, https://doi.org/10.5194/acp-7-1293-2007, 2007.
Spinei, E., Cede, A., Swartz, W. H., Herman, J., and Mount, G. H.: The use of NO2 absorption cross section temperature sensitivity to derive NO2 profile temperature and stratospheric–tropospheric column partitioning from visible direct-sun DOAS measurements, Atmos. Meas. Tech., 7, 4299–4316, https://doi.org/10.5194/amt-7-4299-2014, 2014.
Spinei, E., Whitehill, A., Fried, A., Tiefengraber, M., Knepp, T. N., Herndon, S., Herman, J. R., Müller, M., Abuhassan, N., Cede, A., Richter, D., Walega, J., Crawford, J., Szykman, J., Valin, L., Williams, D. J., Long, R., Swap, R. J., Lee, Y., Nowak, N., and Poche, B.: The first evaluation of formaldehyde column observations by improved Pandora spectrometers during the KORUS-AQ field study, Atmos. Meas. Tech., 11, 4943–4961, https://doi.org/10.5194/amt-11-4943-2018, 2018.
Stammes, P., Sneep, M., de Haan, J. F., Veefkind, J. P., Wang, P., and Levelt, P. F.: Effective cloud fractions from the Ozone Monitoring Instrument: Theoretical framework and validation, J. Geophys. Res., 113, D16S38, https://doi.org/10.1029/2007JD008820, 2008.
Theys, N., Van Roozendael, M., Hendrick, F., Fayt, C., Hermans, C., Baray, J.-L., Goutail, F., Pommereau, J.-P., and De Mazière, M.: Retrieval of stratospheric and tropospheric BrO columns from multi-axis DOAS measurements at Reunion Island (21∘ S, 56∘ E), Atmos. Chem. Phys., 7, 4733–4749, https://doi.org/10.5194/acp-7-4733-2007, 2007.
Tilstra, L. G., Tuinder, O. N. E., Wang, P., and Stammes, P.: Surface reflectivity climatologies from UV to NIR determined from Earth observations by GOME‐2 and SCIAMACHY, J. Geophys. Res.-Atmos., 122, 4084–4111, https://doi.org/10.1002/2016JD025940, 2017.
Tirpitz, J.-L., Frieß, U., Hendrick, F., Alberti, C., Allaart, M., Apituley, A., Bais, A., Beirle, S., Berkhout, S., Bognar, K., Bösch, T., Bruchkouski, I., Cede, A., Chan, K. L., den Hoed, M., Donner, S., Drosoglou, T., Fayt, C., Friedrich, M. M., Frumau, A., Gast, L., Gielen, C., Gomez-Martín, L., Hao, N., Hensen, A., Henzing, B., Hermans, C., Jin, J., Kreher, K., Kuhn, J., Lampel, J., Li, A., Liu, C., Liu, H., Ma, J., Merlaud, A., Peters, E., Pinardi, G., Piters, A., Platt, U., Puentedura, O., Richter, A., Schmitt, S., Spinei, E., Stein Zweers, D., Strong, K., Swart, D., Tack, F., Tiefengraber, M., van der Hoff, R., van Roozendael, M., Vlemmix, T., Vonk, J., Wagner, T., Wang, Y., Wang, Z., Wenig, M., Wiegner, M., Wittrock, F., Xie, P., Xing, C., Xu, J., Yela, M., Zhang, C., and Zhao, X.: Intercomparison of MAX-DOAS vertical profile retrieval algorithms: studies on field data from the CINDI-2 campaign, Atmos. Meas. Tech. Discuss., https://doi.org/10.5194/amt-2019-456, in review, 2020.
Tzortziou, M., Herman, J. R., Ahmad, Z., Loughner, C. P., Abuhassan, N., and Cede, A.: Atmospheric NO2 dynamics and impact on ocean color retrievals in urban nearshore regions, J. Geophys. Res.-Oceans, 119, 3834–3854, https://doi.org/10.1002/2014JC009803, 2014.
Tzortziou, M., Herman, J. R., Cede, A., Loughner, C. P., Abuhassan, N., and Naik, S.: Spatial and temporal variability of ozone and nitrogen dioxide over a major urban estuarine ecosystem, J. Atmos. Chem., 72, 287–309, https://doi.org/10.1007/s10874-013-9255-8, 2015.
Tzortziou, M., Parker, O., Lamb, B., Herman, J. R., Lamsal, L., Stauffer, R., and Abuhassan, N.: Atmospheric trace has (NO2 and O3) variability in South Korean coastal waters, and implications for remote sensing of coastal ocean color dynamics, Remote Sens., 10, 1587, https://doi.org/10.3390/rs10101587, 2018.
Valks, P., Pinardi, G., Richter, A., Lambert, J.-C., Hao, N., Loyola, D., Van Roozendael, M., and Emmadi, S.: Operational total and tropospheric NO2 column retrieval for GOME-2, Atmos. Meas. Tech., 4, 1491–1514, https://doi.org/10.5194/amt-4-1491-2011, 2011.
Valks, P., Loyola, D., Hao, N., Hedelt, P., Slijkhuis, S., Grossi, M., Begoin, M., Gimeno Garcia, S., and Lutz, R.: Algorithm Theoretical Basis Document for GOME-2 Total Column Products of Ozone, NO2, BrO, SO2, H2O, HCHO and Cloud Properties (GDP 4.8 for AC SAF OTO and NTO), DLR, Tech. rep., SAF/AC/DLR/ATBD/01, Iss./Rev.: 3/A/2, available at: https://acsaf.org/atbds.html (last access: 30 October 2019), 2017.
van Geffen, J. H. G. M., Boersma, K. F., Van Roozendael, M., Hendrick, F., Mahieu, E., De Smedt, I., Sneep, M., and Veefkind, J. P.: Improved spectral fitting of nitrogen dioxide from OMI in the 405–465 nm window, Atmos. Meas. Tech., 8, 1685–1699, https://doi.org/10.5194/amt-8-1685-2015, 2015.
van Noije, T. P. C., Eskes, H. J., Dentener, F. J., Stevenson, D. S., Ellingsen, K., Schultz, M. G., Wild, O., Amann, M., Atherton, C. S., Bergmann, D. J., Bey, I., Boersma, K. F., Butler, T., Cofala, J., Drevet, J., Fiore, A. M., Gauss, M., Hauglustaine, D. A., Horowitz, L. W., Isaksen, I. S. A., Krol, M. C., Lamarque, J.-F., Lawrence, M. G., Martin, R. V., Montanaro, V., Müller, J.-F., Pitari, G., Prather, M. J., Pyle, J. A., Richter, A., Rodriguez, J. M., Savage, N. H., Strahan, S. E., Sudo, K., Szopa, S., and van Roozendael, M.: Multi-model ensemble simulations of tropospheric NO2 compared with GOME retrievals for the year 2000, Atmos. Chem. Phys., 6, 2943–2979, https://doi.org/10.5194/acp-6-2943-2006, 2006.
Veefkind, J. P., Aben, I., McMullan, K., Förster, H., de Vries, M., Otter, G., Claas, J., Eskes, H. J., de Haan, J. F., Kleipool, Q. L., van Weele, M., Hasekamp, O., Hoogeveen, R., Landgraf, J., Snel, R., Tol, P., Ingmann, P., Voors, R., Kruizinga, B., Vink, R., Visser, H., Levelt, P. F., and de Vries, J.: TROPOMI on the ESA Sentinel-5 Precursor: A GMES mission for global observations of the atmospheric composition for climate, air quality and ozone layer applications, Remote Sens. Environ., 120, 70–83, 2012.
Veefkind, J. P., de Haan, J. F., Sneep, M., and Levelt, P. F.: Improvements to the OMI O2−O2 operational cloud algorithm and comparisons with ground-based radar–lidar observations, Atmos. Meas. Tech., 9, 6035–6049, https://doi.org/10.5194/amt-9-6035-2016, 2016.
Veihelmann, B., Al-Saadi, J., Cede, A., Chance, K., Flynn, L. E., Kim, J., Kim, S.-W., Koopman, R., Lambert, J.-C., Lindstrot, R., Loyola, D., Munro, R., Van Roozendael, M., Wang, J., and Yoon, J.: Geostationary Satellite Constellation for Observing Global Air Quality: Geophysical Validation Needs, CEOS Atmospheric Composition Virtual Constellation (AC-VC) and CEOS Working Group on Calibration and Validation (WGCV), white paper, Version 1.1, 47 pp., available at: http://ceos.org (last access: 29 October 2020), 2019.
Verhoelst, T., Granville, J., Hendrick, F., Köhler, U., Lerot, C., Pommereau, J.-P., Redondas, A., Van Roozendael, M., and Lambert, J.-C.: Metrology of ground-based satellite validation: co-location mismatch and smoothing issues of total ozone comparisons, Atmos. Meas. Tech., 8, 5039–5062, https://doi.org/10.5194/amt-8-5039-2015, 2015.
Vlemmix, T., Piters, A. J. M., Stammes, P., Wang, P., and Levelt, P. F.: Retrieval of tropospheric NO2 using the MAX-DOAS method combined with relative intensity measurements for aerosol correction, Atmos. Meas. Tech., 3, 1287–1305, https://doi.org/10.5194/amt-3-1287-2010, 2010.
Vlemmix, T., Hendrick, F., Pinardi, G., De Smedt, I., Fayt, C., Hermans, C., Piters, A., Wang, P., Levelt, P., and Van Roozendael, M.: MAX-DOAS observations of aerosols, formaldehyde and nitrogen dioxide in the Beijing area: comparison of two profile retrieval approaches, Atmos. Meas. Tech., 8, 941–963, https://doi.org/10.5194/amt-8-941-2015, 2015.
Wagner, T., Dix, B., Friedeburg, C. Von, Frieß, U., Sanghavi, S., Sinreich, R., and Platt, U.: MAX-DOAS O4 measurements: a new technique to derive information on atmospheric aerosols – Principles and information content, J. Geophys. Res., 109, D22205, https://doi.org/10.1029/2004JD004904, 2004.
Wagner, T., Beirle, S., Brauers, T., Deutschmann, T., Frieß, U., Hak, C., Halla, J. D., Heue, K. P., Junkermann, W., Li, X., Platt, U., and Pundt-Gruber, I.: Inversion of tropospheric profiles of aerosol extinction and HCHO and NO2 mixing ratios from MAX-DOAS observations in Milano during the summer of 2003 and comparison with independent data sets, Atmos. Meas. Tech., 4, 2685–2715, https://doi.org/10.5194/amt-4-2685-2011, 2011.
Wang, P., Stammes, P., van der A, R., Pinardi, G., and van Roozendael, M.: FRESCO+: an improved O2 A-band cloud retrieval algorithm for tropospheric trace gas retrievals, Atmos. Chem. Phys., 8, 6565–6576, https://doi.org/10.5194/acp-8-6565-2008, 2008.
Wang, S., Pongetti, T. J., Sander, S. P., Spinei, E., Mount, G. H., Cede, A., and Herman, J.: Direct Sun measurements of NO2 column abundances from Table Mountain, California: Intercomparison of low- and high-resolution spectrometers, J. Geophys. Res., 115, D13305, https://doi.org/10.1029/2009JD013503, 2010.
Wang, Y., Li, A., Xie, P. H., Wagner, T., Chen, H., Liu, W. Q., and Liu, J. G.: A rapid method to derive horizontal distributions of trace gases and aerosols near the surface using multi-axis differential optical absorption spectroscopy, Atmos. Meas. Tech., 7, 1663–1680, https://doi.org/10.5194/amt-7-1663-2014, 2014.
Wang, Y., Beirle, S., Lampel, J., Koukouli, M., De Smedt, I., Theys, N., Li, A., Wu, D., Xie, P., Liu, C., Van Roozendael, M., Stavrakou, T., Müller, J.-F., and Wagner, T.: Validation of OMI, GOME-2A and GOME-2B tropospheric NO2, SO2 and HCHO products using MAX-DOAS observations from 2011 to 2014 in Wuxi, China: investigation of the effects of priori profiles and aerosols on the satellite products, Atmos. Chem. Phys., 17, 5007–5033, https://doi.org/10.5194/acp-17-5007-2017, 2017.
Wenig, M. O., Cede, A. M., Bucsela, E. J., Celarier, E. A., Boersma, K. F., Veefkind, J. P., Brinksma, E. J., Gleason, J. F., and Herman, J. R.: Validation of OMI tropospheric NO2 column densities using direct sun mode Brewer measurements at NASA Goddard Space Flight Center, J. Geophys. Res., 113, D16S45, https://doi.org/10.1029/2007JD008988, 2008.
Williams, J. E., Boersma, K. F., Le Sager, P., and Verstraeten, W. W.: The high-resolution version of TM5-MP for optimized satellite retrievals: description and validation, Geosci. Model Dev., 10, 721–750, https://doi.org/10.5194/gmd-10-721-2017, 2017.
Wittrock, F., Oetjen, H., Richter, A., Fietkau, S., Medeke, T., Rozanov, A., and Burrows, J. P.: MAX-DOAS measurements of atmospheric trace gases in Ny-Ålesund – Radiative transfer studies and their application, Atmos. Chem. Phys., 4, 955–966, https://doi.org/10.5194/acp-4-955-2004, 2004.
Wu, F. C., Xie, P. H., Li, A., Chan, K. L., Hartl, A., Wang, Y., Si, F. Q., Zeng, Y., Qin, M., Xu, J., Liu, J. G., Liu, W. Q., and Wenig, M.: Observations of SO2 and NO2 by mobile DOAS in the Guangzhou eastern area during the Asian Games 2010, Atmos. Meas. Tech., 6, 2277–2292, https://doi.org/10.5194/amt-6-2277-2013, 2013.
Yilmaz, S.: Retrieval of Atmospheric Aerosol and Trace Gas Vertical Profiles using Multi-Axis Differential Optical Absorption Spectroscopy, PhD thesis, University of Heidelberg, Heidelberg, Germany, 2012.
Zara, M., Boersma, K. F., De Smedt, I., Richter, A., Peters, E., van Geffen, J. H. G. M., Beirle, S., Wagner, T., Van Roozendael, M., Marchenko, S., Lamsal, L. N., and Eskes, H. J.: Improved slant column density retrieval of nitrogen dioxide and formaldehyde for OMI and GOME-2A from QA4ECV: intercomparison, uncertainty characterisation, and trends, Atmos. Meas. Tech., 11, 4033–4058, https://doi.org/10.5194/amt-11-4033-2018, 2018.
- Abstract
- Introduction
- Satellite tropospheric NO2 datasets
- Ground-based datasets: MAX-DOAS and direct sun measurements
- Comparison method
- Results
- Horizontal dilution effects
- Overall validation results
- Conclusions
- Code and data availability
- Author contributions
- Competing interests
- Acknowledgements
- Financial support
- Review statement
- References
- Supplement