the Creative Commons Attribution 4.0 License.
the Creative Commons Attribution 4.0 License.
 | 25 Nov 2020
An interlaboratory comparison of aerosol inorganic ion measurements by ion chromatography: implications for aerosol pH estimate
Jingsha Xu
Shaojie Song
Roy M. Harrison
Congbo Song
Lianfang Wei
Qiang Zhang
Lu Lei
Chao Zhang
Xiaohong Yao
Dihui Chen
Weijun Li
Miaomiao Wu
Hezhong Tian
Lining Luo
Shengrui Tong
Weiran Li
Junling Wang
Guoliang Shi
Yanqi Huangfu
Yingze Tian
Baozhu Ge
Shaoli Su
Chao Peng
Yang Chen
Fumo Yang
Aleksandra Mihajlidi-Zelić
Dragana Đorđević
Stefan J. Swift
Imogen Andrews
Jacqueline F. Hamilton
Ye Sun
Agung Kramawijaya
Jinxiu Han
Supattarachai Saksakulkrai
Clarissa Baldo
Siqi Hou
Feixue Zheng
Kaspar R. Daellenbach
Yongchun Liu
Markku Kulmala
Pingqing Fu
Water-soluble inorganic ions such as ammonium, nitrate and sulfate are major components of fine aerosols in the atmosphere and are widely used in the estimation of aerosol acidity. However, different experimental practices and instrumentation may lead to uncertainties in ion concentrations. Here, an intercomparison experiment was conducted in 10 different laboratories (labs) to investigate the consistency of inorganic ion concentrations and resultant aerosol acidity estimates using the same set of aerosol filter samples. The results mostly exhibited good agreement for major ions Cl−, SO, NO, NH and K+. However, F−, Mg2+ and Ca2+ were observed with more variations across the different labs. The Aerosol Chemical Speciation Monitor (ACSM) data of nonrefractory SO, NO and NH generally correlated very well with the filter-analysis-based data in our study, but the absolute concentrations differ by up to 42 %. Cl− from the two methods are correlated, but the concentration differ by more than a factor of 3. The analyses of certified reference materials (CRMs) generally showed a good detection accuracy (DA) of all ions in all the labs, the majority of which ranged between 90 % and 110 %. The DA was also used to correct the ion concentrations to showcase the importance of using CRMs for calibration check and quality control. Better agreements were found for Cl−, SO, NO, NH and K+ across the labs after their concentrations were corrected with DA; the coefficient of variation (CV) of Cl−, SO, NO, NH and K+ decreased by 1.7 %, 3.4 %, 3.4 %, 1.2 % and 2.6 %, respectively, after DA correction. We found that the ratio of anion to cation equivalent concentrations (AE / CE) and ion balance (anions–cations) are not good indicators for aerosol acidity estimates, as the results in different labs did not agree well with each other. In situ aerosol pH calculated from the ISORROPIA II thermodynamic equilibrium model with measured ion and ammonia concentrations showed a similar trend and good agreement across the 10 labs. Our results indicate that although there are important uncertainties in aerosol ion concentration measurements, the estimated aerosol pH from the ISORROPIA II model is more consistent.
- Article
(2309 KB) - Full-text XML
-
Supplement
(797 KB) - BibTeX
- EndNote


Water-soluble inorganic ions (WSIIs), including F−, Cl−, NO, NO, SO, NH, Na+, K+, Mg2+ and Ca2+, are a major component of atmospheric aerosols and can contribute up to 77 % of PM2.5 (particulate matter with aerodynamic diameter ≤ 2.5 µm) mass (Xu et al., 2019a). Secondary inorganic aerosols (SIAs) including sulfate, nitrate and ammonium (SNA) often dominate water-soluble ionic species in PM2.5 and were reported to account for more than 90 % of WSIIs in Sichuan, China (Tian et al., 2017). In Beijing, the average SNA concentrations can range from 4.2 ± 2.9 µg/m3 on nonhaze days to 85.9 ± 22.4 µg/m3 on heavily polluted days, and contribute 15 %–49 % of PM2.5 (Li et al., 2016). SNA can greatly influence air pollution, visibility, aerosol acidity and hygroscopicity, which are driving factors affecting aerosol-phase pH and chemistry and the uptake of gaseous species by particles (Shon et al., 2012; Xue et al., 2011; Zhang et al., 2019). Hence, the study of WSIIs is of great interest.
WSIIs in aerosols were reported to be analyzed by multiple techniques such as Cl− by spectrophotometry and Ca2+ and Mg2+ by flame atomic absorption in the early 1980s (Harrison and Pio, 1983). However, previous methods were time-consuming as WSIIs were analyzed by different techniques separately. Ion chromatography (IC), which was first introduced in 1975 (Buchberger, 2001), was applied in many studies for routine measurement of atmospheric WSIIs due to its fast, accurate and sensitive determination in a single run (Heckenberg and Haddad, 1984; Baltensperger and Hertz, 1985). IC can be coupled with diverse detection techniques for ion analysis, such as suppressed conductivity, ultraviolet–visible spectrophotometry (UV–VIS) absorbance, amperometry, potentiometry and mass spectrometry (Buchberger, 2001). It has been used in various atmospheric studies for many years and is still widely applied at present, such as in the investigation of WSIIs in size-segregated aerosols (Li et al., 2013; Zhao et al., 2011; Ðorðeviæ et al., 2012), fine aerosols (Fan et al., 2017; He et al., 2017; Liu et al., 2017a) and coarse aerosols (Li et al., 2014; Guo et al., 2011; Mkoma et al., 2009). IC can also be used for the determination of both water-soluble organic and water-soluble inorganic ions (Yu et al., 2004; Karthikeyan and Balasubramanian, 2006).
Aerosol ion concentrations can also be measured by online methods such as with the Aerosol Chemical Speciation Monitor (ACSM) or an aerosol mass spectrometer (AMS; Ng et al., 2011; Sun et al., 2012). During the recent Atmospheric Pollution and Human Health in a Chinese Megacity (APHH-China) campaigns (Shi et al., 2019), we observed important discrepancies between offline aerosol IC observations from different labs and between online AMS and offline IC methods. This prompted us to carry out this intercomparison exercise.
The IC method had been validated by a common reference standard – NIST SRM 1648 (urban particulate matter) – and the results for Na, K, S and NH were compared with those from other suitable alternative analytical techniques such as atomic absorption spectroscopy (AAS), UV–VIS and particle-induced X-ray emission (PIXE) in previous studies (Karthikeyan and Balasubramanian, 2006). However, to the best of our knowledge, no investigation has been conducted to compare the results of different laboratories (labs) for such an important and widely used technique.
The aim of this work is to (1) examine the consistency of ion concentrations measured by various labs and by ACSM, (2) explore the impact of the interlaboratory variability in ion concentration measurements on aerosol acidity estimates, and (3) provide recommendations for improving future WSII analysis by IC.
2.1 Participating laboratories
Ten laboratories from China, the United Kingdom and Serbia were invited to take part in the interlaboratory comparison of atmospheric inorganic ions and are listed as follows: the University of Birmingham; the University of York; the University of Belgrade; Zhejiang University; Nankai University; Ocean University of China; Beijing Normal University; the Chongqing Institute of Green and Intelligent Technology, Chinese Academy of Sciences; the Institute of Chemistry, Chinese Academy of Sciences; and the Institute of Atmospheric Physics, Chinese Academy of Sciences. The participating laboratories were randomly coded from Lab-1 to Lab-10, not related to the above order.
2.2 Sample and data collection
Eight daily PM2.5 samples were collected on quartz filters (total area 406.5 cm2) from 16 to 23 January 2019 by a high-volume air sampler (1.13 m3/min; Tisch Environmental Inc., USA) at an urban site, located at the Institute of Atmospheric Physics (IAP) of the Chinese Academy of Sciences in Beijing, China. The sampling site (39.98∘ N, 116.39∘ E) is located between the North 3rd Ring Road and North 4th Ring Road and approximately 200 m from the G6 highway. It is 8 m above the ground and surrounded by high-density roads and buildings; detailed information regarding the sampling site can be found elsewhere (Shi et al., 2019). Apart from the aerosol samples, five field blank filters were also collected in the same manner with the pump off. All ion concentrations in this study were corrected by the values obtained from field blanks. Hourly PM2.5 mass concentrations were obtained from a nearby Olympic Park station available via the national monitoring network operated by the China National Environmental Monitoring Center (CNEMC). Shi et al. (2019) showed that the PM2.5 data at this station are close to those observed at IAP during the APHH-China campaigns. The close observed PM2.5 concentrations at different air quality stations in Beijing provide further reassurance of the representability of the observed concentration at the Olympic Park station. The original hourly data were averaged to 24 h for comparison.
An Aerodyne time-of-flight aerosol chemical speciation monitor (ToF-ACSM) with a PM2.5 aerodynamic lens was also deployed on the same roof of the building at IAP for real-time measurements of nonrefractory (NR) chemical species (organics, Cl−, NO, SO and NH in PM2.5 (NR-PM2.5) with a 2 min time resolution (Sun et al., 2020). Another ToF-ACSM was also used to measure the PM2.5-associated nonrefractory chemical species at the Beijing University of Chemical Technology (BUCT), which is located at the West 3rd Ring Road of Beijing and approximately 10 km away from the sampling location of IAP. The collection efficiencies (CEs) applied for the ACSM at IAP and BUCT were different. For IAP, a capture vaporizer was used, and the CE was assumed to be close to 1 (Sun et al., 2020). For BUCT, a standard vaporizer was applied with a composition- and acidity-dependent CE calculated according to Middlebrook et al. (2012). Details regarding quality control of the ACSM at IAP and BUCT can be found elsewhere (Sun et al., 2020; Liu et al., 2020). The concentrations of nonrefractory species were calculated from mass spectra using a fragmentation table (Allan et al., 2004). The ToF-ACSM data were then averaged to 24h for a comparison with those from filter analysis in our study. Note that the ToF-ACSM data at IAP on 19 and 20 January and data at BUCT on 17 and 18 January are excluded from the comparison due to the maintenance of the instrument. An ammonia analyzer (DLT-100, Los Gatos Research, USA) which applies a unique laser absorption technology called off-axis integrated-cavity-output spectroscopy was used for the ambient NH3 measurements. It has a precision of 0.2 ppb, and the original data with 5 min intervals were averaged to 24 h for the calculation of aerosol pH. More information on NH3 measurement can be found elsewhere (Ge et al., 2019).
2.3 Sample analysis
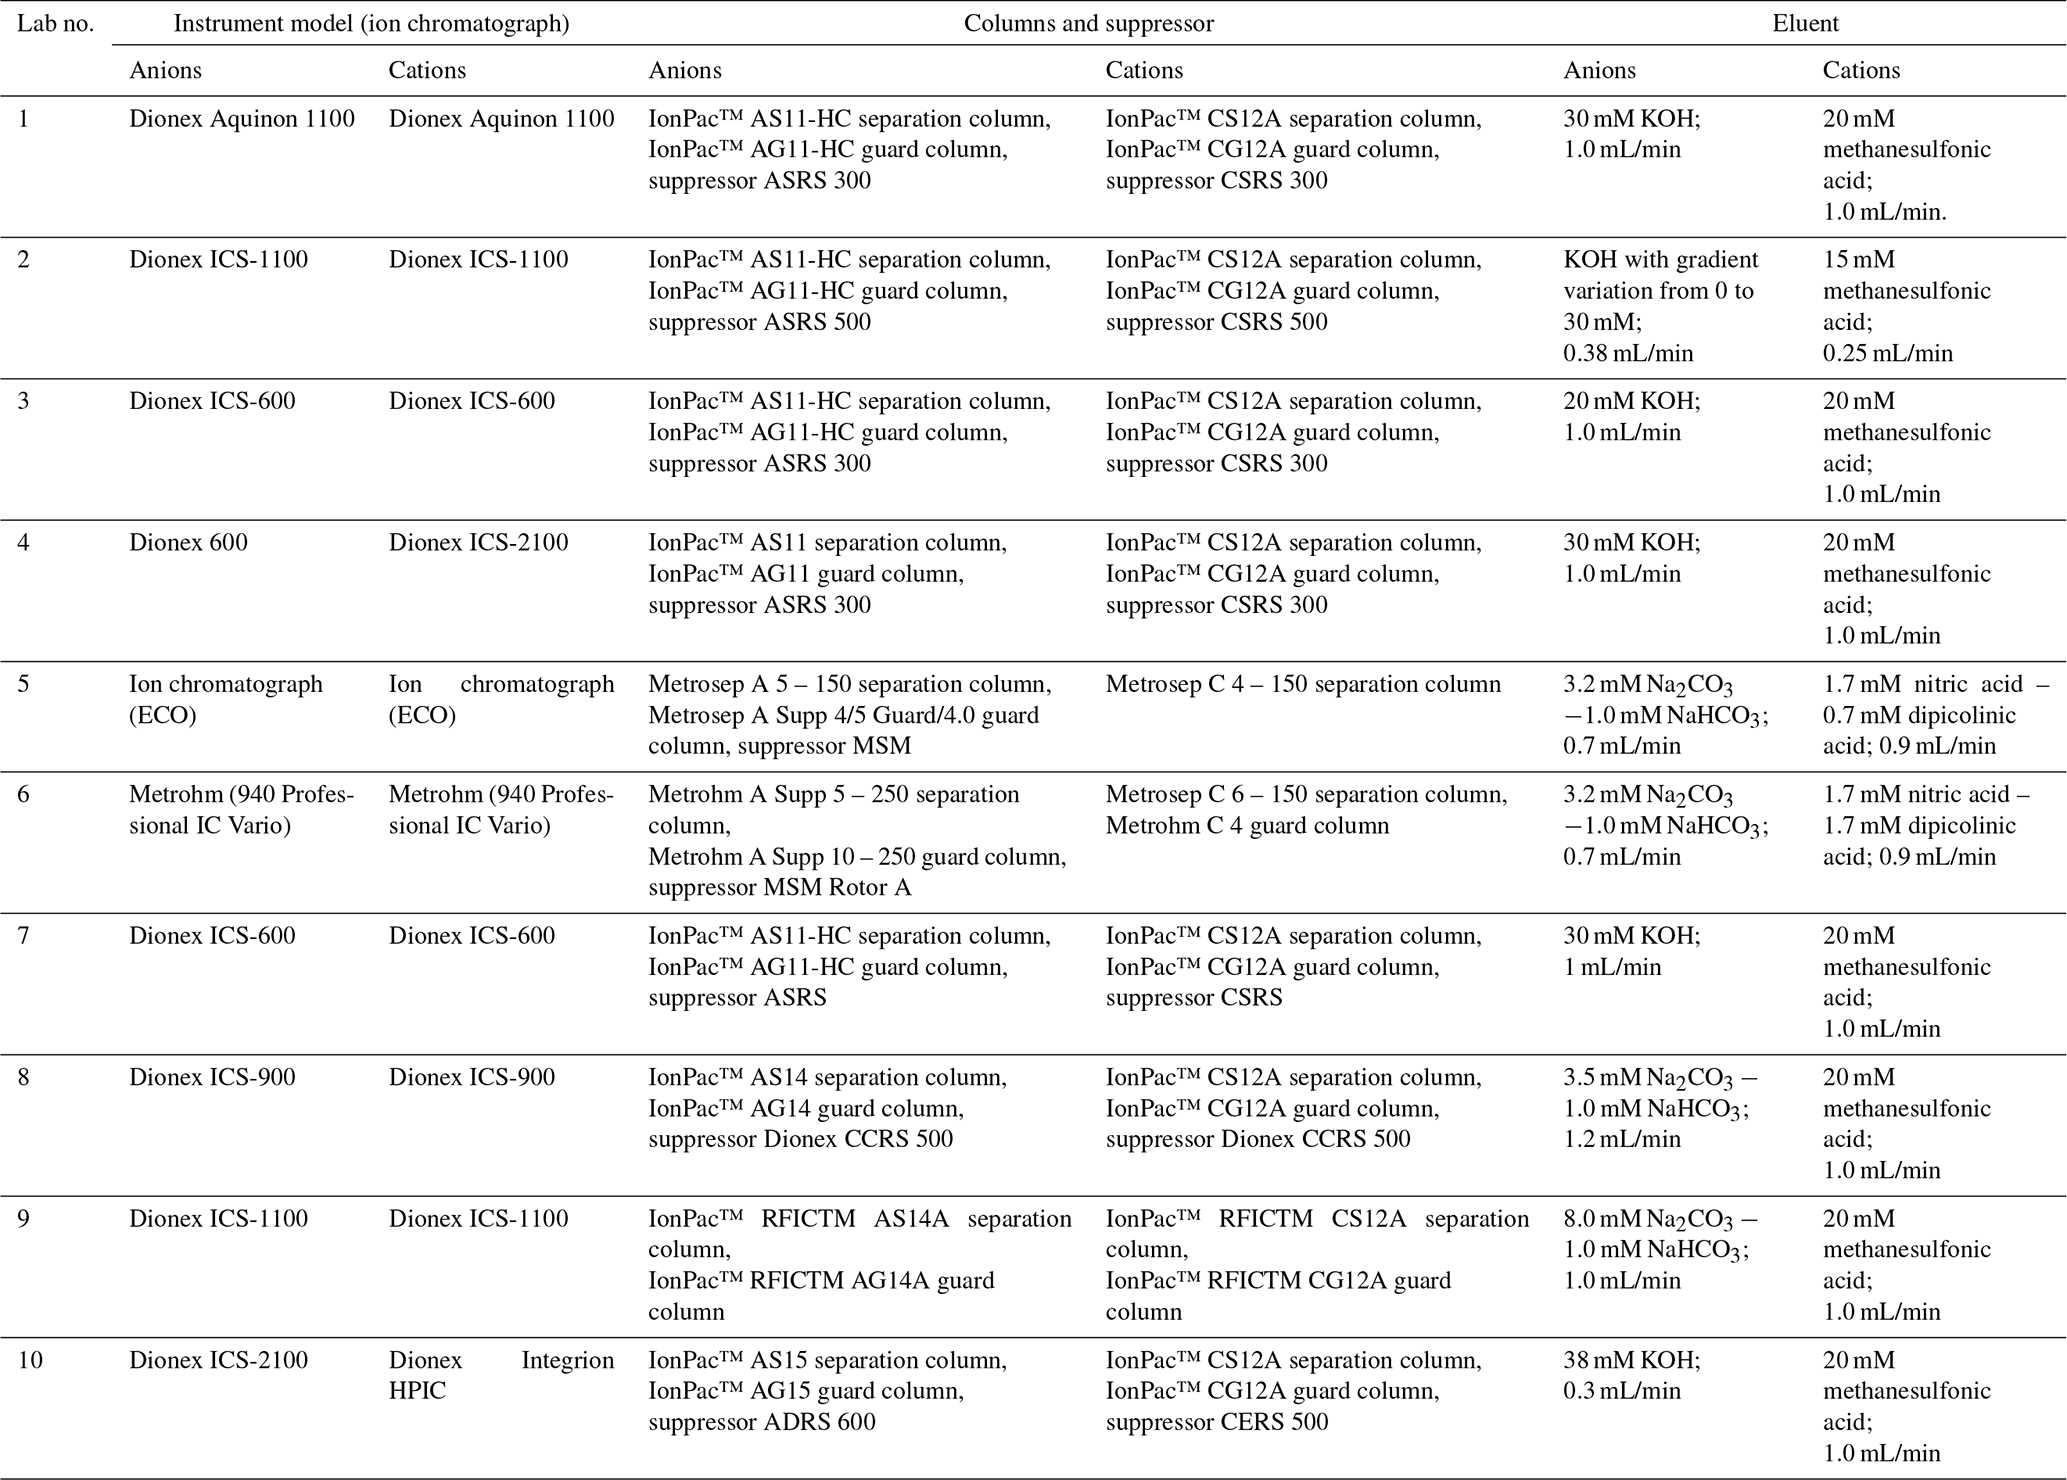
Filter cuts of 5 and 6 cm2 from the same set of samples were used for extraction in the 10 labs. Filters were extracted ultrasonically for 30 min with 10 mL ultrapure water in all laboratories and then filtered before IC analysis. The instrument details are given in Table 1, and the extraction details including the purity of ultrapure water, model and power of ultrasonicator, and type of syringe filter and vials used for analysis are provided in Table S1 in the Supplement. In total, nine ionic species were reported: F−, Cl−, SO, NO, Na+, NH, K+, Mg2+ and Ca2+. Other ions including Br−, NO, PO and Li+ were not included due to their relatively low concentrations in aerosol samples. The calibration detail and quality assurance and quality control (QA–QC) procedures are provided in Table S2.
Certified reference materials (CRMs) were also determined for quality control. The CRM for cations (CRM-C, Multi Cation Standard 1 for IC, Sigma-Aldrich) contains 200 mg/L Na+, 200 mg/L K+, 50 mg/L Li+, 200 mg/L Mg2+, 1000 mg/L Ca2+ and 400 mg/L NH. The CRM for anion (CRM-A, Multi Anion Standard 1 for IC, Sigma-Aldrich) contains 3 mg/L F−, 10 mg/L Cl−, 20 mg/L Br−, 20 mg/L NO, 20 mg/L SO and 30 mg/L PO. CRM-C and CRM-A were diluted 180 and 6 times, respectively. Of the diluted CRM solutions, 20 mL was marked as unknown solution and sent along with the aerosol samples to each lab for analysis. All CRM solutions were measured by each lab as unknown samples. All filters and solutions were kept frozen during transportation to prevent any loss due to volatilization.
Table 1Summary of instrument and method details in the 10 laboratories.
2.4 Coefficient of divergence analysis
In order to investigate the differences in ionic concentrations measured by different labs, Pearson's correlation coefficient (R) and the coefficient of divergence (COD) were calculated. The COD is a parameter to evaluate the degree of uniformity or divergence of two datasets. The COD and R were computed for Labj–Lab-Median pairs, in which Labj indicates the results of each lab and Lab-Median represents the median values of the 10 labs. Median values are chosen here to better represent the theoretical true concentrations of the ions, as there are some outliers in some labs, and the averages may be less representative. The results of COD and R were also computed for Labj–Lab-Mean, Labj–Lab-Upper and Labj–Lab-Lower pairs (Figs. S1–S3 in the Supplement), where Lab-Mean, Lab-Upper and Lab-Lower represent the mean value, upper values (84th percentile) and lower values (16th percentile) of ion concentrations measured by the 10 labs. The COD of ionic concentrations of two datasets is determined as follows:
where j represents the ion concentrations measured by an individual lab, k stands for the median ion concentrations of the 10 labs and P is the number of samples. Xij and Xik represent the concentration of ion i measured by Labj and the median concentration of ion i measured by the 10 labs, respectively. A COD value equal to 0 implies no difference between two datasets, while a COD of 1 means absolute heterogeneity and maximum difference between two datasets (Liu et al., 2017c). A COD value of 0.2 is applied as an indicator for similarity and variability (Krudysz et al., 2008). A higher COD (> 0.2) implies variability between two datasets, while a lower COD (< 0.2) indicates similarity between them. Overall, a lower COD (< 0.2) and higher R (> 0.8) of a lab suggest a similar variation pattern and similar ion concentrations of this lab to the median values of 10 labs.
2.5 ISORROPIA II
ISORROPIA II is a thermodynamic equilibrium model for predicting the composition and physical state of atmospheric inorganic aerosols (available at http://isorropia.eas.gatech.edu, last access: 16 September 2020; Fountoukis and Nenes, 2007). It was applied in this study to calculate the aerosol water content (AWC) and pH. Aerosol pH in this study (pHi) was defined as the molality-based hydrogen ion activity on a logarithmic scale, calculated applying the following equation (Jia et al., 2018; Song et al., 2019):
where represents hydrogen ion activity in aqueous solution, . and represent the molality and the molality-based activity coefficient of , respectively. mΘ is the standard molality (1 mol/kg). Model inputs include aerosol-phase Cl−, SO, NO, Na+, NH, K+, Mg2+ and Ca2+ and gas-phase NH3 concentrations, along with daily averaged temperature and relative humidity (Table S3). In this study, the model was run only in forward mode (with gas + aerosol inputs) in the thermodynamically metastable phase state, assuming salts do not precipitate under supersaturated conditions. More information regarding applications of ISORROPIA II can be found in other studies (Guo et al., 2016; Weber et al., 2016; Song et al., 2018).
3.1 Quality assurance and quality control (QA and QC)
3.1.1 Certified reference materials (CRMs) – detection accuracy and repeatability
Certified reference materials for both cations and anions were investigated for quality control. CRM-C and CRM-A were analyzed three consecutive times in each lab. The detection accuracy (DA) of each ion was determined as the ratio of measured concentration divided by its certified concentration as a percentage. The results of the DAs of all ions are listed in Table 2.
Table 2Detection accuracy (%) of water-soluble inorganic ions in certified reference materials measured by the 10 laboratories.
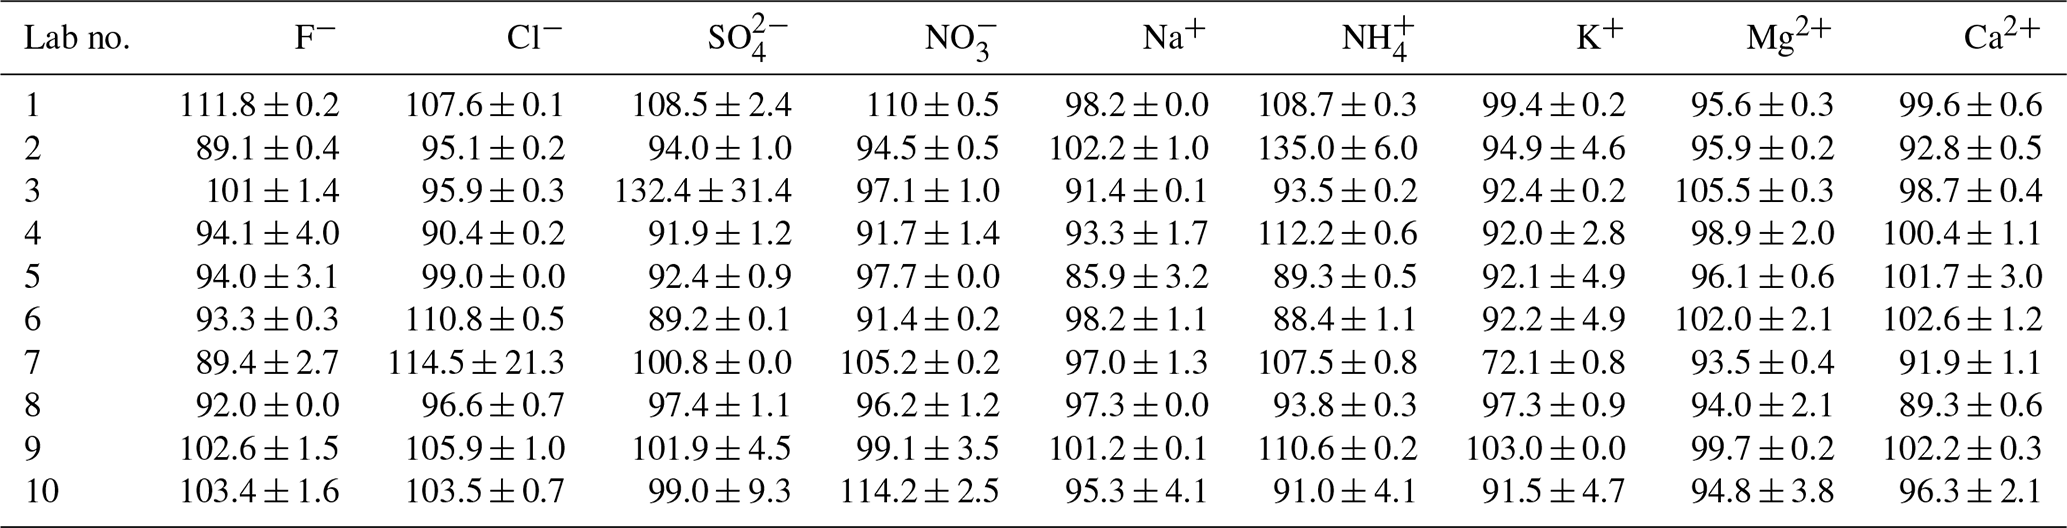
As reported in Table 2, most ions were observed with a DA in the range of 90 %–110 % among the 10 laboratories. However, SO in Lab-3 and NH in Lab-2 were overestimated, the DAs of which were 132.4 % ± 31.4 % and 135.0 % ± 6.0 %, respectively. The standard deviation of SO measured by Lab-3 was the largest (31.4 %), followed by Cl− measured by Lab-7 (21.3 %), which indicated their poor repeatability. Even though NH in Lab-2 was observed with a high value of DA, its deviation of three repeats was relatively small, which may be attributable to the evaporation of ammonium in calibration standards in Lab-2; hence, the level it represented was higher than its real concentration. K+ in Lab-7 was underestimated, and was observed with a DA of only 72.1 % ± 0.8 %. This may be due to contamination in the water blanks or the IC system, as the average concentration of K+ in three water blanks of Lab-7 was 8.0 ng/L, much higher than the median value of 10 labs (3.4 ng/L).
3.1.2 Detection limits
The detection limits (DLs) in this study were calculated as
where SDi is the standard deviation of the blank filters. The mean concentrations of the ions in blanks and DLs (3SD) of all ions are provided in Table 3.
Table 3Mean filter blank concentrations and detection limits (3×SD; ng/m3) of ions measured by the 10 laboratories.
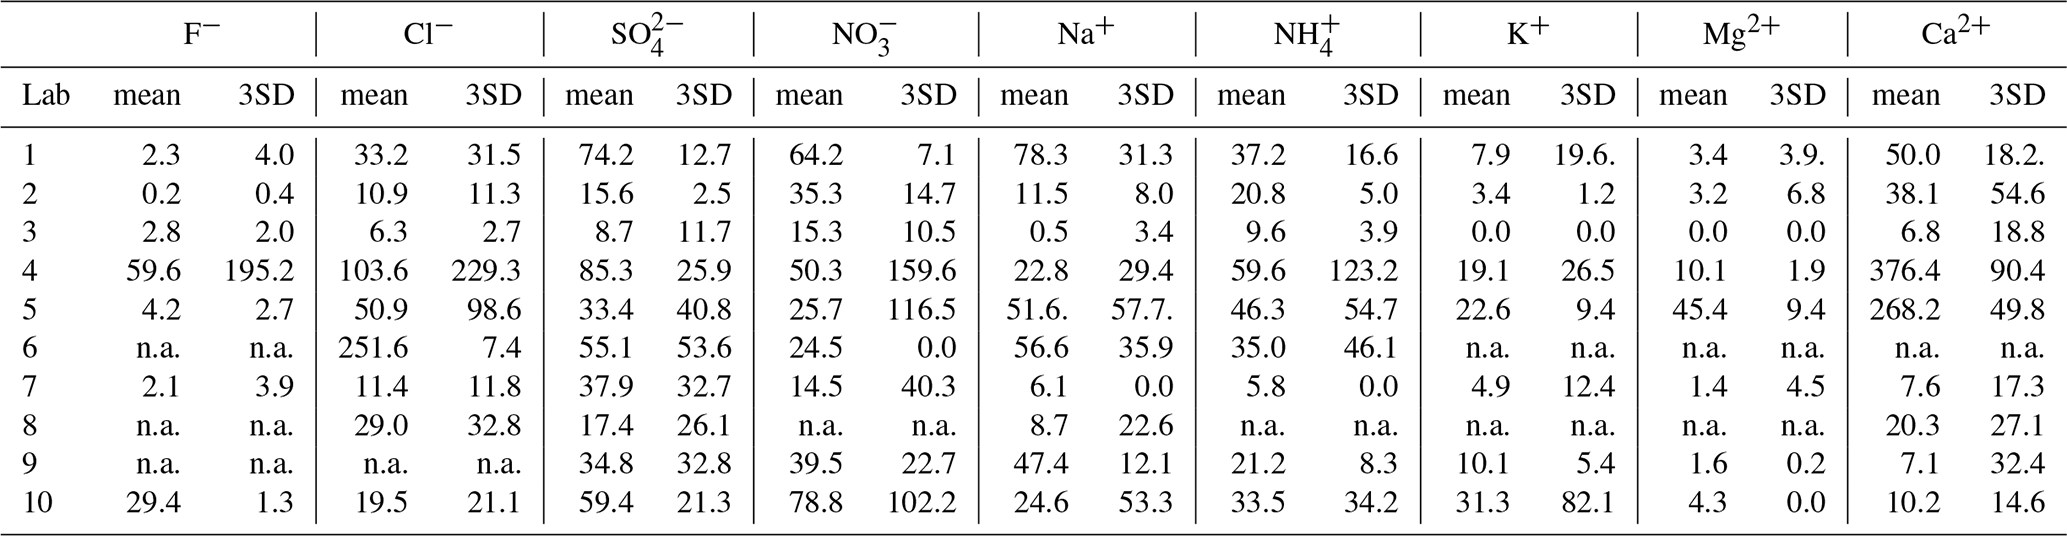
Note that the detection limits were calculated based on large-volume sampling (total filter size: 406.5 cm2; total sampling volume: 1560 m3); n.a.: not available due to no relevant peaks being identified in the chromatography.
3.2 Mass concentrations of PM2.5 and inorganic ions
3.2.1 PM2.5 and ion concentrations
The results for PM2.5 and all inorganic ion concentrations measured by the 10 labs are presented in Fig. 1. During 16–23 January 2019, the daily mean PM2.5 ranged from 8.4 to 53.8 µg/m3, with an average of 31.4 µg/m3. Among these days, 16, 17 and 18 January were deemed moderately polluted days with PM2.5 concentrations >35 µg/m3, while the rest were nonhaze days with PM2.5 concentrations falling in the range of 8.4–27.9 µg/m3.

Figure 1The time series of mass concentrations of PM2.5 and ions. The date is given in the format month/day.
The time series of all inorganic ions are shown in Fig. 1 to demonstrate the consistency among different laboratories. In Fig. 1, Cl−, NO, SO and NH showed a similar trend to PM2.5 and good correlations among the 10 labs, suggesting the consistency and reliability of using ion chromatography for analyzing these ions, despite various instruments and analyzing methods. Larger variations in Cl−, NO, SO and NH concentrations between different laboratories were observed on moderately polluted days, whereas results for the nonhaze days, especially for 19 and 20 January, were observed with good agreement in the 10 labs. Good agreement was also observed for the mass ratios of NO / SO in most of the labs during the study period (Fig. S4), which basically followed a similar trend to PM2.5. On more polluted days, NO ratios were obviously higher than on less polluted days, suggesting the dominance of mobile source contributions over stationary sources during heavily polluted days.
The average SNA concentrations of eight samples varied from 6.3 ± 3.3 to 9.1 ± 5.0 µg/m3 (Lab-4 and Lab-1, respectively) in the 10 labs, accounting for 20.6 % ± 4.8 % to 29.0 % ± 6.7 % of the PM2.5 mass concentrations. However, their contributions to total ions measured by each lab, which ranged between 83.6 % ± 2.7 % and 86.3 % ± 2.3 %, were not significantly different. The total ions summed to 24.3 ± 4.9 % (Lab-4) to 33.8 % ± 7.1 % (Lab-1) of PM2.5. These results are comparable with those in another study in Beijing which found that SNA accounted for 88 % of total ions and 9 %–70 % of PM2.5 concentrations (Xu et al., 2019b). As shown in Table 2, the DAs of most ions measured by Lab-4 were < 100 %, while those of Lab-1 were much higher, especially for major ions (> 100 %). Corresponding to this, the ion concentrations in Lab-4 were mostly lower than in other labs, while those of Lab-1 were mostly higher than in other labs. For Lab-6 which was also observed to have lower DA of ions such as SO (89.2 %) and NH (88.4 %) in the 10 labs, its SNA concentrations and total ions accounted for 24.5 % ± 5.6 % and 28.7 % ± 6.0 % of PM2.5, respectively, the second lowest among all labs. Hence, it is very important to run certified reference materials before any sample analysis to ensure the accuracy and good quality of data.
K+ concentrations analyzed by the 10 labs followed a similar trend to PM2.5 mass, except with the sample measured on a moderately polluted day (19 January) by Lab-6, which is 2–3 times higher than those measured by other labs. F− concentrations varied across the 10 labs, but most of them shared a similar trend. Some labs like Lab-8 did not follow the same trend due to reporting undetectable F− concentrations. The Na+ concentration on the least polluted day (20 January) was abnormally high in Lab-9, while its concentrations measured by other labs were generally low. This may be due to Na+ contamination during the preparation or measurement of this sample, as Na+ concentrations in the rest of the samples measured by Lab-9 followed a similar trend to those of other labs. The alkaline ions Mg2+ and Ca2+ mostly originate from crustal dust and mainly exist in coarse particles (Zou et al., 2018). Their mass concentrations varied considerably due to their relatively low concentrations in aerosol samples and being sometimes below the detection limits in some labs, such as Lab-6. Nevertheless, some labs like Lab-2, Lab-3 and Lab-10 still followed a similar trend.
3.2.2 Comparison with ToF-ACSM data
As shown in Fig. 1, Cl−, NO, SO and NH generally exhibited similar patterns, but due to some outliers, such as the NO concentration measured by Lab-8 on 16 January, the median values were selected to better represent the general levels and theoretical actual concentrations of ions measured by different labs. The scatter plots of the median mass concentrations of Cl−, NO, SO and NH in the 10 labs (IC-Cl−, IC-NO, IC-SO and IC-NH versus the nonrefractory (NR) species measured by the ToF-ACSM (ACSM-Cl−, ACSM-NO, ACSM-SO and ACSM-NH are shown in Fig. 2. The time series of IC and ACSM data at IAP and BUCT are plotted in Fig. S5.
Chloride is reported to arise mainly from biomass burning and coal combustion in China (Zhang et al., 2016). Its average concentration in the 10 labs correlated very well with ACSM-Cl− (R2=0.82 for IAP). However, IC-Cl− in IAP is 2–3 times higher than ACSM-Cl−; this may be due to the small contribution of Cl− to the overall mass spectrum which made it difficult to quantify by the ToF-ACSM (Allan et al., 2004). Additionally, the ACSM is incapable of measuring Cl− in the form of KCl, as the ACSM only measures nonrefractory Cl−. Poor correlation of chloride (R2=0.21) was also discovered between two collocated ACSMs with a much larger set of data points, while other NR species were observed with strong correlation (R2>0.8) in another study (Budisulistiorini et al., 2014), suggesting the quantification of chloride by ACSM has large uncertainties.
Sulfate, an important component of atmospheric secondary inorganic aerosols, plays an important role in the formation of haze (Wang et al., 2014; Yue et al., 2019). The correlation coefficient (R2) between the measured IC-SO and ACSM-SO was only 0.26 for IAP with a slope of 0.54. The correlation of IC-SO and ACSM-SO from BUCT was 0.84 (R2) with a slope of 0.56. Judging from the slopes, ACSM-SO and ACSM-NH were similarly higher than the median values of measured SO and NH concentrations in this study. The NR species followed the same trend as NR-PM2.5, and chemical species measured through filter analysis also shared the same trend as PM2.5 measured in our study.
Very good correlation between measured IC and ACSM data was found for NO and NH with R2>0.9. The lab median value of NO was very close to the ACSM-NO from the same sampling site IAP, with a slope of 0.88 for IC-NO, while that of BUCT was only 0.57. The slopes of IC-NH were 0.58 and 0.60 for IAP and BUCT, respectively. Comparing IC-NH to ACSM-NH, the absolute concentration of IC-NH differed the most among all ions (42 %), except Cl−. Generally, ACSM-NO and ACSM-NH were higher than the median values of measured NO and NH concentrations in the 10 labs. Higher concentrations in the online ACSM observations compared to the daily filter sample measurements may be partially due to differences in the performance of the two PM2.5 cut-point selectors, which led to different transmission efficiencies of particles. Other reasons could be as follows: (1) the uncertainties in ACSM observations themselves – Crenn et al. (2015) reported the uncertainties in NO, SO and NH in ACSM analysis were 15 %, 28 % and 36 %, respectively – and (2) negative filter artifacts, such as volatilization of semivolatile ions (Kim et al., 2015), although the latter would not be expected to affect sulfate. Sun et al. (2020) also compared ACSM and filter-based IC results and showed that the concentrations of NO, NH and SO in the ACSM measurement were also higher than those of the filter-based measurements, although the slopes were smaller than in our study. It is also possible that the representative ions of ACSM-NO and ACSM-NH could have significant interferences from other species in the mass spectrum, causing large uncertainties even after correction for those interferences.
To summarize, SO, NO, NH from lab analysis generally correlated very well with the ACSM data, but the absolute concentrations differ by up to 42 %. Cl− from the two methods is correlated, but the concentrations differ by more than a factor of 3. It appears that Cl− is less accurate in online ACSM observations. NO was comparable for the online data and filter-based data, while SO and NH in online data may be generally overestimated by a similar factor. It should be noted that higher SO concentrations in online ACSM data could potentially be due to ACSM not being able to separate organosulfate from sulfate. ACSM-NO, ACSM-SO and ACSM-NH were also reported to be higher (approximately 10 %–20 %) than filter-analysis-based NO, SO and NH in another study (Sun et al., 2020). Although the comparison between IC and ACSM provided important information about the data from the two methods, we recognize that we only have eight data points here. Future studies should be carried out and include more data points in order to comprehensively study the relationship between the online ACSM data and filter-based data. We emphasize that it is essential that both ACSM and filter-based observations are robustly quality controlled before any ACSM and IC intercomparison.
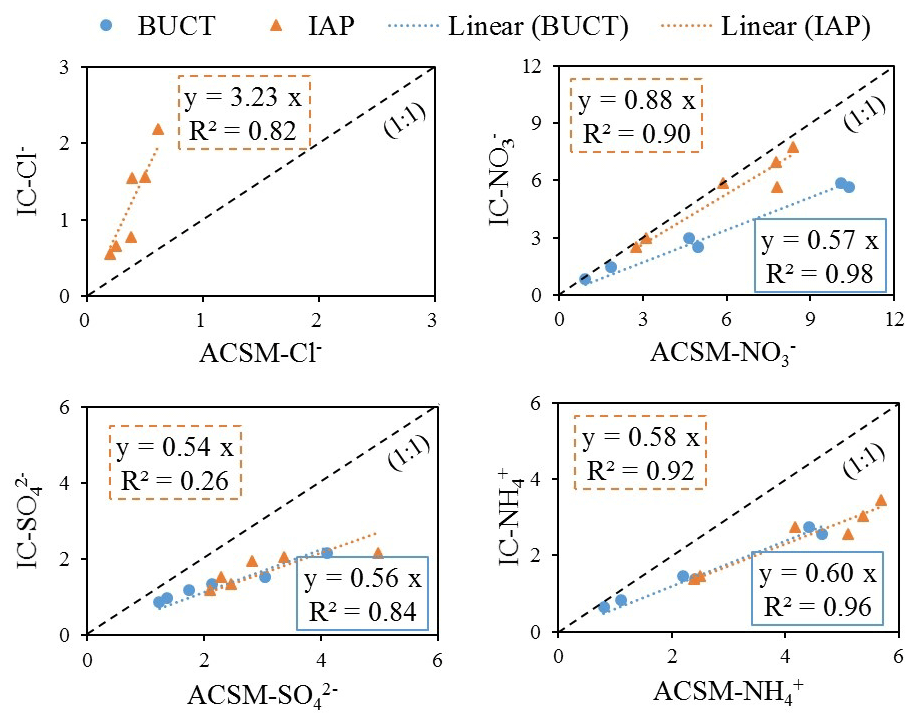
Figure 2Scatter plots of the median mass concentrations of Cl−, NO, SO and NH measured by the 10 labs (IC-Cl−, IC-NO, IC-SO and IC-NH versus the nonrefractory (NR) chemical species from ACSM (ACSM-Cl−, ACSM-NO, ACSM-SO and ACSM-NH from BUCT and IAP.
3.3 Divergence and correlation analysis
As shown above, some ions like Cl−, NO, SO and NH generally exhibited similar patterns, but some of the ions varied significantly in different laboratories. Therefore, Pearson's correlation coefficient (R) and the coefficient of divergence (COD) were both calculated to identify the uniformity and divergence of ionic concentrations measured by different labs. The COD and R values of all ions for Labj–Lab-Median pairs are presented in Fig. 3. Cl−, NO, SO, NH and K+ clearly showed high R values (> 0.8) and low COD values (< 0.2) in all labs, suggesting the reliability of the measurement of these ions in different labs. However, F− and Ca2+ in most of the labs were observed with higher COD values, and Ca2+ was also found to have a lower R value, suggesting heterogeneity of Ca2+ detection in different labs, which made this ion less reliable. Mg2+ was observed with good correlation (> 0.7) between each lab and the Lab-Median, but a higher COD was found between Lab-3, Lab-5 and Lab-6 than with the Lab-Median. Similarly, Na+ was also observed with good correlation (> 0.7) between each lab and the Lab-Median, except Lab-9, and a higher COD was found between Lab-5 and Lab-8 than with the Lab-Median.
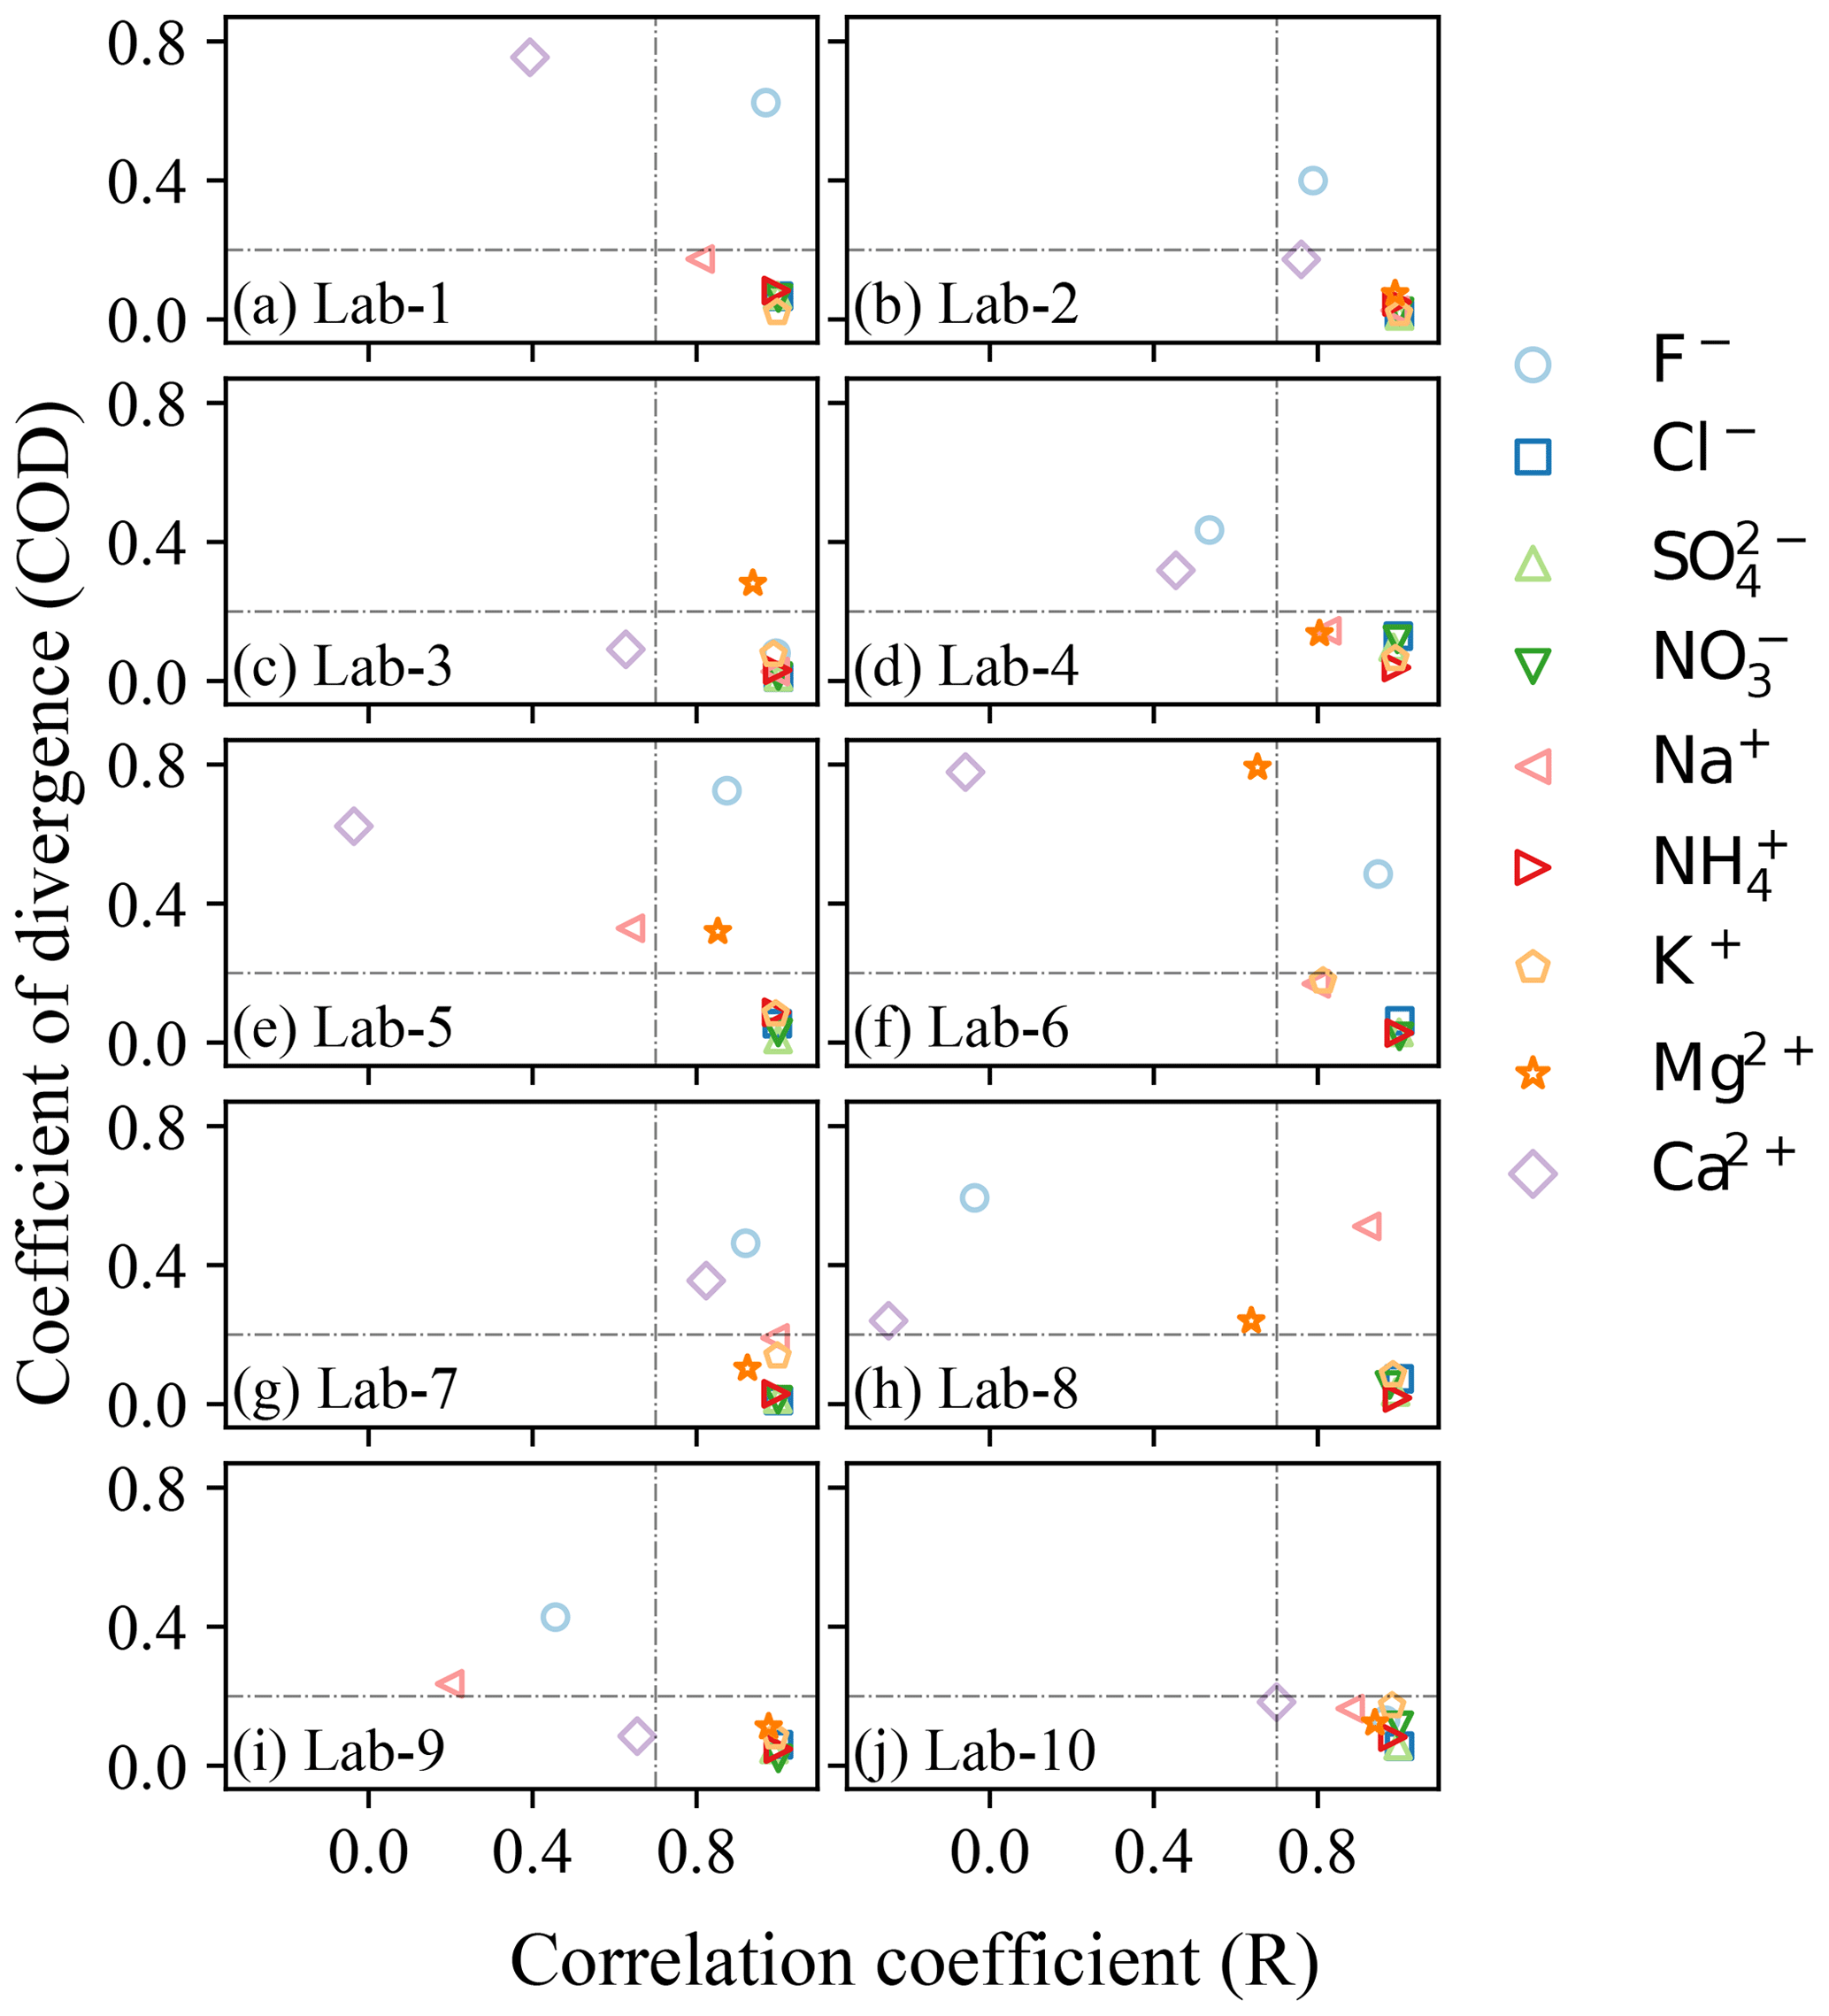
Figure 3Coefficient of divergence (COD) plotted against correlation coefficient (R) for all ions in each lab with the median ionic concentrations of the 10 labs. (Note: vertical line indicates an R value of 0.8, and horizontal lines indicate COD values of 0.2).
3.4 Ion concentrations calculated by detection accuracy of CRMs
The detection accuracy of the certified reference materials was used to correct the ion concentrations in this study to show the importance of using CRMs for calibration checking and quality control. The correction was conducted by dividing the measured ion concentrations by their corresponding DA value. The coefficient of variation (CV), which indicates the variance of data, was applied here to compare the variation in uncorrected or corrected ion concentrations among the 10 labs. It was calculated as the standard deviation of ion concentrations measured by the 10 labs divided by the mean and expressed in a percentage. A lower CV value indicates the closeness of data measured by the 10 labs and reflects more precise results, while a higher CV value reflects the opposite. As F−, Na+, Mg2+ and Ca2+ were undetectable in some labs, only Cl−, SO, NO, NH and K+ were investigated, and the results are shown in Table 4.
In Table 4, Lab-7 was excluded from the calculation of the CV of both uncorrected and corrected chloride, due to its poor repeatability. The CV of uncorrected chloride concentration in eight samples varied between 11.7 % and 19.3 %, with an average of 14.3 %. The CV of corrected chloride concentration in eight samples varied between 10.4 % and 17.0 %, with an average of 12.6 %. The averaged CV decreased 1.7 % for corrected chloride concentration. Small changes in CV were observed during moderately polluted days (16, 17, 18 January), but more obvious changes occurred during nonhaze days.
The average CV of SO surprisingly increased from 9.8 % for uncorrected SO to 10.9 % for corrected SO (Supplement, Table S4). However, when excluding Lab-3 from the calculation, the averaged CV of uncorrected sulfate concentration was 10.3 %, and it significantly decreased to 6.9 % once corrected. Therefore, it is strongly recommended that an excessive DA (> 110 %) with large variation should be avoided for the correction of SO concentrations. Better agreements of NO and K+ concentrations among the 10 labs were also observed after correction, as indicated by lower CV values for corrected samples. Similar to other ions, the mean concentration of NH of the 10 labs remained almost the same after correction, but the CV of corrected samples increased from 12.5 % to 13.2 % after correction (Table S4). Nevertheless, it decreased 1.2 % after correction when excluding Lab-2 (the DA of NH was 135.0 ± 6.0 %) from the calculation. The small change in the coefficient of variation here could be due to the high volatility of ammonia which leads to differing results measured by different analytical procedures in the labs.
To sum up, certified reference materials should be applied for quality control. If the values of the DA highly deviate from 100 % (e.g., > 110 % or < 90 %) or there are large inter-CRM variations, then the measurement procedures have to be checked, including repeating the analysis or repreparing the calibration standard solutions.
Table 4Uncorrected and CRM-corrected ion concentrations (µg/m3) and their corresponding coefficients of variation (CVs; %).
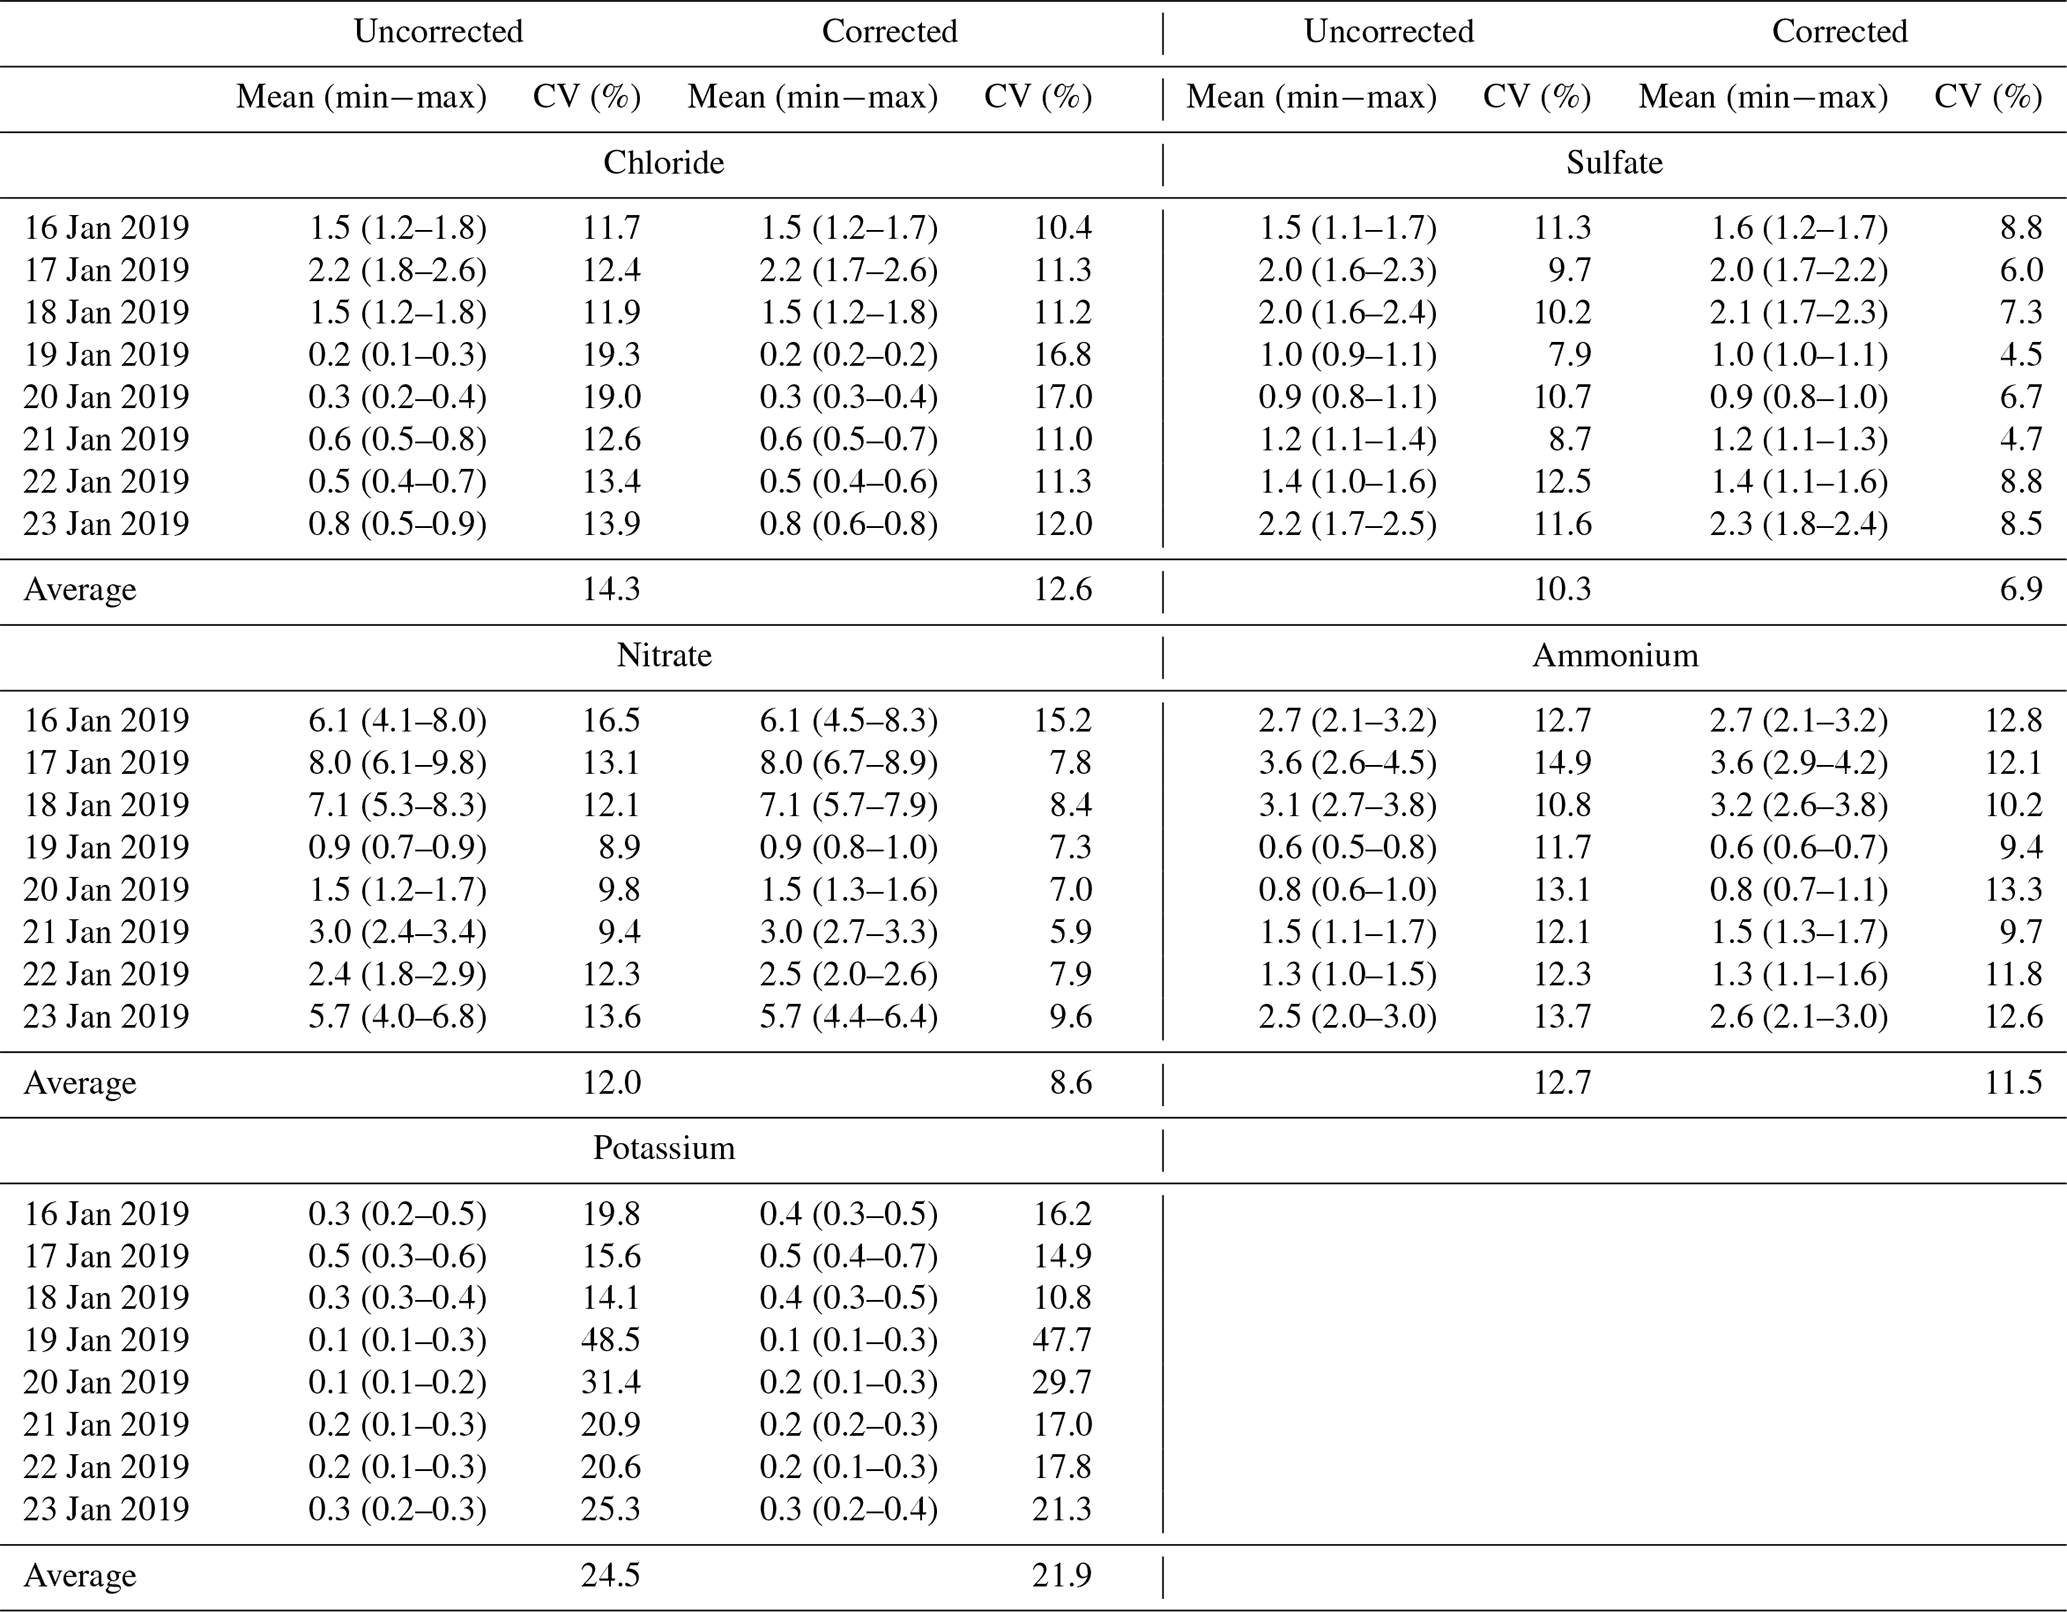
Lab-2, Lab-3 and Lab-7 were excluded for calculating CVs (%) of ammonium, sulfate and chloride, respectively.
3.5 Aerosol acidity
In this study, aerosol acidity was evaluated applying three different parameters: the anion and cation equivalence ratio, ion balance, and in situ acidity. Ion balance was calculated by subtracting equivalent cations from anions (Zhang et al., 2007), while in situ aerosol acidity was represented by pH or the concentration of free H+ in the deliquesced particles under ambient conditions. In situ aerosol pH can be estimated from various thermodynamic models, for example, SCAPE, GFEMN, E-AIM and ISORROPIA (He et al., 2012; Pathak et al., 2009; Yao et al., 2006). In situ aerosol acidity is most likely to influence the chemical behavior of aerosols (He et al., 2012). Ion balance is widely used to indicate the neutralization status of aerosols with the equivalent ratios of anions / cations in a relative way (Sun et al., 2010; Takami et al., 2007; Chou et al., 2008). It is noteworthy that ion balance and in situ aerosol acidity estimations are empirical approaches which are strongly dependent on the selection of ion species.
3.5.1 Anion and cation equivalence ratio
The ratio of the anion molar equivalent concentrations to the cation molar equivalent concentrations (AE / CE) can be applied to reflect the potential aerosol acidity (Meng et al., 2016; Zou et al., 2018). In this study, AE and CE were calculated as
AE represents the equivalent concentrations of all anions; and CE denotes all cation equivalent concentrations.
Table 5Anion and cation equivalent ratios (AE∕CE) among the 10 laboratories.
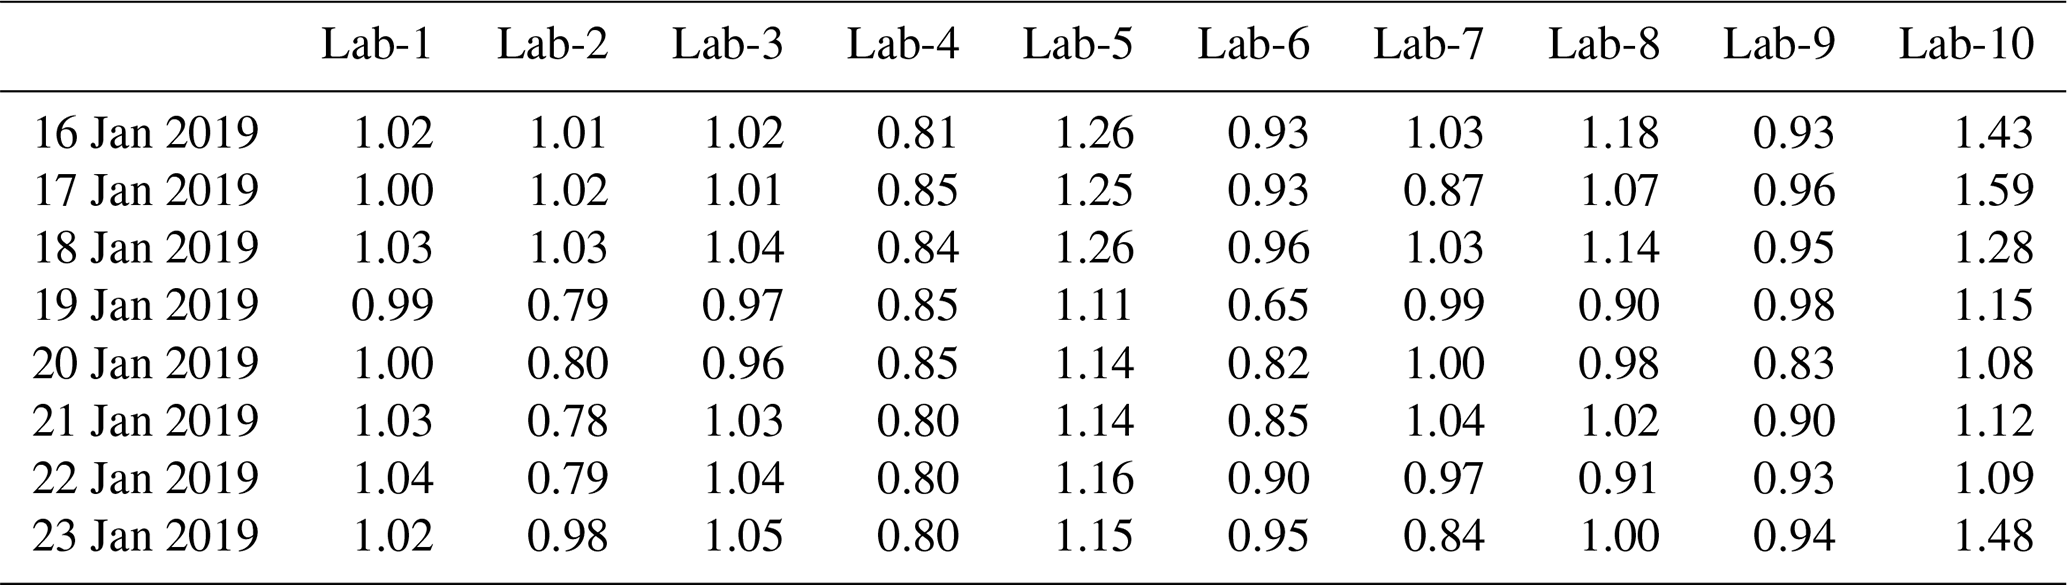
The AE / CE ratios of all samples were compared among the 10 labs (Table 5). The ratios in Lab-1 and Lab-3 were close to unity. The ratios in Lab-5 and Lab-10 were above 1, indicating the deficiency of cations in neutralizing all anions and contrary to Lab-4, Lab-6 and Lab-9. In Table 2, the detection accuracies of major cations (Na+, NH, K+) were < 100 % and much lower than those of the major anions (Cl−, NO, SO in Lab-5 and Lab-10, which may have caused lower cation concentrations than their real concentrations and a constantly higher ratio of AE∕CE. For Lab-9, the detection accuracies of all ions were very close to 100 %, except NH which was found with a detection accuracy of > 110 %. Therefore, the AE∕CE < 1 of all samples measured by Lab-9 could be the result of overestimation of ammonium. Similarly, in addition to ammonium detection accuracy of > 110 %, generally lower anion detection accuracies than cations were reported by Lab-4, which may explain the AE∕CE < 1 in all samples measured by this lab as well. The other three labs (Lab-2, Lab-7 and Lab-8) were found with various AE∕CE ratios with both > 1 and < 1 values; moderately polluted days were generally observed with a higher ratio of AE∕CE. These results indicate that AE / CE ratios bear large uncertainties in different labs. Stricter quality control measures should be adopted if applying AE∕CE ratios to evaluate aerosol acidity.
3.5.2 Ion balance
The calculation of ion balance is an alternative way to evaluate the aerosol acidity (Han et al., 2016; He et al., 2012). Three methods are listed below for the calculation of ion balance in this study:
In Method 1, only SO, NO and NH were applied for the calculation (Tian et al., 2017), assuming that these three ions and H+ alone control PM2.5 acidity (Ziemba et al., 2007). SO, NO and NH were also used in other studies to assess aerosol acidity. For example, the mole charge ratio of NH to the sum of SO and NO was applied to represent aerosol acidity (Chandra Mouli et al., 2003; Wang et al., 2019). SO, NO and NH were selected because they contributed approximately 90 % of the total ionic species in fine aerosols and play predominant roles in controlling aerosol acidity (Zhou et al., 2012). Salt ions Na+, K+ and Cl− were added for the calculation in Method 2. Based on this calculation, Mg2+ and Ca2+ were added in Method 3 to include the effects of crustal dust on aerosol acidity (Huang et al., 2014).
The ion balance of all labs varied when applying different methods, especially for the first 3 heavily polluted days, as shown in Fig. 4. Positive ion-balance values indicated a deficiency of cations in neutralizing anions, while negative values implied an excess of cations to neutralize anions. Lab-10 showed the highest variation among all labs; when excluding Lab-10, the results of the other nine labs agreed very well, with most of the values below 0, suggesting sufficient ammonium to neutralize sulfate and nitrate. By applying Method 1, comparable results were found. The average ion-balance values in all samples were consistent in Lab-1, Lab-2, Lab-6, Lab-7 and Lab-9 (0.02 µmol/m3). When adding more ions in the calculation by adopting methods 2 and 3, poorer agreement among all labs was exhibited. Therefore, it seems more consistent to indicate the relative ion-balanced aerosol acidity among different samples by Method 1, as SNA were the most abundant ions in atmospheric aerosols and their concentrations measured by different labs showed good agreement (Fig. 1). This method could reduce the large discrepancy in ion-balance results calculated by adding other ions from the different labs, as their concentrations varied largely in different labs due to varying detection limits.
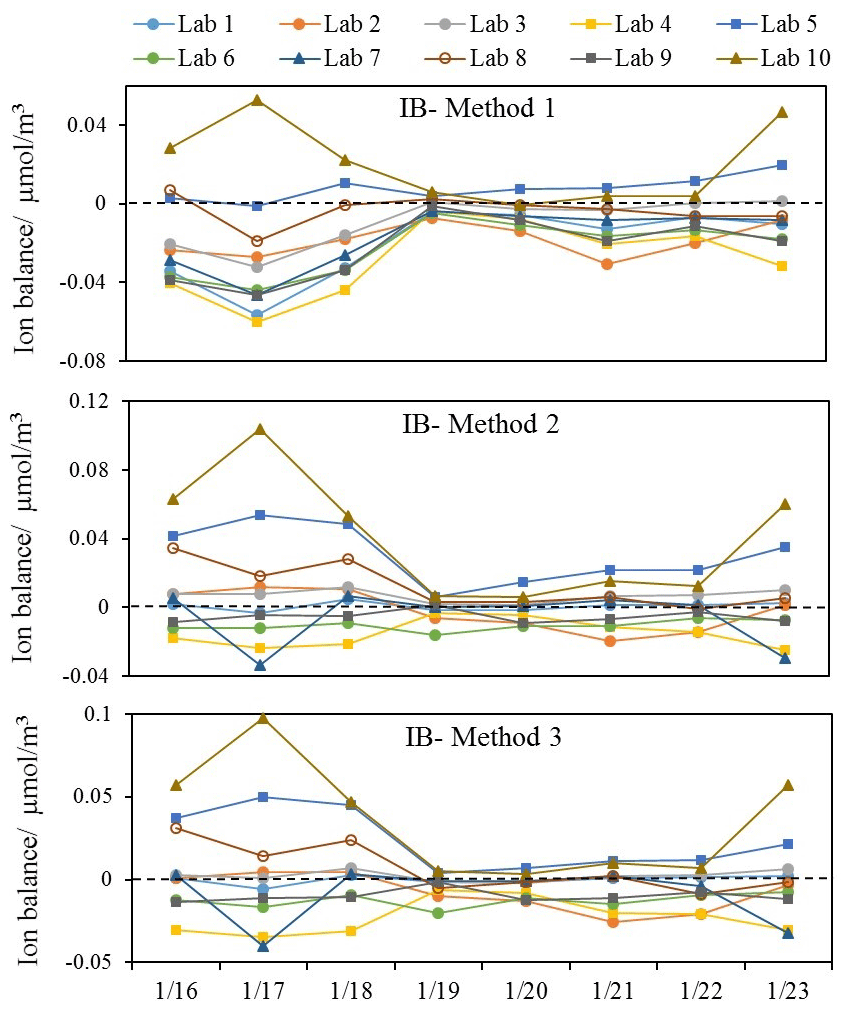
Figure 4Ion balance in all labs applying different methods (negative values reflect the excessive cations to neutralize anions).
3.5.3 Aerosol pH using ISORROPIA II
A thermodynamic equilibrium model ISORROPIA II was applied to estimate the in situ aerosol acidity. This was run only in forward mode, as the results from the use of reverse mode (using only particle-phase composition) are reported to be unreliable (Song et al., 2018). The only gas-phase data were for ammonia, but this introduces little error as concentrations of HNO3 and HCl are likely to be very low in this high-ammonia environment (Song et al., 2018).
The inputs include aerosol-phase Cl−, SO, NO, Na+, NH, K+, Mg2+ and Ca2+ and gas-phase NH3 concentrations. The daily ammonia concentrations during the study period derived from 5 min data ranged from 13.9 ± 0.6 to 20.1 ± 0.7 ppb (average 17.2 ± 2.2 ppb). The small standard deviations of the daily average (< 1 ppb) suggest that the diurnal variation in NH3 was not significant. Hence, aerosol pH was only investigated using daily mean NH3 concentrations. Mean NH3 concentrations during moderately polluted and nonhaze days were 19.6 ± 0.6 and 15.9 ± 1.5 ppb, respectively. Daily temperature ranged between −4.4 and 4.3∘C with an average of 1.0∘C, and RH ranged from 13.8 % to 40.1 % with a mean value of 22.4 %. The aerosol pH, as well as aerosol water content (AWC), was calculated for all samples by the model (Table S5); details of the calculation of pH and AWC can be found elsewhere (Liu et al., 2017b; Masiol et al., 2020). The calculated aerosol pH results of the 10 labs are presented in Fig. 5. The predicted gas-phase NH3 by ISORROPIA II was well correlated with the measured NH3 with slope of 1.02 and R2 of 0.95 (Fig. S6), which demonstrated the accuracy of thermodynamic calculations by the model (Song et al., 2018).
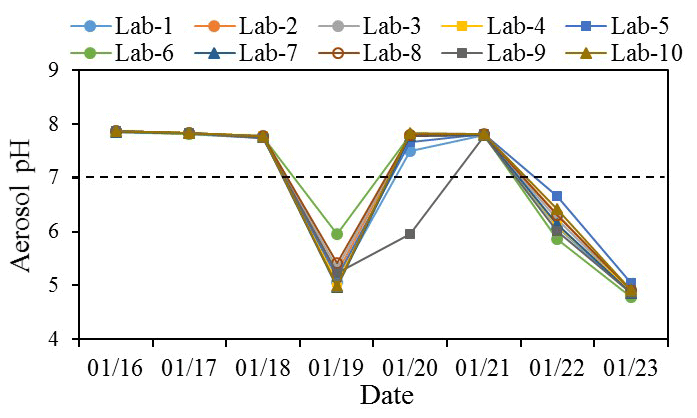
Figure 5Aerosol pH estimated by ISORROPIA II using ions and ammonia in the 10 labs from 16 to 23 January 2019.
The computed aerosol pH during the study period generally exhibited good agreement among the 10 labs. Lab-6 was observed with a higher pH and lower ion balance than other labs on 19 January, which could be mainly due to the K+ concentration measured by Lab-6 on that day that was 2–3 times higher (Fig. 1), while other ions measured by this lab were more comparable with other labs. The aerosol pH on 3 moderately polluted days was above 7, indicating an alkaline nature of aerosols during these days. This result is consistent with the discussion mentioned above that ion balance estimated by Method 1 was below 0 as more NH neutralizes NO and SO. It should be noted that the higher pH (> 7) of those samples could be due to the lower temperature (−4.4 to 4.3 ∘C) during the sampling period (Table S3), in addition to their relatively alkalic nature. The equilibrium of water (H2O) with OH−(aq) + H+(aq) is temperature-dependent. For highly dilute aqueous systems, the values of pKw (log10[Kw]; Kw is the temperature-dependent equilibrium constant on molality basis) at 25 ∘C (13.99) and 0 ∘C (14.95) can result in corresponding pH values of 6.995 and 7.475, respectively, both of which are considered neutral (Bandura and Lvova, 2006; Pye et al., 2020). In addition, the low RH in these samples (Table S3) may have also contributed to the high pH values we calculated. Different RH values were tested for aerosol pH among the 10 labs. The results (Fig. S7) showed that at different RH levels (40 %, 50 %, 60 %, 70 %, 80 %), the pH values in the 10 labs were consistent; and the pH values were mostly lower than 6 in all samples. Hence, the higher pH (> 7) of some samples could have resulted from the combination of lower temperature and RH and the nature of the aerosols. Excellent agreement among the 10 labs for the aerosol pH during these moderately polluted days was also found. Nonhaze days, especially the least polluted day on 20 January, showed higher variation among the different labs. The calculated pH values of nine labs mostly fall on the same side of the neutralization line (pH = 7), and only Lab-9 on 20 January falls onto a different side of the pH = 7 line from the other labs. A sensitivity test of Na+, K+, Mg2+ and Ca2+ showed that this abnormal pH value was mainly due to the significantly higher Na+ concentration of Lab-9 on 20 January.
Our results suggest AE∕CE and ion balance are flawed representations of particle acidity, which are not recommended for the evaluation of aerosol acidity. This is also consistent with the conclusions from previous studies (Hennigan et al., 2015; Guo et al., 2015; Pye et al., 2020). ISORROPIA II gives more consistent aerosol pH values among different laboratories. But there are uncertainties within this calculation: (1) RH during some periods in this study was relatively low (around 20 %), and as a result, aerosol water content was very low. Under such conditions, ions mostly exist in the solid phase. Hence, the pH of aerosols with very low RH may not be reliable. (2) The calculation of AWC was only considered for inorganics in this study. Water associated with organics also contributes to AWC. For example, Guo et al. (2015) indicated that it accounts for 29 %–39 % of total PM2.5 water in the southeastern United States.
NH3 is the main driving factor affecting aerosol pH and leads to the more alkaline nature of aerosols. To investigate the effect of NH3 concentration on aerosol pH, we conducted a sensitivity test which showed the aerosol pH of samples measured by the 10 labs at NH3 levels of 0.5, 1, 2, 5 and 10 ppb (Fig. S8). When the concentration of NH3≥2 ppb, the aerosol pH estimates of the 10 labs were generally consistent and less affected by the variation in ion concentrations. But there is more variation of aerosol pH in the 10 labs when NH3 concentration is under 2 ppb. This suggests when NH3 concentration < 2 ppb, the aerosol pH could be more affected by the variation in ion concentrations. Wang et al. (2020) also reported that the high concentration of total ammonium (gas + aerosol) was likely an important factor causing lower aerosol acidity of fine particles during a severe haze period in Henan province, China. It is also confirmed in another study that ammonia played an important role in influencing aerosol pH during a winter haze period in northern China (Song et al., 2018).
Despite the use of variable methods and instruments for measuring ion concentrations, data from all the participating labs show a reasonably good agreement in the overall trend for major ions like chloride, sulfate, nitrate and ammonium. The coefficients of divergence of these ions across the 10 labs were lower than 0.2, and the correlation coefficients were higher than 0.8, suggesting a reasonably high reliability of measuring major ions by IC in different labs. However, the interlaboratory difference can be as high as 30 % if excluding the two extreme values for each day and reached up to 100 % in extreme cases if including all data. Furthermore, ions like F−, Mg2+, K+ and Ca2+ were observed with large variations in different labs, which may be due to their relatively low concentrations in the samples. Good correlations were found for nonrefractory ion species measured by ACSM with those in our study. However, the absolute mass levels were quite different, which may be due to the differences in the performance of the two PM2.5 cut-point selectors, the uncertainties in ACSM observations themselves and negative filter artifacts. Certified reference materials were applied to show the detection accuracy of IC measurement in the 10 laboratories. By comparing the coefficient of variation in samples among the 10 labs before and after correction by the detection accuracy of CRMs, we emphasize the importance of using certified reference materials for quality control for future ionic species analysis.
Aerosol acidity was studied through the investigation of ion-balance-based acidity and in situ acidity. Firstly, the ratios of anion equivalent concentrations to cation equivalent concentrations (AE / CE) varied significantly in different labs, which could be attributed to measurement errors, as supported by the different detection accuracies of ions in CRMs. Secondly, by calculating the ion balance, Method 1, which only applied SNA for the calculation, was more consistent in most labs. Poor agreement of acidity estimation was observed in all labs when adding other ions like Ca2+ and Mg2+. Finally, ISORROPIA II was applied for estimating in situ aerosol acidity by calculating aerosol pH in forward (gas + aerosol phases as input) mode. The results showed a similar trend between labs and exhibited a good agreement. This indicates that, if including gaseous pollutant equilibrium in the ISORROPIA II model, the estimated aerosol pH is more consistent even if there are relatively large differences in the measured concentrations of ions.
Based on this analysis and our experience, we recommend the following:
-
Literature aerosol ion data based on online and offline methods should be treated with a degree of uncertainty in mind. The uncertainties are particularly large for minor ions like Ca2+ from the aerosol filter-based ion chromatography analysis.
-
The ion-balance approach is not recommended for estimating aerosol acidity due to its large uncertainty. Instead, in situ aerosol pH may be used to represent acidity and can be calculated from a thermodynamic model considering gas–aerosol equilibrium (e.g., NH and NH3). This requires the measurements of aerosol composition as well as of NH3.
-
The variation in ion concentrations is expected to strongly affect aerosol acidity estimated by ISORROPIA II when the NH3 concentration is low (e.g., < 2 ppb in this case). Additionally, the impact of the diurnal variation in NH3 on aerosol acidity is worthy of investigation, particularly when the NH3 concentration is low.
-
Certified reference materials should be used on a regular basis to assess the accuracy and reliability of the measurement method. Calibration standards should be reprepared and the IC performance should be checked when the detection accuracy highly deviates from 100 % (e.g., > 110 % or < 90 %).
-
The detection accuracy of ammonium varied significantly among the 10 labs (88.4 %–135.0 %) with the median value close to 100 %. Stock NH solutions that are used for the preparation of calibration standards should be freshly prepared to ensure good detection accuracy.
-
Robust quality control processes should be put in place to avoid contamination, particularly for those ions with low concentrations, such as K+ and Na+. For example, water blanks should be run before any standard or sample analyses to ensure no contamination from water blanks or the IC system.
-
Some batches of commercial quartz filters may be contaminated with Na+ and PO, and thus testing each batch of blank filters is necessary before any field sampling (data not shown here). Filter washing may be needed in some cases.
-
Ionic concentration from ACSM observations should be calibrated although the observed trend is robust. Future research should be carried out to compare the offline ASCM and IC using the same filters to clearly identify the discrepancies between the two methods.
The data in this article are available from the corresponding author upon request.
The supplement related to this article is available online at: https://doi.org/10.5194/amt-13-6325-2020-supplement.
ZS conceived the study after discovering large interlaboratory variability in water-soluble inorganic ions from offline and online methods. JX prepared the paper with the help of ZS, RMH and all co-authors. JX, LW, QZ, CZ, XY, DC, WeijL, MW, HT, LiL, ST, WeirL, JW, GS, YH, SS, CP, YC, FY, AM, DD, SJS, IA and JFH conducted the laboratory analysis. SS supported the aerosol pH calculation. CS supported the calculation of coefficient of divergence. YLS, LuL, FZ, KRD, CY, YL and MK provided the ACSM data, and YLS supported the interpretation of the ACSM data. BG provided the NH3 data.
The authors declare that they have no conflict of interest.
We would like to acknowledge the support from all participating laboratories. We thank the anonymous reviewers for providing constructive comments.
This research has been supported by the Natural Environment Research Council (grant nos. NE/N007190/1, NE/S00579X/1 and NE/R005281/1).
This paper was edited by Mingjin Tang and reviewed by three anonymous referees.
Allan, J. D., Delia, A. E., Coe, H., Bower, K. N., Alfarra, M. R., Jimenez, J. L., Middlebrook, A. M., Drewnick, F., Onasch, T. B., Canagaratna, M. R., Jayne, J. T., and Worsnop, D. R.: A generalised method for the extraction of chemically resolved mass spectra from Aerodyne aerosol mass spectrometer data, J. Aerosol Sci., 35, 909–922, https://doi.org/10.1016/j.jaerosci.2004.02.007, 2004.
Baltensperger, U. and Hertz, J.: Determination of anions and cations in atmospheric aerosols by single column ion chromatography, J. Chromatogr. A, 324, 153–161, https://doi.org/10.1016/S0021-9673(01)81314-5, 1985.
Bandura, A. and Lvova, S.: The Ionization Constant of Water over Wide Ranges of Temperature and Density, J. Phys. Chem. Ref., 35, 15–30, https://doi.org/10.1063/1.1928231, 2006.
Buchberger, W. W.: Detection techniques in ion chromatography of inorganic ions, TrAC Trends Anal. Chem., 20, 296–303, https://doi.org/10.1016/S0165-9936(01)00068-1, 2001.
Budisulistiorini, S. H., Canagaratna, M. R., Croteau, P. L., Baumann, K., Edgerton, E. S., Kollman, M. S., Ng, N. L., Verma, V., Shaw, S. L., Knipping, E. M., Worsnop, D. R., Jayne, J. T., Weber, R. J., and Surratt, J. D.: Intercomparison of an Aerosol Chemical Speciation Monitor (ACSM) with ambient fine aerosol measurements in downtown Atlanta, Georgia, Atmos. Meas. Tech., 7, 1929–1941, https://doi.org/10.5194/amt-7-1929-2014, 2014.
Chandra Mouli, P., Venkata Mohan, S., and Jayarama Reddy, S.: A study on major inorganic ion composition of atmospheric aerosols at Tirupati, J. Hazard. Mat., 96, 217–228, https://doi.org/10.1016/S0304-3894(02)00214-5, 2003.
Chou, C. C. K., Lee, C. T., Yuan, C. S., Hsu, W. C., Lin, C. Y., Hsu, S. C., and Liu, S. C.: Implications of the chemical transformation of Asian outflow aerosols for the long-range transport of inorganic nitrogen species, Atmos. Environ., 42, 7508–7519, https://doi.org/10.1016/j.atmosenv.2008.05.049, 2008.
Crenn, V., Sciare, J., Croteau, P. L., Verlhac, S., Fröhlich, R., Belis, C. A., Aas, W., Äijälä, M., Alastuey, A., Artiñano, B., Baisnée, D., Bonnaire, N., Bressi, M., Canagaratna, M., Canonaco, F., Carbone, C., Cavalli, F., Coz, E., Cubison, M. J., Esser-Gietl, J. K., Green, D. C., Gros, V., Heikkinen, L., Herrmann, H., Lunder, C., Minguillón, M. C., Moènik, G., O'Dowd, C. D., Ovadnevaite, J., Petit, J. E., Petralia, E., Poulain, L., Priestman, M., Riffault, V., Ripoll, A., Sarda-Estève, R., Slowik, J. G., Setyan, A., Wiedensohler, A., Baltensperger, U., Prévôt, A. S. H., Jayne, J. T., and Favez, O.: ACTRIS ACSM intercomparison – Part 1: Reproducibility of concentration and fragment results from 13 individual Quadrupole Aerosol Chemical Speciation Monitors (Q-ACSM) and consistency with co-located instruments, Atmos. Meas. Tech., 8, 5063–5087, https://doi.org/10.5194/amt-8-5063-2015, 2015.
Ðorðeviæ, D., Mihajlidi-Zeliæ, A., Reliæ, D., Ignjatoviæ, L., Huremoviæ, J., Stortini, A. M., and Gambaro, A.: Size-segregated mass concentration and water soluble inorganic ions in an urban aerosol of the Central Balkans (Belgrade), Atmos. Environ., 46, 309–317, https://doi.org/10.1016/j.atmosenv.2011.09.057, 2012.
Fan, M.-Y., Cao, F., Zhang, Y.-Y., Bao, M.-Y., Liu, X.-Y., Zhang, W.-Q., Gao, S., and Zhang, Y.-L.: Characteristics and Sources of Water Soluble Inorganic Ions in Fine Particulate Matter During Winter in Xuzhou, Huan jing ke xue = Huanjing kexue, 38, 4478–4485, https://doi.org/10.13227/j.hjkx.201703178, 2017 (in Chinese).
Fountoukis, C. and Nenes, A.: ISORROPIA II: a computationally efficient thermodynamic equilibrium model for K+-Ca2+-Mg2+--Na+--NO3-Cl-H2O aerosols, Atmos. Chem. Phys., 7, 4639–4659, https://doi.org/10.5194/acp-7-4639-2007, 2007.
Ge, B. Z., Xu, X. B., Ma, Z. Q., Pan, X. L., Wang, Z., Lin, W. L., Ouyang, B., Xu, D. H., Lee, J., Zheng, M., Ji, D. S., Sun, Y. L., Dong, H. B., Squires, F. A., Fu, P. Q., and Wang, Z. F.: Role of Ammonia on the Feedback Between AWC and Inorganic Aerosol Formation During Heavy Pollution in the North China Plain, Earth Space Sci., 6, 1675–1693, https://doi.org/10.1029/2019ea000799, 2019.
Guo, H., Xu, L., Bougiatioti, A., Cerully, K. M., Capps, S. L., Hite Jr., J. R., Carlton, A. G., Lee, S.-H., Bergin, M. H., Ng, N. L., Nenes, A., and Weber, R. J.: Fine-particle water and pH in the southeastern United States, Atmos. Chem. Phys., 15, 5211–5228, https://doi.org/10.5194/acp-15-5211-2015, 2015.
Guo, H., Sullivan, A. P., Campuzano-Jost, P., Schroder, J. C., Lopez-Hilfiker, F. D., Dibb, J. E., Jimenez, J. L., Thornton, J. A., Brown, S. S., Nenes, A., and Weber, R. J.: Fine particle pH and the partitioning of nitric acid during winter in the northeastern United States, J. Geophys. Res.-Atmos., 121, 10355–310376, https://doi.org/10.1002/2016jd025311, 2016.
Guo, Y.-T., Zhang, J., Wang, S.-G., She, F., and Li, X.: Long-term characterization of major water-soluble inorganic ions in PM10 in coastal site on the Japan Sea, J. Atmos. Chem., 68, 299–316, https://doi.org/10.1007/s10874-012-9223-8, 2011.
Han, B., Zhang, R., Yang, W., Bai, Z., Ma, Z., and Zhang, W.: Heavy haze episodes in Beijing during January 2013: Inorganic ion chemistry and source analysis using highly time-resolved measurements from an urban site, Sci. Total Environ., 544, 319–329, https://doi.org/10.1016/j.scitotenv.2015.10.053, 2016.
Harrison, R. M. and Pio, C. A.: Major ion composition and chemical associations of inorganic atmospheric aerosols, Environ. Sci. Technol., 17, 169–174, https://doi.org/10.1021/es00109a009, 1983.
He, K., Zhao, Q., Ma, Y., Duan, F., Yang, F., Shi, Z., and Chen, G.: Spatial and seasonal variability of PM2.5 acidity at two Chinese megacities: insights into the formation of secondary inorganic aerosols, Atmos. Chem. Phys., 12, 1377–1395, https://doi.org/10.5194/acp-12-1377-2012, 2012.
He, Q., Yan, Y., Guo, L., Zhang, Y., Zhang, G., and Wang, X.: Characterization and source analysis of water-soluble inorganic ionic species in PM2.5 in Taiyuan city, China, Atmos. Res., 184, 48–55, https://doi.org/10.1016/j.atmosres.2016.10.008, 2017.
Heckenberg, A. L. and Haddad, P. R.: Determination of inorganic anions at parts per billion levels using single-column ion chromatography without sample preconcentration, J. Chromatogr. A, 299, 301–305, https://doi.org/10.1016/S0021-9673(01)97845-8, 1984.
Hennigan, C. J., Izumi, J., Sullivan, A. P., Weber, R. J., and Nenes, A.: A critical evaluation of proxy methods used to estimate the acidity of atmospheric particles, Atmos. Chem. Phys., 15, 2775–2790, https://doi.org/10.5194/acp-15-2775-2015, 2015.
Huang, K., Zhuang, G., Wang, Q., Fu, J. S., Lin, Y., Liu, T., Han, L., and Deng, C.: Extreme haze pollution in Beijing during January 2013: chemical characteristics, formation mechanism and role of fog processing, Atmos. Chem. Phys. Discuss., 14, 7517–7556, https://doi.org/10.5194/acpd-14-7517-2014, 2014.
Jia, S., Wang, X., Zhang, Q., Sarkar, S., Wu, L., Huang, M., Zhang, J., and Yang, L.: Technical note: Comparison and interconversion of pH based on different standard states for aerosol acidity characterization, Atmos. Chem. Phys., 18, 11125–11133, https://doi.org/10.5194/acp-18-11125-2018, 2018.
Karthikeyan, S. and Balasubramanian, R.: Determination of water-soluble inorganic and organic species in atmospheric fine particulate matter, Microchem. J., 82, 49–55, https://doi.org/10.1016/j.microc.2005.07.003, 2006.
Kim, C. H., Choi, Y., and Ghim, Y. S.: Characterization of Volatilization of Filter-Sampled PM2.5 Semi-Volatile Inorganic Ions Using a Backup Filter and Denuders, Aerosol Air Qual. Res., 15, 814–820, https://doi.org/10.4209/aaqr.2014.09.0213, 2015.
Krudysz, M. A., Froines, J. R., Fine, P. M., and Sioutas, C.: Intra-community spatial variation of size-fractionated PM mass, OC, EC, and trace elements in the Long Beach, CA area, Atmos. Environ., 42, 5374–5389, https://doi.org/10.1016/j.atmosenv.2008.02.060, 2008.
Li, L., Yin, Y., Kong, S., Wen, B., Chen, K., Yuan, L., and Li, Q.: Altitudinal effect to the size distribution of water soluble inorganic ions in PM at Huangshan, China, Atmos. Environ., 98, 242–252, https://doi.org/10.1016/j.atmosenv.2014.08.077, 2014.
Li, X., Wang, L., Ji, D., Wen, T., Pan, Y., Sun, Y., and Wang, Y.: Characterization of the size-segregated water-soluble inorganic ions in the Jing-Jin-Ji urban agglomeration: Spatial/temporal variability, size distribution and sources, Atmos. Environ., 77, 250–259, https://doi.org/10.1016/j.atmosenv.2013.03.042, 2013.
Li, Y., Tao, J., Zhang, L., Jia, X., and Wu, Y.: High Contributions of Secondary Inorganic Aerosols to PM(2.5) under Polluted Levels at a Regional Station in Northern China, Int. J. Environ. Res. Public Health, 13, 1202, https://doi.org/10.3390/ijerph13121202, 2016.
Liu, B., Wu, J., Zhang, J., Wang, L., Yang, J., Liang, D., Dai, Q., Bi, X., Feng, Y., Zhang, Y., and Zhang, Q.: Characterization and source apportionment of PM2.5 based on error estimation from EPA PMF 5.0 model at a medium city in China, Environ. Pollut., 222, 10–22, https://doi.org/10.1016/j.envpol.2017.01.005, 2017a.
Liu, M., Song, Y., Zhou, T., Xu, Z., Yan, C., Zheng, M., Wu, Z., Hu, M., Wu, Y., and Zhu, T.: Fine particle pH during severe haze episodes in northern China, Geophys. Res. Lett., 44, 5213–5221, https://doi.org/10.1002/2017GL073210, 2017b.
Liu, Y., Yan, C., Ding, X., Wang, X., Fu, Q., Zhao, Q., Zhang, Y., Duan, Y., Qiu, X., and Zheng, M.: Sources and spatial distribution of particulate polycyclic aromatic hydrocarbons in Shanghai, China, Sci. Total Environ., 584, 307–317, https://doi.org/10.1016/j.scitotenv.2016.12.134, 2017c.
Liu, Y., Yan, C., Feng, Z., Zheng, F., Fan, X., Zhang, Y., Li, C., Zhou, Y., Lin, Z., Guo, Y., Zhang, Y., Ma, L., Zhou, W., Liu, Z., Dada, L., Dällenbach, K., Kontkanen, J., Cai, R., Chan, T., Chu, B., Du, W., Yao, L., Wang, Y., Cai, J., Kangasluoma, J., Kokkonen, T., Kujansuu, J., Rusanen, A., Deng, C., Fu, Y., Yin, R., Li, X., Lu, Y., Liu, Y., Lian, C., Yang, D., Wang, W., Ge, M., Wang, Y., Worsnop, D. R., Junninen, H., He, H., Kerminen, V.-M., Zheng, J., Wang, L., Jiang, J., Petäjä, T., Bianchi, F., and Kulmala, M.: Continuous and comprehensive atmospheric observations in Beijing: a station to understand the complex urban atmospheric environment, Big Earth Data, 4, 295–321, https://doi.org/10.1080/20964471.2020.1798707, 2020.
Masiol, M., Squizzato, S., Formenton, G., Khan, M. B., Hopke, P. K., Nenes, A., Pandis, S. N., Tositti, L., Benetello, F., Visin, F., and Pavoni, B.: Hybrid multiple-site mass closure and source apportionment of PM2.5 and aerosol acidity at major cities in the Po Valley, Sci. Total Environ., 704, 135287, https://doi.org/10.1016/j.scitotenv.2019.135287, 2020.
Meng, C. C., Wang, L. T., Zhang, F. F., Wei, Z., Ma, S. M., Ma, X., and Yang, J.: Characteristics of concentrations and water-soluble inorganic ions in PM2.5 in Handan City, Hebei province, China, Atmos. Res., 171, 133–146, https://doi.org/10.1016/j.atmosres.2015.12.013, 2016.
Middlebrook, A. M., Bahreini, R., Jimenez, J. L., and Canagaratna, M. R.: Evaluation of Composition-Dependent Collection Efficiencies for the Aerodyne Aerosol Mass Spectrometer using Field Data, Aerosol Sci. Technol., 46, 258–271, https://doi.org/10.1080/02786826.2011.620041, 2012.
Mkoma, S. L., Wang, W., and Maenhaut, W.: Seasonal variation of water-soluble inorganic species in the coarse and fine atmospheric aerosols at Dar es Salaam, Tanzania, Nucl. Instrum. Meth. B, 267, 2897–2902, https://doi.org/10.1016/j.nimb.2009.06.099, 2009.
Ng, N. L., Herndon, S. C., Trimborn, A., Canagaratna, M. R., Croteau, P. L., Onasch, T. B., Sueper, D., Worsnop, D. R., Zhang, Q., Sun, Y. L., and Jayne, J. T.: An Aerosol Chemical Speciation Monitor (ACSM) for Routine Monitoring of the Composition and Mass Concentrations of Ambient Aerosol, Aerosol Sci. Technol., 45, 780–794, https://doi.org/10.1080/02786826.2011.560211, 2011.
Pathak, R. K., Wu, W. S., and Wang, T.: Summertime PM2.5 ionic species in four major cities of China: nitrate formation in an ammonia-deficient atmosphere, Atmos. Chem. Phys., 9, 1711–1722, https://doi.org/10.5194/acp-9-1711-2009, 2009.
Pye, H. O. T., Nenes, A., Alexander, B., Ault, A. P., Barth, M. C., Clegg, S. L., Collett Jr., J. L., Fahey, K. M., Hennigan, C. J., Herrmann, H., Kanakidou, M., Kelly, J. T., Ku, I.-T., McNeill, V. F., Riemer, N., Schaefer, T., Shi, G., Tilgner, A., Walker, J. T., Wang, T., Weber, R., Xing, J., Zaveri, R. A., and Zuend, A.: The acidity of atmospheric particles and clouds, Atmos. Chem. Phys., 20, 4809–4888, https://doi.org/10.5194/acp-20-4809-2020, 2020.
Shi, Z., Vu, T., Kotthaus, S., Harrison, R. M., Grimmond, S., Yue, S., Zhu, T., Lee, J., Han, Y., Demuzere, M., Dunmore, R. E., Ren, L., Liu, D., Wang, Y., Wild, O., Allan, J., Acton, W. J., Barlow, J., Barratt, B., Beddows, D., Bloss, W. J., Calzolai, G., Carruthers, D., Carslaw, D. C., Chan, Q., Chatzidiakou, L., Chen, Y., Crilley, L., Coe, H., Dai, T., Doherty, R., Duan, F., Fu, P., Ge, B., Ge, M., Guan, D., Hamilton, J. F., He, K., Heal, M., Heard, D., Hewitt, C. N., Hollaway, M., Hu, M., Ji, D., Jiang, X., Jones, R., Kalberer, M., Kelly, F. J., Kramer, L., Langford, B., Lin, C., Lewis, A. C., Li, J., Li, W., Liu, H., Liu, J., Loh, M., Lu, K., Lucarelli, F., Mann, G., McFiggans, G., Miller, M. R., Mills, G., Monk, P., Nemitz, E., O'Connor, F., Ouyang, B., Palmer, P. I., Percival, C., Popoola, O., Reeves, C., Rickard, A. R., Shao, L., Shi, G., Spracklen, D., Stevenson, D., Sun, Y., Sun, Z., Tao, S., Tong, S., Wang, Q., Wang, W., Wang, X., Wang, X., Wang, Z., Wei, L., Whalley, L., Wu, X., Wu, Z., Xie, P., Yang, F., Zhang, Q., Zhang, Y., Zhang, Y., and Zheng, M.: Introduction to the special issue “In-depth study of air pollution sources and processes within Beijing and its surrounding region (APHH-Beijing)”, Atmos. Chem. Phys., 19, 7519–7546, https://doi.org/10.5194/acp-19-7519-2019, 2019.
Shon, Z.-H., Kim, K.-H., Song, S.-K., Jung, K., Kim, N.-J., and Lee, J.-B.: Relationship between water-soluble ions in PM2.5 and their precursor gases in Seoul megacity, Atmos. Environ., 59, 540–550, https://doi.org/10.1016/j.atmosenv.2012.04.033, 2012.
Song, S., Gao, M., Xu, W., Shao, J., Shi, G., Wang, S., Wang, Y., Sun, Y., and McElroy, M. B.: Fine-particle pH for Beijing winter haze as inferred from different thermodynamic equilibrium models, Atmos. Chem. Phys., 18, 7423–7438, https://doi.org/10.5194/acp-18-7423-2018, 2018.
Song, S., Nenes, A., Gao, M., Zhang, Y., Liu, P., Shao, J., Ye, D., Xu, W., Lei, L., Sun, Y., Liu, B., Wang, S., and McElroy, M. B.: Thermodynamic Modeling Suggests Declines in Water Uptake and Acidity of Inorganic Aerosols in Beijing Winter Haze Events during 2014/2015–2018/2019, Environ. Sci. Technol. Lett., 6, 752–760, https://doi.org/10.1021/acs.estlett.9b00621, 2019.
Sun, J., Zhang, Q., Canagaratna, M. R., Zhang, Y., Ng, N. L., Sun, Y., Jayne, J. T., Zhang, X., Zhang, X., and Worsnop, D. R.: Highly time- and size-resolved characterization of submicron aerosol particles in Beijing using an Aerodyne Aerosol Mass Spectrometer, Atmos. Environ., 44, 131–140, https://doi.org/10.1016/j.atmosenv.2009.03.020, 2010.
Sun, Y., Wang, Z., Dong, H., Yang, T., Li, J., Pan, X., Chen, P., and Jayne, J. T.: Characterization of summer organic and inorganic aerosols in Beijing, China with an Aerosol Chemical Speciation Monitor, Atmos. Environ., 51, 250–259, https://doi.org/10.1016/j.atmosenv.2012.01.013, 2012.
Sun, Y., He, Y., Kuang, Y., Xu, W., Song, S., Ma, N., Tao, J., Cheng, P., Wu, C., Su, H., Cheng, Y., Xie, C., Chen, C., Lei, L., Qiu, Y., Fu, P., Croteau, P., and Worsnop, D. R.: Chemical Differences Between PM1 and PM2.5 in Highly Polluted Environment and Implications in Air Pollution Studies, Geophys. Res. Lett., 47, e2019GL086288, https://doi.org/10.1029/2019gl086288, 2020.
Takami, A., Miyoshi, T., Shimono, A., Kaneyasu, N., Kato, S., Kajii, Y., and Hatakeyama, S.: Transport of anthropogenic aerosols from Asia and subsequent chemical transformation, J. Geophys. Res., 112, D22S31, https://doi.org/10.1029/2006JD008120, 2007.
Tian, M., Wang, H., Chen, Y., Zhang, L., Shi, G., Liu, Y., Yu, J., Zhai, C., Wang, J., and Yang, F.: Highly time-resolved characterization of water-soluble inorganic ions in PM2.5 in a humid and acidic mega city in Sichuan Basin, China, Sci. Total Environ., 580, 224–234, https://doi.org/10.1016/j.scitotenv.2016.12.048, 2017.
Wang, S., Yin, S., Zhang, R., Yang, L., Zhao, Q., Zhang, L., Yan, Q., Jiang, N., and Tang, X.: Insight into the formation of secondary inorganic aerosol based on high-time-resolution data during haze episodes and snowfall periods in Zhengzhou, China, Sci. Total Environ., 660, 47–56, https://doi.org/10.1016/j.scitotenv.2018.12.465, 2019.
Wang, S., Wang, L., Li, Y., Wang, C., Wang, W., Yin, S., and Zhang, R.: Effect of ammonia on fine-particle pH in agricultural regions of China: comparison between urban and rural sites, Atmos. Chem. Phys., 20, 2719–2734, https://doi.org/10.5194/acp-20-2719-2020, 2020.
Wang, Y., Zhang, Q., Jiang, J., Zhou, W., Wang, B., He, K., Duan, F., Zhang, Q., Philip, S., and Xie, Y.: Enhanced sulfate formation during China's severe winter haze episode in Jan 2013 missing from current models, J. Geophys. Res.-Atmos., 119, 10425–10440, https://doi.org/10.1002/2013JD021426, 2014.
Weber, R. J., Guo, H., Russell, A. G., and Nenes, A.: High aerosol acidity despite declining atmospheric sulfate concentrations over the past 15 years, Nat. Geosci., 9, 282–285, https://doi.org/10.1038/ngeo2665, 2016.
Xu, Q., Wang, S., Jiang, J., Bhattarai, N., Li, X., Chang, X., Qiu, X., Zheng, M., Hua, Y., and Hao, J.: Nitrate dominates the chemical composition of PM2.5 during haze event in Beijing, China, Sci. Total Environ., 689, 1293–1303, https://doi.org/10.1016/j.scitotenv.2019.06.294, 2019a.
Xu, W., Liu, X., Liu, L., Dore, A. J., Tang, A., Lu, L., Wu, Q., Zhang, Y., Hao, T., Pan, Y., Chen, J., and Zhang, F.: Impact of emission controls on air quality in Beijing during APEC 2014: Implications from water-soluble ions and carbonaceous aerosol in PM2.5 and their precursors, Atmos. Environ., 210, 241–252, https://doi.org/10.1016/j.atmosenv.2019.04.050, 2019b.
Xue, J., Lau, A. K. H., and Yu, J. Z.: A study of acidity on PM2.5 in Hong Kong using online ionic chemical composition measurements, Atmos. Environ., 45, 7081–7088, https://doi.org/10.1016/j.atmosenv.2011.09.040, 2011.
Yao, X., Yan Ling, T., Fang, M., and Chan, C. K.: Comparison of thermodynamic predictions for in situ pH in PM2.5, Atmos. Environ., 40, 2835–2844, https://doi.org/10.1016/j.atmosenv.2006.01.006, 2006.
Yu, X.-C., He, K.-B., Yang, F., Yang, F.-M., Duan, F.-K., Zheng, A.-H., and Zhao, C.-Y.: Application of ion chromatography to the determination of water-soluble inorganic and organic ions in atmospheric aerosols, J. Environ. Sci. (China), 16, 813–815, 2004.
Yue, F., Xie, Z., Zhang, P., Song, S., He, P., Liu, C., Wang, L., Yu, X., and Kang, H.: The role of sulfate and its corresponding S(IV)+NO2 formation pathway during the evolution of haze in Beijing, Sci. Total Environ., 687, 741–751, https://doi.org/10.1016/j.scitotenv.2019.06.096, 2019.
Zhang, B., Zhou, T., Liu, Y., Yan, C., Li, X., Yu, J., Wang, S., Liu, B., and Zheng, M.: Comparison of water-soluble inorganic ions and trace metals in PM2.5 between online and offline measurements in Beijing during winter, Atmos. Pollut. Res., 10, 1755–1765, https://doi.org/10.1016/j.apr.2019.07.007, 2019.
Zhang, J. K., Cheng, M. T., Ji, D. S., Liu, Z. R., Hu, B., Sun, Y., and Wang, Y. S.: Characterization of submicron particles during biomass burning and coal combustion periods in Beijing, China, Sci. Total Environ., 562, 812–821, https://doi.org/10.1016/j.scitotenv.2016.04.015, 2016.
Zhang, Q., Jimenez, J. L., Worsnop, D. R., and Canagaratna, M.: A Case Study of Urban Particle Acidity and Its Influence on Secondary Organic Aerosol, Environ. Sci. Technol., 41, 3213–3219, https://doi.org/10.1021/es061812j, 2007.
Zhou, Y., Xue, L., Wang, T., Gao, X., Wang, Z., Wang, X., Zhang, J., Zhang, Q., and Wang, W.: Characterization of aerosol acidity at a high mountain site in central eastern China, Atmos. Environ., 51, 11–20, https://doi.org/10.1016/j.atmosenv.2012.01.061, 2012.
Zhao, J., Zhang, F., Xu, Y., and Chen, J.: Characterization of water-soluble inorganic ions in size-segregated aerosols in coastal city, Xiamen, Atmos. Res., 99, 546–562, https://doi.org/10.1016/j.atmosres.2010.12.017, 2011.
Ziemba, L. D., Fischer, E., Griffin, R. J., and Talbot, R. W.: Aerosol acidity in rural New England: Temporal trends and source region analysis, J. Geophys. Res.-Atmos., 112, D10S22, https://doi.org/10.1029/2006jd007605, 2007.
Zou, J., Liu, Z., Hu, B., Huang, X., Wen, T., Ji, D., Liu, J., Yang, Y., Yao, Q., and Wang, Y.: Aerosol chemical compositions in the North China Plain and the impact on the visibility in Beijing and Tianjin, Atmos. Res., 201, 235–246, https://doi.org/10.1016/j.atmosres.2017.09.014, 2018.