the Creative Commons Attribution 4.0 License.
the Creative Commons Attribution 4.0 License.
 | 04 Dec 2020
Comparison of formaldehyde tropospheric columns in Australia and New Zealand using MAX-DOAS, FTIR and TROPOMI
Jeremy D. Silver
Richard Querel
Dan Smale
Steve Rhodes
Matt Tully
Nicholas Jones
Robyn Schofield
South-eastern Australia has been identified by modelling studies as a hotspot of biogenic volatile organic compound (VOC) emissions; however, long-term observational VOC studies are lacking in this region. Here, 2.5 years of multi-axis differential optical absorption spectroscopy (MAX-DOAS) formaldehyde (HCHO) measurements in Australasia are presented, from Broadmeadows, in northern Melbourne, Australia, and from Lauder, a rural site in the South Island of New Zealand. Across the measurement period from December 2016 to November 2019, the mean formaldehyde columns measured by the MAX-DOAS were molec. cm−2 at Lauder and molec. cm−2 at Broadmeadows. In both locations, the seasonal cycle showed a pronounced peak in Austral summer (December–January–February) consistent with temperature-dependent formaldehyde production from biogenic precursor gases. The amplitude of the seasonal cycle was 0.7×10¹⁵ molec. cm−2 at Lauder, and it was 2.0×10¹⁵ molec. cm−2 at Broadmeadows. The Lauder MAX-DOAS HCHO measurements are compared with 27 months of co-located Fourier transform infrared (FTIR) observations. The seasonal variation of Lauder MAX-DOAS HCHO, smoothed by the FTIR averaging kernels, showed good agreement with the FTIR measurements, with a linear regression slope of 1.03 and an R2 of 0.66 for monthly averaged formaldehyde partial columns (0–4 km). In addition to ground-based observations, a clear way to address the VOC measurement gap in areas such as Australasia is with satellite measurements. Here, we demonstrate that the TROPOspheric Monitoring Instrument (TROPOMI) can be used to distinguish formaldehyde hotspots in forested and agricultural regions of south-eastern Australia. The MAX-DOAS measurements are also compared to TROPOMI HCHO vertical columns at Lauder and Melbourne; very strong monthly average agreement is found for Melbourne (regression slope of 0.61 and R2 of 0.95) and a strong agreement is found at Lauder (regression slope of 0.73 and R2 of 0.61) for MAX-DOAS vs. TROPOMI between May 2018 and November 2019. This study, the first long-term satellite comparison study using MAX-DOAS in the Southern Hemisphere, highlights the improvement offered by TROPOMI's high resolution over previous satellite products and provides the groundwork for future studies using ground-based and satellite DOAS for studying VOCs in Australasia.
- Article
(10211 KB) - Full-text XML
- BibTeX
- EndNote


Volatile organic compounds (VOCs) influence tropospheric oxidation chemistry in three key ways: oxidation by OH (thereby decreasing oxidation capacity), formation of OH (e.g. by photolysis of formaldehyde) and their contribution to tropospheric ozone formation. Remote sensing of oxidized VOCs such as formaldehyde has been demonstrated as an effective method for constraining VOC emissions and for studying the role of VOCs in atmospheric reactivity (see Kefauver et al., 2014, and references therein).
Formaldehyde has atmospheric mixing ratios ranging from several hundred parts per trillion (ppt) in unpolluted marine air (Mahajan et al., 2010; Peters et al., 2012) to tens of parts per billion (ppb) in polluted urban air (e.g. Zhu et al., 2017). Primary sources of formaldehyde include direct emission from fossil fuel combustion and wild fires. The main secondary sources of HCHO are the oxidation of methane, isoprene and monoterpenes. Methane is considered to be the primary background HCHO source globally (Pfister et al., 2008), and because it is a potent greenhouse gas, studying background formaldehyde levels has important climate change implications. Isoprene and monoterpenes emitted from vegetation constitute the main source of biogenic carbon to the atmosphere (Guenther et al., 2012). While methane is considered the most important OH sink in background oceanic air, isoprene and monoterpenes constitute the largest OH reactivity over land; hence, these biogenic VOCs play a crucial role in determining oxidative capacity (Fuentes et al., 2000; Lelieveld et al., 2008). Isoprene and monoterpenes are also thought to play a strong role in the climate system through radiative forcing by secondary formation of organic aerosols (Henze et al., 2008). Photolysis and reaction with OH limit the lifetime of formaldehyde to several hours during the daytime which facilitates the comparison of co-located measurements and also means that spatially resolved HCHO measurements closely resemble the distribution of its VOC sources (Zhu et al., 2016).
Biogenic VOC emissions in Australasia are among the highest in the world due to the abundance of Australian endemic eucalyptus trees, known to be high isoprene and monoterpene emitters (Winters et al., 2009; Guenther et al., 2012). Global-scale modelling has suggested that Australia has the highest isoprene-derived formaldehyde levels of any other continent (Pfister et al., 2008); however, constraining biogenic VOC emissions has proven challenging in Australia to date. Formaldehyde measurements, such as those from satellites, are common proxies for biogenic VOC emissions, but the accuracy of these measurements under low-NOx conditions has not been observationally verified (Zhu et al., 2016; Wolfe et al., 2016), which is likely due to uncertainties in differentiating HCHO from different anthropogenic, isoprene and monoterpene sources. Emmerson et al. (2016, 2018) highlighted this by demonstrating that the Model of Emissions of Gases and Aerosols from Nature (MEGAN) biogenic emissions scheme, used in numerous global- and regional-scale chemistry and climate models, overestimates isoprene and underestimates monoterpenes in the thickly eucalyptus-forested south-east of Australia. Therefore, reliable, long-term biogenic VOC measurements are needed in the Australasian region.
The multi-axis differential optical absorption spectroscopy (MAX-DOAS) technique, a passive spectroscopic method which uses scattered solar radiation, can facilitate this through measurement of formaldehyde. In the last decade HCHO MAX-DOAS measurements have been reported from many locations worldwide, (Hoque et al., 2018a, b; Heckel et al., 2005; Pinardi et al., 2013; Peters et al., 2012; Vigouroux et al., 2009), but none have been reported in Australasia so far.
Developments in satellite sensors and retrievals of atmospheric trace gases over the past 2 decades can offer new insights into air quality and composition (Martin, 2008). Validation by ground-based instrumentation is an important step in understanding the utility of such satellite data products. Because satellite instruments and MAX-DOAS share the same spectroscopic technique for retrieving UV and visible absorbing trace gases, MAX-DOAS is an ideal validation tool as demonstrated for HCHO in several previous papers (e.g. Chance et al., 2000; Thomas et al., 1998; Hoque et al., 2018b; De Smedt et al., 2015; Vigouroux et al., 2009; Lee et al., 2015; Kurosu et al., 2007). However, no such validation studies have been published for the Australasian region to date.
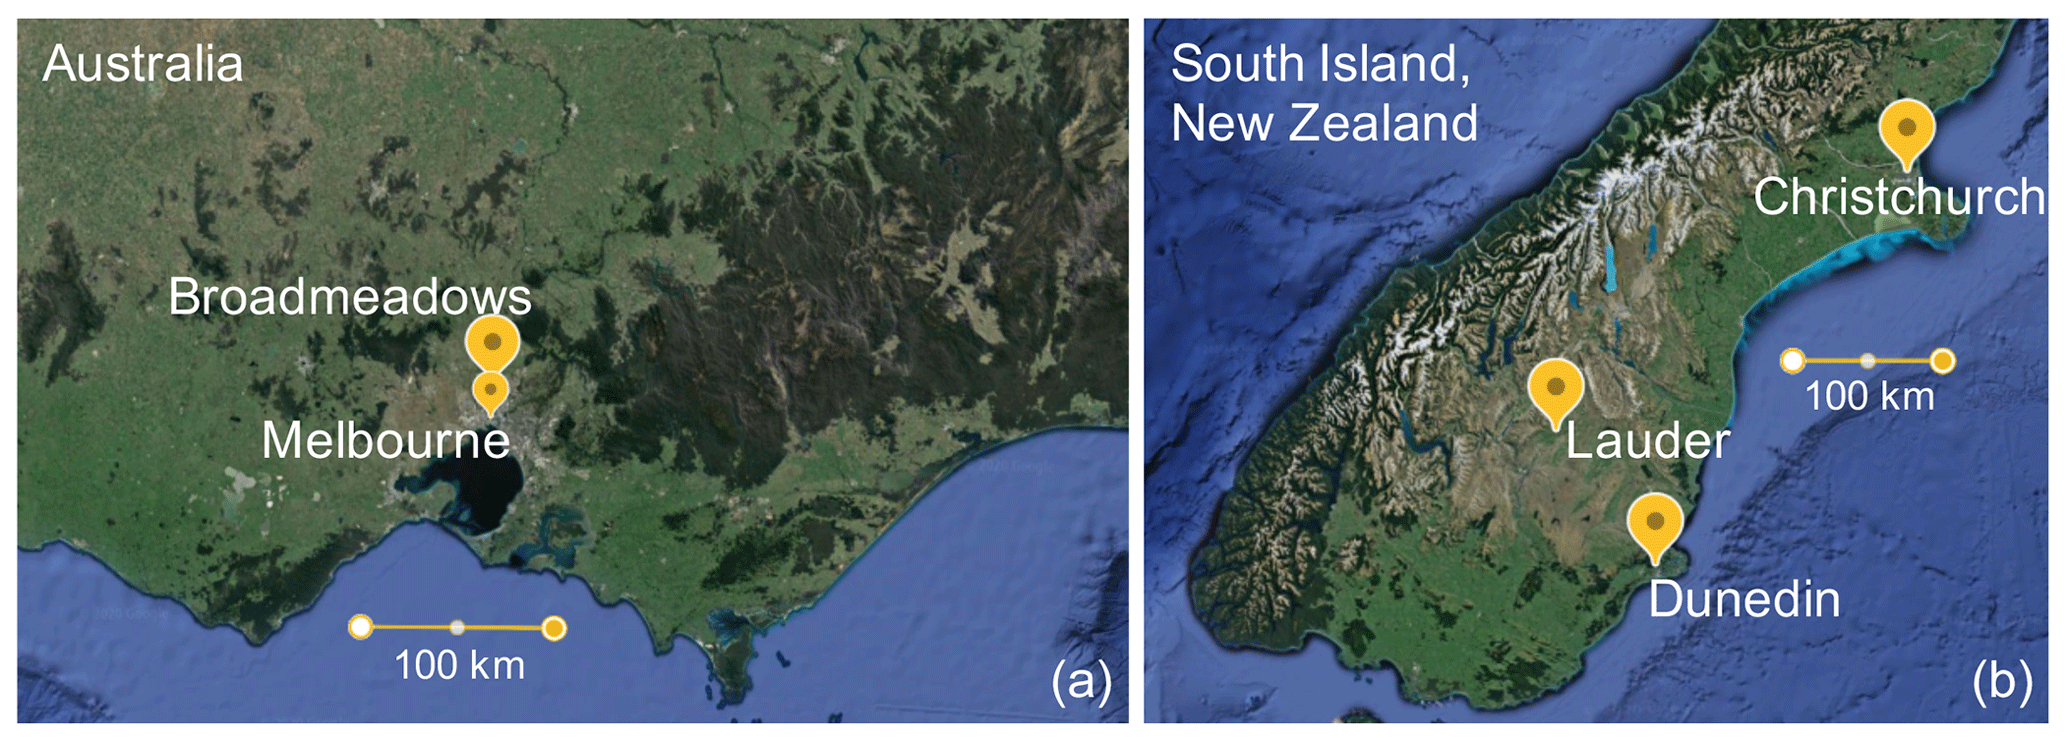
Figure 1Maps of (a) south-eastern Australia showing the location of Melbourne and the Broadmeadows measurement site, and (b) the South Island of New Zealand showing the locations of Lauder and the largest South Island cities, Dunedin and Christchurch. Map generated in Google Earth.
Measurements in two locations are discussed in this paper: Broadmeadows, on the northern fringe of Melbourne in south-eastern Australia, and Lauder, a remote locality in the South Island of New Zealand, as shown in the map in Fig. 1. Australia's Bureau of Meteorology has operated an EnviMeS MAX-DOAS instrument on a laboratory roof at its training facility at Broadmeadows (37.690∘ S, 144.947∘ E; 110 m a.m.s.l.) since December 2016. This location is close to some significant pollution sources, including factories and major roadways. MAX-DOAS measurements of nitrogen dioxide and nitrous acid at the Broadmeadows site have been reported in Ryan et al. (2018).
Lauder is located in Central Otago, New Zealand (45.038∘ S, 169.684∘ E; 370 m a.m.s.l.), surrounded by irrigated farmland, ringed by distant mountain ranges and lying approximately 30 km north-east of the nearest large town, Alexandra. An EnviMeS MAX-DOAS has been operational at Lauder since November 2016, allowing a significant period of overlap between the Lauder and Melbourne time series. The National Institute of Water and Atmospheric Research (NIWA) EnviMeS MAX-DOAS demonstrated good performance at the CINDI-2 international comparison campaign held in the Netherlands in 2016 (Kreher et al., 2020).
Both Broadmeadows and Lauder have regular co-located meteorological, aerosol, radiation and trace gas measurements; the Lauder site is part of numerous international atmospheric monitoring networks (De Mazière et al., 2018; Pollard et al., 2017; Tradowsky et al., 2018). In addition, formaldehyde vertical columns measured at Lauder using Fourier transform infrared (FTIR) spectroscopy (Vigouroux et al., 2018) are available for comparison with the MAX-DOAS measurements.
The paper is structured as follows: Sect. 2 presents the MAX-DOAS and FTIR HCHO retrieval approach used in this work; Sect. 3.1 presents the MAX-DOAS HCHO time series from Lauder and Broadmeadows, briefly discussing potential HCHO sources at each location; Sect. 3.2 compares the FTIR and MAX-DOAS HCHO results from Lauder; and Sect. 3.3 presents a comparison study for TROPOMI HCHO vs. MAX-DOAS at both Lauder and Broadmeadows.
2.1 MAX-DOAS measurements
MAX-DOAS measurements at Broadmeadows were made with a 2D EnviMeS instrument pointing to a fixed azimuth direction of 208∘. The measurement, completed over 12 min, consisted of the elevation angles 90, 30, 20, 10, 5, 3, 2 and 1∘, as described in Ryan et al. (2018). At Lauder, a 1D EnviMeS instrument was used pointed at a fixed azimuth of 30∘, and the elevation angles used were 90, 40, 20, 10, 5, 3 and 2∘. Dark current and offset corrections were made for each dataset using calibration spectra collected nightly, and initial wavelength and line-shape calibrations were facilitated by laboratory-measured mercury emission lamp spectra.
2.2 MAX-DOAS spectral analysis
The MAX-DOAS data analysis process consists of two parts: calculation of differential slant column densities (dSCDs) from the raw spectra and an inversion algorithm to retrieve vertical trace gas profiles from the dSCD information. The spectral retrieval was done in QDOAS (http://uv-vis.aeronomie.be/software/QDOAS/, last access: 10 June 2020). Cross sections used in the analysis were NO2 at 220 and 298 K (Vandaele et al., 1998), O4 at 298 K (Thalman and Volkamer, 2013), O3 at 223 and 243 K (Serdyuchenko et al., 2014), HCHO at 297 K (Meller and Moortgat, 2000), BrO at 223 K (Fleischmann et al., 2004), HONO at 298 K (Stutz et al., 2000) and a Ring cross section at 250 K (Grainger and Ring, 1962). All cross sections were pre-convolved with the line shape of the instrument and fifth-order polynomial and second-order offset terms were also included in QDOAS.
Differential slant column densities (dSCDs) of O4, used in MAX-DOAS aerosol retrievals, were determined using the wavelength range from 338 to 370, as in studies such as Ryan et al. (2018) and Kreher et al. (2020). A simple sensitivity study was run to determine the appropriate wavelength range for formaldehyde retrieval given that two wavelength ranges are common in previous papers: 324.5–359 and 336–359 nm. Formaldehyde absorption bands for formaldehyde are, in theory, measurable by the MAX-DOAS UV spectrometers used in this work down to 300 nm. Published research to date, however, tends to avoid fitting below 320 nm due to strong ozone absorption. Retrieval strategies in other work use a fitting range from 336 to 359 nm (e.g. Kreher et al., 2020; Heckel et al., 2005; Pinardi et al., 2013; Vigouroux et al., 2009) encompassing the three highest UV HCHO absorption features. Here a simple sensitivity study was run to determine if any benefit can be derived from additional absorption bands in the extended range (e.g. Chan et al., 2019; Johansson et al., 2009; Wang et al., 2017b; Franco et al., 2015). Data for this test were chosen from a clear-sky autumn day at Broadmeadows with maximum HCHO dSCDs of molec. cm−2 at a 3∘ elevation angle. The calculation of fit error in QDOAS depends on the linear fit parameters, the residuals and the information content of the retrieval, which, in turn, depends on the number of wavelengths in the fit. Neither the residual root mean square (RMS) (Fig. 2c) nor the magnitude of the dSCD (Fig. 2a) were substantially impacted by the choice of the wavelength range, suggesting that the improvement in fit error for the 324.5–359 nm range (Fig. 2b) results from increasing the information content of the retrieval. As a result of the increased information content and resulting lower fit errors, the 324.5–359 nm range was adopted in this paper for formaldehyde. An example HCHO DOAS fit is shown Fig. 2d and demonstrates the convincing retrieval of formaldehyde dSCDs using the extended range.
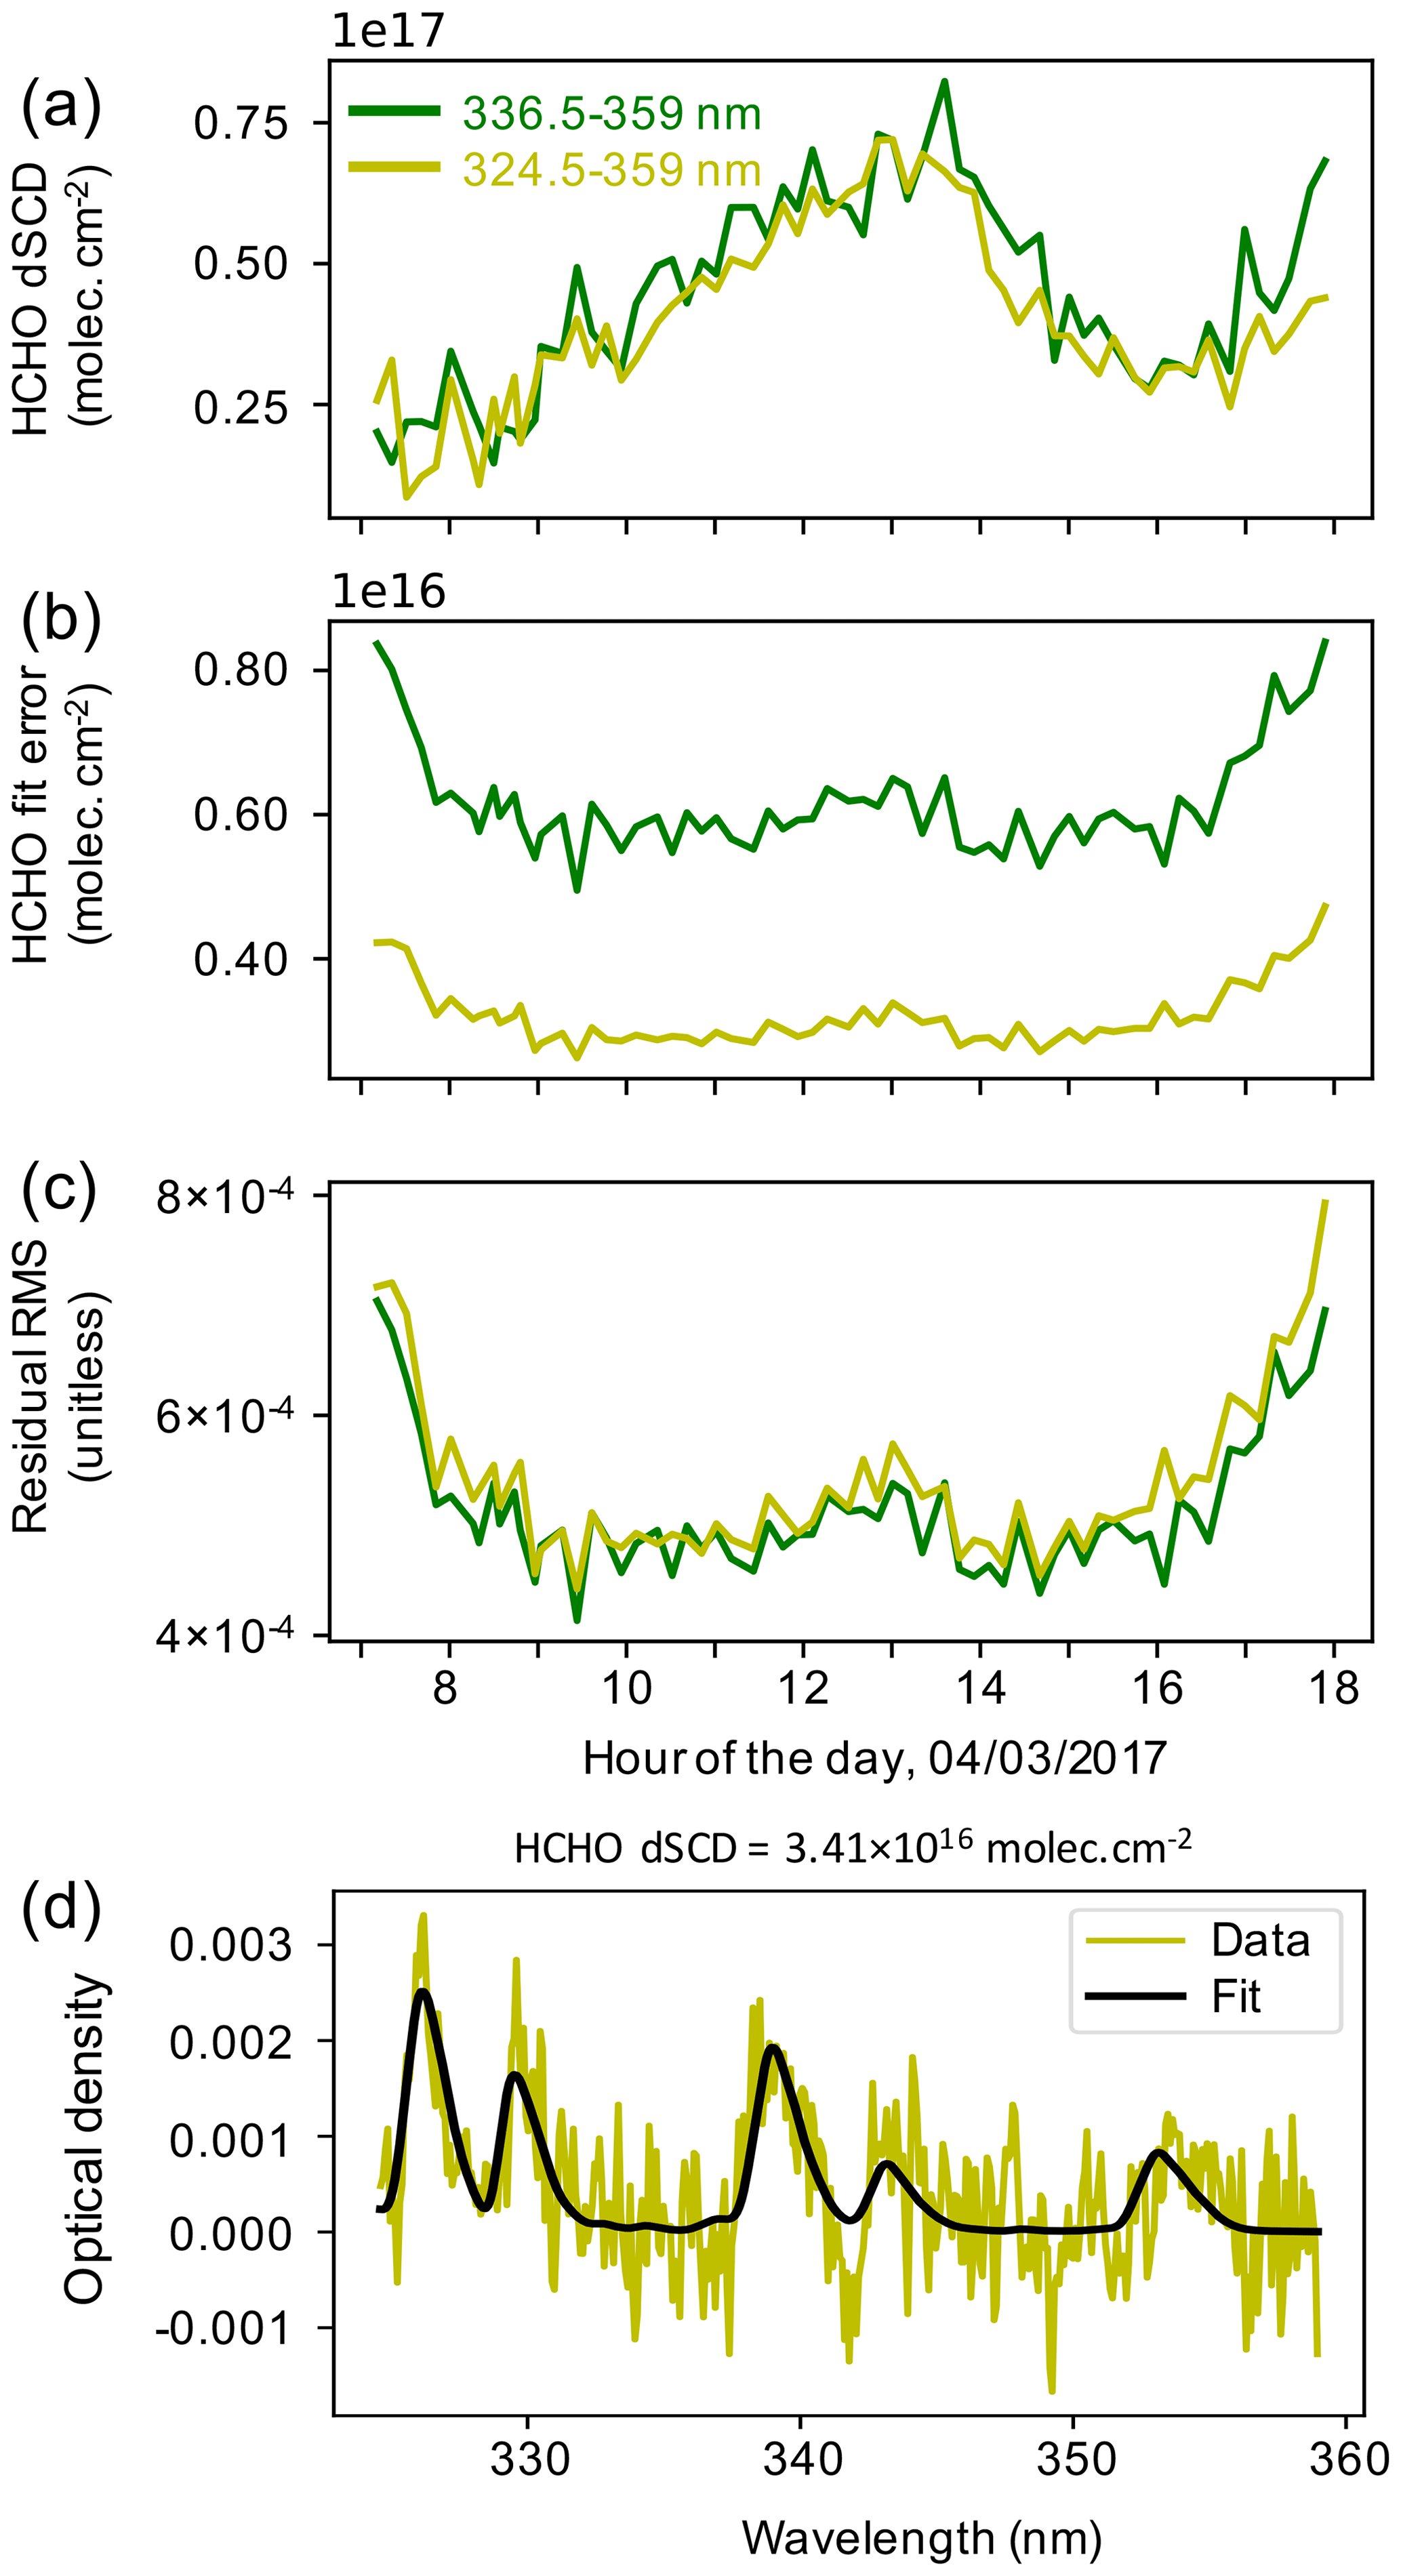
Figure 2(a–c) Results of sensitivity tests to determine the appropriate fitting range for formaldehyde, using 3∘ elevation angle data from 4 March 2017 at Broadmeadows, showing the dSCD, the dSCD fit error and the residual RMS respectively. (d) Example 3∘ elevation angle HCHO DOAS fit from 11:00 LT on the same day.
2.3 MAX-DOAS profile retrievals
Formaldehyde vertical columns and profiles from Broadmeadows and Lauder were retrieved from dSCDs using the Heidelberg profile retrieval algorithm (HEIPRO; Frieß et al., 2006). HEIPRO has previously been used for NO2 and HONO gas profile retrievals at Broadmeadows (Ryan et al., 2018). In an initial step, aerosol profiles were determined from dSCDs of the O4 dimer. These were used as input information on the light path for calculating air mass factors and HCHO vertical column density (VCD) in the second retrieval step. Vertical profiles were retrieved on a 20-layer grid with a 200 m resolution from 0 to 4 km, aerosol retrievals were calculated at 360.8 nm and HCHO retrievals were calculated at 338.9 nm. A priori profiles used in the inversion were chosen to be exponentially decreasing functions of altitude, characterized by a set surface mixing ratio and scale height, which were 0.5 ppb and 1 km respectively for formaldehyde. HEIPRO was run in 15 min intervals ensuring that each measurement set contained a full set of elevation angles. MAX-DOAS retrievals were filtered for results with less than one independent piece of information and for the presence of clouds. At Broadmeadows this was determined using an empirical algorithm based on colour indices (e.g. Gielen et al., 2014; Wagner et al., 2014, 2016), also described in Ryan et al. (2018), and at Lauder it was determined using the SkyNet AOD (aerosol optical density) flag which is calculated using the method outlined in Khatri and Takamura (2009).
The errors associated with the MAX-DOAS retrieval include systematic errors, which derive primarily from the HCHO cross section uncertainty of around 9 % (Vigouroux et al., 2009). Random errors include model parameter uncertainty (such as uncertainty in a priori parameters), which is estimated to be 10 % following the methodology outlined in Ryan et al. (2018), along with retrieval noise and smoothing errors, which were calculated in HEIPRO.

Figure 3Example HEIPRO retrieval from Broadmeadows on 13 December 2017 at 14:00 LT. Panel (a) shows the retrieved–measured dSCD comparison, panel (b) shows the retrieved and a priori profiles and panel (c) shows the averaging kernels for this retrieval.
An example MAX-DOAS HCHO retrieval from HEIPRO is shown in Fig. 3, including the model–measurement comparison, retrieved and a priori profile and averaging kernels. These example averaging kernels at Broadmeadows show the highest sensitivity at the surface as well as 3.4 degrees of freedom (DoFs) for signal. The Lauder retrievals consistently have reduced surface sensitivity and lower DoFs compared with Melbourne, which is likely related to the lower amounts of formaldehyde at Lauder and the fact that 2∘ is the lowest possible elevation angle for MAX-DOAS at Lauder due to proximate mountain ranges. Across the whole measurement period, the average DoFs value was 2.25 ± 0.34 (1σ) at Broadmeadows and 1.27 ± 0.11 (1σ) at Lauder. Detection limits for the MAX-DOAS vertical column densities at Lauder and Broadmeadows have been estimated using the method outlined in Peters et al. (2012):
where Ravg is the average residual RMS, XSmax is the maximum value of the cross section ( for HCHO) and A is the air mass factor taken here as 15 for low elevation angles. Ravg was at Broadmeadows, giving DLVCD(HCHO) as 4.9×10¹⁴ molec. cm−2. The average residual RMS was lower at Lauder, , giving a calculated detection limit of 3.2×10¹⁴ molec. cm−2. Over the whole measurement period, the average vertical column was molec. cm−2 at Lauder and molec. cm−2 at Broadmeadows, meaning that HCHO VCDs were generally above the detection limit but measurements at Lauder were closer to the detection limit than at Broadmeadows.
2.4 FTIR retrieval
Solar FTIR measurements have been made since the early 1990s at Lauder as part of the Network for Detection of Atmospheric Composition Change (NDACC; Jones et al., 1994; De Mazière et al., 2018). Measurements are made on all possible clear-sky days, throughout the day, using Bruker high-resolution (0.0035 cm−1) spectrometers (https://www.bruker.com/, last access: 10 June 2020).
Initial retrievals of HCHO from the Lauder 1992–2005 FTIR dataset are described in detail in Jones et al. (2009). The HCHO retrieval strategy (under the auspices of the NDACC infrared working group) was harmonized across the network as detailed in Vigouroux et al. (2018). Lauder spectra HCHO reprocessing was part of this harmonization activity and is the retrieval strategy used to provide HCHO data in this study. The same HCHO dataset is also used in a TROPOMI comparison study comprising globally distributed ground-based FTIR measurements (Vigouroux et al., 2020). These studies show that HCHO abundances over Lauder exhibit a seasonal cycle peaking in the summer (DJF, December–January–February).
Pertinent to this study, and paraphrasing details in Vigouroux et al. (2018), the Lauder FTIR retrievals are performed on a 48-layer atmosphere (0.37–100 km) of which 15 layers are between 0.37 and 10 km. The retrievals use a static a priori originating from WACCM_v4 (Whole Atmosphere Community Climate Model, version 4) climate–chemistry model simulations (Garcia et al., 2007), and the retrievals are constrained using Tikhonov regularization (L1, α = 100). Combined with a measurement signal-to-noise ratio of 400, the retrieval strategy has sensitivity over the altitude range from 0.37 to 26 km with an average total column DoFs of 1.4 ± 0.2 (1σ). The highest sensitivity is in the upper troposphere peaking at 8km with a full width at half maximum of 16–18 km. This differs from the MAX-DOAS measurements which has maximum sensitivity in the boundary layer. An example Lauder FTIR formaldehyde retrieval from 8 January 2018 is shown in Fig. 4. Attributed uncertainty analysis of the total column measurement gives an estimate of ≈2 % and ≈12 % for random and systematic error respectively. The systematic error is dominated by spectroscopic line strength uncertainty, whereas the major component of the random error is measurement noise.
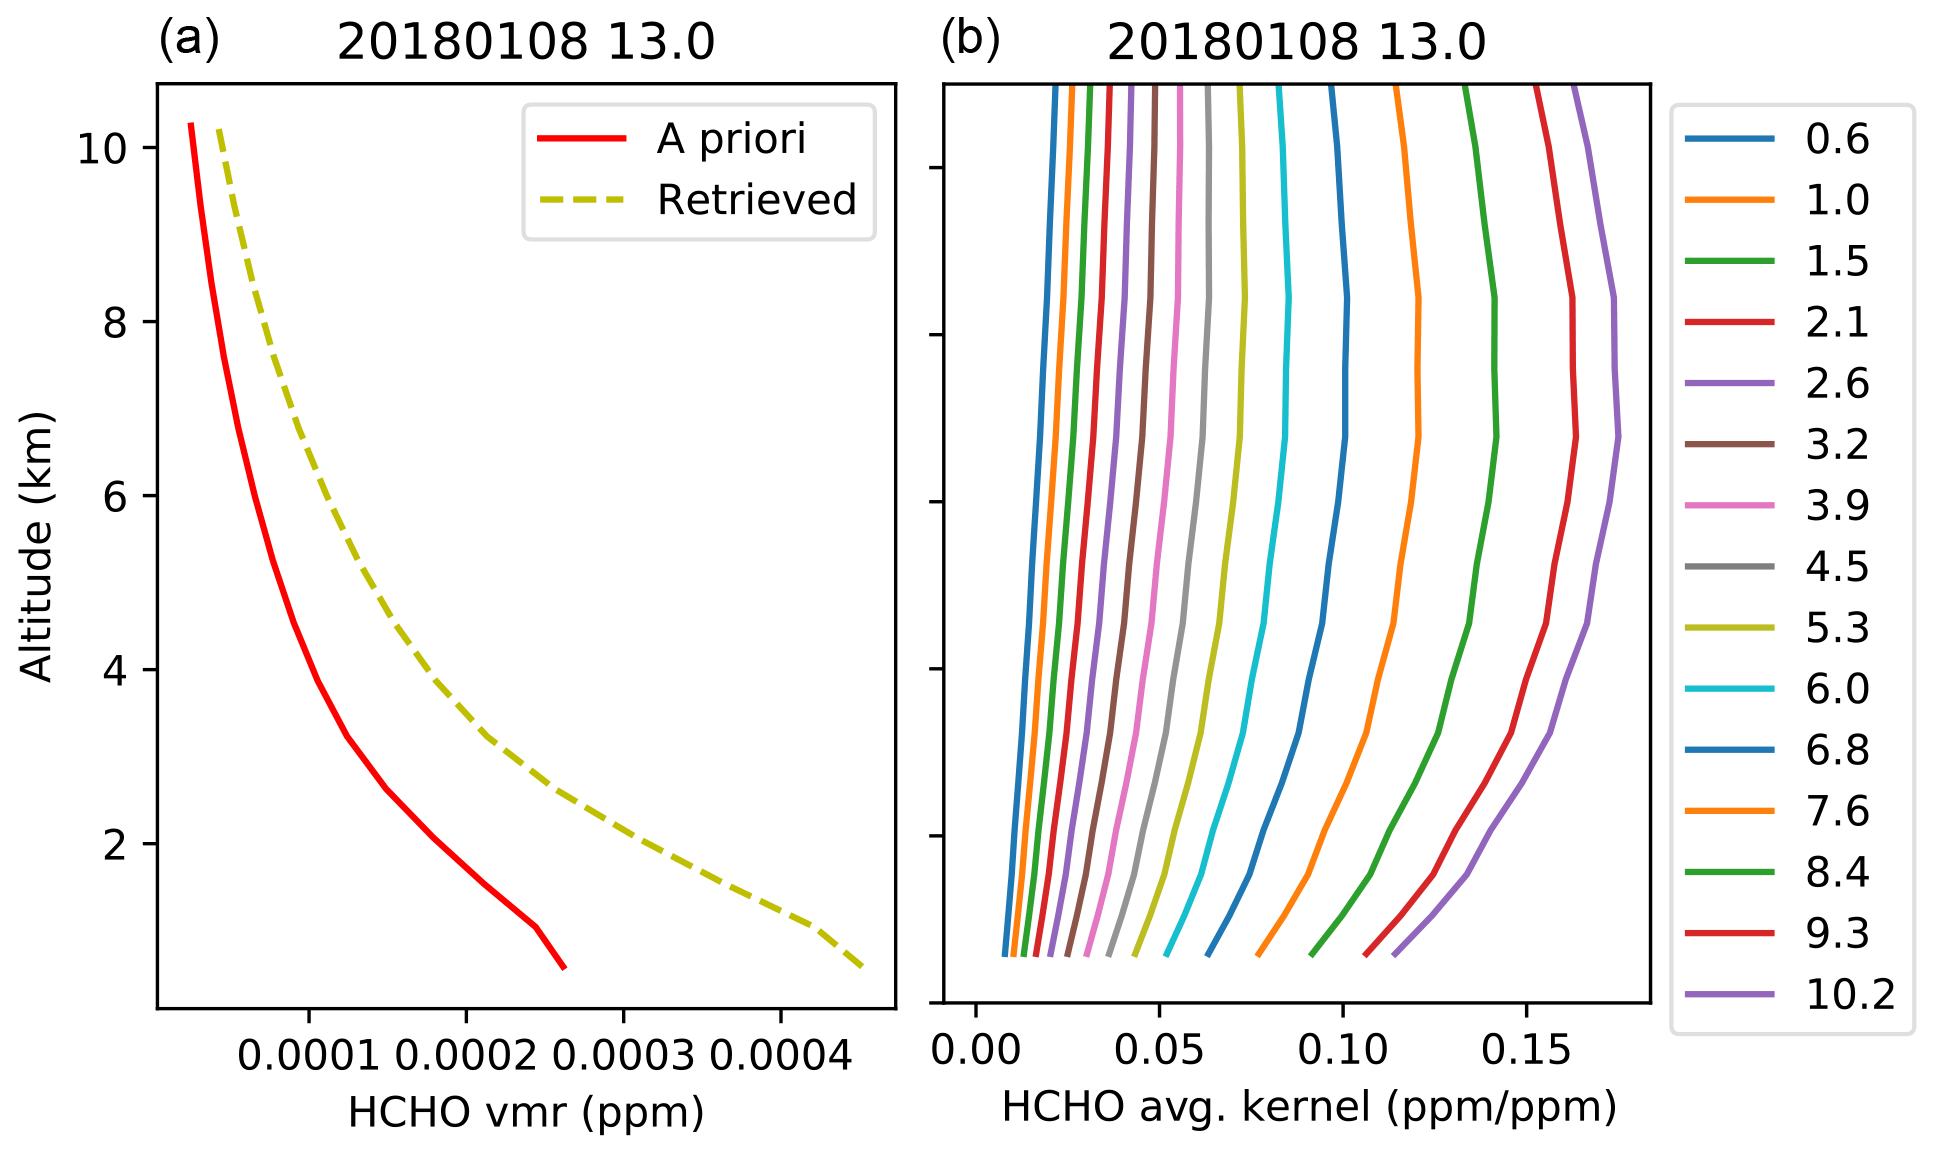
Figure 4Example FTIR profile retrieval from 13:00 LT on 8 January 2018 at Lauder. Panel (a) shows a priori and retrieved HCHO profiles in the lowest 10 km, and panel (b) shows the corresponding averaging kernels.
2.5 Satellite details
The TROPOspheric Monitoring Instrument (TROPOMI) is a nadir-viewing imaging spectrometer aboard the European Space Agency's Copernicus Sentinel 5 Precursor (S5P) satellite. S5P launched in October 2017 and is a low (afternoon) polar orbit (≈824 km) mission providing daily global coverage for a range of UV, visible and infrared absorbing trace gases (Veefkind et al., 2012). The S5P overpass time is 13:30 LT (local time), and the spatial resolution of TROPOMI is 3.6 × 7.2 km (before 6 August 2019) and 3.6 × 5.6 km (after 6 August 2019).
Formaldehyde slant column densities (SCDs) are retrieved from the analysis of absorption features over the wavelength range from 328.5 to 359 nm. The SCDs are converted to vertical columns using air mass factors calculated at 340 nm with HCHO a priori vertical profiles simulated by the TM5-MP global chemistry transport model as described in De Smedt et al. (2018).
For this study, TROPOMI data were regridded to 0.1×0.1∘, (approximately 10 × 10 km). The recommended quality control (QC) filtering was applied, excluding retrieved values where the QC flag was less than 0.5 (on a scale of 0–1), which ensures that scenes with a cloud radiance fraction (at 340 nm) < 0.5 are excluded from the comparisons. Given that the satellite overpass was around 13:30 LT, MAX-DOAS results between 13:00 and 14:00 LT were averaged for the comparisons.
The Ozone Monitoring Instrument (OMI) is also a UV–Vis nadir-viewing spectrometer providing near-global daily coverage, housed on the National Aeronautics and Space Administration's Earth Observing System Aura satellite (Levelt et al., 2006). The spatial resolution of OMI is 13 × 24 km, and the overpass time is also around 13:30 LT. Formaldehyde slant columns retrieved from OMI using a wavelength range of 327.5–356.5 nm (González Abad et al., 2015) are used along with GEOS-Chem simulated a priori profiles to calculate HCHO vertical columns (Bey et al., 2001). For comparison with the Broadmeadows MAX-DOAS dataset, OMI HCHO columns were regridded to 0.25 × 0.25∘, meaning that columns approximately 25 km either side of the measurement site were used, and as with TROPOMI, cloudy scenes were excluded from the comparison.
3.1 Lauder vs. Melbourne HCHO
The time series of monthly formaldehyde vertical columns from Broadmeadows and Lauder MAX-DOAS measurements are presented in Fig. 5a. Following the example of Jones et al. (2009), the seasonal cycle of formaldehyde was fitted with a cosine function described by the following equation:
where C(t) is the formaldehyde vertical column as a function of time (in units of days since 1 January 2016), ϕ is the phase term (in units of day of the year) and . Also fitted in the linear regression are a2 (amplitude of the seasonal cycle), a0 (the initial mean column amount) and a1 (the magnitude of the linear trend in HCHO over time). At Lauder, the mean HCHO VCD was 2.5×10¹⁵ molec. cm−2, and the amplitude of the fitted seasonal cycle was 6.9×10¹⁴ molec. cm−2; at Broadmeadows the average HCHO VCD was 5.4×10¹⁵ molec. cm−2, and the amplitude of the fitted seasonal cycle was 2.0×10¹⁵ molec. cm−2. A comparison of results from Broadmeadows and Lauder, including a breakdown of uncertainty components, is provided in Table 1. The HCHO seasonal cycle from Lauder MAX-DOAS measurements is consistent with that found from FTIR measurements at Lauder from July 2002 to July 2017 (Vigouroux et al., 2018). The fact that both the magnitude of the HCHO VCDs and amplitude of the seasonal cycle are much smaller at Lauder than Broadmeadows could be due to higher anthropogenic VOC precursors, as Melbourne is a large city, and/or due to higher biogenic VOC emissions from forests surrounding Melbourne.
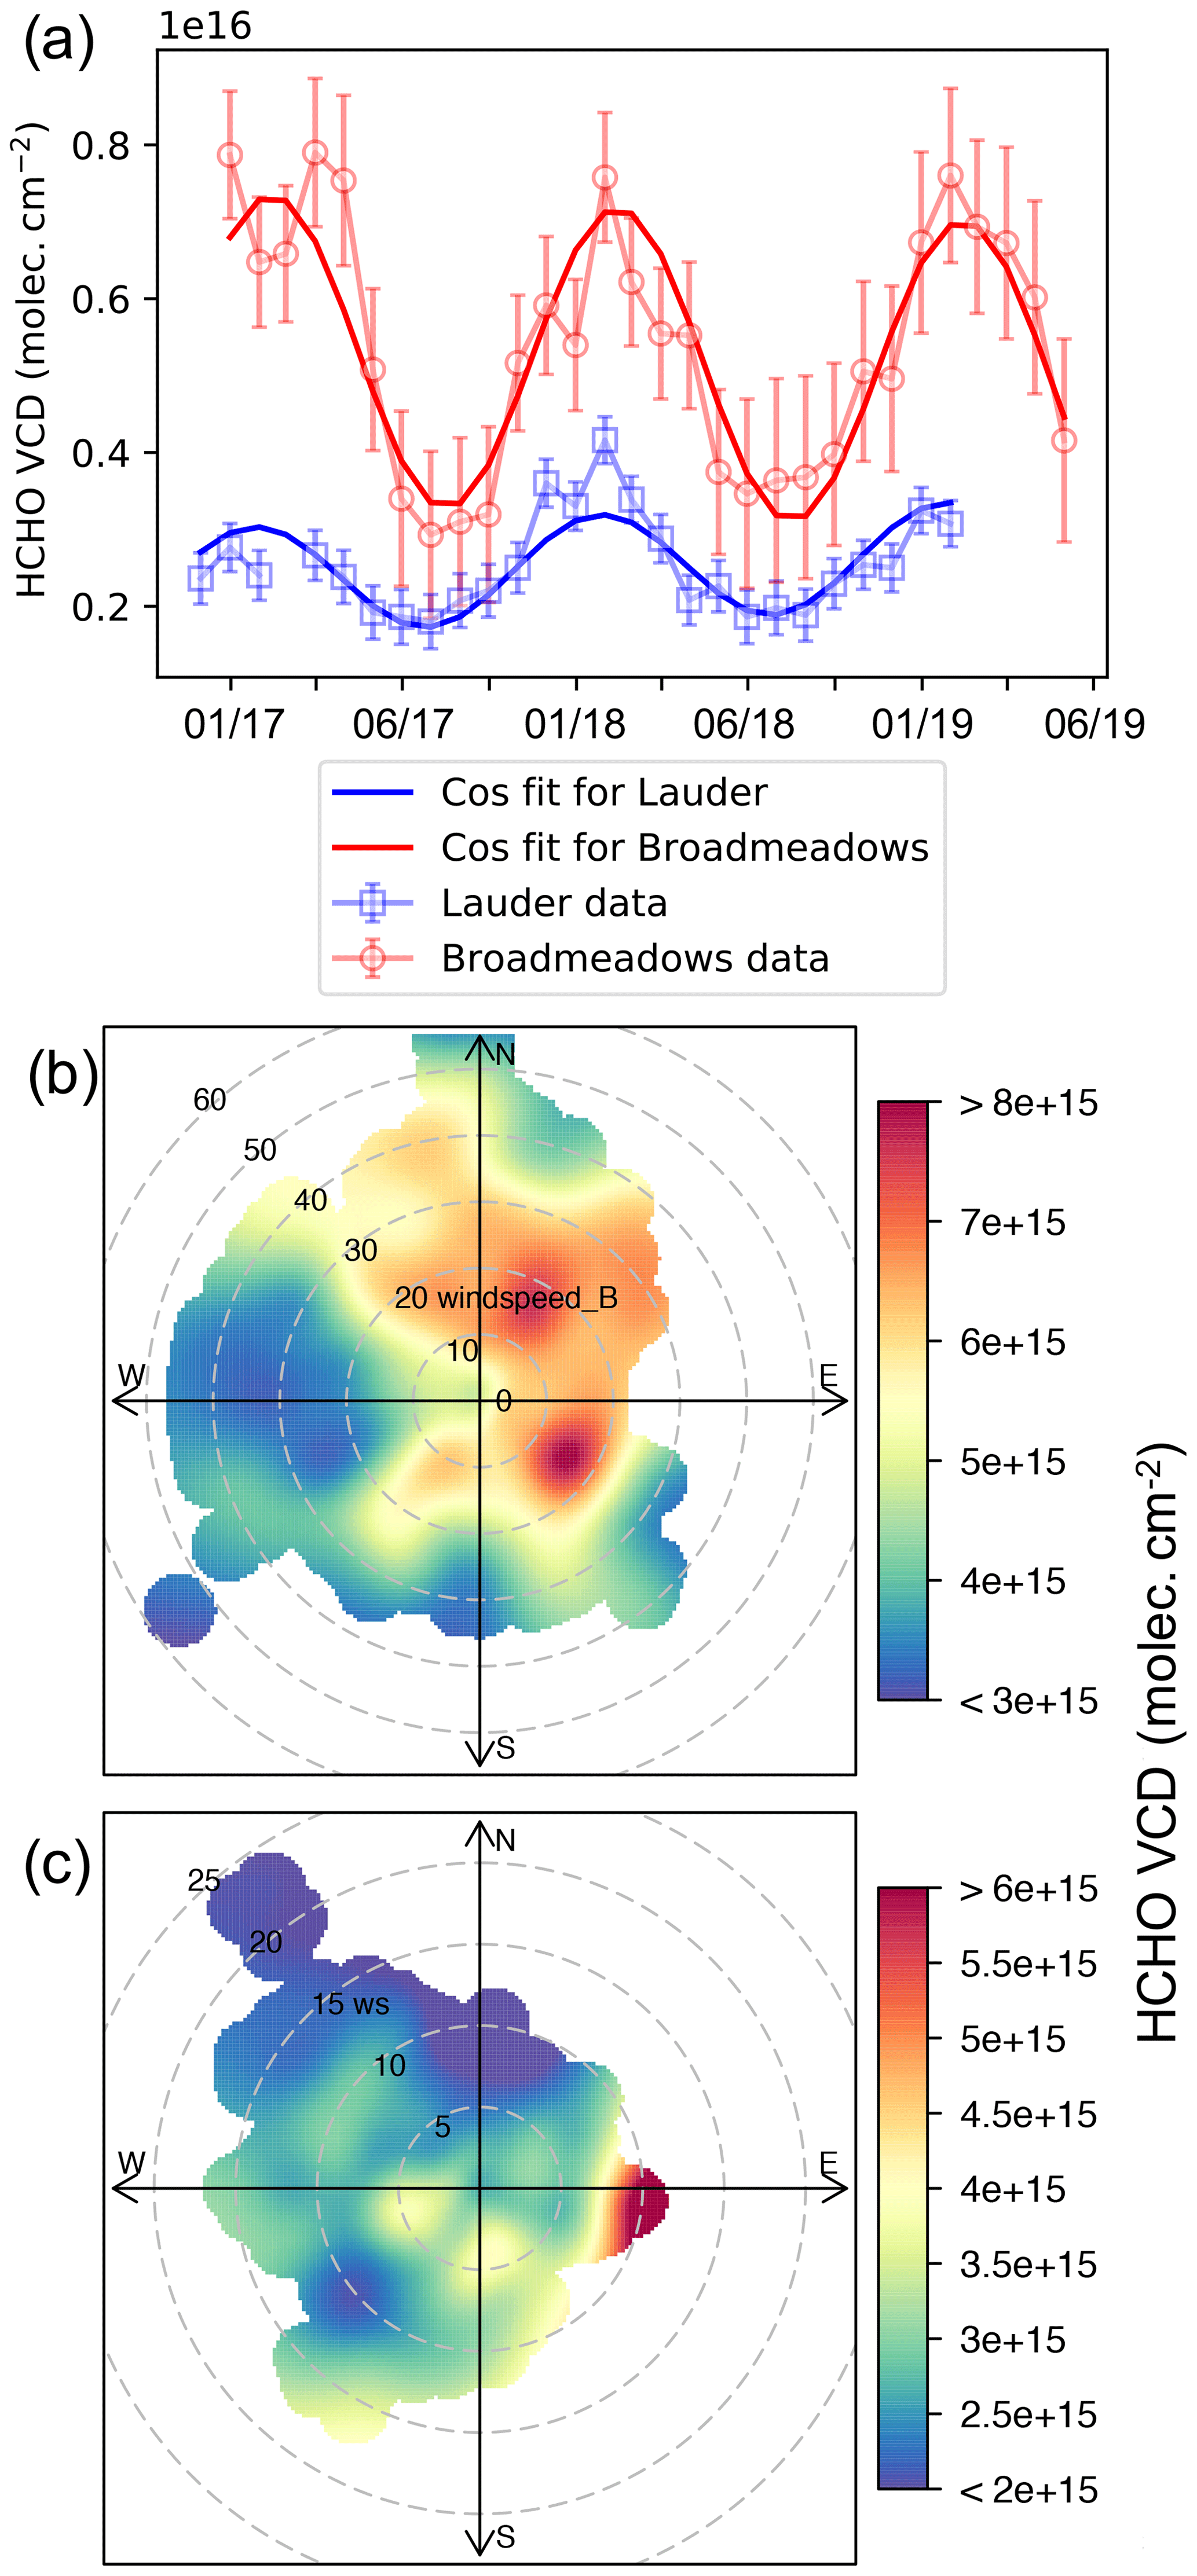
Figure 5(a) Time series of monthly averaged MAX-DOAS formaldehyde VCDs at Broadmeadows (red points) and Lauder (blue squares). Cosine fits to each dataset are also plotted (solid lines), representing the seasonal cycle of HCHO at each location. (b) Polar bivariate plot showing the relationship between HCHO VCD and wind speed (in km h−1) and direction at Broadmeadows across the measurement period. (c) Same as panel (b) but for Lauder.
Table 1Summary of MAX-DOAS formaldehyde results and the error budget from Lauder and Broadmeadows.

The seasonal cycle of formaldehyde shows a distinct austral summer peak in both locations. This would be expected from the biogenic production of formaldehyde (e.g. from isoprene), which depends strongly on temperature (Duncan et al., 2009; Palmer et al., 2006; Zhu et al., 2014). The phase of the cosine fit in each location is 31 d, indicating that the HCHO seasonal cycle peaks at the end of January. This is also consistent with the results for Lauder in Vigouroux et al. (2018) and suggests that the same background mechanisms may be responsible for summertime HCHO production at Lauder and Broadmeadows.
Polar bivariate plots showing the relationship between formaldehyde and wind direction and speed at Broadmeadows and Lauder are given in Fig. 5b and c respectively. At Broadmeadows, HCHO concentrations are highest with wind from the northern and eastern sectors, aligning with the direction of rural and densely forested regions, suggesting an important role for biogenic HCHO sources at this location. The dominant source directions from forested and rural regions, along with the summertime peak, are also consistent with biomass burning being a source of formaldehyde in Melbourne. At Lauder, maximum column amounts correspond to moderate wind speeds from the east. While over the course of the MAX-DOAS dataset the wind came from this direction less than 10 % of the time, the same key source directions including the strong “easterly maximum” are observed in polar bivariate plots of the 2001–2019 FTIR dataset (not shown). There is a large variation in vegetation types across New Zealand's South Island, including temperate rainforest in the west, dryland agricultural in the Central Otago region, and intensive irrigated pasture in much of the east, south and south-east, which might be expected to produce different volatile organic emissions and formaldehyde amounts. The highest population density in the South Island, including the cities of Dunedin and Christchurch, lies along the east coast. Given that the lifetime of formaldehyde is of the order of hours, transport of the order of a hundred kilometres is possible, meaning that the different source directions can reasonably be compared. Based on the available evidence, it could be hypothesized that the agricultural and more densely populated eastern sector is a stronger source of formaldehyde to Lauder than the forested west coast.
3.2 MAX-DOAS vs. FTIR at Lauder
One previous study, carried out on the tropical Reunion Island, highlights a comparison between MAX-DOAS and FTIR formaldehyde columns (Vigouroux et al., 2009). In that paper, the comparison period was 4 months. In this work, co-located measurements over a period of 27 months are compared, from November 2016 to January 2019, allowing for the comparison of HCHO over two annual cycles. The comparison method used here has been adapted from Vigouroux et al. (2009) and Rodgers and Connor (2003). Partial column amounts have been compared in the lowest 4 km of the atmosphere, which is the region of expected formaldehyde production and the region of highest sensitivity for MAX-DOAS measurements. Because the FTIR instrument is less sensitive to the HCHO partial column in the lowest 4 km (as is evident from the averaging kernels in Figs. 3a and 4), the MAX-DOAS partial columns have been smoothed by the FTIR total averaging kernel using the method outlined in Vigouroux et al. (2009). As in Vigouroux et al. (2009), the equation for the smoothing is simplified by the fact that the same a priori profile was used to retrieve MAX-DOAS and FTIR profiles, allowing the smoothed DOAS column to be given by the following equation:
where AF is the FTIR total column averaging kernel matrix (from 0 to 4 km), which is unitless (calculated as mixing ratio/mixing ratio); Ca is the common a priori column amount; xD is the original retrieved MAX-DOAS profile; xa is the common a priori profile; and CDOAS,smooth is the smoothed MAX-DOAS column amount. Only columns between 08:00 and 18:00 LT contributed to the monthly averages examined here.

Figure 6(a) Time series comparison of monthly averaged FTIR and MAX-DOAS (original and smoothed with FTIR averaging kernels) HCHO vertical columns from November 2016 to January 2019 at Lauder. (b) Scatter plot comparison of FTIR with MAX-DOAS smoothed HCHO columns.
The time series of monthly averaged results is presented in Fig. 6a, showing that both measurements capture the same broad seasonal cycle at Lauder and that monthly average columns for both measurements were clearly above the calculated MAX-DOAS detection limit. The month-to-month variation in formaldehyde is in especially good temporal agreement for summer (DJF) 2017–2018, whereas both the timing and magnitude of HCHO in summer 2016–2017 and 2018–2019 are poorly replicated by the FTIR. Due to the higher sensitivity of the MAX-DOAS to the lower troposphere, this suggests that HCHO plumes were lower in 2016–2017 and 2018–2019; therefore, they were not captured as well by the FTIR in 2016–2017 and 2018–2019 as they were in the summer of 2017–2018. There is a clear offset between the MAX-DOAS and FTIR columns, with the FTIR consistently lower across the comparison period. Comparing the measurements by linear (Deming method, incorporating errors in both the x and y ordinates), the offset is found to be 2.92×10¹⁵ molec. cm−2 and almost constant, as indicated by the regression slope (1.17, see Fig. 6b). The time series also shows that smoothing the DOAS partial columns brought them more into line with the FTIR columns, especially in the peak months (November–March). The R2 value of 0.65 (n=27) for the regression in Fig. 6b highlights the moderate temporal agreement. Considering daily averages, a slope of 1.31 and an R2 of 0.42 (n=810) were found, whereas the slope of the Deming regression was 1.19 with an R2=0.47 (n=116) for weekly averages. The weekly and daily average time series and scatter plots are shown in Fig. A1 in Appendix A.
Table 2Summary of MAX-DOAS formaldehyde results and error budget from Lauder and Broadmeadows. The slope and R2 are from the linear regression fit to y = Slope , where y = FTIR or TROPOMI HCHO columns, and x = MAX-DOAS HCHO columns. The random and systematic error columns represent the breakdown of errors on the column differences. Percentages are with respect to the MAX-DOAS columns.
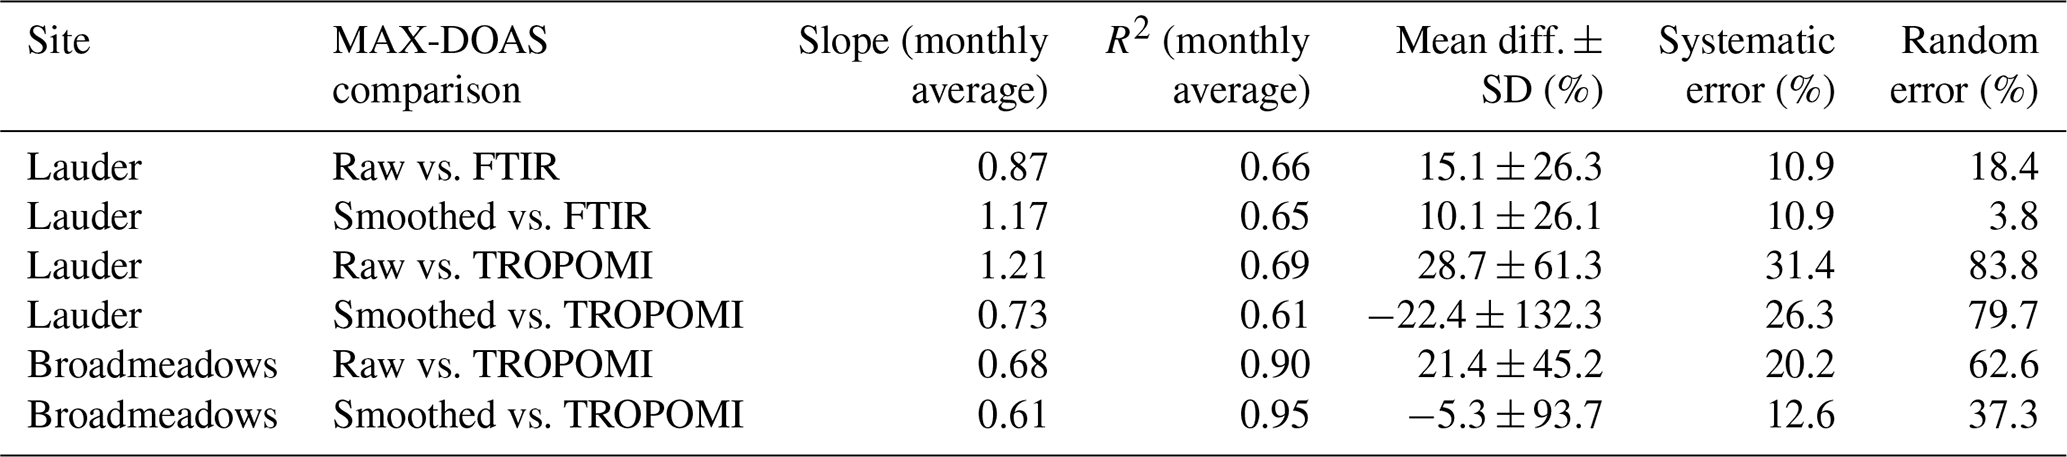
The differences and errors on the differences between MAX-DOAS and FTIR columns were calculated for the smoothed and original MAX-DOAS columns following the method outlined in Vigouroux et al. (2009). For the raw MAX-DOAS columns, the difference (MAX-DOAS – FTIR, ±1σ) was 15.1 ± 26.3 %, whereas it was 10.1 ± 26.1 % for the smoothed comparison. These results and the breakdown of random and systematic errors on the differences are compiled in Table 2.
The differences and standard deviations of the column comparisons are slightly larger here than for the results found in the Reunion Island comparison (Vigouroux et al., 2009), where no significant offset between measurements was observed. In contrast to their study, the smoothing was found to improve the mean difference between the columns in this work. The greater mean difference and standard deviations of the differences at Lauder compared with Vigouroux et al. (2009) likely reflect the much longer comparison period, incorporating variations across a much wider range of atmospheric conditions, and the fact that only the altitude range of 0–4 km is examined in this work rather than the 0–10 km range used in Vigouroux et al. (2009). In addition, differences in site characteristics may play a role in the greater offset observed at Lauder. Reunion Island, being a coastal site, is likely to be measuring marine background formaldehyde, as indicated by the fact that the 2007 measurements in Vigouroux et al. (2009) rarely exceeded 7.7×10¹⁵ molec. cm−2, with little local surface HCHO production. In comparison, the mean smoothed DOAS column across the 27-month comparison period was 7.7×10¹⁵ molec. cm−2, suggesting greater local production, which will occur at the surface where the MAX-DOAS sensitivity is greatest and the FTIR least sensitive.
3.3 MAX-DOAS vs. TROPOMI
In this section, MAX-DOAS formaldehyde columns are compared with satellite results. Firstly, Lauder HCHO MAX-DOAS columns are examined alongside results from TROPOMI. Following the example of MAX-DOAS vs. satellite formaldehyde comparisons in Hoque et al. (2018b) and De Smedt et al. (2015), vertical columns are compared rather than profiles.
TROPOMI reports an uncertainty on the column amount; however, it was found that this uncertainty was highly correlated with the magnitude of the column amount. Therefore, we estimated the uncertainty on the satellite column retrievals from the number of retrievals contributing to the averaged column in the 0.1×0.1∘ grid box (number per cell, Npc) and the standard deviation of those retrievals (SDT): . More measurements were available from TROPOMI over Broadmeadows than at Lauder, with an average Npc across the comparison period, considering TROPOMI pixels 0.1∘ either side of the ground-based station, of 1.18 in New Zealand and 2.76 in Melbourne. Because Npc was often below one for a 0.1∘ resolution, comparison with MAX-DOAS results was carried out at a 0.2∘ resolution. The final compared results filtered out pixels with Npc<1, giving an average Npc of 1.84 for Lauder and 2.94 for Broadmeadows. The discrepancy in Npc could be due to more cloud over New Zealand than Victoria, or because HCHO columns over Lauder are low enough to be approaching the detection limit. TROPOMI results showed greater spatial variation over New Zealand than Victoria, as illustrated in the example map in Fig. 7a. This is reflected in the standard deviation (SDT) of HCHO retrievals contributing to the Lauder and Broadmeadows average TROPOMI columns: the mean ±SDT was and molec. cm−2 for Lauder and Broadmeadows respectively. Overall, these factors combined to give a high mean percentage variance for Lauder TROPOMI columns of 129 %, whereas the mean percentage variance was only 9.7 % for Broadmeadows.
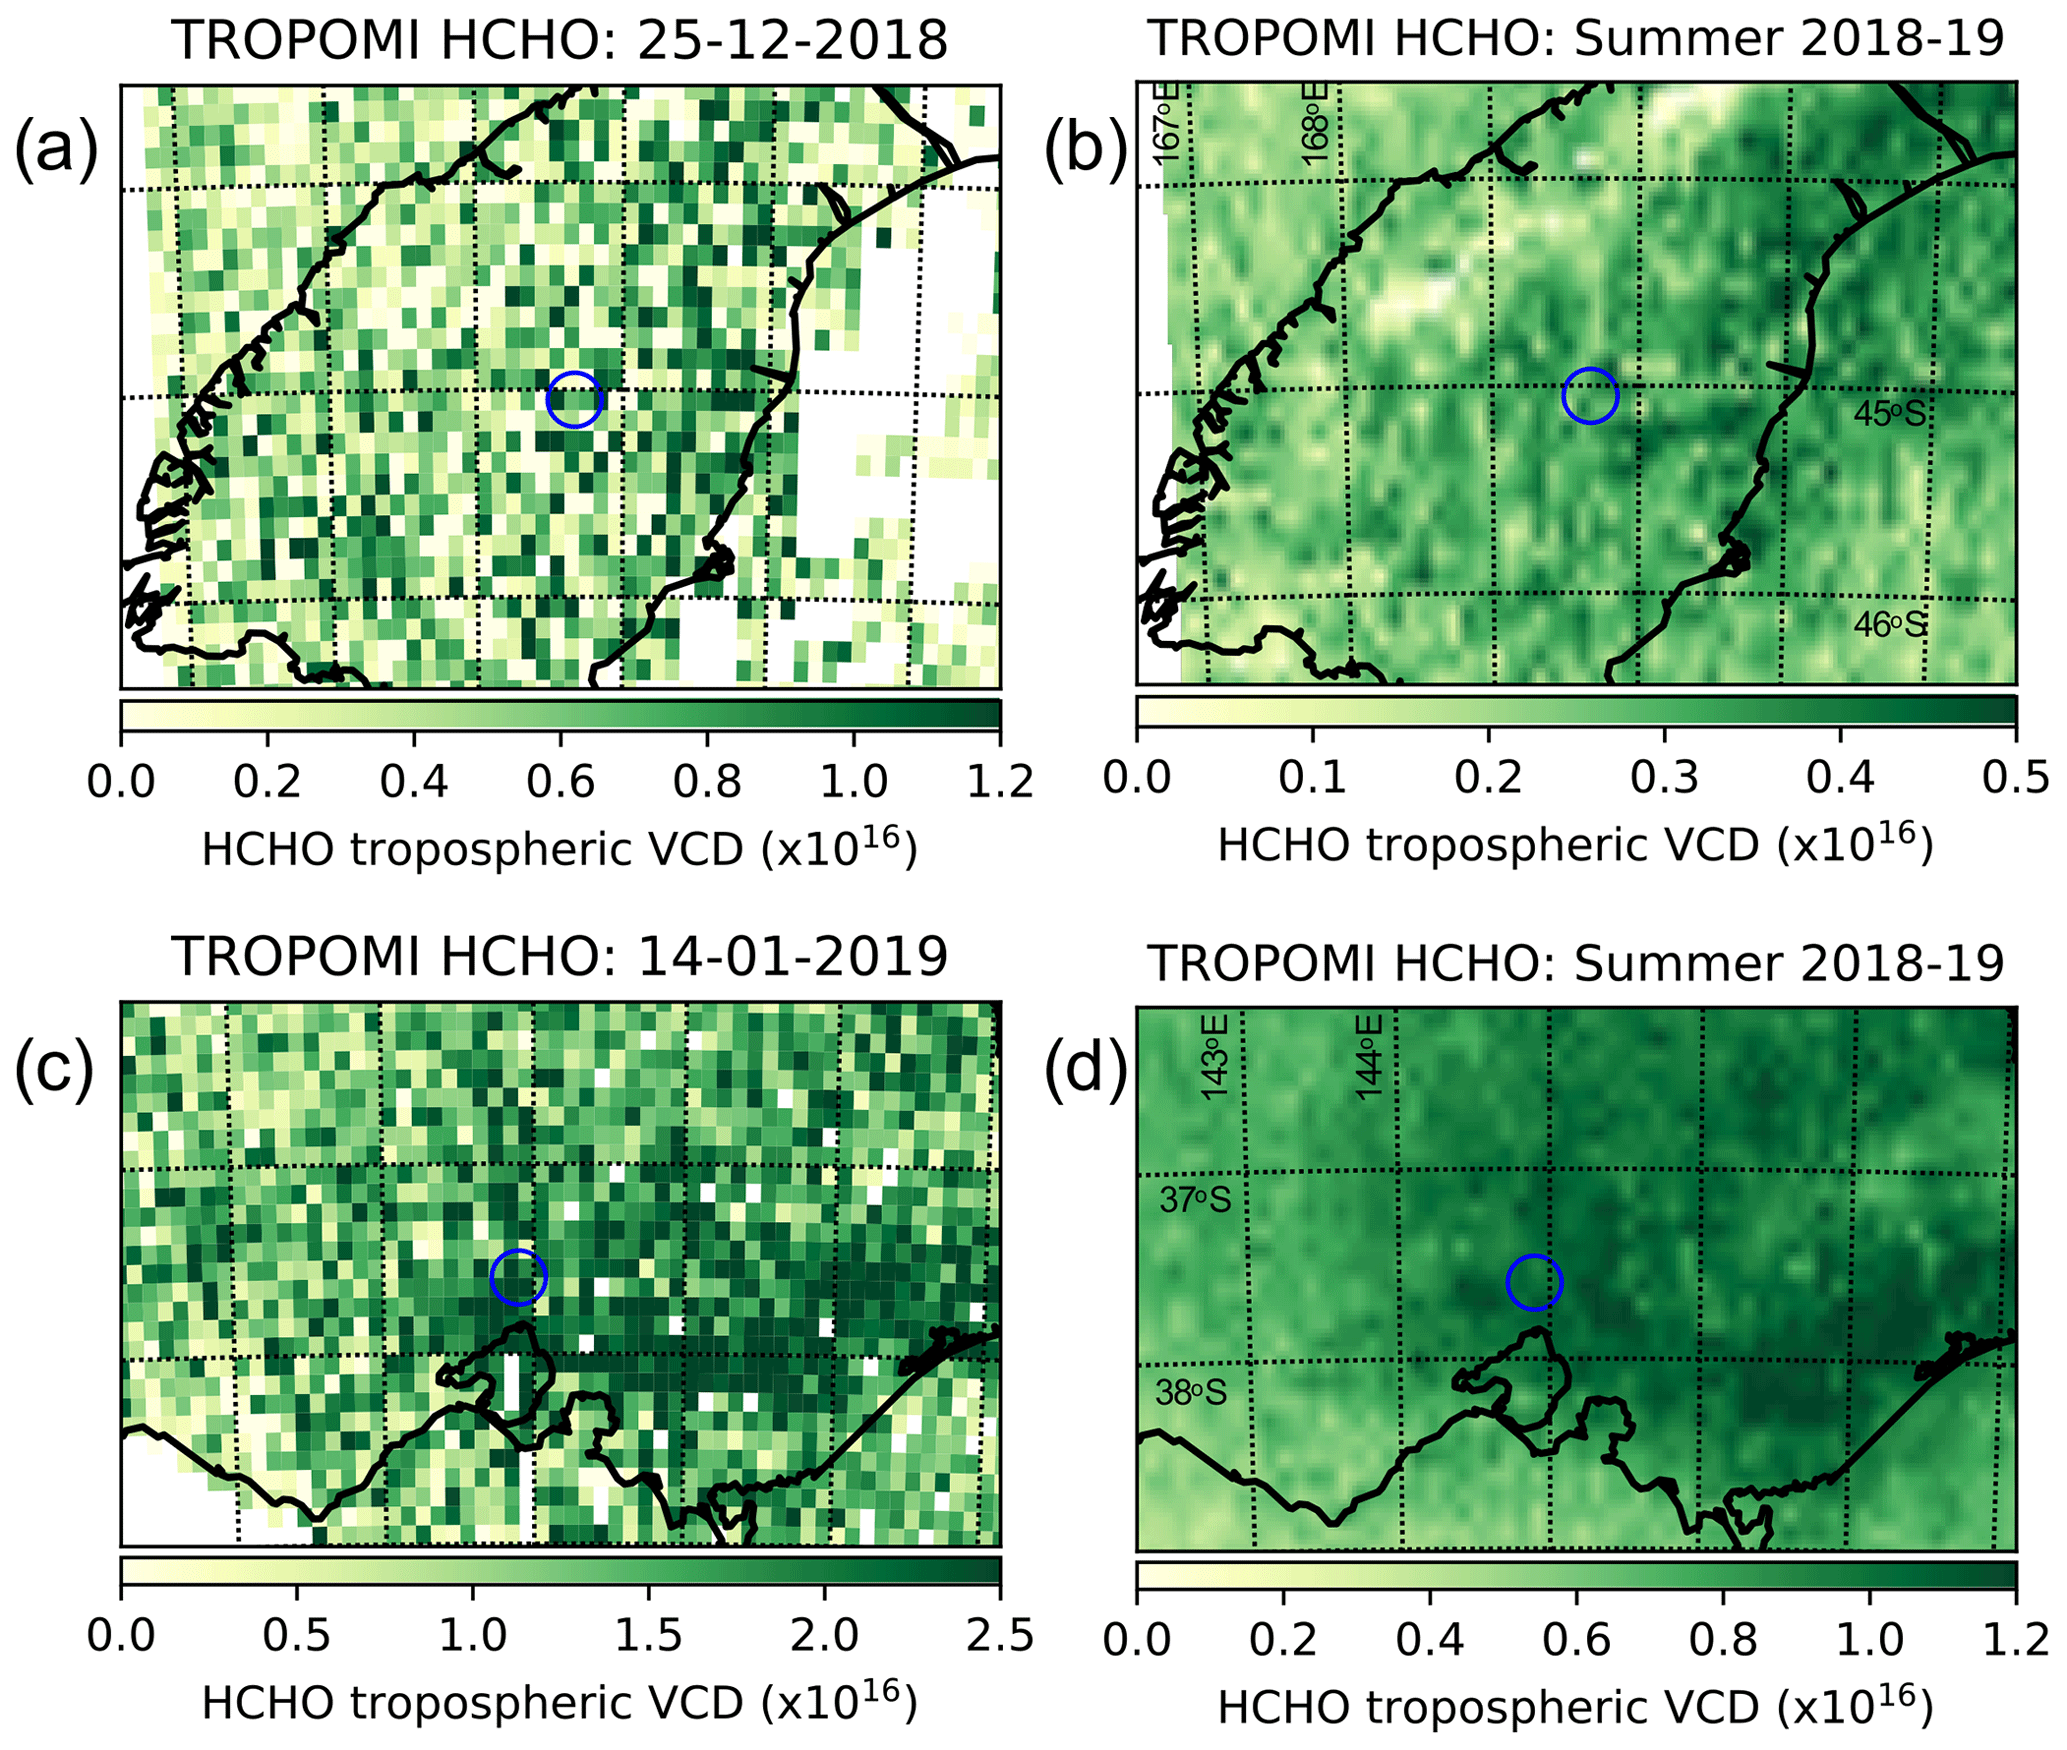
Figure 7Examples of TROPOMI 0.1×0.1∘ gridded output. The blue circles indicate the MAX-DOAS measurement locations. The grid lines drawn are at 1∘ latitude and longitude intervals. (a) Example retrieval from the South Island of New Zealand, 24 December 2018; (b) all New Zealand retrievals from December 2018 to February 2019 averaged. (c) Example from Victoria, 14 January 2019; (d) all Victorian retrievals from December 2018 to February 2019 averaged. Note that the colour bar scale is different for each plot to emphasize the spatial patterns.
Nevertheless, the average summer (DJF) 2018–2019 TROPOMI retrieval map for the central New Zealand South Island, shown in Fig. 7b, supports the conclusion (from the MAX-DOAS measurements) that the highest formaldehyde amounts are in the agricultural and more densely populated eastern parts of the island. There are no standout HCHO hotspots in the thickly forested west coast or south-western Fiordland regions. The New Zealand Alps are highlighted in this figure by the lack of formaldehyde, possibly due to minimal vegetation in this region and because the satellite retrieval will not work over areas of high albedo (i.e. snow). The inference that formaldehyde is close to background levels is supported by the fact that the average summer column amounts over the Tasman Sea and Pacific Ocean off the coast of the South Island appear similar to those over land. In comparison, the average summer 2018–2019 map from Victoria highlights some clear features – especially high formaldehyde levels over the densely forested regions in the east of the state. The irrigated agricultural land north of Melbourne stands out compared with the drier grazing country in the west and north-west; these areas highlighted by TROPOMI correspond to the directions of highest measured HCHO at Broadmeadows in Fig. 5b.
Formaldehyde columns from TROPOMI and MAX-DOAS at Broadmeadows and Lauder were compared over the course of 18 months (May 2018–November 2019). For the comparison, TROPOMI results (columns and associated a priori profiles and averaging kernels) were averaged 0.2∘ either side of the Broadmeadows and Lauder MAX-DOAS locations. MAX-DOAS columns (along with averaging kernels) were averaged between 13:00 and 14:00 LT, around the time of the TROPOMI overpass. TROPOMI vertical profiles are not available for download; hence, in order to accurately compare tropospheric columns across the same altitude range, the MAX-DOAS retrievals for this comparison were run to 10 km rather than 4 km as in the FTIR–MAX-DOAS comparison in Sect. 3.2.
For direct comparison of TROPOMI and MAX-DOAS formaldehyde vertical columns, accounting for the different instrumental a priori profiles and vertical sensitivities, the method outlined in Vigouroux et al. (2020) for comparing TROPOMI with FTIR was adapted. Firstly, to account for the fact that the two retrieval methods use different a priori profiles, the following equation was used to produce an adjusted MAX-DOAS profile :
where xD is the original MAX-DOAS profile, AM is the MAX-DOAS averaging kernel matrix, I is the identity matrix, xD,a is the MAX-DOAS a priori profile and xT,a is the TROPOMI a priori profile expressed on the MAX-DOAS altitude grid. The integrated adjusted column gave an adjusted MAX-DOAS HCHO tropospheric column, which was then smoothed using the TROPOMI averaging kernels (expressed on the MAX-DOAS altitude grid) using the same method as for smoothing the FTIR columns in Sect. 3.2 (Rodgers and Connor, 2003):
where CD,smooth is the smoothed MAX-DOAS tropospheric column, CT,a is the TROPOMI a priori tropospheric column and aT is the TROPOMI column total averaging kernel.
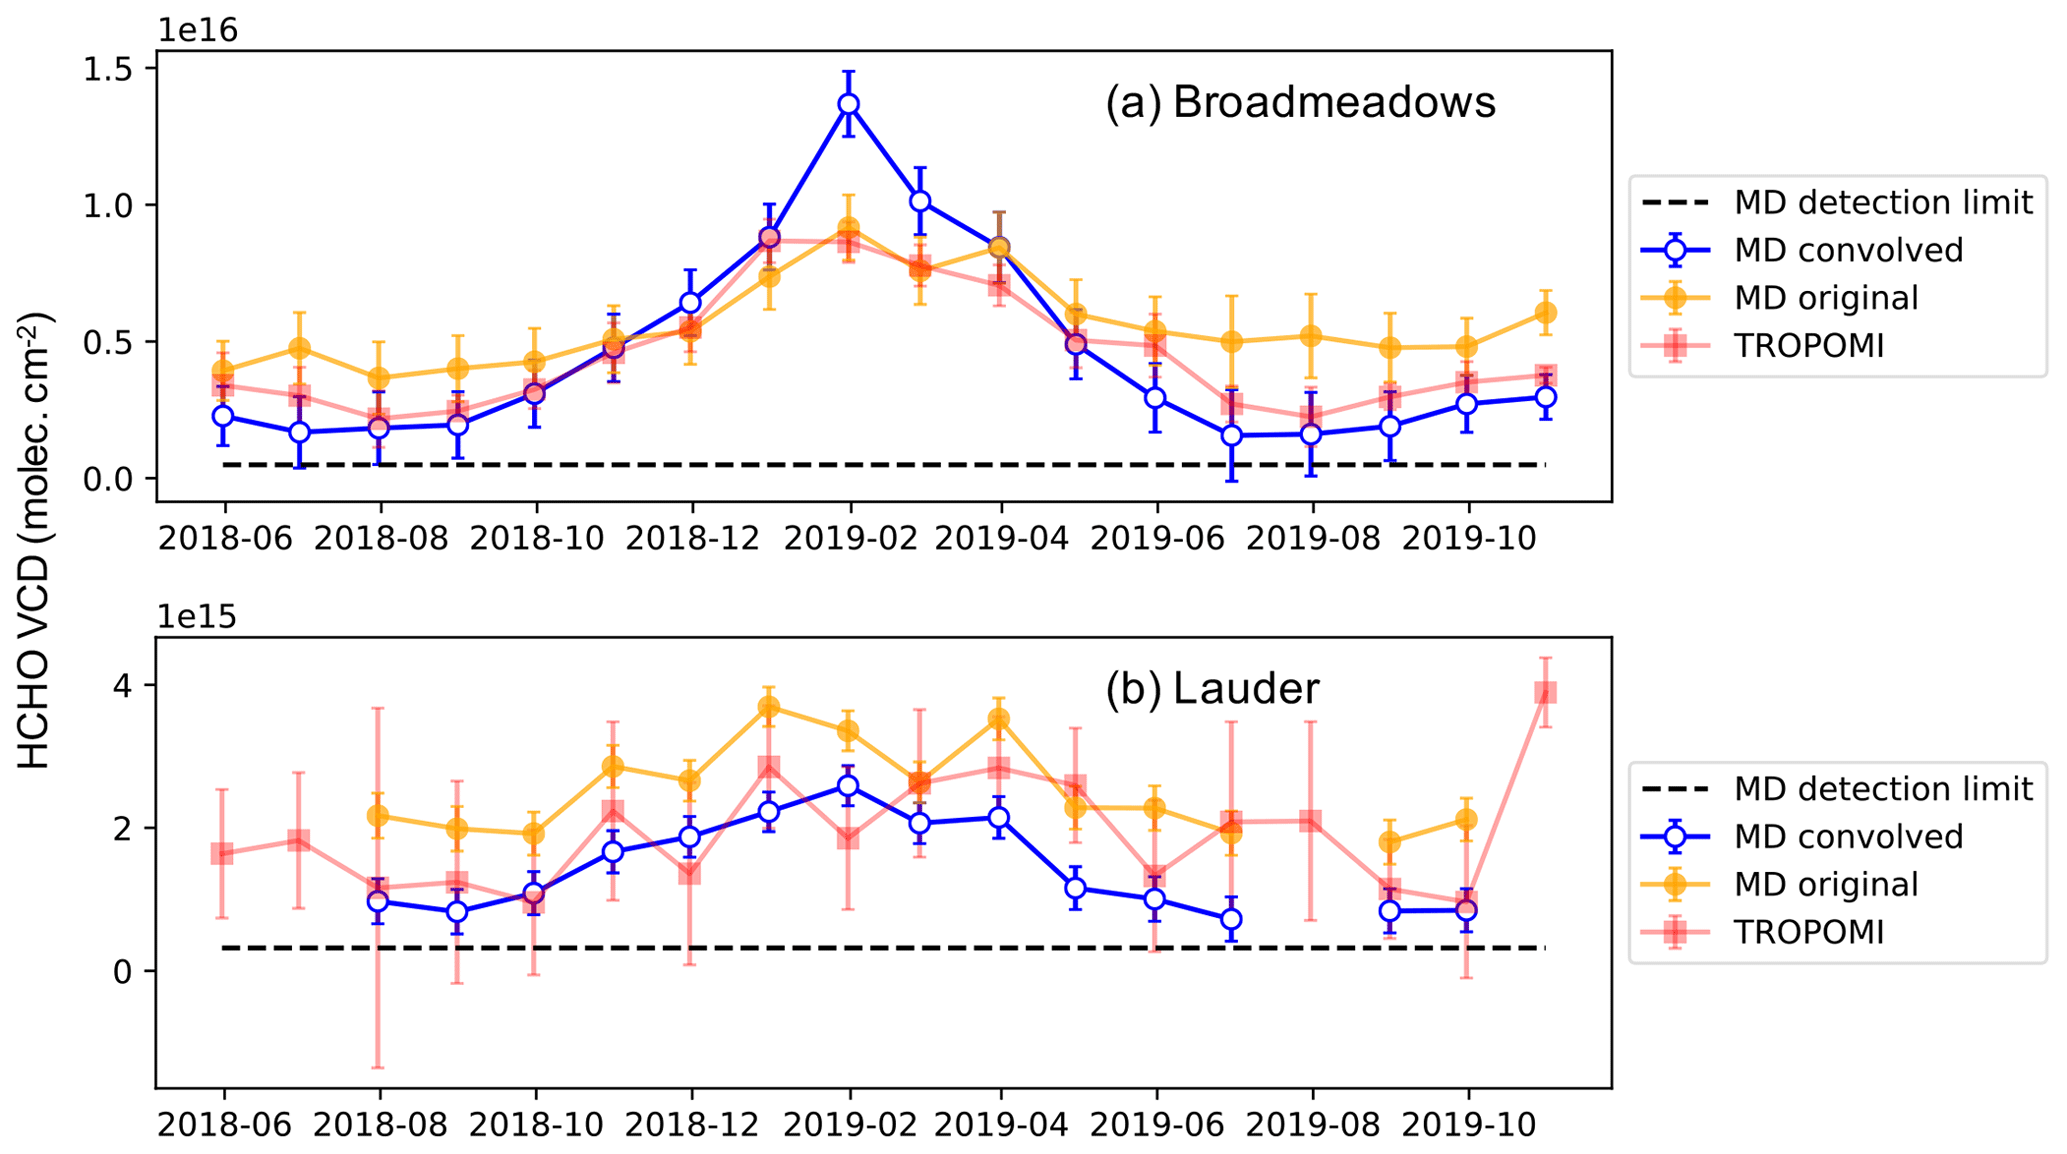
Figure 8Time series comparison of monthly mean formaldehyde columns from TROPOMI and the MAX-DOAS between May 2018 and November 2019 at (a) Broadmeadows and (b) Lauder. Both the original (orange) and convolved (blue and white, i.e. accounting for different retrieval a priori and sensitivities) MAX-DOAS columns are shown.
The monthly average time series of HCHO tropospheric columns at Broadmeadows measured by MAX-DOAS and TROPOMI is shown in Fig. 8a. The seasonal variation in formaldehyde with its strong summer peak is clearly captured by TROPOMI, with all MAX-DOAS and TROPOMI data points above the calculated MAX-DOAS detection limit. The original MAX-DOAS retrieved columns agree well with the magnitude of the TROPOMI observations between October 2018 and June 2019, including over the summer peak, but they are greater than TROPOMI outside of these months. The MAX-DOAS columns adjusted for a priori differences and convolved with TROPOMI averaging kernels agree well with TROPOMI, within uncertainty, for all months except the height of the summer peak in January–February 2019. This discrepancy during times of peak HCHO production in the boundary layer highlights the much greater sensitivity of the MAX-DOAS to the lower atmosphere than TROPOMI. The average difference between TROPOMI and the smoothed and raw MAX-DOAS columns, along with the breakdown of random and systematic errors on the differences (calculated following the methodology outlined in Vigouroux et al., 2009) is presented in Table 2. Smoothed MAX-DOAS columns were on average 5 % higher than TROPOMI; however, for individual measurements, the difference was highly variable (standard deviation 94 %). This small average bias towards MAX-DOAS is consistent with the bias found between ground-based FTIR stations and TROPOMI for locations with comparable average HCHO column amounts in Vigouroux et al. (2020).
Figure 8b shows the same as Fig. 8a but for Lauder. As for Broadmeadows, the broad seasonal variation is captured by TROPOMI, and all data points are above the calculated MAX-DOAS detection limit, although TROPOMI error bars are greater than at Broadmeadows and often extend below the MAX-DOAS detection limit, due to the lower number of available TROPOMI retrievals over Lauder. The convolved MAX-DOAS HCHO columns compare well within error for a majority of months. On average, TROPOMI was 29 % lower than MAX-DOAS raw columns and 22 % higher than smoothed MAX-DOAS columns; however, the smoothing process accentuated the largest differences resulting in a standard deviation for the smoothed comparison greater than 100 %. The average bias found for Lauder MAX-DOAS vs. TROPOMI is consistent within the uncertainty with the negative bias for TROPOMI vs. FTIR for Lauder in Vigouroux et al. (2020).
The agreement between TROPOMI and MAX-DOAS is further examined using linear Deming regression analysis in Fig. 9. For Lauder, Fig. 9b shows the monthly average scatter plot with overall regression slope of 0.73 and R2=0.61 (n=18). The majority of data points lie within error of the 1 : 1 line. The regression values for the daily measurements at Lauder were slope = 0.40 and R2=0.22 (n=510), whereas weekly averages gave a slope of 0.66 and R2 of 0.45 (n=73). The resolution selection criterion did not have a large effect on the comparison, with a regression slope of 0.68 (monthly averages) for averaging TROPOMI 50 km either side of Lauder as opposed to 20 km. At Broadmeadows, data points lie along the 1 : 1 line within error except for the highest two values, which are January and February 2019 as highlighted in the time series, giving a regression slope of 0.61. This further highlights the finding, in line with Vigouroux et al. (2020), that the low bias of TROPOMI compared with ground-based measurements is accentuated at high HCHO levels. The very strong temporal consistency is highlighted by an R2 of 0.95 (n=18). Considering the individual daily measurements at Broadmeadows, the slope of the regression was 0.77 with R2=0.69 (n=506), whereas the slope was 0.66 with R2=0.89 (n=73) for weekly averages (plots for Lauder and Broadmeadows daily measurements and weekly averages are shown in Figs. A2 and A3 in Appendix A). Considering TROPOMI sampled 10 and 50 km either side of Broadmeadows, regression slopes were 0.56 and 0.65 respectively, with the low bias of TROPOMI compared with MAX-DOAS at high HCHO consistent across sampling resolution.
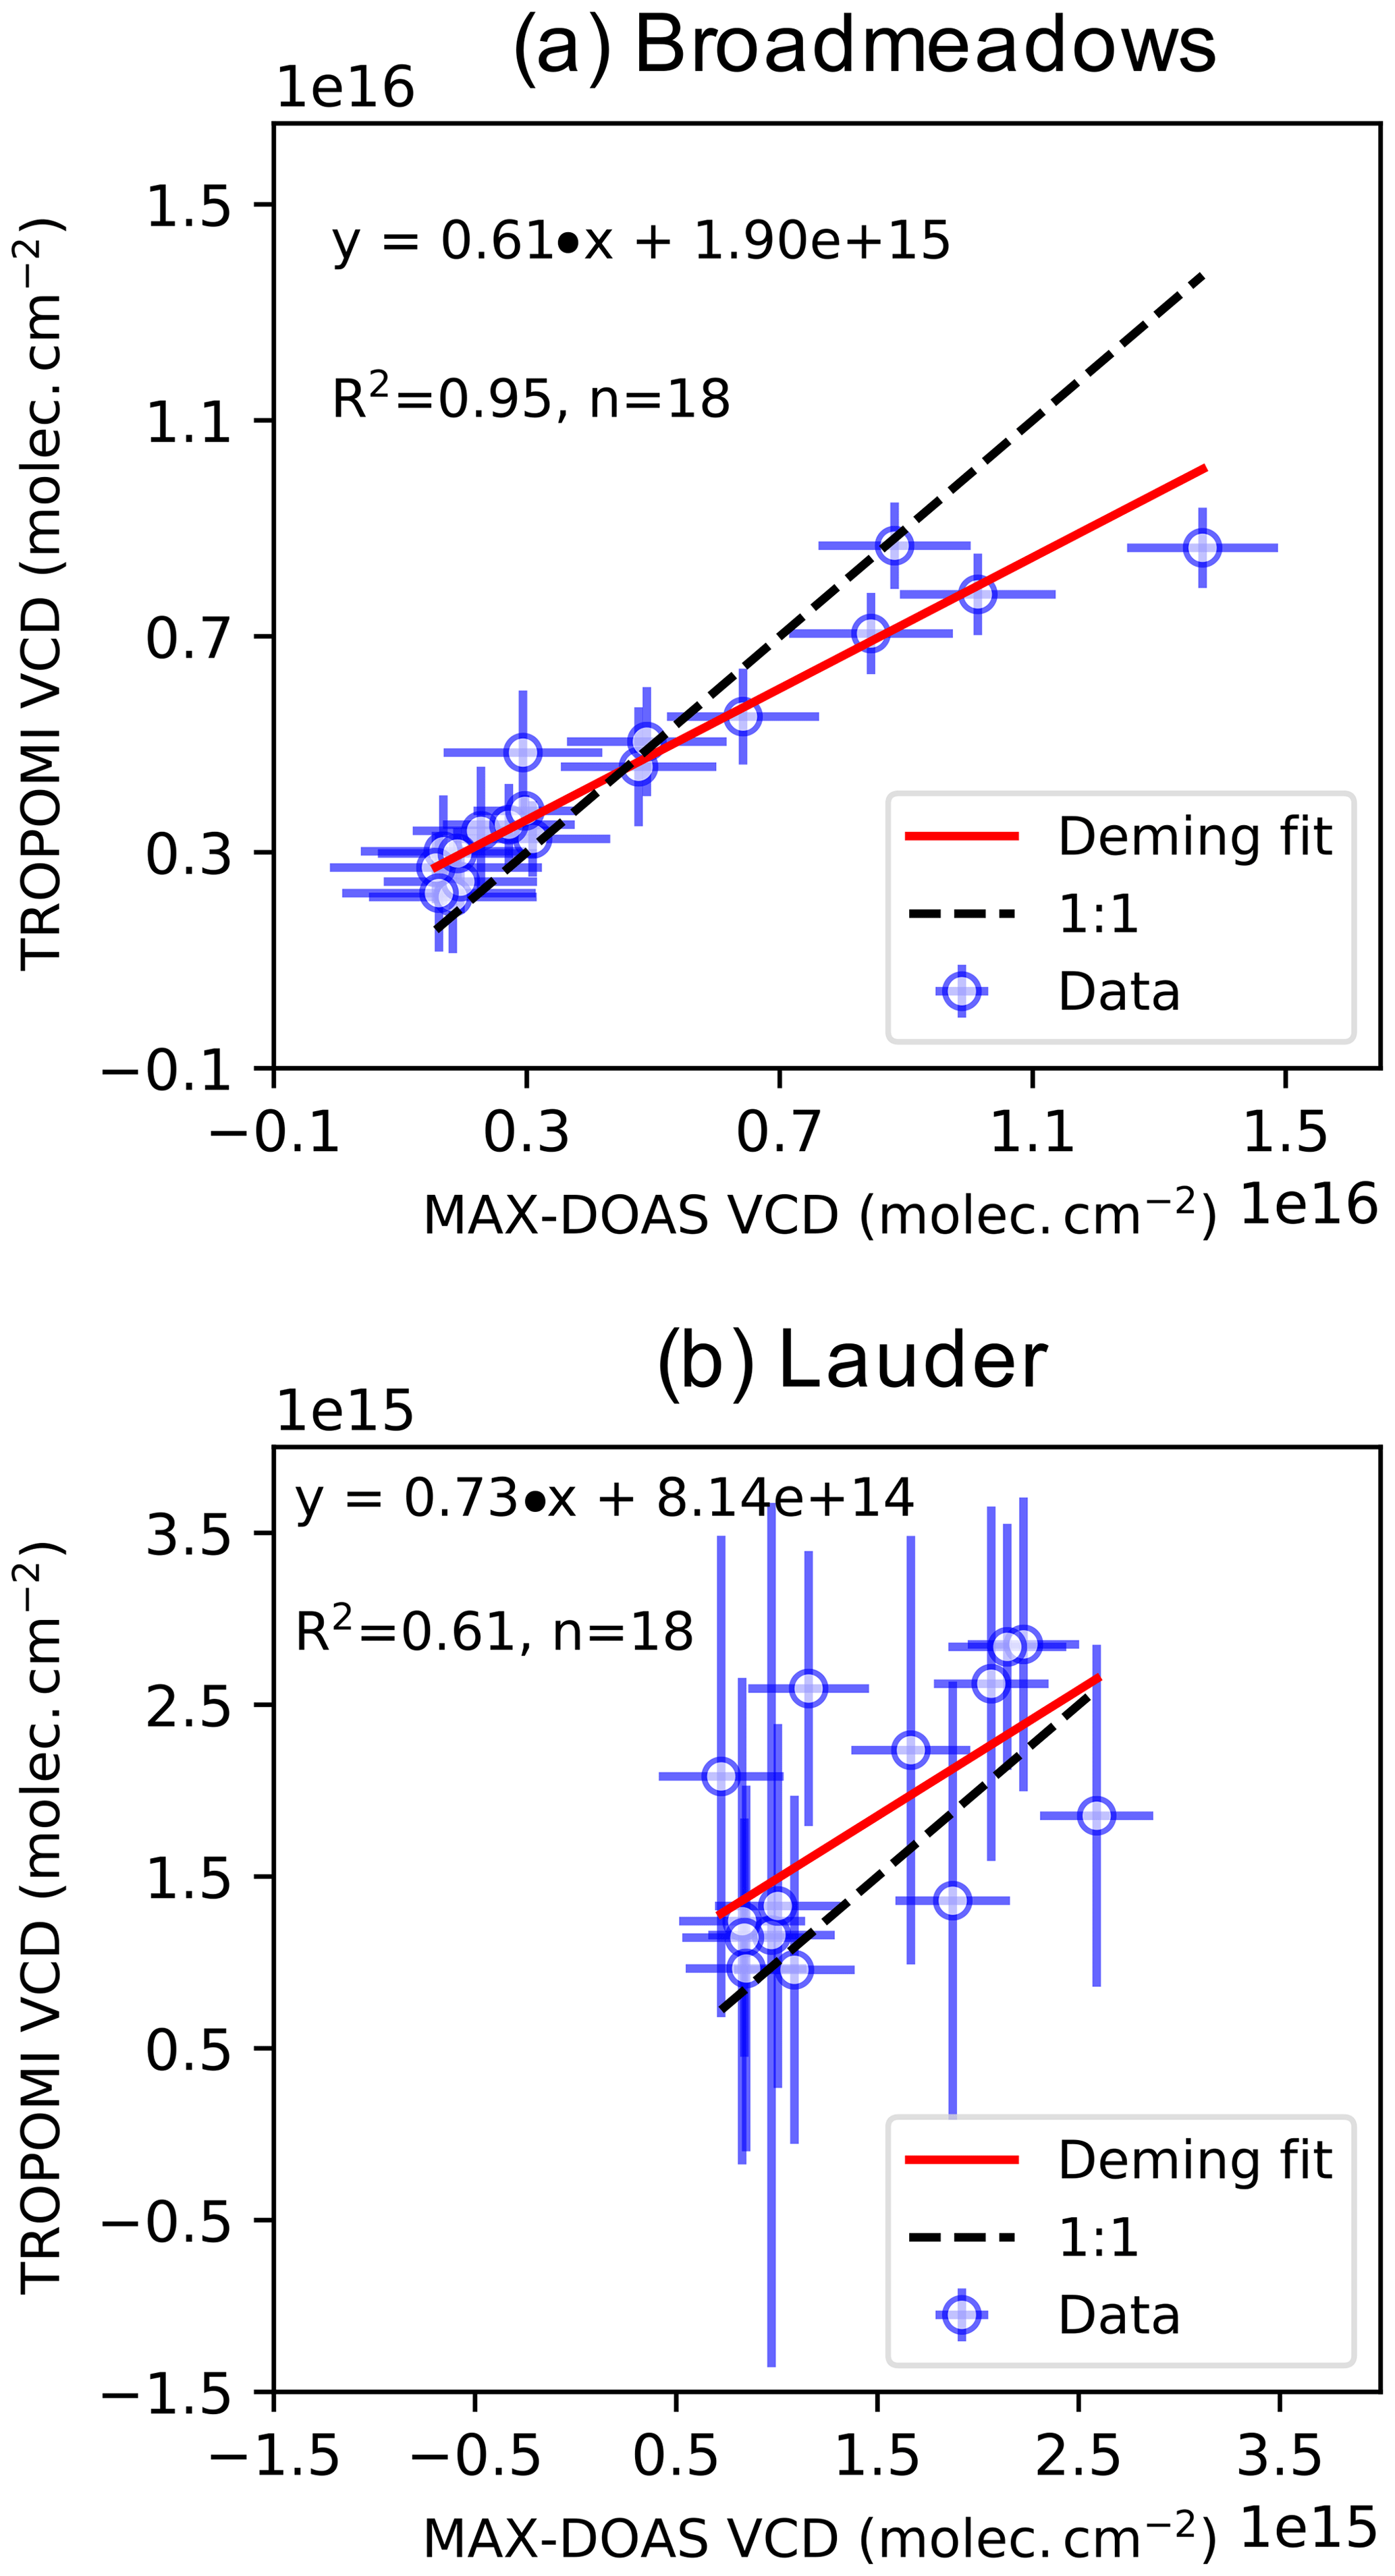
Figure 9Scatter plot and Deming regression results for the comparison of monthly mean formaldehyde columns from TROPOMI and the MAX-DOAS (convolved with TROPOMI averaging kernels) between May 2018 and November 2019 at (a) Broadmeadows and (b) Lauder.
The success of this comparison study for formaldehyde with TROPOMI, especially at Broadmeadows, is highlighted by a comparison (2017–2019) at the same Broadmeadows location between OMI and the MAX-DOAS. As shown in Fig. A4, OMI does not clearly capture any of the seasonal formaldehyde variation in Melbourne; as such, it fails to replicate the MAX-DOAS values. The error bars shown in this figure are the quoted uncertainty on the OMI columns, and they represent 67 % of the total column on average, perhaps due to the poorer resolution of OMI compared with TROPOMI, making observation of the seasonal cycle difficult in this data. Monthly OMI HCHO columns are on average 200 % higher than the MAX-DOAS (see Table A1 in Appendix A), which is far greater than any discrepancy reported in the literature for a MAX-DOAS vs. satellite retrieval. One possibility for the disparity is the fact that OMI is sampled 25 km either side of the measurement location compared with approximately 20 km for MAX-DOAS, thereby taking in more of the background. However, this could not explain why no seasonality is evident in the OMI results. Given that both OMI and TROPOMI retrievals rely on a priori formaldehyde profiles calculated using the same chemical transport model (TM5, De Smedt et al., 2018), a priori differences cannot explain the difference in the comparison. However, previous studies (e.g. De Smedt et al., 2015; Wang et al., 2017a) found that agreement between OMI and MAX-DOAS measurements improved when using the MAX-DOAS a priori profiles to retrieve satellite columns; it would be interesting in future work to do the same for HCHO satellite-based retrievals over Australasia. Examining the influence of a priori profiles calculated by chemical transport models on formaldehyde retrievals is also of particular interest in south-eastern Australia given that biogenic VOC emissions have been shown to be poorly simulated in this region (Emmerson et al., 2016, 2018).
This paper presents comparison studies of MAX-DOAS formaldehyde measurements in two distinctly different environments: the remote Central Otago region in New Zealand and the suburban fringe area of Broadmeadows in Victoria. This work is the first long-term comparison and validation study undertaken using MAX-DOAS measurements in the Southern Hemisphere.
For MAX-DOAS measurements between December 2016 and November 2019, the mean formaldehyde column measured by the MAX-DOAS at Broadmeadows was molec. cm−2 compared with molec. cm−2 at Lauder. The amplitude of the seasonal cycle was also greater at Broadmeadows than at Lauder: 2.0×10¹⁵ molec. cm−2 compared with 0.7×10¹⁵ molec. cm−2. The seasonal cycles at Lauder and Broadmeadows could be described by a periodic function peaking at the end of January, i.e. at the height of the austral summer, consistent with biogenic temperature-dependent formaldehyde production.
At Lauder, 27 months of MAX-DOAS measurements were compared with FTIR formaldehyde partial columns between 0 and 4 km. Smoothing of the FTIR columns using the MAX-DOAS averaging kernels to resolve for the different vertical sensitivities was carried according to the methodology outlined in Rodgers and Connor (2003) and Vigouroux et al. (2009). The seasonal cycle of formaldehyde at Lauder, with a pronounced summer peak, was clearly replicated by both sets of observations, and the smoothed FTIR columns correlated more strongly than the original with the MAX-DOAS results. The timing of the HCHO seasonal cycle peak was very similar between Broadmeadows and Lauder, suggesting similar HCHO sources; however, the source strength at Lauder seems to be weaker with a lower seasonal cycle amplitude.
In the first TROPOMI–MAX-DOAS Southern hemispheric comparison study, TROPOMI performed especially well compared to the Broadmeadows monthly average columns in terms of temporal variation and magnitude (R2=0.95, slope = 0.61). This result is a significant improvement in the comparison with OMI both at this location and in previous literature reports. Higher spatial variability and lower absolute amounts of HCHO made the comparison more difficult at Lauder; however, the linear regression analysis also indicated moderate temporal agreement in most months of the comparison (R2=0.61, slope = 0.73).
Using maps of average TROPOMI HCHO retrievals, this study also demonstrates the utility of the satellite product to identify hotspot regions of biogenic VOCs, which will be a critical tool in addressing the current gap in the understanding of isoprene and monoterpene chemistry in south-eastern Australia.
This TROPOMI comparison study, especially over Melbourne, raises many exciting possibilities for future work. This study shows the importance of long-term time series MAX-DOAS measurements for satellite validation, and it could contribute to international validation efforts. This research could also be extended to consider not only formaldehyde validation but also NO2, HONO and glyoxal. This would continue to address the lack of Southern hemispheric satellite validation studies using ground-based remote sensing. This work also shows the utility of the MAX-DOAS technique for studying formaldehyde in the VOC hotspot of south-eastern Australia, and it would be interesting in future studies to deploy MAX-DOAS instruments into the forested areas highlighted in TROPOMI as large formaldehyde source regions. Moreover, this work has shown that improvements in satellite technology, culminating (at this point in time) in TROPOMI, mean that space-based HCHO measurements will also be of great benefit in constraining the temporal and spatial distribution of VOC emissions in this region. With such assurance, related tropospheric oxidation and ozone chemistry, with their associated air quality and climate implications, can be studied on a much grander scale.
Table A1Results from this and previous literature studies comparing formaldehyde vertical columns from MAX-DOAS and satellite retrievals. Note that “Diff.” represents MAX-DOAS − satellite. Slope is the gradient (m) of the linear regression for Satellite = m× MAX-DOAS +C.
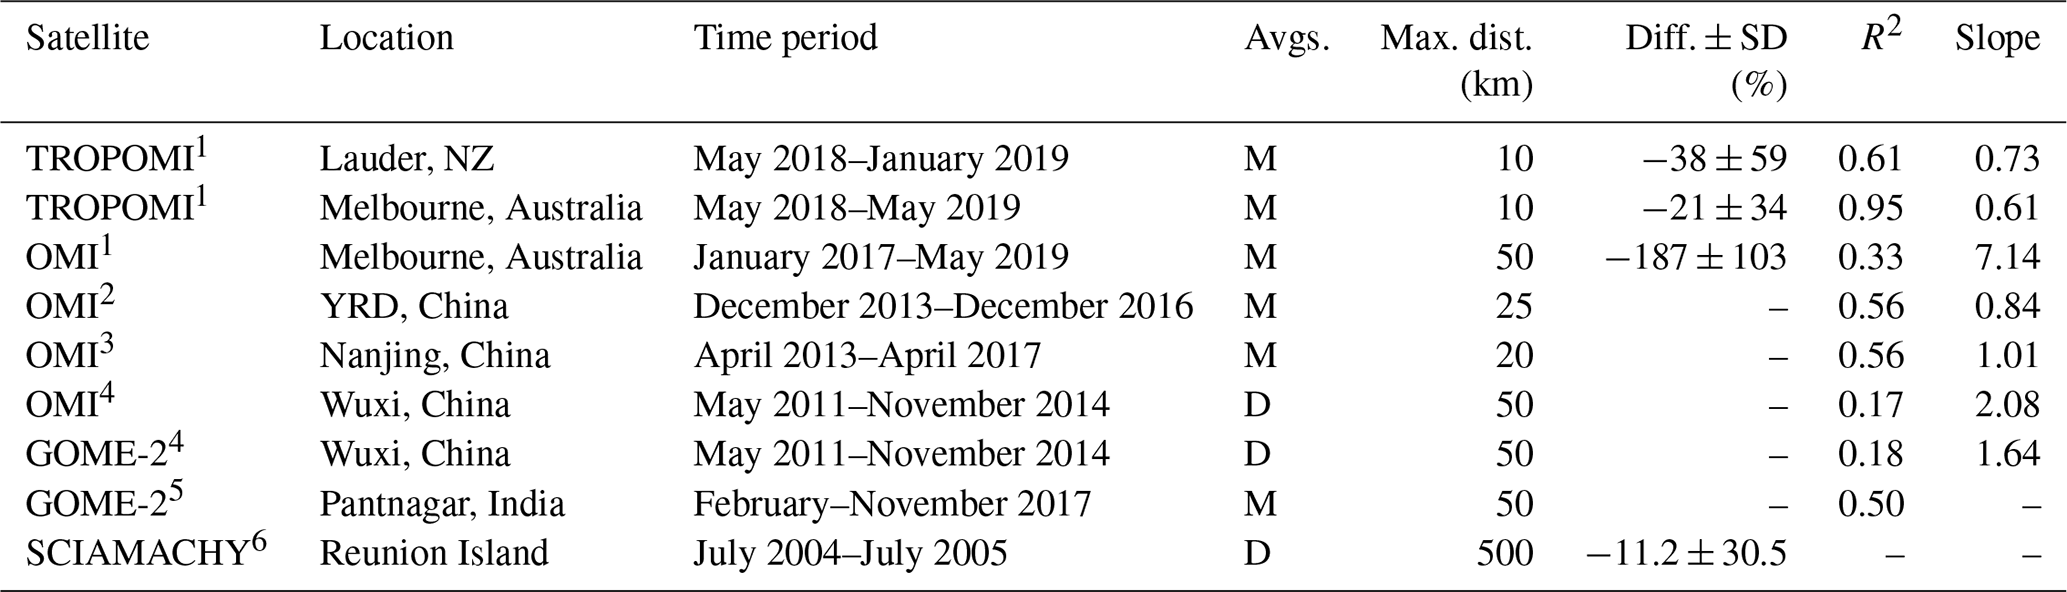
1 This study. 2 Tian et al. (2018). 3 Chan et al. (2019). 4 Wang et al. (2017a). 5 Hoque et al. (2018b). 6 Vigouroux et al. (2009). M denotes “monthly”, D denotes “daily” and YRD refers to the Yangtze River Delta.
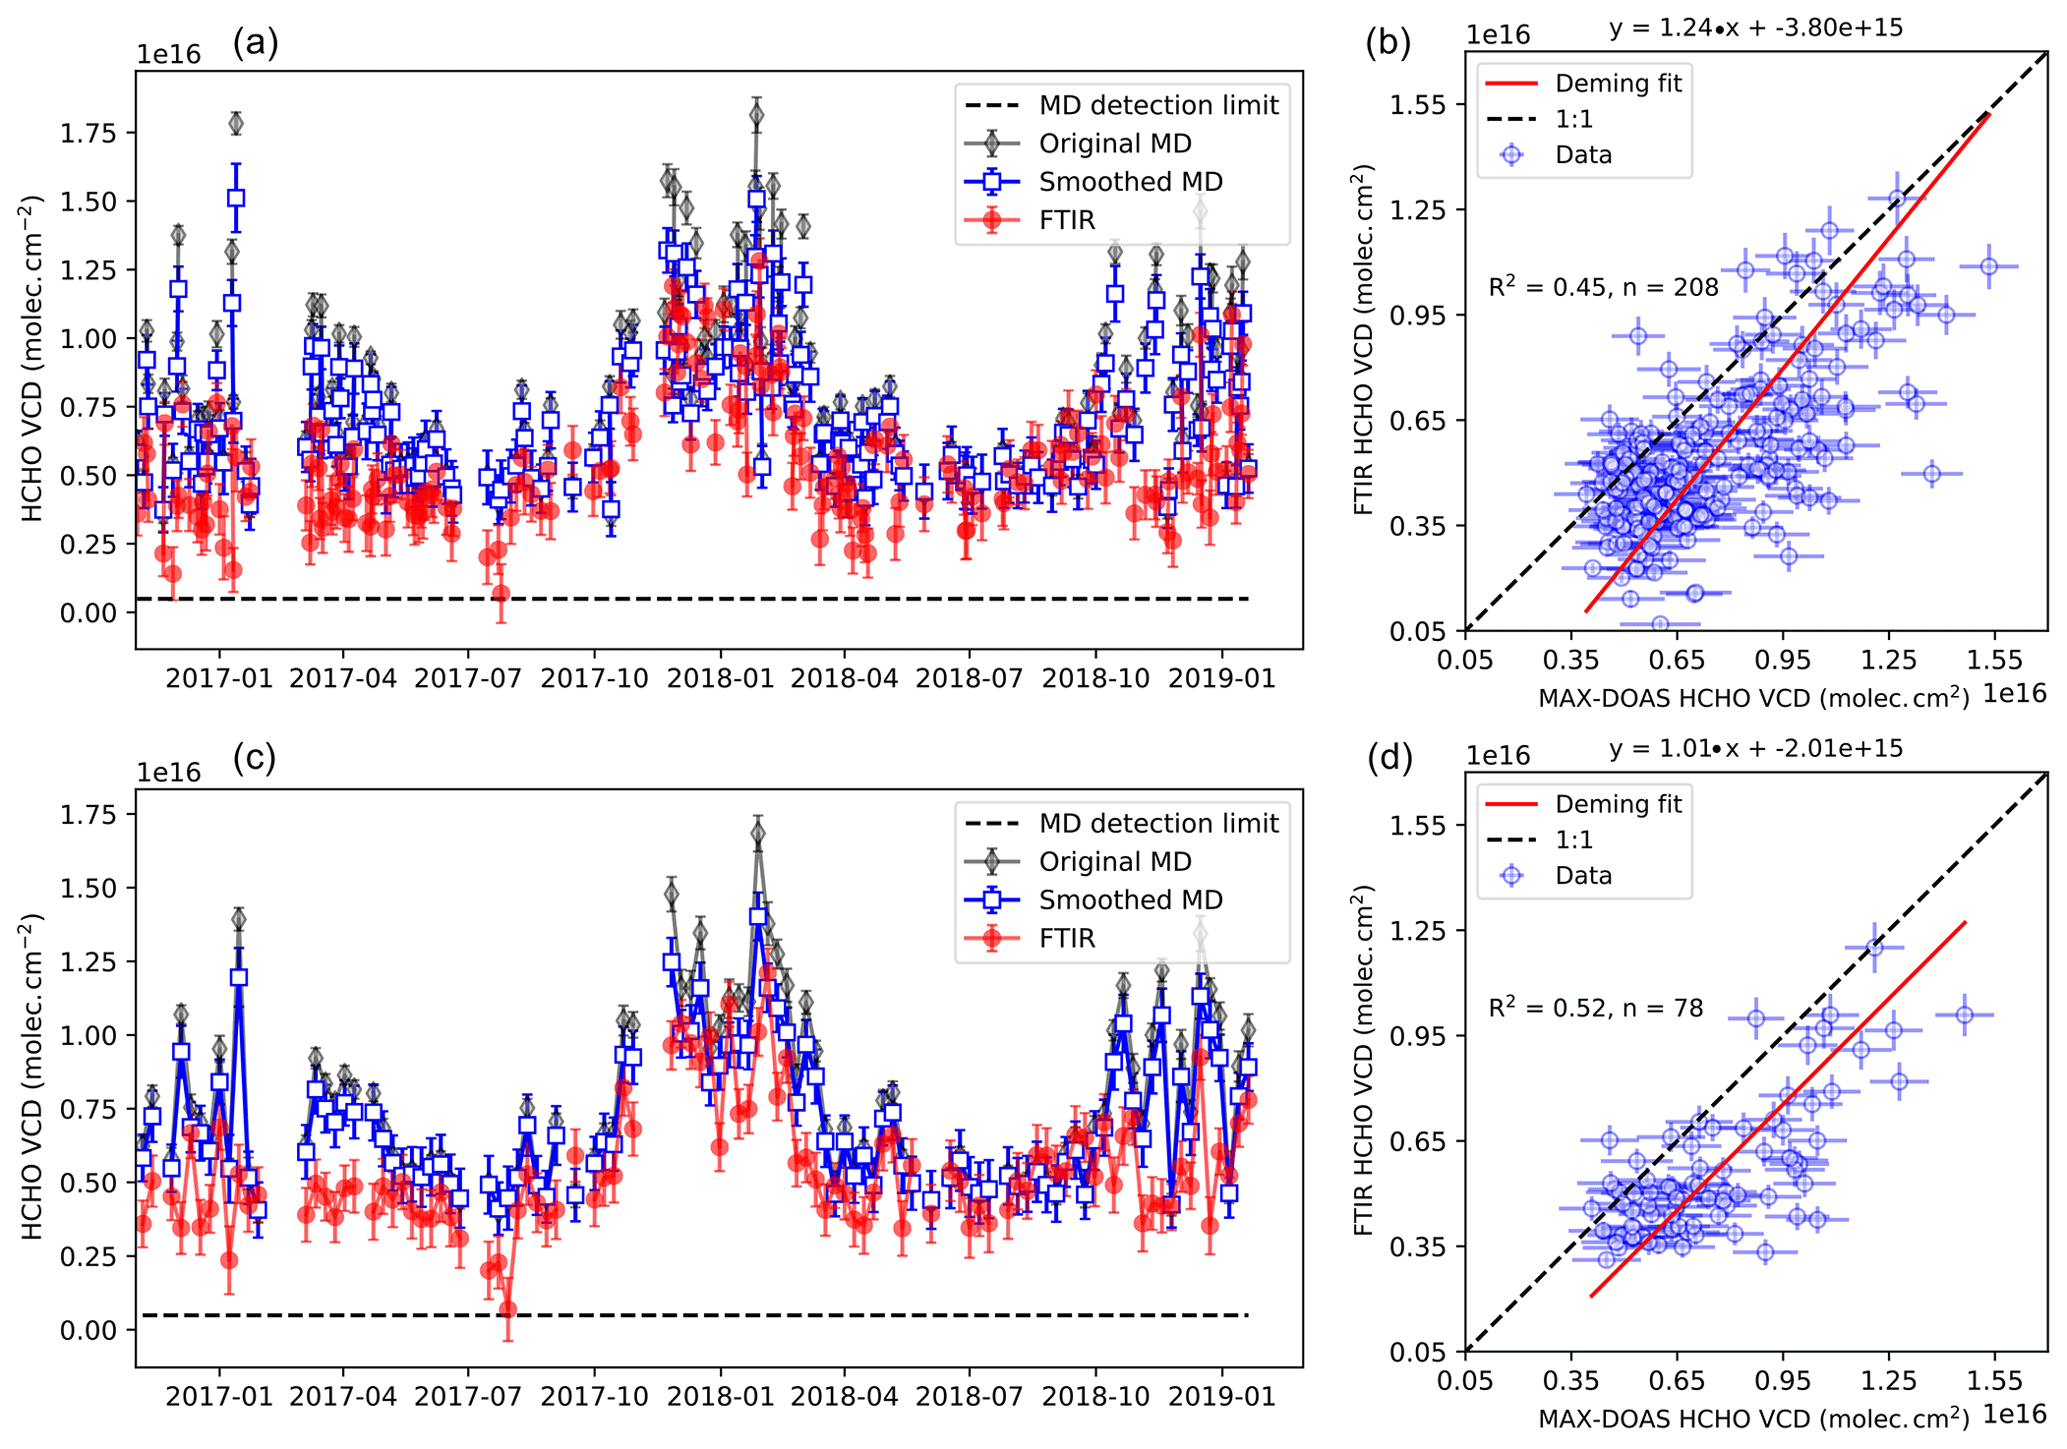
Figure A1Results for the comparison of formaldehyde columns from FTIR and the MAX-DOAS (convolved with FTIR averaging kernels) at Lauder: (a) daily average time series, (b) daily average scatter plot, (c) weekly average time series and (d) weekly average scatter plot.
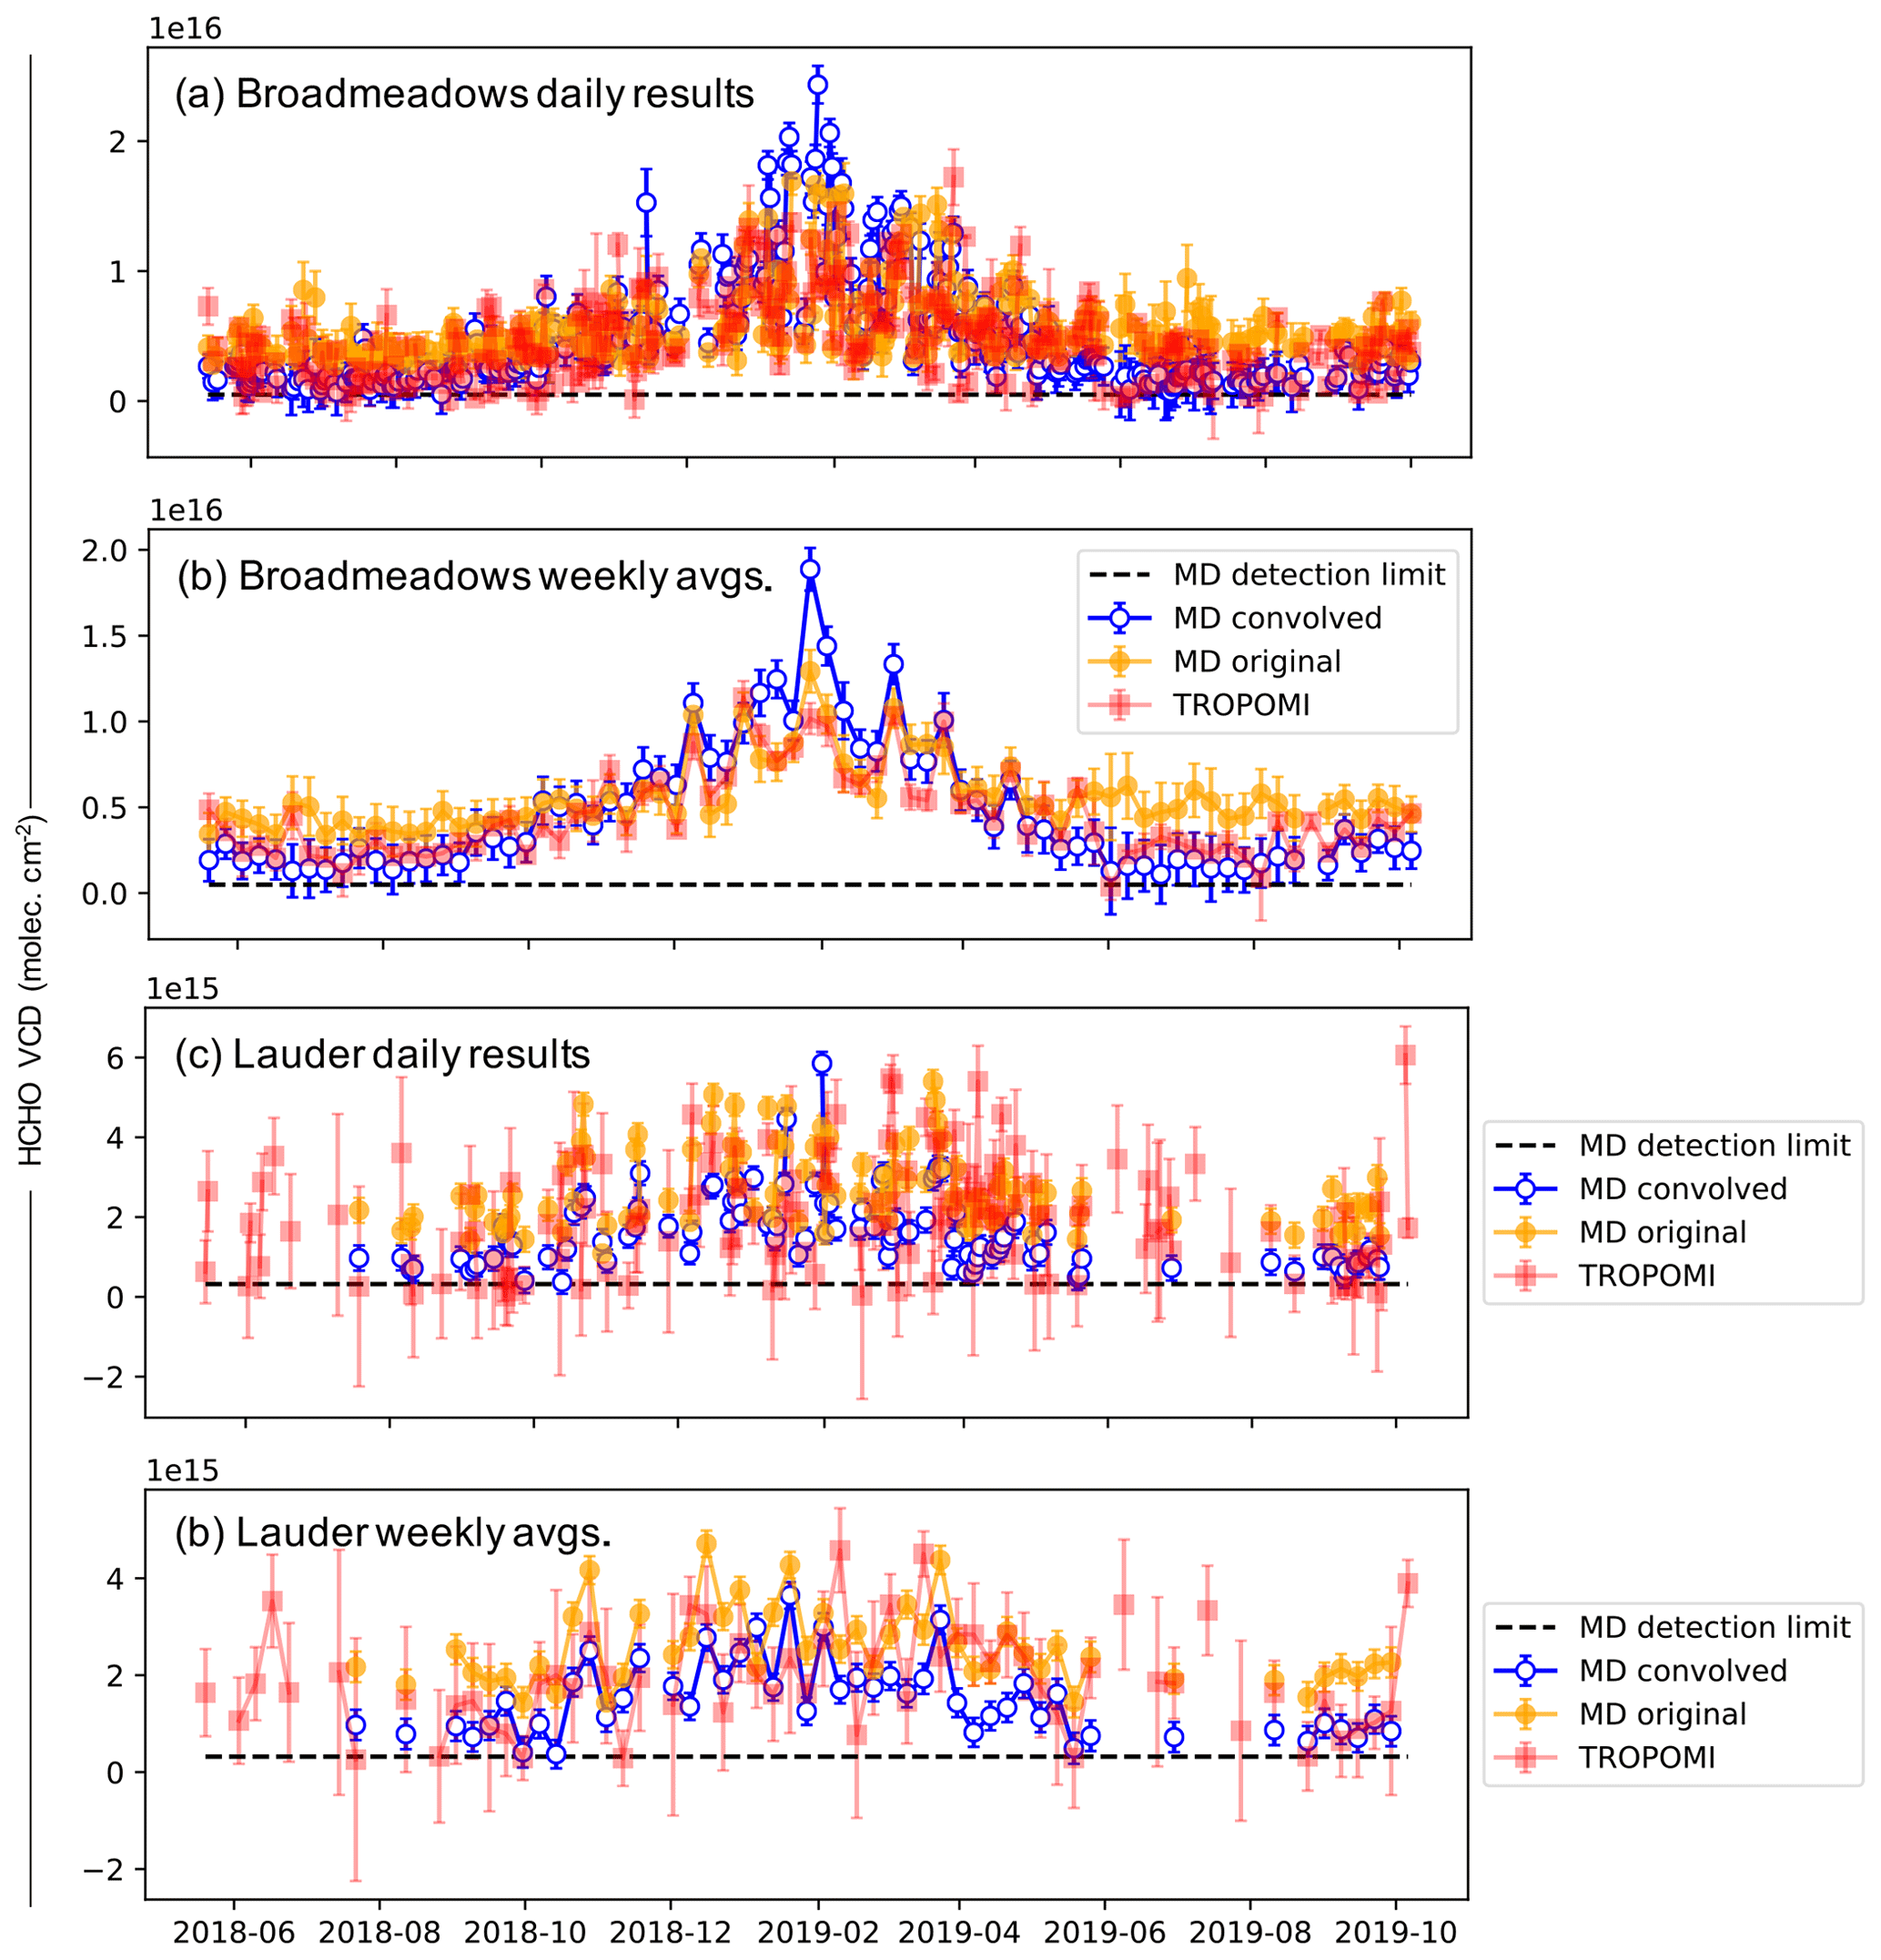
Figure A2Time series results for the comparison of formaldehyde columns from TROPOMI and the MAX-DOAS (convolved with TROPOMI averaging kernels) between May 2018 and November 2019: (a) Broadmeadows daily measurements, (b) Broadmeadows weekly averages, (c) Lauder daily measurements and (d) Lauder weekly averages.
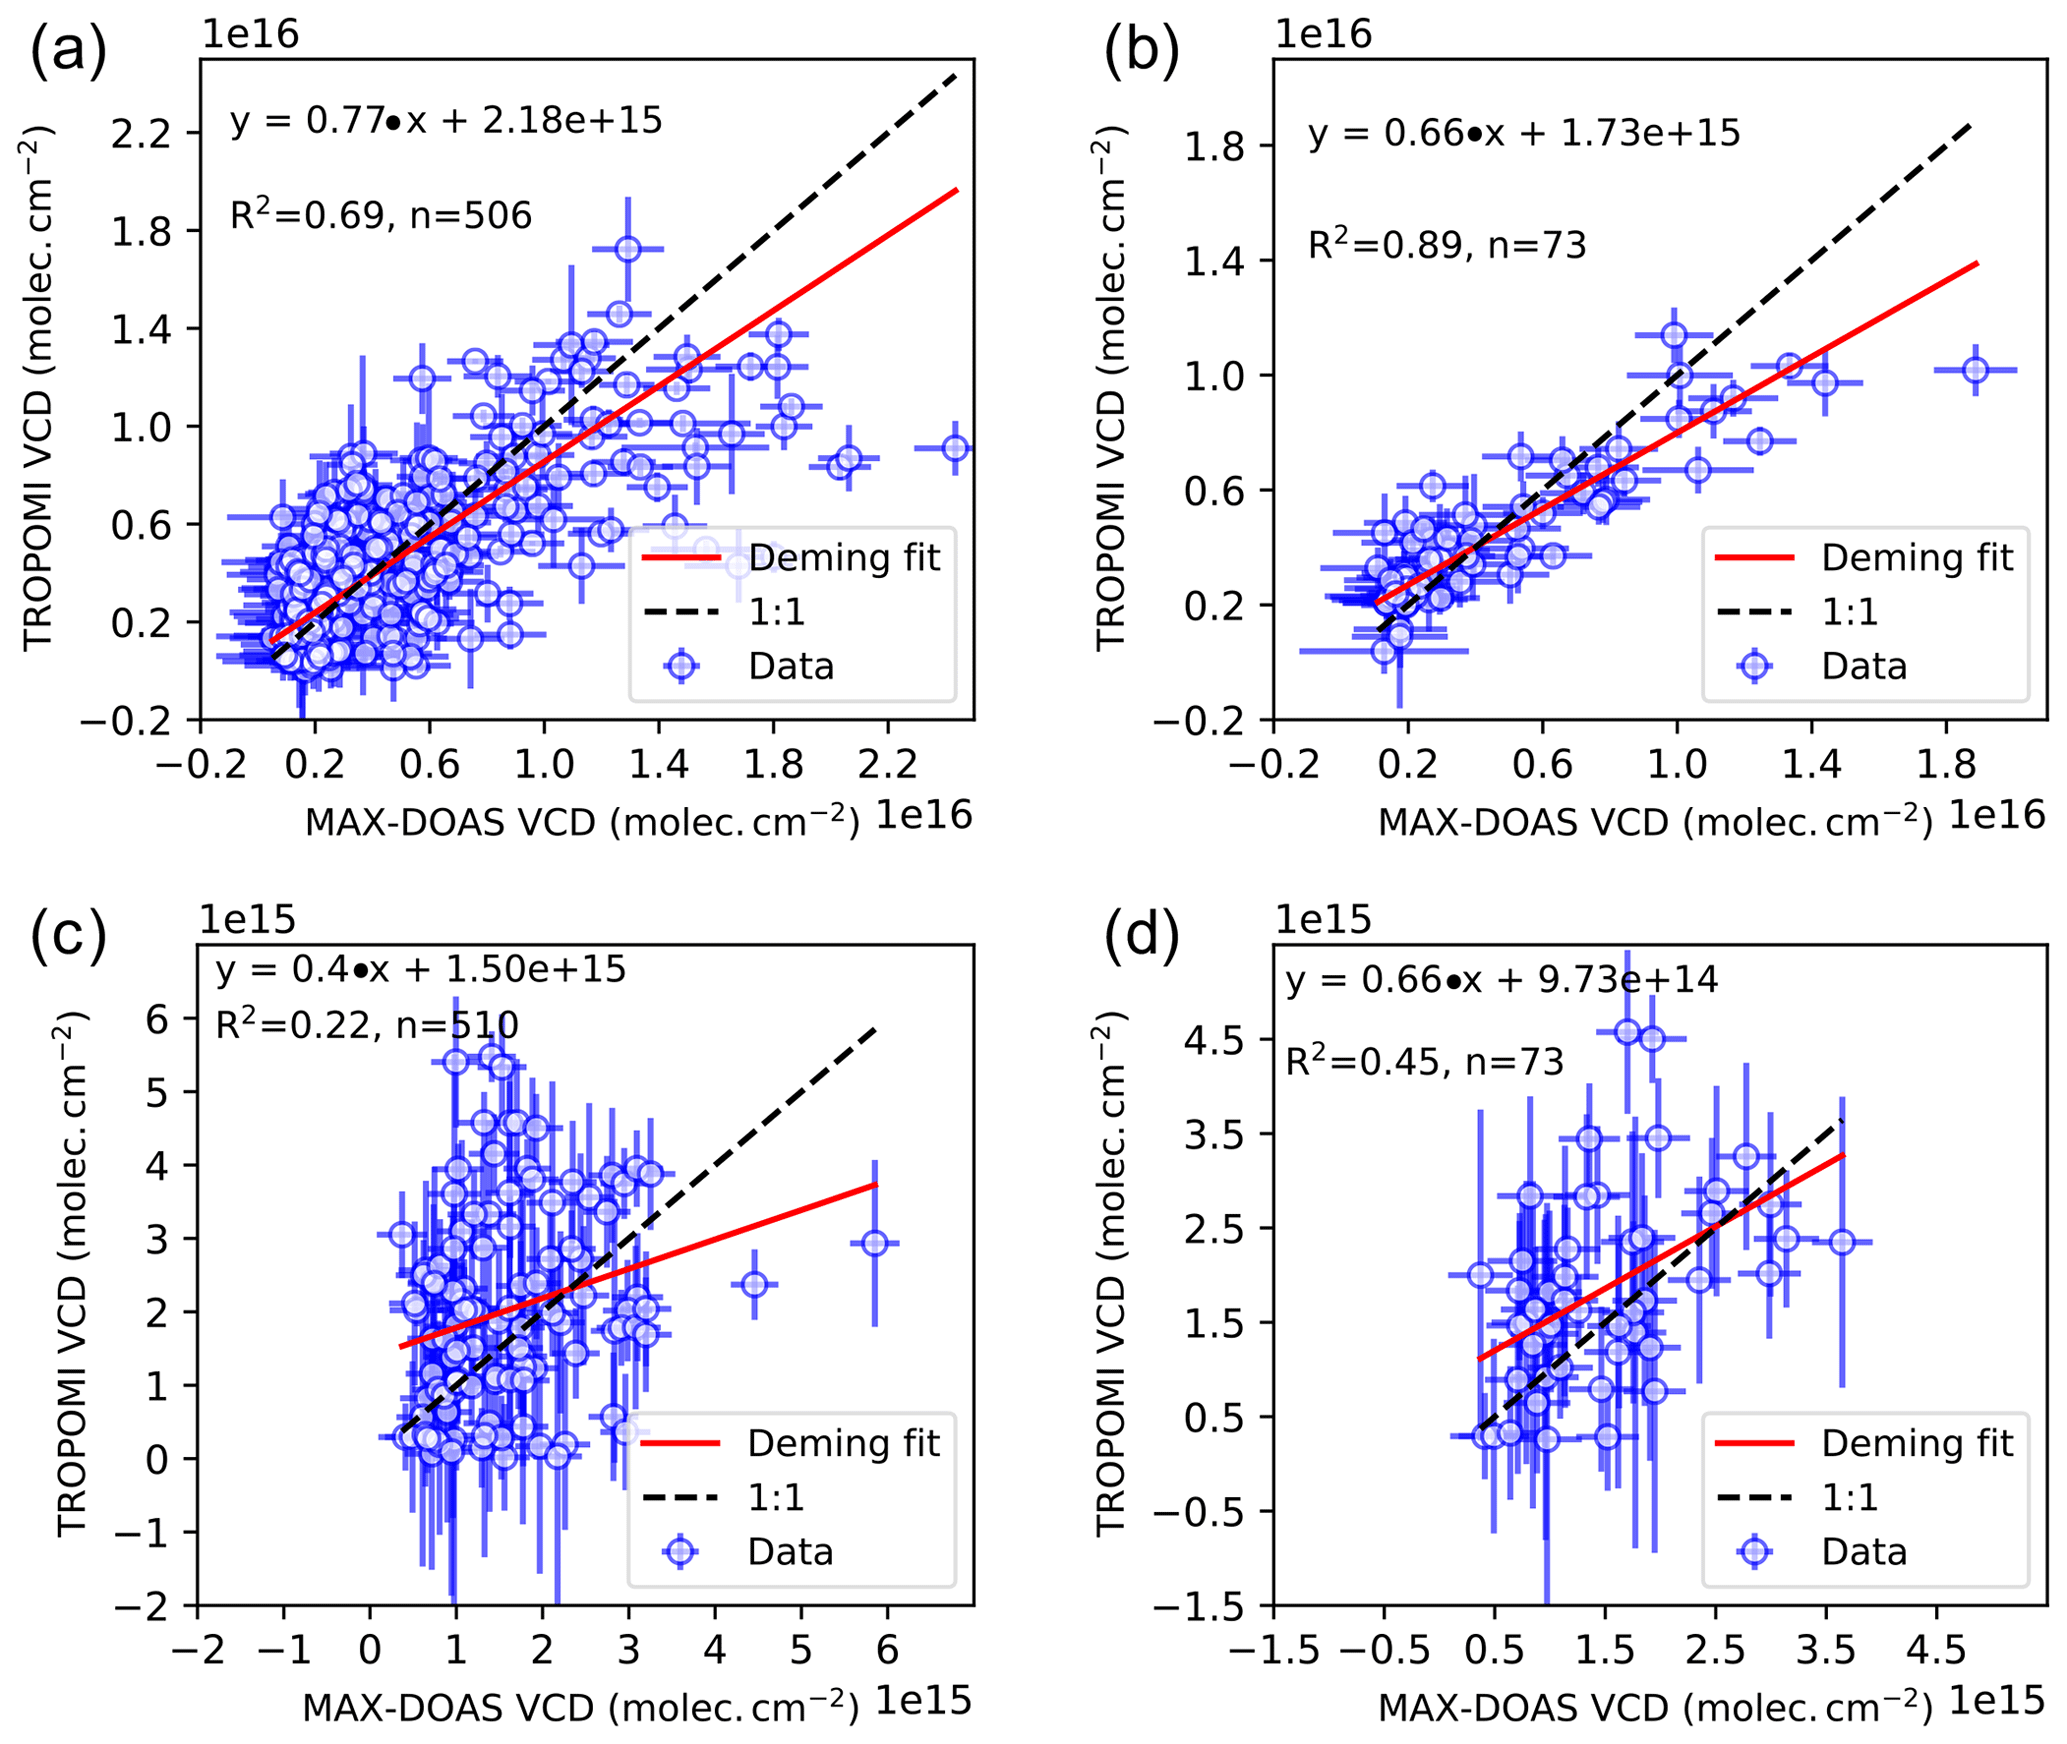
Figure A3Scatter plot results for the comparison of formaldehyde columns from TROPOMI and the MAX-DOAS (convolved with TROPOMI averaging kernels) between May 2018 and November 2019: (a) Broadmeadows daily measurements, (b) Broadmeadows weekly averages, (c) Lauder daily measurements and (d) Lauder weekly averages.
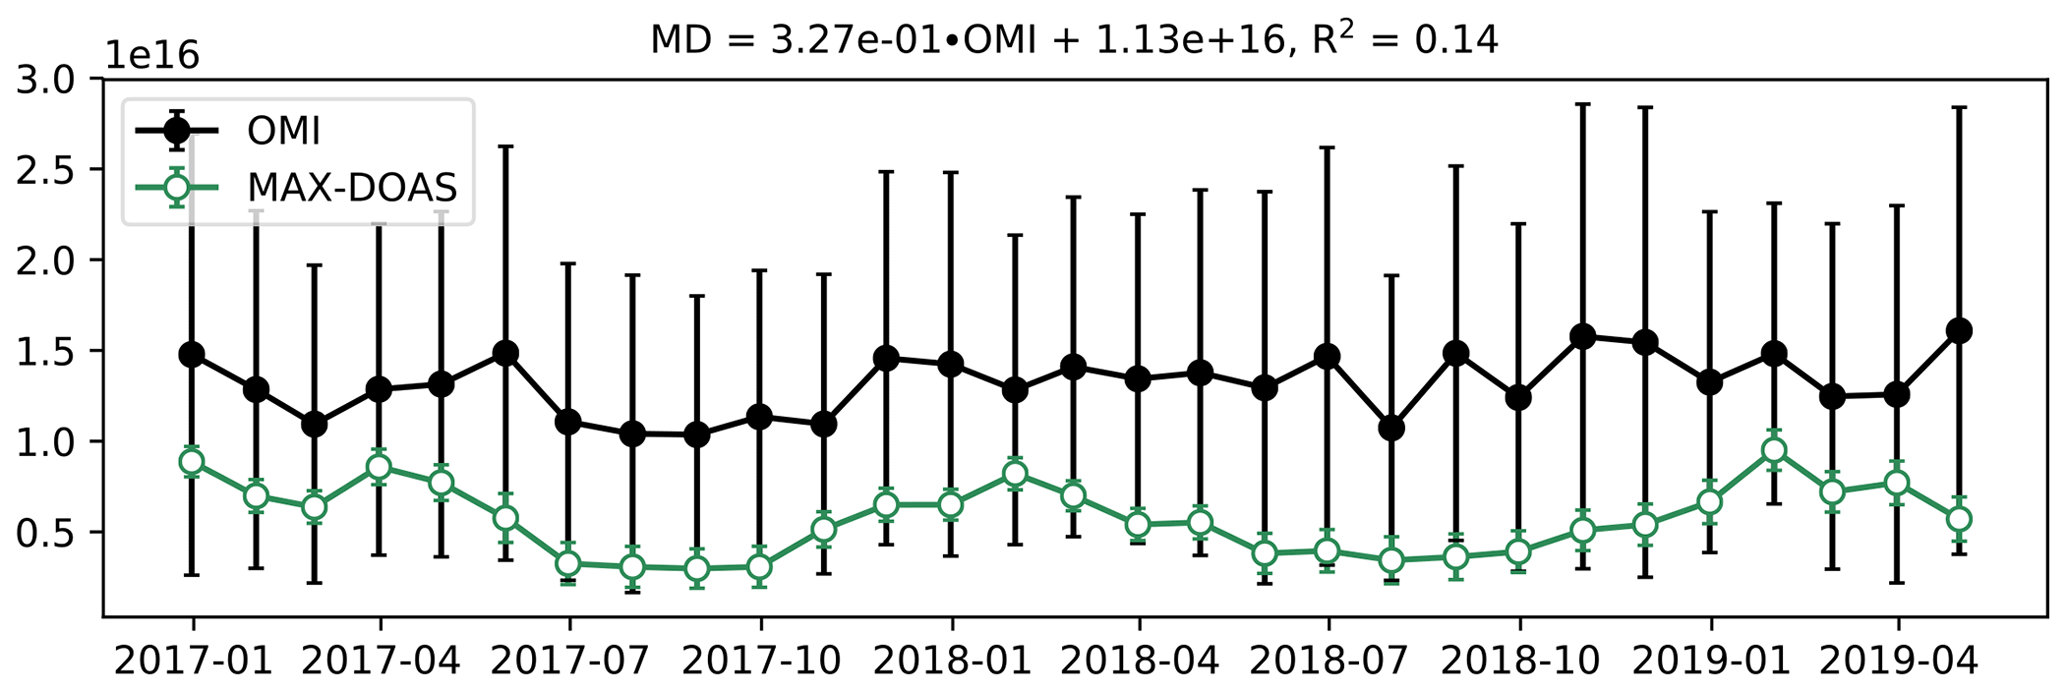
Figure A4Time series of monthly averaged MAX-DOAS and OMI HCHO vertical columns (“ColumnAmount” field) at Broadmeadows from January 2017 to May 2019.
Data available on request from the authors.
RGR processed the MAX-DOAS data, performed the comparison calculations, made the figures and wrote the paper. The study was designed jointly by RGR, JDS, RS, RQ and DS. JDS downloaded TROPOMI data and assisted with both comparison calculations and drafting the paper. RQ and DS were responsible for MAX-DOAS and FTIR data collection at the Lauder site and contributed to writing the article. SR and MT were responsible for MAX-DOAS data collection and Broadmeadows. NJ contributed to vertical column HCHO calculations for FTIR and MAX-DOAS results and assisted with writing the paper. RS directed the project and contributed to drafting the paper.
The authors declare that they have no conflict of interest.
Robert G. Ryan wishes to thank Peter Rayner for helpful discussions on inverse methods and Udo Frieß for access to and assistance with the HEIPRO algorithm. The authors acknowledge Thomas Danckeart, Caroline Fayt and Michel van Roozendael, authors of the QDOAS software used in DOAS analysis in this work and Blair Trewin at the Bureau of Meteorology for providing meteorological data. This research was undertaken with the assistance of resources and services from the National Computational Infrastructure, which is supported by the Australian Government.
This research has been supported by the Australian Research Council's Centre of Excellence for Climate System Science (grant no. CE110001028), the Centre of Excellence for Climate Extremes (grant no. CE170100023) and the Australian Research Council's Discovery project: Tackling Atmospheric Chemistry Grand Challenges in the Southern Hemisphere (grant no. DP160101598). The Albert Shimmins Memorial Fund (through the University of Melbourne) contributed support for the writing of this paper. MAX-DOAS and FTIR measurements at Lauder are core-funded by NIWA through New Zealand's Ministry of Business, Innovation and Employment Strategic Science Investment Fund.
This paper was edited by Michel Van Roozendael and reviewed by three anonymous referees.
Bey, I., Jacob, D. J., Yantosca, R. M., Logan, J. A., Field, B. D., Fiore, A. M., Li, Q., Liu, H. Y., Mickley, L. J., and Schultz, M. G.: Global modeling of tropospheric chemistry with assimilated meteorology: Model description and evaluation, J. Geophys. Res.-Atmos., 106, 073–095, 2001. a
Chan, K. L., Wang, Z., Ding, A., Heue, K.-P., Shen, Y., Wang, J., Zhang, F., Shi, Y., Hao, N., and Wenig, M.: MAX-DOAS measurements of tropospheric NO2 and HCHO in Nanjing and a comparison to ozone monitoring instrument observations, Atmos. Chem. Phys., 19, 10051–10071, https://doi.org/10.5194/acp-19-10051-2019, 2019. a, b
Chance, K., Palmer, P. I., Spurr, R. J., Martin, R. V., Kurosu, T. P., and Jacob, D. J.: Satellite observations of formaldehyde over North America from GOME, Geophys. Res. Lett., 27, 3461–3464, 2000. a
De Mazière, M., Thompson, A. M., Kurylo, M. J., Wild, J. D., Bernhard, G., Blumenstock, T., Braathen, G. O., Hannigan, J. W., Lambert, J.-C., Leblanc, T., McGee, T. J., Nedoluha, G., Petropavlovskikh, I., Seckmeyer, G., Simon, P. C., Steinbrecht, W., and Strahan, S. E.: The Network for the Detection of Atmospheric Composition Change (NDACC): history, status and perspectives, Atmos. Chem. Phys., 18, 4935–4964, https://doi.org/10.5194/acp-18-4935-2018, 2018. a, b
De Smedt, I., Stavrakou, T., Hendrick, F., Danckaert, T., Vlemmix, T., Pinardi, G., Theys, N., Lerot, C., Gielen, C., Vigouroux, C., Hermans, C., Fayt, C., Veefkind, P., Müller, J.-F., and Van Roozendael, M.: Diurnal, seasonal and long-term variations of global formaldehyde columns inferred from combined OMI and GOME-2 observations, Atmos. Chem. Phys., 15, 12519–12545, https://doi.org/10.5194/acp-15-12519-2015, 2015. a, b, c
De Smedt, I., Theys, N., Yu, H., Danckaert, T., Lerot, C., Compernolle, S., Van Roozendael, M., Richter, A., Hilboll, A., Peters, E., Pedergnana, M., Loyola, D., Beirle, S., Wagner, T., Eskes, H., van Geffen, J., Boersma, K. F., and Veefkind, P.: Algorithm theoretical baseline for formaldehyde retrievals from S5P TROPOMI and from the QA4ECV project, Atmos. Meas. Tech., 11, 2395–2426, https://doi.org/10.5194/amt-11-2395-2018, 2018. a, b
Duncan, B. N., Yoshida, Y., Damon, M. R., Douglass, A. R., and Witte, J. C.: Temperature dependence of factors controlling isoprene emissions, Geophys. Res. Lett., 36, L05813, https://doi.org/10.1029/2008GL037090, 2009. a
Emmerson, K. M., Galbally, I. E., Guenther, A. B., Paton-Walsh, C., Guerette, E.-A., Cope, M. E., Keywood, M. D., Lawson, S. J., Molloy, S. B., Dunne, E., Thatcher, M., Karl, T., and Maleknia, S. D.: Current estimates of biogenic emissions from eucalypts uncertain for southeast Australia, Atmos. Chem. Phys., 16, 6997–7011, https://doi.org/10.5194/acp-16-6997-2016, 2016. a, b
Emmerson, K. M., Cope, M. E., Galbally, I. E., Lee, S., and Nelson, P. F.: Isoprene and monoterpene emissions in south-east Australia: comparison of a multi-layer canopy model with MEGAN and with atmospheric observations, Atmos. Chem. Phys., 18, 7539–7556, https://doi.org/10.5194/acp-18-7539-2018, 2018. a, b
Fleischmann, O. C., Hartmann, M., Burrows, J. P., and Orphal, J.: New ultraviolet absorption cross-sections of BrO at atmospheric temperatures measured by time-windowing Fourier transform spectroscopy, J. Photoch. Photobio. A, 168, 117–132, 2004. a
Franco, B., Hendrick, F., Van Roozendael, M., Müller, J.-F., Stavrakou, T., Marais, E. A., Bovy, B., Bader, W., Fayt, C., Hermans, C., Lejeune, B., Pinardi, G., Servais, C., and Mahieu, E.: Retrievals of formaldehyde from ground-based FTIR and MAX-DOAS observations at the Jungfraujoch station and comparisons with GEOS-Chem and IMAGES model simulations, Atmos. Meas. Tech., 8, 1733–1756, https://doi.org/10.5194/amt-8-1733-2015, 2015. a
Frieß, U., Monks, P. S., Remedios, J. J., Rozanov, A., Sinreich, R., Wagner, T., and Platt, U.: MAX-DOAS O4 measurements: A new technique to derive information on atmospheric aerosols: 2. Modeling studies, J. Geophys. Res.-Atmos., 111, D14203, https://doi.org/10.1029/2005JD006618, 2006. a
Fuentes, J. D., Lerdau, M., Atkinson, R., Baldocchi, D., Bottenheim, J. W., Ciccioli, P., Lamb, B., Geron, C., Gu, L., Guenther, A., Sharkey, T. D., and Stockwell, W.: Biogenic Hydrocarbons in the Atmospheric Boundary Layer: A Review, B. Am. Meteorol. Soc., 81, 1537–1576, 2000. a
Garcia, R., Marsh, D., Kinnison, D., Boville, B., and Sassi, F.: Simulation of secular trends in the middle atmosphere, 1950–2003, J. Geophys. Res.-Atmos., 112, D09301, https://doi.org/10.1029/2006JD007485, 2007. a
Gielen, C., Van Roozendael, M., Hendrick, F., Pinardi, G., Vlemmix, T., De Bock, V., De Backer, H., Fayt, C., Hermans, C., Gillotay, D., and Wang, P.: A simple and versatile cloud-screening method for MAX-DOAS retrievals, Atmos. Meas. Tech., 7, 3509–3527, https://doi.org/10.5194/amt-7-3509-2014, 2014. a
González Abad, G., Liu, X., Chance, K., Wang, H., Kurosu, T. P., and Suleiman, R.: Updated Smithsonian Astrophysical Observatory Ozone Monitoring Instrument (SAO OMI) formaldehyde retrieval, Atmos. Meas. Tech., 8, 19–32, https://doi.org/10.5194/amt-8-19-2015, 2015. a
Grainger, J. F. and Ring, J.: Anomalous Fraunhofer Line Profiles, Nature, 193, 762–762, 1962. a
Guenther, A. B., Jiang, X., Heald, C. L., Sakulyanontvittaya, T., Duhl, T., Emmons, L. K., and Wang, X.: The Model of Emissions of Gases and Aerosols from Nature version 2.1 (MEGAN2.1): an extended and updated framework for modeling biogenic emissions, Geosci. Model Dev., 5, 1471–1492, https://doi.org/10.5194/gmd-5-1471-2012, 2012. a, b
Heckel, A., Richter, A., Tarsu, T., Wittrock, F., Hak, C., Pundt, I., Junkermann, W., and Burrows, J. P.: MAX-DOAS measurements of formaldehyde in the Po-Valley, Atmos. Chem. Phys., 5, 909–918, https://doi.org/10.5194/acp-5-909-2005, 2005. a, b
Henze, D. K., Seinfeld, J. H., Ng, N. L., Kroll, J. H., Fu, T.-M., Jacob, D. J., and Heald, C. L.: Global modeling of secondary organic aerosol formation from aromatic hydrocarbons: high- vs. low-yield pathways, Atmos. Chem. Phys., 8, 2405–2420, https://doi.org/10.5194/acp-8-2405-2008, 2008. a
Hoque, H. M. S., Irie, H., and Damiani, A.: First MAX-DOAS Observations of Formaldehyde and Glyoxal in Phimai, Thailand, J. Geophys. Res.-Atmos., 123, 9957–9975, 2018a. a
Hoque, H. M. S., Irie, H., Damiani, A., Rawat, P., and Naja, M.: First simultaneous observations of formaldehyde and glyoxal by MAX-DOAS in the Indo-Gangetic Plain region, SOLA, 14, 159–164, https://doi.org/10.2151/sola.2018-028, 2018b. a, b, c, d
Johansson, M., Rivera, C., de Foy, B., Lei, W., Song, J., Zhang, Y., Galle, B., and Molina, L.: Mobile mini-DOAS measurement of the outflow of NO2 and HCHO from Mexico City, Atmos. Chem. Phys., 9, 5647–5653, https://doi.org/10.5194/acp-9-5647-2009, 2009. a
Jones, N., Koike, M., Matthews, W., and McNamara, B.: Southern hemisphere mid-latitude seasonal cycle in total column nitric acid, Geophys. Res. Lett., 21, 593–596, 1994. a
Jones, N. B., Riedel, K., Allan, W., Wood, S., Palmer, P. I., Chance, K., and Notholt, J.: Long-term tropospheric formaldehyde concentrations deduced from ground-based fourier transform solar infrared measurements, Atmos. Chem. Phys., 9, 7131–7142, https://doi.org/10.5194/acp-9-7131-2009, 2009. a, b
Kefauver, S. C., Filella, I., and Peñuelas, J.: Remote sensing of atmospheric biogenic volatile organic compounds (BVOCs) via satellite-based formaldehyde vertical column assessments, Int. J. Remote Sens., 35, 7519–7542, 2014. a
Khatri, P. and Takamura, T.: An Algorithm to Screen Cloud-A? ected Data for Sky Radiometer Data Analysis, J. Meteorol. Soc. Jpn., 87, 189–204, 2009. a
Kreher, K., Van Roozendael, M., Hendrick, F., Apituley, A., Dimitropoulou, E., Frieß, U., Richter, A., Wagner, T., Lampel, J., Abuhassan, N., Ang, L., Anguas, M., Bais, A., Benavent, N., Bösch, T., Bognar, K., Borovski, A., Bruchkouski, I., Cede, A., Chan, K. L., Donner, S., Drosoglou, T., Fayt, C., Finkenzeller, H., Garcia-Nieto, D., Gielen, C., Gómez-Martín, L., Hao, N., Henzing, B., Herman, J. R., Hermans, C., Hoque, S., Irie, H., Jin, J., Johnston, P., Khayyam Butt, J., Khokhar, F., Koenig, T. K., Kuhn, J., Kumar, V., Liu, C., Ma, J., Merlaud, A., Mishra, A. K., Müller, M., Navarro-Comas, M., Ostendorf, M., Pazmino, A., Peters, E., Pinardi, G., Pinharanda, M., Piters, A., Platt, U., Postylyakov, O., Prados-Roman, C., Puentedura, O., Querel, R., Saiz-Lopez, A., Schönhardt, A., Schreier, S. F., Seyler, A., Sinha, V., Spinei, E., Strong, K., Tack, F., Tian, X., Tiefengraber, M., Tirpitz, J.-L., van Gent, J., Volkamer, R., Vrekoussis, M., Wang, S., Wang, Z., Wenig, M., Wittrock, F., Xie, P. H., Xu, J., Yela, M., Zhang, C., and Zhao, X.: Intercomparison of NO2, O4, O3 and HCHO slant column measurements by MAX-DOAS and zenith-sky UV–visible spectrometers during CINDI-2, Atmos. Meas. Tech., 13, 2169–2208, https://doi.org/10.5194/amt-13-2169-2020, 2020. a, b, c
Kurosu, T. P., Chance, K., Liu, X., Volkamer, R., Fu, T.-M., Millet, D., Jacob, D. J., and Levelt, P.: Seasonally resolved global distributions of glyoxal and formaldehyde observed from the Ozone Monitoring Instrument on EOS Aura, Proceeding of Anais XIII Simpósio Brasileiro de Sensoriamento Remoto, 21, 6461, 2007. a
Lee, H., Ryu, J., Irie, H., Jang, S.-H., Park, J., Choi, W., and Hong, H.: Investigations of the diurnal variation of vertical HCHO profiles based on MAX-DOAS measurements in Beijing: Comparisons with OMI vertical column data, Atmosphere-Basel, 6, 1816–1832, 2015. a
Lelieveld, J., Butler, T., Crowley, J., Dillon, T., Fischer, H., Ganzeveld, L., Harder, H., Lawrence, M., Martinez, M., and Taraborrelli, D.: Atmospheric oxidation capacity sustained by a tropical forest, Nature, 452, 737–740, 2008. a
Levelt, P. F., van den Oord, G. H. J., Dobber, M. R., Malkki, A., Visser, H., de Vries, J., Stammes, P., Lundell, J. O. V., and Saari, H.: The ozone monitoring instrument, IEEE T. Geosci. Remote, 44, 1093–1101, 2006. a
Mahajan, A. S., Whalley, L. K., Kozlova, E., Oetjen, H., Mendez, L., Furneaux, K. L., Goddard, A., Heard, D. E., Plane, J. M., and Saiz-Lopez, A.: DOAS observations of formaldehyde and its impact on the HOx balance in the tropical Atlantic marine boundary layer, J. Atmos. Chem., 66, 167, 2010. a
Martin, R. V.: Satellite remote sensing of surface air quality, Atmos. Environ., 42, 7823–7843, 2008. a
Meller, R. and Moortgat, G. K.: Temperature dependence of the absorption cross sections of formaldehyde between 223 and 323 K in the wavelength range 225–375nm, J. Geophys. Res.-Atmos., 105, 7089–7101, 2000. a
Palmer, P. I., Abbot, D. S., Fu, T.-M. Jacob, D. J., Chance, K., Kurosu, T. P., Guenther, A., Wiedinmyer, C., Stanton, J. C., Pilling, M. J., Pressley, S. N., Lamb, B., and Sumner, A. L.: Quantifying the seasonal and interannual variability of North American isoprene emissions using satellite observations of the formaldehyde column, J. Geophys. Res.-Atmos., 111, D12315, https://doi.org/10.1029/2005JD006689, 2006. a
Peters, E., Wittrock, F., Großmann, K., Frieß, U., Richter, A., and Burrows, J. P.: Formaldehyde and nitrogen dioxide over the remote western Pacific Ocean: SCIAMACHY and GOME-2 validation using ship-based MAX-DOAS observations, Atmos. Chem. Phys., 12, 11179–11197, https://doi.org/10.5194/acp-12-11179-2012, 2012. a, b, c
Pfister, G., Emmons, L., Hess, P., Lamarque, J., Orlando, J., Walters, S., Guenther, A., Palmer, P., and Lawrence, P.: Contribution of isoprene to chemical budgets: A model tracer study with the NCAR CTM MOZART-4, J. Geophys. Res.-Atmos., 113, D05308, https://doi.org/10.1029/2007JD008948, 2008. a, b
Pinardi, G., Van Roozendael, M., Abuhassan, N., Adams, C., Cede, A., Clémer, K., Fayt, C., Frieß, U., Gil, M., Herman, J., Hermans, C., Hendrick, F., Irie, H., Merlaud, A., Navarro Comas, M., Peters, E., Piters, A. J. M., Puentedura, O., Richter, A., Schönhardt, A., Shaiganfar, R., Spinei, E., Strong, K., Takashima, H., Vrekoussis, M., Wagner, T., Wittrock, F., and Yilmaz, S.: MAX-DOAS formaldehyde slant column measurements during CINDI: intercomparison and analysis improvement, Atmos. Meas. Tech., 6, 167–185, https://doi.org/10.5194/amt-6-167-2013, 2013. a, b
Pollard, D. F., Sherlock, V., Robinson, J., Deutscher, N. M., Connor, B., and Shiona, H.: The Total Carbon Column Observing Network site description for Lauder, New Zealand, Earth Syst. Sci. Data, 9, 977–992, https://doi.org/10.5194/essd-9-977-2017, 2017. a
Rodgers, C. D. and Connor, B. J.: Intercomparison of remote sounding instruments, J. Geophys. Res.-Atmos., 108, 4116, https://doi.org/10.1029/2002JD002299, 2003. a, b, c
Ryan, R. G., Rhodes, S., Tully, M., Wilson, S., Jones, N., Frieß, U., and Schofield, R.: Daytime HONO, NO2 and aerosol distributions from MAX-DOAS observations in Melbourne, Atmos. Chem. Phys., 18, 13969–13985, https://doi.org/10.5194/acp-18-13969-2018, 2018. a, b, c, d, e, f
Serdyuchenko, A., Gorshelev, V., Weber, M., Chehade, W., and Burrows, J. P.: High spectral resolution ozone absorption cross-sections – Part 2: Temperature dependence, Atmos. Meas. Tech., 7, 625–636, https://doi.org/10.5194/amt-7-625-2014, 2014. a
Stutz, J., Kim, E., Platt, U., Bruno, P., Perrino, C., and Febo, A.: UV visible absorption cross sections of nitrous acid, J. Geophys. Res.-Atmos., 105, 14585–14592, 2000. a
Thalman, R. and Volkamer, R.: Temperature dependent absorption cross-sections of O2–O2 collision pairs between 340 and 630nm and at atmospherically relevant pressure, Phys. Chem. Chem. Phys., 15, 15371–15381, 2013. a
Thomas, W., Hegels, E., Slijkhuis, S., Spurr, R., and Chance, K.: Detection of biomass burning combustion products in Southeast Asia from backscatter data taken by the GOME spectrometer, Geophys. Res. Lett., 25, 1317–1320, 1998. a
Tian, X., Xie, P., Xu, J., Li, A., Wang, Y., Qin, M., and Hu, Z.: Long-term observations of tropospheric NO2, SO2 and HCHO by MAX-DOAS in Yangtze River Delta area, China, J. Environ. Sci., 71, 207–221, 2018. a
Tradowsky, J. S., Bodeker, G. E., Querel, R. R., Builtjes, P. J. H., and Fischer, J.: Combining data from the distributed GRUAN site Lauder–Invercargill, New Zealand, to provide a site atmospheric state best estimate of temperature, Earth Syst. Sci. Data, 10, 2195–2211, https://doi.org/10.5194/essd-10-2195-2018, 2018. a
Vandaele, A. C., Hermans, C., Simon, P. C., Carleer, M., Colin, R., Fally, S., Merienne, M.-F., Jenouvrier, A., and Coquart, B.: Measurements of the NO2 absorption cross section from 42 000 cm-1 to 10 000 cm-1 (238–1000 nm) at 220 K and 294 K, J. Quant. Spectrosc. Ra., 59, 171–184, 1998. a
Veefkind, J., Aben, I., McMullan, K., Förster, H., De Vries, J., Otter, G., Claas, J., Eskes, H., De Haan, J., Kleipool, Q., vanWeele, M., Hasekamp, O., Hoogeveen, R., Landgraf, J., Snel, R., Tol, P., Ingmann, P., Voors, R., Kruizinga, B., Vink, R., Visser, H., and Levelt, P.: TROPOMI on the ESA Sentinel-5 Precursor: A GMES mission for global observations of the atmospheric composition for climate, air quality and ozone layer applications, Remote Sens. Environ., 120, 70–83, 2012. a
Vigouroux, C., Hendrick, F., Stavrakou, T., Dils, B., De Smedt, I., Hermans, C., Merlaud, A., Scolas, F., Senten, C., Vanhaelewyn, G., Fally, S., Carleer, M., Metzger, J.-M., Müller, J.-F., Van Roozendael, M., and De Mazière, M.: Ground-based FTIR and MAX-DOAS observations of formaldehyde at Réunion Island and comparisons with satellite and model data, Atmos. Chem. Phys., 9, 9523–9544, https://doi.org/10.5194/acp-9-9523-2009, 2009. a, b, c, d, e, f, g, h, i, j, k, l, m, n, o, p
Vigouroux, C., Bauer Aquino, C. A., Bauwens, M., Becker, C., Blumenstock, T., De Mazière, M., García, O., Grutter, M., Guarin, C., Hannigan, J., Hase, F., Jones, N., Kivi, R., Koshelev, D., Langerock, B., Lutsch, E., Makarova, M., Metzger, J.-M., Müller, J.-F., Notholt, J., Ortega, I., Palm, M., Paton-Walsh, C., Poberovskii, A., Rettinger, M., Robinson, J., Smale, D., Stavrakou, T., Stremme, W., Strong, K., Sussmann, R., Té, Y., and Toon, G.: NDACC harmonized formaldehyde time series from 21 FTIR stations covering a wide range of column abundances, Atmos. Meas. Tech., 11, 5049–5073, https://doi.org/10.5194/amt-11-5049-2018, 2018. a, b, c, d, e
Vigouroux, C., Langerock, B., Bauer Aquino, C. A., Blumenstock, T., Cheng, Z., De Mazière, M., De Smedt, I., Grutter, M., Hannigan, J. W., Jones, N., Kivi, R., Loyola, D., Lutsch, E., Mahieu, E., Makarova, M., Metzger, J.-M., Morino, I., Murata, I., Nagahama, T., Notholt, J., Ortega, I., Palm, M., Pinardi, G., Röhling, A., Smale, D., Stremme, W., Strong, K., Sussmann, R., Té, Y., van Roozendael, M., Wang, P., and Winkler, H.: TROPOMI–Sentinel-5 Precursor formaldehyde validation using an extensive network of ground-based Fourier-transform infrared stations, Atmos. Meas. Tech., 13, 3751–3767, https://doi.org/10.5194/amt-13-3751-2020, 2020. a, b, c, d, e
Wagner, T., Apituley, A., Beirle, S., Dörner, S., Friess, U., Remmers, J., and Shaiganfar, R.: Cloud detection and classification based on MAX-DOAS observations, Atmos. Meas. Tech., 7, 1289–1320, https://doi.org/10.5194/amt-7-1289-2014, 2014. a
Wagner, T., Beirle, S., Remmers, J., Shaiganfar, R., and Wang, Y.: Absolute calibration of the colour index and O4 absorption derived from Multi AXis (MAX-)DOAS measurements and their application to a standardised cloud classification algorithm, Atmos. Meas. Tech., 9, 4803–4823, https://doi.org/10.5194/amt-9-4803-2016, 2016. a
Wang, Y., Beirle, S., Lampel, J., Koukouli, M., De Smedt, I., Theys, N., Li, A., Wu, D., Xie, P., Liu, C., Van Roozendael, M., Stavrakou, T., Müller, J.-F., and Wagner, T.: Validation of OMI, GOME-2A and GOME-2B tropospheric NO2, SO2 and HCHO products using MAX-DOAS observations from 2011 to 2014 in Wuxi, China: investigation of the effects of priori profiles and aerosols on the satellite products, Atmos. Chem. Phys., 17, 5007–5033, https://doi.org/10.5194/acp-17-5007-2017, 2017a. a, b
Wang, Y., Lampel, J., Xie, P., Beirle, S., Li, A., Wu, D., and Wagner, T.: Ground-based MAX-DOAS observations of tropospheric aerosols, NO2, SO2 and HCHO in Wuxi, China, from 2011 to 2014, Atmos. Chem. Phys., 17, 2189–2215, https://doi.org/10.5194/acp-17-2189-2017, 2017b. a
Winters, A. J., Adams, M. A., Bleby, T. M., Rennenberg, H., Steigner, D., Steinbrecher, R., and Kreuzwieser, J.: Emissions of isoprene, monoterpene and short-chained carbonyl compounds from Eucalyptus spp. in southern Australia, Atmos. Environ., 43, 3035–3043, 2009. a
Wolfe, G. M., Kaiser, J., Hanisco, T. F., Keutsch, F. N., de Gouw, J. A., Gilman, J. B., Graus, M., Hatch, C. D., Holloway, J., Horowitz, L. W., Lee, B. H., Lerner, B. M., Lopez-Hilifiker, F., Mao, J., Marvin, M. R., Peischl, J., Pollack, I. B., Roberts, J. M., Ryerson, T. B., Thornton, J. A., Veres, P. R., and Warneke, C.: Formaldehyde production from isoprene oxidation across NOx regimes, Atmos. Chem. Phys., 16, 2597–2610, https://doi.org/10.5194/acp-16-2597-2016, 2016. a
Zhu, L., Jacob, D. J., Mickley, L. J., Marais, E. A., Cohan, D. S., Yoshida, Y., Duncan, B. N., Abad, G. G., and Chance, K. V.: Anthropogenic emissions of highly reactive volatile organic compounds in eastern Texas inferred from oversampling of satellite (OMI) measurements of HCHO columns, Environ. Res. Lett., 9, 114004, 2014. a
Zhu, L., Jacob, D. J., Kim, P. S., Fisher, J. A., Yu, K., Travis, K. R., Mickley, L. J., Yantosca, R. M., Sulprizio, M. P., De Smedt, I., González Abad, G., Chance, K., Li, C., Ferrare, R., Fried, A., Hair, J. W., Hanisco, T. F., Richter, D., Jo Scarino, A., Walega, J., Weibring, P., and Wolfe, G. M.: Observing atmospheric formaldehyde (HCHO) from space: validation and intercomparison of six retrievals from four satellites (OMI, GOME2A, GOME2B, OMPS) with SEAC4RS aircraft observations over the southeast US, Atmos. Chem. Phys., 16, 13477–13490, https://doi.org/10.5194/acp-16-13477-2016, 2016. a, b
Zhu, L., Jacob, D. J., Keutsch, F. N., Mickley, L. J., Scheffe, R., Strum, M., Gonzalez Abad, G., Chance, K., Yang, K., Rappengluck, B., Millet, D. B., Baasandorj, B., Jaegl, L., and Shah, V.: Formaldehyde (HCHO) as a hazardous air pollutant: Mapping surface air concentrations from satellite and inferring cancer risks in the United States, Environ. Sci. Tech., 51, 5650–5657, 2017. a