the Creative Commons Attribution 4.0 License.
the Creative Commons Attribution 4.0 License.
 | 24 Mar 2021
The improved comparative reactivity method (ICRM): measurements of OH reactivity under high-NOx conditions in ambient air
Wenjie Wang
Jipeng Qi
Yuwen Peng
Sihang Wang
Suxia Yang
Jonathan Williams
Vinayak Sinha
Min Shao
The comparative reactivity method (CRM) was developed more than a decade to measure OH reactivity (i.e., OH loss frequency) in both laboratory and field studies. However, accurate OH reactivity quantification remains challenging under real ambient conditions, especially for OH reactivity measurements in high-NOx (e.g., > 10 ppbv) environments, as ambient NO enhances the regeneration of OH radicals in the CRM reactor. To solve this problem, we design a new and improved CRM reactor (ICRM) and add NO into the system continuously so that the HO2 radical concentration is suppressed. We confirmed the appropriate level of NO by determining the maximum decrease in the pyrrole level caused by regenerated OH radicals from NO + HO2. RO2 radicals induced by volatile organic compounds (VOCs) in the ICRM reactor were also found to react with NO, which led to the regeneration of OH radicals and thus the underestimation of OH reactivity. This effect was quantified by the calibration of representative VOC species at different NO levels, and the correction coefficients obtained were used to correct the measured OH reactivity. All these efforts resulted in reducing the uncertainty of the NO-artifact correction by at least an order of magnitude compared to the original CRM system. Additionally, these technological improvements also considerably reduced the systematic errors from pyrrole photolysis in the original system. A new operation mode was proposed for the ICRM, which is able to avoid the interference resulting from OH radicals produced by photolysis of residual humidity and save time for ambient measurement. The ICRM system was employed in a field campaign to measure OH reactivity and performed well with ambient NO levels ranging from 0 to 50 ppbv, which are typically observed in the urban and suburban atmosphere.
- Article
(5403 KB) - Full-text XML
-
Supplement
(2041 KB) - BibTeX
- EndNote


The hydroxyl radical (OH) is the most important oxidant in the daytime troposphere. It initiates the chemically removal of primary gaseous pollutants and in turn produces a host of secondary pollutants (Hofzumahaus, 1991; Atkinson, 2000; Atkinson and Arey, 2003). OH reactivity is defined as the sum of all OH reactive trace gas concentrations multiplied by their respective reaction rate coefficients with OH, as shown in Eq. (1). OH reactivity is a fundamental property of the atmosphere in that it defines the overall loss frequency of OH radicals and hence the lifetime of OH. As such, it is a useful atmospheric parameter for evaluating the level of reactive pollutants, and it is closely related to atmospheric oxidation capacity and the formation of secondary pollutants, including ozone and secondary aerosols (Sinha et al., 2012; Yang et al., 2016; Pfannerstill et al., 2019).
Equation (1) defines OH reactivity, where ROH is the total OH reactivity, and kCO, kNO, , , , and represent the reaction rate coefficients between OH radicals and CO, NO, NO2, SO2, O3, and volatile organic compound (VOC) species i, respectively. [CO], [NO], [NO2], [SO2], [O3], and [VOCi] are the concentrations of CO, NO, NO2, SO2, O3, and VOC species i, respectively.
Currently, two general methods are used to measure OH reactivity: (1) direct measurements of OH decay rates by using a laser-induced fluorescence (LIF) technique and (2) measuring the relative change in a reference substance with and without ambient air present by using the comparative reactivity method (CRM). LIF-based technology has been used to measure OH reactivity in a variety of different environments and has provided many new insights into the budget of OH reactivity (Kovacs and Brune, 2001, 2003; Sadanaga et al., 2004, 2005; Ingham et al., 2009; Lou et al., 2010). However, the cost, complexity, and large size of LIF systems are deterrents to widespread deployment for field measurements (Sinha et al., 2008). Such detector systems need to be built and cannot be bought directly from a supplier. The CRM measures the OH decay rate indirectly by using the relative reaction rate of a reference substance (pyrrole) with self-generated OH radicals in the presence and absence of ambient air. The reference substance can be measured by an online instrument, such as a proton transfer reaction mass spectrometer (PTR-MS) (Sinha et al., 2008, 2009; Kumar and Sinha, 2014) or a gas chromatograph (Nolscher et al., 2012a; Praplan et al., 2017a, 2019). The CRM technique has proven to be a useful supplementary technique to measure the total OH reactivity in ambient air, with a more economical and portable setup than LIF-based systems. Based on an intercomparison between various OH reactivity techniques in the SAPHIR chamber, LIF-type instruments are generally more sensitive and less noisy than CRM instruments (Fuchs et al., 2017).
The CRM has been applied to numerous field campaigns in recent years to measure OH reactivity (Dolgorouky et al., 2012; Nölscher et al., 2014; Michoud et al., 2015; Kim et al., 2016; Zannoni et al., 2016, 2017; Praplan et al., 2017b, 2019; Yang et al., 2017; Kumar et al., 2018; Pfannerstill et al., 2018, 2019). However, this method is not suitable for environments with high levels of NOx due to the pen-ray mercury lamp used to generate OH radicals in the CRM system. It also generates approximately equivalent amounts of HO2 radicals that may react with sampled NO to produce additional OH radicals (Sinha et al., 2008; Yang et al., 2017), which cause an enhanced consumption of pyrrole in the CRM system and result in an underestimation of OH reactivity in sampled ambient air when NO exceeds certain levels (Sinha et al., 2008). This NO interference prevents the CRM from providing high-quality data in emission exhaust and urban areas with high NO levels. As a result, applications of the CRM have been generally restricted to high-reactivity, low-NOx environments, including forests (Sinha et al., 2010; Kim et al., 2011; Nolscher et al., 2012b; Praplan et al., 2019; Pfannerstill et al., 2020), moderately polluted cities (NO < 10 ppb) (Sinha et al., 2008; Praplan et al., 2017b), pristine marine environments (Sinha et al., 2012; Zannoni et al., 2015), emission sources (e.g., gasoline evaporation) (Wu et al., 2015), branch cuvette studies (Nölscher et al., 2013), and chamber studies (Nölscher et al., 2014) with little or no NOx present. One solution to this issue is to deliberately remove NO before the sampled air is introduced into the reactor. However, the present technology is not able to remove NO selectively without affecting other reactive species (i.e., VOCs). The effect of NO on measured OH reactivity can be quantified by NO-correction experiments, and the resulting correction curve can be applied to adjust ambient measurements according to simultaneously measured NO levels (Hansen et al., 2015; Yang et al., 2017). However, the uncertainty of measured OH reactivity due to NO correction increases with the NO concentration (Hansen et al., 2015; Michoud et al., 2015). Hansen et al. (2015) reported that the total uncertainty increases by up to a factor of 3 at NOx mixing ratios higher than 40 ppbv. Therefore, this calls for an improvement of the traditional CRM reactor for accurately quantifying OH reactivity in high-NOx conditions. In addition to the NO effect, photolysis of pyrrole and VOCs as well as the humidity difference between zero air and ambient air also influence measured OH reactivity (Sinha et al., 2008; Hansen et al., 2015; Zannoni et al., 2015).
The main purpose of this study is to improve the original CRM system to make it suitable for use in high-NOx conditions. We modified the structure of the original CRM glass reactor and added a certain amount of NO into the system to remove the generated but unwanted HO2 radicals. We further characterized the improved CRM (ICRM) system by quantitatively evaluating the effect of the reaction of sample VOC-induced RO2 with NO on measured OH reactivity. Additionally, the interference of pyrrole photolysis was also systematically evaluated. Finally, the ICRM system was deployed to measure OH reactivity under high-NOx conditions (0–50 ppbv) during a field campaign in the Pearl River Delta region of China.
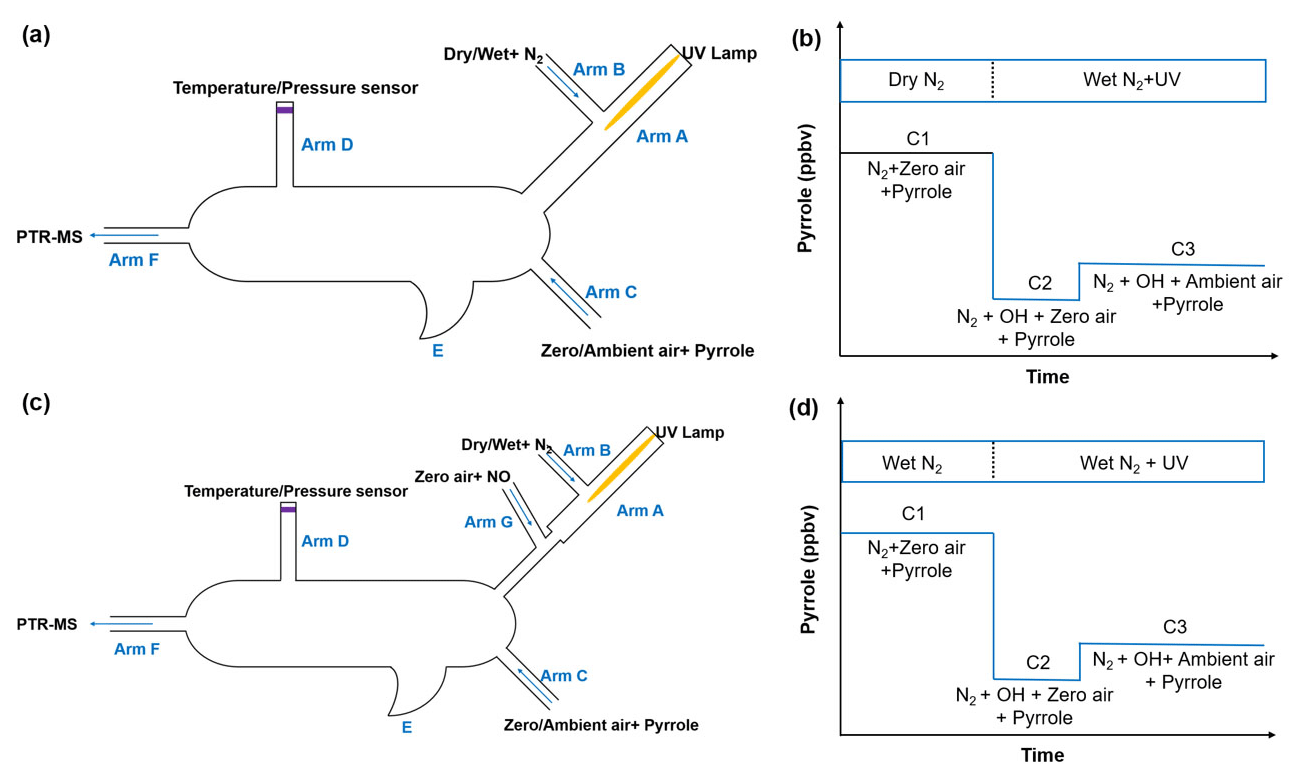
Figure 1Schematic and work mode of the original CRM (Sinha et al., 2008, a, b) and the ICRM (this study, c, d).
2.1 The original CRM reactor
The schematic of the original CRM reactor is shown in Fig. 1a. Gas-phase pyrrole mixed with zero air or ambient air is introduced through arm C at a constant flow. Arm A consists of a pen-ray spectral mercury lamp (Analytik Jean; 90-0012-01), over which nitrogen (humidified or dry) is passed through arm B at a constant flow rate. When humidified nitrogen is flowing and the mercury lamp is turned on, H2O is photolyzed into OH and H radicals by the mercury lamp at 254 nm. The total airflow in the reactor exits through arm F, and the concentration of pyrrole is monitored with a PTR-MS. A detailed description of the original CRM has been reported by Sinha et al. (2008).
Figure 1b shows the four work modes of the original CRM (Sinha et al., 2009). In C0 mode, the mercury lamp is turned off and high-purity dry nitrogen is introduced into the reactor through arm B. Pyrrole is introduced into the reactor with dry zero air through arm C. In C1 mode, the mercury lamp is turned on while everything else remains the same as C0. The pyrrole concentration decreases during C1 mode due to its photolysis reaction. In C2 mode, nitrogen flow in C1 is changed to humidified nitrogen to generate OH radicals, and the pyrrole concentration decreases to C2. In the final step, ambient air is introduced to the reactor through arm C in C3 mode. Based on pseudo-first-order assumptions (i.e., [pyrrole] ≥ [OH]), total OH reactivity (ROH) is calculated as in Eq. (2):
where kpyr+OH is the rate coefficient for the reaction of pyrrole with OH radicals (1.28 × 10⁻¹⁰ ; Dillon et al., 2012), and C1, C2, and C3 represent pyrrole concentrations at the corresponding steps described above, respectively.
In C2 and C3 mode, OH radicals are produced by the photolysis of water vapor at atmospheric pressure as shown in Reaction (R1). The generated H radicals from Reaction (R1) react with O2 of zero air or ambient air to generate HO2 radicals, as shown in Reaction (R2). When NO is present in the sampled ambient air, it can recycle OH by reacting with HO2 (Reaction R3).
An underlying assumption of the CRM is that the influence of the species in ambient air on the production of OH radicals in the reactor is ignorable. The theoretical OH mixing ratio in the original CRM reactor is about 5–20 ppbv, which depends on the introduced pyrrole concentration to ensure the ratio is 2:1–3:1. However, the additional OH radicals produced via Reaction (R3) can react with pyrrole to cause an additional decrease in pyrrole relative to C2 mode, thus leading to the underestimation of OH reactivity.
2.2 The improved CRM reactor
In order to remove the interference from the reaction of HO2 radicals with NO as discussed above, we modified the pipe structure of the original CRM reactor (Fig. 1c). We kept the length and volume of the glass reactor of the ICRM system similar to the original CRM system but added a branch inlet G ( in. o.d. glass; length 3 cm) in arm A to introduce a stream of NO standard (Air Liquide; stated uncertainty 3 %; 10.8 ppmv) mixed with zero air at a constant flow of 120 mL min−1. The typical flow rate inside the ICRM reactor is approximately 660 mL min−1. The flow rate of nitrogen (Air Liquide; 99.9995 % purity) through arm B is 250 mL min−1. The input pyrrole (Linde Spectra Environment Gases; stated uncertainty 5 %; 5.37 ppm) flow rate is 2.5 mL min−1. The total flow rate of pyrrole and zero air (Air Liquide; 99.9995 % purity) through arm C is 290 mL min−1. With this modified structure of arm A, the HO2 radicals, which are produced by the reaction of the generated H radicals near the mercury lamp and O2 in introduced zero air, were converted to OH radicals by reacting with NO downstream of arm G. The interference induced by Reaction (R3) can then be eliminated.
Arm A consists of one in. o.d. (i.d.: 0.62 cm, length: 7 cm) glass tube and one in. o.d. (i.d.: 0.32 cm, length: 5 cm) glass tube. The longer arm A is beneficial for a longer reaction time of HO2 with NO but with lower OH concentrations passing into the reactor due to wall loss. We chose an appropriate length of arm A (12 cm) to ensure an appropriate OH concentration (4 ppbv) and reaction time of HO2 with NO (∼ 0.1 s). The purpose of the two-section structure is to ensure that the UV light is mostly confined within a in. o.d. glass tube of arm A as the diameter of arm A goes from wide to slender. The new structure of arm A leads to lower OH concentrations (decreased by approximately 50 %) passing into reactor compared with the original CRM system due to wall loss, but OH radicals produced from the reaction of HO2 radicals with NO can partially compensate for this loss.
2.3 The detection of pyrrole by PTR-MS
The accuracy of pyrrole measurement is critical in determining OH reactivity for the CRM. Here we used PTR-MS to detect the pyrrole concentration. With a proton affinity greater than water (pyrrole: 209.2 kcal mol−1; water: 165.2 kcal mol−1) (Sinha et al., 2008), pyrrole is chemically ionized by proton transfer with H3O+ ions, and the product ions are detected using a quadrupole mass spectrometer. As highlighted by Sinha et al. (2009), the sensitivity of PTR-MS instruments to pyrrole is dependent on humidity, and the pyrrole signal must be carefully calibrated for relative humidity changes within the CRM reactor. The approach described by de Gouw and Warneke (2007) was employed in this study to account for the effect of the ion source and humidity on the sensitivity of the PTR-MS to pyrrole (de Gouw and Warneke, 2007). This approach involves normalization of the pyrrole signal to a sum of reagent ion signals (H3O+ + XR ⋅ H3O+(H2O)) that leads to a normalized signal for pyrrole that is independent of humidity. XR, a scaling factor for the H3O+(H2O) signal, is determined experimentally by measuring the pyrrole signal from a standard mixture under different humidity conditions. In this study, a relatively higher electric field parameter of the drift tube (i.e., ) value of 153 Td was used to measure pyrrole, which can minimize the humidity effect from water clusters in the PTR-MS instrument. As shown in the Supplement, the best estimate for the XR parameter was determined to be zero (Fig. S1 in the Supplement), indicating the negligible role of H3O+ ⋅ H2O in pyrrole detection by a PTR-MS in this study.
2.4 Other instruments of the ambient measurement campaign
In order to test and validate the ICRM system for OH reactivity measurements under high-NO conditions, we conducted field measurements of OH reactivity at a receptor site in the Pearl River Delta (PRD) region of China (Yang et al., 2017; Tan et al., 2019). Meanwhile, non-methane hydrocarbons (NMHCs) and oxygenated volatile organic compounds (OVOCs) were also measured by an online gas chromatograph mass spectrometer couple with a flame ionization detector (GC-MS/FID) (Wang et al., 2014a) and a proton transfer reaction time-of-flight mass spectrometer (PTR-TOF-MS) (Yuan et al., 2017), respectively (Table S1 in the Supplement). Inorganic trace gases, including CO, NO2, NO, SO2, and O3, were measured by a Thermo Fisher 48i CO analyzer, a 2B Technologies model 405nm NOx analyzer, a Thermo Fisher 42i NOx analyzer, a Thermo Fisher 43i SO2 analyzer, and a Thermo Fisher 49i O3 analyzer, respectively. Detailed descriptions of these instruments can be found in previous studies (Wang et al., 2014b; Birks et al., 2018).
2.5 Zero-dimensional box model
To test our understanding of the chemical processes occurring inside the ICRM reactor, results from laboratory experiments were compared with simulations from a zero-dimensional (0-D) box model. The MCM v3.3.1 (Wolfe et al., 2016) was used as a chemical mechanism in the box model. The use of a detailed mechanism aims at better representing the chemistry of peroxy radicals. In the box model, the initial concentrations of OH, HO2, pyrrole, VOCs, CO, and NO were supplied, and the time-dependent variations of different compounds in the reactor were simulated. The initial concentrations of OH (4 ppbv), HO2 (4 ppbv), and pyrrole (21 ppbv) were determined based on results from our experiments. The residence time in the reactor was about 11 s according to the volume of the reactor (120 cm3) and the flow of introduced gases (660 mL min−1). An MCM subset was extracted for inorganic reactions and reactions for propane, propene, and toluene. C3H5O2 was used as a surrogate for the peroxy radicals from pyrrole, as the degradation of pyrrole is not included in the MCM.
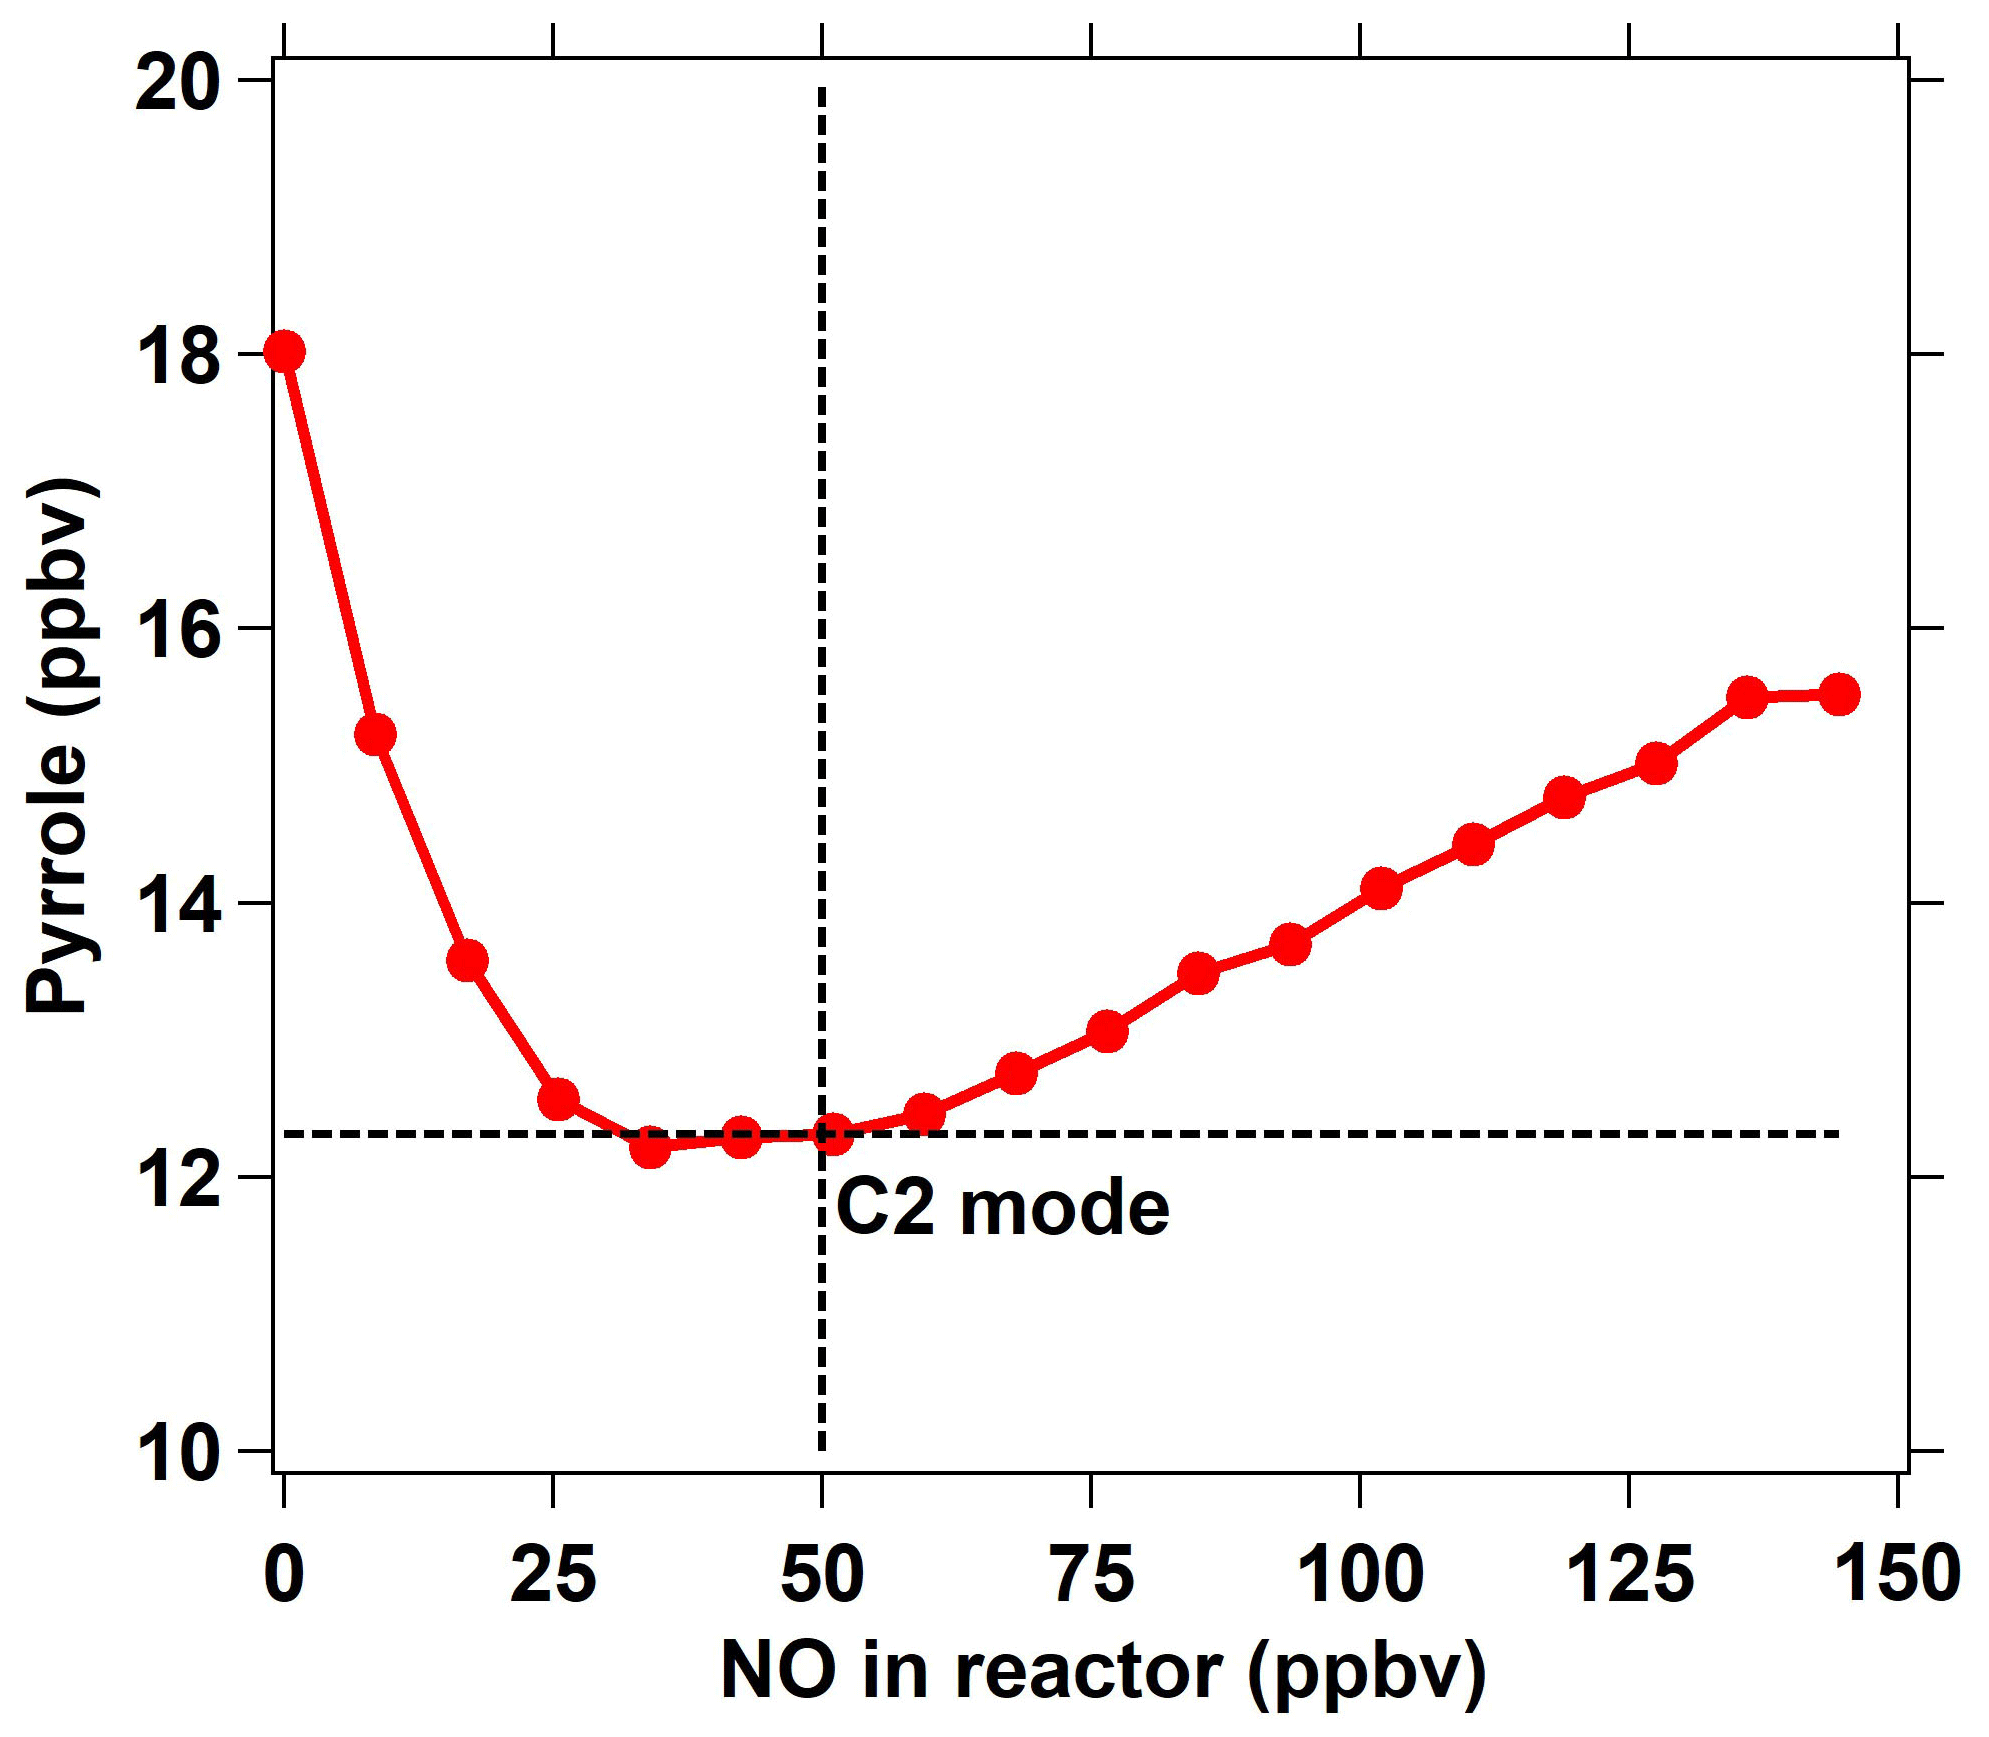
Figure 2The response of the pyrrole concentration to different NO concentrations introduced through arm G into the reactor. For the ICRM system, the C2 mode corresponds to a pyrrole concentration of 12.31 ppbv at NO = 50 ppbv, at which the HO2 radicals were constantly removed.
3.1 Determination of the amount of NO addition
In addition to HO2 produced from the reaction of H radicals with O2, RO2 produced from the reaction of pyrrole with OH also reacts with NO to recycle HO2 and OH (Reactions R4–R6) and consume pyrrole. In order to eliminate the effect of HO2 and RO2 radicals, an NO supply with an appropriate concentration through arm G is needed. We optimized the NO concentration by testing the dependence of the change in the pyrrole concentrations on the concentration of NO introduced through arm G (as described below and in Fig. 2). Figure 1d shows three work modes of the ICRM. During the experiment, the pyrrole concentration in the C1 mode (for which N2 and zero air were humidified and the mercury lamp was turned off) was 22 ppbv, which decreased to 18 ppbv when the mercury lamp was turned on at 0 ppbv of NO, implying that the generated OH radicals depleted ∼4 ppbv of pyrrole. We varied the NO concentrations mixed with the zero air entering arm G, which resulted in NO concentrations in the reactor ranging from 0 to 150 ppbv, and found the appropriate NO level to consume all HO2 and RO2 produced in the glass reactor. NO was mixed with zero air rather than nitrogen, as oxygen in zero air can transform H radicals in arm A into HO2 radicals. The pyrrole concentration decreases with the increase in NO concentrations, reaching a minimum when the NO concentration is ca. 40–50 ppbv, and is increased again when the NO concentration exceeds 50 ppbv.
Here, RH represents pyrrole in the reactor or ambient VOCs introduced into the reactor.
The NO addition experiments are simulated in the box model. The simulated pyrrole concentrations as a function of the NO concentration are consistent with laboratory experiments, with pyrrole concentrations decreasing at first and then increasing (Fig. S2). When NO is not present in the reactor, the self-reactions of peroxy radicals (HO2 + HO2, HO2 + RO2) dominate the sink of HO2 and RO2 (Fig. S3). As NO is introduced into the reactor, the reaction of NO with HO2 or RO2 competes with the self-reactions of peroxy radicals. With more NO introduced, the produced OH radicals from the reaction of HO2 with NO increase, leading to a decrease in the pyrrole concentration (Fig. S3). As the NO concentration exceeds 50 ppbv, pyrrole concentrations increase again due to large amounts of excess NO competing with pyrrole for reaction with OH radicals. The remaining NO concentration outflowing from the reactor increases with the introduced NO concentrations (Fig. S2), indicating that excessive NO is needed to compete with the self-reactions of peroxy radicals. Based on laboratory measurements, the remaining NO concentration outflowing from the reactor is ∼ 18 ppbv when the introduced NO concentration is 50 ppbv. The laboratory measurements and simulated results both suggest that 40 ∼ 50 ppbv is the lowest NO concentration needed to transform HO2 and RO2 into OH to the largest extent. The higher introduced NO concentration had a negligible effect on the increase in OH production from HO2 and RO2. Thus, we introduced a 50 ppbv NO concentration into the ICRM reactor in the experiments in this study. Under this optimized condition, the pyrrole concentration decreased to 12.3 ppbv, indicating that the total OH radical concentration including production from the UV lamp and from the reaction of HO2 with NO is about 10 ppbv in the ICRM system. The concentration of pyrrole in this scenario is regarded as the C2 mode for the ICRM system. It worth noting that the determined NO concentration can vary slightly as OH generation performance changes (e.g., humidity change in the region of the pen-ray mercury lamp).
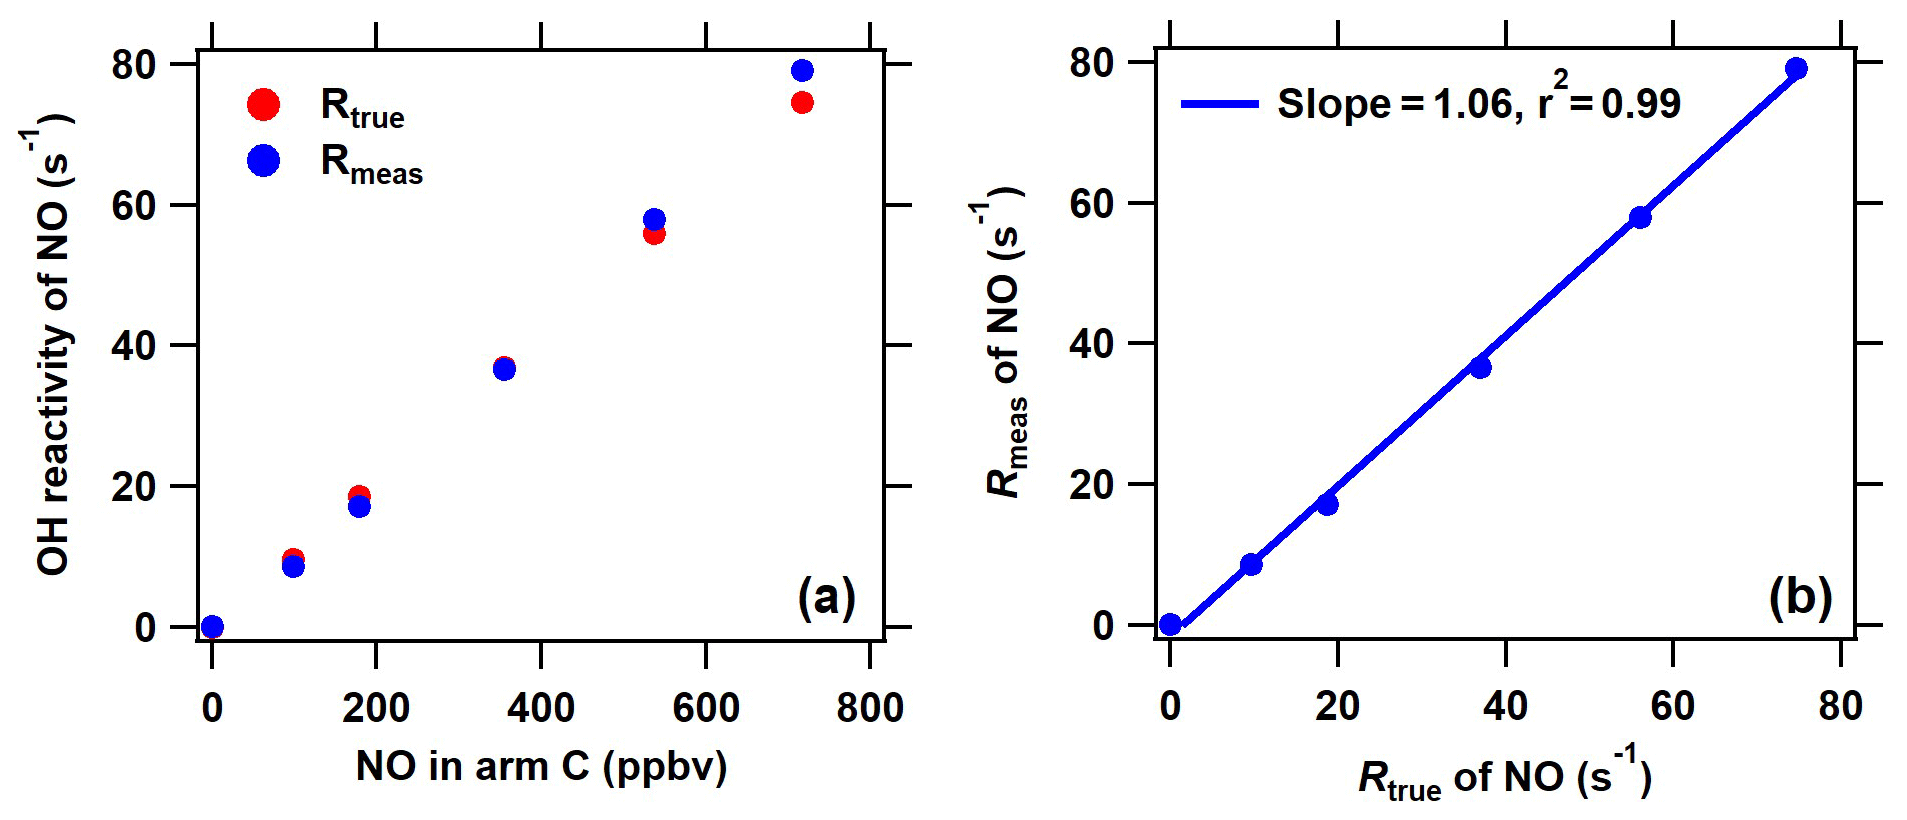
Figure 3Comparison of the measured and true OH reactivity of NO at different NO concentrations introduced through arm C. The measured OH reactivity of NO was calculated based on the new C2 mode shown in Fig. 2 in the ICRM system.
Under the determined optimal NO level through arm G, it is necessary to ensure that the OH production from HO2 and pyrrole-induced RO2 will not manifest itself when ambient NO is introduced through arm C. For this purpose, we compared the measured and true OH reactivity of NO by passing a series of NO concentrations (0–700 ppbv) mixed with zero air through arm C into the reactor (Fig. 3). In this test, no other reactive gases were introduced into the system except NO. The measured OH reactivity of NO ( according to an IUPAC evaluation in November 2017) agreed well with the corresponding true values, indicating that HO2 radicals were fully consumed and that pyrrole peroxy radicals were effectively converted to carbonyls and nitrates by NO introduced through arm G.
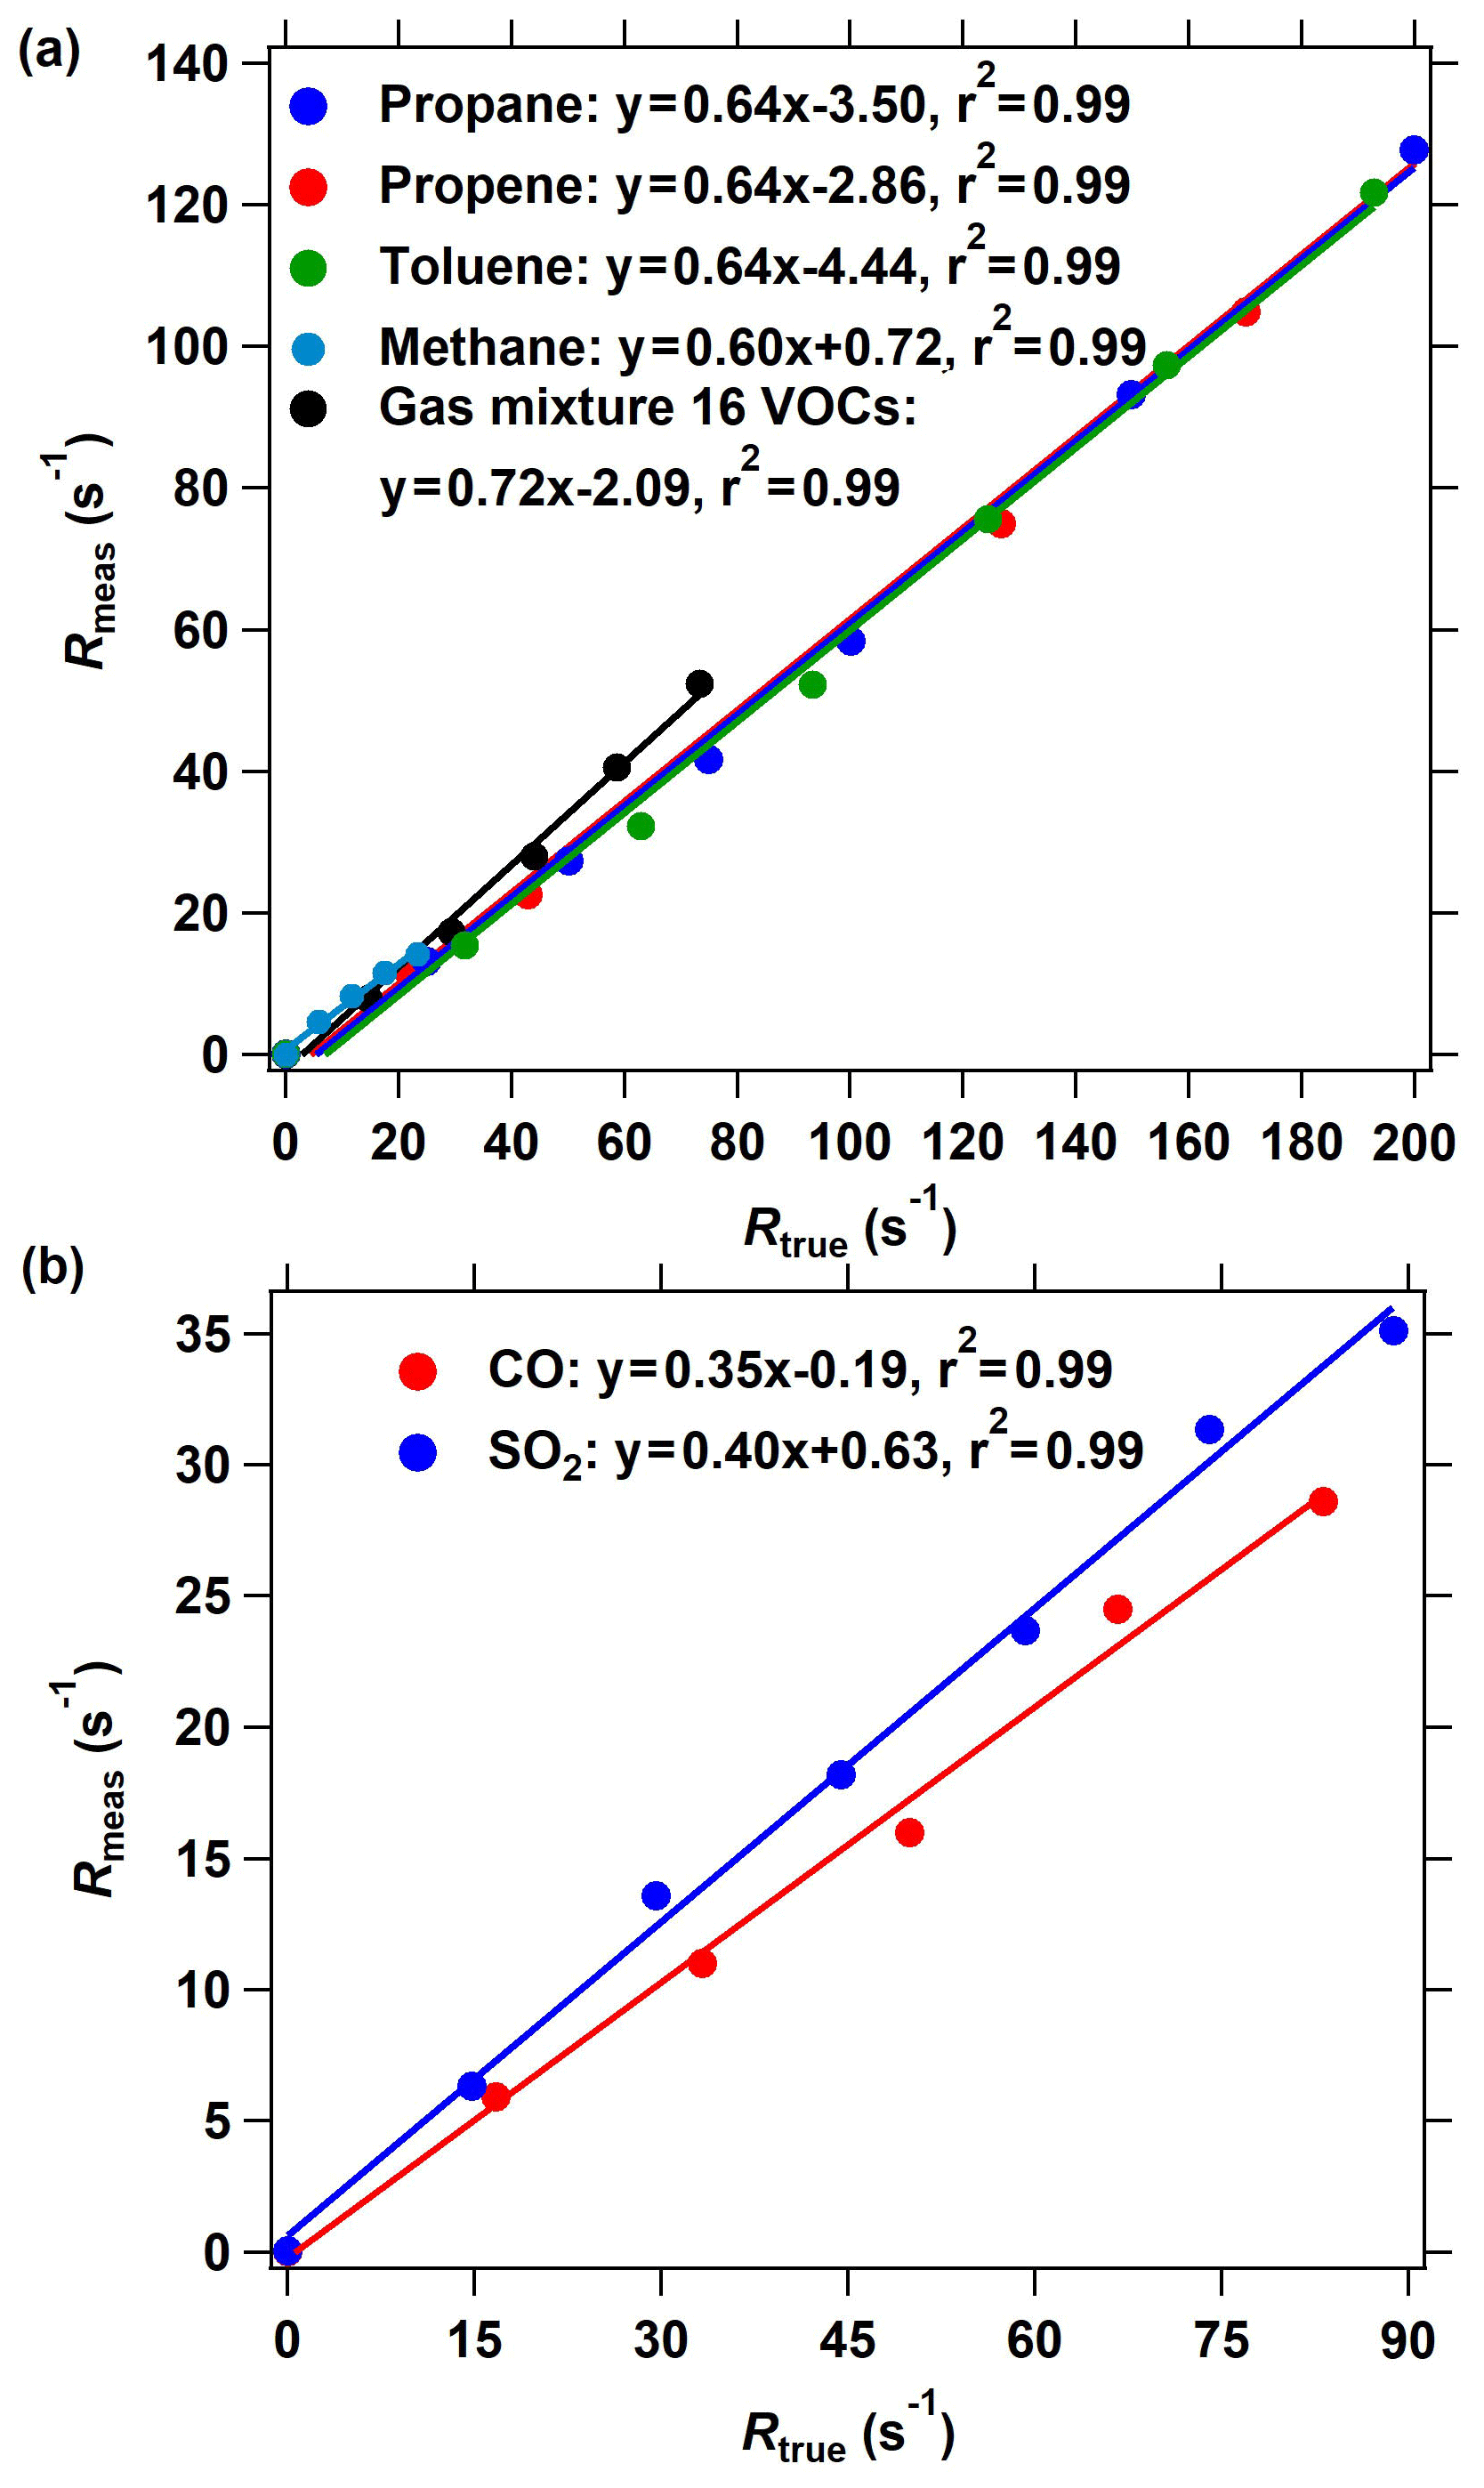
Figure 4The OH reactivity calibration of the improved CRM system using different standard gases. (a) The calibrating results of organic species including methane, propane, propene, toluene, and a mixture of 16 VOC species through arm C. (b) The calibrating results of inorganic species including CO and SO2. The measured OH reactivity was calculated based on the C2 mode shown in Fig. 2 in the ICRM system.
3.2 Calibration for OH reactivity of VOCs
Several reactive VOC species were used to validate and calibrate the ICRM system; these are methane, propane, propene, toluene, and mixed gases including 16 VOC species (acetaldehyde, methanol, ethanol, isoprene, acetone, acetonitrile, methyl vinyl ketone, methyl ethyl ketone, benzene, toluene, o-xylene, α-pinene, 1,2,4-trimethylbenzene, phenol, m-cresol, naphthalene). These VOC species were introduced into the system through arm C at various reactivities (0–200 s−1). Figure 4a presents the plots of the measured (Rmeas, s−1) vs. true OH reactivity (Rtrue, s−1) of these species. Rmeas is lower than Rtrue for almost all species, with the slopes of linear fittings ranging from 0.60 to 0.72. The slopes of methane, propane, propene, toluene, and mixed gases are 0.60, 0.64, 0.64, 0.64, and 0.72, respectively. The OH reactivity calibration of SO2 and CO indicates that the linear fitting slope of Rmeas vs. Rtrue is 0.35 and 0.40, respectively (Fig. 4b), which is lower than that of VOCs. It is worth mentioning that the intercept of the line in Fig. 4 is not zero, which indicates that at low OH reactivity the ICRM lacks sensitivity.
Equation (2) is valid only under nearly pseudo-first-order conditions (i.e., when [pyrrole] ≫ [OH]). In this study, the [pyrrole] to [OH] ratio is set at 2.5, which will cause significant systematic errors. We plot the calculated reactivity, obtained by applying Eq. (2) to the numerical simulations of the pyrrole concentration (C2 and C3) at [pyrrole] [OH] = 2.5 after OH had reacted to zero, vs. the true reactivity. The correction curve indicates that the calculated reactivity underestimates the true reactivity by about 5 %. After considering this interference, the slope of calibration shown in Fig. 4a and b decreased to 0.57 ∼ 0.68 for VOCs, 0.38 for SO2, and 0.33 for CO. Therefore, the deviation of pseudo-first-order conditions cannot explain the calibrated slopes for VOCs, CO, and SO2 being lower than 1.
The calibrated slopes for VOCs that are lower than 1 can be related to the secondary chemistry of VOC-generated RO2 radicals with NO. When more VOCs are introduced into the reactor, additional RO2 radicals produced from the reaction of VOCs with OH will react with excessive NO in the reactor, thus increasing the recycled OH (Reactions R4–R6). The recycled OH from RO2 will deplete pyrrole, thus leading to an Rmeas lower than the Rtrue. We deduce that this is the reason for the linear fitting slopes in Fig. 4 being lower than 1. For specific VOC species, the decrease in the pyrrole concentration due to recycling OH depends on the true OH reactivity of VOCs, NO concentrations, and the efficiency of organic nitrate production (RO2 + NO → RONO2) in this system. The consistency in the linear fitting slopes of different VOC species indicates that the RO2 + NO reactions for the investigated VOCs are similar. This is in agreement with the simulated results (Fig. S4). Similarly, the produced HO2 from the reactions of CO and SO2 with OH will end up recycling OH in excess-NO environments and thus reduce the fitting slopes. The lower fitting slope of SO2 and CO than that of VOCs is because SO2 and CO react with OH to produce HO2, which has higher efficiency to produce OH by reacting with NO than RO2 that goes through two steps (RO2 → HO2 and HO2 → OH). Here, we define the linear fitting slopes in Fig. 4 as correction coefficients with regard to the calibration for the OH reactivity of VOCs, CO, and SO2 (characterized by αVOC, αCO, and ) at ambient NO = 0 ppbv.
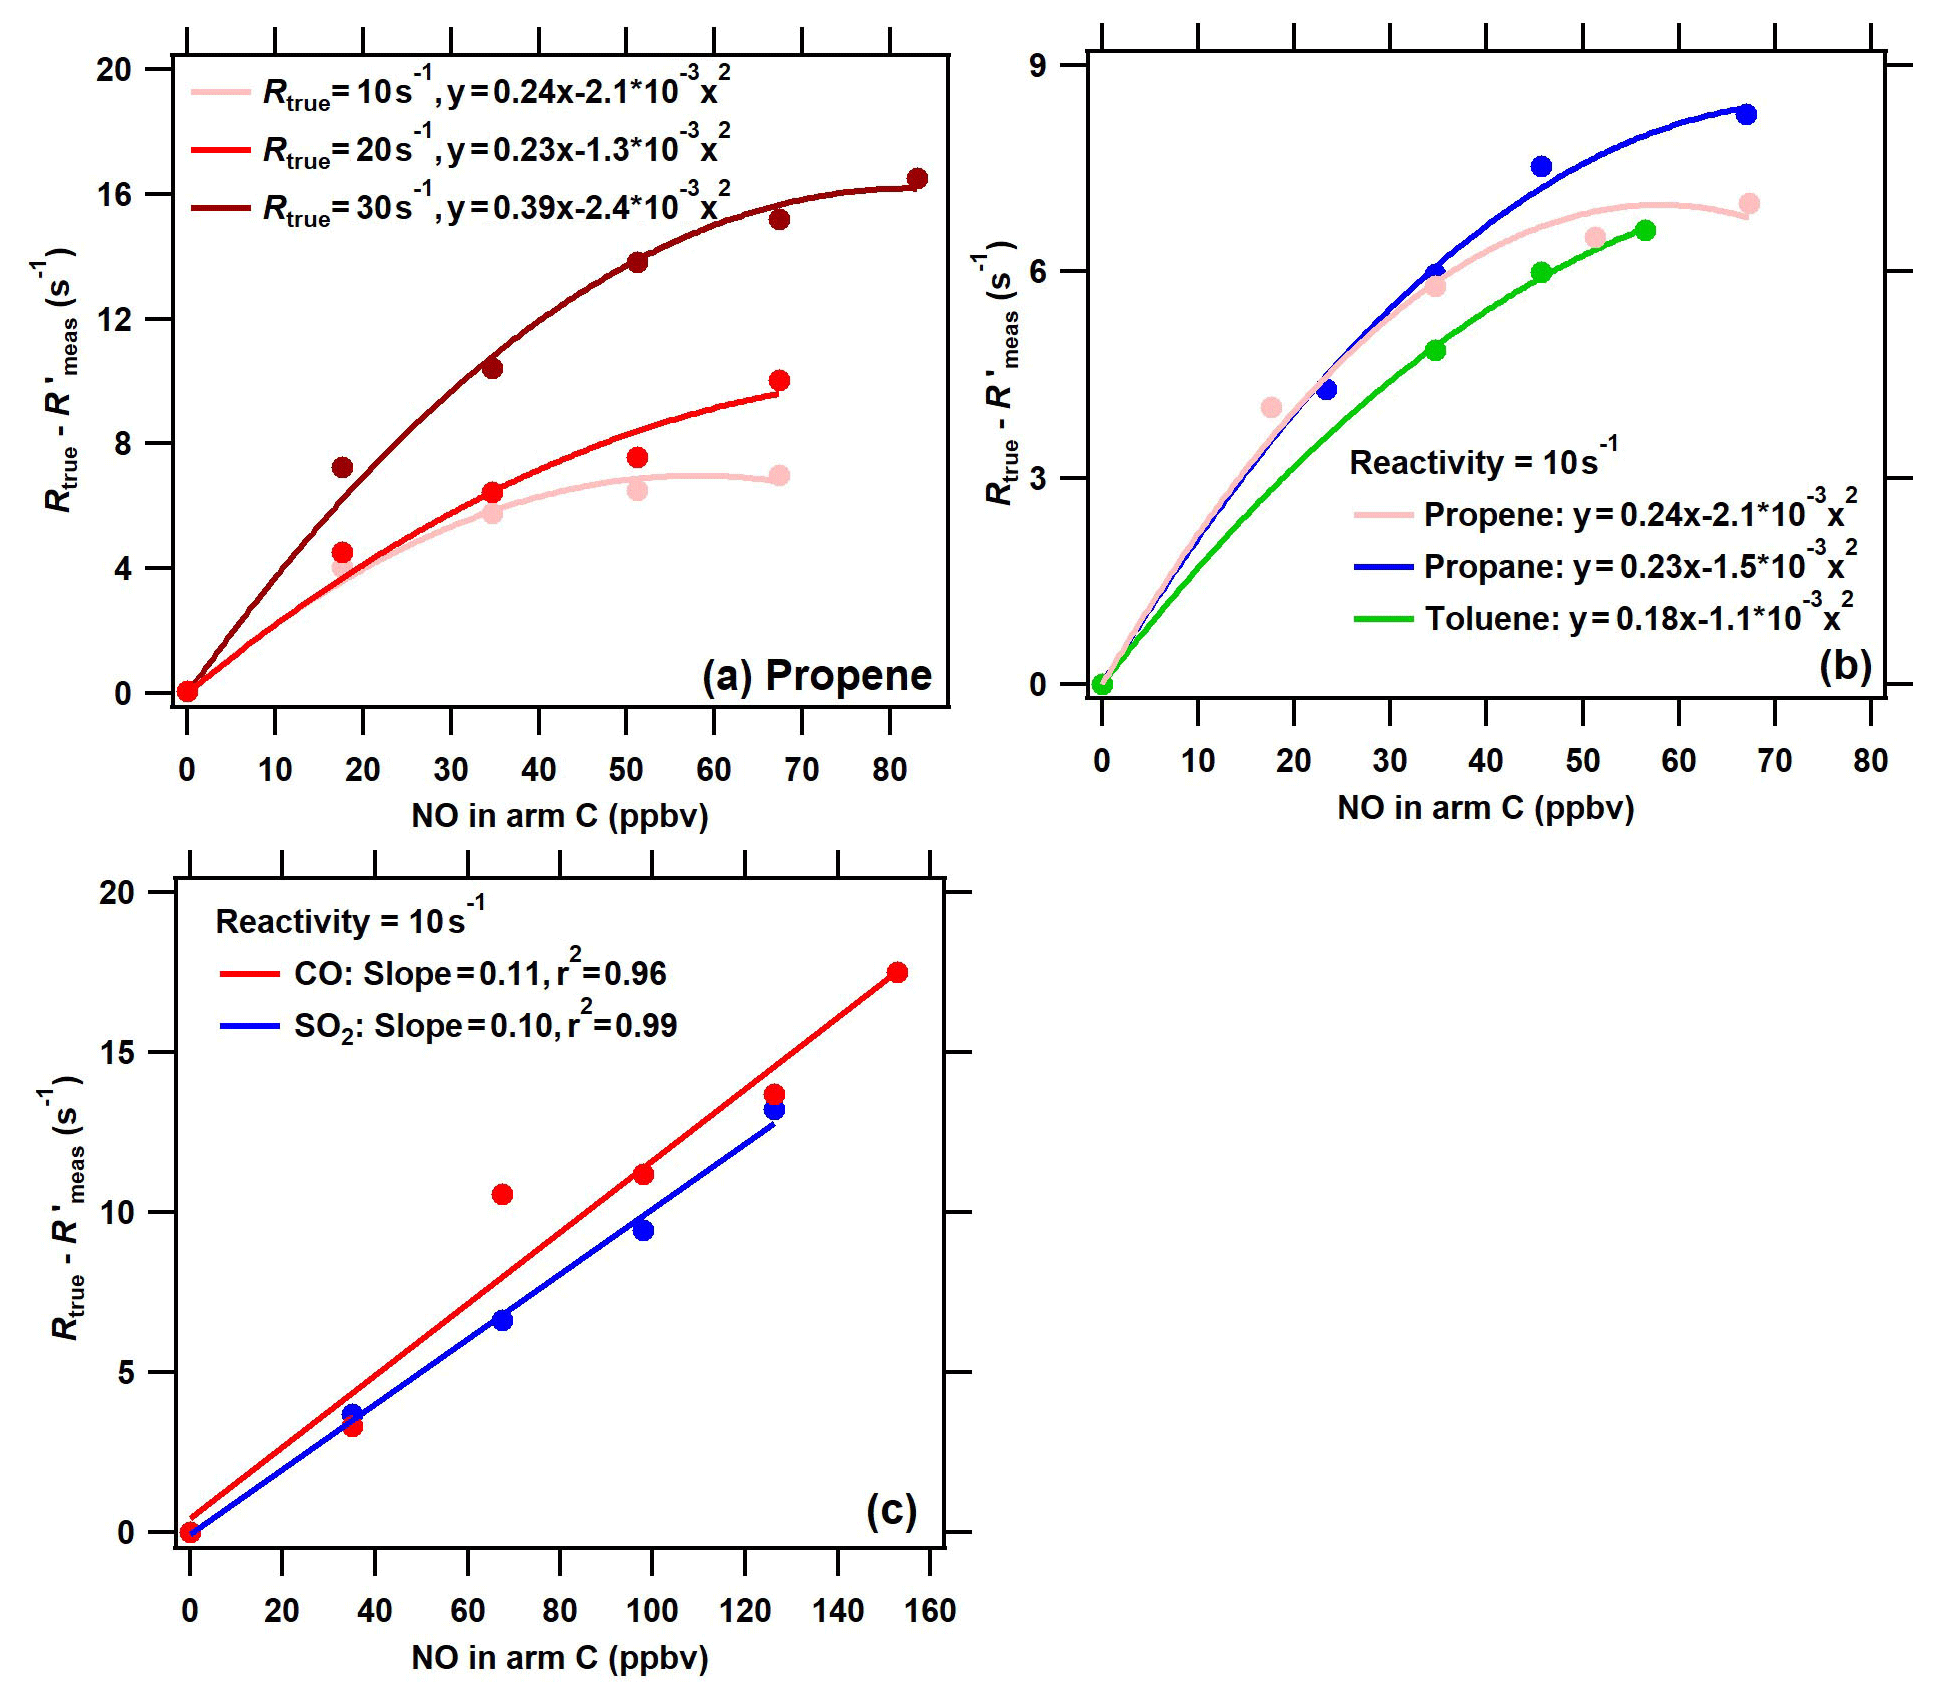
Figure 5The difference between the true OH reactivity (Rtrue) and the corrected measured OH reactivity () using the calibration factor α1 ( = () as a function of NO concentrations in arm C in conditions of (a) different levels of VOC reactivity for the same species (propylene), (b) different VOC species for the same OH reactivity level (10 s−1), and (c) different inorganic species (red: CO; blue: SO2) for the same OH reactivity level (10 s−1). Note that NO, CO, SO2, and VOCs were introduced into the reactor through arm C.
To further evaluate the performance of the ICRM system with elevated NOx concentrations in ambient air, a series of NO concentrations were introduced into the reactor through arm C both with constant reactivity from different VOC species and with different reactivities provided by the same species. Of all experimental conditions, the (the is defined as the corrected Rmeas by the correction coefficient αVOC) was observed to decrease with an increased NO concentration, and thus the difference between Rtrue and (Rtrue − ) increases with increased NO concentrations for the four VOC standard gases (Fig. 5a and b). This is because the reaction rate of RO2 with NO increases with NO concentrations, leading to enhancement of the recycled OH. Similar to previous studies (Michoud et al., 2015; Praplan et al., 2017b; Yang et al., 2017), the difference between Rtrue and (Rtrue − ) increases with NO concentrations for different VOC species and different reactivity levels. The difference between Rtrue and (Rtrue − ) also increases with NO concentrations for CO and SO2, with slopes of 0.11 and 0.10, respectively (the is defined as the corrected Rmeas by the correction coefficients αCO and ) (Fig. 5c). However, the difference in NO effects between VOCs and CO (and SO2), as shown in Figs. 4 and 5, has not been reported in previous studies about the CRM system.
Previous studies have reported that NO had a large effect on the difference between Rtrue and Rmeas in CRM systems (note that the Rmeas is not corrected in previous studies) (Hansen et al., 2015; Michoud et al., 2015; Yang et al., 2017). This NO effect is not only due to the reaction of HO2 with NO, but also due to the reaction of pyrrole-produced and VOC-produced RO2 with NO. Figure S5 compares the effect of NO on (Rtrue−Rmeas) in the original CRM system (reported by previous studies) with that in the ICRM system (this study). Far larger NO effects were reported in the original CRM system than in the ICRM system. For example, the presence of ambient NO at 50 ppbv leads to Rmeas lower than the Rtrue by 70–232 s−1; this is at least an order of magnitude higher than the NO artifact in the ICRM system, which leads to lower than the Rtrue by 8.8 s−1. This is because both HO2 and pyrrole-induced RO2 are fully removed by the introduced NO in advance in the ICRM system, and thus the remaining influencing factor is the reaction of ambient VOC-induced RO2 with NO. The uncertainty due to the NO-artifact correction in the ICRM system was predicted to be far lower than that of the original CRM system, as the absolute change in OH reactivity caused by NO is reduced by removing HO2 and pyrrole-induced RO2. Despite the ICRM system not being able to remove the NO effect entirely, it does lead to a significant decrease in the uncertainty of the NO-artifact correction.
Due to the different behaviors of VOCs, SO2 and CO in high-NO conditions, in order to get accurate OH reactivity, it is necessary to conduct an NO correction for VOCs, SO2, and CO individually. Note that this issue may also be present in the original CRM system, but it was ignored in previous studies. For the ICRM system, we use the following formula to determine the true OH reactivity of VOCs.
Here, Rmeas is the measured OH reactivity by the ICRM system as defined above. The Rtrue VOC is the true OH reactivity of VOCs. was calculated from measured concentrations of species i (i = NO, NO2, O3, SO2, and CO) multiplied by the rate coefficient of the reaction of species i with OH. The Rmeas and Rtrue of NOx (= NO + NO2) was close to 1:1 as shown in Figs. 3 and S6. αCO, , and αVOC are the correction coefficients with regard to the calibration for the OH reactivity of CO, SO2, and VOCs at ambient NO = 0 ppbv, respectively. Note that the αVOC is the mean slope of Fig. 4a. f1 and f2 are the correction coefficients with regard to the effect of ambient NO on (Rtrue − ). Note that the f1 is the mean value in Fig. 5c, and the f2 is the fitting result in both Fig. 5a and b (f1=0.105; , as shown in Fig. S5). After getting Rtrue VOC, the total OH reactivity (Rtot) was then calculated as the summation of Rtrue VOC, , , , and Rtrue CO:
In this study, we calibrated four individual representative VOC species (methane, propane, propene, toluene). In addition, we also calibrated the mixed standard gases with 16 VOC species including representative oxygenated VOCs (acetaldehyde, methanol, ethanol, acetone, acetonitrile, methyl vinyl ketone, methyl ethyl ketone), biogenic VOCs (isoprene, α-pinene), and typical aromatics (benzene, toluene, o-xylene, 1,2,4-trimethylbenzene, naphthalene, phenol, m-cresol). The calibration slope is close to those of the four individual VOC species, indicating that the RO2 + NO reactions for these investigated VOCs should be similar. Nevertheless, given that there are different VOC compositions in different environments such as forests, urban areas, and emission sources, calibrations for more individual VOC species might also be needed.
3.3 Additional potential interference related to NO addition
In order to assess the extent of any additional interferences due to NO addition, we further consider the following effects.
In arm A, the photolysis of O2 introduced through arm G by the mercury lamp produces O3. The NO introduced through arm G reacts with HO2 to generate NO2, which can also photolyze to generate NO, oxygen atoms, and subsequently O3. We monitored the O3 concentration through arm F using an O3 monitor. The O3 concentration flowing out of arm F was less than 5 ppbv, which has a negligible influence on the pyrrole concentrations and the Rmeas, considering that the pyrrole + O3 reaction rate constant of = 1.57 × 10⁻¹⁷ (Atkinson et al., 1984) is several orders of magnitude slower than the pyrrole + OH reaction rate constant (kpyrrole+OH = 1.28 × 10⁻¹⁰ ). The ozone concentration was low, as excess NO was introduced into the reactor, and the remaining NO titrated O3 back to NO2.
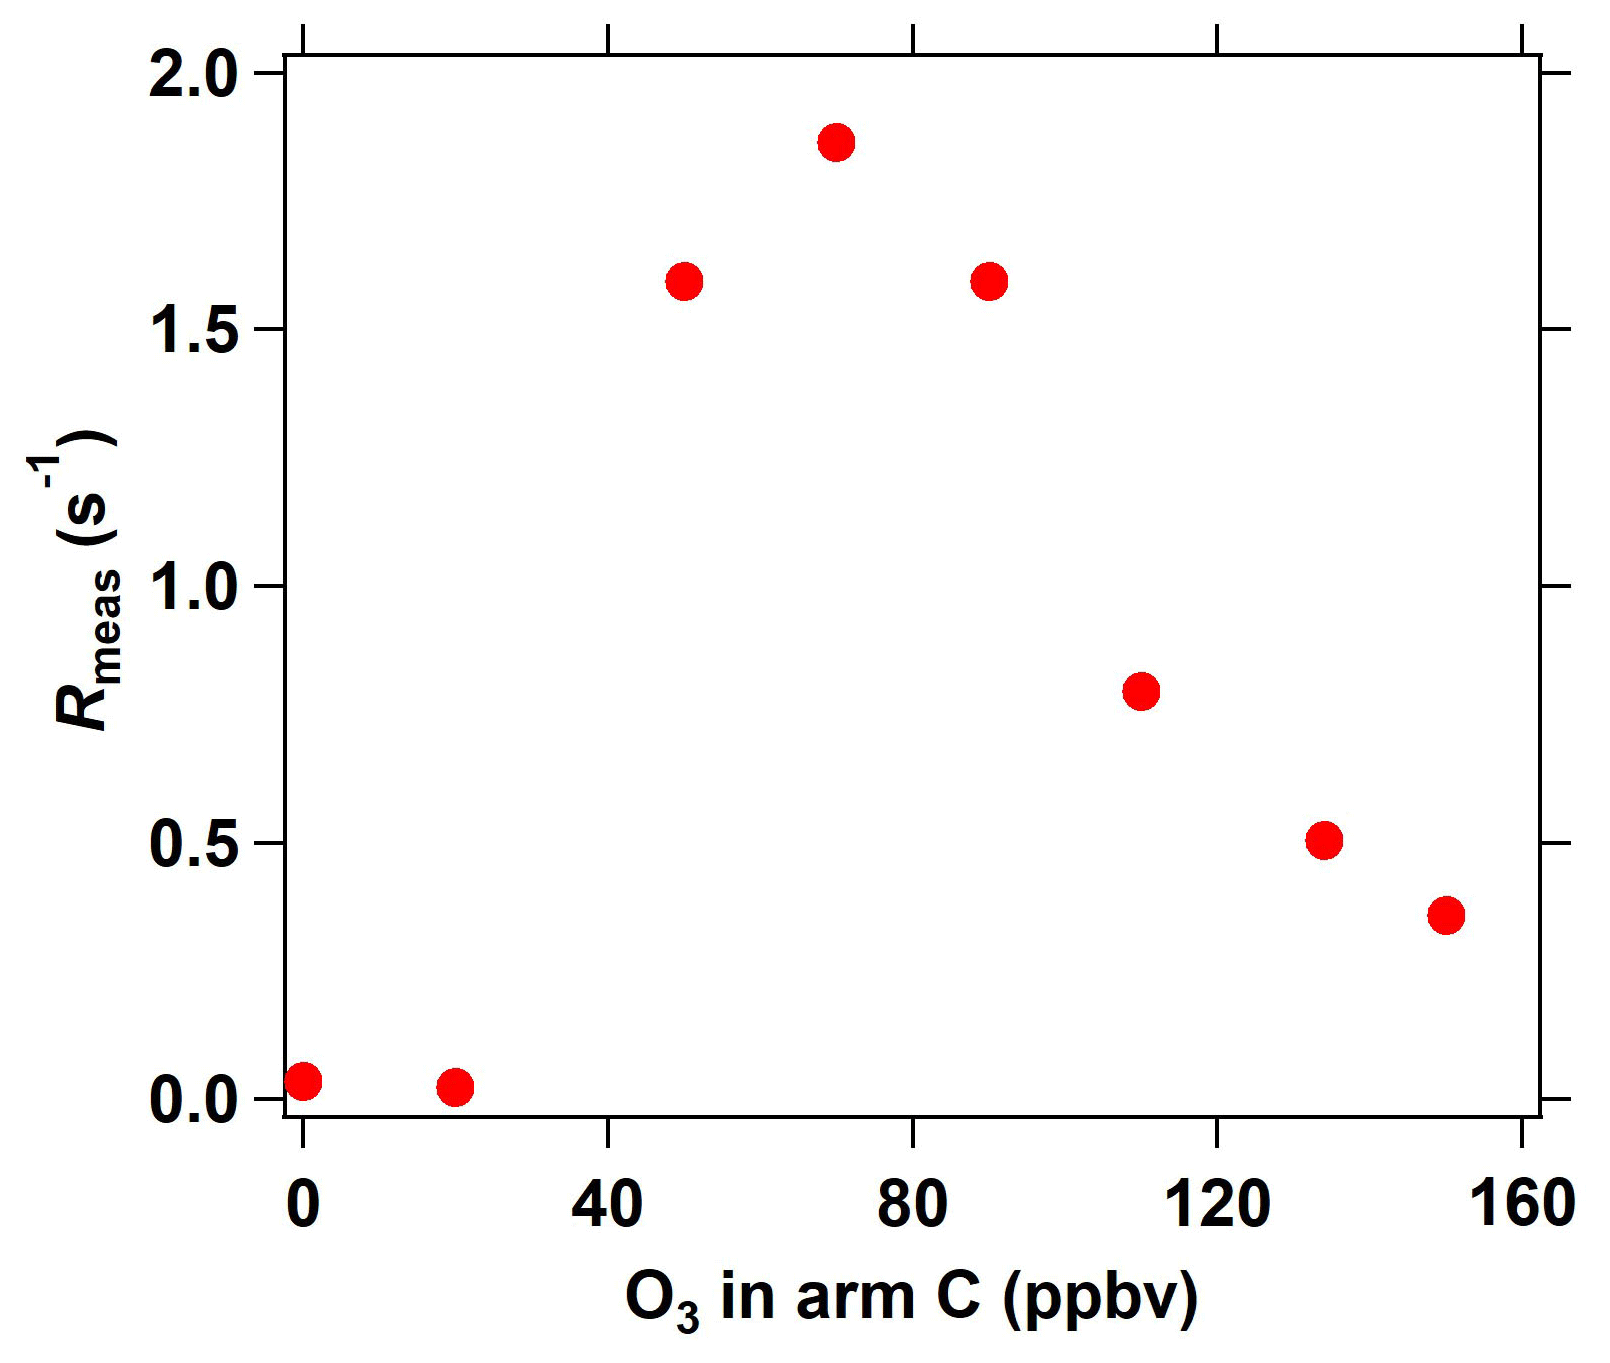
Figure 6Interference of different O3 concentrations (introduced into the reactor through arm C) on measured OH reactivity in the ICRM system.
In the C3 mode of the ICRM, sample ambient O3 can react with the high levels of NO in the reactor, which might interfere with Rmeas. We characterize this interference by introducing a series of O3 concentrations into the reactor through arm C. At O3 concentrations lower than 40 ppbv, O3 has a negligible effect on OH reactivity (Fig. 6). Interestingly, Rmeas first increases and then decreases with increasing O3 concentrations. The reaction rate coefficient of OH with NO2 is slightly higher than with NO, which are 1.2 × 10⁻¹¹ (Atkinson et al., 2004) and 9.7 × 10⁻¹² at 298 K, respectively. With the increase in the introduced O3 concentration, higher NO2 is produced, which causes an increase in Rmeas. As NO is consumed completely by O3, excessive O3 can further react with NO2 to produce NO3 radicals, which can deplete pyrrole (k = 1.80 × 10⁻¹⁰ ) (Cabanas et al., 2004) and lead to the decrease in Rmeas. Overall, OH reactivity exhibited little change (< 2 s−1) with the increase in O3 concentrations (0 ∼ 160 ppbv), indicating that the introduced O3 plays a negligible role in Rmeas. This is another advantage of the ICRM compared with the original CRM, which needs an ozone correction as the reaction of O3 with HO2 gives OH back (Fuchs et al., 2017).
According to the model simulation, the produced NO2 from the reaction of NO with HO2 increases with introduced NO concentrations (Fig. S2). The produced NO2 can deplete OH (OH + NO2 → HNO3) and thereby lead to an increase in the pyrrole concentration. When NO was introduced with a concentration of 50 ppbv, the produced NO2 was 25 ppbv, corresponding to 6.2 s−1 OH reactivity (Fig. S2). However, this process does not interfere with the Rmeas as the produced NO2 is the same in both C2 and C3 modes, leading to this effect canceling out in the two modes.
Finally, the reaction time between HO2 and NO should be noted. The initial HO2 concentration is about 4 ppbv. The lifetime of HO2 at 50 ppbv of NO is at the timescale of 0.1 s, given that the reaction rate constant of NO + HO2 is 8.1 × 10⁻¹² (Sander et al., 2006). The reaction time of NO + HO2 in arm A is estimated to be around ∼ 0.1 s, during which most HO2 will be consumed. Hence, there will be only a small fraction of HO2 entering the main body of the reactor.
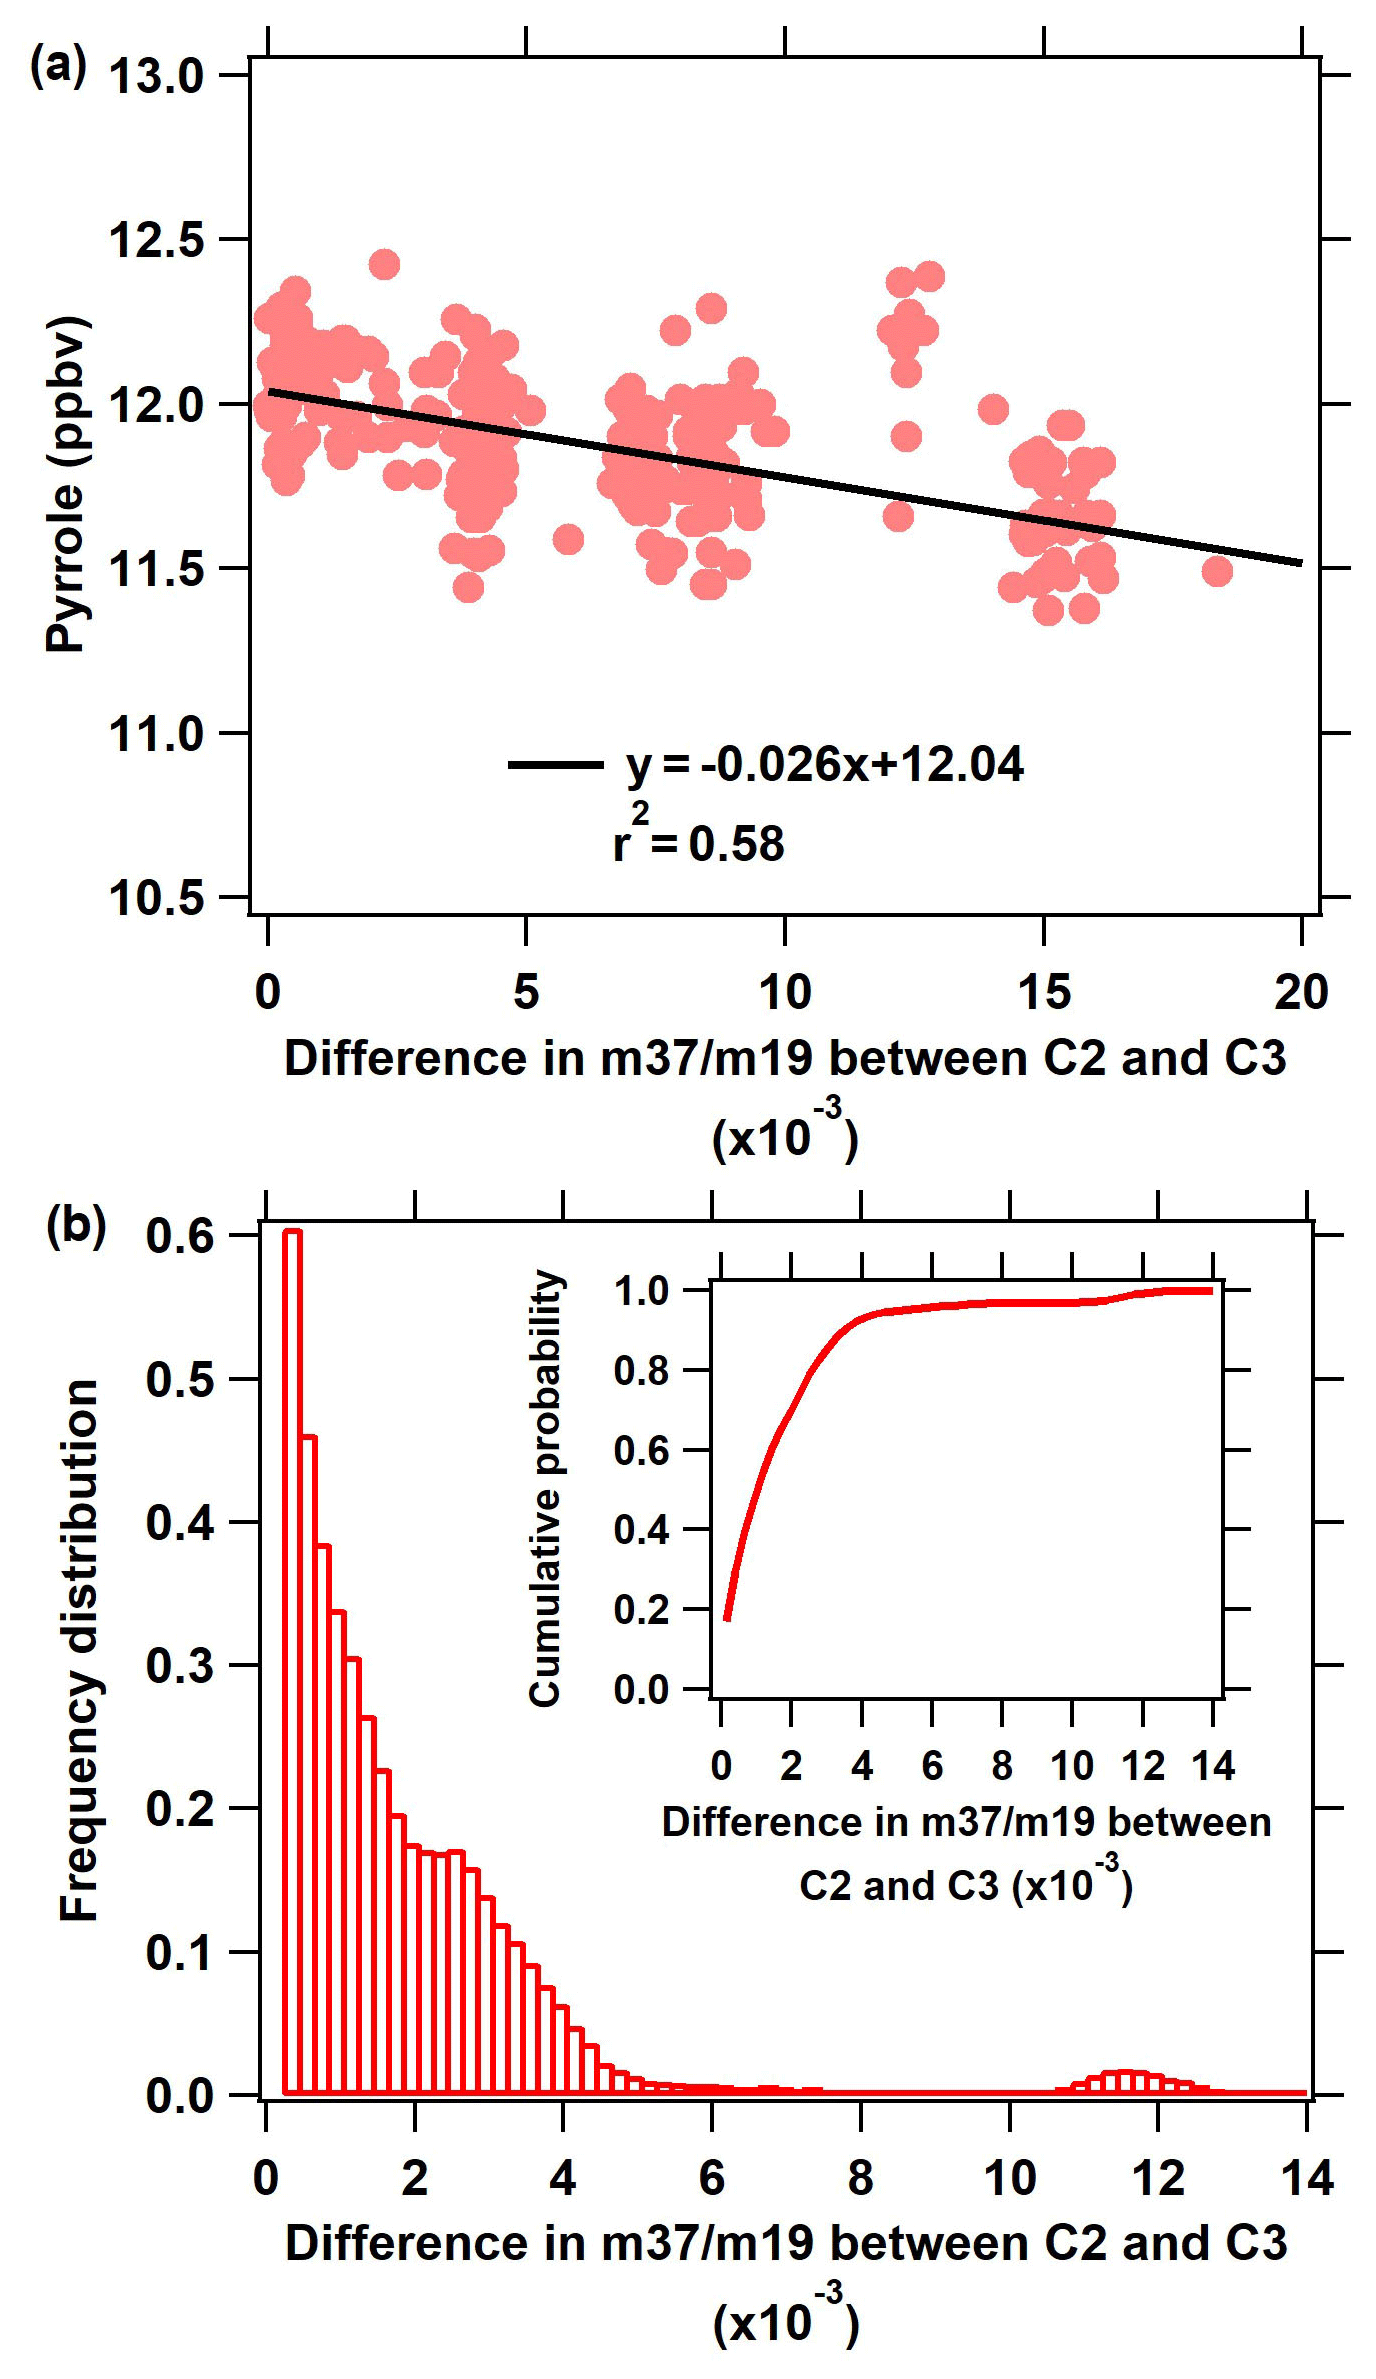
Figure 7(a) Pyrrole concentration during zero air measurements (C2) as a function of the difference in between the C2 and C3 humidity indicator (). (b) Frequency distribution of the difference in between C2 and C3 during the measurement.
3.4 Photolysis of pyrrole
Photolysis of pyrrole in the CRM introduces additional uncertainties and complexity in the determination of OH reactivity (Sinha et al., 2008; Hansen et al., 2015; Michoud et al., 2015; Zannoni et al., 2015). To investigate the effect of the ICRM system on the interference from photolysis, we turned the mercury lamp off and on to test the variation in pyrrole concentrations under dry conditions (no humidification). Compared with the condition in which the mercury lamp is turned off, pyrrole concentrations decreased by < 3 % after the mercury lamp was turned on (Fig. S7), which caused an Rmeas increase of 0.55 s−1 when the Rtrue was 20 s−1. This result indicates that the photolysis of pyrrole is weak enough to be negligible in the ICRM system. This smaller photolysis of pyrrole closely relates to the improved design of the reactor structure. Arm A consists of two sections of glass tubing with and in. o.d., respectively (Fig. 1c). UV light is mostly confined in a in. o.d. glass tube of arm A, as the glass tube is constructed with a decreasing diameter following the direction of gas flow. This reduces the amount of UV light getting into the main reaction part of the reactor. The improved structure of arm A leads to lower OH concentrations (decreased by approximately 50 %) passing into reactor due to wall loss, but the OH radicals produced from the reaction of HO2 radicals with NO can partially compensate for this loss. In comparison, the pen-ray mercury lamp was very close to the main body of the reactor in the original CRM reactor to maximize the OH entering the reactor by minimizing wall loss. However, this will lead to photolysis of pyrrole as high as 25 % (Sinha et al., 2008; Hansen et al., 2015). The change in the structure of arm A also ensures that the photolysis of H2O, HONO, NO2, and VOCs inside the ICRM reactor is weaker than that in the original CRM system. In this system, OH reacts with introduced NO or ambient NO to produce HONO, which can reproduce OH and NO by photolysis. As we have improved the structure of arm A to avoid UV light entering the main body of the reactor, photolysis of HONO is expected to be low. In addition to our design change, previous studies have reported that the photolysis of pyrrole can also be lowered to below 5 % by changing the UV mercury lamp position in the setup (Michoud et al., 2015; Zannoni et al., 2015).
In the original CRM system, C1 instead of C0 is used as the initial amount of pyrrole in order to avoid the interference of pyrrole photolysis. The C1 mode, for which dry N2 and zero air are used and the mercury lamp is turned on, was measured for a duration of 2 h every 12 h (Sinha et al., 2008; Hansen et al., 2015). This duration is necessary to reach the driest conditions possible to minimize residual OH in the reactor. It should be noted that this procedure can result in an underestimation of C1, as it is difficult to remove all trace amounts of water molecules from surfaces and in nitrogen and zero air flowing through the reactor, which is able to produce extra OH by photolysis (Hansen et al., 2015; Michoud et al., 2015; Zannoni et al., 2015). The underestimation of C1 will result in an overestimation of OH reactivity. The significantly lower photolysis of pyrrole for the ICRM system allows us to measure the C1 mode differently. Here, the condition that N2 and zero air are humidified while the mercury lamp is turned off is regarded as C1. The new C1 mode is able to avoid the interference resulting from OH radicals produced by photolysis of residual humidity since the mercury lamp is turned off and OH will not be produced. The C1 mode in ICRM is measured for a duration of 15 min every 12 h, which also saves time compared with the C1 mode in the original CRM.
3.5 Humidity difference between zero air and ambient air
The variation of humidity between the C2 (wet zero air) and C3 (ambient air) measurements could result in a change in the OH production rate in the CRM reactor, which in turn could lead to a C2 measurement not representative of the OH production rate observed during the C3 measurement (Sinha et al., 2008; Dolgorouky et al., 2012). Although the use of a catalytic converter or dynamic humidification of zero air can help to reduce differences in humidity between C2 and C3 modes, small differences still exist (Michoud et al., 2015). While catalytic converters can be used to generate zero air with the same humidity as ambient air, these converters cannot remove NOx species and are thus not suitable for OH reactivity measurements in urban and suburban areas with high-NOx conditions (Hansen et al., 2015).
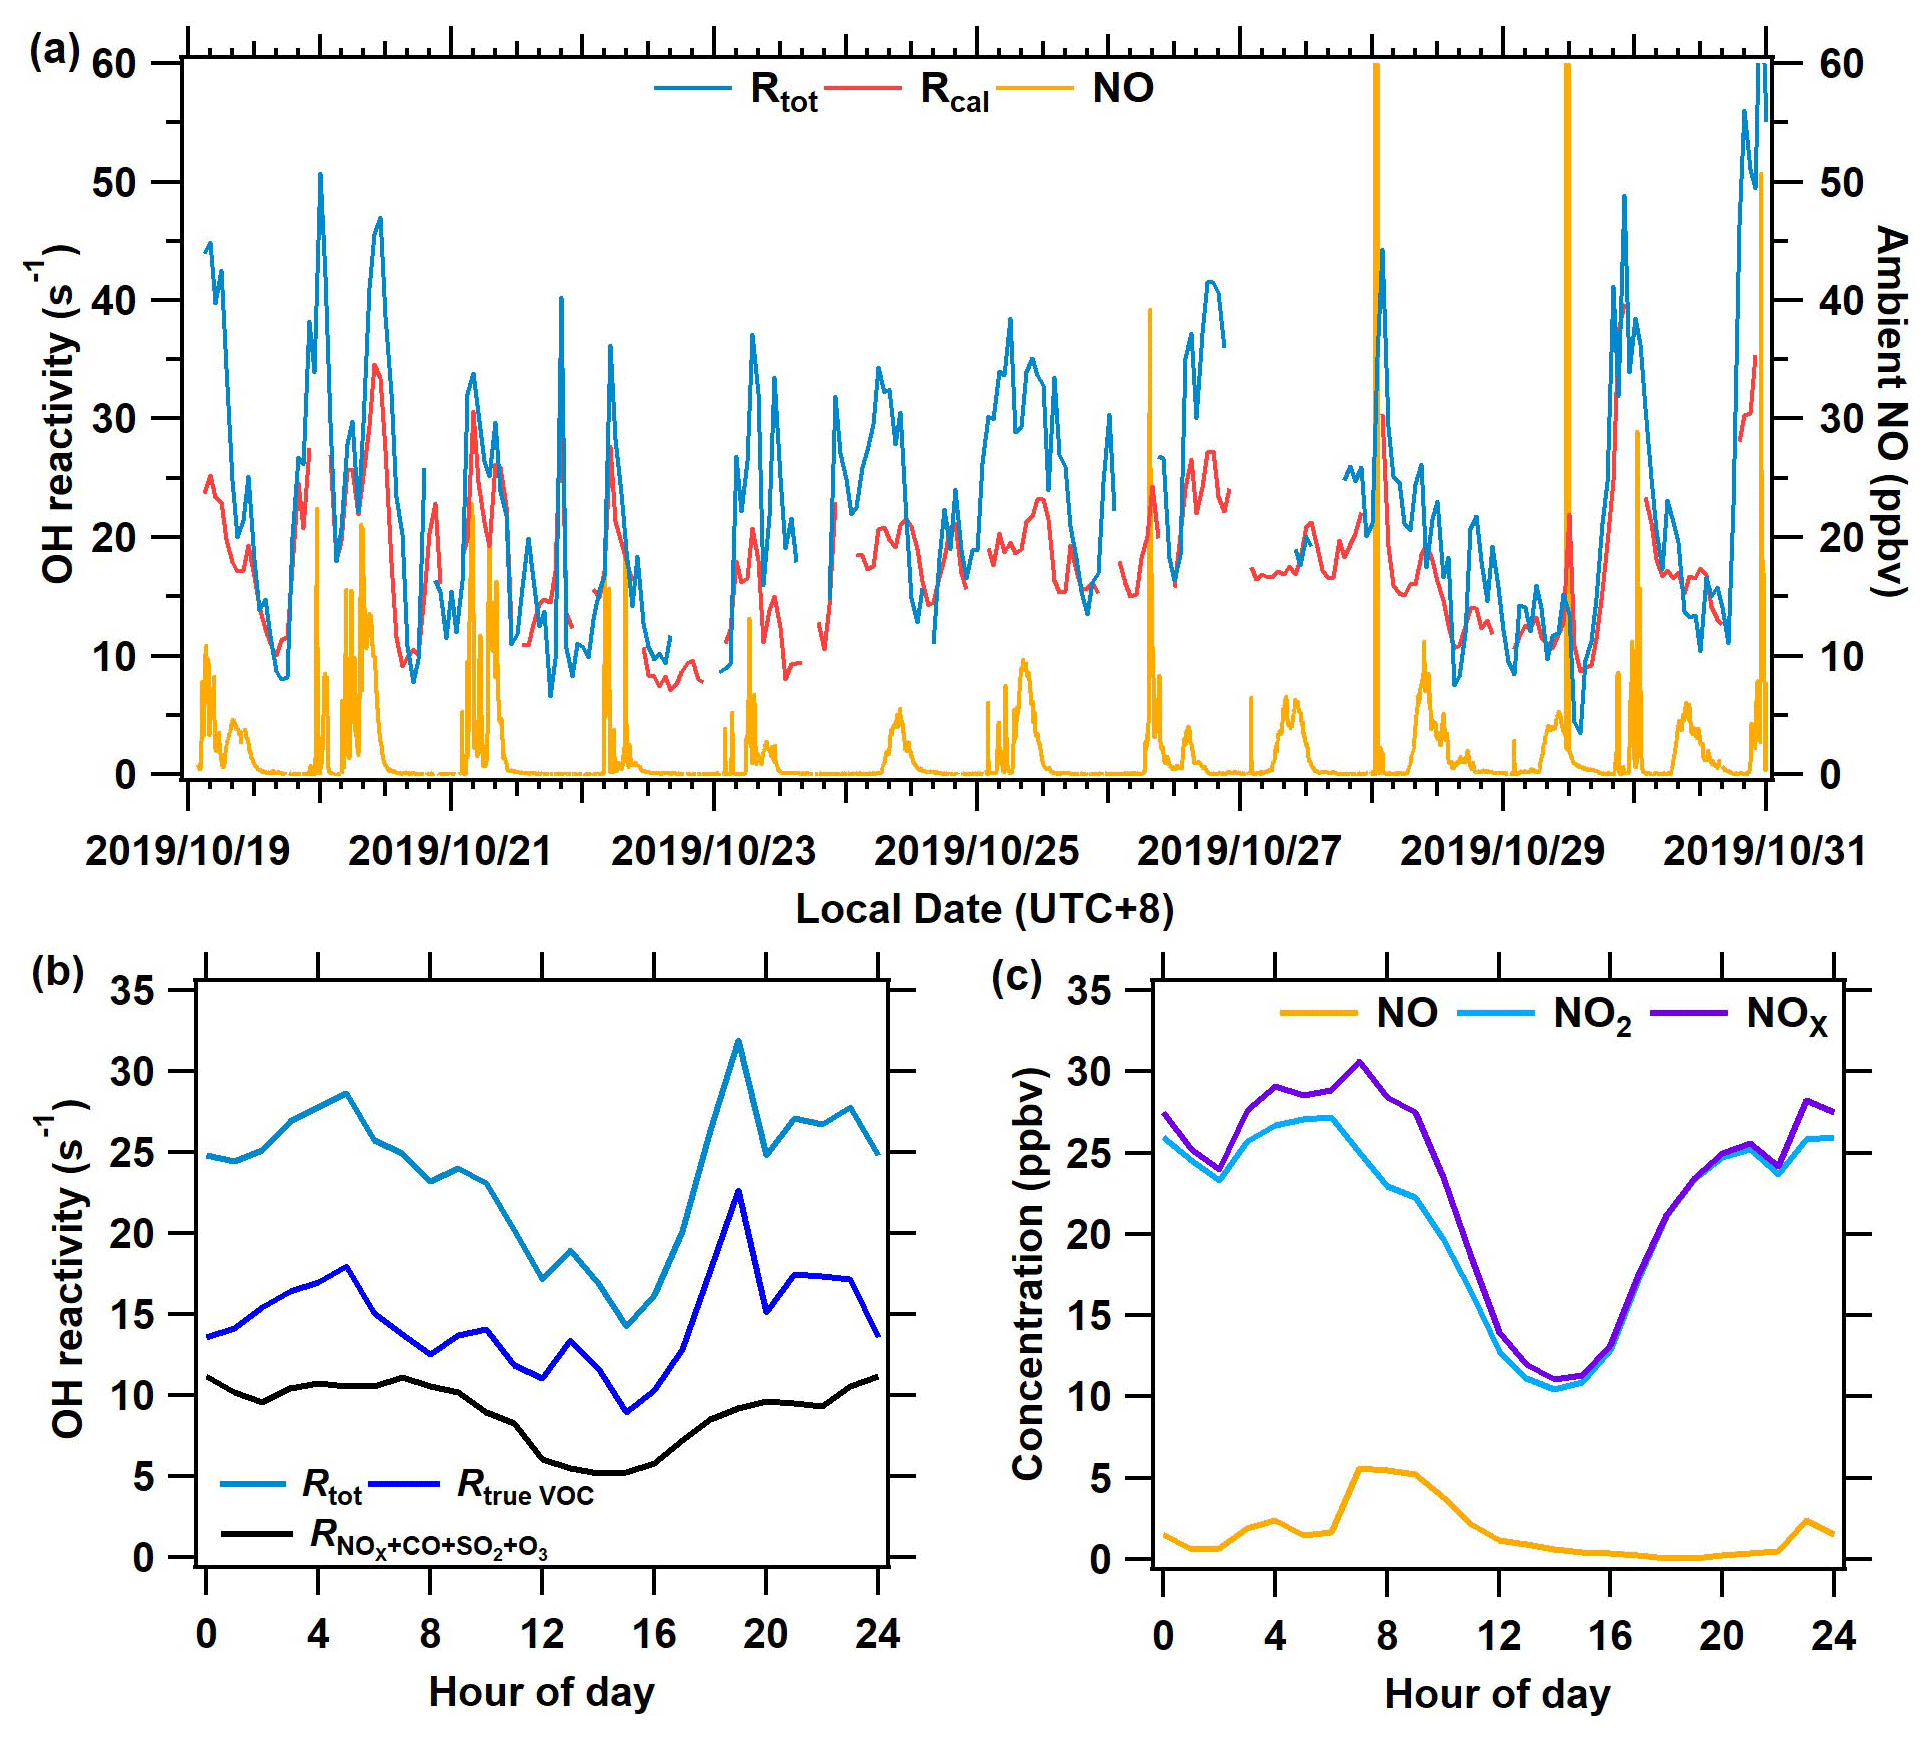
Figure 8The measurement results of OH reactivity and ambient NO at the Heshan site from 19 to 31 October 2019. (a) The time series of total OH reactivity (Rtot), calculated reactivity (Rcal), and ambient NO concentration. (b) The mean diurnal profile of OH reactivity of Rtrue VOC, , and Rtot. (c) Mean diurnal profiles of measured NO, NO2, and NOx.
To investigate the influence of humidity differences between C2 and C3 on the Rmeas in the ICRM system, we test the response of the pyrrole concentration to humidity by introducing zero air with different humidities through arm C at mode C2. The ratio of H3O+ (H2O) to H3O+ () is selected to represent the level of different humidity. Figure 7a presents the dependence of pyrrole concentrations on in mode C2. Pyrrole concentrations slightly decrease with the increase in . It must be noted that this dependence is not due to the humidity dependence of the PTR-MS sensitivity to pyrrole, but the change in OH production in the reactor, as the normalization procedure of the pyrrole signal described in Sect. 2.3 was applied to all pyrrole measurements. The maximum difference of between C2 mode and C3 mode is about 0.01, corresponding to RH changing by ∼ 30 % (Fig. 7b), which led to pyrrole changing by ∼ 0.26 ppbv, and thus the Rmeas changed by ∼ 1.9 s−1 when the Rtrue was 20 s−1. This result indicates that the influence of humidity change on OH concentrations and subsequently Rmeas cannot be ignored even though the structure of arm A was improved to decrease the number of photons entering the main body of the reactor. Therefore, a humidity correction is needed to accurately obtain Rmeas. The humidity difference between the C2 and C3 mode can be corrected by the function derived from the relationship between OH reactivity and (as shown in Fig. 7a).
3.6 Instrument performance in ambient measurements
The detection limit of the ICRM was determined to be 2.3 s−1 for an averaged pyrrole-to-OH ratio of 2.3 according to the method proposed by Michoud et al. (2015) (Fig. S8). This means that the minimum detection limit for the reactivity of sample air would be about 5 s−1 (typically diluted in the glass reactor by a factor of 2). During the measurement, daily calibration was conducted by introducing a constant concentration of various VOC standards (propane, propene, or toluene) through arm C in C2 mode and determining the ratio of Rmeas to Rtrue (i.e., αVOC). As shown in Fig. S9, is relatively stable during the measurement, ranging from 0.60 to 0.70, implying that this method has high stability despite the structural differences of the VOC species introduced.
Figure 8a presents a time series of Rtot, calculated OH reactivity (Rcal), and ambient NO. Rtot was acquired based on Eq. (5), and Rcal is calculated as the sum of all measured reactive trace gas concentrations multiplied by their respective reaction rate coefficients with OH. The new system worked well even at high NO concentrations (> 20 ppbv). The average Rtot for the entire campaign was 27.3 s−1. The Rtot was higher than the Rcal by 27 % during the campaign, with larger differences observed in the morning and at night than in the afternoon. As shown in Fig. 8b, the Rtot has an obvious diurnal variation, with higher levels at night and in the morning than that in the afternoon. This is because air pollutants from anthropogenic emissions accumulated at night and in the morning due to a lack of oxidative consumption, whereas they were depleted rapidly during the afternoon due to rising levels of oxidants, i.e., OH radicals. This diurnal pattern of Rtot is similar to that of the previous measurement results in the Pearl River Delta (Lou et al., 2010; Yang et al., 2017) and Beijing (Williams et al., 2016). Overall, the diurnal variation of the Rtrue VOC (calculated by Eq. 4) is similar to that of the calculated OH reactivity of inorganic gas (Fig. 8b) and the concentration of NOx (Fig. 8c). A comparison between the Rtot determined by the ICRM and the laser-induced fluorescence method will be of interest in future studies, particularly because LIF-type systems can also experience difficulties at high NO when OH decay rates are rapid. Further discussions on the OH reactivity results of this campaign will be given in another publication.
In this study, we presented an improved comparative reactivity method (ICRM) that is suitable for measuring OH reactivity under high-NOx conditions. The major improvements of the ICRM compared to the original CRM system are as follows.
-
The HO2 and RO2 radicals produced from H radicals reacting with O2 and OH oxidation of pyrrole, respectively, were continuously removed to the largest extent possible. In this study, 50 ppbv of NO was injected into the ICRM reactor through an additional arm G between arm A and the reactor. Under this NO level, the interference due to the reaction of HO2 and RO2 from pyrrole with NO was minimized.
-
OH recycling always happens to some extent when sampled VOCs are introduced into the reactor in the presence of NO, causing the measured OH reactivity (Rmeas) to deviate from the true OH reactivity (Rtrue). We quantified this effect by calibrating several representative VOC species, CO, and SO2 to obtain the slope of Rmeas vs. Rtrue. Different VOC species produce similar slopes, which are significantly higher than the slopes of CO and SO2. Using the average value of the derived slopes of the different species as a correction factor, we obtained a more accurate Rmeas. Additionally, the effect of ambient NO on the difference between Rtrue and was quantified.
-
The structure of the glass reactor was transformed to reduce the amount of ultraviolet light generated by the mercury lamp reaching the main body of the glass reactor. This effort resulted in eliminating the interference of pyrrole photolysis that existed in the original system. Under this condition, the new C1 mode was able to avoid the interference resulting from OH radicals produced by photolysis of residual humidity and save lots of time compared with the original C1 mode. The ICRM system was employed in a field campaign to measure OH reactivity and performed well even when ambient NO concentrations were high.
More detailed data can be provided by contacting the corresponding author.
The supplement related to this article is available online at: https://doi.org/10.5194/amt-14-2285-2021-supplement.
WJW and BY came up with the idea for the improved CRM. JPQ built the ICRM system and performed data analysis. WJW, JPQ, and BY wrote the paper, with contributions from all other authors. YWP and SHW provided the PTR-TOF-MS and PAMS data. SXY helped with the box model run. JW and VS revised the paper. MS provided financial support.
The authors declare that they have no conflict of interest.
This research has been supported by the Key-Area Research and Development Program of Guangdong Province (grant no. 2019B110206001), the National Natural Science Foundation of China (grant no. 41877302), Guangdong Natural Science Funds for Distinguished Young Scholars (grant no. 2018B030306037), the National Key R&D Plan of China (grant nos. 2019YFE0106300, 2018YFC0213904, 2016YFC0202206), the Guangdong Soft Science Research Program (grant no. 2019B101001005), the and Guangdong Innovative and Entrepreneurial Research Team Program (grant no. 2016ZT06N263). This work was also supported by the Special Fund Project for Science and Technology Innovation Strategy of Guangdong Province (grant no. 2019B121205004).
This paper was edited by Anna Novelli and reviewed by two anonymous referees.
Atkinson, R.: Atmospheric chemistry of VOCs and NOx, Atmos. Environ., 36, 2063–2101, 2000.
Atkinson, R. and Arey, J.: Atmospheric Degradation of Volatile Organic Compounds, Chem. Rev., 103, 4605–4638, 2003.
Atkinson, R., Aschmann, S. M., Winer, A. M., and Carter, W. P. L.: Rate constants for the gas phase reactions of OH radicals and O3, with pyrrole at 295 ± 1 K and atmospheric pressure, Atmos. Environ., 18, 2105–2107, 1984.
Atkinson, R., Baulch, D. L., Cox, R. A., Crowley, J. N., Hampson, R. F., Hynes, R. G., Jenkin, M. E., Rossi, M. J., and Troe, J.: Evaluated kinetic and photochemical data for atmospheric chemistry: Volume I – gas phase reactions of Ox, HOx, NOx and SOx species, Atmos. Chem. Phys., 4, 1461–1738, https://doi.org/10.5194/acp-4-1461-2004, 2004.
Birks, J. W., Andersen, P. C., Williford, C. J., Turnipseed, A. A., Strunk, S. E., Ennis, C. A., and Mattson, E.: Folded tubular photometer for atmospheric measurements of NO2 and NO, Atmos. Meas. Tech., 11, 2821–2835, https://doi.org/10.5194/amt-11-2821-2018, 2018.
Cabanas, B., Baeza, M. T., Salgado, S., Martin, P., Taccone, R., and Martinez, E.: Oxidation of heterocycles in the atmosphere: Kinetic study of their reactions with NO3 radical, J. Phys. Chem. A, 108, 10818–10823, https://doi.org/10.1021/jp046524t, 2004.
de Gouw, J. and Warneke, C.: Measurements of volatile organic compounds in the earth's atmosphere using proton-transfer-reaction mass spectrometry, Mass. Spectrom. Rev., 26, 223–257, https://doi.org/10.1002/mas.20119, 2007.
Dillon, T. J., Tucceri, M. E., Dulitz, K., Horowitz, A., Vereecken, L., and Crowley, J. N.: Reaction of hydroxyl radicals with C4H5N (pyrrole): temperature and pressure dependent rate coefficients, J. Phys. Chem. A, 116, 6051–6058, https://doi.org/10.1021/jp211241x, 2012.
Dolgorouky, C., Gros, V., Sarda-Esteve, R., Sinha, V., Williams, J., Marchand, N., Sauvage, S., Poulain, L., Sciare, J., and Bonsang, B.: Total OH reactivity measurements in Paris during the 2010 MEGAPOLI winter campaign, Atmos. Chem. Phys., 12, 9593–9612, https://doi.org/10.5194/acp-12-9593-2012, 2012.
Fuchs, H., Novelli, A., Rolletter, M., Hofzumahaus, A., Pfannerstill, E. Y., Kessel, S., Edtbauer, A., Williams, J., Michoud, V., Dusanter, S., Locoge, N., Zannoni, N., Gros, V., Truong, F., Sarda-Esteve, R., Cryer, D. R., Brumby, C. A., Whalley, L. K., Stone, D., Seakins, P. W., Heard, D. E., Schoemaecker, C., Blocquet, M., Coudert, S., Batut, S., Fittschen, C., Thames, A. B., Brune, W. H., Ernest, C., Harder, H., Muller, J. B. A., Elste, T., Kubistin, D., Andres, S., Bohn, B., Hohaus, T., Holland, F., Li, X., Rohrer, F., Kiendler-Scharr, A., Tillmann, R., Wegener, R., Yu, Z., Zou, Q., and Wahner, A.: Comparison of OH reactivity measurements in the atmospheric simulation chamber SAPHIR, Atmos. Meas. Tech., 10, 4023–4053, https://doi.org/10.5194/amt-10-4023-2017, 2017.
Hansen, R. F., Blocquet, M., Schoemaecker, C., Léonardis, T., Locoge, N., Fittschen, C., Hanoune, B., Stevens, P. S., Sinha, V., and Dusanter, S.: Intercomparison of the comparative reactivity method (CRM) and pump–probe technique for measuring total OH reactivity in an urban environment, Atmos. Meas. Tech., 8, 4243–4264, https://doi.org/10.5194/amt-8-4243-2015, 2015.
Hofzumahaus, A., Dorn, H. P., Callies, J., Platt, U., and Ehhalt, D. H.: Tropospheric OH concentration measurements by laser long-path absorption spectroscopy, Atmos. Environ., 25A, 2017–2022, 1991.
Ingham, T., Goddard, A., Whalley, L. K., Furneaux, K. L., Edwards, P. M., Seal, C. P., Self, D. E., Johnson, G. P., Read, K. A., Lee, J. D., and Heard, D. E.: A flow-tube based laser-induced fluorescence instrument to measure OH reactivity in the troposphere, Atmos. Meas. Tech., 2, 465–477, https://doi.org/10.5194/amt-2-465-2009, 2009.
Kim, S., Guenther, A., Karl, T., and Greenberg, J.: Contributions of primary and secondary biogenic VOC tototal OH reactivity during the CABINEX (Community Atmosphere-Biosphere INteractions Experiments)-09 field campaign, Atmos. Chem. Phys., 11, 8613–8623, https://doi.org/10.5194/acp-11-8613-2011, 2011.
Kim, S., Sanchez, D., Wang, M., Seco, R., Jeong, D., Hughes, S., Barletta, B., Blake, D. R., Jung, J., Kim, D., Lee, G., Lee, M., Ahn, J., Lee, S. D., Cho, G., Sung, M. Y., Lee, Y. H., Kim, D. B., Kim, Y., Woo, J. H., Jo, D., Park, R., Park, J. H., Hong, Y. D., and Hong, J. H.: OH reactivity in urban and suburban regions in Seoul, South Korea – an East Asian megacity in a rapid transition, Faraday Discuss., 189, 231–251, https://doi.org/10.1039/c5fd00230c, 2016.
Kovacs, T. A. and Brune, W. H.: Total OH Loss Rate Measurement, J. Atmos. Chem., 39, 105–122, https://doi.org/10.1023/A:1010614113786, 2001.
Kovacs, T. A., Brune, W. H., Harder, H., Martinez, M., Simpas, J. B., Frost, G. J., Williams, E., Jobson, T., Stroud, C., Young, V., Fried, A., and Wert, B.: Direct measurements of urban OH reactivity during Nashville SOS in summer 1999, J. Environ. Monitor., 5, 68–74, https://doi.org/10.1039/b204339d, 2003.
Kumar, V. and Sinha, V.: VOC–OHM: A new technique for rapid measurements of ambient total OH reactivity and volatile organic compounds using a single proton transfer reaction mass spectrometer, Int. J. Mass Spectrom., 374, 55–63, https://doi.org/10.1016/j.ijms.2014.10.012, 2014.
Kumar, V., Chandra, B. P., and Sinha, V.: Large unexplained suite of chemically reactive compounds present in ambient air due to biomass fires, Sci. Rep.-UK, 8, 626, https://doi.org/10.1038/s41598-017-19139-3, 2018.
Lou, S., Holland, F., Rohrer, F., Lu, K., Bohn, B., Brauers, T., Chang, C. C., Fuchs, H., Häseler, R., Kita, K., Kondo, Y., Li, X., Shao, M., Zeng, L., Wahner, A., Zhang, Y., Wang, W., and Hofzumahaus, A.: Atmospheric OH reactivities in the Pearl River Delta – China in summer 2006: measurement and model results, Atmos. Chem. Phys., 10, 11243–11260, https://doi.org/10.5194/acp-10-11243-2010, 2010.
Michoud, V., Hansen, R. F., Locoge, N., Stevens, P. S., and Dusanter, S.: Detailed characterizations of the new Mines Douai comparative reactivity method instrument via laboratory experiments and modeling, Atmos. Meas. Tech., 8, 3537–3553, https://doi.org/10.5194/amt-8-3537-2015, 2015.
Nölscher, A. C., Sinha, V., Bockisch, S., Klüpfel, T., and Williams, J.: Total OH reactivity measurements using a new fast Gas Chromatographic Photo-Ionization Detector (GC-PID), Atmos. Meas. Tech., 5, 2981–2992, https://doi.org/10.5194/amt-5-2981-2012, 2012a.
Nölscher, A. C., Williams, J., Sinha, V., Custer, T., Song, W., Johnson, A. M., Axinte, R., Bozem, H., Fischer, H., Pouvesle, N., Phillips, G., Crowley, J. N., Rantala, P., Rinne, J., Kulmala, M., Gonzales, D., Valverde-Canossa, J., Vogel, A., Hoffmann, T., Ouwersloot, H. G., Vilà-Guerau de Arellano, J., and Lelieveld, J.: Summertime total OH reactivity measurements from boreal forest during HUMPPA-COPEC 2010, Atmos. Chem. Phys., 12, 8257–8270, https://doi.org/10.5194/acp-12-8257-2012, 2012b.
Nölscher, A. C., Bourtsoukidis, E., Bonn, B., Kesselmeier, J., Lelieveld, J., and Williams, J.: Seasonal measurements of total OH reactivity emission rates from Norway spruce in 2011, Biogeosciences, 10, 4241–4257, https://doi.org/10.5194/bg-10-4241-2013, 2013.
Nölscher, A. C., Butler, T., Auld, J., Veres, P., Muñoz, A., Taraborrelli, D., Vereecken, L., Lelieveld, J., and Williams, J.: Using total OH reactivity to assess isoprene photooxidation via measurement and model, Atmos. Environ., 89, 453–463, https://doi.org/10.1016/j.atmosenv.2014.02.024, 2014.
Pfannerstill, E. Y., Nölscher, A. C., Yáñez-Serrano, A. M., Bourtsoukidis, E., Keßel, S., Janssen, R. H. H., Tsokankunku, A., Wolff, S., Sörgel, M., Sá, M. O., Araújo, A., Walter, D., Lavrič, J., Dias-Júnior, C. Q., Kesselmeier, J., and Williams, J.: Total OH Reactivity Changes Over the Amazon Rainforest During an El Niño Event, Front. For. Glob. Change, 1, 1–17, https://doi.org/10.3389/ffgc.2018.00012, 2018.
Pfannerstill, E. Y., Wang, N., Edtbauer, A., Bourtsoukidis, E., Crowley, J. N., Dienhart, D., Eger, P. G., Ernle, L., Fischer, H., Hottmann, B., Paris, J.-D., Stönner, C., Tadic, I., Walter, D., Lelieveld, J., and Williams, J.: Shipborne measurements of total OH reactivity around the Arabian Peninsula and its role in ozone chemistry, Atmos. Chem. Phys., 19, 11501–11523, https://doi.org/10.5194/acp-19-11501-2019, 2019.
Pfannerstill, E. Y., Reijrink, N. G., Edtbauer, A., Ringsdorf, A., Zannoni, N., Araújo, A., Ditas, F., Holanda, B. A., Sá, M. O., Tsokanku, A., Walter, D., Wolff, S., Lavrič, J. V., Pöhlker, C., Sörgel, M., and Williams, J.: Total OH reactivity over the Amazon rainforest: variability with temperature, wind, rain, altitude, time of day, season, and an overall budget closure, Atmos. Chem. Phys. Discuss. [preprint], https://doi.org/10.5194/acp-2020-752, in review, 2020.
Praplan, A. P., Pfannerstill, E. Y., Williams, J., and Hellen, H.: OH reactivity of the urban air in Helsinki, Finland, during winter, Atmos. Environ., 169, 150–161, https://doi.org/10.1016/j.atmosenv.2017.09.013, 2017a.
Praplan, A. P., Pfannerstill, E. Y., Williams, J., and Hellén, H.: OH reactivity of the urban air in Helsinki, Finland, during winter, Atmos. Environ., 169, 150–161, https://doi.org/10.1016/j.atmosenv.2017.09.013, 2017b.
Praplan, A. P., Tykkä, T., Chen, D., Boy, M., Taipale, D., Vakkari, V., Zhou, P., Petäjä, T., and Hellén, H.: Long-term total OH reactivity measurements in a boreal forest, Atmos. Chem. Phys., 19, 14431–14453, https://doi.org/10.5194/acp-19-14431-2019, 2019.
Sadanaga, Y., Yoshino, A., Watanabe, K., Yoshioka, A., Wakazono, Y., Kanaya, Y., and Kajii, Y.: Development of a measurement system of OH reactivity in the atmosphere by using a laser-induced pump and probe technique, Rev. Sci. Instrum., 75, 2648–2655, https://doi.org/10.1063/1.1775311, 2004.
Sadanaga, Y., Yoshino, A., Kato, S., and Kajii, Y.: Measurements of OH Reactivity and Photochemical Ozone Production in the Urban Atmosphere, Environ. Sci. Technol., 39, 8847–8852, https://doi.org/10.1021/es049457p 2005.
Sander, S. P., Finlayson-Pitts, B. J., Friedl, R. R., Golden, D. M., Huie, R. E., Keller-Rudek, H., Kolb, C. E., Kurylo, M. J., Molina, M. J., Moortgat, G. K., Orkin, V. L., Ravishankara, A. R., and Wine, P. H.: Chemical Kinetics and Photochemical Data for Use in Atmospheric Studies Evaluation Number 15, JPL Publication 06-2, Jet Propulsion Laboratory, Pasadena, 2006.
Sinha, V., Williams, J., Crowley, J. N., and Lelieveld, J.: The Comparative Reactivity Method – a new tool to measure total OH Reactivity in ambient air, Atmos. Chem. Phys., 8, 2213–2227, https://doi.org/10.5194/acp-8-2213-2008, 2008.
Sinha, V., Custer, T. G., Kluepfel, T., and Williams, J.: The effect of relative humidity on the detection of pyrrole by PTR-MS for OH reactivity measurements, Int. J. Mass Spectrom., 282, 108–111, https://doi.org/10.1016/j.ijms.2009.02.019, 2009.
Sinha, V., Williams, J., Lelieveld, J., Ruuskanen, T. M., Kajos, M. K., Patokoski, J., Hellen, H., Hakola, H., Mogensen, D., Boy, M., Rinne, J., and Kulmala, M.: OH Reactivity Measurements within a Boreal Forest: Evidence for Unknown Reactive Emissions, Environ. Sci. Technol., 44, 6614–6620, https://doi.org/10.1021/es101780b, 2010.
Sinha, V., Williams, J., Diesch, J. M., Drewnick, F., Martinez, M., Harder, H., Regelin, E., Kubistin, D., Bozem, H., Hosaynali-Beygi, Z., Fischer, H., Andrés-Hernández, M. D., Kartal, D., Adame, J. A., and Lelieveld, J.: Constraints on instantaneous ozone production rates and regimes during DOMINO derived using in-situ OH reactivity measurements, Atmos. Chem. Phys., 12, 7269–7283, https://doi.org/10.5194/acp-12-7269-2012, 2012.
Tan, Z., Lu, K., Hofzumahaus, A., Fuchs, H., Bohn, B., Holland, F., Liu, Y., Rohrer, F., Shao, M., Sun, K., Wu, Y., Zeng, L., Zhang, Y., Zou, Q., Kiendler-Scharr, A., Wahner, A., and Zhang, Y.: Experimental budgets of OH, HO2, and RO2 radicals and implications for ozone formation in the Pearl River Delta in China 2014, Atmos. Chem. Phys., 19, 7129–7150, https://doi.org/10.5194/acp-19-7129-2019, 2019.
Wang, M., Zeng, L., Lu, S., Shao, M., Liu, X., Yu, X., Chen, W., Yuan, B., Zhang, Q., Hu, M., and Zhang, Z.: Development and validation of a cryogen-free automatic gas chromatograph system (GC-MS/FID) for online measurements of volatile organic compounds, Anal. Methods-UK, 6, 9424–9434, https://doi.org/10.1039/c4ay01855a, 2014a.
Wang, Y., Ying, Q., Hu, J., and Zhang, H.: Spatial and temporal variations of six criteria air pollutants in 31 provincial capital cities in China during 2013–2014, Environ. Int., 73, 413–422, https://doi.org/10.1016/j.envint.2014.08.016, 2014b.
Williams, J., Keßel, S. U., Nölscher, A. C., Yang, Y., Lee, Y., Yáñez-Serrano, A. M., Wolff, S., Kesselmeier, J., Klüpfel, T., Lelieveld, J., and Shao, M.: Opposite OH reactivity and ozone cycles in the Amazon rainforest and megacity Beijing: Subversion of biospheric oxidant control by anthropogenic emissions, Atmos. Environ., 125, 112–118, https://doi.org/10.1016/j.atmosenv.2015.11.007, 2016.
Wolfe, G. M., Marvin, M. R., Roberts, S. J., Travis, K. R., and Liao, J.: The Framework for 0-D Atmospheric Modeling (F0AM) v3.1, Geosci. Model Dev., 9, 3309–3319, https://doi.org/10.5194/gmd-9-3309-2016, 2016.
Wu, Y., Yang, Y. D., Shao, M., and Lu, S. H.: Missing in total OH reactivity of VOCs from gasoline evaporation, Chinese Chem. Lett., 26, 1246–1248, 2015.
Yang, Y., Shao, M., Wang, X., Nölscher, A. C., Kessel, S., Guenther, A., and Williams, J.: Towards a quantitative understanding of total OH reactivity: A review, Atmos. Environ., 134, 147–161, https://doi.org/10.1016/j.atmosenv.2016.03.010, 2016.
Yang, Y., Shao, M., Keßel, S., Li, Y., Lu, K., Lu, S., Williams, J., Zhang, Y., Zeng, L., Nölscher, A. C., Wu, Y., Wang, X., and Zheng, J.: How the OH reactivity affects the ozone production efficiency: case studies in Beijing and Heshan, China, Atmos. Chem. Phys., 17, 7127–7142, https://doi.org/10.5194/acp-17-7127-2017, 2017.
Yuan, B., Koss, A. R., Warneke, C., Coggon, M., Sekimoto, K., and de Gouw, J. A.: Proton-Transfer-Reaction Mass Spectrometry: Applications in Atmospheric Sciences, Chem. Rev., 117, 13187–13229, https://doi.org/10.1021/acs.chemrev.7b00325, 2017.
Zannoni, N., Dusanter, S., Gros, V., Sarda Esteve, R., Michoud, V., Sinha, V., Locoge, N., and Bonsang, B.: Intercomparison of two comparative reactivity method instruments inf the Mediterranean basin during summer 2013, Atmos. Meas. Tech., 8, 3851–3865, https://doi.org/10.5194/amt-8-3851-2015, 2015.
Zannoni, N., Gros, V., Lanza, M., Sarda, R., Bonsang, B., Kalogridis, C., Preunkert, S., Legrand, M., Jambert, C., Boissard, C., and Lathiere, J.: OH reactivity and concentrations of biogenic volatile organic compounds in a Mediterranean forest of downy oak trees, Atmos. Chem. Phys., 16, 1619–1636, https://doi.org/10.5194/acp-16-1619-2016, 2016.
Zannoni, N., Gros, V., Sarda Esteve, R., Kalogridis, C., Michoud, V., Dusanter, S., Sauvage, S., Locoge, N., Colomb, A., and Bonsang, B.: Summertime OH reactivity from a receptor coastal site in the Mediterranean Basin, Atmos. Chem. Phys., 17, 12645–12658, https://doi.org/10.5194/acp-17-12645-2017, 2017.