the Creative Commons Attribution 4.0 License.
the Creative Commons Attribution 4.0 License.
 | 08 Apr 2021
Improving atmospheric path attenuation estimates for radio propagation applications by microwave radiometric profiling
Ayham Alyosef
Domenico Cimini
Lorenzo Luini
Carlo Riva
Frank S. Marzano
Marianna Biscarini
Luca Milani
Antonio Martellucci
Sabrina Gentile
Saverio T. Nilo
Francesco Di Paola
Ayman Alkhateeb
Filomena Romano
Ground-based microwave radiometer (MWR) observations of downwelling brightness temperature (TB) are commonly used to estimate atmospheric attenuation at relative transparent channels for radio propagation and telecommunication purposes. The atmospheric attenuation is derived from TB by inverting the radiative transfer equation with a priori knowledge of the mean radiating temperature (TMR). TMR is usually estimated by either time-variant site climatology (e.g., monthly average computed from atmospheric thermodynamical profiles) or condition-variant estimation from surface meteorological sensors. However, information on TMR may also be extracted directly from MWR measurements at channels other than those used to estimate atmospheric attenuation. This paper proposes a novel approach to estimate TMR in clear and cloudy sky from independent MWR profiler measurements. A linear regression algorithm is trained with a simulated dataset obtained by processing 1 year of radiosonde observations of atmospheric thermodynamic profiles. The algorithm is trained to estimate TMR at K- and V–W-band frequencies (22–31 and 72–82 GHz, respectively) from independent MWR observations at the V band (54–58 GHz). The retrieval coefficients are then applied to a 1-year dataset of real V-band observations, and the estimated TMR at the K and V–W band is compared with estimates from nearly colocated and simultaneous radiosondes. The proposed method provides TMR estimates in better agreement with radiosondes than a traditional method, with 32 %–38 % improvement depending on frequency. This maps into an expected improvement in atmospheric attenuation of 10 %–20 % for K-band channels and ∼30 % for V–W-band channels.
- Article
(5798 KB) - Full-text XML
- BibTeX
- EndNote


There is a continuous trend to use higher frequencies in the development of satellite communication (SatCom) as lower-frequency bands become saturated (e.g., Biscarini et al., 2017). Europe's current Earth observation programs with the Sentinel satellite constellation generate a daily data volume of terabytes, requiring new broadband links to access the data. In future interplanetary explorer missions, the need for high-throughput communications will also become more pressing due to a wider range of observed parameters and teleoperated landers or rovers to avoid data loss due to limited onboard memory or data compression (Jebril et al., 2007; Acosta et al., 2012). In remote areas on Earth, like Antarctica, it is of concern to forward scientific data via satellite to the research facilities (Bonifazi et al., 2002). All mentioned scientific applications have in common that the increase in data volume requires higher transmission capacities than those currently available. Current high-throughput SatCom systems operate at the X (8–12 GHz), Ku (12–18 GHz), K (18–26), and Ka (26–40 GHz) band, and presumably their next implementation will use Q (40–50 GHz) and V (50–75 GHz) bands, whereas the W band (75–110 GHz) appears to be the next natural evolution (Riva et al., 2014). Moving beyond the X and Ku bands to less congested higher frequencies increases the available bandwidth, allowing smaller equipment that consequently reduces the size of the satellite and launch vehicle (Cianca et al., 2011; Acosta et al., 2012; Emrick et al., 2014).
Ground-based microwave radiometer (MWR) observations of downwelling brightness temperature (TB) are commonly used to estimate atmospheric attenuation at relatively transparent microwave channels for radio propagation and telecommunication purposes (e.g., Marzano et al., 2006; Marzano, 2007; Biscarini et al., 2019). However, higher frequencies are characterized by larger dynamics of atmospheric propagation effects, mainly because of higher atmospheric losses (rain, clouds, and atmospheric gases). Planning of V- and W-band SatCom systems requires experimental data to characterize these unexplored atmospheric radio channels (Mattioli et al., 2013; Riva et al., 2014; Biscarini and Marzano, 2020). Radio wave propagation models can provide a reliable estimate of atmospheric path attenuation but have typically been validated only for frequencies up to 50 GHz (Riva et al., 2014). These models, recommended by the International Telecommunication Union (ITU), are based on past experimental campaigns at K–Ka and Q bands, whereas designing the Earth–satellite link budget at V and W bands would require satellite beacon data that are currently not available. It is then essential to investigate the behavior of electromagnetic waves in the V and W bands to improve existing models and validate them with independent measurements (Biscarini et al., 2019).
In response to this need, a measurement campaign has been recently planned to characterize the V- and W-band satellite atmospheric radio channel through ground-based microwave radiometric observations. The core observatory is located at Politecnico di Milano (Milan, Italy), where a four-channel MWR, including two V- and W-band channels at 72.5 and 82.5 GHz, respectively, is operated. An independent MWR with a 14-channel temperature and humidity profiler is also operated in Spino d'Adda, 25 km from Milan (Italy). Atmospheric path attenuation is derived from MWR TB observations by inverting the radiative transfer equation with a prior knowledge of the mean radiating temperature (TMR). A priori TMR is usually obtained from monthly average values computed from radiosondes (e.g., Martellucci, 2007), inferred from surface meteorological sensors (e.g., Luini et al., 2018), or derived from radio propagation models (e.g., Mattioli et al., 2013; Biscarini and Marzano, 2020). The uncertainty in TMR estimates contributes to the path attenuation uncertainty. To the aim of reducing this uncertainty, in this work we propose an original approach increasing the accuracy of TMR estimates by exploiting independent MWR profiler measurements. This is a follow-up of the work presented at the 11th International Symposium on Tropospheric Profiling (Cimini et al., 2019). The paper is structured as follows: Sect. 2 describes the methodology, and Sect. 3 presents the available dataset; Sect. 4 presents the results and the obtained performance, and Sect. 4 summarizes the results, providing hints for future work.
The atmospheric brightness temperature TB (K), measured by a MWR at frequency fi and elevation angle θ, can be used to estimate the atmospheric total path attenuation AMWR(fi,θ) (dB) using the following expression (e.g., Marzano, 2007; Ulaby and Long, 2014):
where TC is the cosmic background temperature (usually set to 2.73 K in the microwave and millimeter-wave range) and TMR(fi,θ) is the mean radiating temperature (in K), which is given by (e.g., Han and Westwater, 2000)
where T(s) and α(s) are the atmospheric physical temperature and absorption coefficient along the path s and is the total atmospheric opacity (Np) from the surface to the top of the atmosphere. As Eq. (2) suggests, the mean radiating temperature represents the mean temperature along the optical path weighted by the atmospheric transmission , i.e., the inverse of the atmospheric loss LA=eτ. Note that Eqs. (1) and (2) are derived from the radiative transfer equation for a non-scattering atmosphere (Schwarzschild's equation) and adopting the Rayleigh–Jeans approximation (Janssen, 1993), which is commonly used in the microwave range to simplify Planck's law with a linear relationship with temperature T; , where k and c are the Boltzmann and speed of light constants, respectively. In these conditions, the atmospheric opacity can be written as
and thus the atmospheric total path attenuation, which is simply the atmospheric loss in decibels (dB) units, can be rewritten in terms of τ as
Note that, as discussed in Han and Westwater (2000) and Janssen (1993), Eq. (1) is just an approximation of the exact formulation. In the frequency range used here, this approximation is valid within 2 % of the exact formulation, and thus it is adopted here for the sake of simplicity. Moreover, atmospheric scenarios with rainfall and snowfall are excluded since multiple scattering is not included in Eq. (1) and thus in this work (see Marzano et al., 2006; Biscarini and Marzano, 2020). TMR can be easily calculated from the atmospheric profiles of the physical temperature and absorption coefficient through Eq. (2). In clear-sky conditions, radiosonde profiles of temperature and humidity are sufficient to compute TMR, while in the presence of clouds assumptions must be made on the vertical distribution of condensed water (e.g., Salonen and Uppala, 1991).
Thus, the mean radiating temperature plays a role in mapping the brightness temperature to the atmospheric opacity and then total path attenuation, and the operational estimate of atmospheric attenuation from radiometric TB observations requires some a priori knowledge of TMR. Traditionally, TMR was treated as a constant determined climatologically from a dataset of atmospheric profiles, usually radiosondes. This assumption propagates uncertainty in the attenuation estimates through Eq. (1). However, as long as TB is relatively low, e.g., for zenith and low-frequency observations, the TMR uncertainty contribution to attenuation is rather small, and thus precise knowledge of TMR is not crucial.
On the other hand, with increasing TB values, e.g., in the case of observations at lower elevation angles and/or at relatively more opaque higher frequencies, accurate TMR estimates gain more importance. One consequence is that TMR uncertainties cause significant calibration errors when large air masses (i.e., pointing at a low elevation angle) are used. For example, it has been demonstrated that using a TMR climatological mean (with 9 K standard deviation based on a 13-year dataset) introduces up to 1.4 K uncertainty in tipping curve calibration at K-band channels, exploiting elevation angles down to ∼15∘ (Han and Westwater, 2000).
Thus, methods are usually exploited to reduce TMR uncertainties, especially when low-angle and/or high-frequency observations are involved. One simple method is to divide the TMR climatology into seasons, efficiently reducing the standard deviation of the climatological mean. A slightly more sophisticated method exploits time interpolation of the TMR monthly mean (Martellucci, 2007). However, these methods do not consider the actual meteorological conditions, which may significantly differ from the seasonal or monthly mean. In order to consider the actual meteorological conditions, another method is predicting TMR from the surface air temperature using regression analysis. Surface-based temperature measurements, along with TMR calculated from radiosonde measurements, provide the means to derive linear regression coefficients relating surface temperature to TMR. It has been shown that this method reduces the calibration uncertainty in K-band channels by a factor of ∼3 (Han and Westwater, 2000). Other surface measurements, such as pressure and humidity, may also be considered among the predictors in addition to temperature. This last method, relating TMR to surface pressure, temperature, and humidity (PTU) measurements, likely represents the current best practice (Luini et al., 2018). Note that hereafter relative humidity is used as the humidity variable.
However, the PTU method may be inaccurate in particular cases, i.e., when surface conditions are not well correlated with upper air. One obvious case is the occurrence of strong temperature inversions. To circumvent this problem, another method was suggested by Han and Westwater, (2000): TMR prediction could be improved by using boundary temperature profiles from an MWR profiler or a radio acoustic sounding system, which accurately recovers boundary layer surface temperature inversions (Martner et al., 1993). To our knowledge, this has not been demonstrated yet.
Thus, this analysis builds on this suggestion and presents a method to derive TMR from combined surface measurements and MWR profiler observations, demonstrating the reduced uncertainty with respect to the other methods introduced above.
The proposed method is demonstrated estimating TMR at four channels in K and V–W bands from surface measurements and independent MWR profiler observations. The dataset considered here consists of experimental data collected in 2015–2016 at two sites involved within the ESA WRad campaign. The MWR operated in Spino d'Adda is a humidity and temperature profiler (HATPRO) manufactured by Radiometer Physics GmbH (RPG) measuring TB at 14 channels from the K to V band (22.24, 23.04, 23.84, 25.44, 26.24, 27.84, 31.4, 51.26, 52.28, 53.86, 54.94, 56.66, 57.3, 58.0 GHz). The MWR operated at Politecnico di Milano is a LWP-U72-82 manufactured by RPG measuring TB at four channels, two at the K band (23.84 and 31.4 GHz) and two between the V and W bands (72.5 and 82.5 GHz). During the considered period, both MWRs constantly pointed at ∼35∘ elevation towards the geostationary satellite Alphasat, collecting one sample per second. Standard meteorological sensors are located near the two MWRs to provide the environmental PTU measurements.
In addition, the dataset includes the atmospheric thermodynamical profiles measured by radiosondes launched operationally twice a day from the Linate airport in Milan (∼5 km from Politecnico di Milano). The two radiosondes per day are launched at 11:30 and 23:30 UTC. Radiosonde profiles in the period from January 2015 to December 2016 have been collected for this analysis. Atmospheric thermodynamical profiles from each radiosonde have been processed to compute the simulated TMR in clear and cloudy conditions using the Wave Propagation Laboratory (WPL) radiative transfer code. This code was originally developed at the U.S. National Oceanic and Atmospheric Administration (NOAA; Schroeder and Westwater, 1991), implementing the millimeter-wave propagation model (MPM; Liebe, 1989), and has since been updated with refined spectroscopic parameters (Rosenkranz, 2017), as described in Cimini et al. (2018) and references therein. The cloud water content is modeled using the Teknillinen KorkeaKoulu (TKK) method (Salonen and Uppala, 1991; Luini et al., 2018).
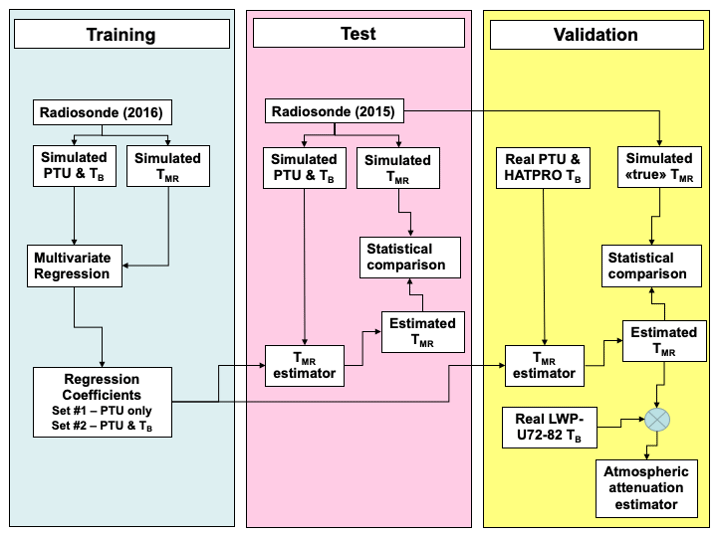
The experimental implementation is pictured in Fig. 1. TB, TMR, and PTU simulated from the 2-year dataset of radiosonde profiles are used in the training and test phases. Synthetic noise, with zero mean and standard deviation equal to the expected instrument accuracy, has been added to simulate the instrument uncertainty. In the training phase, a half-dataset (2016) is used to train two versions of a multivariate linear regression to estimate TMR from either PTU only or PTU and TB. From the set of 14 HATPRO channels available, we selected the five higher-frequency V-band channels (51.26, 52.28, 53.86, 54.94, 56.66, 57.3, 58.0 GHz). These channels are mostly sensitive to atmospheric temperature and are less affected by hydrometeors than lower-frequency K-band channels, which makes them more suited for the operational whole-sky estimate of TMR. In the test phase, the two versions of regression coefficients are used to estimate TMR from either PTU only or PTU and TB from the remaining dataset (2015). The resulting TMR values are then compared with “true” values computed from simultaneous radiosondes. Finally, in the validation phase, the two versions of regression coefficients are fed with real measurements, either from the PTU sensor only or with the PTU sensor and five HATPRO V-band channels. The resulting TMR values are again compared with true radiosonde values and also applied to real LWP-U72-82 observations to estimate atmospheric attenuation through Eq. (1).
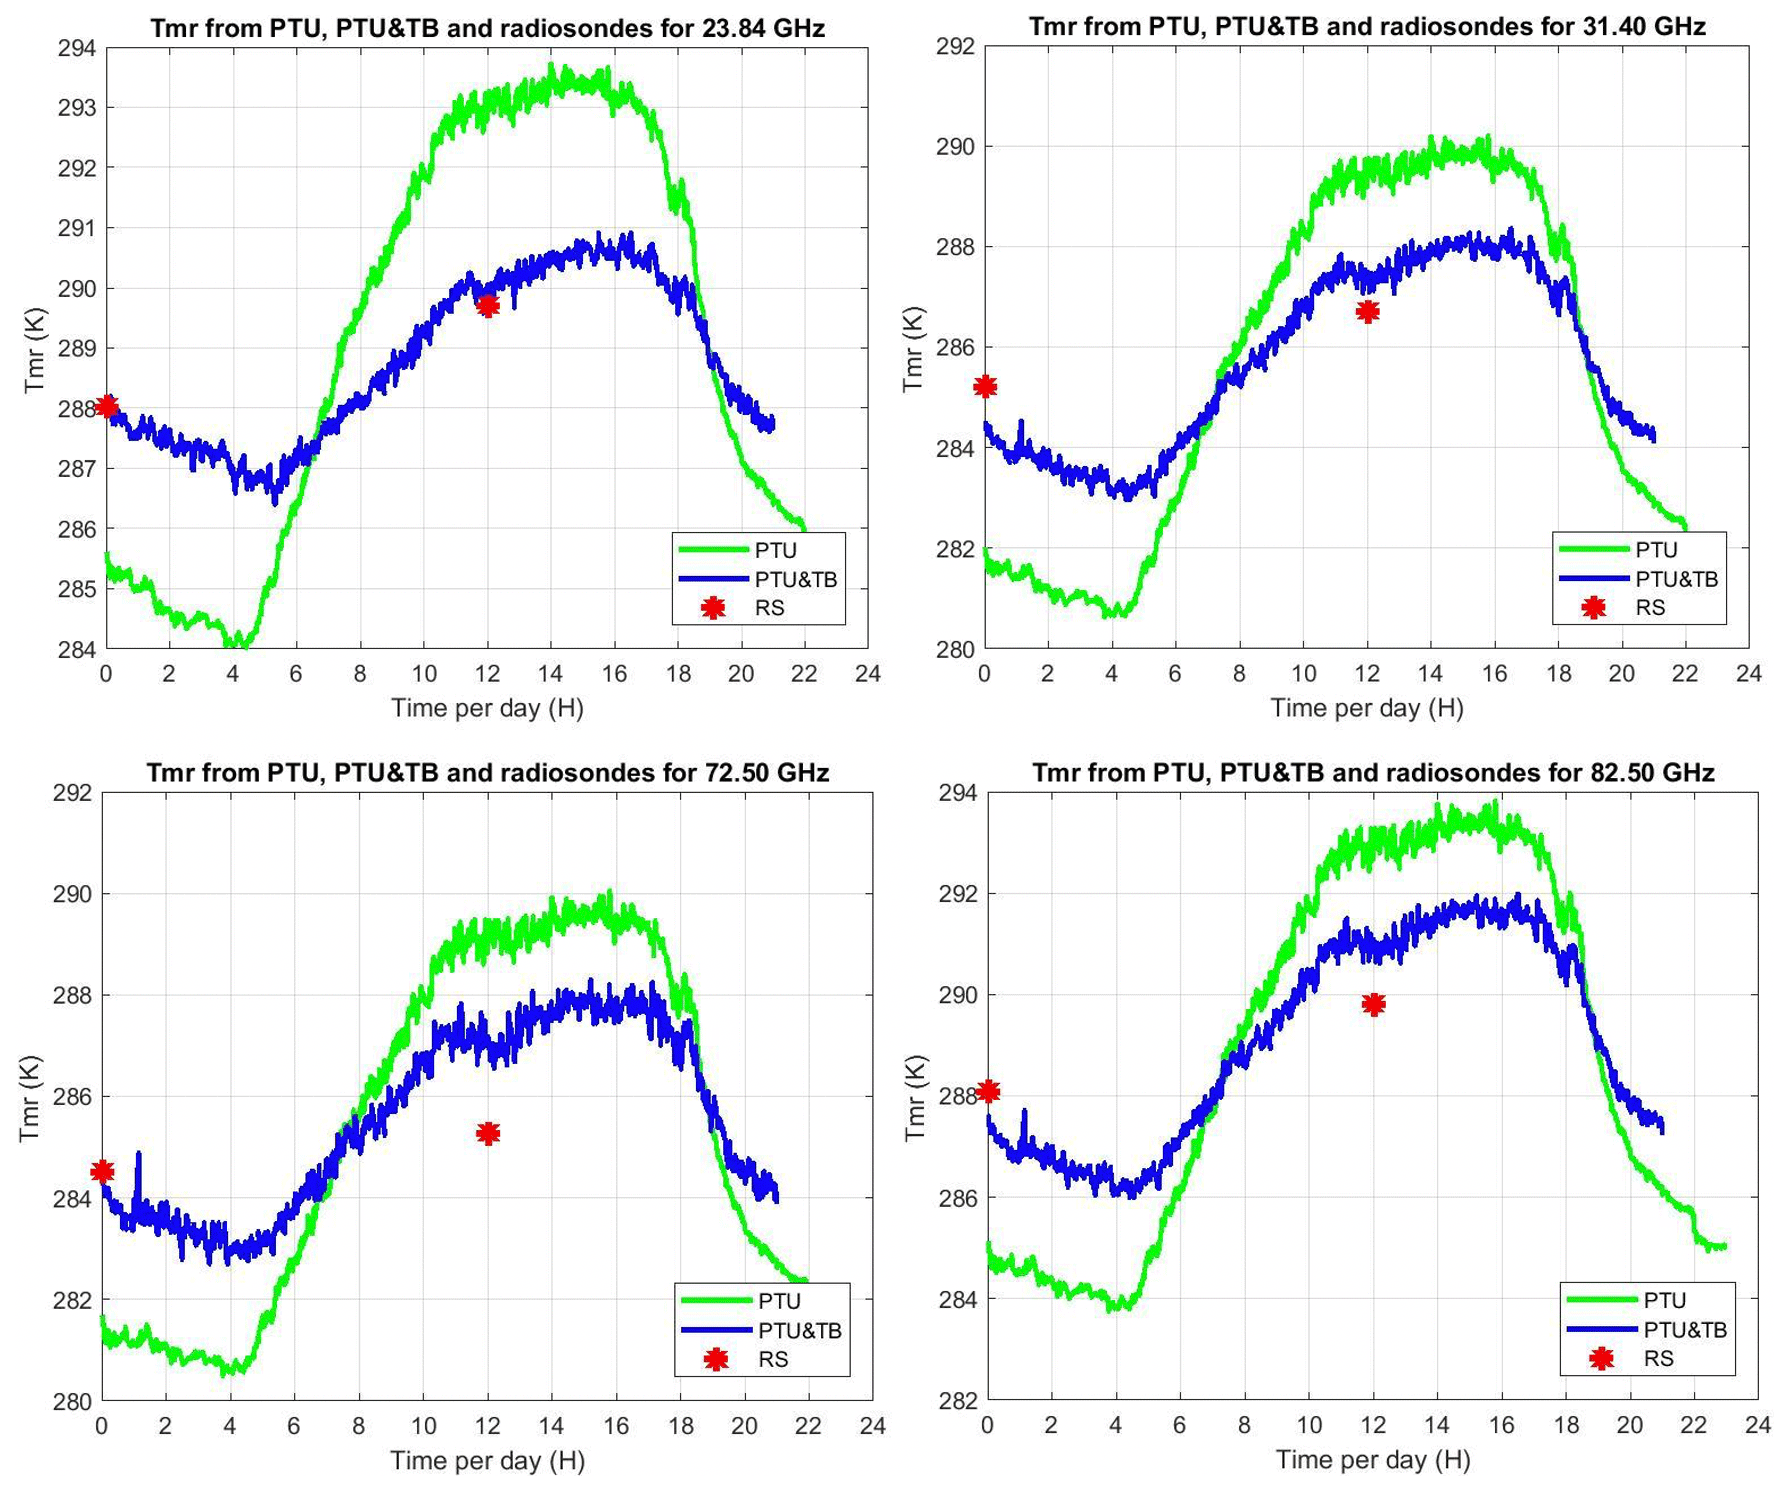
Figure 2The 24 h time series (19 July 2015) of TMR as estimated from surface PTU measurements (green line) and with the additional TB at five V-band channels (blue line). TMR values from twice-daily radiosonde measurements are also reported (red dots). Clockwise from top left: 23.84, 31.40, 72.50, 82.50 GHz.
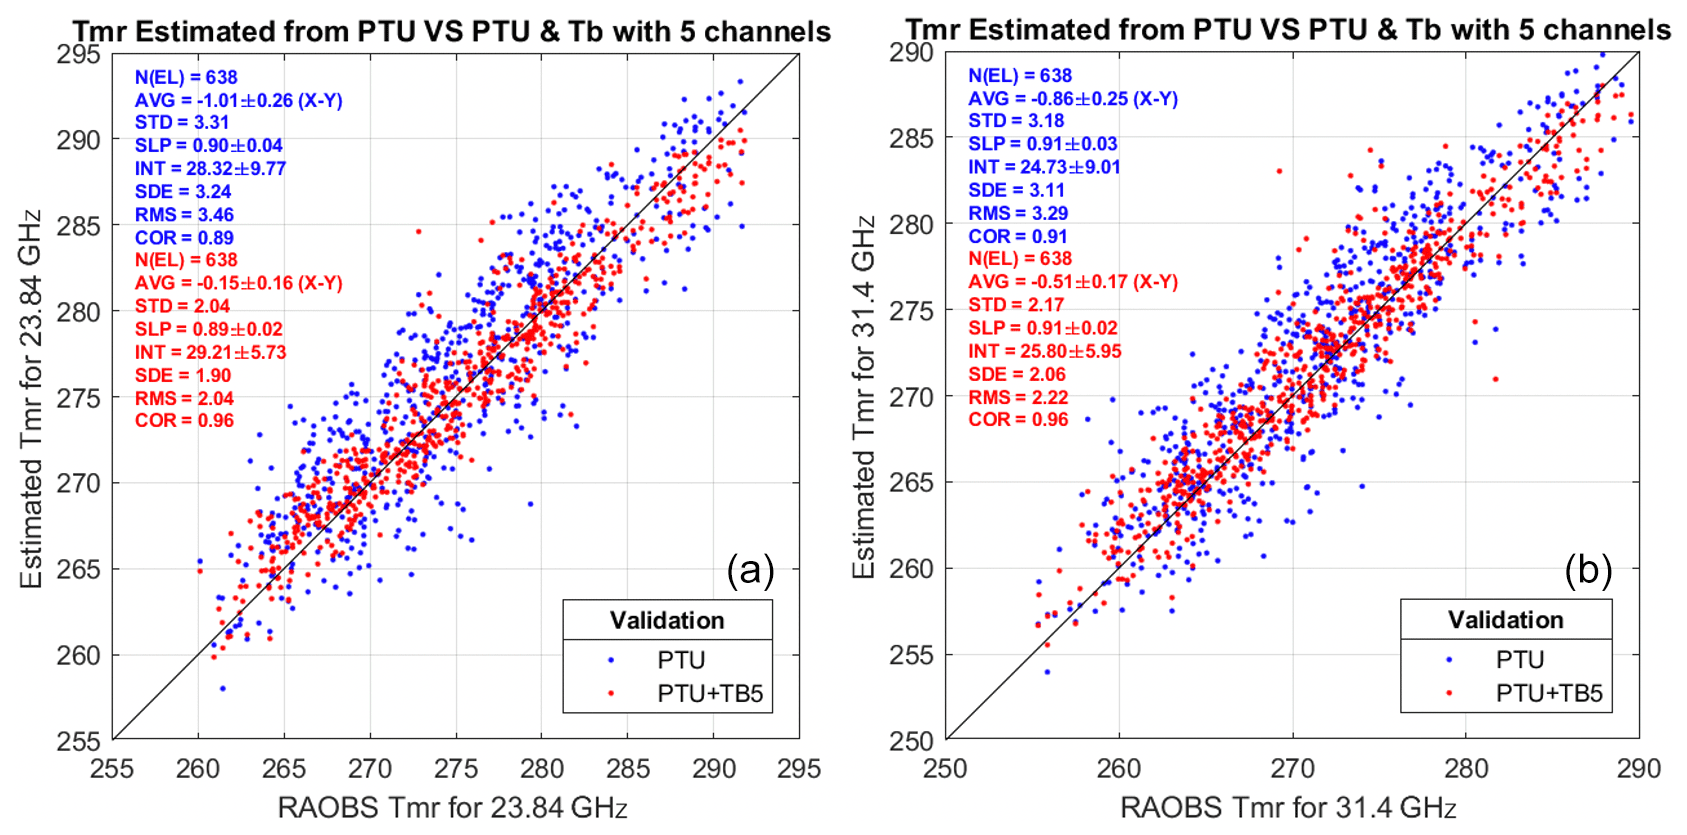
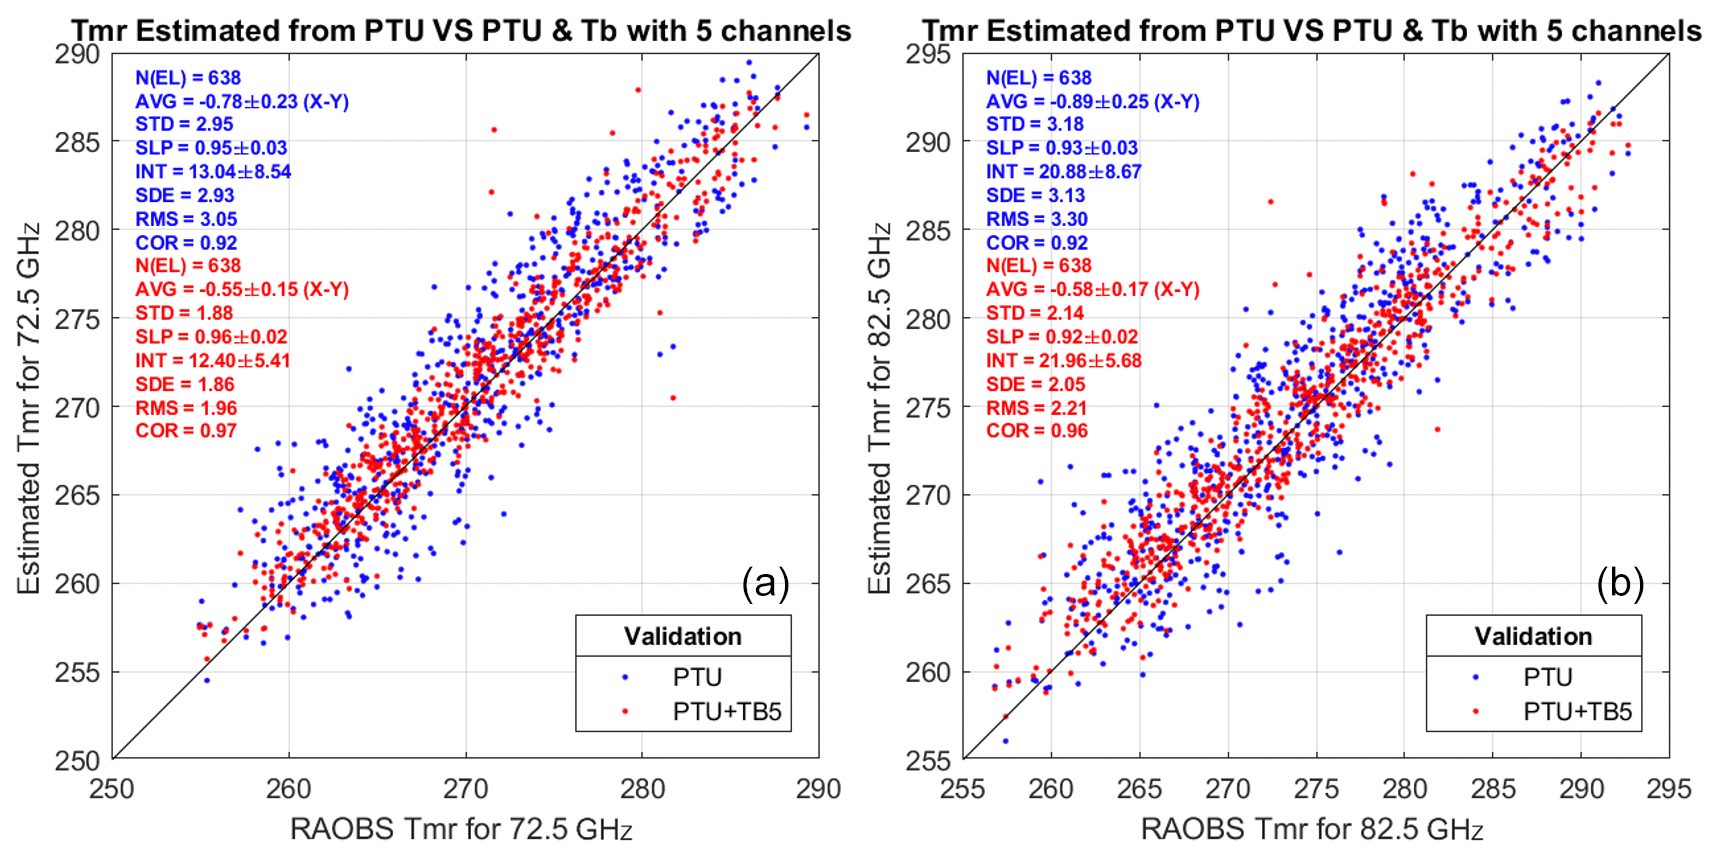
Figure 3Estimated vs. reference TMR at K band: (a) 23.84 GHz and (b) 31.4 GHz. Red dots indicate estimated TMR based on PTU and TB, while blue dots indicate TMR based on PTU only. Each panel reports the number of elements (N(EL)), the average difference (AVG), the standard deviation (SD), the slope (SLP) and intercept (INT) of a linear fit, the standard error (SE), the root mean square difference (RMSD), and the correlation coefficient (COR); 95 % confidence intervals are given for AVG, SLP, and INT. Units for AVG, SD, SE, and RMSD are Kelvin.
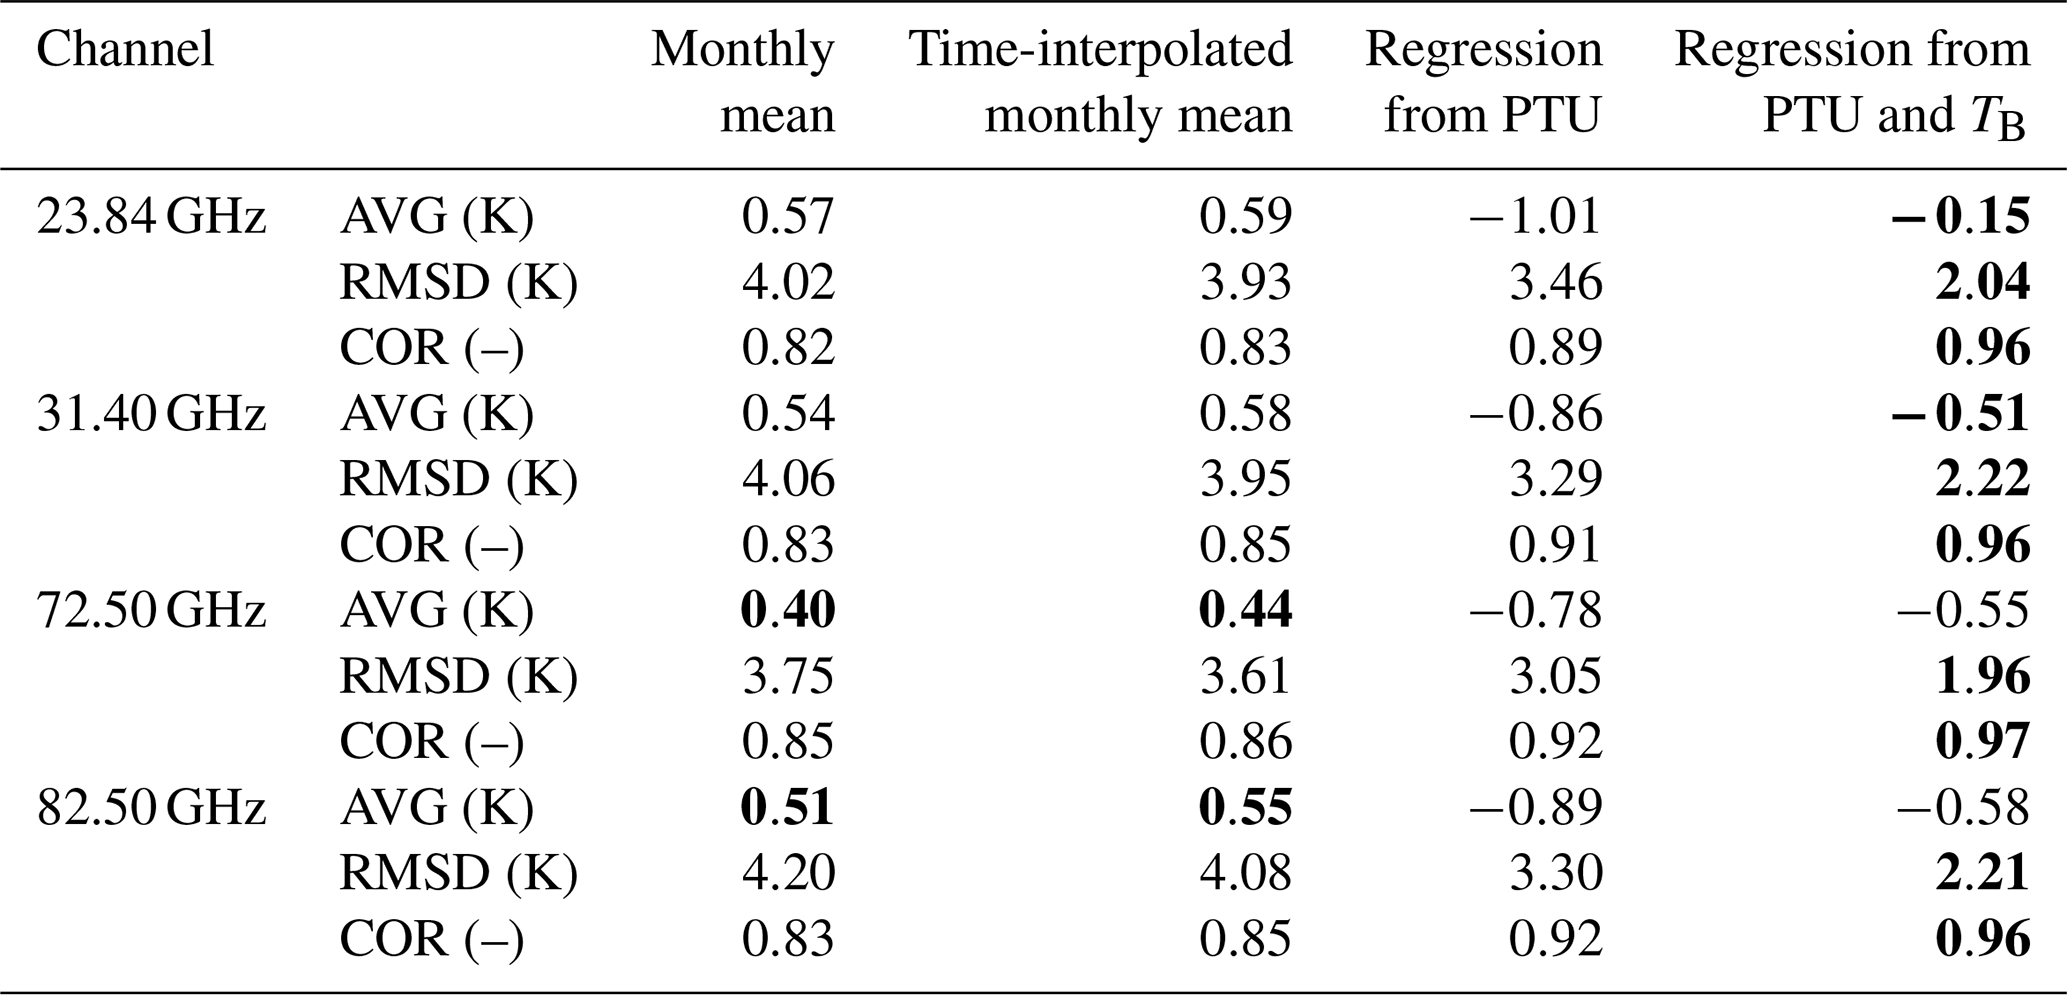
In the validation phase, the multivariate regression trained with the simulated dataset from 2016 is applied to real observations in 2015 and validated against TMR computed from radiosonde profiles. For the considered pointing angle (35∘ elevation), the cloud liquid water path estimated from radiosondes reaches 2.8 mm for the training set, while the liquid water path estimated from MWR observations within the validation set reaches 4.6 mm. The results from the two versions of regression coefficients, one applicable to surface PTU measurements only and the other applicable to PTU measurements and five V-band channels TB, are compared here. The implemented equation and coefficients for the multivariate regression are given in Appendix A. The output dataset consists of TMR and A at four frequencies (23.84, 31.4, 72.5, and 82.5 GHz) retrieved at 1 min temporal resolution. One example of 24 h time series is shown in Fig. 2. For all four considered frequencies, it is evident that TMR from PTU and TMR from PTU and TB follow a similar diurnal cycle, decreasing up to 05:00, then rapidly increasing until noon, then remaining stable for a few hours, and finally decreasing again after 17:00 UTC. However, there seems to be a factor of ∼2 in the peak-to-peak variation; e.g., at 23.84 GHz, TMR peak-to-peak variation is ∼9 K for TMR (PTU), while it is ∼4 K for TMR (PTU and TB). TMR computed from the two daily radiosondes, representing our reference “truth”, seems to confirm that TMR (PTU and TB) is correct in estimating a smaller variation. The statistical comparison from the validation phase is reported in Figs. 2 and 3, considering a set of 638 radiosondes in 2015. From this dataset, the TMR climatological variations in Milan in clear and cloudy sky are estimated to be ∼7.6–8.2 K, depending upon K- and V–W-band channels. Time colocation with radiometric observations is achieved by averaging the estimated TMR within 15 min of the radiosonde release time. All the considered statistical scores show that TMR (PTU and TB) agrees better than TMR (PTU) with the reference radiosondes for all four considered frequency channels (two K and two V–W bands). In particular, the average difference (AVG), the root mean square difference (RMSD), and the correlation coefficient (COR) with respect to TMR from radiosondes are reported in Table 1. Four methods to estimate TMR are reported in Table 1: seasonal climatology (monthly mean), time-interpolated monthly mean, regression from PTU, and finally regression from PTU and TB. As one would expect, Table 1 indicates that condition-dependent methods (e.g., the two regression types) outperform methods simply based on climatology. The only score that is better for climatology methods is AVG, i.e., the average difference over 1 year. This is somewhat expected, as the climatology methods minimize the annual mean difference by definition. Nonetheless, the regression methods show modestly higher AVG values. Conversely, the regression methods show substantially better RMSD and COR scores with respect to climatological methods, which confirms that regression methods are preferable when accurate estimates of TMR and atmospheric attenuation are desired. Table 1 also clearly indicates that the regression based on PTU and TB outperforms the one based on PTU only. For the considered K- and V–W-band frequencies, the improvement ranges between ∼0.2 and 0.8 K in average difference, ∼1.0 and 1.4 K in RMSD, and ∼4 % and 7 % in correlation. This quantitatively demonstrates that the consideration of V-band channels within the regression brings in significant information on TMR, as originally foreseen by Han and Westwater (2000).
Table 1Average difference (AVG), root mean square difference (RMSD), and correlation coefficient (COR) with respect to reference TMR (computed from radiosondes) for TMR estimated from four methods: monthly mean, time-interpolated monthly mean, regression from PTU, and regression from PTU and TB. The best scores are in bold.
Given the radio propagation purposes, the question is whether the improvements in TMR estimation given in Table 1 bring significant improvements in atmospheric attenuation estimates. In order to investigate this, we propagate TMR and TB uncertainty through Eq. (1) to obtain the uncertainty of atmospheric attenuation. From Eqs. (3)–(4), the uncertainty in atmospheric attenuation is simply related to the uncertainty in atmospheric opacity as
where
is the uncertainty in atmospheric opacity due to the uncertainty in TMR and TB, i.e., σTMR and σTB. Thus, we compute the uncertainty of atmospheric attenuation σA in the case that TMR is estimated from PTU with TB and from PTU only by replacing σTMR in Eq. (6) with the TMR uncertainty in Table 1 and σTB with a typical value for MWR TB uncertainty, i.e., 0.5 K (e.g., Cimini et al., 2003). The percentual improvement brought by the TMR estimated with the proposed method (A, based on PTU and TB) over the conventional method (B, based on PTU only) is quantified by
for both TMR and A. Table 2 summarizes the percentual improvements for the four considered frequencies in the K and W band. Thus, with respect to the conventional PTU method, the proposed method on average improves the TMR estimates by more than 32 %, and it is expected to improve the A estimates by 10 %–20 % at K-band channels and ∼30 % at V–W-band channels. In terms of radio propagation measurements, the achieved improvement level is rather modest (fraction of a decibel) in clear-sky conditions when TB and the atmospheric attenuation are low, but it becomes more and more important as TB and the attenuation increase (e.g., heavy clouds and precipitation) due to the (TMR−TB) factor in the denominator of Eqs. (1) and (6).
Table 2Percentage improvements brought by the proposed method (based on PTU and TB) over the conventional method (based on PTU only). Note that while the improvements for TMR are validated against radiosondes (i.e., the SD in Figs. 3–4), the improvements for A are estimated through Eqs. (5)–(6) and thus represent an estimate of the expected improvements.
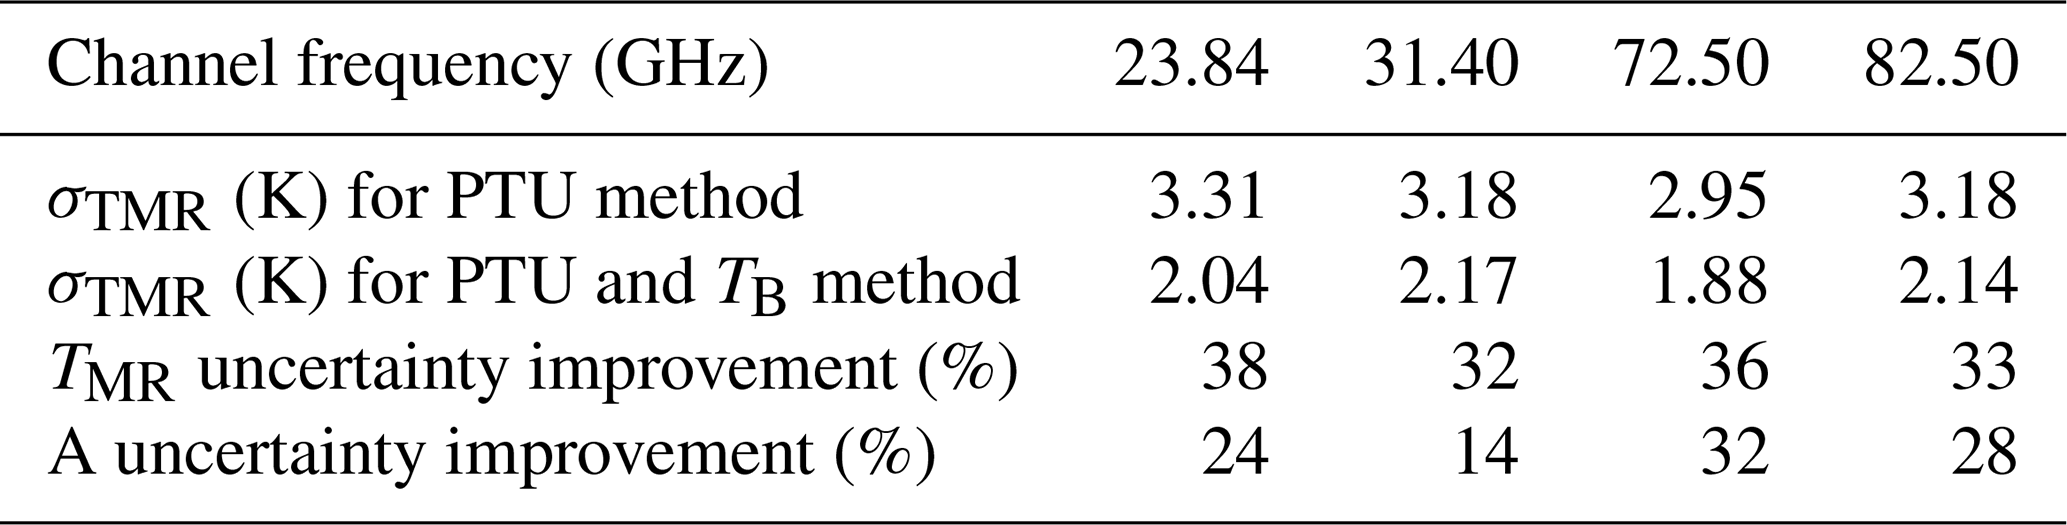
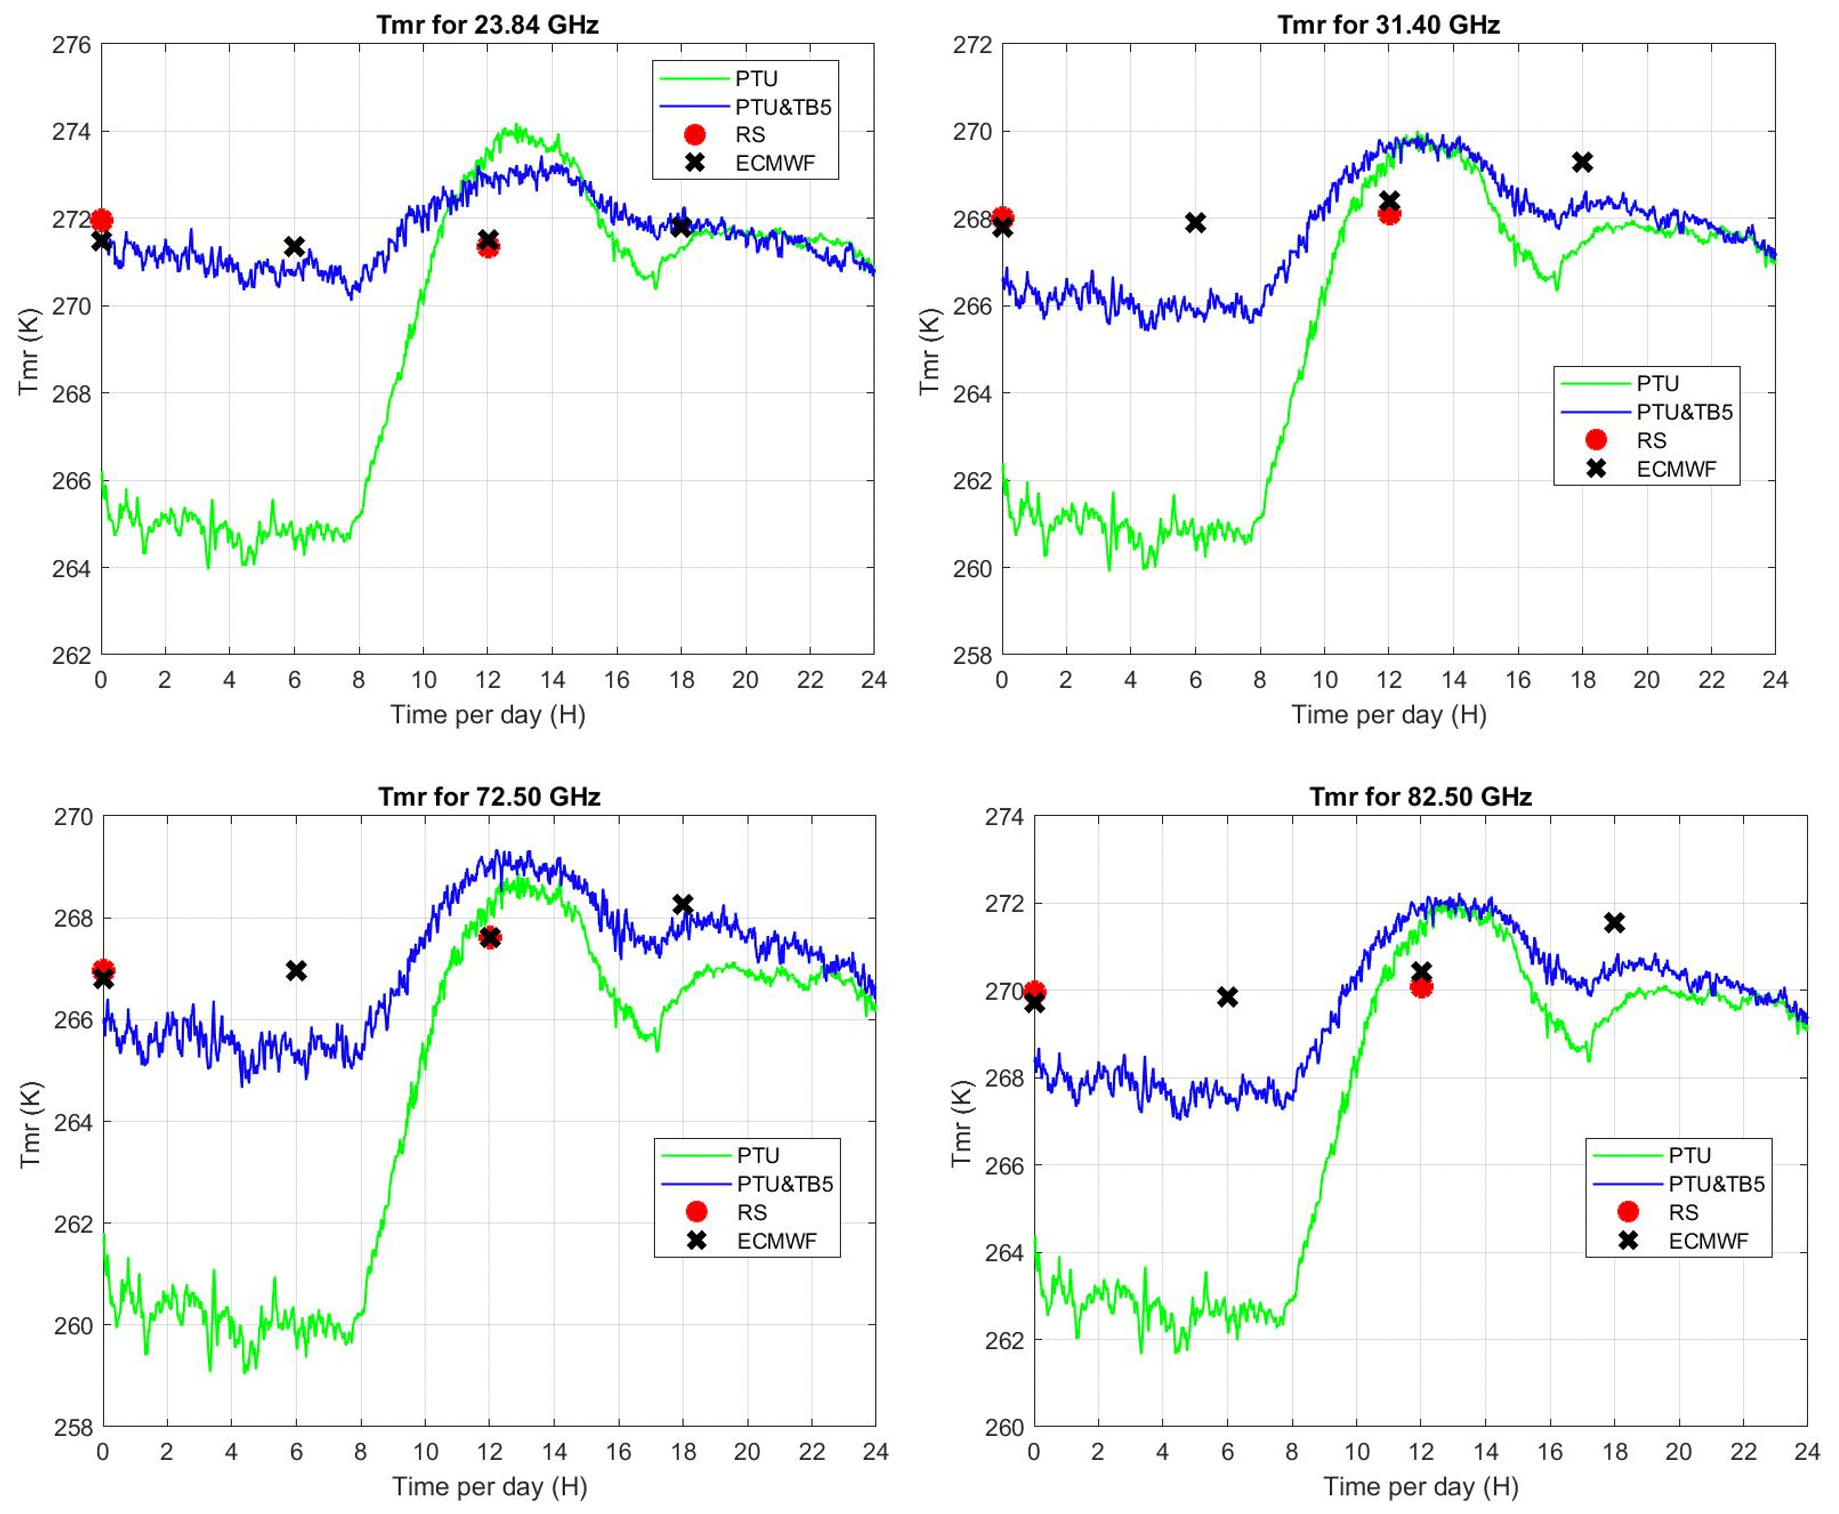
Figure 5The 24 h time series (31 December 2018) of TMR as estimated from surface PTU measurements (green line) and with the additional TB at five V-band channels (blue line). TMR values from twice-daily radiosonde measurements (red dots) and from ECMWF analysis (black crosses) are also reported. Clockwise from top left: 23.84, 31.40, 72.50, 82.50 GHz.
To show an example of application, we select one day (31 December 2018) for which data from the 14-channel MWR in Spino d'Adda and the four-channel MWR at Politecnico di Milano are available, together with the PTU readings. PTU and TB at the five higher-frequency V-band channels (51.26, 52.28, 53.86, 54.94, 56.66, 57.3, 58.0 GHz) of the 14-channel MWR are used to compute TMR at the frequencies of the four-channel MWR (23.84, 31.40, 72.50, 82.50 GHz). TMR and the observed TB at the four channels are used to compute the attenuation. Results for both PTU only and for the PTU and TB method are shown in Fig. 5 (TMR) and Fig. 6 (attenuation). Figures 5 and 6 also show TMR and attenuation computed from the radiosonde profiles (twice daily) and the model profiles (every 6 h) from the nearest grid point of the global analysis produced by the European Centre for Medium-Range Weather Forecasts (ECMWF). The difference between the PTU and PTU with TB methods is evident between midnight and 08:00. As indicated by the radiosonde profile (not shown), that night was characterized by a temperature inversion near the surface about 8 K strong and 160 m deep. This causes the surface temperature (used in the PTU method) to decouple from that of the upper air. Conversely, the PTU and TB method brings in information on lower-atmospheric temperature. The TMR difference between the two methods is 4–6 K at 08:00, rapidly decreasing as the Sun warms up the surface and fading to negligible values around noon.
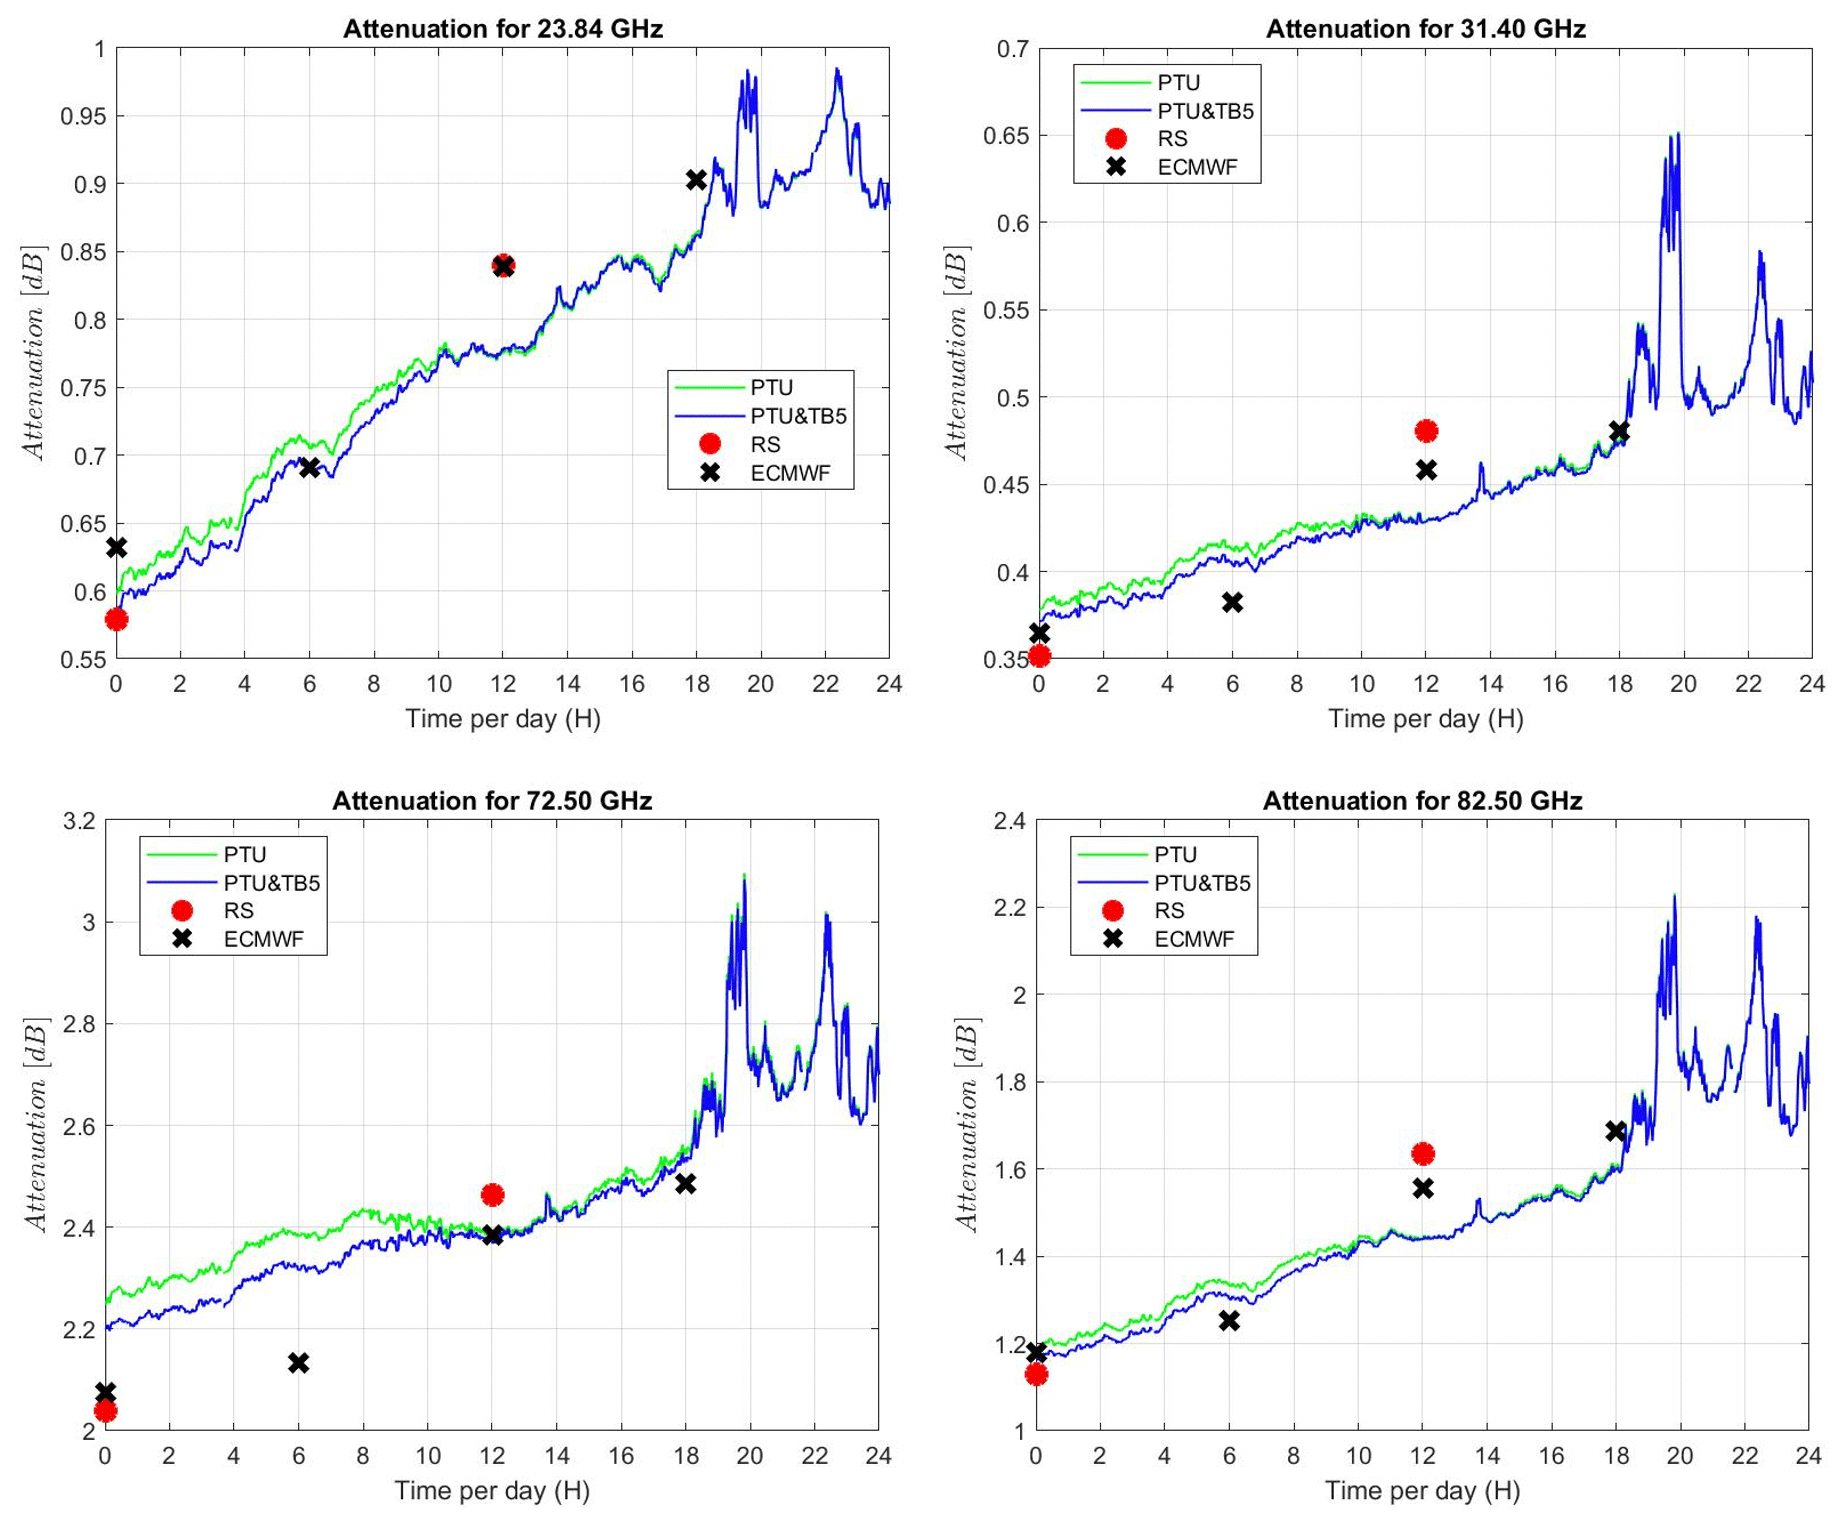
Figure 6The 24 h time series (31 December 2018) of A from the PTU (green line) and PTU with TB (blue line) methods. A computed from twice-daily radiosonde measurements (red dots) and ECMWF analysis (black crosses) is also reported. Clockwise from top left: 23.84, 31.40, 72.50, 82.50 GHz.
A similar behavior is found in attenuation (Fig. 6), although the difference is less striking. Attenuation from radiosondes and ECMWF profiles is mostly closer to that from the PTU and TB method. However, a proper validation would require a dataset with a larger dynamical range and an independent reference valid in both clear and cloudy conditions. In fact, neither radiosonde nor ECMWF profiles can be assumed as a reference in cloudy conditions due to the lack of accurate cloud water content, which for radiosondes is modeled statistically (TKK method), while for ECMWF it represents a larger scale than the local one. The collection of a reference dataset is indeed the main objective of the WRad campaign through the application of Sun-tracking microwave radiometry (Biscarini et al., 2019, and references therein).
In this paper we propose an approach to estimate TMR from radiometric observations at the V band (sensitive to atmospheric temperature) in addition to surface measurements of PTU, which represents the current best practice. The approach was suggested in Han and Westwater (2000) but never attempted to our knowledge. Here, we implement the suggested approach by applying multivariate linear regression to radiometric and radiosonde observations collected in the Milan area (Italy). Two independent microwave radiometers are considered, one atmospheric profiler operating at 14 channels in the K and V bands and one four-channel radiometer operating at two K-band channels and two between V- and W-band channels. The implemented approach exploits five V-band channels of the microwave profiler (namely at 53.86, 54.94, 56.66, 57.3, and 58.0 GHz) together with surface PTU measurements to estimate TMR at the K- and V–W-band frequencies of the four-channel radiometer. The conventional method is also implemented, estimating TMR at the frequencies of the four-channel radiometer from PTU measurements only. Results from the proposed and conventional methods are validated against TMR from simultaneous radiosondes, showing improvement in all channels and statistical scores (∼0.2–0.8 K in average difference, ∼1.0–1.4 K in RMSD, and ∼4 %–7 % in correlation, depending upon frequency). This corresponds to a decrease in TMR estimation uncertainty by 32 % to 38 %, depending upon frequency. The improvement in TMR estimation is then mapped into the improvement in attenuation estimates for radio propagation purposes by propagating typical TMR and TB uncertainties into the atmospheric attenuation equation. This results in expected improvements in atmospheric attenuation estimates of the order of 10 %–20 % at K-band channels and ∼30 % at V–W-band channels. Although this level of improvement leads to modest change in absolute attenuation in clear sky (fraction of a decibel), it becomes more and more important (a few decibels) with the increasing attenuation typical of cloudy and rainy conditions. In summary, this paper demonstrates the validity of the Han and Westwater (2000) idea, and it provides a quantitative assessment of the improvements brought by the proposed method over the conventional PTU method for estimating TMR and atmospheric attenuation at the cost of higher observation complexity (two radiometers in a relatively small area). This limitation may be overcome by the increasing availability of MWR profilers currently deployed at several ground stations serving satellite telecommunication (e.g., ESA Tracking Network in Cebreros, Malargüe, and New Norcia) as well as observatories devoted to atmospheric research and operational weather forecast (Cimini et al., 2020). Concerning the radio propagation purposes, future work will include the application of the proposed method to the dataset collected within the ESA WRad campaign (August 2019–August 2021) to further validate the improvements in atmospheric attenuation estimates in whole-sky conditions, eventually contributing to the future assessment of the V–W-band link budget for Earth–satellite telecommunication.
Multivariate multiple linear regression (Bevington and Robinson, 2003) is used here to estimate TMR at four frequencies (23.8, 31.4, 72.5, 82.5 GHz). To clarify, note that the term multivariate refers to statistical models that have more than one dependent or outcome variable (predictands), while multiple (or multivariable) refers to statistical models that have more than one independent or input variable (predictors) (e.g., Hidalgo and Goodman, 2013). Following Cimini et al. (2006) and references therein, a general equation for the multivariate multiple linear regression between (vector of predictands) and y (vector of predictors) is
where D is the matrix of linear regression coefficients, and x0, y0, and Cxy and Cyy are estimated from the training set (a priori knowledge) as the mean values for x and y, the covariance matrix of simultaneous x and y, and the autocovariance matrix of y, respectively. In this work, the predictands are TMR at four frequencies. Thus, for any measured k-dimension vector of predictors yi, the estimated TMR for each channel j is
Table A1D for multivariate multiple linear regression Eqs. (A1)–(A2) to estimate TMR from PTU only. The first row and column respectively indicate the corresponding frequency channel and predictor.

Table A2D for multivariate multiple linear regression Eqs. (A1)–(A2) to estimate TMR from PTU and TB at five V-band channels. The first row and column respectively indicate the corresponding frequency channel and predictor.

In this study, two versions are implemented with different sets of predictors. The first version considers three variables as predictors (k=3): air pressure, temperature, and relative humidity (PTU) measured by standard meteorological sensors. The second version considers eight variables as predictors (k=8): the three PTU readings and TB at five V-band channels (53.86, 54.94, 56.66, 57.3, 58.0 GHz). From the training set, we obtain the following values for x0, indicating the mean TMR (K) at four frequencies:
While x0 is the same for the two versions of multivariate multiple linear regression, both y0 and D depend on the number of predictors. For the first version y contains the mean PTU measurements, i.e., a vector of three components, and D is as in Table A.1:
For the second version, y contains the PTU measurements and TB at five V-band channels, i.e., a vector of eight components, and D is as in Table A.2:
The underlying software code and data can be accessed upon request by emailing the corresponding author: domenico.cimini@imaa.cnr.it.
AyhA and DC conceived the study, processed the data, and wrote the paper. LL and CR provided the MWR data and insights on methodology for radio propagation applications. FSM led the WRad project and provided funds for the study. MB, LM, and AM contributed to the understanding of requirements. SG, STN, FDP, FR, and AymA contributed to data processing. All authors contributed to writing, reviewing, and editing the published version of the paper.
The authors declare that they have no conflict of interest.
This article is part of the special issue “Tropospheric profiling (ISTP11) (AMT/ACP inter-journal SI)”. It is a result of the 11th edition of the International Symposium on Tropospheric Profiling (ISTP), Toulouse, France, 20–24 May 2019.
Support from COST – European Cooperation in Science and Technology (https://www.cost.eu, last access: 1 April 2021) – under action CA18235 “PROBE” is acknowledged.
This research has been supported by the European Space Agency (ESA) as part of the WRad project (ESA contract no. 4000125141/18/NL/AF).
This paper was edited by Paolo Di Girolamo and reviewed by Ed R. Westwater and one anonymous referee.
Acosta, R. J., Nessel, J. A., Simons, R. N., Zemba, M. J., Morse, J. R., and Budinger J. M.: W/V-Band RF Propagation Experiment Design, 18th Ka and Broadband Communication Conference, available at: https://ntrs.nasa.gov/archive/nasa/casi.ntrs.nasa.gov/20120016067.pdf (last access: 31 July 2020), Ottawa, Canada, 24 September 2012, 2012.
Bevington, P. R. and Keith Robinson, D.: Data Reduction and Error Analysis for the Physical Sciences (3rd Edition), ISBN 0-07-247227-8, McGraw-Hill, New York, NY 10020, USA, 2003.
Biscarini, M. and Marzano, F. S.: Generalized Parametric Prediction Model of the Mean Radiative Temperature for Microwave Slant Paths in All-Weather Condition, IEEE T. Antenn. Propag., 68, 1031–1043, 2020.
Biscarini, M., Montopoli, M., and Marzano, F. S.: Evaluation of High-Frequency Channels for Deep-Space Data Transmission Using Radiometeorological Model Forecast, IEEE T. Antenn. Propag., 65, 1311–1320, 2017.
Biscarini, M., Milani, L., Montopoli, M., De Sanctis, K., Di Fabio, S., Magde, K. M., Brost, G. A., and Marzano, F. S.: Exploiting Tropospheric Measurements From Sun-Tracking Radiometer for Radiopropagation Models at Centimeter and Millimeter Wave, IEEE J. Sel. Top. Appl., 12, 1697–1708, 2019.
Bonifazi, C., Ruggieri, M., Pratesi, M., Salome, A., Varacalli, G., Paraboni, A., and Saggese, E.: The DAVID satellite mission of the Italian Space Agency: High rate data transmission to Internet at W and Ka bands, IEEE International Conference on, vol. 5. IEEE, pp. 3022–3026, 2002.
Cianca, E., Rossi, T., Yahalom, A., Pinhasi, Y., Farserotu, J., and Sacchi, C.: EHF for Satellite Communications: The New Broadband Frontier, P. IEEE, 99, 1858–1881, 2011.
Cimini, D., Westwater, E. R., Han, Y., and Keihm, S. J.: Accuracy of Ground-based Microwave Radiometer and Balloon-Borne Measurements During WVIOP2000 Field Experiment, IEEE T. Geosci. Remote, 41, 2605–2615, 2003.
Cimini, D., Hewison, T. J., Martin, L., Güldner, J., Gaffard, C., and Marzano, F. S.: Temperature and humidity profile retrievals from ground-based microwave radiometers during TUC, Meteorol. Z., 15, 45–56, https://doi.org/10.1127/0941-2948/2006/0099, 2006.
Cimini, D., Rosenkranz, P. W., Tretyakov, M. Y., Koshelev, M. A., and Romano, F.: Uncertainty of atmospheric microwave absorption model: impact on ground-based radiometer simulations and retrievals, Atmos. Chem. Phys., 18, 15231–15259, https://doi.org/10.5194/acp-18-15231-2018, 2018.
Cimini, D., Luini, L., Alyosef, A., Marzano, F. S., Riva, C., Di Paola, F., Romano, F.: Are microwave profilers useful to improve atmospheric attenuation estimates for radio propagation purposes?, 11th International Symposium on Tropospheric Profiling, Toulouse (France), 20–24 May 2019, 2019.
Cimini, D., Haeffelin, M., Kotthaus, S., Löhnert, U., Martinet, P., O'Connor, E., Walden, C., Collaud Coen, M., and Preissler, J.: Towards the profiling of the atmospheric boundary layer at European scale–introducing the COST Action PROBE, Bull. of Atmos. Sci. & Technol., 1, 23–42, https://doi.org/10.1007/s42865-020-00003-8, 2020.
Emrick, R., Cruz, P., Carvalho, N. B., Gao, S., Quay, R., and Waltereit P.: The Sky's the Limit: Key Technology and Market Trends in Satellite Communications, IEEE Microw. Mag., 15, 65–78, 2014.
Han, Y. and Westwater, E. R.: Analysis and improvement of tipping calibration for ground-based microwave radiometers, IEEE T. Geosci. Remote, 38, 1260–1276, 2000.
Hidalgo, B. and Goodman M.: Multivariate or multivariable regression?, Am. J. Public Health, 103, 39–40, https://doi.org/10.2105/AJPH.2012.300897, 2013.
Janssen, M. A.: Atmospheric Remote Sensing by Microwave Radiometry, 1st edition, Wiley, New York, 1993.
Jebrill, A., Lucente, M., Re, E., Rossi, T., Ruggieri, M., Sacchi, C., and Dainelli, V.: Perspectives of W-Band for space communications, in: IEEE Aerospace Conference, 3–10 March 2007, Big Sky, MT, USA, 1–12, https://doi.org/10.1109/AERO.2007.352936, 2007.
Liebe, H. J.: MPM – An atmospheric millimeter wave propagation model, Int. J. Infrared Milli., 10, 631–650, https://doi.org/10.1007/BF01009565, 1989.
Luini, L., Riva, C., Nebuloni, R., Mauri, M., Nessel, J., and Fanti, A.: Calibration and use of microwave radiometers in multiple-site EM wave propagation experiments, 12th European Conference on Antennas and Propagation (EuCAP 2018), 9–13 April 2018, London, 1–5, https://doi.org/10.1049/cp.2018.0906, 2018.
Martellucci A.: Total Water Vapour and Cloud liquid Retrieval coefficients for Radiometric Measurements in Cabauw, ESA Technical Note TEC-EEP/2007144 ver. 1.0, The Netherlands, 2007.
Martner, B. E., Wuertz, D. B., Stankov, B. B., Strauch, R. G., Westwater, E. R., Gage, K. S., Ecklund, W. L., Martin, C. L., and Dabberdt, W. F.: An evaluation of wind profiler, RASS, and microwave radiometer performance, B. Am. Meteorol. Soc., 74, 599–616, 1993.
Marzano, F. S., Fionda, E., and Ciotti, P.: A neural network approach to precipitation intensity and extinction retrieval by ground-based passive microwave technique, J. Hydrol., 328, 121–131, https://doi.org/10.1016/j.jhydrol.2005.11.042, 2006.
Marzano, F. S.: Predicting antenna noise temperature due to rain clouds at microwave and millimeter-wave frequencies, IEEE T. Antenn. Propag., 55, 2022–2031, 2007.
Mattioli, V., Marzano, F. S., Pierdicca, N., Capsoni, C., and Martellucci A.: Modeling and predicting sky-noise temperature of clear, cloudy, and rainy atmosphere from X-to W-band, IEEE T. Antenn. Propag., 61, 3859–3868, 2013.
Riva, C., Capsoni, C., Luini, L., Luccini, M., Nebuloni, R., and Martellucci A.: The challenge of using the w band in satellite communication, Int. J. Satell. Comm. N., 32, 187–200, 2014.
Rosenkranz, P. W.: Line-by-line microwave radiative transfer (non-scattering), Remote Sens. Code Library, https://doi.org/10.21982/M81013, 2017.
Salonen, E. and Uppala W.: New prediction method of cloud attenuation, Electron. Lett., 27, 1106–1108, 1991.
Schroeder, J. A. and Westwater, E. R.: User's guide to WPL microwave radiative transfer software, Nat. Ocean. Atmos. Admin., NOAA Technical Memorandum, ERL WPL-213, Boulder, CO, 1991.
Ulaby, F. T. and Long, D. G.: Microwave radar and radiometric remote sensing, Univ. Of Michigan Press, Ann Arbor, Mich, ISBN: 9780472119356, 2014.
- Abstract
- Introduction
- Methodology
- Dataset and implementation
- Results
- Conclusions
- Appendix A: Coefficients for multivariate multiple linear regression
- Code and data availability
- Author contributions
- Competing interests
- Special issue statement
- Acknowledgements
- Financial support
- Review statement
- References