the Creative Commons Attribution 4.0 License.
the Creative Commons Attribution 4.0 License.
 | 26 Apr 2021
Ground-based temperature and humidity profiling: combining active and passive remote sensors
Ulrich Löhnert
Thermodynamic profiles in the planetary boundary layer (PBL) are important observations for a range of atmospheric research and operational needs. These profiles can be retrieved from passively sensed spectral infrared (IR) or microwave (MW) radiance observations or can be more directly measured by active remote sensors such as water vapor differential absorption lidars (DIALs). This paper explores the synergy of combining ground-based IR, MW, and DIAL observations using an optimal-estimation retrieval framework, quantifying the reduction in the uncertainty in the retrieved profiles and the increase in information content as additional observations are added to IR-only and MW-only retrievals.
This study uses ground-based observations collected during the Perdigão field campaign in central Portugal in 2017 and during the DIAL demonstration campaign at the Atmospheric Radiation Measurement Southern Great Plains site in 2017. The results show that the information content in both temperature and water vapor is higher for the IR instrument relative to the MW instrument (thereby resulting in smaller uncertainties) and that the combined IR + MW retrieval is very similar to the IR-only retrieval below 1.5 km. However, including the partial profile of water vapor observed by the DIAL increases the information content in the combined IR + DIAL and MW + DIAL water vapor retrievals substantially, with the exact impact vertically depending on the characteristics of the DIAL instrument itself. Furthermore, there is a slight increase in the information content in the retrieved temperature profile using the IR + DIAL relative to the IR-only; this was not observed in the MW + DIAL retrieval.
- Article
(1849 KB) - Full-text XML
- BibTeX
- EndNote


High-temporal-resolution thermodynamic profiles in the planetary boundary layer (PBL) are needed for a wide range of research and operational weather forecasting needs (Wulfmeyer et al., 2015). For example, the vertical distribution of water vapor and temperature changes markedly over the diurnal cycle, the passage of synoptic features such as frontal boundaries and dry lines can cause very rapid changes in the thermodynamic structure of the PBL and the evolution of convective weather with evaporation-driven cold pools impacts both the temperature and humidity profiles and feeds back on the storm's evolution. Indeed, a large number of groups have called for improvements in thermodynamic profiling in the PBL, and the establishment of ground-based networks to provide these datasets to the atmospheric science community (e.g., Dabberdt et al., 2005; NRC, 2009).
Progress is being made, albeit perhaps slowly. There are a large number of case studies using PBL thermodynamic-profiling systems to gain insight into how the convective properties of the atmosphere change (e.g., Feltz et al., 2003; Cimini et al., 2015; Bluestein et al., 2017; Toms et al., 2017; Mueller et al., 2017), analyses of long time series to show the capability of these systems (Löhnert and Maier, 2012; Wagner et al., 2008), and utility for improving short-term nowcasts and forecasts (e.g., Cimini et al., 2011; Caumont et al., 2016; Hu et al., 2019; Coniglio et al., 2019).
In Europe, there are a large number of microwave radiometers that are being characterized and assimilated (experimentally) into numerical weather prediction models (Cimini et al., 2018; De Angelis et al., 2017). Activities in the US have focused primarily on field campaigns and the Plains Elevated Convection at Night (PECAN; Geerts et al., 2017) in particular, which deployed a small network of six infrared spectrometers in the central US. The PECAN observations are being used to study a range of atmospheric phenomena both observationally (e.g., Gasmick et al., 2018; Loveless et al., 2019) and via use in numerical weather prediction models (Johnson et al., 2018; Degelia et al., 2019).
However, these different ground-based remote sensors have generally not been collocated, which makes evaluating the relative differences in the information content of the observations difficult. This paper takes advantage of two field campaigns where multiple ground-based remote sensing systems were collocated to evaluate the relative strengths and weaknesses of these different observations for thermodynamic profiling in the PBL. The two campaigns are Perdigão, which occurred in central Portugal in May–June of 2017 (Fernando et al., 2019), and a campaign at the Department of Energy's Atmospheric Radiation Measurement (ARM) Southern Great Plains site (Sisterson et al., 2016) in May–June 2017 to compare a newly developed broadband differential absorption lidar for water vapor profiling with other instruments (Newsom et al., 2020).
While there are many different instruments that could be included in this analysis, we focus on four instruments that have been demonstrated to run operationally in unattended modes for weeks or longer and either already are or will likely soon become commercially available. Two of these instruments are passive remote sensors (i.e., they do not transmit electromagnetic energy to the atmosphere), while two are active remote sensors.
2.1 Microwave radiometer
One type of passive thermodynamic profiler is a microwave radiometer (MWR). MWRs used for thermodynamic profiling typically have multiple channels along the high-frequency side of the 22.2 GHz water vapor absorption line (i.e., from 22.2 to 31 GHz) and on the low-frequency side of the 60 GHz oxygen absorption complex (i.e., from 51 to 60 GHz). Height-dependent pressure broadening of the water vapor line allows the retrieval of a coarsely resolved water vapor profile, whereas temperature profile information is obtained from the frequency-dependent optical depth. Generally speaking, the more transparent frequencies provide information through a deeper portion of the atmosphere, and the optically thick channels provide information closer to the MWR. Oxygen is well mixed in the atmosphere, and its concentration is known; thus the downwelling radiance observed in the channels that are primarily sensitive to oxygen can be used to infer the temperature profile. Water vapor concentration profiles can be determined from the channels that have sensitivity to water vapor after the temperature profile is known. However, there is some level of absorption due to oxygen in the 22–31 GHz range and water vapor in the 51–60 GHz range, so retrieval methods need to account for this “cross-talk” and provide some estimate of the correlated errors in the retrieved profiles.
Table 1Important specifications of the instruments used in this paper.
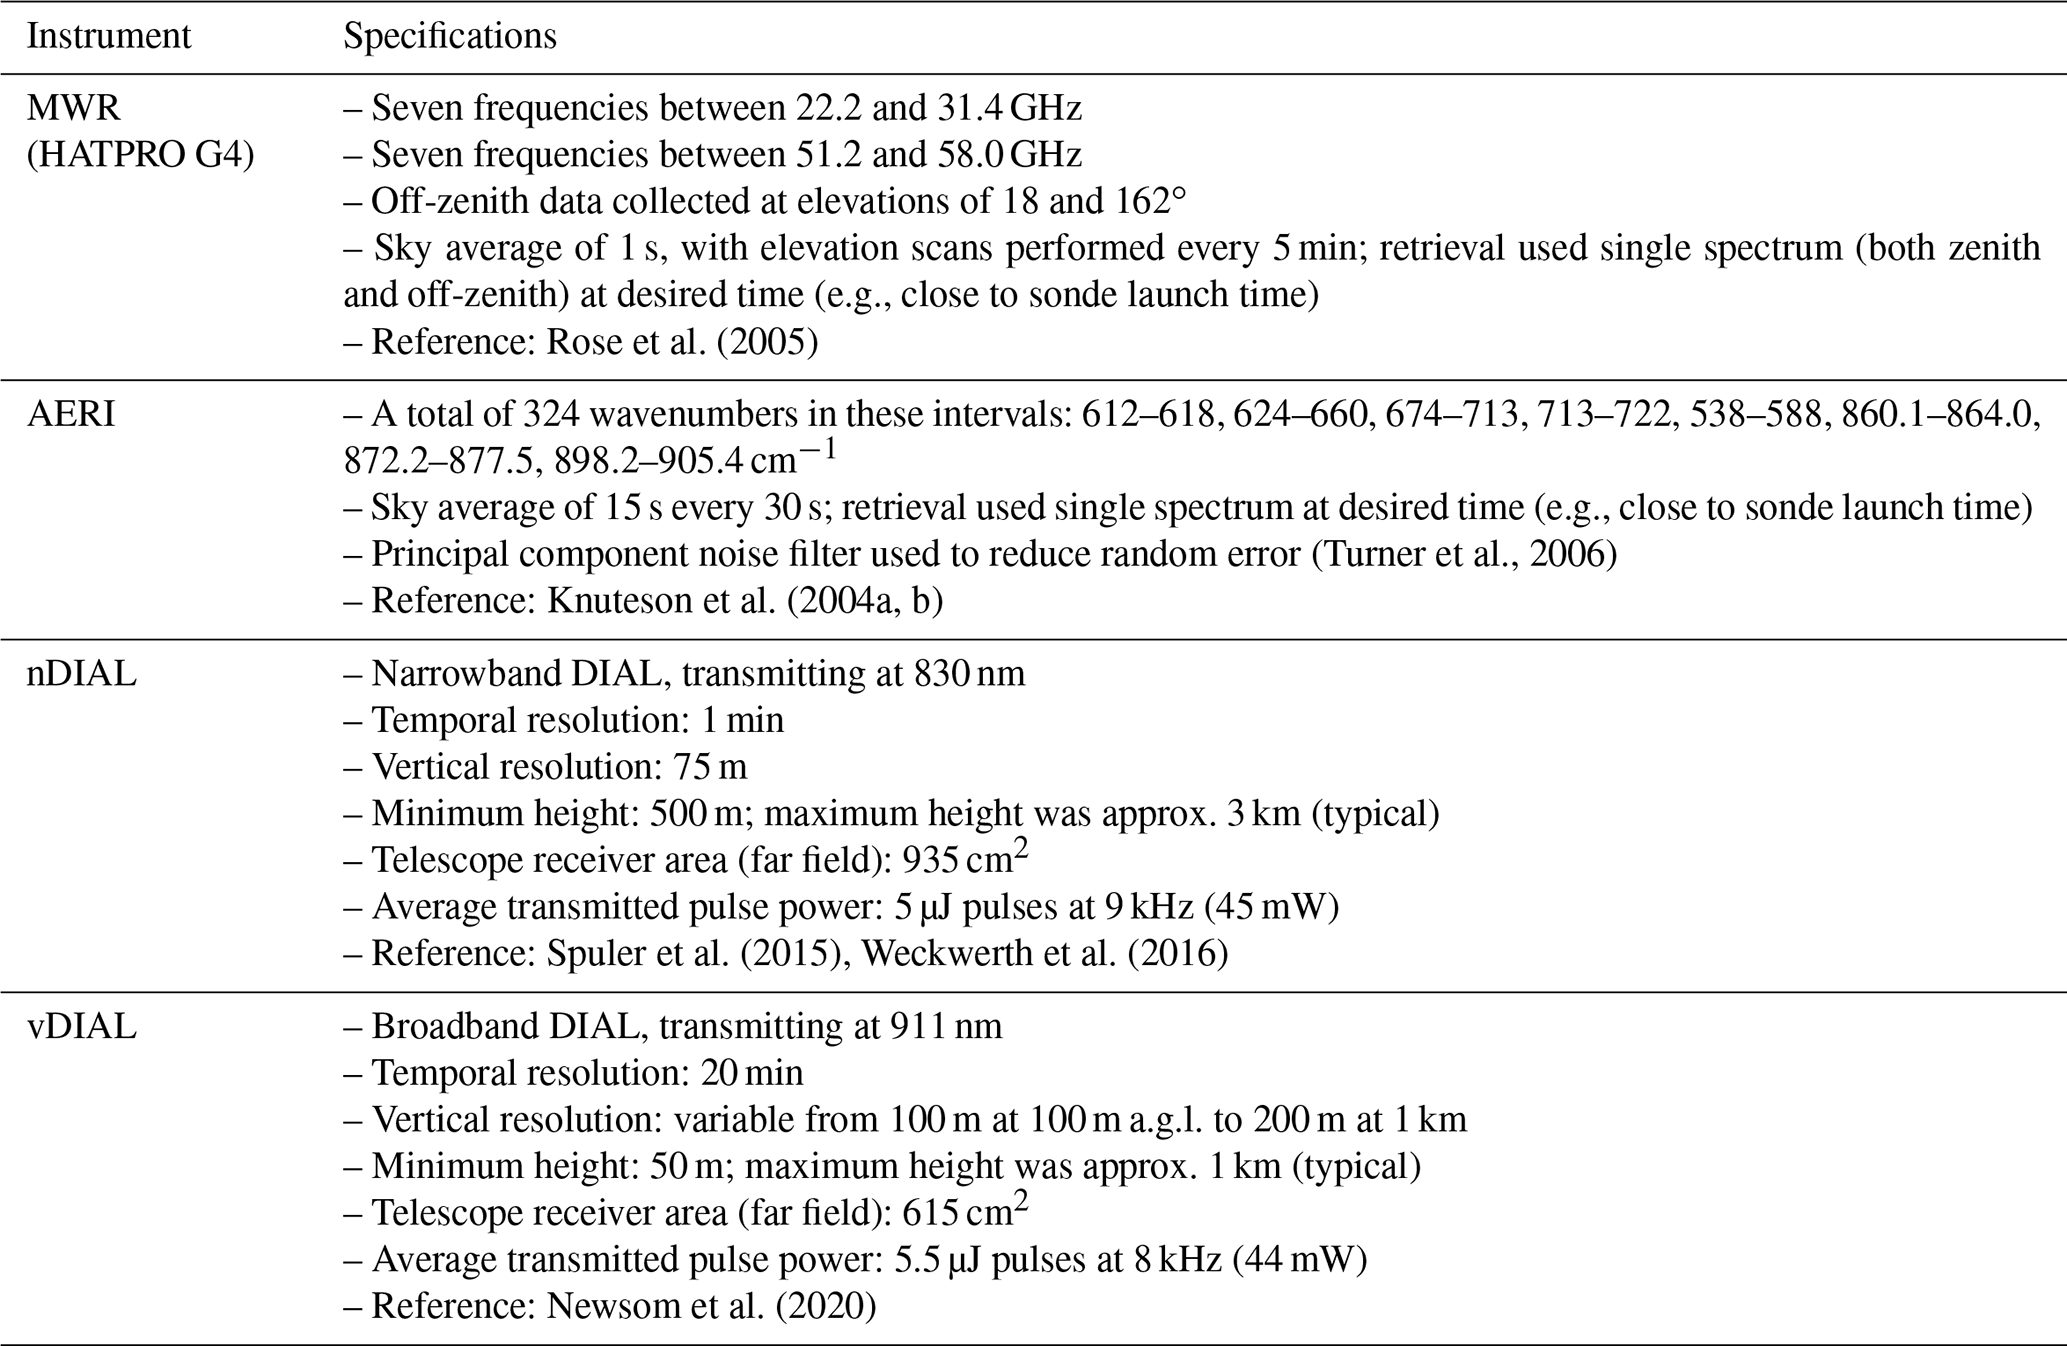
For this study, we used a 14-channel Humidity and Temperature Profiling (HATPRO) microwave radiometer (Rose et al., 2005). This is a fourth-generation system, which is part of the Collaborative Lower Atmospheric Mobile Profiling System (CLAMPS; Wagner et al., 2019). The instrument specifications are given in Table 1. The radiometric uncertainty in these observations was determined via a time series analysis of the observed brightness temperatures when the atmosphere could be assumed to be quasi-stationary. These values are provided in Table 1. These radiometric uncertainties are assumed to be uncorrelated between the different channels.
2.2 AERI
The second passive remote sensor studied here is the Atmospheric Emitted Radiance Interferometer (AERI). The AERI is a Fourier transform spectrometer designed to measure infrared radiation emitted by the atmosphere between 3.3 and 19 µm in wavelength (3000 to 520 cm−1) with a spectral resolution of 0.5 cm−1. The AERI was designed specifically for the Department of Energy's Atmospheric Radiation Measurement (ARM) program (Knuteson et al., 2004a, b; Turner et al., 2016a). Its specifications can also be found in Table 1.
The radiometric uncertainty in the AERI observations is derived from the imaginary component of the AERI's calibration equation (Revercomb et al., 1988), and thus the noise spectrum can be derived for each sky observation period. Turner and Blumberg (2019) have demonstrated that the radiometric noise in the AERI observations is spectrally uncorrelated.
2.3 NCAR water vapor DIAL
Water vapor differential absorption lidar (DIAL) works by transmitting pulsed laser energy at two wavelengths, one of which is selected to have markedly higher water vapor absorption than the other. These two frequencies are typically referred to as the online and offline frequencies. If the two wavelengths are spectrally close to each other (e.g., within a nanometer in wavelength), then many of the terms that describe the ratio of the strength of the backscattered signals cancel out. The ratio of the online to offline return signals is directly related to the water vapor concentration profile.
The National Center for Atmospheric Research (NCAR) has developed a micropulse water vapor DIAL. The approach used by this lidar is the so-called “narrowband DIAL” approach, wherein the laser emits monochromatic pulses of energy. Thus, because the characteristics of the absorption line are well known, the method is self-calibrating, and no external calibration source is needed. Narrowband DIAL systems require extremely high spectral purity in the outgoing laser as subtle changes in the wavelength (especially for the online channel), even for a small number of laser pulses in the averaging window, can introduce biases in the derived water vapor profile because the incorrect absorption cross-section is used in the derivation.
The laser in the NCAR DIAL, henceforth called the nDIAL, emits low pulse energies at a high pulse repetition rate (Spuler et al., 2015). The outgoing laser beam is expanded by a portion of the primary telescope, which makes the lidar system eye-safe. The nDIAL system has its origins at Montana State University (MSU), wherein commercially available laser diodes developed for telecommunications were used as the laser source (Nehrir et al., 2012), and MSU continues to collaborate with the NCAR to advance the nDIAL technology. A single photon counting detector is used to detect the backscattered signals in both the online and offline channels. High-transmission, narrowband interference filters are used to reject energy (e.g., solar background) outside the desired frequency range of the desired signals. The technical details of this system are provided in Table 1.
The signal-to-noise ratio (SNR) in DIAL systems is strongly dependent upon the strength of the backscattering signal as a function of range. Aerosol particles provide an efficient scattering source, and because aerosol concentration decreases markedly above the top of the PBL, the SNR also drops sharply above this level. However, the actual range wherein the lidar makes good water vapor measurements is a function of the pulse energy, the efficiency of the detector system (e.g., size of the telescope, transmission of the detection optics, sensitivity of the detector), and the vertical profiles of both the aerosol and water vapor concentrations. For this study, the backscattered-photon data were co-added (i.e., photons were accumulated) for 1 min before deriving the water vapor profile.
Virtually all lidar systems have difficulties accurately measuring atmospheric properties close to the lidar itself. Ultimately, this is due to a mismatch between the outgoing laser beam and the detector and leads to a systematic error that varies with height. This systematic error reduces to zero at some range, and the region where the error is nonzero is referred to as the “overlap” region. For many lidar systems, an empirically determined correction can be applied to reduce the maximum range of the nonzero overlap error. For the current version of the nDIAL, approximately the lowest 500 m suffers from a varying overlap correction (S. Spuler, personal communication, 2019) and thus is not used in this analysis.
The uncertainty in the nDIAL observations is directly calculated by assuming that the detected backscatter signal follows a Poisson distribution and propagating the uncertainty in the backscatter profile through the DIAL equation. A similar approach was used for the Southern Great Plains (SGP) Raman lidar, and the noise estimate derived from Poisson statistics agrees with that derived using an autocovariance analysis (Turner et al., 2014).
The nDIAL has been deployed in a number of different field campaigns. In particular, the water vapor profile observed by the nDIAL has been compared to water vapor profiles measured by radiosondes and independently retrieved from collocated AERI and MWR systems (Weckwerth et al., 2016). These comparisons demonstrate that the nDIAL agrees well with these other sensors (e.g., the bias error relative to radiosondes is less than 0.3 g m−3) and has no significant day vs. night differences in sensitivity (e.g., due to solar background). In 2018, NCAR constructed four additional units (bringing the total number of nDIAL systems to five), which were deployed in a network configuration at the Department of Energy's Atmospheric Radiation Measurement (ARM) SGP site (Sisterson et al., 2016) from April through July 2019.
2.4 Vaisala water vapor DIAL
Vaisala is also developing a micropulse water vapor DIAL (henceforth called the vDIAL). This lidar system is based upon the CL51 ceilometer design, a ceilometer used operationally around the world. Unlike the nDIAL, the vDIAL transmits a spectrally broad pulse of laser energy that encompasses several water vapor absorption lines (“online channel”) and in a nearby spectral window with no absorption lines (“offline”). This approach is less technically demanding on the laser specifications (e.g., the requirement for high spectral purity is much smaller), but the tradeoff is that the measurement is no longer self-calibrating (Newsom et al., 2020). For this particular broadband DIAL implementation, the reference measurement is a well-calibrated surface-level in situ sensor integrated into the DIAL, and measurements from this sensor are used in an iterative-retrieval approach to derive the water vapor profile (Newsom et al., 2020).
The vDIAL actually consists of two independent broadband DIAL systems integrated together. The first system has a wide field of view, thereby resulting in a very small overlap region and allowing the lidar to profile water vapor down to 50 m a.g.l. (above ground level). However, this wide field of view results in additional solar background photons, and the SNR decreases very rapidly with range. The second system has a much narrower field of view, which results in a deeper overlap region but also enables the lidar to profile water vapor much higher. Cross-talk between the two independent systems is eliminated by operating one system for 5 s and then operating the other for the next 5 s. The water vapor profiles are derived independently for the wide and narrow field-of-view systems, and then they are merged linearly between 300 and 400 m. Additional details on this system are provided in Newsom et al. (2020).
The vDIAL system uses analog detection, and thus the uncertainties in the backscatter do not follow a Poisson distribution like in the nDIAL. Instead, the uncertainties in the vDIAL water vapor profile are estimated by deriving water vapor profiles every 2 min and computing the standard deviation from these data at each height across a 20 min window to provide the uncertainty in the standard 20 min average water vapor profile.
The vDIAL system was deployed to the ARM SGP in May–June 2017, where it was compared against water vapor profiles observed by the ARM Raman lidar (Turner et al., 2016b; Turner and Goldsmith, 1999) and radiosondes and retrieved from the AERI.
Passive spectral radiometers, such as MWRs and AERIs, measure radiance, and thermodynamic profiles must be retrieved from these observations. However, this is an ill-posed problem as there could exist multiple solutions (e.g., different thermodynamic profiles) that would yield the observed radiance. Thus, the retrieval algorithm must incorporate additional information to constrain the solution to a potentially valid solution. Here, we have elected to use the optimal-estimation approach (Rodgers, 2000; Maahn et al., 2020), which is a one-dimensional variational method. We have modified the AERIoe optimal-estimation retrieval algorithm (Turner and Löhnert, 2014) to use AERI and/or MWR data, together with an a priori dataset that specifies how temperature and humidity covary with height, as input. This algorithm has already been modified to include additional observations, such as water vapor lidars (Turner and Blumberg, 2019), and thus in these cases the retrieval is finding the temperature and humidity profiles that satisfy both the observed radiance and the (partial) profile of water vapor observed by the DIAL simultaneously.
We desire to retrieve the thermodynamic profile X, i.e., both the temperature and humidity profile, so , where Ti and qi are the temperature and water vapor mixing ratio in the ith vertical bin. We refer to Xn as the state vector on the nth iteration. The observations from the AERI, MWR, and DIALs form the observation vector Y. A forward model F is used to compute a pseudo-observation F(X), which is then compared with Y. If they disagree, then the state vector is modified to provide a new estimate (Xn+1) following
where K is the Jacobian of F, Xa is the mean a priori, and Sa is the covariance matrix of the a priori dataset (see Sect. 3.2). Sϵ denotes the combined forward model and observation error covariance matrix. The observation error for the single instruments is considered as described in the subsection of Sect. 2, and the forward model uncertainty is discussed in Sect. 3.1. The superscripts T and −1 denote matrix transpose and matrix inverse, respectively. Because F is moderately non-linear in X, optimal estimation is formulated as an iterative method, where the subscript n indicates the iteration number; for our studies, we typically start with X0=Xa. The scalar γ is used to stabilize the retrieval when n is small to improve the convergence rate and decreases to unity as n increases; the description of how γ is used is explained in Turner and Löhnert (2014). Note that due to the non-linearity of the forward models applied for the microwave and infrared radiative transfer, the Jacobians are required to be recomputed for each iteration. We continue to iterate Eq. (1) until
where m is the dimension of Y.
3.1 Forward models
As shown by Eq. (1), a forward model is needed to transform the current state vector Xn into the observational domain so it can then be compared to the observation vector Y. In this study, four different forward models are used (one for each instrument).
For the passive radiometers, the forward models are line-by-line radiative transfer models. The monochromatic MonoRTM radiative transfer model (Clough et al., 2005; Payne et al., 2011) is used to simulate MWR observations, and the line-by-line radiative transfer model LBLRTM (Clough and Iacono, 1995; Mlawer and Turner, 2016) is used to simulate the AERI. In the latter, the monochromatic spectra are convolved with a top hat function in the time domain and then transformed to the spectral domain via a Fourier transform; this applies the AERI's line shape function to the calculation. The vertical grid used in these calculations is specified by the a priori data. The pressure profile is computed from the temperature and humidity data from the current state vector using the hypsometric equation. The spectral regions used in the retrieval are given in Table 1. In the infrared, many trace gases have absorption bands, and while the spectral regions used in the retrieval are primarily sensitive to water vapor and carbon dioxide (where the latter provides the sensitivity to temperature), there are minor contributions to the downwelling radiance by other gases. We utilize the US Standard Atmosphere to provide profiles of these other trace gases for this study, but our results are insensitive to this choice.
To incorporate the DIAL data into Eq. (1), a forward model is needed for each lidar also. The purest forward model would simulate the profiles of backscatter energy that would be observed in both the on and offline channels for a given water vapor profile. We could have also used the profile of differential optical depth between range bins as our observation. However, we have elected to use the derived water vapor concentration from each lidar in the observation vector. This results in a trivial forward model for each lidar: essentially, the forward model just converts water vapor mixing ratio to water vapor number concentration for the nDIAL. The output of the vDIAL is water vapor mixing ratio so that forward model is just the unity function.
3.2 The a priori dataset
There has been only one campaign that had an AERI, HATPRO, and water vapor DIAL collocated with each other: the Perdigão campaign that was held in Portugal from 1 May to 15 June 2017 (Fernando et al., 2019). We specified a 48-level vertical grid for the retrievals, starting at 0 m a.g.l. with the next level at 10 m a.g.l., and each subsequent height bin is 10 % thicker than the previous one. Although ∼ 150 radiosondes were launched during Perdigão, these are not enough to accurately compute the level-to-level covariance for the 96-element state vector (i.e., X has 48 levels for temperature and 48 for water vapor). Therefore, we used 1571 radiosondes launched in the months of April, May, June, and July over the last decade by the Portuguese weather service at Lisbon to compute Xa and Sa. This a priori information was used in all of the retrievals shown here.
The vDIAL was not part of the Perdigão deployment, so we use AERI and vDIAL data collected between 15 May and 12 June 2017 at the SGP site instead. Both the Perdigão and SGP datasets used here were collected in the spring, but the SGP climatology is different than that in Portugal, necessitating the use of a different a priori dataset. We have used over 2000 radiosondes launched at SGP during the months of April, May, and June over the past decade to derive the a priori information for this site.
3.3 Characterizing the information content in the retrieved profile
One advantage of the optimal-estimation framework is that the uncertainties in the retrieval, which include contributions from both the uncertainties in the observations and a priori as well as the sensitivity of the forward model, are a direct output of the framework. If the “optimal” solution is Xop, which is the solution after both γ=1 and Eq. (2) indicate that the solution has converged after nc iterations, then the covariance of the optimal solution is given by
We look at the square root of the diagonal elements of Sop to quantify how the 1σ uncertainties in the retrieved profiles change as different instrument combinations are used in the observation vector.
A second advantage of this method is that the averaging kernel A provides a direct estimate of the sensitivity of the retrieved profile at each height to perturbations at that height. This matrix is computed as
The diagonal components of A provide the degrees of freedom for signal (DFS; Rodgers, 2000) for each height in the retrieved profile. If the observations had very high information content at each level of the retrieved profile, then the diagonal elements of Sop would be small relative to the diagonal elements of the a priori, and thus the trace of A would approach the dimension of X. The total DFS, which are equal to the trace of A, provide a metric for how many independent pieces of information exist in the observation.
For this study, we recognize that the matrices A, Sop, and Sa really have four equal-sized quadrants that correspond to
We look at the portions of A and Sop that correspond to (T,T) and (q,q) independently. Furthermore, as we can see, the DFSs are typically much smaller than unity, so we look at the profile of the cumulative DFS (cDFS) as this allows us to quickly determine how many independent levels are below some specified height, which is advantageous when talking about where in the vertical the different instruments provide sensitivity to changes in temperature and water vapor.
We want to highlight that even though lidars make explicitly range-resolved measurements, their information content in the derived water vapor profile is not the same as the number of range bins. The actual information content at height z depends strongly on the noise level of the observation there. Even direct derivations of water vapor from lidar signals would benefit from being cast into a retrieval framework similar to what we have specified in Eq. (1) because then the a priori information could be used to constrain the derived water vapor when the instrument's SNR decreases (e.g., Sica and Haefele, 2016).
Several studies have demonstrated that ground-based thermodynamic retrievals in the PBL using only AERI observations have 2–4 times larger total DFS in both temperature and water vapor than retrievals that use only microwave data (Löhnert et al., 2009; Blumberg et al., 2015; Wulfmeyer et al., 2015). However, what is not known is how the information content changes when partial profiles of water vapor from a differential absorption lidar (since the DIAL observations extend only from the top of the region, where full overlap is achieved, to a height where its SNR becomes small) are included in a retrieval considering the synergy of AERI, MWR, and nDIAL or vDIAL. For example, does including a partial water vapor profile in the retrieval result in AERI + DIAL and MWR + DIAL having equivalent cDFS for water vapor? Does including a partial water vapor profile in a simultaneous retrieval of T(z) and q(z) (as we are doing here in Eq. 1) improve the temperature profile in any way?
Table 2Average uncertainty values (derived from Sop) at three levels for temperature and humidity for the different instrument combinations used in this study. The passive-only retrievals are highlighted in gray, whereas the active + passive are in white. The values in parentheses at 3 km show the 10th and 90th percentile at that height, thereby providing a measure of the amount of variability in these statistics for each retrieval.
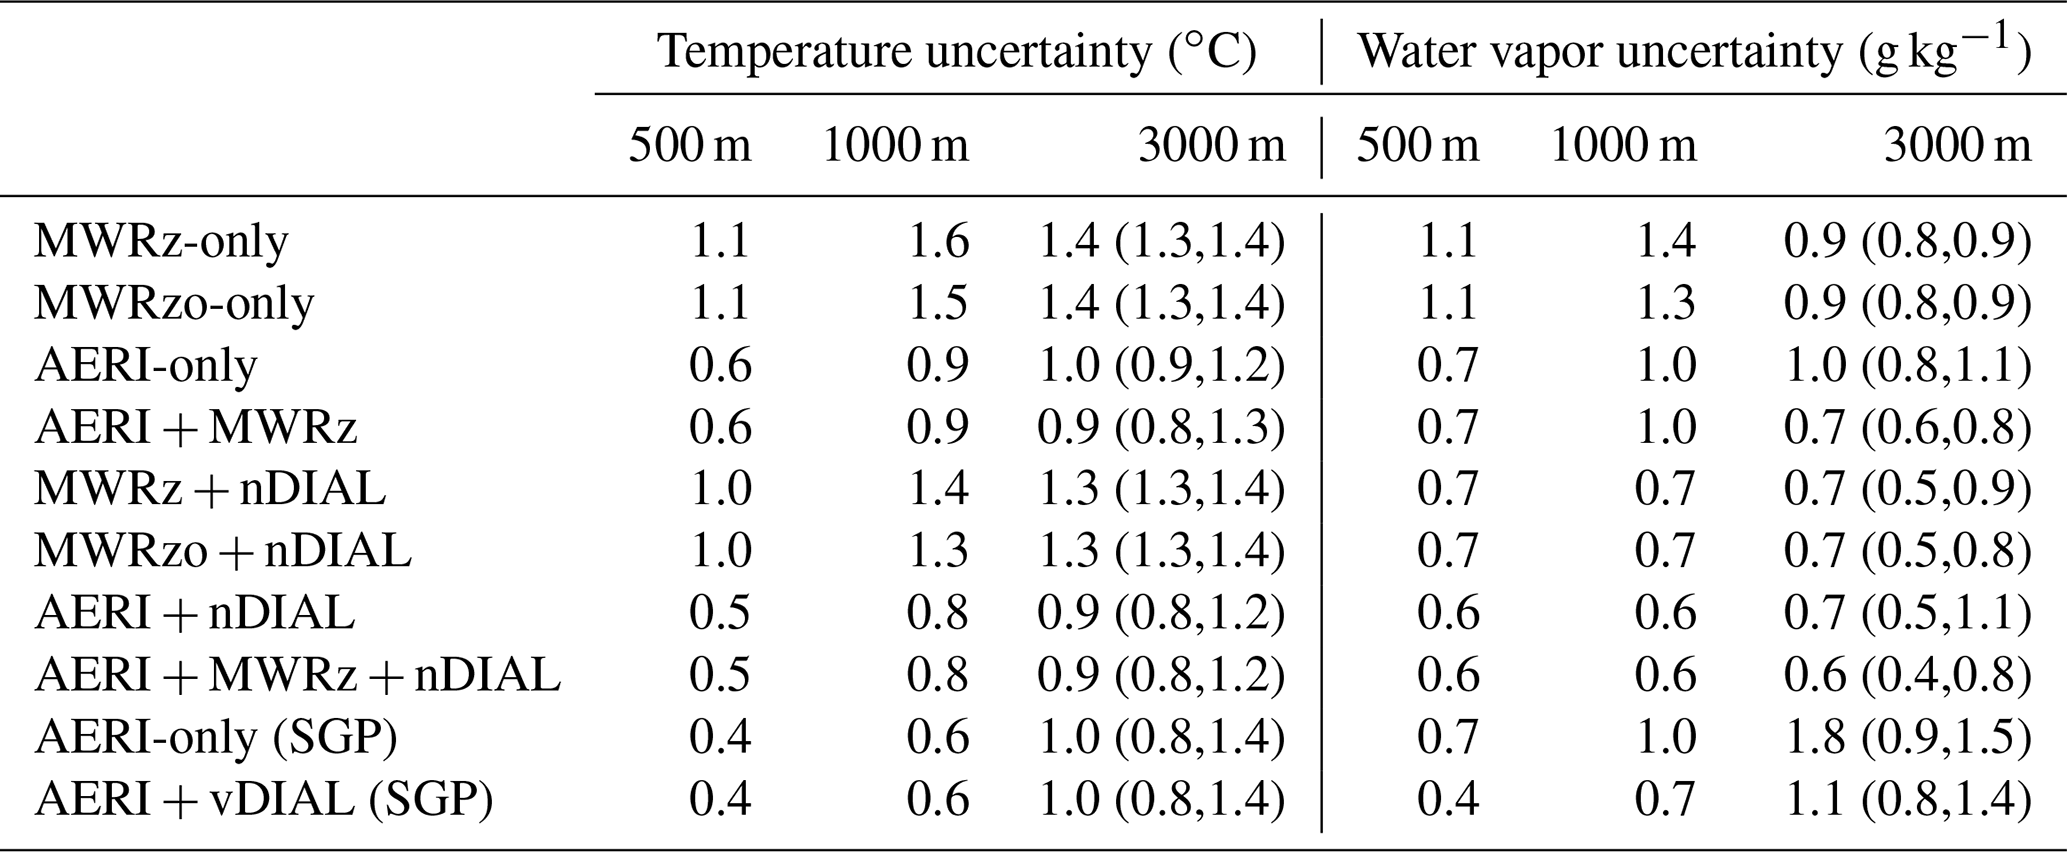
In order to answer these questions, we performed eight sets of retrievals using data from the Perdigão field campaign in Portugal (Table 2): four were using passive-only measurements (MWRz, MWRzo, AERI, and AERI + MWRz), and four included the nDIAL together with those passive measurements. “MWRz” denotes the case when only zenith-pointing MWR brightness temperature observations were used in the retrieval, whereas “MWRzo” denotes the case when both zenith and off-zenith (i.e., “oblique” elevation scans) are used. Crewell and Löhnert (2007) demonstrated that adding elevation scan observations at frequencies where the atmosphere is optically thick and assuming horizontal homogeneity of the PBL resulted in a marked increase in the information content and hence accuracy of the retrieved temperature profile. However, only observations made at frequencies above 55 GHz are used in these elevation scans. Even at low elevation angles, frequencies below 55 GHz are too transparent, and thus the assumption of horizonal homogeneity fails very frequently (Crewell and Löhnert, 2007).
As the vDIAL will soon be the first commercially available DIAL instrument for water vapor profiling (H. Winston, personal communication, 2019), a major objective is to evaluate how including this lidar dataset with passive observations changes the information content in the retrieved profiles. In addition, we show the impact of the vDIAL relative to the nDIAL on our retrievals. However, vDIAL (ARM SGP) and nDIAL (Perdigão) observations are only available at different locations with different a priori datasets. In order to overcome this issue, the comparisons were carried out in relation to the AERI instruments, which operated at both sites. The comparison of the AERI-only from ARM SGP and Perdigão allows us to characterize the impact of the prior on the retrievals since the two AERI instruments deployed in Portugal and at the SGP site have similar error characteristics (not shown). Ultimately, we have looked at the differences between the AERI-only and AERI + xDIAL retrievals (where x is either “v” or “n”) at the two sites.
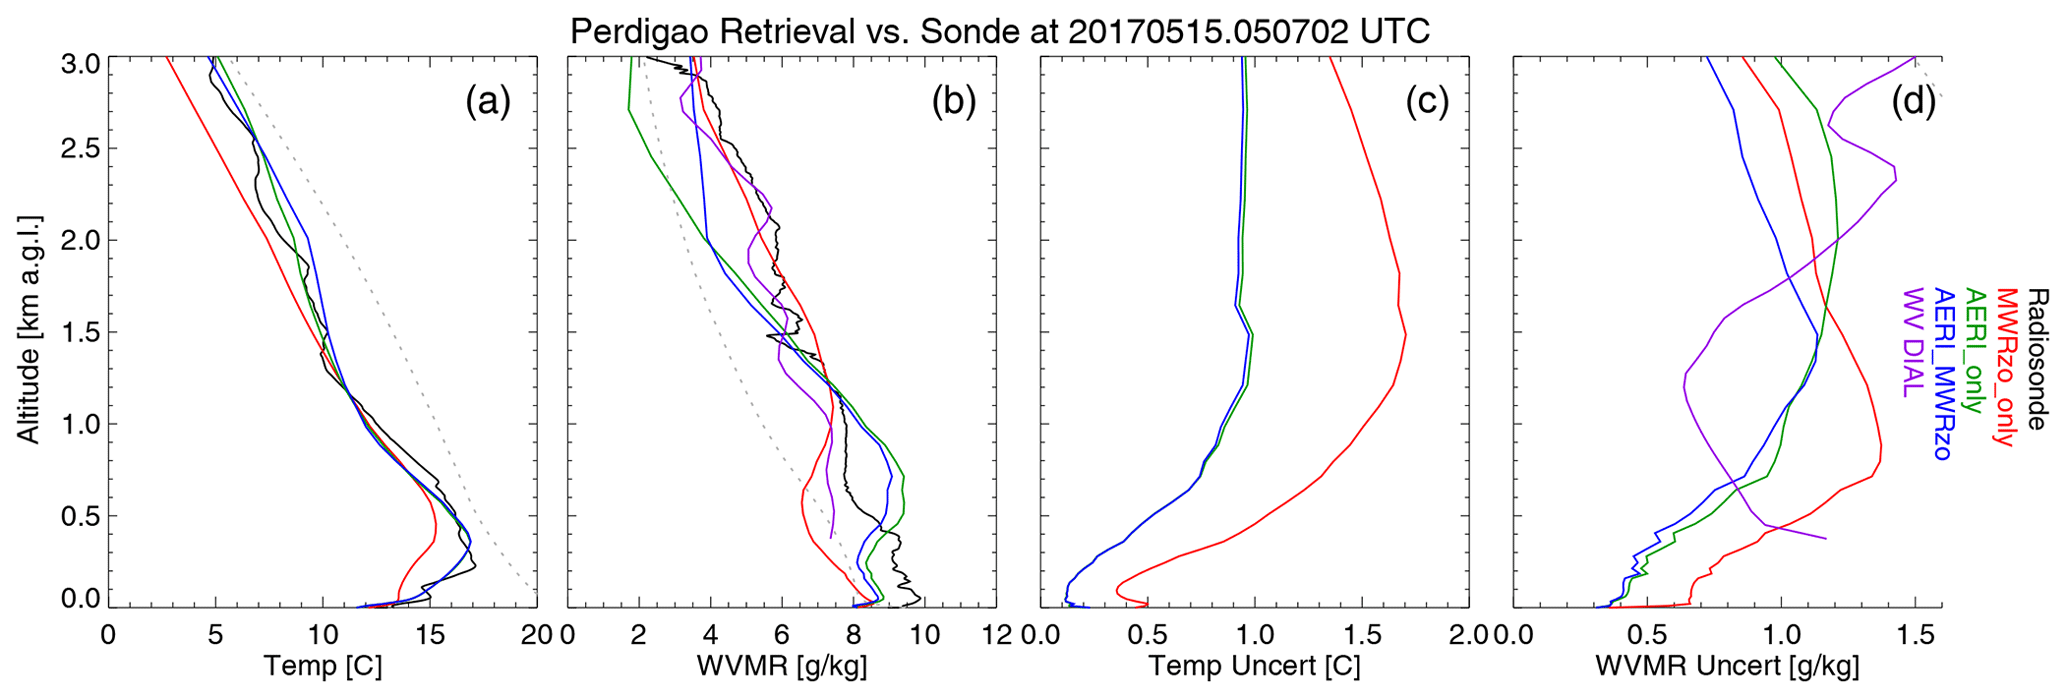
Figure 1The retrieved profiles of temperature (a) and water vapor (b), with the uncertainties in these profiles (c, d, respectively), for the passive-only retrievals with the MWRzo-only (red), AERI-only (green), and AERI + MWRzo (blue) on 05:07 UTC on 15 May 2017 during Perdigão. The collocated radiosonde temperature and water vapor profiles are shown in black in (a) and (b), respectively. The water vapor observed by the DIAL and its uncertainty are included in the figure, although it is not used in any of these retrievals. The dotted black lines in (a) and (b) are the mean prior profiles
4.1 Case study example
To illustrate the differences between the various passive-only and passive + active retrievals, we selected a case during Perdigão on 15 May 2017 at 05:07 UTC. This is a clear-sky event and is representative of the retrieval quality during the entire field campaign. Figure 1 shows the retrieved temperature (Fig. 1a) and water vapor mixing ratio (WVMR; Fig. 1b) and the associated 1σ uncertainties in each (Fig. 1c and d, respectively), derived from the square root of the diagonal of the retrieval error covariance Sop. The black line in Fig. 1a and b denote the coincident radiosonde, whereas the other colors denote the different passive-only retrievals.
All three passive-only retrievals (MWRzo, AERI, and AERI + MWRzo) identify the surface-based inversion, although the retrievals that include the AERI capture it more accurately (Fig. 1a). Furthermore, the retrievals that include the AERI are able to better match the radiosonde temperature observations above 1.5 km, whereas the MWRzo retrieval shows a bias at those altitudes. None of the three retrievals are able to capture the small-scale variability in the vertical observed by the radiosonde due to the relatively coarse vertical resolution of the retrievals. The uncertainties in the MWRzo temperature retrievals are about 50 % larger (or more) over the lowest 3 km relative to the AERI retrievals (Fig. 1c), which agrees qualitatively with the differences to the radiosonde seen in Fig. 1a.
The water vapor retrievals (Fig. 1b) show two basic vertical patterns: the MWRzo retrieval is markedly drier than the radiosonde below 1 km, whereas the AERI and AERI + MWRzo retrieval starts dry, then becomes too wet (between 500 and 1000 m), and then becomes drier than the radiosonde above 1500 m. Interestingly, the nDIAL water vapor profile is also drier than the radiosonde below 1500 m and agrees better with the MWRzo profile. However, the retrievals that use the AERI data have markedly smaller uncertainties than the MWRzo below 1.5 km; above that height, the uncertainty in the MWRzo is smaller than the AERI, although the AERI + MWRzo retrieval has the smallest uncertainties over the entire lowest 3 km, as would be expected for a variational retrieval method.

Figure 2Same as Fig. 1, except that the retrievals combine active and passive data with the MWRzo + DIAL (red), AERI + DIAL (green), and AERI + MWRzo + DIAL (blue). The water vapor observed by the DIAL and its uncertainty are included in the retrievals. See text for more details.
Including the nDIAL data above 500 m in the retrieval, thus finding a solution that simultaneously fits both the observed radiance and the partial WVMR profile of the DIAL within their uncertainties, yields the results shown in Fig. 2. The largest impact, not surprisingly, is on the retrieved water vapor profile (Fig. 2b). The inclusion of the nDIAL data forces the retrievals that also include the AERI to reduce the amount of water vapor between 500 and 1000 m (where the AERI-based retrievals were too wet in Fig. 1b), which has the impact of increasing the amount of water vapor in the AERI retrievals below 500 m (Fig. 2b), resulting in the AERI + nDIAL and AERI + MWRzo + nDIAL agreeing much better with the radiosonde. Between 800 and 1500 m, the MWR + nDIAL-retrieved profile is essentially the same as the nDIAL profile, suggesting that the MWR does not add any significant information to the DIAL's observation. The impact of the nDIAL data on the water vapor uncertainty profiles can clearly be seen in Fig. 2d, where all retrievals have a similar uncertainty above about 800 m, where the DIAL data are being used. Including the DIAL data in the retrievals has a minor impact on the retrieved temperature profiles as all three seem to agree a bit better qualitatively with the radiosonde above 1000 m (comparing Fig. 2a with Fig. 1a), and the 1σ uncertainties in temperature are slightly smaller (comparing Fig. 2c with Fig. 1c).
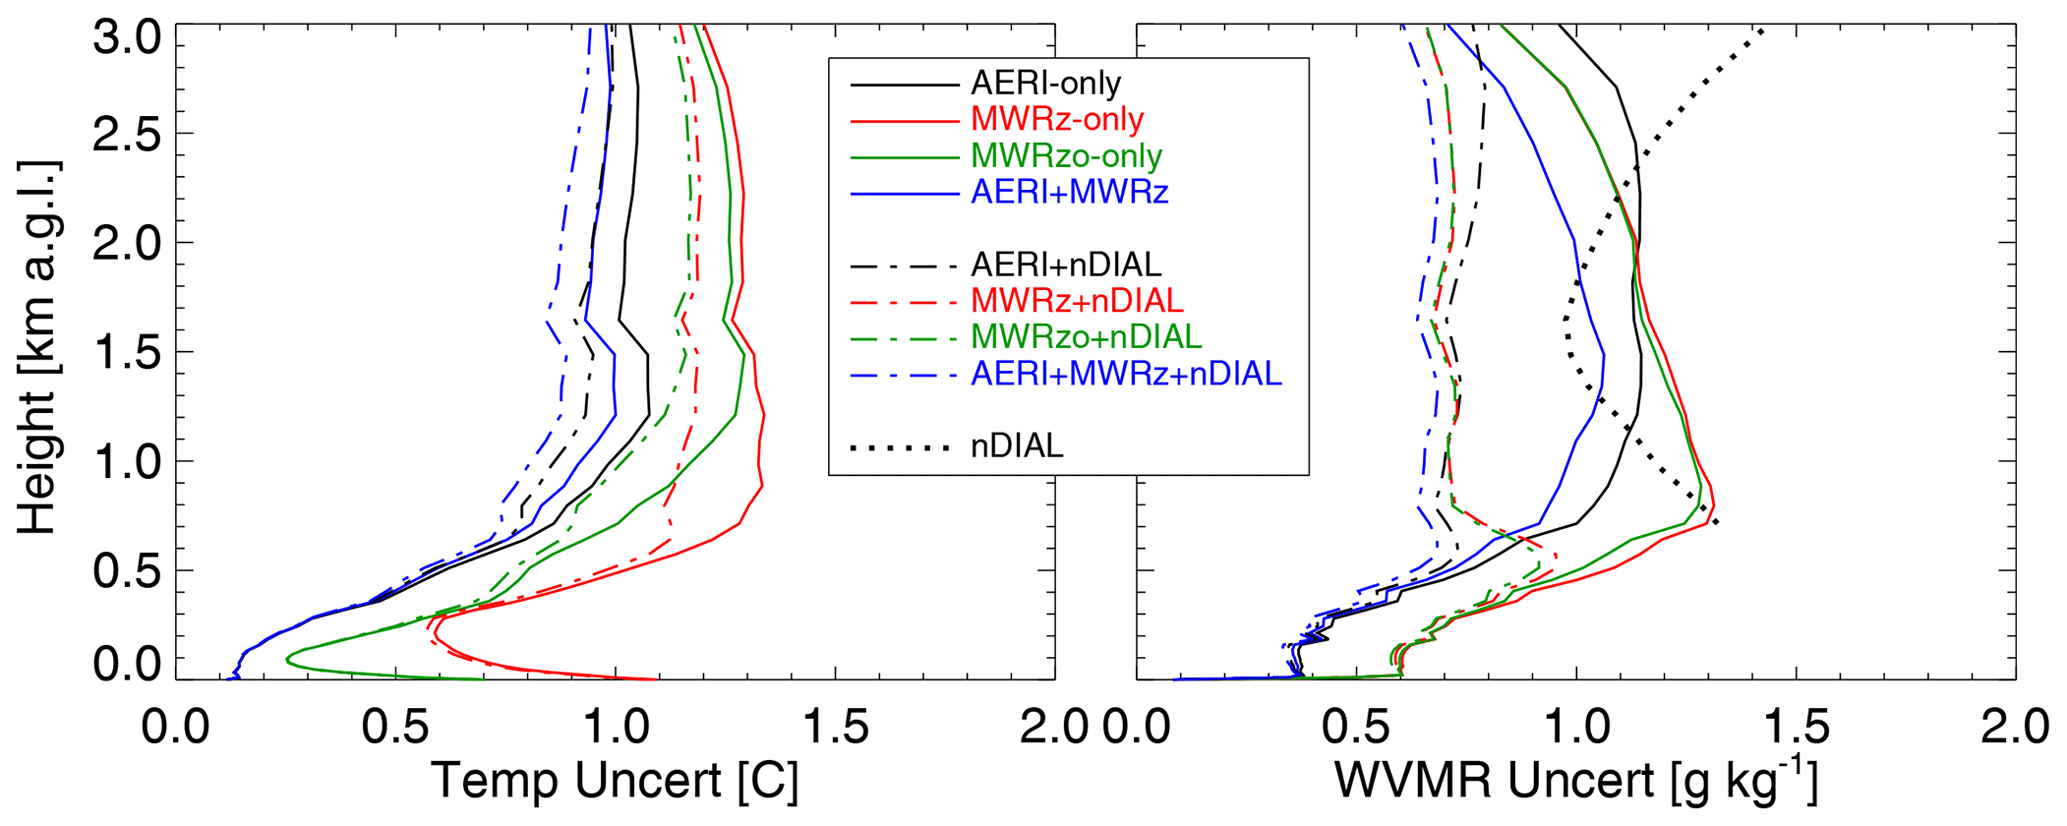
Figure 3The mean uncertainty in temperature (left) and water vapor mixing ratio (right) for passive-only (solid lines) and active + passive (broken lines) retrievals during Perdigão. The black dotted line is the mean uncertainty from the nDIAL.
4.2 Comparing mean uncertainty profiles
While the case study above may be representative, the quality of a retrieval (i.e., its uncertainty and information content) is case-specific. To provide a more complete picture of how the different passive-only and active + passive retrievals compare, we computed the mean 1σ uncertainty profiles from all of the retrievals performed during Perdigão as a wide range of environmental conditions (e.g., the surface temperature ranged from approximately 9 to 33 ∘C and the precipitable water vapor from 1.1 to 3.1 cm) were observed during the 5-week campaign. Figure 3 shows these mean uncertainty profiles for temperature (left) and water vapor (right) for the different passive-only (solid lines) and active + passive (broken lines), and Table 2 provides the mean values at three different heights.
Considering the passive-only retrievals, combining the AERI and MWR together has little impact on the resulting temperature retrieval in the lowest 3 km or on the water vapor retrieval below 1.5 km compared to the AERI-only retrieval. However, the MWRz and MWRzo outperform the AERI for water vapor above 2 km. Most strikingly, the benefit of the passive-retrieval synergy can be seen for water vapor above 1.5 km, where the improvement is up to 30 % compared to the single-sensor retrievals. Adding the elevation scanning data to the MWR retrieval (i.e., the MWRzo vs. MWRz) results in a smaller uncertainty in the temperature profile, especially below 400 m.
Including the nDIAL data in the retrievals greatly reduces the 1σ uncertainty in the water vapor profiles for all active + passive retrievals (relative to the passive-only results) and results in a slight decrease in the temperature uncertainty also. The addition of the nDIAL data to either the MWR- or AERI-based retrievals results in smaller uncertainties in water vapor than either the lidar by itself (dotted black line) or the passive-only retrievals (Fig. 3, right). The AERI-based retrievals show smaller uncertainties than the MWR-based retrievals, with the exception of the water vapor retrievals above 2 km, where the MWR-based retrieval has a smaller uncertainty than the AERI retrieval. The uncertainty in the AERI + nDIAL water vapor retrieval between 500 m and 2 km, where the nDIAL data are used, is slightly smaller than the uncertainty in the MWRz + nDIAL retrieval, suggesting that the AERI is adding more information to the DIAL observations than the MWR. However, above 2 km the combination of all sensors has distinguishably the best performance, indicating that all instruments are contributing to the sensor synergy. In quantitative numbers, the WVMR can be retrieved via sensor synergy with accuracies between 0.4 and 0.6 g kg−1 in the lowest 3 km, which between 1 and 2 km (the region where DIAL shows its optimal performance) is an uncertainty reduction of up to 50 % compared to the passive-retrieval synergy.
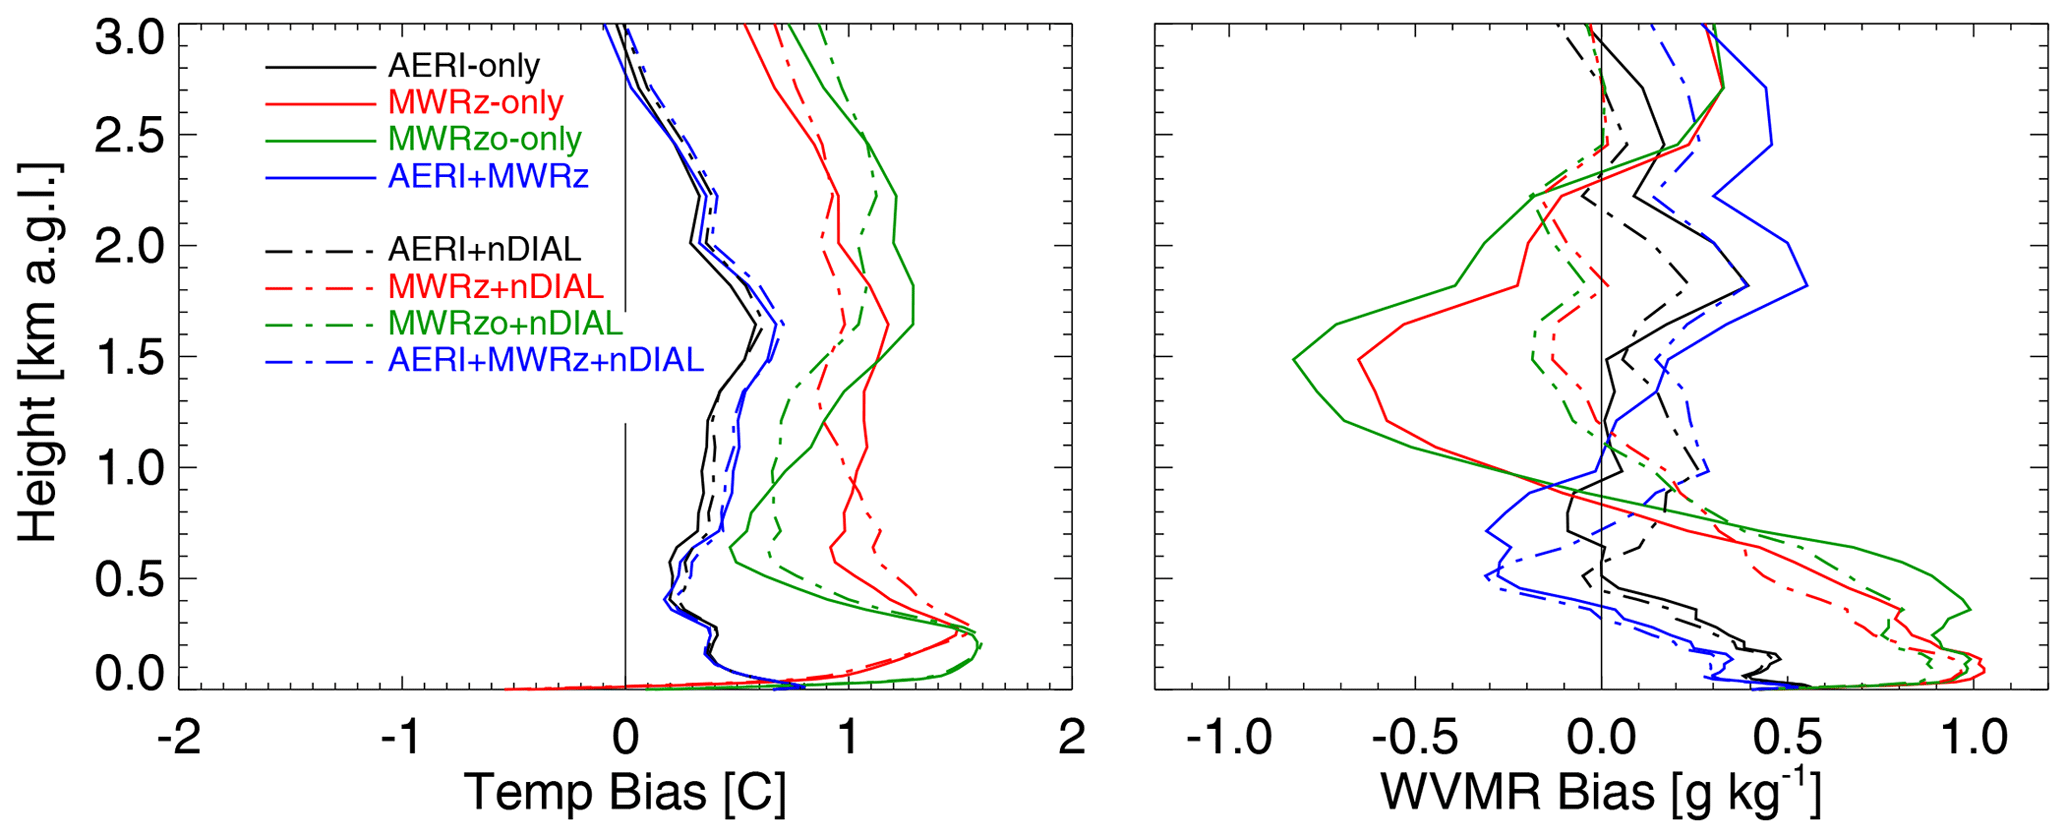
Figure 4The bias in temperature (left) and water vapor mixing ratio (right) for passive-only (solid lines) and active + passive (broken lines) retrievals relative to radiosondes during Perdigão.
4.3 Comparing bias profiles
Figure 4 shows the bias profiles in temperature and humidity relative to radiosondes launched during Perdigão. The radiosondes were launched within 100 m of the remote sensors, and 169 individual comparisons are included in these bias profiles.
The temperature bias profiles (Fig. 4, left) demonstrate that the retrievals that include AERI data have markedly smaller biases than the retrievals that did not. The inclusion of the nDIAL observations with the AERI (i.e., AERI + nDIAL, AERI + MWRz + nDIAL) did not markedly change the bias relative to the AERI-only and AERI + MWRz. However, for the retrievals that use the MWR data and not the AERI, the inclusion of the nDIAL data did result in smaller temperature biases above approximately 1 km.
The water vapor mixing ratio bias profiles (Fig. 4, right) illustrate that the MWRz-only and MWRzo-only profiles had markedly larger magnitudes than the retrievals that included AERI data. Including nDIAL data in these MWR-based retrievals (i.e., the MWRz + nDIAL and MWRzo + nDIAL) resulted in smaller mixing ratio biases above 500 m (recall the nDIAL data below 500 m were not used in this analysis due to known systematic issues), but the water vapor bias below 600 m was largely unchanged. Similarly, including the nDIAL data in the AERI-based retrievals also reduced the size of the water vapor bias above 1 km, although the impact of this additional dataset was smaller because the accuracy in the water vapor retrievals above 1 km is better for AERI-only retrievals relative to MWRz-only and MWRzo-only retrievals.
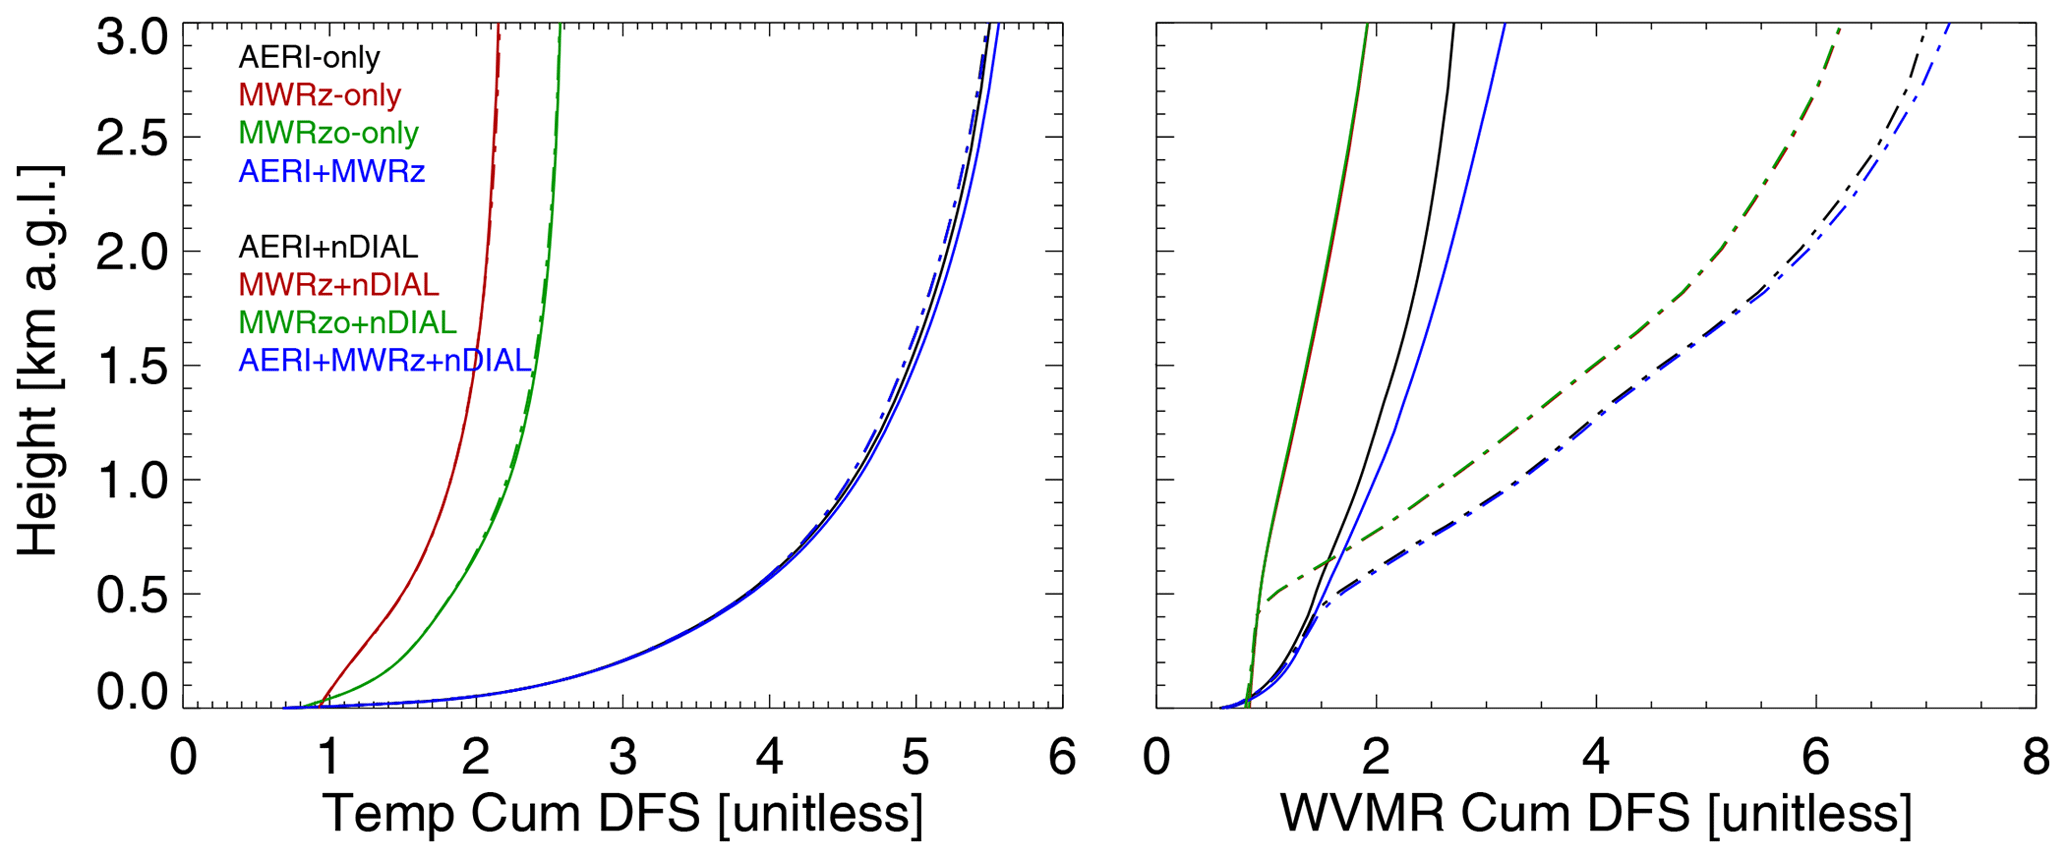
Figure 5The mean cDFS profiles for temperature (left) and water vapor mixing ratio (right) for passive-only (solid lines) and active + passive (broken lines) retrievals during Perdigão. Note that the water vapor cumulative DFS profiles for MWRz and MWRzo retrievals are virtually identical (see Table 3) and hence overlap.
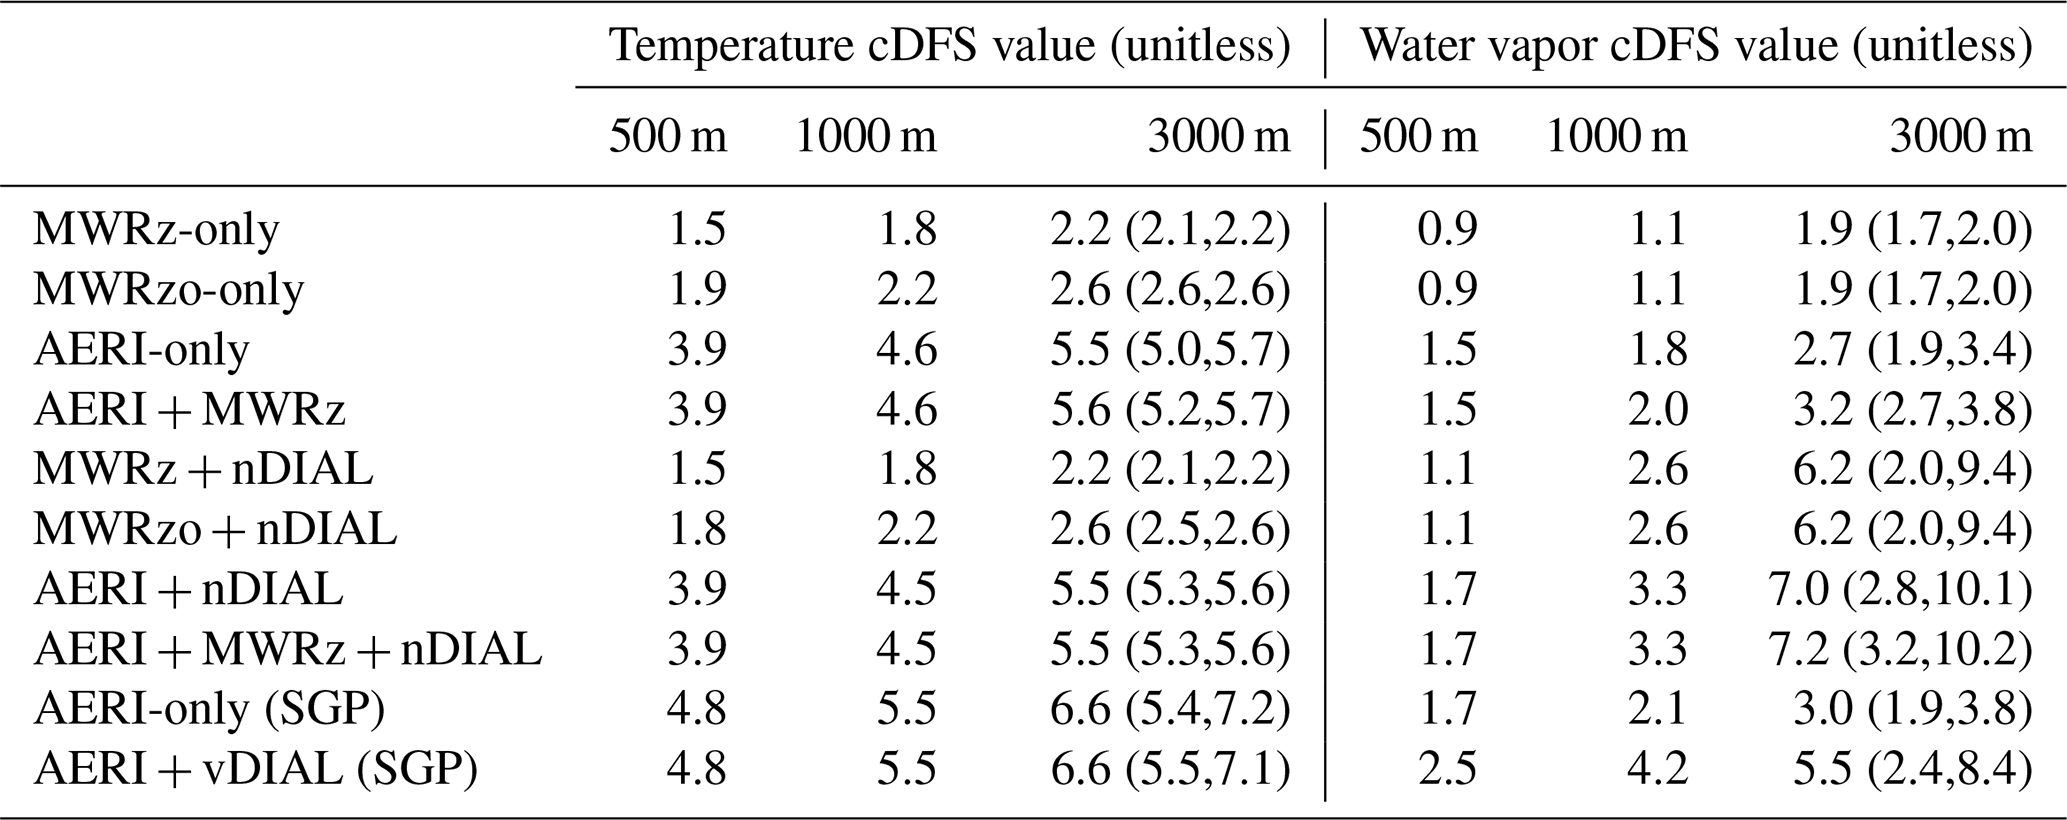
Table 3Average cDFS values at three levels for temperature and humidity for the different instrument combinations used in this study. The passive-only retrievals are highlighted in gray, whereas the active + passive are in white. The values in parentheses at 3 km show the 10th and 90th percentile at that height, thereby providing a measure of the amount of variability in these statistics for each retrieval.
4.4 Comparing mean cDFS profiles
The optimal-estimation framework used in this study uses the a priori to help constrain the ill-posed retrieval, thereby allowing the algorithm to converge to a realistic solution more frequently. Looking at the DFS profile, especially when summed with altitude from the surface (called here the cumulative DFS profile), enables one to understand where the independent data in the observations are located vertically. Figure 5 shows the mean cumulative DFS profiles for the different retrievals; mean values at three specific heights are provided in Table 3.
There are several important features in this figure. First, adding the elevation scanning data to the MWR retrieval (i.e., comparing the MWRz-only vs. MWRzo-only) increases the total DFS for temperature at 3 km by 0.4 (from 2.15 to 2.57), with almost all of this increase in the first 500 m. (Note, however, that we have only included a single additional elevation angle in the MWRzo (Table 1), and the inclusions of additional elevation angles would result in a slight increase in the cDFS for temperature.) The AERI-only temperature retrieval has more information (3.87) in the lowest 500 m than the MWRzo-only retrieval has in the lowest 3 km (2.57). Most of the information in the temperature retrievals is below 1.5 km as the cDFS profiles become relatively constant above that level; this suggests that these passive-only and active + passive temperature retrievals will have limited ability to retrieve the structure of the temperature profile above that height.
The passive-only retrievals of water vapor show less total DFSs (using the value at 3 km height) during Perdigão relative to datasets at other field campaigns (e.g., Turner and Löhnert 2014; Blumberg et al., 2015). This is likely due to the spread in the covariance of the prior because if the prior had (hypothetically) negligible spread then the derived information content from the observations would be vanishingly small. Nonetheless, we can still use this prior to demonstrate how the addition of the DIAL data to the retrievals changes the information content. The cDFS profiles for the water vapor retrievals clearly show the impact of including the nDIAL data above 500 m as the cDFS profiles for the active + passive retrievals are markedly larger above that height than the passive-only retrievals (i.e., with values between 6 and 7 compared to between 2 and 3 at 3 km). The additional information on water vapor in the AERI below 500 m relative to the MWR is clearly seen. However, the lidar does not always provide data at the same altitude, and its noise levels can depend on atmospheric conditions (e.g., if there is a cloud above the lidar or not), and thus the spread in the cumulative DFS profiles was quite large (e.g., from 2.0 to 9.4 for the MWRz + nDIAL at 3 km height; Table 3).

Figure 6Profiles of cumulative degrees of freedom of signal from MWRz-only (dashed curves with dots) and AERI-only (solid curves with squares) temperature (left) and water vapor (right) retrievals for three samples between 03:00 and 05:00 UTC on 27 May 2017 during Perdigão. The different colors correspond to different LWP path values in the overhead cloud, whose height is indicated with the horizontal gray bar. The solid symbols indicate heights that would be assimilated if the first level started at 50 m a.g.l., and each level was separated by a unit of DFSs. See the text for more details.
4.5 Impact of clouds
One of the often-stated advantages of MWR-based retrievals, relative to infrared-based retrievals, is the ability to profile through clouds because the optical thickness of the cloud is markedly smaller in the microwave relative to the infrared for a given liquid water path (LWP). Figure 6 shows cDFS profiles from the MWRz-only and AERI-only temperature and water vapor retrievals during a 2 h period when the sky transitioned from virtually clear sky to overcast. Three profiles with different LWP amounts (2, 10, and 60 g m−2, where the infrared is essentially opaque for the last; Turner, 2007) are shown. The cloud base was at 1100 m and was assumed to be 100 m thick (there was no way to determine cloud top from other observations at the site). First, notice that as the cloud becomes optically thicker, the retrievals have more information about the temperature at the cloud base. Second, the cloud becomes opaque in the infrared quickly; hence the cumulative DFS profile becomes essentially constant (especially for water vapor) above the cloud as the LWP values approach 60 g m−2. Meanwhile, the cloud is semi-transparent in the microwave for all LWP values, which is seen by the increasing cDFS profile (especially for water vapor) above the cloud. However, there is still only a small amount of information in the observations at heights above 1 km in the MWR (see left-hand panel of Fig. 5), and thus the increase in the information content in the MWR retrieval above the cloud is relatively limited.
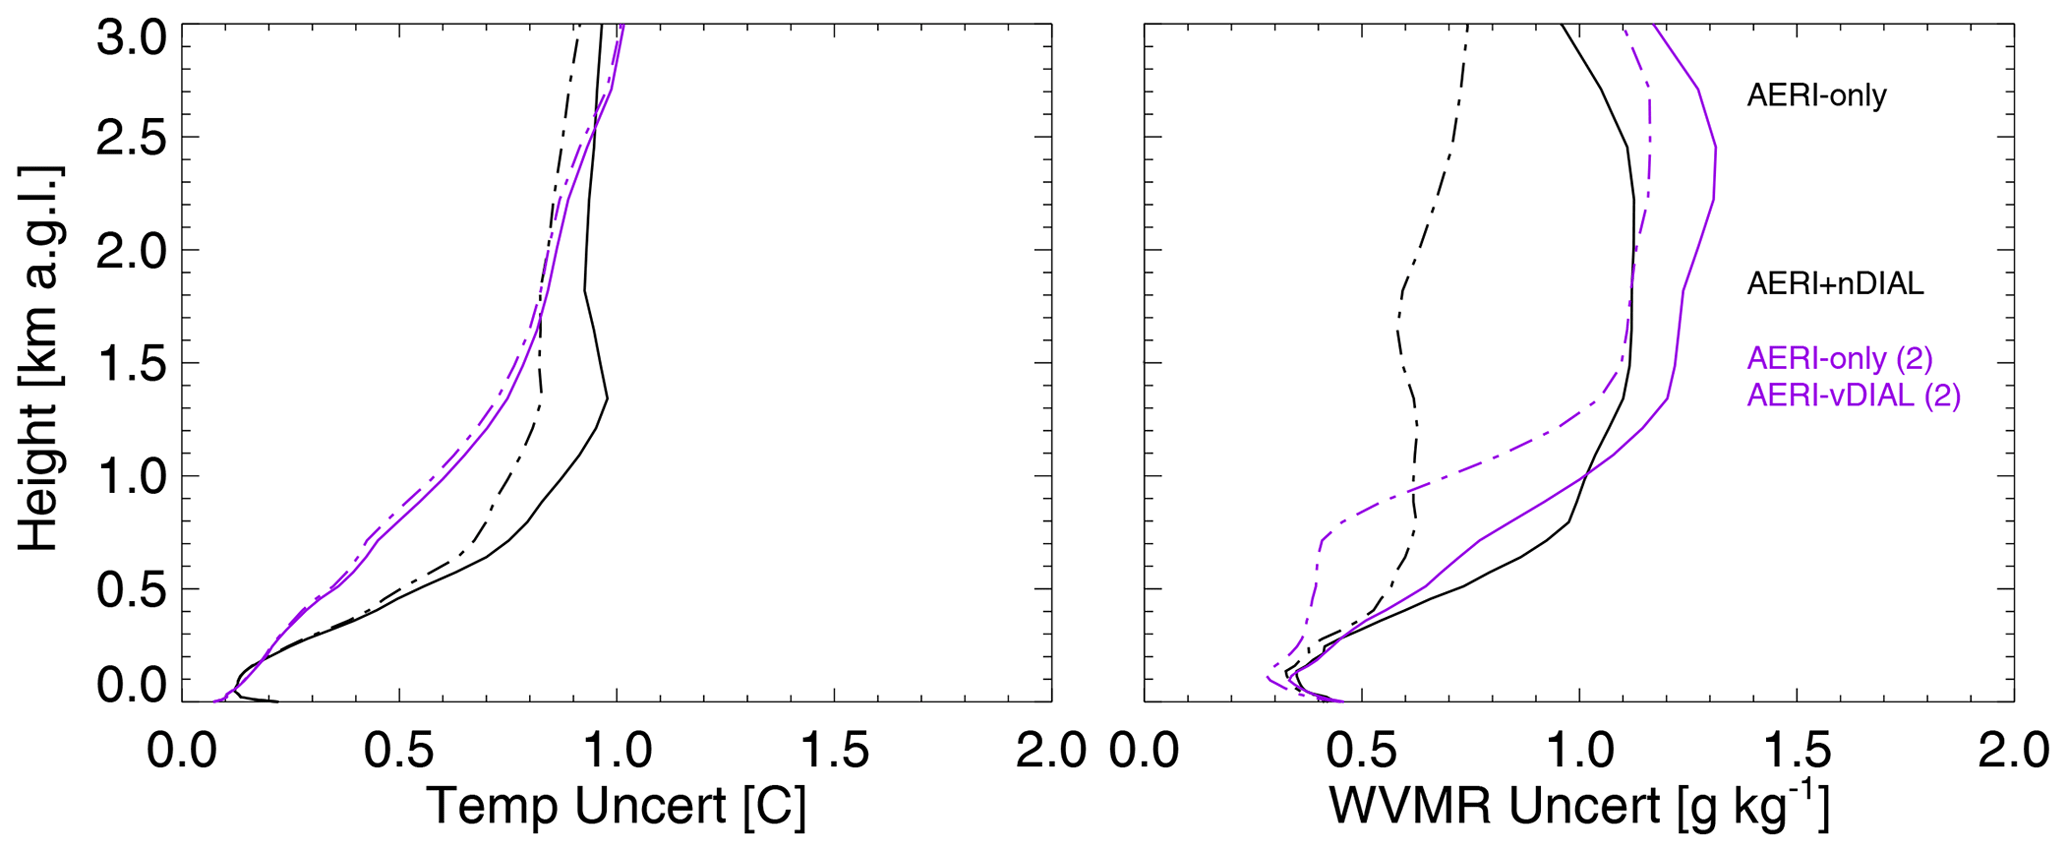
Figure 7The mean uncertainty in temperature (left) and water vapor mixing ratio (right) for AERI-only (solid lines) and AERI + xDIAL (broken lines) retrievals during Perdigão (black) and SGP (purple), where the former used nDIAL data, and the latter used vDIAL data. Note that different priors were used for the two locations; this impact is seen in the AERI-only retrievals as the noise levels of the two AERIs were similar.
The accurate understanding of where the information exists vertically is useful in order to properly assimilate these profiles into a numerical weather prediction model. There is often significant level-to-level correlation in the uncertainties in profiles retrieved from passive remote sensors (e.g., see Fig. 10 of Turner and Blumberg, 2019), and most data assimilation systems are not yet configured to handle correlated error in the observations. Coniglio et al. (2019) used the cDFS profile to identify the heights that should be assimilated to minimize the amount of correlated error from the retrieved profiles. Starting at a specified height (e.g., 50 m), they identified heights where the cDFS had increased by 1 above that height, and this process continued until they either were unable to identify any other points or had reached the maximum height that they wanted to assimilate. This is illustrated by the dots on the profiles in Fig. 6, with the first height taken at 50 m. For the AERI-retrieved profiles, three levels would be assimilated below the cloud, with an additional level at the cloud base or just above; the height of all of the temperature levels is pretty consistent for these three profiles. For the MWR, only two levels would be assimilated due to the lower information content in the microwave observations, with the height of the second point changing dramatically due to how the cloud influences the vertical distribution of the DFS profile. Again, we remind the reader that the total DFS seen in this example are lower than what is seen using this same retrieval framework in other field campaigns; we attribute this to the lack of spread in the a priori dataset used at Perdigão.
4.6 Sensitivity to the nDIAL vs. vDIAL
The impact of adding any new observation depends partially on its error covariance matrix as observations with larger uncertainties will add less information to the retrieved profile than observations with smaller uncertainties. For many lidars, co-adding photon counting data in either time or altitude reduces the random errors and thus would increase the information content and impact of using these lidar data in retrievals such as these. However, other features of the observations are also important. For example, during Perdigão, the lowest range gate that was considered useful from the nDIAL was at 500 m; data below that level suffered from systematic errors associated with the overlap function of the lidar (S. Spuler, personal communication, 2019). However, the vDIAL was designed to make good measurements at 50 m above the surface, although generally speaking its maximum range is much less (on the order of 1 km; Newsom et al., 2020) than the nDIAL system (which frequently makes good water vapor measurements at altitudes well above 2 km). A natural question is how the results already shown would change if the vDIAL system were used instead of the nDIAL
Unfortunately, this is not straightforward to answer as the vDIAL was not collocated with the other Perdigão instruments. Instead, we use the 6-week deployment of the vDIAL at the ARM SGP site (Newsom et al., 2020), which has an AERI with similar noise characteristics as the AERI deployed at Perdigão, as a surrogate. However, different a priori datasets were used for the retrievals at the two sites, which impacts the retrievals and hence the analysis. To help adjust for the contribution of the two priors, we performed AERI-only retrievals and AERI + vDIAL retrievals at the SGP so that we could look at the difference between the two and compare that to the difference between the AERI-only and AERI + nDIAL retrievals at Perdigão (Fig. 7).
The impact of the vDIAL data on the water vapor retrieval is most significant between 300 and 1500 m and reaches relative values of up to 50 % uncertainty reduction compared to the AERI-only retrieval. Above 1500 m, the AERI + vDIAL WVMR uncertainties increase quickly with height and approach the AERI-only uncertainties at 3 km. The AERI + nDIAL uncertainties are very similar to the AERI-only below 500 m (because the nDIAL data are not available at those levels) but are approximately 2 times smaller than the AERI-only for all heights between 500 m and 3 km. Further, the change in the cDFS between 500 m and 3 km is larger for the nDIAL system relative to the vDIAL (Table 3). Thus, the ability of the nDIAL to see deeper into the troposphere than the vDIAL is clearly shown. Interestingly, the water vapor uncertainty in the AERI + vDIAL is smaller than the AERI + nDIAL in the 500–900 m range; however, this could easily be changed by adjusting how the DIAL data were co-added in the nDIAL (which had 1 min temporal resolution relative to the 20 min temporal resolution of the vDIAL; see Table 1).
Perhaps most noteworthy is the relative impact of the two DIALs on the retrieved temperature profile. The addition of the vDIAL data has almost no impact on the uncertainty or the cDFS profile relative to the AERI-only (Fig. 7, Tables 2 and 3), whereas the nDIAL has a marked impact on the retrieved temperature profile in the range from 500 m to 2.5 km, with a reduction in the uncertainty of up to 0.25 K compared to the AERI-only retrieval. Here, the instrument synergy is obtained through a more exact determination of the water vapor profile by the nDIAL, which enables the AERI to reach a higher DFS value for temperature.
Many applications require profiles of temperature and humidity in the PBL. However, the accuracy and information content from different ground-based remote sensing instruments is not the same. Previous work (e.g., Löhnert et al., 2009; Blumberg et al., 2015) demonstrated that there is more information content in both temperature and water vapor from spectral infrared measurements (such as those made by the AERI) than in spectral microwave radiometer measurements. These results depend strongly on the characteristics of the instrument systems being used; for example, if future-generation MWRs are improved to have smaller random errors, then the information content in the observations would increase. The online python modules provided by Maahn et al. (2020) can be used to explore how the information content would change for different assumed random error levels in the MWR.
This study investigated the impact of ground-based sensor synergy for PBL thermodynamic profiling and in particular how the information content and random errors would change if an active remote sensor such as a water vapor DIAL were included in the retrieval. An open question going into this research was whether the inclusion of the water vapor DIAL observations with MWR radiance observations would have the same information content as retrievals that used the DIAL with the AERI observations. An important aspect of this study is that the same a priori data and retrieval framework were used for all of the different retrievals shown in this paper, which is crucial to truly quantify the differences as different retrieval frameworks can result in markedly different retrievals (Maahn et al., 2020). Furthermore, the 2017 NASA Decadal Survey recommended an increased focus on thermodynamic profiling of the atmospheric boundary layer from space (National Academies, 2018), and coupling passive microwave and infrared with active DIAL remote sensing is one possible solution. We have shown that including the DIAL data increases the water vapor information content and reduces water vapor errors in both the AERI + DIAL and MWR + DIAL retrievals, relative to the passive-only retrievals. However, the AERI + DIAL continues to have more information on water vapor than the MWR + DIAL. The best retrieval performance is observed when all three instruments are combined in one retrieval. Improvements are shown that decrease the uncertainty by 50 % compared to passive-only retrievals between 1 and 2 km. At Perdigão, the AERI is shown to dominate retrieval accuracy in the lowest 500 m, from 500 m to 2 km it is the DIAL that primarily determines the accuracy, and above 2 km the three instruments complement each other optimally to obtain the best solution. Furthermore, the addition of the water vapor DIAL observations (slightly) improves the information content in temperature retrievals from the AERI + DIAL but has no impact on the temperature profiles for the MWR + DIAL.
Passive ground-based remote sensors are relatively common as these technologies are more mature, have been commercially available for several decades, and have been operated in networks (e.g., Caumont et al., 2016; Geerts et al., 2017; Yang and Min, 2018). The recent advances in water vapor DIAL (e.g., Spuler et al., 2015; Newsom et al., 2020) are leading to the possibility that the two DIALs used in this study could be commercially available in the next several years, which is why they formed the focus of this study. There are other thermodynamic-profiling active remote sensors that could be combined with MWRs and AERIs: for example, Raman lidar and radio acoustic sounding systems (RASSs). Studies have been conducted combining Raman lidar with both MWR data (e.g., Barrera-Verdejo et al., 2016; Foth and Pospichal, 2017) and AERI data (e.g., Turner and Blumberg, 2019); however, these studies were in different environments using different a priori datasets, which makes quantitatively comparing their accuracy and information content problematic. There are currently efforts underway to evaluate the impact of RASS virtual temperature profile observations on both AERI and MWR observations. Developing improved synergistic retrievals and sensor synergy are the goals of many groups, including the PROfiling of the atmospheric Boundary layer at European scale (PROBE; Cimini et al., 2020).
Sensor synergy does not have to just involve ground-based sensors. Ground-based MWR and AERI observations can also be combined with satellite observations to improve information content and accuracy, especially in the middle- and upper troposphere. Feltz et al. (2003) showed the impact on AERI retrievals and how these improved profiles could be used for evaluating thermodynamic structure near storms, while Ebell et al. (2013) performed a more classical information content study. Additional efforts (e.g., such as Toprov and Löhnert, 2020) are needed which show the impact of the high-temporal- and high-spectral-resolution geostationary infrared sounders with ground-based remote sensing systems and the impact on stability indices and other parameters.
It is possible that readers will consider this study to be a suggestion about the optimal ground-based solution for thermodynamic profiling, especially for future operational networks. This paper provides insights into only one aspect of the cost–benefit solution (i.e., the relative differences in information content); considerations as to ease of use, durability and hardiness, calibration stability, and other scientific traits (e.g., whether the instrument provides information on macro- or microphysical cloud properties, aerosol properties, trace gases, etc.) also need to be considered.
The retrieval code used in this study is available from the first author by request. It is currently being ported from IDL to python, after which it will be available via GitHub.
The data used in this analysis are available from the NCAR Earth Observing Laboratory's data archive under the Perdigão campaign (https://www.eol.ucar.edu/field_projects/perdigao/ (last access: July 2019, UCAR/NCAR-Earth Observing Laboratory, 2017.)) and the ARM data archive (https://www.arm.gov, last access: July 2019, Atmospheric Radiation Measurement (ARM) user facility, 2004).
Both authors conceived the study, outlined the objectives, and formulated the analysis plan. The development of the AERIoe retrieval algorithm and data analysis was performed by DDT. DDT prepared the manuscript with contributions from UL.
The authors declare that they have no conflict of interest.
This article is part of the special issue “Tropospheric profiling (ISTP11) (AMT/ACP inter-journal SI)”. It is a result of the 11th edition of the International Symposium on Tropospheric Profiling (ISTP), Toulouse, France, 20–24 May 2019.
This research was supported in part by the Department of Energy's Atmospheric System Research (ASR) program (grant nos. DE-SC0014375 and 89243019SSC000034) and the NOAA's Atmospheric Science for Renewable Energy program. We thank the groups that helped to collect the two primary datasets from the Perdigão field campaign used in this paper: Petra Klein, Elizabeth Smith, Josh Gebauer, and Tyler Bell at the University of Oklahoma and Scott Spuler, Matt Hayman, and Tammy Weckwerth at the National Center for Atmospheric Research. Additionally, we thank Raisa Lehtinen, Reijo Roininen, and Christoph Münkel at Vaisala and Rob Newsom at Pacific Northwest National Laboratory for the collection of the DIAL dataset at the SGP site. This article supports activities associated with COST (European Cooperation in Science and Technology) Action CA18235 “PROBE” (http://www.probe-cost.eu/, last access: November 2020). We would like to thank Jason English for constructive comments on an earlier version of this paper. This paper does not imply endorsement for any particular instrument, nor does it reflect the views or official position of the NOAA or the US government.
This research has been supported by the US Department of Energy, Office of Science (grant nos. DE-SC0014375 and 89243019SSC000034) and NOAA's Atmospheric Science for Renewable Energy program.
This paper was edited by E. J. O'Connor and reviewed by two anonymous referees.
Atmospheric Radiation Measurement (ARM) user facility: Atmospheric Emitted Radiance Interferometer (AERICH1), 2017-05-10 to 2017-07-02, Southern Great Plains (SGP) Central Facility, Lamont, OK (C1), Compiled by J. Gero, R. Garcia, D. Hackel, B. Ermold and K. Gaustad, ARM Data Center, available at: https://www.arm.gov (last access: 21 July 2019), 2004.
Barrera-Verdejo, M., Crewell, S., Löhnert, U., Orlandi, E., and Di Girolamo, P.: Ground-based lidar and microwave radiometry synergy for high vertical resolution absolute humidity profiling, Atmos. Meas. Tech., 9, 4013–4028, https://doi.org/10.5194/amt-9-4013-2016, 2016.
Bluestein, H. B., Wienhoff, Z. B., Turner, D. D., Reif, D. W., Snyder, J. C., Thiem, K. J., and Houser, J. B.: A comparison of the fine-scale structures of a prefrontal wind-shift line and a strong cold front in the Southern Plains of the U.S., Mon. Weather Rev.., 145, 3307–3330, https://doi.org/10.1175/MWR-D-16-0403.1, 2017.
Blumberg, W. G., Turner, D. D., Löhnert, U., and Castleberry, S.: Ground based temperature and humidity profiling using spectral infrared and microwave observations, Part II: Actual retrieval performance in clear-sky and cloudy conditions, J. Appl. Meteorol., 54, 2305–2319, 2015.
Caumont, O., Cimini, D., Löhnert, U., Alados-Arboledas, L., Bleisch, R., Buffa, F., Ferrario, M.E., Haefele, A., Huet, T., Madonna, F., and Pace, G.: Assimilation of humidity and temperature observations retrieved from ground-based microwave radiometers into a convective-scale NWP model, Q. J. Roy. Meteor. Soc., 142, 2692–2704, https://doi.org/10.1002/qj.2860, 2016.
Cimini, D., Campos, E., Ware, R., Albers, S., Giuliani, G., Oreamuno, J., Joe, P., Koch, S. E., Cober, S., and Westwater, E.: Thermodynamic atmospheric profiling during the 2010 winter Olympics using ground-based microwave radiometry, IEEE T. Geosci. Remote, 49, 4959–4969, https://doi.org/10.1109/TGRS.2011.2154337, 2011.
Cimini, D., Nelson, M., Güldner, J., and Ware, R.: Forecast indices from a ground-based microwave radiometer for operational meteorology, Atmos. Meas. Tech., 8, 315–333, https://doi.org/10.5194/amt-8-315-2015, 2015.
Cimini, D., Rosenkranz, P. W., Tretyakov, M. Y., Koshelev, M. A., and Romano, F.: Uncertainty of atmospheric microwave absorption model: impact on ground-based radiometer simulations and retrievals, Atmos. Chem. Phys., 18, 15231–15259, https://doi.org/10.5194/acp-18-15231-2018, 2018.
Cimini, D., Haeffelin, M., Kotthaus, S., Löhnert, U., Martinet, P., O'Connor, E., Walden, C., Coen, M., and Preissler, J.: Towards the profiling of the atmospheric boundary layer at European scale – introducing the COST action PROBE, Bull. Atmos. Sci. Tech., 1, 23–42, https://doi.org/10.1007/s42865-020-00003-8, 2020.
Clough, S. A. and Iacono, M. J.: Line-by-line calculation of atmospheric fluxes and cooling rates, 2: Applications to carbon dioxide, ozone, methane, nitrous oxide, and halocarbons, J Geophys. Res., 100, 16519–16535, 1995.
Clough, S. A., Shephard, M. W., Mlawer, E. J., Delamere, J. S., Iacono, M. J., Cady-Pereira, K., Boukabara, S., and Brown, P. D.: Atmospheric radiative transfer modeling: A summary of the AER codes, J. Quant. Spectrosc. Ra., 91, 233–244, https://doi.org/10.1016/j.jqsrt.2004.05.058, 2005.
Coniglio, M. C., Romine, G. S., Turner, D. D., and Torn, R. D.: Impacts of targeted AERI and Doppler lidar wind retrievals on short-term forecasts of the initiation and early evolution of thunderstorms, Mon. Weather Rev., 147, 1149–1170, https://doi.org/10.1175/MWR-D-0351.1, 2019.
Crewell, S. and Löhnert, U.: Accuracy of boundary layer temperature profiles retrieved with multi-frequency, multi-angle microwave radiometry, IEEE T. Geosci. Remote, 45, 2195–2201, 2007.
Dabberdt, W. F., Schlatter, T.W., Carr, F. H., Friday, E. W. J., Jorgenson, D., Koch, S., Pirone, M., Ralph, F. M., Sun, J., Welsh, P., Wilson, J. W., and Zou, X.: Multifuction mesoscale observing networks, B. Am. Meteorol. Soc., 86, 961–982, https://doi.org/10.1175/BAMS-86-7-961, 2005.
De Angelis, F., Cimini, D., Löhnert, U., Caumont, O., Haefele, A., Pospichal, B., Martinet, P., Navas-Guzmán, F., Klein-Baltink, H., Dupont, J.-C., and Hocking, J.: Long-term observations minus background monitoring of ground-based brightness temperatures from a microwave radiometer network, Atmos. Meas. Tech., 10, 3947–3961, https://doi.org/10.5194/amt-10-3947-2017, 2017.
Degelia, S. K., Wang, X., and Stensrud, D. J.: An evaluation of the impact of assimilating AERI retrievals, kinematic profilers, rawinsondes, and surface observations on a forecast of nocturnal convection initiation event during the PECAN field campaign, Mon. Weather Rev., 147, 2739–2764, https://doi.org/10.1175/MWR-D-18-0423.1, 2019.
Ebell, K., Orlandi, E., Hünerbein, A., Löhnert, U., and Crewell, S.: Combining ground-based with satellite-based measurements in the atmospheric state retrieval: Assessment of the information content, J. Geophys. Res. Atmos., 118, 6940–6956, https://doi.org/10.1002/jgrd.50548, 2013.
Feltz, W. F., Smith, W. L., Howell, H. B., Knuteson, R. O., Woolf, H., and Revercomb, H. E.: Near-continuous profiling of temperature, moisture, and atmospheric stability using the Atmospheric Emitted Radiance Interferometer (AERI), J. Appl. Meteor, 42, 584–597, 2003.
Fernando, H. J. S., Mann, J., Palma, J., Lundquist, J., Barthelmie, R., Belo-Pereira, M., Brown, W., Chow, F., Gerz, T., Hocut, C., Klein, P., Leo, L., Matos, J., Oncley, S., Pryor, C., Bariteau, L., Bell, T., Bodini, N., Carney, M., Courtney, M., Creegan, E., Dimitrova, R., Gomes, S., Hagen, M., Hyde, J., Kigle, S., Krishnamurthy, R., Lopes, J., Mazzaro, L., Neher, J., Menke, R., Murpy, P., Oswald, L., Otarola-Bustos, S., Pattantyus, A., Veiga Rodrigues, C., Schady, A., Sirin, N., Spuler, S., Sevensson, E., Tomaszewski, J., Turner, D., van Veen, L., Vasiljevic, N., Vassallo, D., Voss, S., Wildmann, N., and Yang, Y.: The Perdigao: Peering into microscale details of mountain winds, B. Am. Meteorol. Soc., 100, 799–819, https://doi.org/10.1175/BAMS-D-17-0227.1, 2019.
Foth, A. and Pospichal, B.: Optimal estimation of water vapour profiles using a combination of Raman lidar and microwave radiometer, Atmos. Meas. Tech., 10, 3325–3344, https://doi.org/10.5194/amt-10-3325-2017, 2017.
Geerts, B., Parsons, D., Ziegler, C., Weckwerth, T., Biggerstaff, M., Clark, R., Coniglio, M., Demoz, B., Ferrare, R., Gallus Jr. W., Haghi, K., Hanesiak, J., Klein, P., Knupp, K., Kosiba, K., McFarquhar, G., Moore, J., Nehrir, A., Parker, M., Pinto, J., Rauber, R., Schumacher, R., Turner, D., Wang, Q., Wang, X., Wang, Z., and Wurman, J.: The 2015 Plains Elevated Convection At Night field project, B. Am. Meteorol. Soc., 98, 767–786, 2017.
Grasmick, C., Geerts, B., Turner, D. D., Wang, Z., and Weckwerth, T. M.: The relation between nocturnal MCS evolution and its outflow boundaries in the stable boundary layer: An observational study of the 15 July 2015 MCS in PECAN, Mon. Weather Rev., 146, 3203–3226, https://doi.org/10.1175/MWR-D-18-0169.1, 2018.
Hu, J., Yussouf, N., Turner, D. D., Jones, T. A., and Wang, X.: Impact of ground-based remote sensing boundary layer observations on short-term probabilistic forecasts of a tornadic supercell event, Weather Forecast., 34, 1453–1476, https://doi.org/10.1175/WAF-D-18-0200.1, 2019.
Johnson, A., Wang, X., Haghi, K., and Parsons, D. B.: Evaluation of forecasts of a convectively generated bore using an intensively observed case study from PECAN, Mon. Weather Rev., 146, 3097–3122, https://doi.org/10.1175/MWR-D-18-0059.1, 2018.
Knuteson, R. O., Revercomb, H., Best, F., Ciganovich, N., Dedecker, R., Dirkx, T., Ellington, S., Feltz, W., Garcia, R., Howell, H., Smith, W., Short, J., and Tobin, D.: Atmospheric Emitted Radiance Interferometer. Part I: Instrument design, J. Atmos. Ocean. Tech., 21, 1763–1776, 2004a.
Knuteson, R. O., Revercomb, H., Best, F., Ciganovich, N., Dedecker, R., Dirkx, T., Ellington, S., Feltz, W., Garcia, R., Howell, H., Smith, W., Short, J., and Tobin, D.: Atmospheric Emitted Radiance Interferometer, Part II: Instrument performance, J. Atmos. Ocean. Tech., 21, 1777–1789, 2004b.
Loveless, D. M., Wagner, T. J., Turner, D. D., Ackerman, S. A., and Feltz, W. F.: A composite perspective on bore passages during the PECAN campaign, Mon. Weather Rev., 147, 1395–1413, https://doi.org/10.1175/MWR-D-18-0291.1, 2019.
Löhnert, U., Turner, D. D., and Crewell, S.: Ground-based temperature and humidity profiling using spectral infrared and microwave observations, Part 1: Simulated retrieval performance in clear sky conditions, J. Appl. Meteor. Clim., 48, 1017–1032, https://doi.org/10.1175/2008JAMC2060.1, 2009.
Löhnert, U. and Maier, O.: Operational profiling of temperature using ground-based microwave radiometry at Payerne: prospects and challenges, Atmos. Meas. Tech., 5, 1121–1134, https://doi.org/10.5194/amt-5-1121-2012, 2012.
Maahn, M., Turner, D. D., Löhnert, U., Posselt, D. J., Ebell, K., Mace, G. G., and Comstock, J. M.: Optimal estimation retrievals and their uncertainties: What every atmospheric scientist should know, B. Am. Meteorol. Soc., 101, 1512–1523, https://doi.org/10.1175/BAMS-D-19-0027.1, 2020.
Mlawer, E. J. and Turner, D. D.: Spectral radiation measurements and analysis in the ARM program, The Atmospheric Radiation Measurement Program: The First 20 Years, Meteor. Monograph, 57, Amer. Meteor. Soc., 1–17, https://doi.org/10.1175/AMSMONOGRAPHS-D-15-0027.1, 2016.
Mueller, D., Geerts, B., Wang, Z., Deng, M., and Grasmick, C.: Evolution and vertical structure of an undular bore observed on 20 June 2015 during PECAN, Mon. Wether. Rev., 145, 3375–3794, https://doi.org/10.1175/MWR-D-16-0305.1, 2017.
National Academies: Thriving on our changing planet: A decadal strategy for Earth observation from space. National Academies Press, https://doi.org/10.17226/24938, available from https://www.nap.edu/catalog/24938/thriving-on-our-changing-planet-a-decadal-strategy-for-earth (last access: February 2019), 2018.
NRC: National Research Council Committee on Developing Mesoscale Meteorological Observational Capabilities to Meet Multiple National Needs: Observing Weather and Climate from the Ground Up: A Nationwide Network of Networks, National Academies Press, 234 pp., 2009.
Nehrir, A. R., Rapasky, K. S., and Carlsten, J. L.: Micropulse water vapor differential absorption lidar: Transmitter design and performance, Opt. Express., 20, 137–151, 2012.
Newsom, R. K., Turner, D. D., Lehtinen, R., Muenkel, C., Kallio, J., and Roininen, R.: Evaluation of a compact broadband differential absorption lidar for routine water vapor profiling in the atmospheric boundary layer, J. Atmos. Ocean. Tech., 37, 47–65, https://doi.org/10.1175/JTECH-D-18-0102.1, 2020.
Payne, V. H., Mlawer, E. J., Cady-Pereira, K. E., and Moncet, J.-L.: Water vapor continuum absorption in the microwave, IEEE T. Geosci. Remote, 49, 2194–2208, https://doi.org/10.1109/TGRS.2010.2091416, 2011.
Revercomb, H. E., Buijs, H., Howell, H. B., LaPorte, D. D., Smith, W. L., and Sromovsky, L. A.: Radiometric calibration of IR Fourier transform spectrometers: Solution to a problem with the high-resolution interferometer sounder, Appl. Opt., 27, 3210–3218, 1988.
Rodgers, C. D.: Inverse Methods for Atmospheric Sounding: Theory and Practice, Series on Atmospheric, Oceanic, and Planetary Physics, Vol. 2, World Scientific, 238 pp, 2000.
Rose, T., Crewell, S., Löhnert, U., and Simmer, C.: A network suitable microwave radiometer for operational monitoring of the cloudy atmosphere, Atmos. Res., 75, 183–200, https://doi.org/10.1016/j.atmosres.2004.12.005, 2005.
Sica, R. J. and Haefele, A.: Retrieval of water vapor mixing ratio from a multiple channel Raman-scatter lidar using an optimal estimation method, Appl. Opt., 55, 763–777, https://doi.org/10.1364/AO.55.000763, 2016.
Sisterson, D. L., Peppler, R. A., Cress, T. S., Lamb, P. J., and Turner, D. D.: The ARM Southern Great Plains (SGP) site, The Atmospheric Radiation Measurement Program: The First 20 Years, Meteor. Monograph. Amer. Meteor. Soc., 57, 1–14, https://doi.org/10.1175/AMSMONOGRAPHS-D-16-0004.1, 2016.
Spuler, S. M., Repasky, K. S., Morley, B., Moen, D., Hayman, M., and Nehrir, A. R.: Field-deployable diode-laser-based differential absorption lidar (DIAL) for profiling water vapor, Atmos. Meas. Tech., 8, 1073–1087, https://doi.org/10.5194/amt-8-1073-2015, 2015.
Toms, B. A., Tomaszewski, J. M., Turner, D. D., and Koch, S. E.: Analysis of a lower-tropospheric gravity wave train using direct and remote sensing measurement systems, Mon. Weather Rev., 145, 2791–2812, https://doi.org/10.1175/MWR-D-0216.1, 2017.
Toporov, M. and Löhnert, U.: Synergy of Satellite- and Ground-Based Observations for Continuous Monitoring of Atmospheric Stability, Liquid Water Path and Integrated Water Vapor, J. Appl. Meteor. Climatol., 59, 1153–1170, https://doi.org/10.1175/JAMC-D-19-0169.1, 2020.
Turner, D. D.: Improved ground-based liquid water path retrievals using a combined infrared and microwave approach, J. Geophys. Res., 112, D15204, https://doi.org/10.1029/2007JD008530, 2007.
Turner, D. D. and Goldsmith, J. E. M.: Twenty-Four-Hour Raman Lidar Water Vapor Measurements during the Atmospheric Radiation Measurement Program's 1996 and 1997 Water Vapor Intensive Observation Periods, J. Atmos. Ocean. Tech., 16, 1062–1076, 1999.
Turner, D. D. and Löhnert, U.: Information content and uncertainties in thermodynamic profiles and liquid cloud properties retrieved from the ground-based Atmospheric Emitted Radiance Interferometer (AERI), J. Appl. Meteor. Clim., 53, 752–771, https://doi.org/10.1175/JAMC-D-13-0126.1, 2014.
Turner, D. D. and Blumberg, W. G.: Improvements to the AERIoe thermodynamic profile retrieval algorithm, IEEE Selected Topics Appl. Earth Obs. Remote Sens., 12, 1339–1354, https://doi.org/10.1109/JSTARS.2018.2874968, 2019.
Turner, D. D., Knuteson, R. O., Revercomb, H. E., Lo, C., and Dedecker, R. G.: Noise reduction of Atmospheric Emitted Radiance Interferometer (AERI) observations using principal component analysis, J. Atmos. Ocean. Tech., 23, 1223–1238, 2006.
Turner, D. D., Wulfmeyer, V., Berg, L. K., and Schween, J. H.: Water vapor turbulence profiles in stationary continental convective mixed layers, J. Geophys. Res., 119, 1–15, https://doi.org/10.1002/2014JD022202, 2014.
Turner, D. D., Mlawer, E. J., and Revercomb, H. E.: Water vapor observations in the ARM program. The Atmospheric Radiation Measurement Program: The First 20 Years, Meteor. Monograph, Amer. Meteor. Soc., 57, 11–18, https://doi.org/10.1175/AMSMONOGRAPHS-D-15-0025.1, 2016a.
Turner, D. D., Goldsmith, J. E. M., and Ferrare, R. A.: Development and applications of the ARM Raman lidar, The Atmospheric Radiation Measurement Program: The First 20 Years, Meteor. Monograph. Amer. Meteor. Soc. 57, 1–15, https://doi.org/10.1175/AMSMONOGRAPHS-D-15-0026.1, 2016b.
UCAR/NCAR-Earth Observing Laboratory: NCAR/EOL Water Vapor DIAL Data, Version 1.0 (Version 1.0) [Data set], UCAR/NCAR – Earth Observing Laboratory. available at: https://www.eol.ucar.edu/field_projects/perdigao/ (last access: July 2019), 2017.
Wagner, T. J., Feltz, W. F., and Ackerman, S. A.: The temporal evolution of convective indices in storm-producing environments, Weather Forecast., 23, 786–794, 2008.
Wagner, T. J., Klein, P. M., and Turner, D. D.: A new generation of ground-based mobile platforms for active and passive profiling of the boundary layer, B. Am. Meteorol. Soc., 100, 137–153, https://doi.org/10.1175/BAMS-D-17-0165.1, 2019.
Weckwerth, T. M., Weber, K., Turner, D. D., and Spuler, S. M.: Validation of a new water vapor micropulse differential absorption lidar (DIAL), J. Atmos. Ocean. Tech., 33, 2353–2372, https://doi.org/10.1175/JTECH-D-16-0119.1, 2016.
Wulfmeyer, V., Hardesty, R. M., Turner, D. D., Behrendt, A., Cadeddu, M., Di Girolamo, P., Schluessel, P., van Baelen, J., and Zus, F.: A review of the remote sensing of lower-tropospheric thermodynamic profiles and its indispensible role for the understanding and simulation of water and energy cycles, Rev. Geophys., 53, 819–895, https://doi.org/10.1002/2014RG000476, 2015.
Yang, J. and Min, Q.: Retrieval of atmospheric profiles in the New York State Mesonet using one-dimensional variational algorithm, J. Geophys. Res., 123, 7563–7575, https://doi.org/10.1029/2018JD028272, 2018.