the Creative Commons Attribution 4.0 License.
the Creative Commons Attribution 4.0 License.
 | 27 May 2021
Internal consistency of the IAGOS ozone and carbon monoxide measurements for the last 25 years
Philippe Nedelec
Damien Boulanger
Pawel Wolff
Bastien Sauvage
Jean-Marc Cousin
Gilles Athier
Andreas Zahn
Florian Obersteiner
Dieter Scharffe
Hervé Petetin
Yasmine Bennouna
Hannah Clark
Valérie Thouret
The In-service Aircraft for a Global Observing System (IAGOS) is a European research infrastructure that equips the Airbus A340/330 with a system for monitoring atmospheric composition. The IAGOS instruments have three different configurations: IAGOS-Core, IAGOS – Measurement of Ozone and Water Vapor by Airbus In Service Aircraft (IAGOS-MOZAIC) and IAGOS – Civil Aircraft for the Regular Investigation of the atmosphere Based on an Instrument Container (IAGOS-CARIBIC). Since 1994, there have been a total of 17 aircraft equipped. In this study, we perform an intercomparison of about 8000 landing and takeoff profiles to compare the O3 and CO measurements performed from these different configurations. The collocated profiles used in the study met various selection criteria. The first was a maximal 1 h time difference between an ascent or descent by two different aircraft at the same airport and the second was a selection based on the similarity of air masses based on the meteorological data acquired by the aircraft. We provide here an evaluation of the internal consistency of the O3 and CO measurements since 1994. For both O3 and CO, we find no drift in the bias amongst the different instrument units (six O3 and six CO IAGOS-MOZAIC instruments, nine IAGOS-Core Package1 and the two instruments used in the IAGOS-CARIBIC aircraft). This result gives us confidence that the entire IAGOS database can be treated as one continuous program and is therefore appropriate for studies of long-term trends.
- Article
(14958 KB) - Full-text XML
- BibTeX
- EndNote


The In-service Aircraft for a Global Observing System (IAGOS; https://www.iagos.org, last access: 10 May 2021) is a European research infrastructure (Petzold et al., 2015) that was officially launched in 2011 to equip Airbus A340/330 long-haul passenger aircraft with a newly designed system (named IAGOS-Core) for collecting data on gases, aerosol and trace species throughout the troposphere and lower stratosphere and maintaining the fleet of the former Measurement of Ozone and Water Vapor by Airbus In Service Aircraft (MOZAIC; now IAGOS-MOZAIC; Marenco et al. (1998)) projects and the Civil Aircraft for the Regular Investigation of the atmosphere Based on an Instrument Container (CARIBIC I and II; now IAGOS-CARIBIC; Brenninkmeijer et al., 1999, 2007, https://www.caribic-atmospheric.com, last access: 10 May 2021).
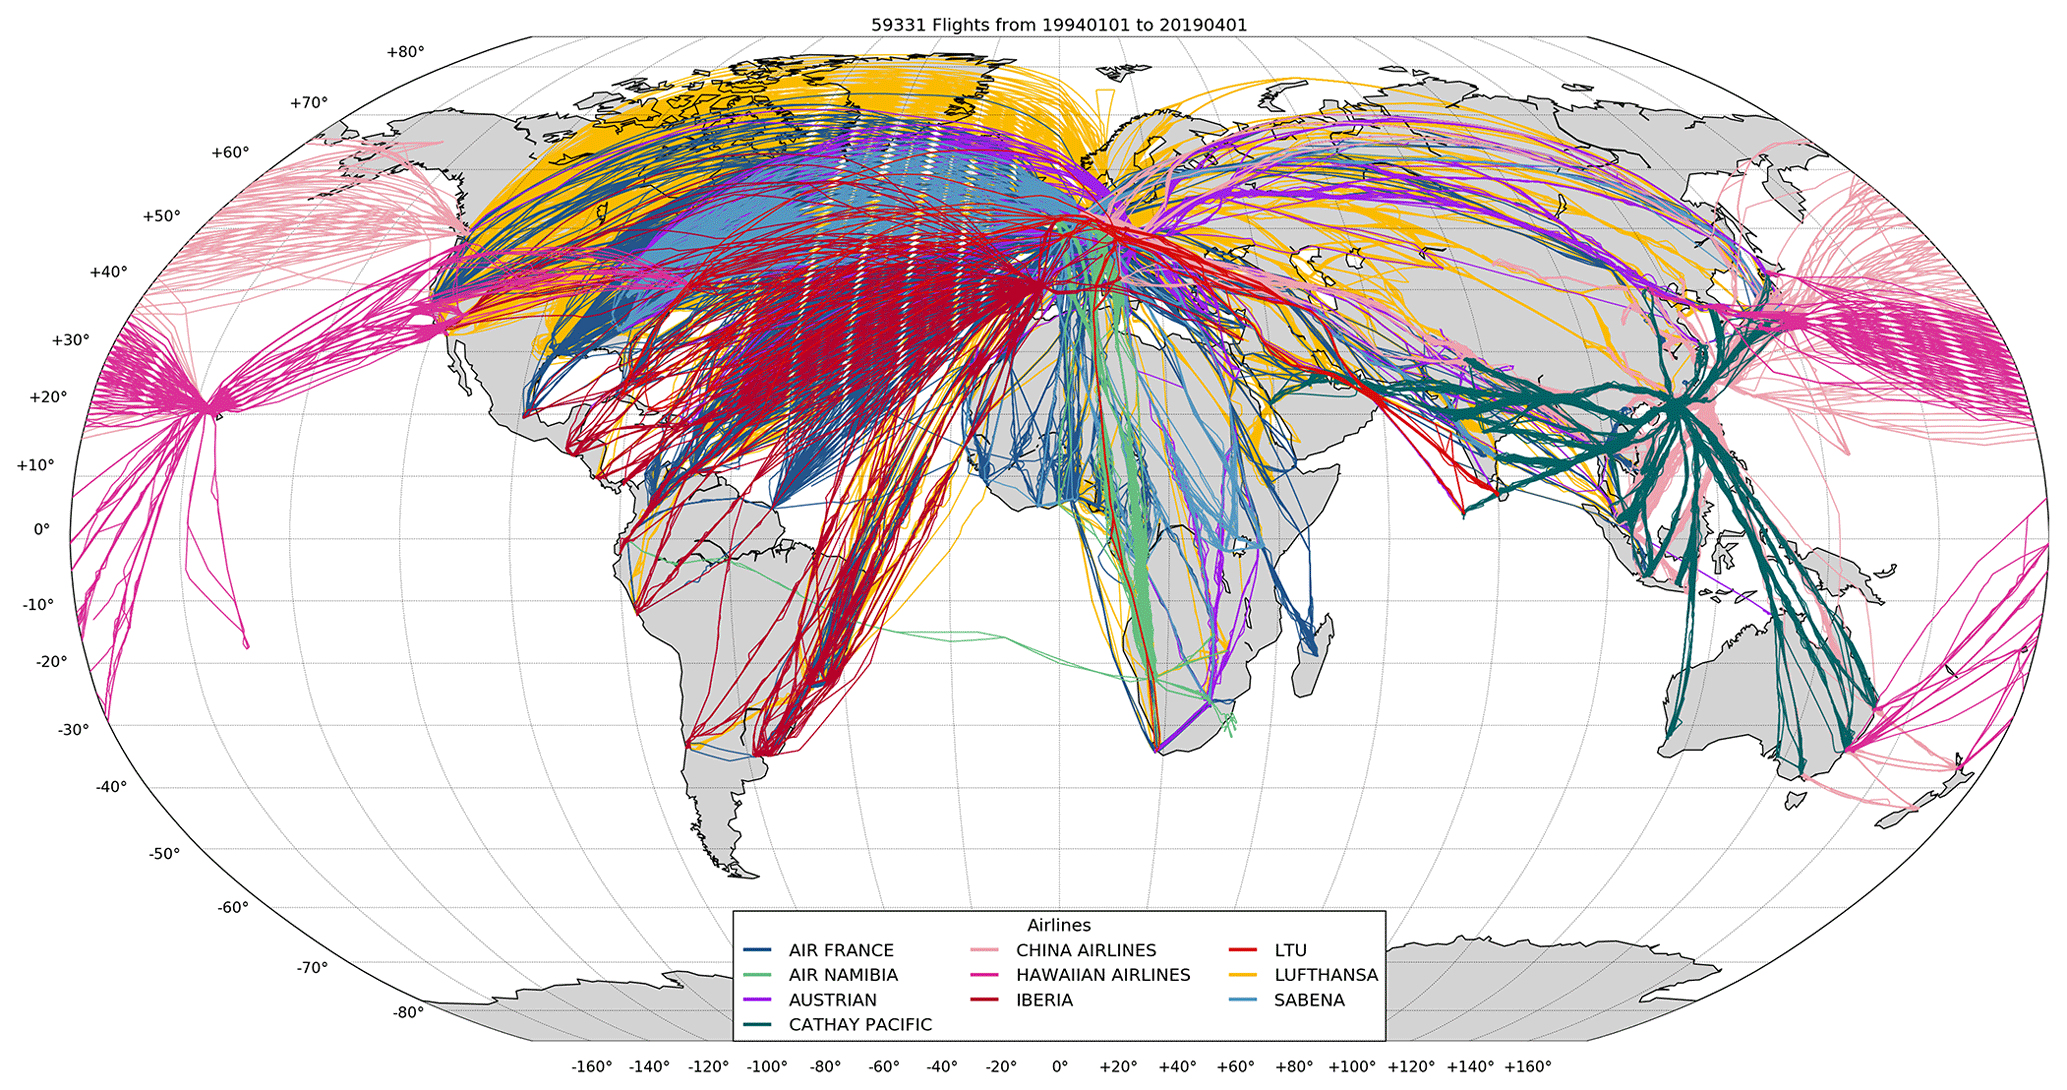
Figure 1IAGOS aircraft fleet routes per airlines since 1994.
The IAGOS program was inspired by the Global Atmospheric Sampling Program (GASP) that was started by the National Aeronautics and Space Administration (NASA) in 1975 (Perkins and Papathakos, 1977; Falconer et al., 1978; Falconer and Pratt, 1979) and showed that civil aircraft can serve as a new kind of observing platform for the atmosphere and can provide high temporal and spatial resolution for a relatively low cost compared to dedicated research aircraft field campaigns (Eyres and Reid, 2014). In the 1990s, the European aircraft manufacturer Airbus, concerned by the probable growing impact of the aeronautical industry on climate, supported the Centre National de la Recherche Scientifique (CNRS) to develop the MOZAIC program with five long-range Airbus A340s permanently equipped with sensors to sample O3 (Thouret et al., 1998), water vapor (Helten et al., 1999; Smit et al., 2014), CO (since 2001; Nédélec et al., 2003) and NOy (2000–2005; Volz-Thomas et al., 2005). At about the same time, the CARIBIC program was launched in Germany with a different but complementary approach compared to MOZAIC. In MOZAIC, measurements of few key atmospheric components are taken on every flight made by the aircraft. In CARIBIC, every month, a 1 t capacity aircraft freight container is loaded onto an aircraft to sample a large number of atmospheric species (up to 100 species). Originally planned for few years of operation, strong long-term support from the French and German ministries of research, the European Union (UE Framework Program funding) and the participating airlines (Air France, Lufthansa, Iberia, Cathay Pacific, China Airlines, Hawaiian Airlines, Austrian Airlines, Air Namibia, Sabena) has allowed IAGOS to equip 17 aircraft in 25 years (nine retired), delivering an impressive amount of measurements, both at cruising altitude (about 180 hPa) and during landings and takeoffs over cities. It represents more than 60 000 flights of 6 to 8 h duration in average and around 120 000 profiles over 338 cities. In total, it is about 3.5 million points of observation spread around the world (see Fig. 1). A more detailed overview of the IAGOS program and instruments can be found in Petzold et al. (2015).
Here, we focus on the O3 and CO data measured within the IAGOS program. These two atmospheric components have been identified as essential climate variables (GCOS, 2010) for which long-term monitoring is a key requirements for climate change projections. O3 is the third most effective climate forcer in the upper troposphere–lower stratosphere (UTLS) after CO2 and CH4 (IPCC, 2013) and it has a detrimental impact on the human health. CO leads the production of O3 by oxidation by the hydroxyl radicals (OH) and, at the same time, affects the oxidation potential of the troposphere (CO can act to both create and destroy OH) (Feilberg et al., 2002). CO, as primary pollutant formed by combustion processes, is also a good proxy to track troposphere–stratosphere vertical transport and transcontinental transport pathways of plumes due to its relative long lifetime.
Until the 1990s, ozonesondes (i.e., the World Ozone and Ultraviolet Radiation Data Centre; WOUDC) used to be the primary source of information on long-term changes of tropospheric O3 (Tanimoto et al., 2015) besides the monitoring ground stations (i.e., the World Data Centre for Greenhouse Gases; WDCGG) for the lower troposphere. For CO, the global sustainable observations for the troposphere came in 1999 with the satellite MOPITT (Measurements of Pollution in the Troposphere), also supported for validation by ground stations and research aircraft campaigns. O3 and CO measurements have been part of the MOZAIC system since 1994 and 2001, respectively, with a large spatial and temporal coverage over different regions. Compared to other platforms, the IAGOS measurements are in situ and the sampling techniques and the calibration strategies have remained the same since the beginning of the program (Nédélec et al., 2015). The avionic setup and the certification processes have evolved to comply with current aeronautical civil safety regulations. Because of this long-term continuity, the IAGOS dataset is particularly adapted to studies of decadal trends and climatologies (Thouret et al., 2006; Zbinden et al., 2006; Hess and Zbinden, 2013; Zhang et al., 2016; Petetin et al., 2016a, b, 2018b; Gaudel et al., 2018; Cohen et al., 2018) and also air quality studies in and around urban agglomerations in the lower troposphere (Petetin et al., 2018a) thanks to the many international airports that serve big cities.
Supported by the European IAGOS for the Atmospheric Service (IGAS) project (see Petzold et al., 2015 and http://www.igas-project.org/, last access: 10 May 2021) launched in 2013, great efforts have been made to document standard operating procedures and to implement robust quality assurance and quality control (QA/QC) procedures for each measured atmospheric component. As a long-term monitoring program and planned to last as long as it gets support from the aeronautical industry and public research entities, it is of primary importance to guarantee the traceability of the data and to regularly track the performance of the instruments in order to ensure a consistent time series. In this paper, we present results which are part of the procedures for the QA/QC routinely performed within the IAGOS program. We investigate the internal consistency of the IAGOS dataset over the period 1994–2020, for O3 and CO, by intercomparing co-located IAGOS measurements obtained from the different aircraft of the fleet.
This study is organized as follows: Sect. 2 describes the instrumentation. The focus here is not to provide details on the IAGOS-MOZAIC, IAGOS-Core and IAGOS-CARIBIC aeronautical system setup since all the descriptions can already be found in their associated publications Marenco et al. (1998), Nédélec et al. (2015) and Brenninkmeijer et al. (2007). Similarly, description of the corresponding instruments measuring O3 and CO can also be found in Thouret et al. (1998), Nédélec et al. (2003, 2015), Zahn et al. (2012) and Scharffe et al. (2012). However, for a smooth reading of the paper, some key details of the project concepts are provided. Each subprogram will hereafter be referred to as MOZAIC, IAGOS and CARIBIC (all being part of the IAGOS infrastructure). In Sect. 3, we will briefly describe the QA part of the standard operation procedures (SOPs) that each O3 and CO sampling unit undergoes before, during and after installation on the different IAGOS aircraft. In the two last sections, the methodology used to evaluate the long-term internal consistency of IAGOS O3 and CO, and then the global results since 1994 are presented.
2.1 Concept overview
Equipping passenger aircraft with scientific instrumentation for atmospheric observations requires a unique and original approach in order to match scientific needs with the safety rules in the airline industry. Airborne observation programs using civil aircraft as a measurement platform share the same core characteristics. First, in-flight operations (system powering, measurements, calibration, data acquisition and safety checks) must be completely automatic with no attention required by the flight crew. Secondly, system maintenance should never interfere with the aircraft schedules. Finally, and maybe the most challenging, all equipment and structural modifications added to the aircraft (support racks, inlets, etc.) must meet the requirements of either the European Aviation Safety Agency (EASA), Federal Aviation Administration (FAA) or any other legal airworthiness institution. This is covered by the deliverance of a supplemental type certificate (STC). All measuring, controlling and safety systems, are powered by the aircraft facilities. Besides the deployment of dedicated scientific instruments, flight navigation and meteorological (see Table 1) data made by the aircraft system itself are collected using the Aeronautical Radio Inc. (ARINC) protocol.
Table 1Parameters provided by the A340/A330 aircraft system.

* Above mean sea level.
2.2 Fleet
Table 2 presents the list of aircraft that have been equipped with the MOZAIC, the IAGOS and CARIBIC systems. Since 1994, nine international airlines, with 17 aircraft in total, with their home bases in various airports, have joined the programs. For MOZAIC, five Airbus A340s were equipped before delivery during the aircraft manufacturing at the Airbus facilities in Toulouse. This process was not applied for the IAGOS system. It can be noted that aircraft with a manufacturer serial number (MSN) lower than 100 carried the MOZAIC measuring system for over 10 to 20 years until the last aircraft retired in 2014. The CARIBIC cargo container first flew on a Boeing 767 from LTU between 1997 and 2002 before an A340 (D-AIHE) from Lufthansa (DLH). First the DLH IAGOS aircraft, the A340 MSN 304 D-AIGT, joined the fleet in 2011. During the following 6 years, nine additional A340s or A330s were equipped with the system. For IAGOS, the aircraft modification is performed during the long maintenance layovers which occur roughly every 5 to 10 years of aircraft lifetime. Some IAGOS equipped aircraft are retired earlier than others depending on the requirements of the airline. Between 2011 and 2014, four IAGOS, one CARIBIC aircraft and three MOZAIC A340s were operating. This allows us, later in this study, to compare the performance of the three different systems together.
Table 2List of the aircraft manufacturer serial number (MSN) equipped with the IAGOS-MOZAIC, IAGOS-Core and IAGOS-CARIBIC systems since 1994.
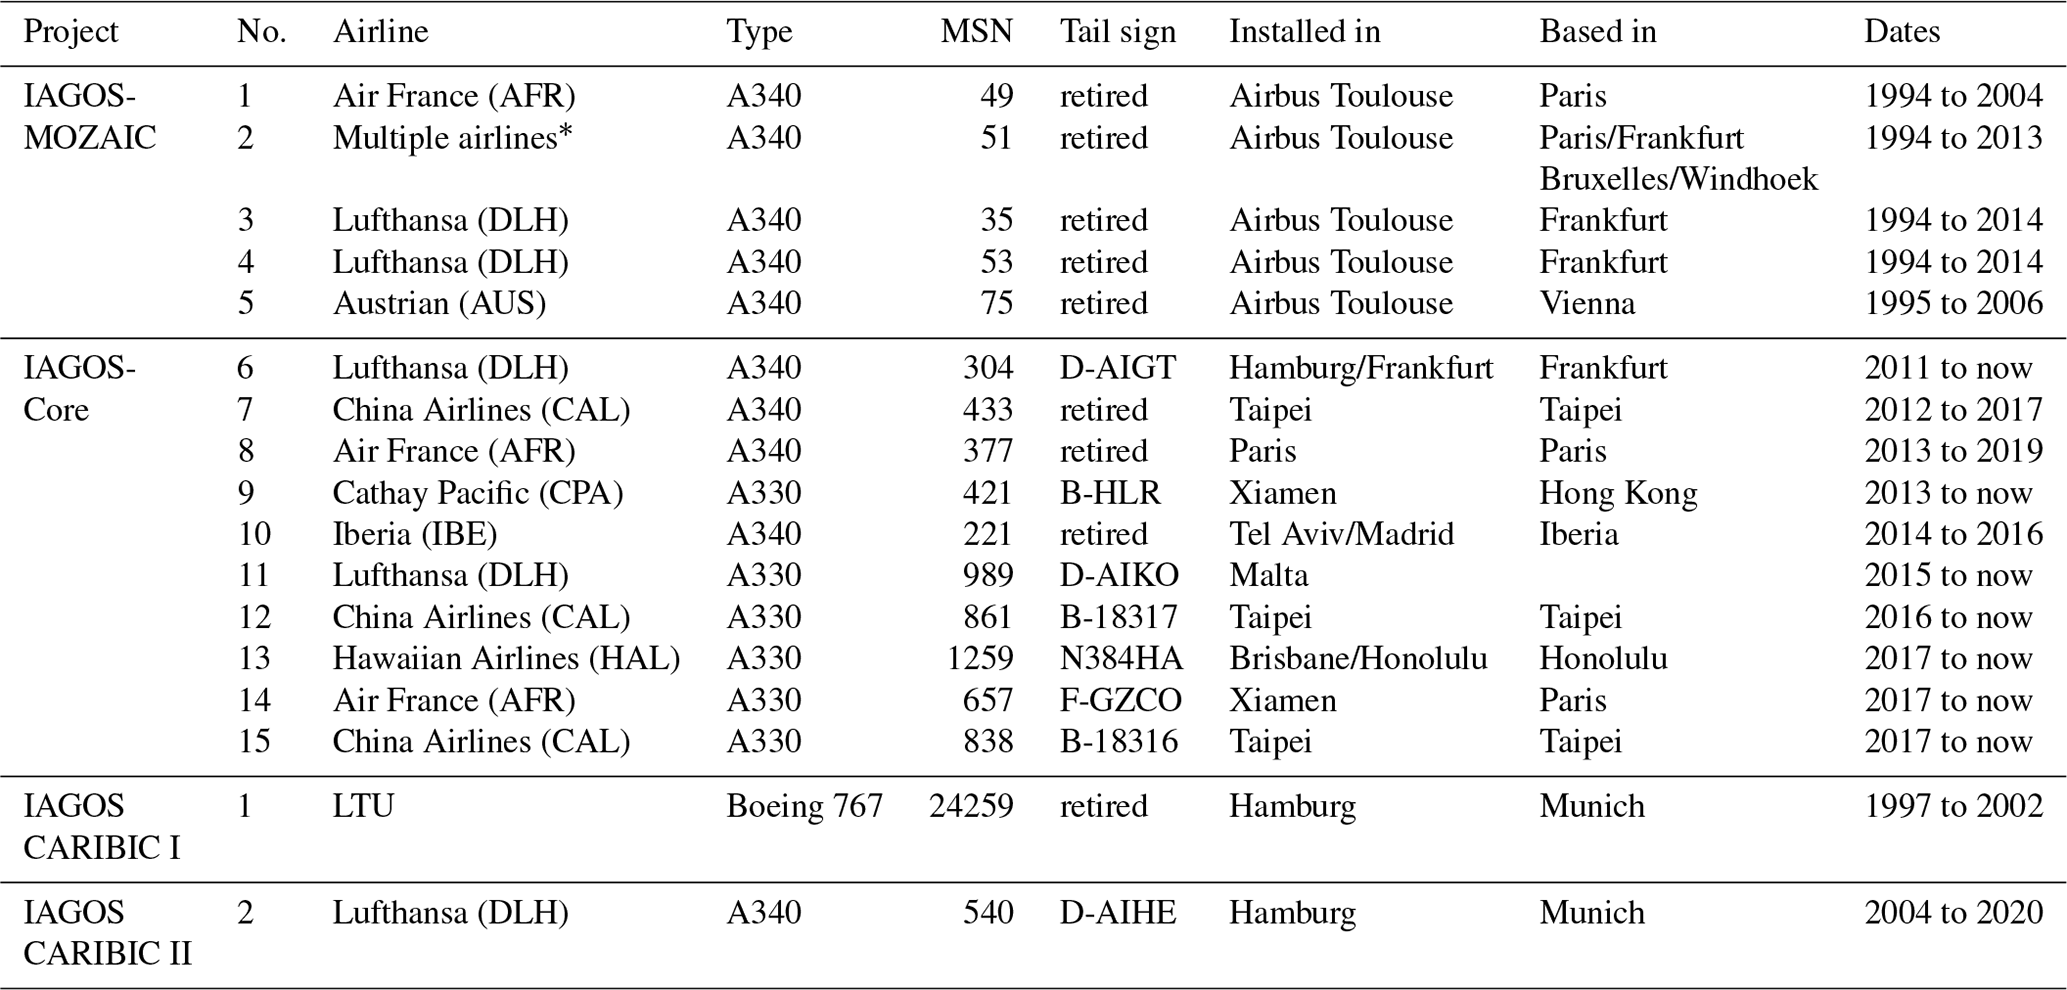
* This aircraft was operated first by Air France, then Sabena (ex-Sogerma) (SAB), then Lufthansa and finally Air Namibia (SW).
2.3 System setups
Figure 2 shows the MOZAIC system installation inside one of the five equipped A340s. All the mechanical parts and other equipments were covered by an Airbus certification. An instrument cabinet rack was located at the starboard side in the avionics bay below the cockpit. The rack was composed of five shelves that received removable/replaceable units. The upper shelf contained a commercial O3 analyzer (Thermo Scientific, model 49), the computer that controls the safety of the systems, the system start at takeoff and the stop at landing, the ARINC data acquisition and the data backups. On the third shelf, there was a modified CO instrument (Thermo Scientific, model 48 CTL; Nédélec et al., 2003) (this is the configuration post-2001), and below, there were the pressurization pumps (one for CO and one for O3) that drive the air from outside the aircraft through an inlet plate (see Fig. 3a and b) located on the fuselage at the port side. The data were stored on personal computer memory card international (PCMCIA) disks replaced roughly every 2 months. In the case of O3 and CO instrument failure, the units could be independently replaced by spares. In total, through the MOZAIC period, from 1994 to 2014, six identical O3 analyzers and six identical CO analyzers with the same measurement uncertainties (see Table 3) were dispatched over the five MOZAIC aircraft, meaning that during the deployment period, only one spare was available at any one time. In the rest of this study, MOZAIC instrument serial numbers (SNs) are referred to SNPM (01PM, 02PM, 03PM, etc.).
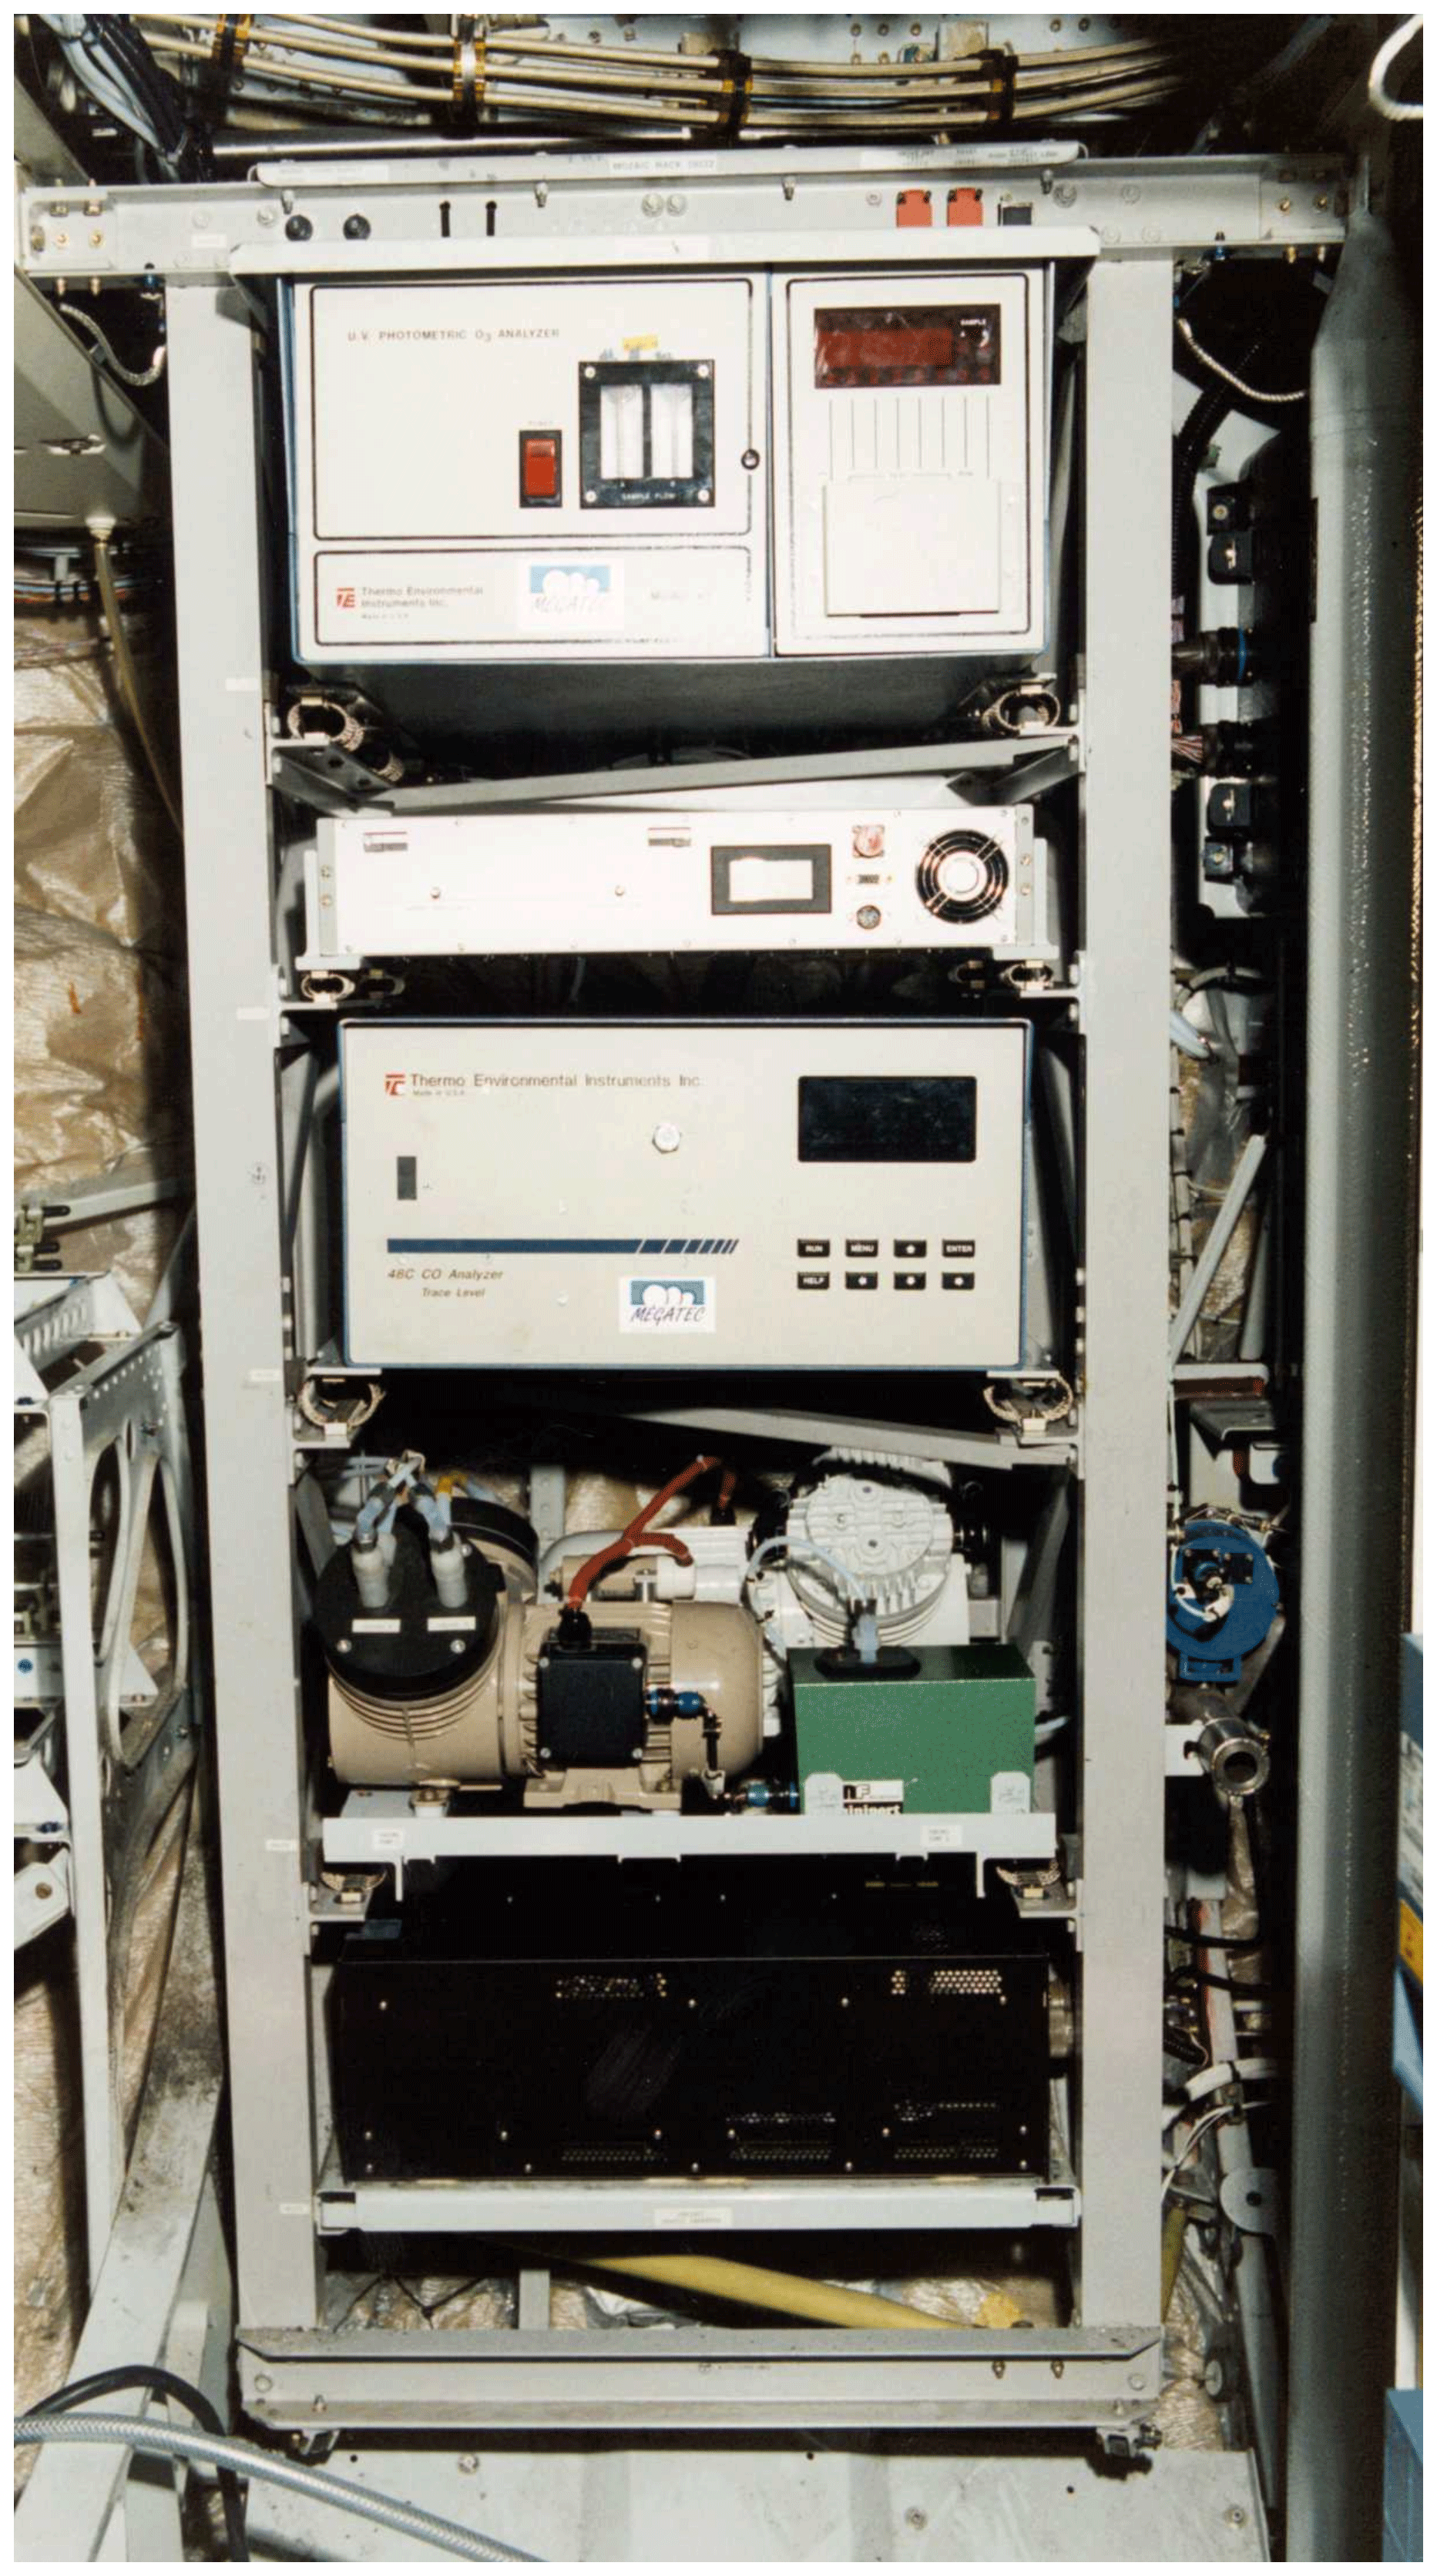
Figure 2Picture of the MOZAIC system located on a A340 starboard side. See text for a brief description.
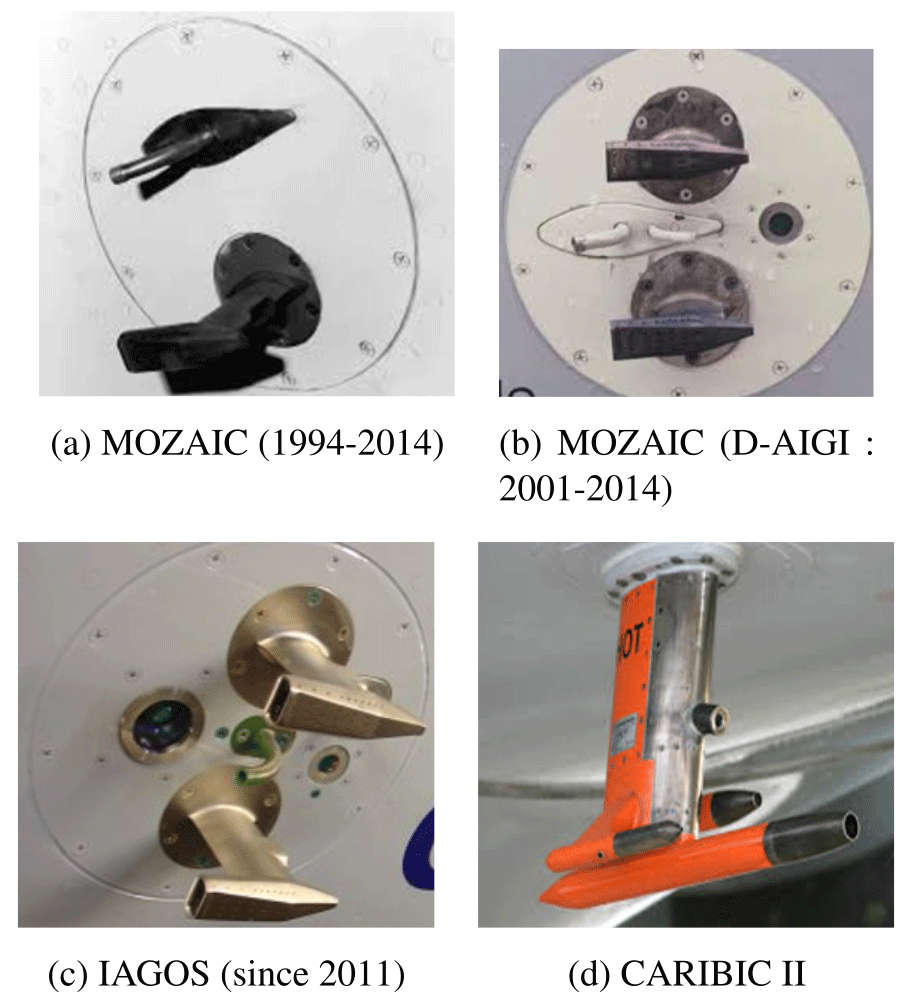
Figure 3Pictures of the inlet plates used throughout the various programs. In panels (a), (b) and (c), air for O3 and CO measurements is collected through the small forward-facing pitot tube. In panel (c), it is done using the lowest small inlet. Other inlets and Rosemount pitots are for water, aerosol or other gas measurements. The inlet shown in panel (b) was installed on one MOZAIC aircraft (D-AIGI) with an additional Rosemount inlet for measurements. It is the precursor of the IAGOS inlet.
In 2009, CNRS and Forschungszentrum Jülich (FZJ) initiated the project to modernize the MOZAIC system to produce a more sustainable concept that would be compliant with the safety regulations of any country. Figure 4 shows a picture of the system inside an A330 aircraft (which shares a similar fuselage to the A340). The setup differs totally from the MOZAIC system. The new cabinet rack is located in the avionics compartment on the aircraft's port side, close to the inlet plate. One of the reasons for changing the position of the cabinet rack from the starboard side to the port side is that on modern aircraft the area that is used to house the MOZAIC cabinet is usually occupied by the in-flight entertainment system. The advantage of the new position on the port side was that it is closer to the inlet plate. The cabinet rack was completely redefined in order to house three removable boxes: one for the pressurization pumps, one for O3 and CO measurements, the so-called “Package1” (or P1), and a third box for either one of the two optional certified “Package2” (or P2), one for CO2 and CH4 measurements (Filges et al., 2015) and one for NOx measurements (Berkes et al., 2018). Compared to MOZAIC, for which O3 and CO were acquired by two separate instruments, the choice for IAGOS was to compact both units into the same box. The measurement characteristics, however, remain the same (see Table 3). P1 also serves as the central data acquisition system that collect the aircraft ARINC data, the IAGOS Capacitive Hygrometer (ICH; Helten et al., 1999) data, data from the Backscatter Cloud Probe (BCP; Beswick et al., 2014) and data from Package2 if installed. The data files are transferred to the IAGOS server at CNRS in Toulouse by the Global System for Mobile (GSM) each time the aircraft cargo door is opened/locked up on the ground and if the modem manages to connect to 2G/3G network for several minutes. In 2020, 14 P1 units were distributed over seven IAGOS aircraft. Therefore, there was one spare unit per aircraft. Each P1 has a serial number from 02 to 16. Serial number 01 was a qualification prototype that has not been used since the operational phase of the program started in 2011, and there is no serial number 13.
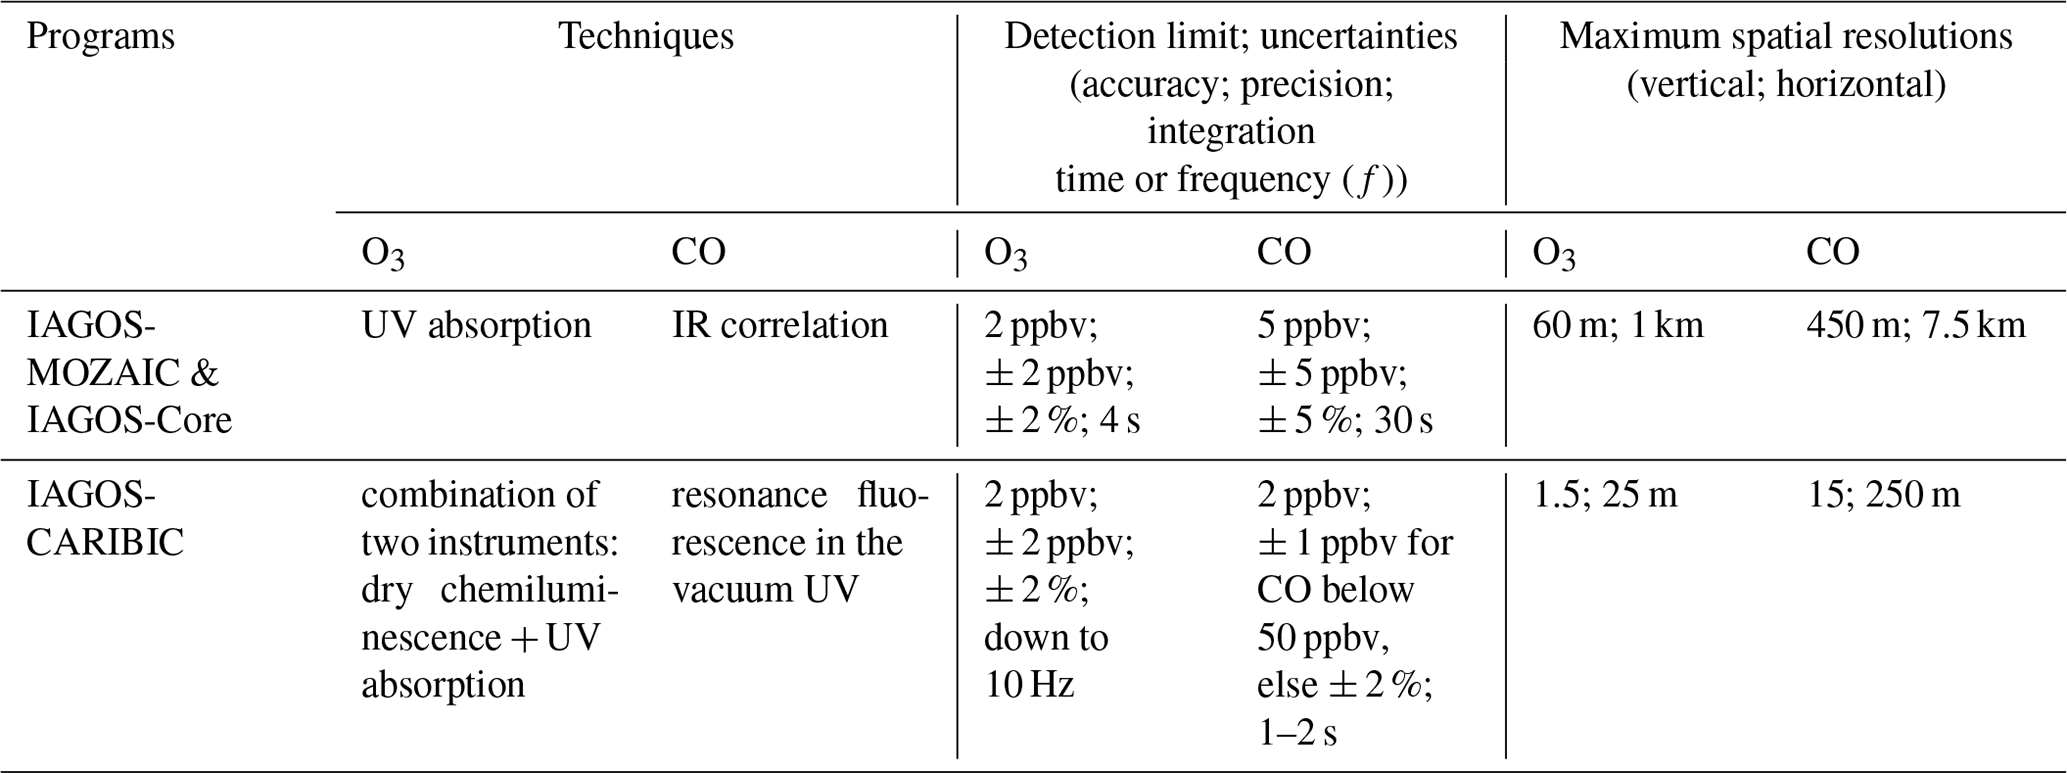
Table 3Summary of the CO and O3 instrument characteristics. Maximum spatial resolutions are just indicative values and are given for civil-aircraft-approximated maximum ascent and descent speed of 15 and 250 m s−1 during cruise.
Within the CARIBIC I and II programs, CO and O3 measurements were performed by two separate units embedded into an modified air freight cargo container that additionally contained more than a dozen other instruments with a total weight of about 1.5 t (Fig. 5). The Lufthansa aircraft, which hosts the CARIBIC container, were modified for the structural addition of an certified inlet system that holds different air intake probes (see Fig. 3d) whether for aerosols, trace gases or water sampling. The container is loaded onto the aircraft for sequences of four to six flights with variable destinations. After takeoff, the main power supply is switched on and a master computer (also in the container) takes command of all instrument activations/deactivations in addition to the acquisition of the ARINC parameters (see Table 1) and other data concerning the functional status of the container. In contrast to MOZAIC and IAGOS which start the trace gases measurements during the takeoff phase (aircraft speed >25 m s−1), the master computer starts the measurements at cruise altitude for CARIBIC I and when the barometric altitude (baro-altitude) is higher than about 2.5 km above ground for CARIBIC II. For that reason and because this study will focus only on profiles, the data from CARIBIC I will be discarded. O3 measurements are performed by a custom-made instrument by Karlsruher Institut für Technologie (KIT) that combines the use of two sampling techniques in one box; the chemiluminescence of a dye in reaction with O3 and the absorption of the UV light by O3. CO mixing ratios are provided, in CARIBIC II, by a custom-improved version of the Aero-Laser model AL 5002 fast-response UV resonance fluorescence instrument. Characteristics, precisions and uncertainties are also summarized in Table 3 for both instruments. CARIBIC aircraft flight sequences are roughly every 30 to 60 d (depending on routes, aircraft availability and the availability of the instruments); therefore, the need to have several spare units is less crucial compared to IAGOS and MOZAIC. Between each period of operation, all instruments can be maintained and redeployed for the next flight sequences.
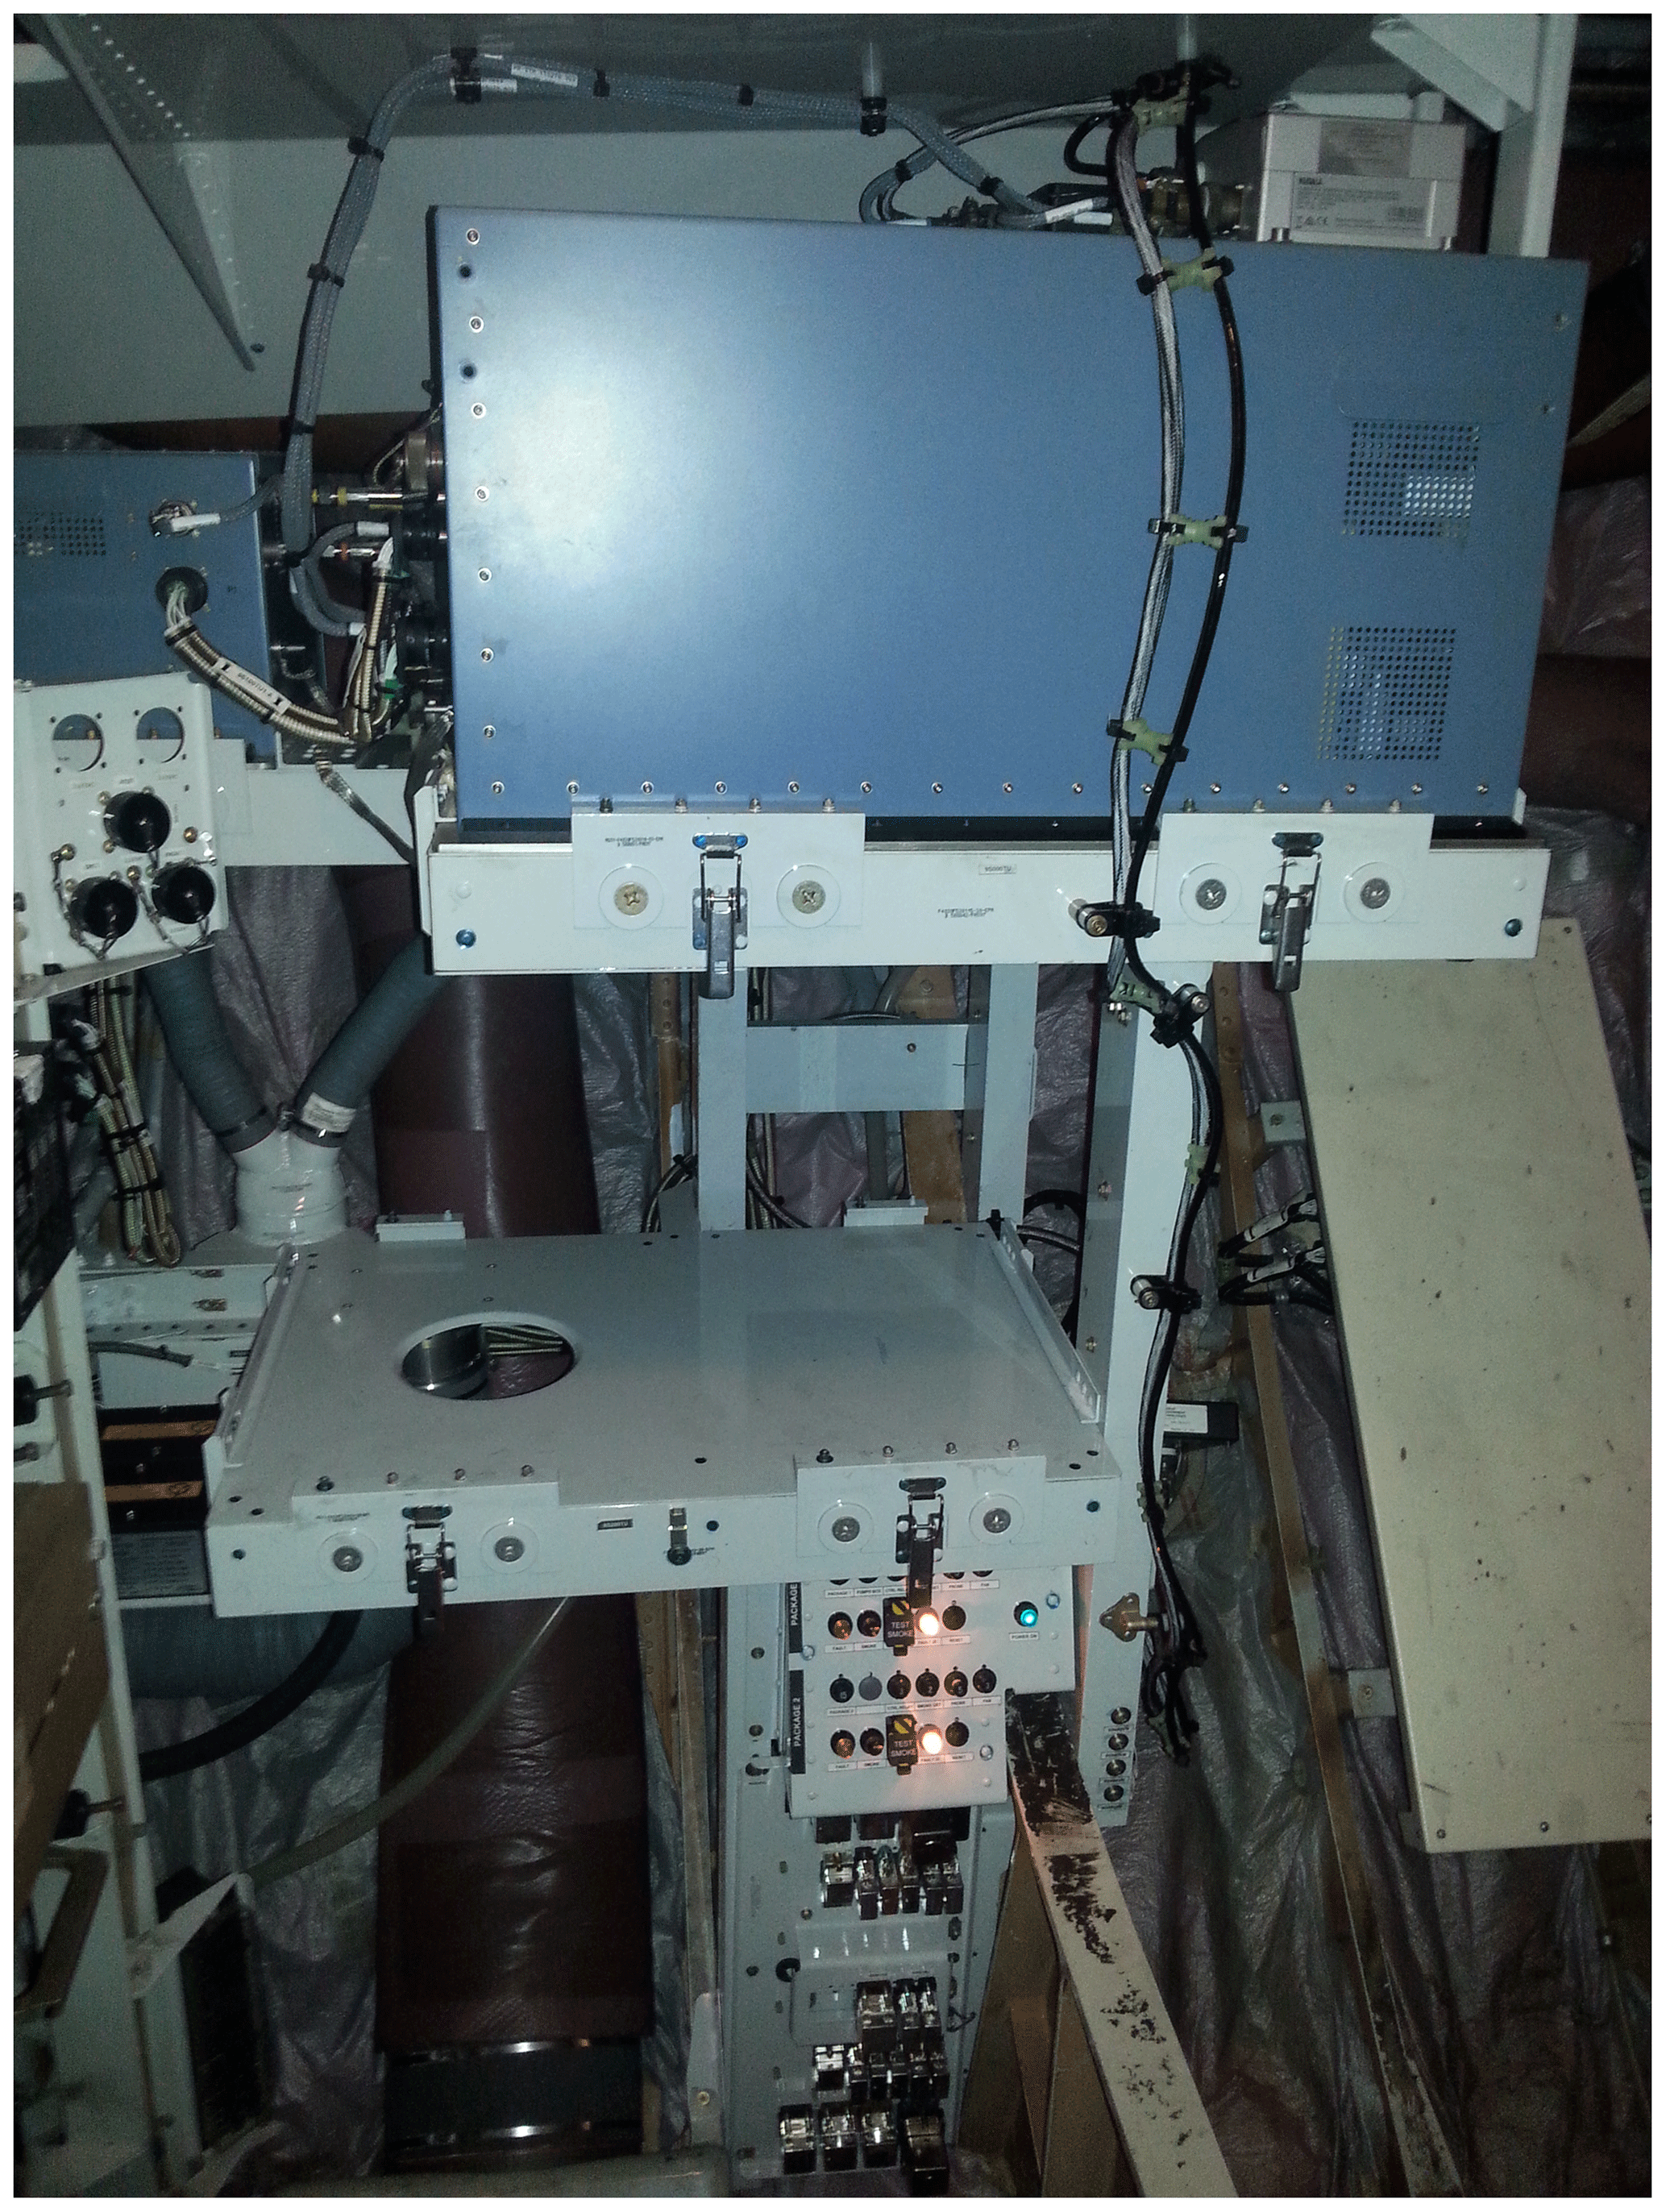
Figure 4Picture of the IAGOS system setup in the avionics bay. The pump box (small blue box in the upper left corner) embeds the pressurization pumps that drive the outside air collected through the pitot (see Fig. 3c) to Package1 (P1; big blue box). The system functioning and safety are managed via the control panel and relay panel seen in the lower part of the picture. The empty shelf is available for Package2 instruments also developed within the IAGOS program.
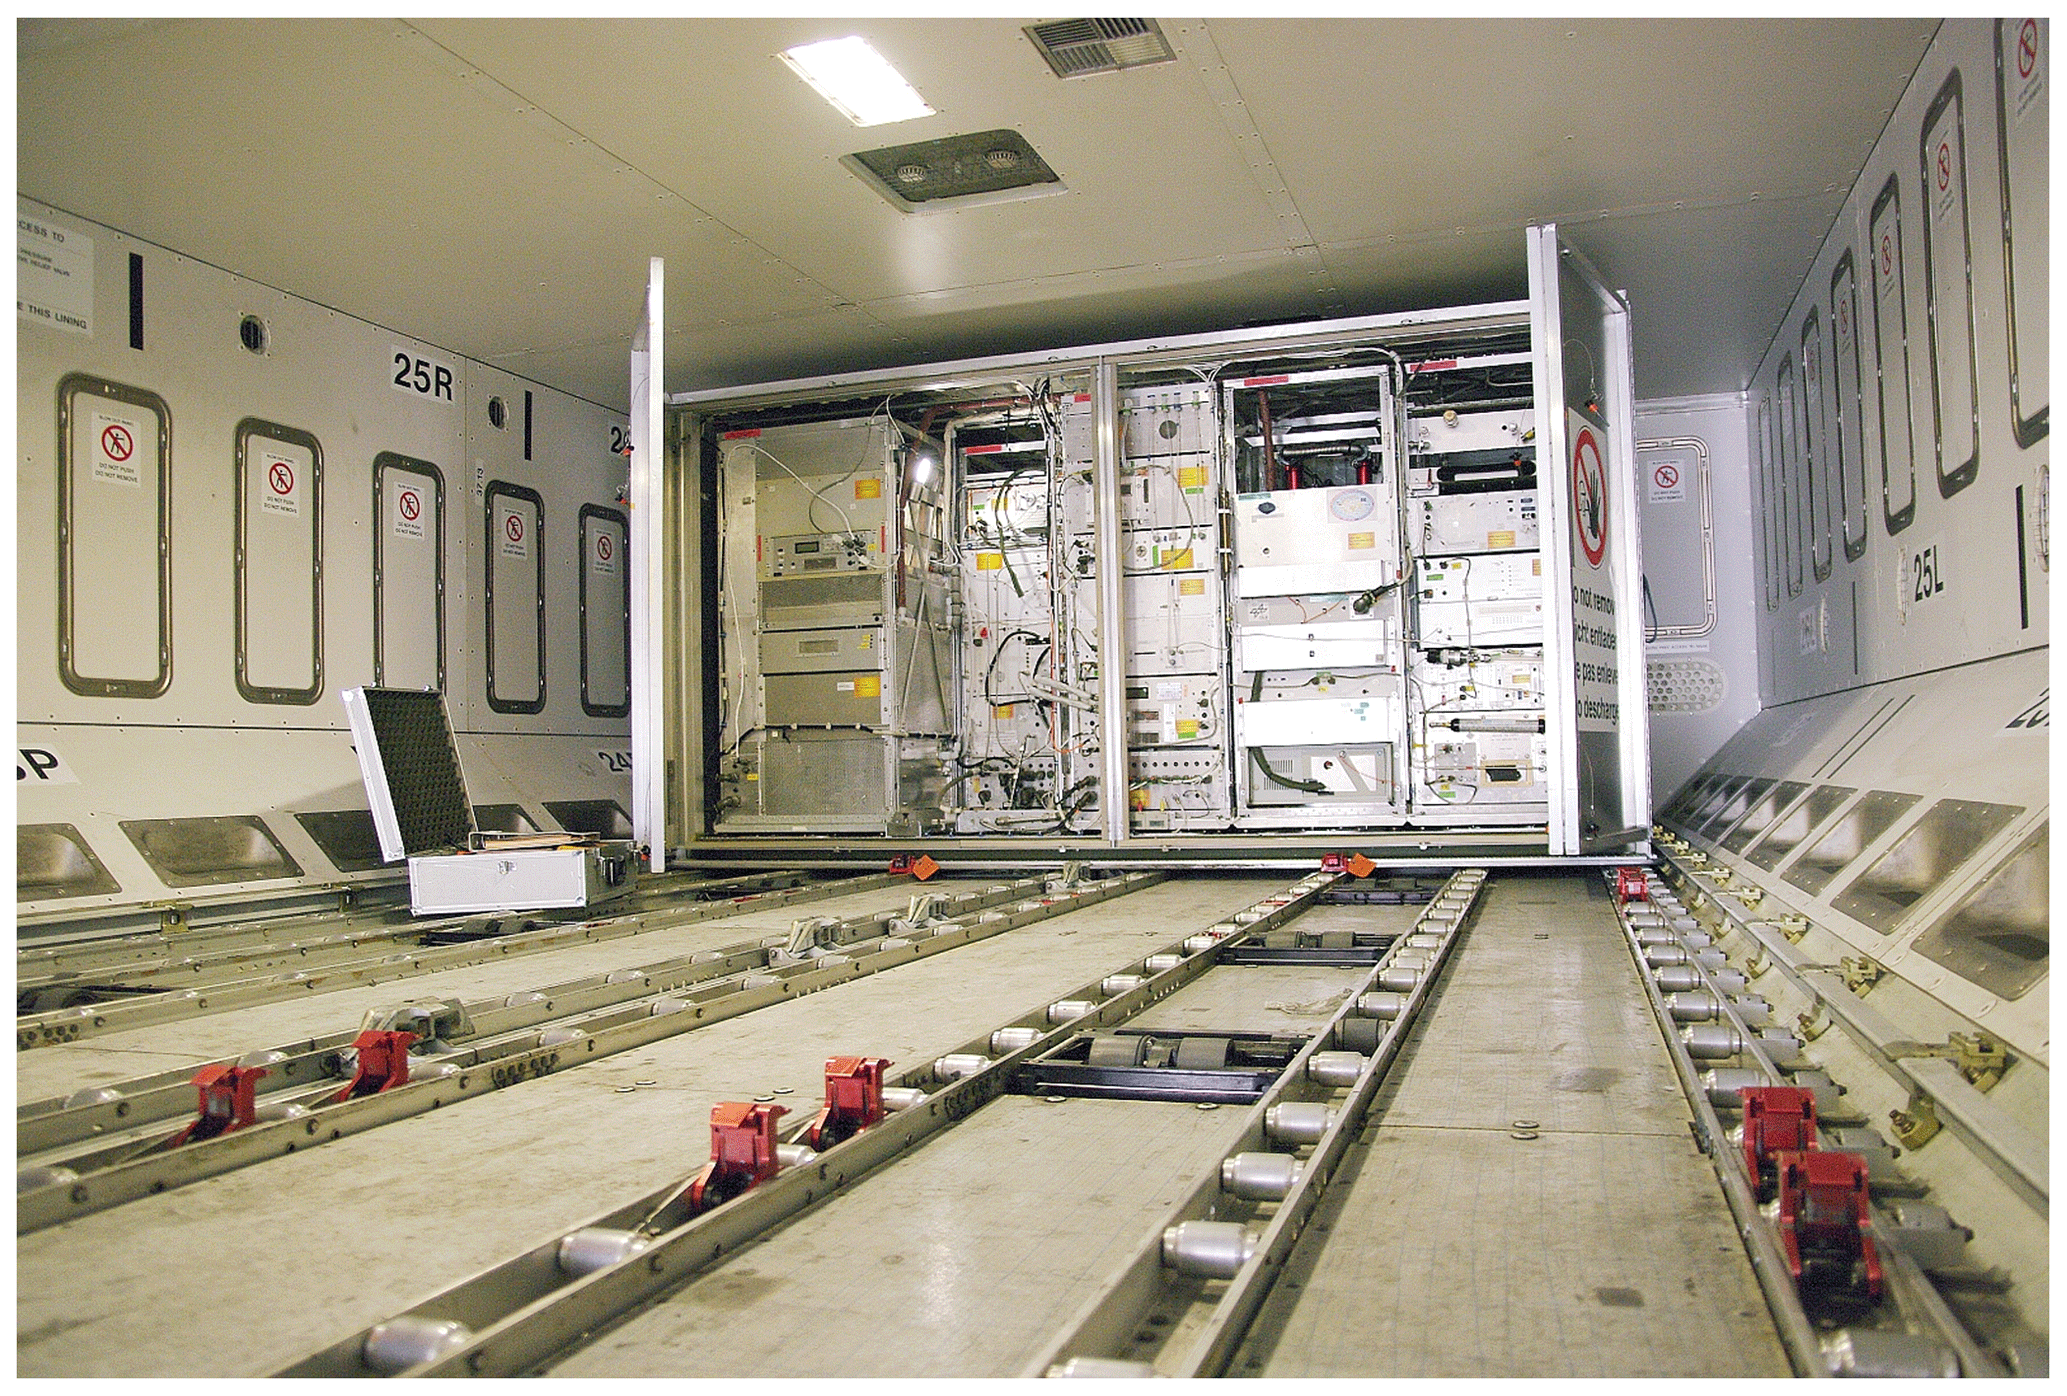
Figure 5Picture of the CARIBIC laboratory container (1.65 t, 19 instruments in 2017) inside the aircraft cargo bay.
3.1 MOZAIC and IAGOS
Before deployment, each measuring unit is cleaned and maintained by a subcontractor that holds an EASA Part 145 agreement1 and according to the corresponding component maintenance manual (CMM), the latter being an official traceable document in regard of the awareness safety rules. All the performed tasks are also traced within an CNRS internal QA/QC document opened for each new maintained unit. After maintenance, O3 and CO from P1 and the MOZAIC instruments are calibrated in the laboratory in Toulouse by the CNRS. For O3, it is performed by comparison with a Thermo Scientific model 49PS reference instrument at several concentration levels to also check the instrument linearity within 1 %. The O3 reference is sent once a year to the French Laboratoire National d'Essais (LNE) for comparison with a traceable National Institute of Standards and Technology (NIST) instrument. For CO, we use a NIST-referenced CO cylinder (CO in N2, 500 ppmv) and a calibrated dilution system. Calibration is performed for several levels of CO to control the linearity of the instrument within 2 %. The CO dilution system is also controlled every year by the French LNE for flow calibration. The last important step in the deployment process is the systematic comparison with a MOZAIC measuring system (identical to Fig. 2) that was kept in the laboratory to serve as a reference. Comparison tests are performed, usually at night, using outside ambient atmospheric air, to make sure that the maintained units are robust and that the measurement difference with the reference instrument remained below 2 % for O3 and 5 % for CO. After these tests have been made, the units are sent to the airlines for a scheduled installation within the standard 6 months of operating time or for an unscheduled replacement if one instrument failed prematurely. The shipping logistics for all IAGOS parts are handled by the IAGOS Maintenance Center (IMC, Enviscope GmbH; http://www.enviscope.de, last access: 1 September 2020).
The installation date of the unit (P1, PM O3 or PM CO) is reported in the QA/QC document as the start of flight period (FP) operation of the unit. The FP ends when the unit is removed from the aircraft. FPs do not depend on whether the instrument is performing measurements successfully, and during this period all instrument failures, main aircraft events, maintenance actions by airline staff on the IAGOS system and any noticeable issues that could impact the O3 and CO measurements are reported and traced in the QA/QC document within this time. FPs are named using the aircraft MSN, the units SN and the number of the FP (e.g., FP0989-10-P1SN04 for operation FP number 10 of P1 serial number 04 on DLH D-AIKO MSN0989). To refer to the aircraft, the SN is used instead of the tail sign since aircraft can be sold to another airline during its operating life. Also, linked to the FP, instrument functional performance is reported and updated. This is usually done by flagging the functional parameters of the instrument according to previously defined thresholds of normally operating values.
After the 6-month deployment on the aircraft, the instruments are returned to CNRS, and the O3 and CO instruments are calibrated and checked for drifts against the laboratory references. This is the last check before applying, if necessary, a correction to the data and to finally deliver the Level 2 (L2) data to the scientific community.
3.2 CARIBIC
Because the container is set up aboard the aircraft for only a few flights, the scientific instruments inside undergo less constraints due to the takeoffs and landings. Therefore, frequent laboratory-based maintenance are not necessary and these are performed roughly every 2 months (about eight flights). The O3 instrument maintenance is done at KIT and mostly consists in performing leak test cleaning, pressure tests and the replacement of chemiluminescence sensor disk. All the maintenance tasks are traced filling out a maintenance list and shipping list before reintegration in the container. The functioning of the UV photometer is controlled every 4–6 months by comparison with a KIT custom-made laboratory O3 instrument (using a Hg lamp as light source) and a long-path UV reference photometer (UMEG GmbH) cross checked by the World Meteorological Organization standard reference photometer no. 15 at the Swiss Federal Laboratories for Materials Science and Technology (EMPA) in Switzerland.
For the CO instrument, the main important maintenance corresponds to the change of the MgF2 CO resonance lamp window every 3 years in order to maintain a high photon transmission statistic. This task was performed for the first time in June 2008. More details can be found in the associated publication (Scharffe et al., 2012).
4.1 Background
The strategy of the program is to expand the number of aircraft equipped with the IAGOS system and to get more airlines (ideally, a minimum of two aircraft per airline) involved in IAGOS. This has several advantages in addition to feed the atmospheric science community with data with more extensive global coverage. First, as maintenance actions can sometimes take weeks or months to be performed on a single aircraft, multiple aircraft are necessary to ensure the continuity of the time series, which is particularly important for the studies of trends. Secondly, multiple aircraft offers the possibility to compare the different O3 and CO instruments that are installed on each aircraft by looking at trajectory coincidences in time and space. During cruise legs, trajectory coincidences (e.g., at least two aircraft that followed a quasi-identical route) are occasionally possible and are very useful in the data validation process. Unfortunately, they do not occur often enough to generate robust statistics. There are, however, many more landings or takeoffs which fall within a maximum 1 h ( min) time window and are suitable for intercomparison (see Fig. 6). Lufthansa has been deeply involved in IAGOS with several equipped aircraft since the beginning of MOZAIC and with several aircraft equipped. As such, there are more than 3000 collocated profiles. There are 340 in Taipei and 171 in Paris. Airbus A330/A340 are long-haul aircraft which serve main international airports. The landing and takeoff coincidences are not necessarily between aircraft of the same airline and more importantly, the mounted O3 and CO instruments are dispatched randomly. Consequently, thanks to the large number of daily coincidences, it is possible to perform a quality control on the O3 and CO measurements, getting a fair idea on how each serial number instrument compared to the others according to some limitations inherent to the use of commercial aircraft, which are exposed in the following section.
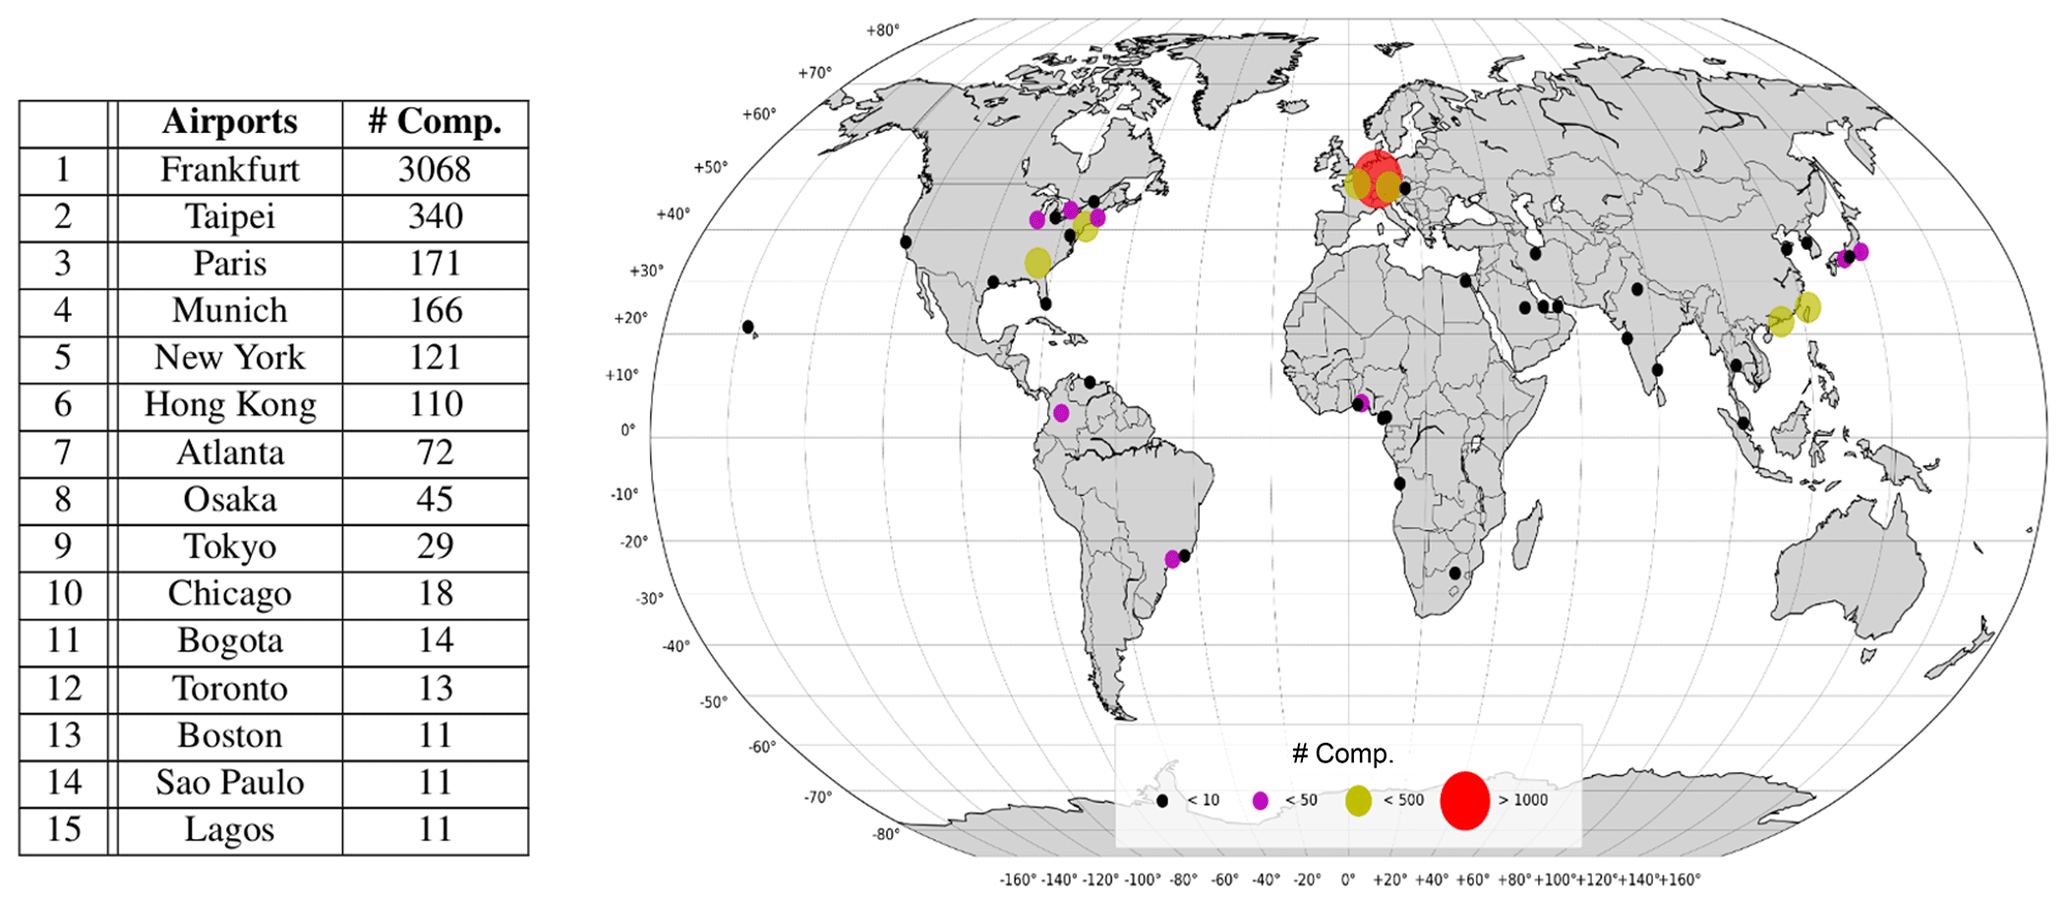
Figure 6World map showing the total number of profile flight intercomparisons observed over airport cities since 1994 for the entire aircraft fleet. The criterion for the maximal time coincidence is 1 h ( min).
4.2 Methodology
4.2.1 MOZAIC and IAGOS
One of the main obvious limitations with the use of commercial aircraft as a scientific measuring platform is that air routes and departure/arrival schedules are fixed by the airlines and, of course, strict airworthiness rules must be respected for the safety of the passengers. This implies explicitly that we cannot have two aircraft flying too close from each other to perform proper flight intercomparison exercises as is often the case for field campaigns using multiple research aircraft. Therefore, even though as shown in the section above, there can be several IAGOS aircraft landing or taking off at the same airport within a time difference less than 1 h (sometimes less than 10 min), we cannot expect that they follow the same routes and, consequently, that they always fly in the same physically and chemically steady air mass. It is also reasonable to not expect perfect 1 : 1 regression for the comparisons; however, by choosing adequate screening criteria for air masses and flight track coincidences, it is possible to get a good estimate of the internal consistency of the instruments.
Figure 7 illustrates the method applied to each flight stored in the database at the CNRS server in Toulouse. We present the steps used for the operational phase of the QC procedure in the IAGOS program. All the data used in the following study are L2 final data provision (see also http://www.iagos-data.fr, last access: 10 May 2021 and Petzold et al., 2015 for details), which are the data that are distributed publicly. For each individual flight, a Java script is triggered to look for any other flight in the database that has landed or taken off at the same airport within a time window of maximum 1 h. Some examples of the testing phase of this procedure were presented in Nédélec et al. (2015). Figure 7 shows an example with one aircraft equipped with the MOZAIC system and one aircraft equipped with IAGOS system that both took off at Frankfurt airport on 17 December 2012 with only a 13 min time difference. As is often the case, the two aircraft quickly headed to different destinations, taking different routes. After only few minutes, the distance between the two tracks can be several hundred kilometers. The profiles of O3 and CO measured by these two aircraft are plotted in Fig. 7c. The curves do not refer to the name of the aircraft but to the serial number of the O3 or CO instrument for MOZAIC or the serial number for Package1 in the case of IAGOS. In this specific example, the MOZAIC aircraft is mounted with the O3 instrument serial number 03PM and CO instrument serial number 04PM that are compared with IAGOS Package1 serial number 03. On these two figures, horizontal gray lines indicate where the air masses encountered by the two aircraft present similar characteristics considering the potential temperature (T), the wind direction (WindDir) and the potential vorticity (PV). The wind direction and the temperature are measured directly by the aircraft sensors (see Table 1). The atmospheric pressure and the absolute temperature are also measured directly by the aircraft and are used to derive the potential temperature. The PV, which is often used to approximate the position of the dynamical tropopause that separates the upper troposphere from the stratosphere (Holton et al., 1995), is taken from the ECMWF operational analyses and evaluated at the aircraft position (Sauvage et al., 2017) by the FLEXible PARTicle dispersion model (FLEXPART; Stohl et al., 2005). Threshold values for the maximum differences at equal barometric altitude of these screening parameters are summarized in Fig. 7b. To prevent the influence of highly variable mixing ratios due to local sources of pollution within the boundary layer, a lower baro-altitude limit is also set to 2 km.
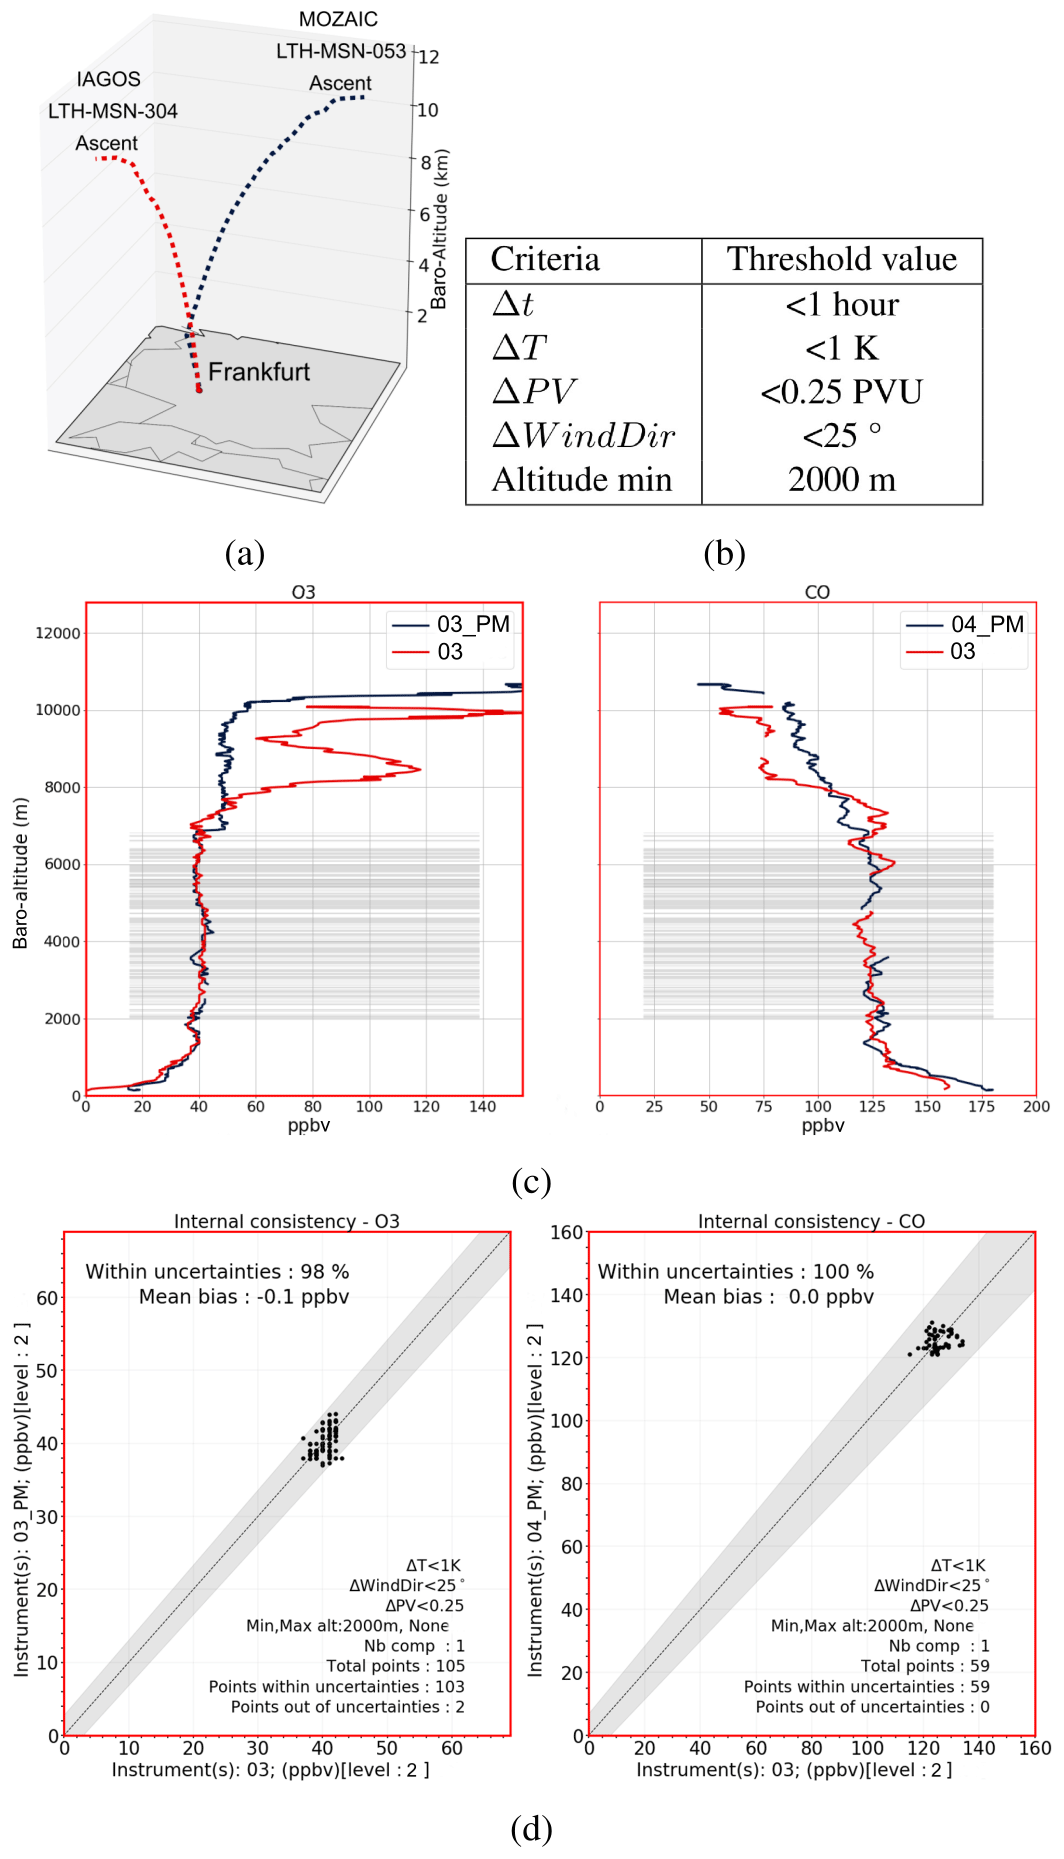
Figure 7O3 and CO profile intercomparisons on 17 December 2012 between MOZAIC Lufthansa msn-053 and IAGOS Lufthansa msn-304. Both aircraft ascend from Frankfurt airport within a 13 min time interval. The MOZAIC aircraft is equipped with the instrument unit serial number 03PM for O3 and 04PM for CO. Package1 mounted on the IAGOS aircraft is serial number 03. The subfigures correspond to (a) aircraft ascent tracks; (b) air mass screening criteria; (c) O3 (left) and CO (right) measurement intercomparison profiles between the Package MOZAIC (black) and IAGOS Package1 (red) instruments. Gray lines correspond to the air masses matching according to the criteria in panel (b). The instrument serial numbers are indicated in the legend; (d) O3 (left) and CO (right) scattergram plots comparing measurements from MOZAIC instrument (ordinate) and the IAGOS instrument (abscissa). The dotted line is the 1 : 1 line; the gray area displays the total uncertainty for both instruments. Statistical information is also displayed for each component (see text).
Figure 7d shows the scattergram plot produced with the measurements made from the two aircraft and resulting from the air mass filtering process (the points highlighted by the horizontal gray lines in Fig. 7c). The gray area represents the quadratic sum of the total uncertainties for each instrument. Since all O3 and CO instruments for MOZAIC and IAGOS have the same characteristics, the gray zone represents the area between , where C is the measured mixing ratio and ΔC is the total uncertainty of the measurements. These scattergram plots are produced routinely for each flight and at each validation step through the process of data validation. Besides plotting the 1 : 1 line and the associated uncertainty, two main key performance indicators are calculated. The first is the bias between the compared instruments. It is the mean of the distance from the 1 : 1 line for every point. The second is more an indication of the dispersion by calculating the percent of measurements that remain within the total instrument uncertainties. This is obtained if each compared measurement agrees with
As it can be noted, the intercomparison plots chosen here, in Fig. 7, correspond to an ideal case study. For O3, instrument 03PM measurements do not differ from P1 serial number 03 (mean bias of almost zero), and 98 % of the points are within measurement uncertainties. For CO, with instrument 04PM, the result is even better.
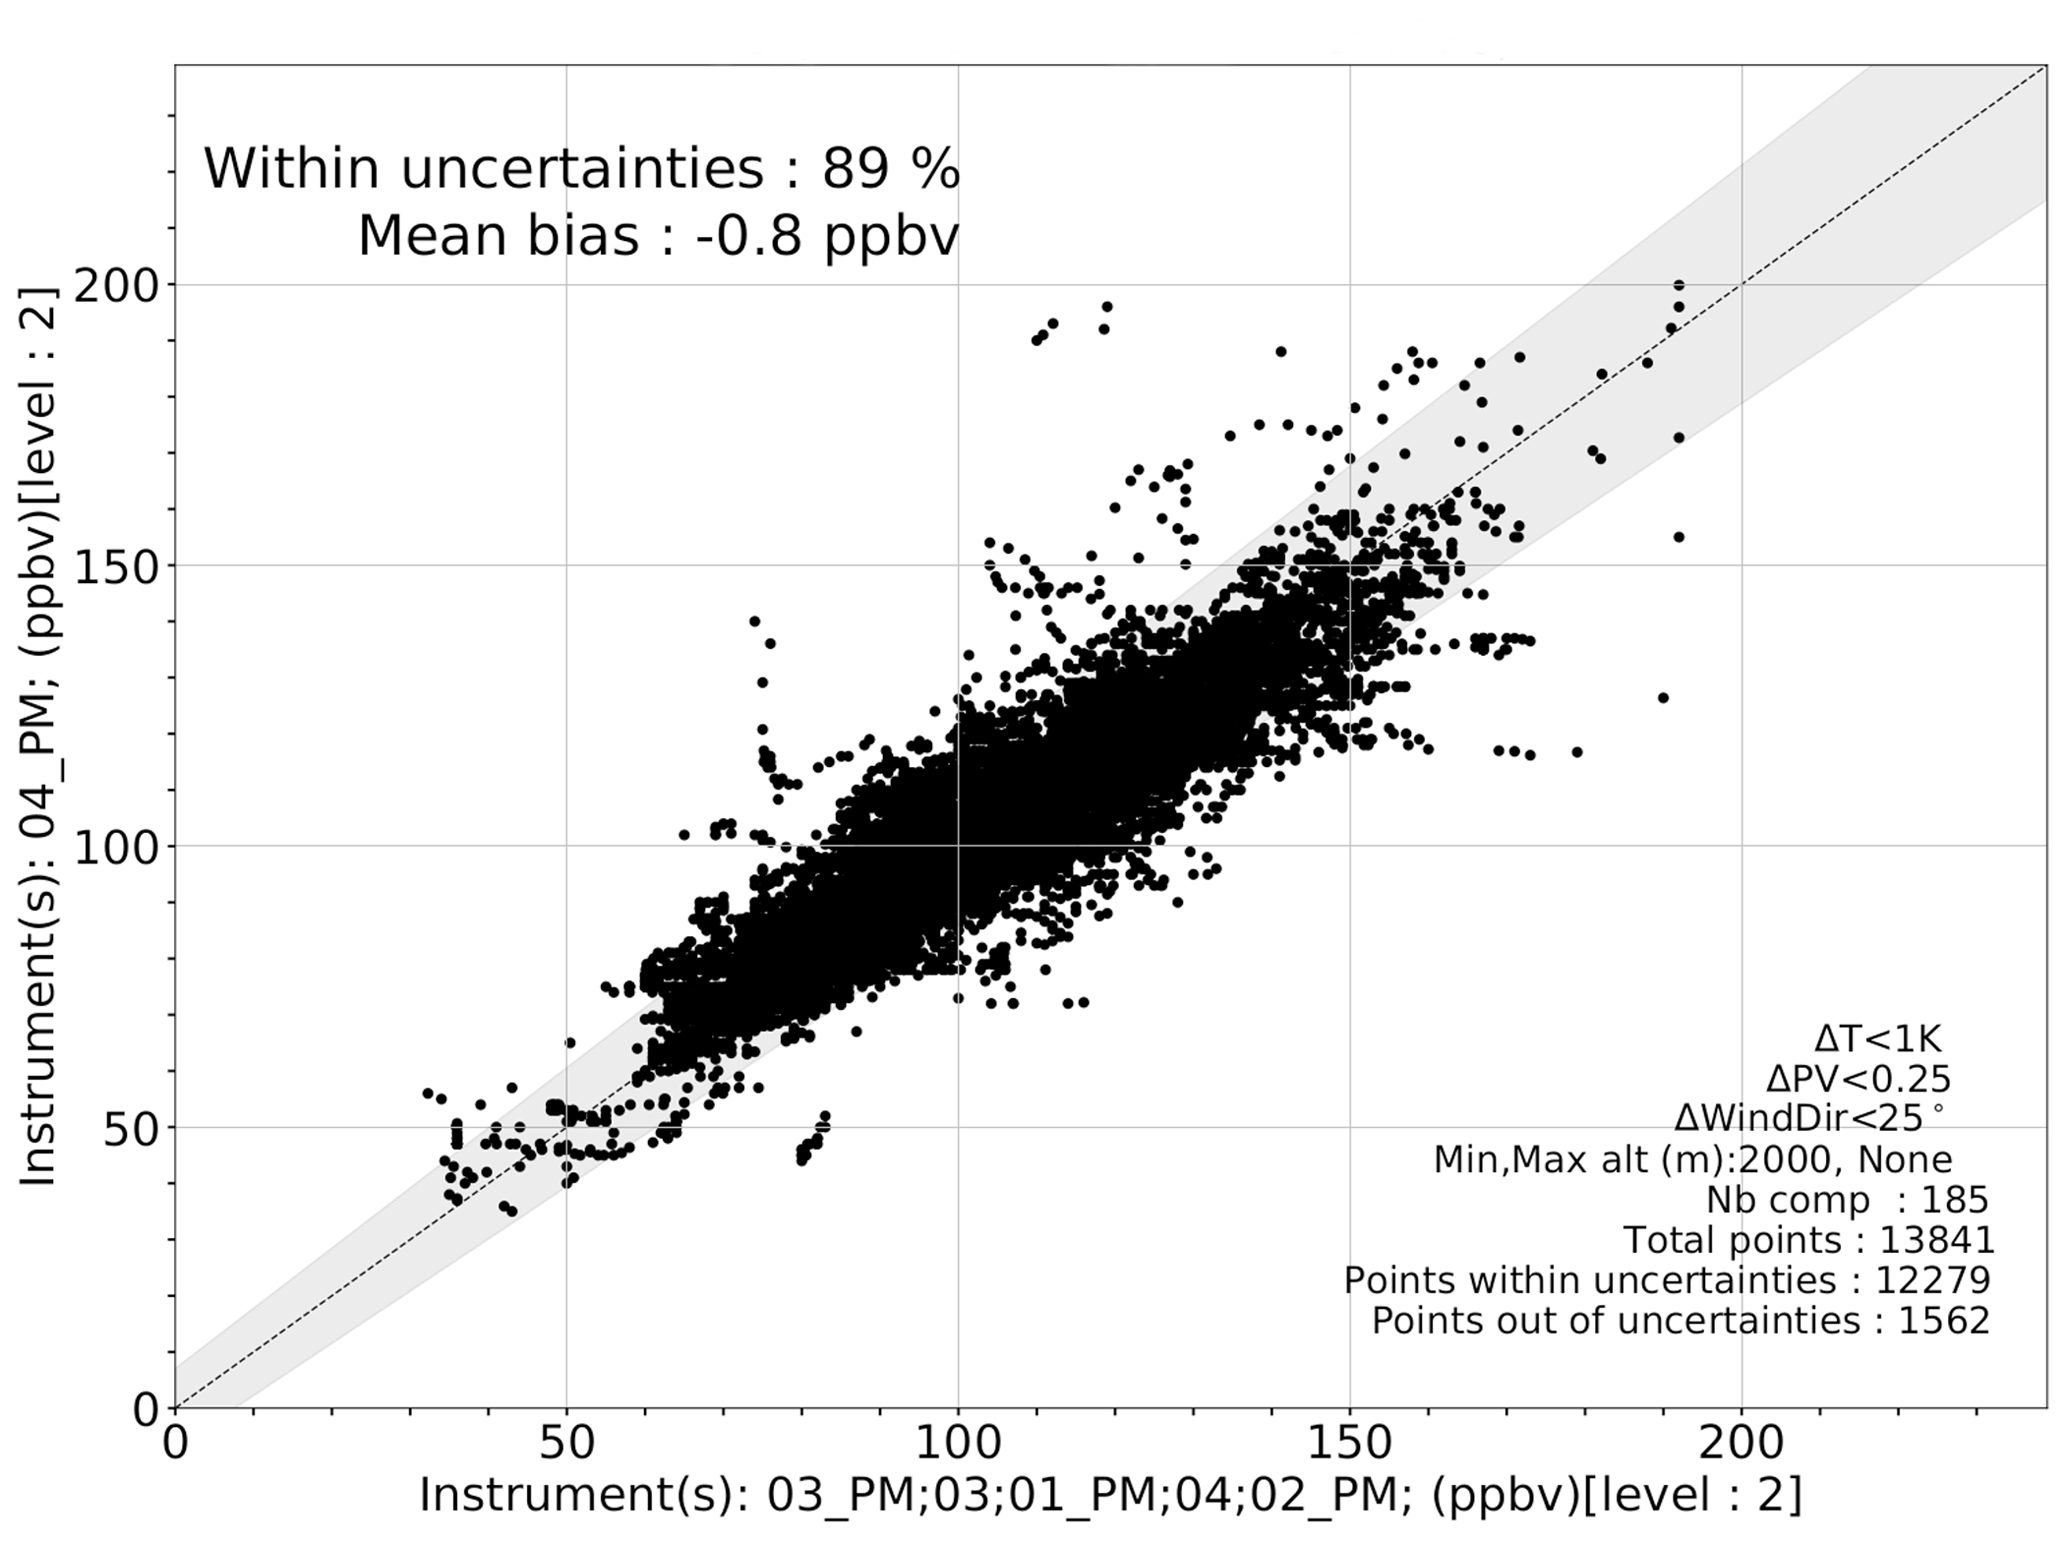
Figure 8Scattergram plot compiling all the flight intercomparisons found for CO MOZAIC instrument serial number 04PM for FP no. 13 on Lufthansa A340 msn53. The gray area represents the total measurement uncertainty. Statistic scores are presented in the figure legend.
However, the information that we really want to reach for the internal consistency is how each instrument performed globally through its entire flight period compared to other instruments flying during coincident periods. For example, CO MOZAIC instrument 04PM of Fig. 7 was installed on the Lufthansa A340 SN53 in December 2012 for a flight period that lasted 448 d in total. It was the 13th time (FP no. 13) that a CO instrument was operated on this aircraft. During this operating time, 185 flights were found within a 1 h time window and 12 279 points were found to be comparable according to the same air mass similarity criteria used to produce Fig. 7. Figure 8 shows the scattergram plot that compiles all the available data for this flight period. On the abscissa, the serial numbers of all the CO instruments that were compared to 04PM are highlighted. As can be noted, the performance indicators globally present a very good score with a mean bias of −0.8 ppbv and 89 % of the points within the total measurement uncertainties. Consequently, it can be stated confidently that the CO measurements of 04PM on Lufthansa Airbus SN53 for FP no. 13 present, on average, a negligible bias compared to the other instruments and in regard to the measurement uncertainties.

Figure 9Percentage of points within the uncertainty and mean bias as function of the potential temperature difference measured by the co-located aircraft found for CO instrument 04PM and for FP no. 13 on Lufthansa A340msn53. The total number of comparable points according the air temperature difference is also shown. The maximum time difference between the landings or the takeoffs is 1 h.
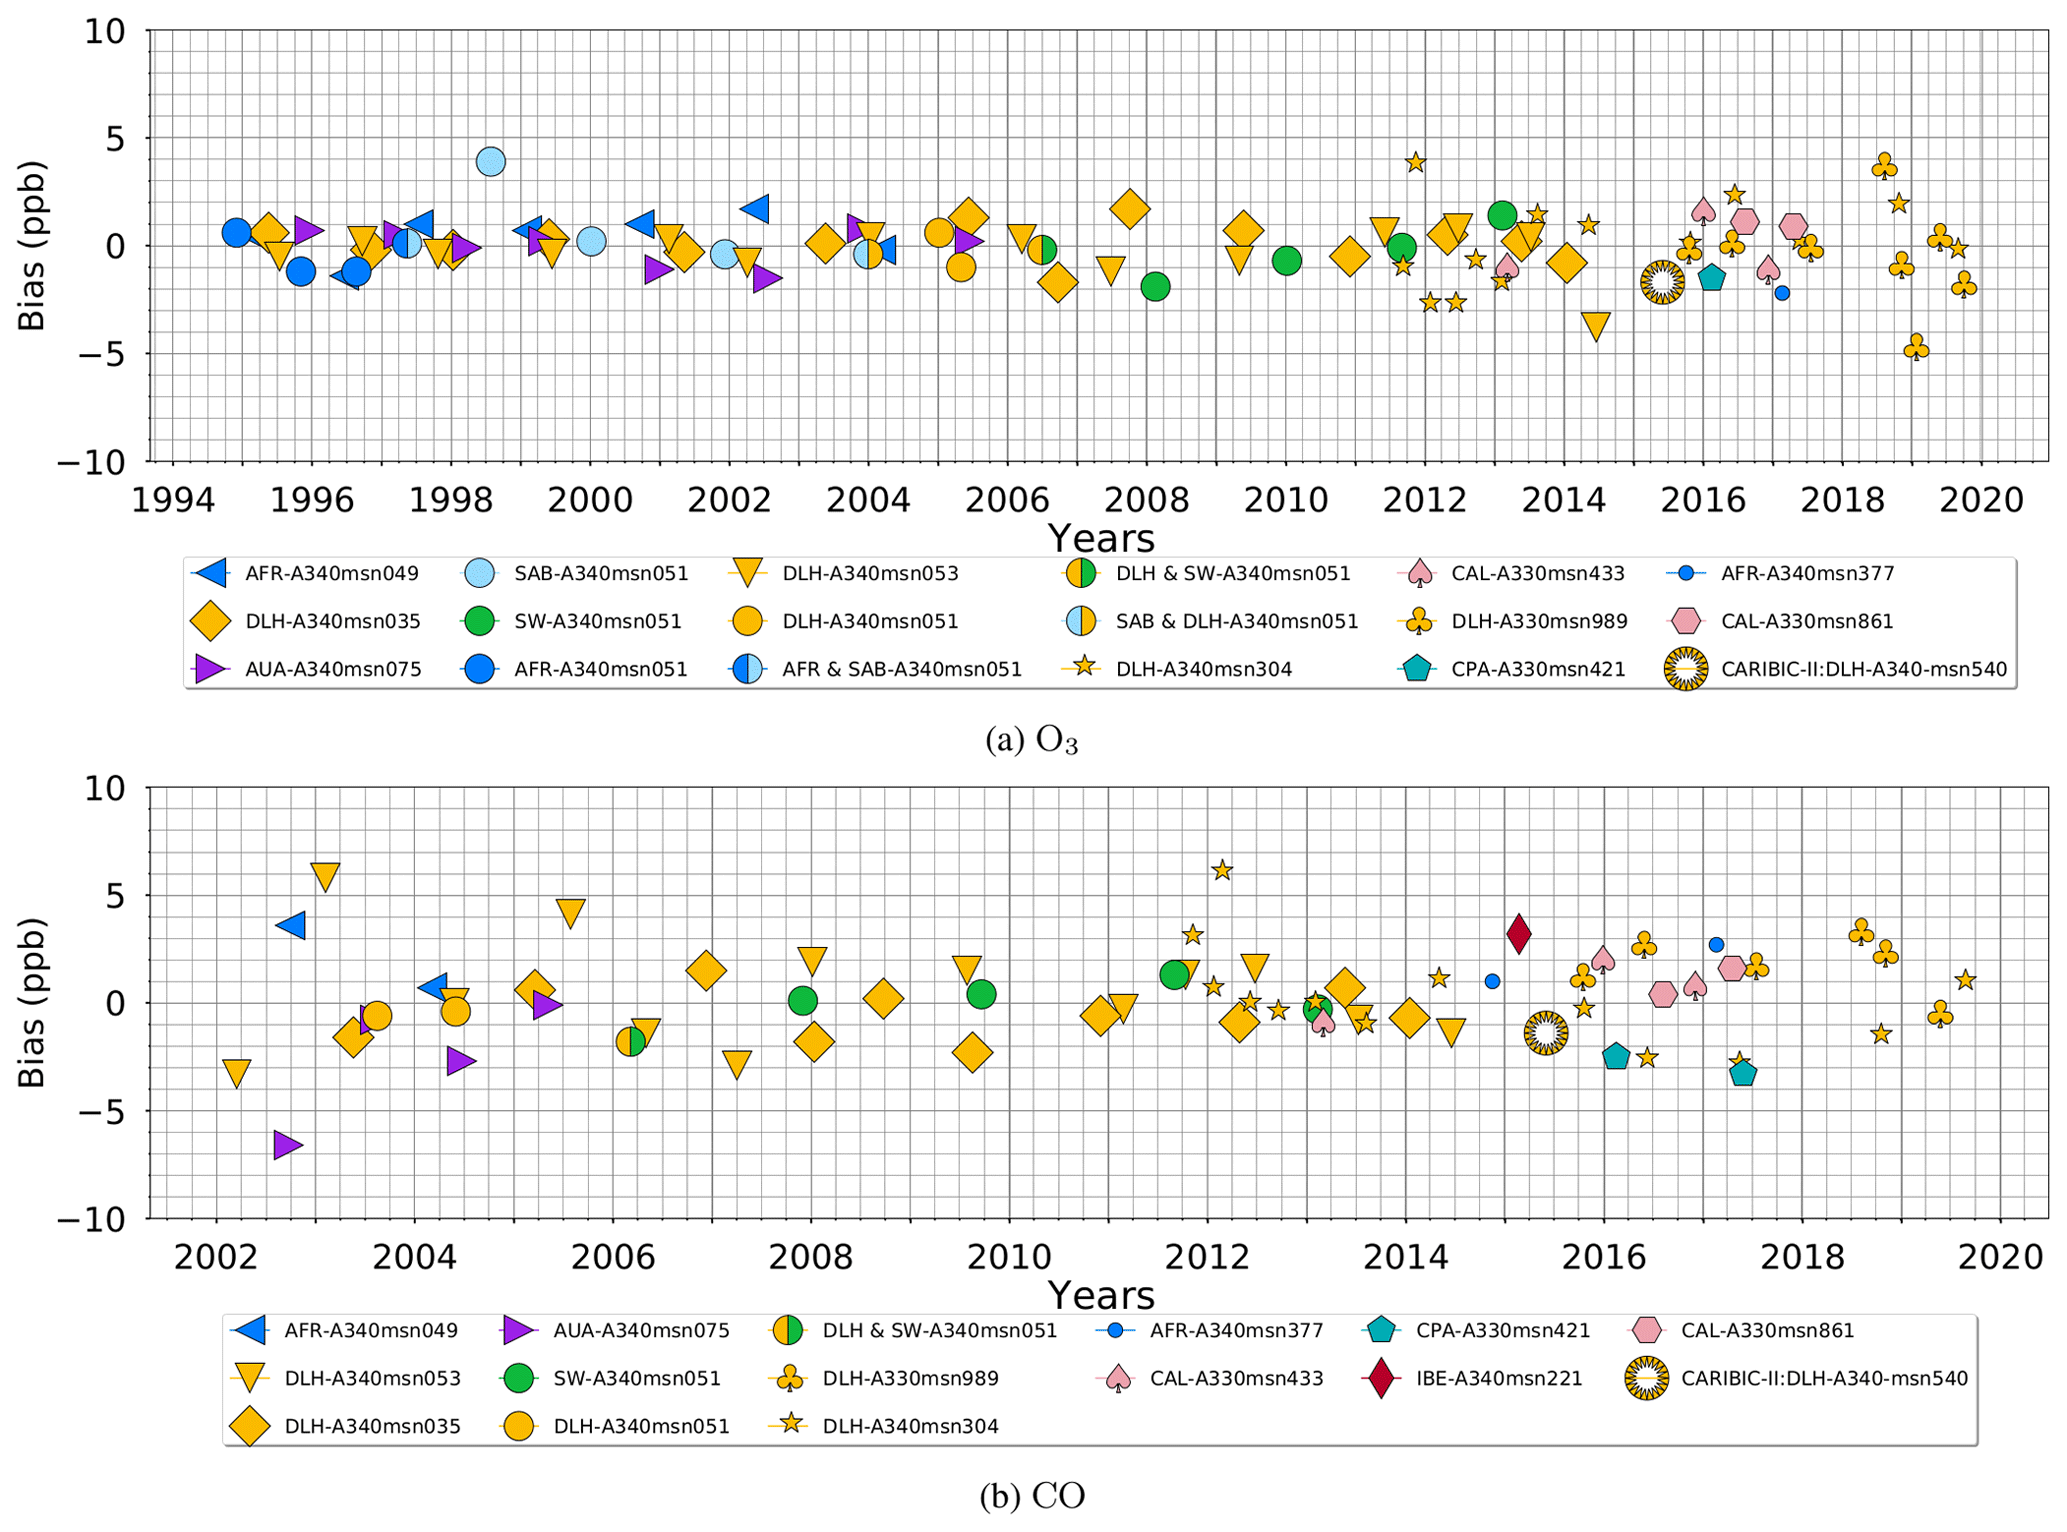
Figure 10Internal consistency of the long-term O3 (a) and CO (b) measurement time series within the IAGOS program. Different symbols are used to differentiate between the aircraft, and different colors are used for each airline. Symbol positions show the flight intercomparison measurement mean bias for an instrument FP centered in the middle of the period. For CARIBIC, the symbol is position arbitrarily on the timescale (see text).
The air mass similarity criteria thresholds were found by testing the following method on several different FPs. First, as is shown in Fig. 9 for the CO instrument 04PM (same FP than in Fig. 8), we monitor the evolution of performance indicators as we increase the temperature difference threshold. The percentage of points within the uncertainty peaks at a temperature difference of 0.25 K and the mean bias peaks at 1 K. For this flight period, we found 185 co-located aircraft which explain the large number (about 10 000) of comparable points, even for a very restrictive threshold. Seeing the rapid increase of the number of points and comparing the results from others instrument units, we found that a temperature difference threshold of 1 K would be a better compromise for shorter FPs or for the ones with instruments that are operated in remote areas with less aircraft rotation (fewer co-located flights). To choose the two additional meteorological air mass similarity thresholds, we set the temperature thresholds to 1 K and successively iterate on the wind direction and the potential vorticity difference increase for several FPs. Then, we decided to apply the same thresholds to all the FPs. For the time difference, we get better results for thresholds less than 1 h (more steady meteorological conditions with respect to the lifetime of O3 and CO); however, we found that, for example, at Frankfurt airport, the number of co-located flights is reduced by 50 % per 30 min.
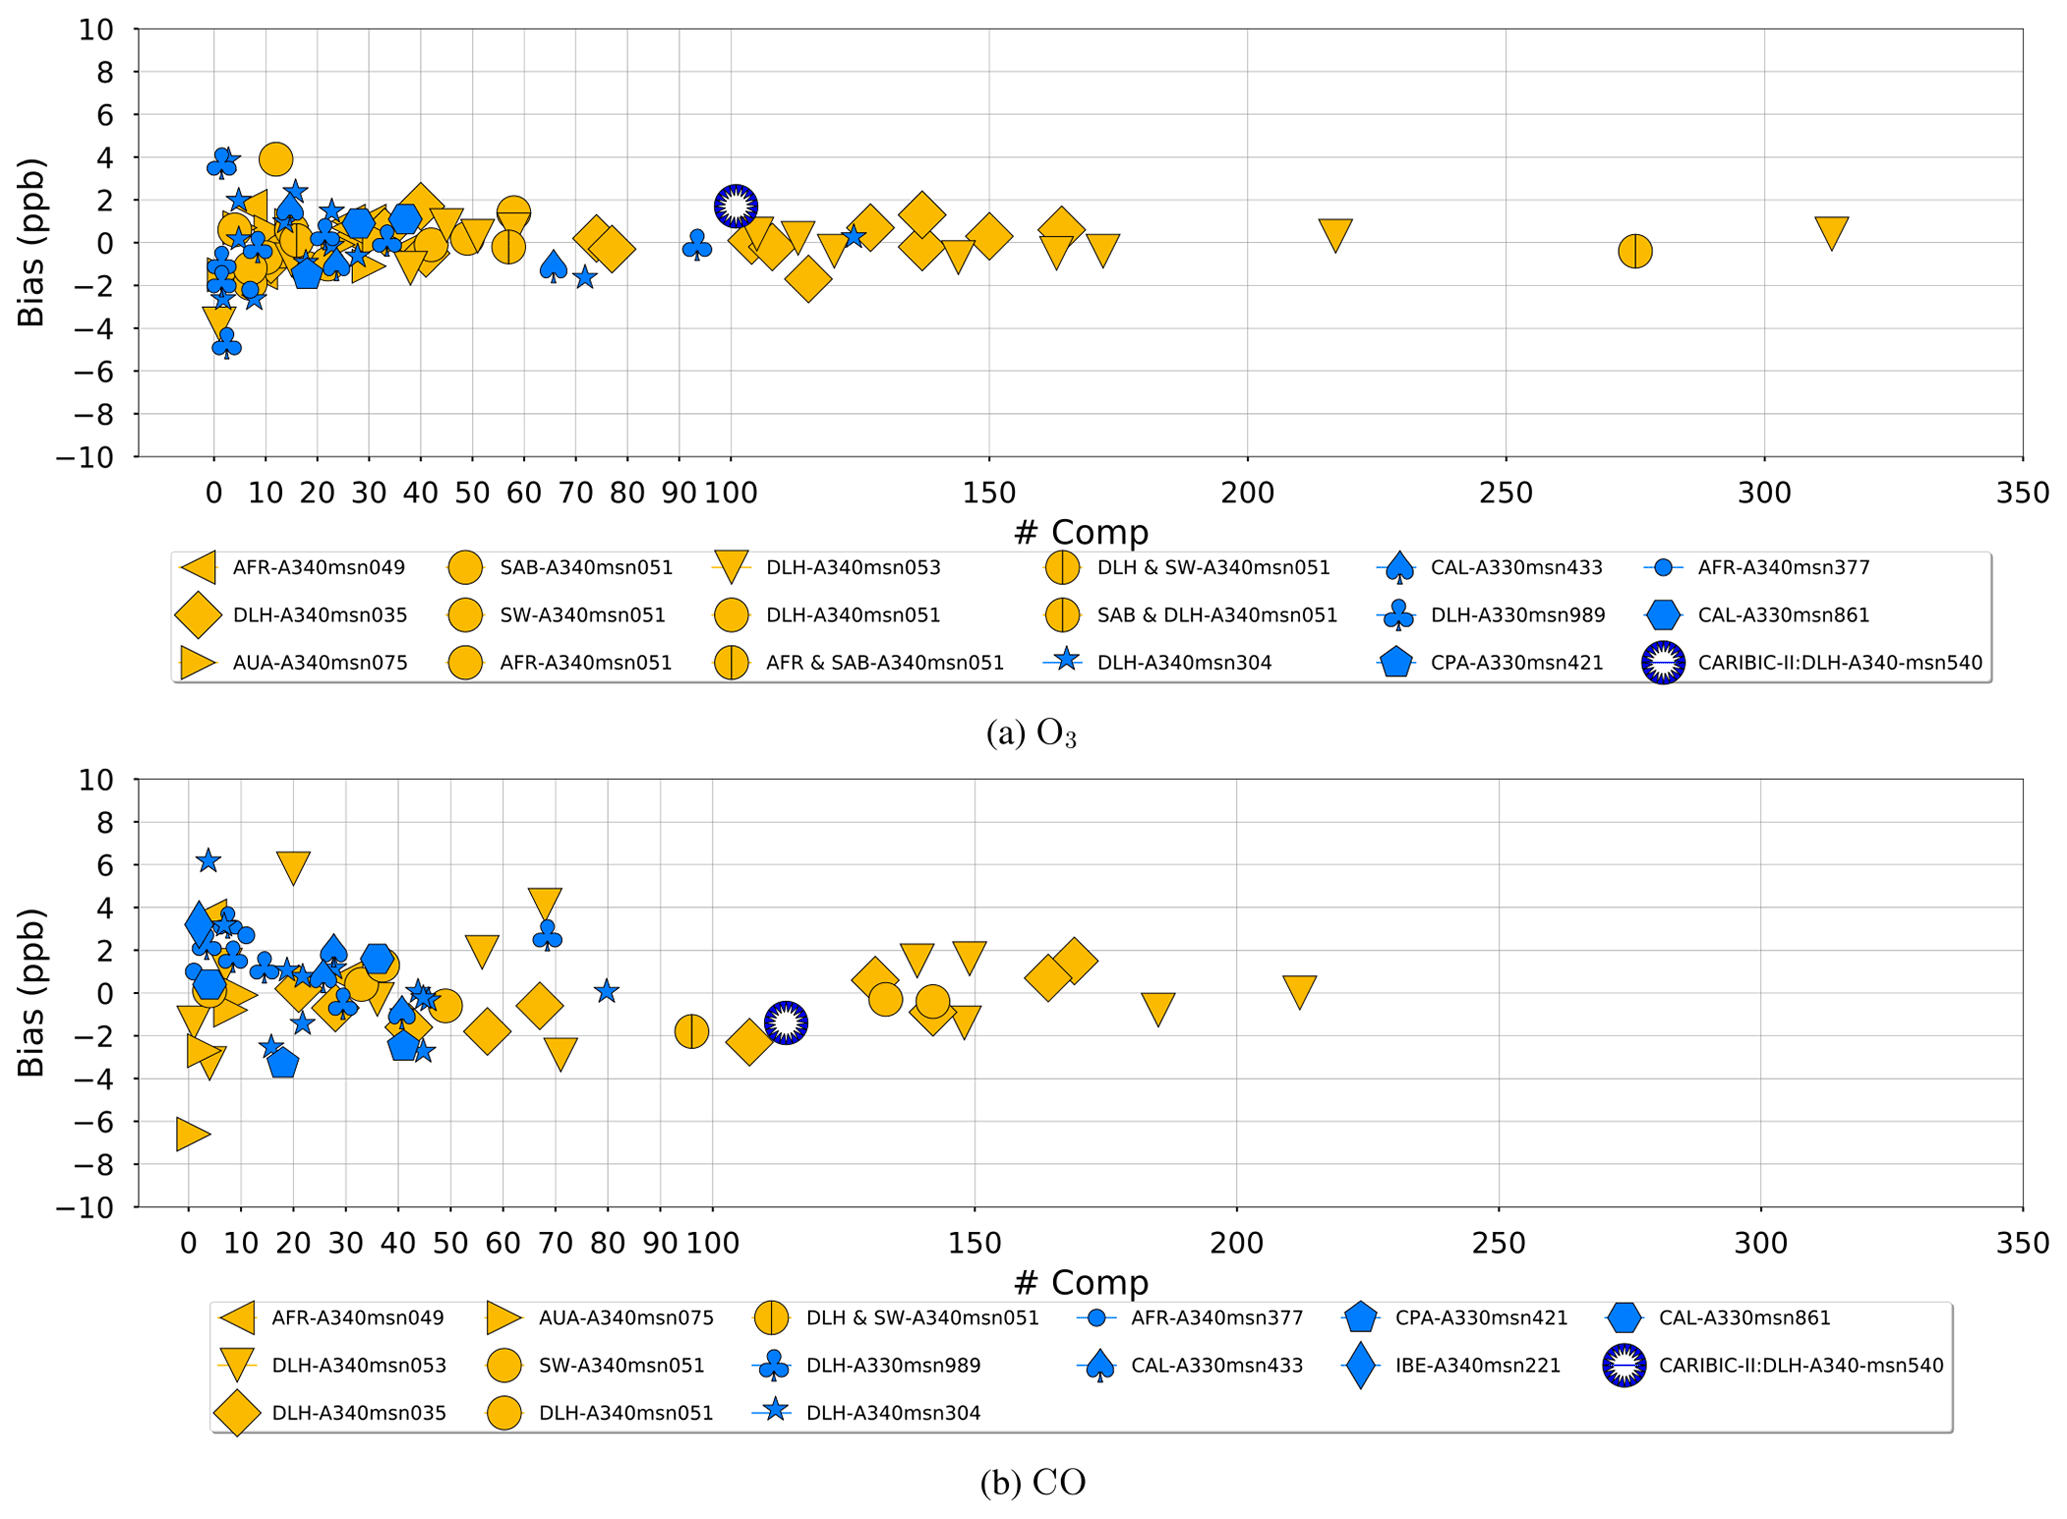
Figure 11Dependency of the O3 (a) and CO (b) instrument measurement mean bias for each FP with the number of flight intercomparison profiles. Different symbols are used for each distinct aircraft (same as Fig. 10); the yellow color is for the MOZAIC program and the blue color is for IAGOS and CARIBIC.
This methodology is applied to each of the MOZAIC and IAGOS instruments that flew on the IAGOS fleet, for all flight periods since 1994 and for which data were delivered as L2 to the scientific community. The results are gathered in Tables 4 and 5, and a summary study is discussed in Sect. 5.
4.2.2 CARIBIC versus MOZAIC/IAGOS
The flight period clustering concept described above cannot be applied to evaluate the performance of the CARIBIC measurements compared to those from IAGOS and MOZAIC because CARIBIC operates for only several days every couple of months, and therefore there are too few flight intercomparisons per period (maximum of one or two per flight sequence). However, if we apply the method considering the whole CARIBIC operation starting from 2005 to now, we found 101 and 114 flight intercomparisons for O3 and CO, respectively, with, in total, 7254 and 7286 points of comparisons, and the vast majority of these profile coincidences were found over Frankfurt airport until 2014, which is the period before DLH moved the aircraft to Düsseldorf as the home airport. Frankfurt has remained the home base of all other MOZAIC and IAGOS aircraft. The performance indicator results for CARIBIC are also presented in Sect. 5.
The results presented in Figs. 10 and 11 constitute the milestone of this study and more generally the QA/QC process within the IAGOS program. They synthesize the statistics gathered in Tables 4 and 5 and the outcomes of the methodology presented in Sect. 4 applied to every O3 and CO instrument that flew aboard every MOZAIC, IAGOS and CARIBIC aircraft.
Table 4Table compiling all the MOZAIC and IAGOS flight intercomparisons O3 measurement statistics and information for each instrument's FP. The latter are gathered and enumerated per aircraft. “Start date” is the date of the instrument unit installation on the aircraft (start of the flight period), “instr. serial” is the serial number of the instrument unit, “duration” is the length of the flight period in days; for “mean bias” and “% consistency”, see Sect. 4.2 for explanation. “No. comparisons” and “no. points” are the number of collocated profiles and collocated data points found according to the methodology described in Sect. 4.2.
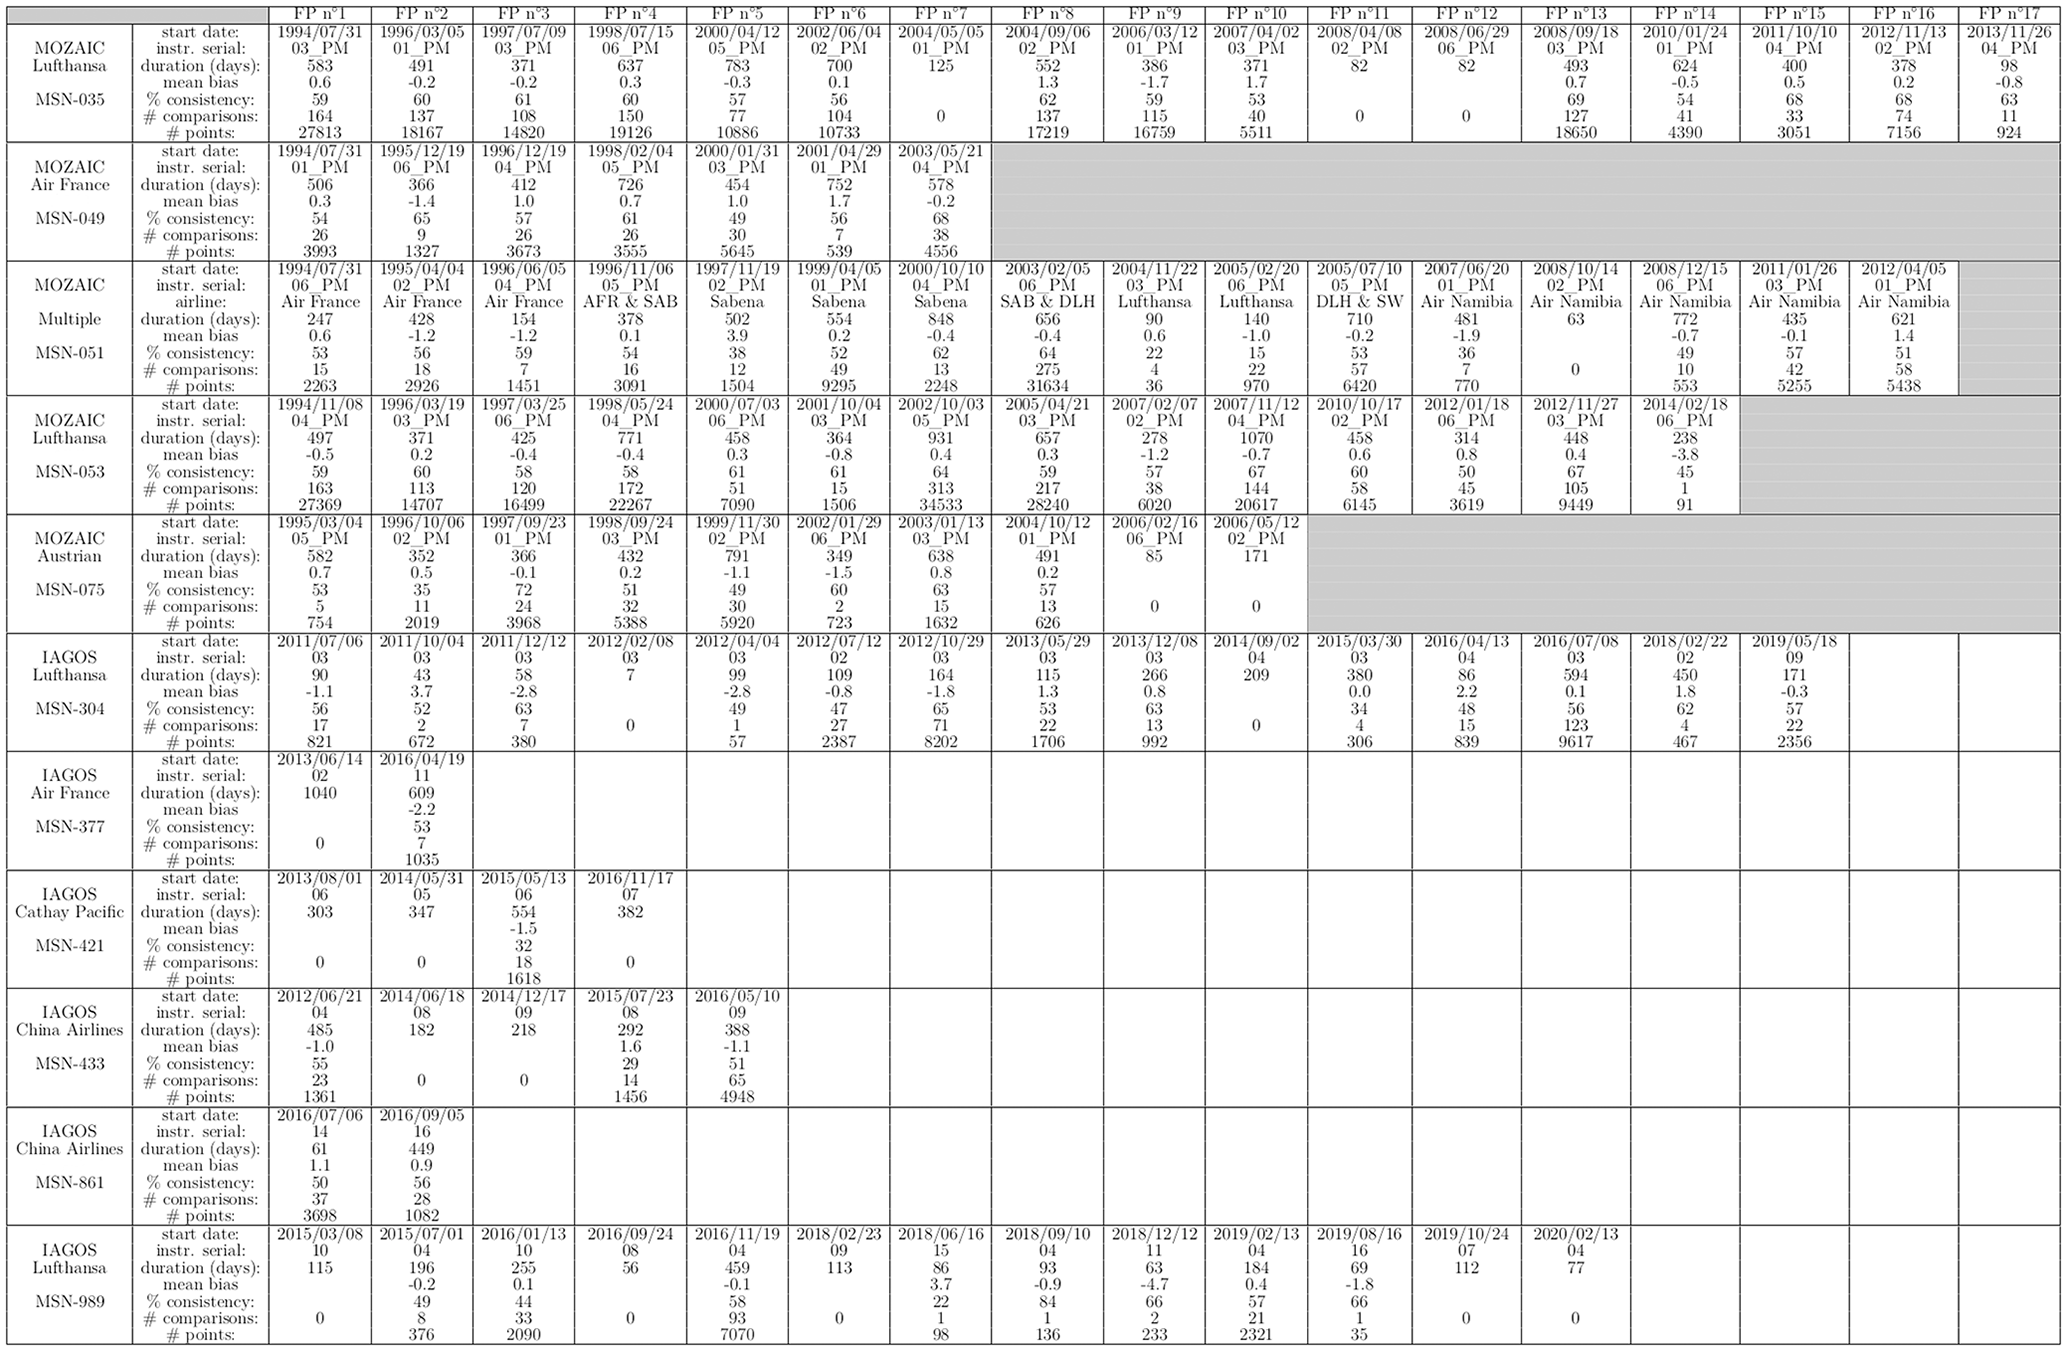
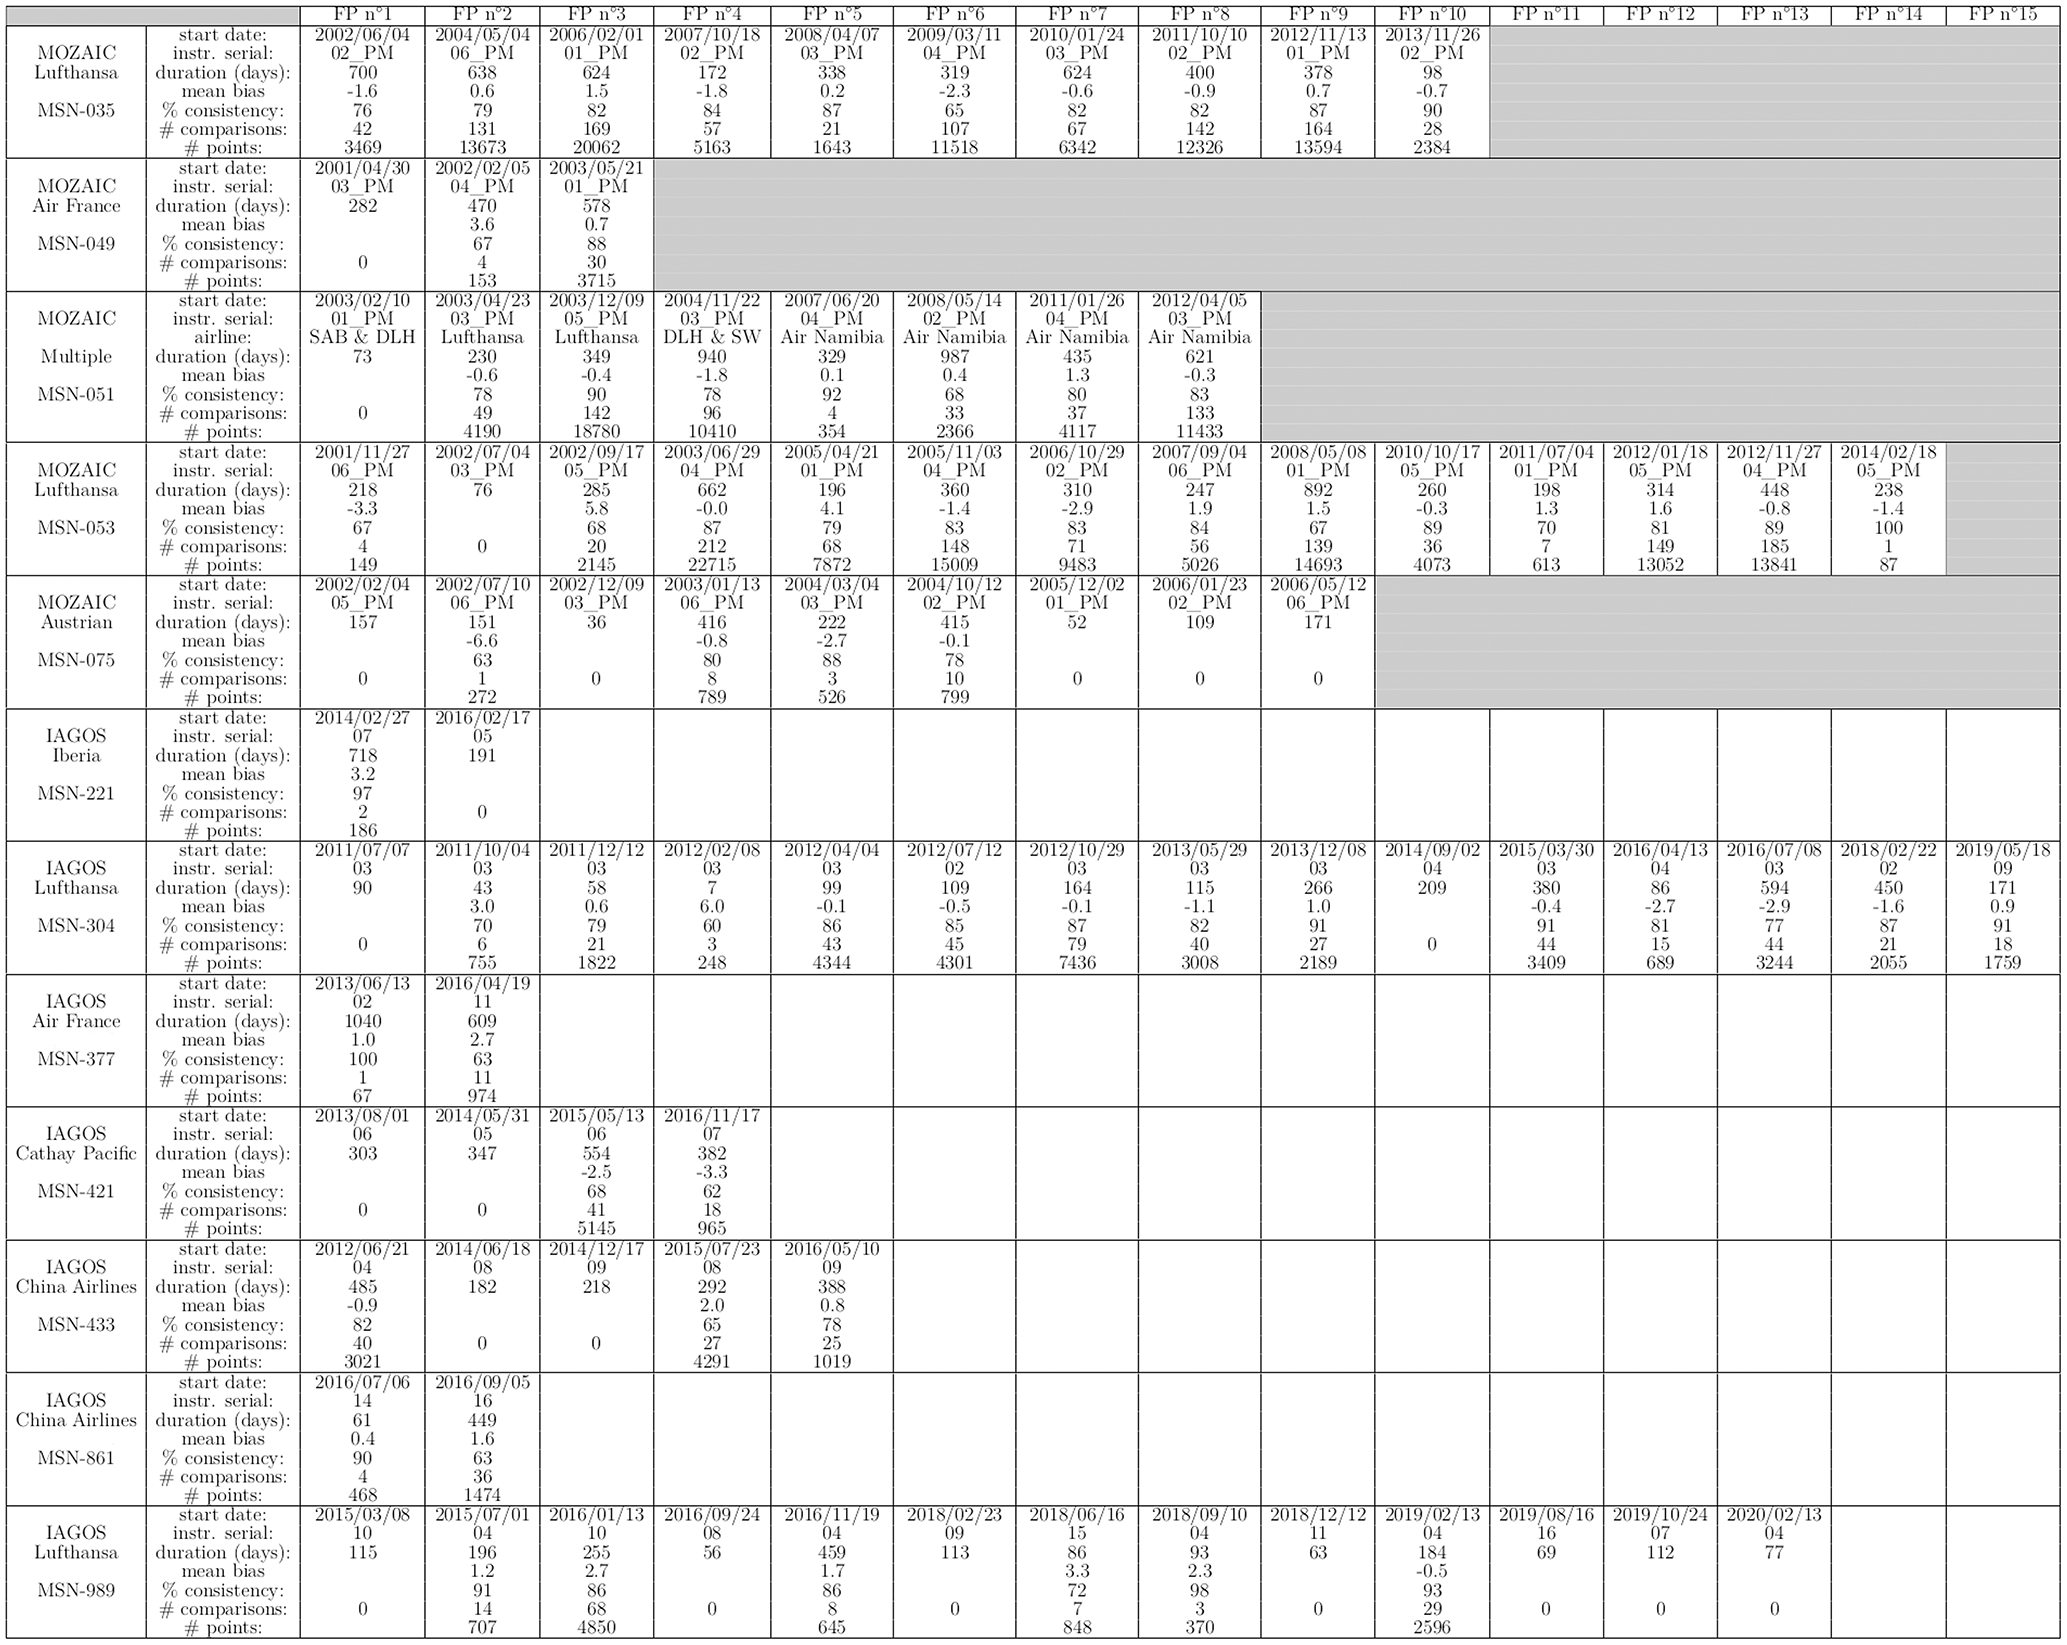
Figure 10 presents the time series of the O3 and CO mean bias for all the instrument FPs from 1994 to 2020. For more clarity, the choice was made to cluster the results from each instrument's FP and for each aircraft's MSN. Different symbols are assigned to distinguish between different aircraft and a color is assigned for each different airline. Individual symbols represent the mean bias of each instrument compared to the others within their relative FP, except for CARIBIC (see Sect. 4.2.2). For O3, it is easily noticeable in Fig. 10 that the large majority of the symbols (including CARIBIC) remain within ±2 ppbv, which is the accuracy of the O3 Package1 and Package MOZAIC instruments, and that symbols are homogeneously distributed around 0 ppbv throughout the entire IAGOS time series since 1994. The same results are evident for CO in Fig. 10b, with most of the symbols falling within the accuracy of the CO instruments (i.e., ± 5 ppbv), and the symbols are homogeneously distributed around 0 ppbv. Figure 11 differs from the previous one by showing the mean bias of the O3 and CO instruments according to the number of profiles that fit the criterion described in Sect. 4.2 for each instrument's FP since 1994. Each symbol is also associated with a distinct aircraft MSN; however, only yellow and blue colors are used in this figure in order to differentiate between the aircraft equipped with the Package MOZAIC and the IAGOS Package1 (CARIBIC has its own deep blue round open circle). Figure 11 highlights that instrument mean bias greater than ±2 and ±5 ppbv for O3 and CO, respectively, is related to a low number of profiles that fit the criteria for the comparison (less than about 10) per FP. This is due to three main reasons: (1) if an airline has at least two of their aircraft equipped with the system, the number of flight coincidences might be reduced if one system is not working properly for a long period of time; (2) the equipped aircraft are located in a different home hub; (3) if only one aircraft is equipped by that airline, there will be fewer flight coincidences. The coincidences depend on the aircraft schedules which are not controlled by IAGOS. IAGOS therefore tries to equip more than one aircraft per airline. Another important result shown in Fig. 11 is that the internal consistencies of the MOZAIC and IAGOS instruments are similar. This result offers assurance that despite the differences in instrumentation since IAGOS began in 1994, the database of O3 and CO measurements can be considered homogeneous.
As pointed out in Tarasick et al. (2019), a lack of information on temporal changes in measurement uncertainties is an area of concern especially for long-term trend studies of the key compounds which have a direct or indirect impact on climate change. The IAGOS program (including MOZAIC and CARIBIC) has measured O3 and CO within the troposphere and the lower stratosphere for more than 25 years and represents the longest airborne time series for these two gases with large coverage in time and space, particularly in the Northern Hemisphere. Since 1994, the aircraft instrument setup has evolved to changing aeronautical regulations but much care was taken to maintain the consistency of the measurement over time. This was achieved by using the same robust and well-recognized technologies based on UV absorption and IR correlation for O3 and CO and by following the same calibration procedures from the beginning to now. In this study, thanks to many flight profile coincidences to compare the measurements made by different IAGOS aircraft, we demonstrated that the O3 and CO data, despite the change of instrument setup over time, present no drifts in bias over time. The study highlights the need for the IAGOS program to increase the size of the fleet with at least two aircraft per airline not only to increase the density of the measurement worldwide but also to be able to closely monitor the performance of each instrument unit mounted onboard.
The data used in this study are available at https://doi.org/10.25326/20 (Boulanger et al., 2019).
RB was responsible for investigation, methodology, formal analysis, visualization and original draft preparation; PN was responsible for conceptualization, investigation and supervision; DB was responsible for data curation; PW was responsible for software; BS was responsible for conceptualization and supervision; JMC was responsible for resources; GA was responsible for software; AZ was responsible for project administration of IAGOS-CARIBIC; FO and DS were responsible for resources; HP was responsible for formal analysis; YB was responsible for software and formal analysis; HC was responsible for review and editing; VT was responsible for funding acquisition and project administration of IAGOS-Core.
The authors declare that they have no conflict of interest.
IAGOS gratefully acknowledges financial support during its preparation, implementation and operation phase from the European Commission in FP6 and FP7 programs, the IAGOS for the GMES Atmospheric Service national (IGAS), research programs in Germany (BMBF), France (INSU-CNRS, MESR, CNES) and the UK (NERC), in addition to institutional resources in Germany (Helmholtz Association, Max Planck Society, Leibniz Association), France (Université de Toulouse, Météo-France) and the UK (University of Manchester, University of Cambridge), and the continuing support of participating airlines (Lufthansa, Air France and Iberia in Europe; China Airlines and Cathay Pacific in Asia). IAGOS wishes to emphasize the excellence of the industrial partners involved in the technical development: Sabena Technics Bordeaux for aircraft systems definition and certification, LGM Ingénierie for the instruments realization and aeronautic qualification and Enviscope GmbH Frankfurt for operating the maintenance center of IAGOS.
This paper was edited by Hendrik Fuchs and reviewed by two anonymous referees.
Berkes, F., Houben, N., Bundke, U., Franke, H., Pätz, H.-W., Rohrer, F., Wahner, A., and Petzold, A.: The IAGOS NOx instrument – design, operation and first results from deployment aboard passenger aircraft, Atmos. Meas. Tech., 11, 3737–3757, https://doi.org/10.5194/amt-11-3737-2018, 2018. a
Beswick, K., Baumgardner, D., Gallagher, M., Volz-Thomas, A., Nedelec, P., Wang, K.-Y., and Lance, S.: The backscatter cloud probe – a compact low-profile autonomous optical spectrometer, Atmos. Meas. Tech., 7, 1443–1457, https://doi.org/10.5194/amt-7-1443-2014, 2014. a
Boulanger, D., Thouret, V., and Petzold, A.: IAGOS Data Portal, Aeris, https://doi.org/10.25326/20, 2019. a
Brenninkmeijer, C., Crutzen, P., Fischer, H., Güsten, H., Hans, W., Heinrich, G., Heintzenberg, J., Hermann, M., Immelmann, T., Kersting, D., Maiss, M., Nolle, M., Pitscheider, A., Pohlkamp, H., Scharffe, D., Specht, K., and Wiedensohler, A.: CARIBIC-Civil aircraft for global measurement of trace gases and aerosols in the tropopause region, J. Atmos. Ocean. Tech., 16, 1373–1383, 1999. a
Brenninkmeijer, C. A. M., Crutzen, P., Boumard, F., Dauer, T., Dix, B., Ebinghaus, R., Filippi, D., Fischer, H., Franke, H., Frieβ, U., Heintzenberg, J., Helleis, F., Hermann, M., Kock, H. H., Koeppel, C., Lelieveld, J., Leuenberger, M., Martinsson, B. G., Miemczyk, S., Moret, H. P., Nguyen, H. N., Nyfeler, P., Oram, D., O'Sullivan, D., Penkett, S., Platt, U., Pupek, M., Ramonet, M., Randa, B., Reichelt, M., Rhee, T. S., Rohwer, J., Rosenfeld, K., Scharffe, D., Schlager, H., Schumann, U., Slemr, F., Sprung, D., Stock, P., Thaler, R., Valentino, F., van Velthoven, P., Waibel, A., Wandel, A., Waschitschek, K., Wiedensohler, A., Xueref-Remy, I., Zahn, A., Zech, U., and Ziereis, H.: Civil Aircraft for the regular investigation of the atmosphere based on an instrumented container: The new CARIBIC system, Atmos. Chem. Phys., 7, 4953–4976, https://doi.org/10.5194/acp-7-4953-2007, 2007. a, b
Cohen, Y., Petetin, H., Thouret, V., Marécal, V., Josse, B., Clark, H., Sauvage, B., Fontaine, A., Athier, G., Blot, R., Boulanger, D., Cousin, J.-M., and Nédélec, P.: Climatology and long-term evolution of ozone and carbon monoxide in the upper troposphere–lower stratosphere (UTLS) at northern midlatitudes, as seen by IAGOS from 1995 to 2013, Atmos. Chem. Phys., 18, 5415–5453, https://doi.org/10.5194/acp-18-5415-2018, 2018. a
Eyres, J. and Reid, R.: Cost benefit studies for observing system, Forcasting Reasearch Technical Report No: 593, p. 12, Met Office, Weather science technical reports, 2014. a
Falconer, P. D. and Pratt, R. W.: A Summary of Research on the NASA-Global Atmospheric Sampling Program Performed by the Atmospheric Sciences Research Center, National Aeronautics and Space Administration, Langley Research Center, Hampton, Virginia, USA, 1979. a
Falconer, P. D., Pratt, R., and Mohnen, V. A.: The transport cycle of atmospheric ozone and its measurements from aircraft and at the earth's surface, Man's Impact on the Troposphere, p. 109, National Aeronautics and Space Administration Reference Publication 1022, Langley Research Center, Hampton, Virginia, USA, 1978. a
Feilberg, K., Sellevåg, S., J. Nielsen, C., W. T. Griffith, D., and S. Johnson, M.: CO + OH → CO2 + H: The relative reaction rate of five CO isotopologues, Phys. Chem. Chem. Phys., 4, 4687–4693, https://doi.org/10.1039/B204827M, 2002. a
Filges, A., Gerbig, C., Chen, H., Franke, H., Klaus, C., and Jordan, A.: The IAGOS-core greenhouse gas package: a measurement system for continuous airborne observations of CO2, CH4, H2O and CO, Tellus B, 67, 27989, https://doi.org/10.3402/tellusb.v67.27989, 2015. a
Gaudel, A., Cooper, O. R., Ancellet, G., Barret, B., Boynard, A., Burrows, J. P., Clerbaux, C., Coheur, P. F., Cuesta, J., Cuevas, E., Doniki, S., Dufour, G., Ebojie, F., Foret, G., Garcia, O., nos, M. J. G. M., Hannigan, J. W., Hase, F., Huang, G., Hassler, B., Hurtmans, D., Jaffe, D., Jones, N., Kalabokas, P., Kerridge, B., Kulawik, S. S., Latter, B., Leblanc, T., Flochmoën, E. L., Lin, W., Liu, J., Liu, X., Mahieu, E., McClure-Begley, A., Neu, J. L., Osman, M., Palm, M., Petetin, H., Petropavlovskikh, I., Querel, R., Rahpoe, N., Rozanov, A., Schultz, M. G., Schwab, J., Siddans, R., Smale, D., Steinbacher, M., Tanimoto, H., Tarasick, D. W., Thouret, V., Thompson, A. M., Trickl, T., Weatherhead, E., Wespes, C., Worden, H. M., Vigouroux, C., Xu, X., Zeng, G., and Ziemke, J.: Tropospheric Ozone Assessment Report: Present-day distribution and trends of tropospheric ozone relevant to climate and global atmospheric chemistry model evaluation, Elem. Sci. Anth., 6, 39, https://doi.org/10.1525/elementa.291, 2018. a
GCOS: Implementation plan for the global observing system for climate in support of the UNFCCC, Implementation Plan for the Global Observing System for Climate in Support of the UNFCCC, World Meteorological Organisation, WMO, Geneva, Switzerland, 2010. a
Helten, M., Smit, H. G. J., Kley, D., Ovarlez, J., Schlager, H., Baumann, R., Schumann, U., Nedelec, P., and Marenco, A.: In-flight comparison of MOZAIC and POLINAT water vapor measurements, J. Geophys. Res.-Atmos., 104, 26087–26096, https://doi.org/10.1029/1999JD900315, 1999. a, b
Hess, P. G. and Zbinden, R.: Stratospheric impact on tropospheric ozone variability and trends: 1990–2009, Atmos. Chem. Phys., 13, 649–674, https://doi.org/10.5194/acp-13-649-2013, 2013. a
Holton, J., Haynes, P., Mcintyre, M., Douglass, A., Rood, R., and Pfister, L.: Stratosphere-Troposphere Exchange, Rev. Geophys., 33, 403–439, https://doi.org/10.1029/95RG02097, 1995. a
IPCC: Summary for Policymakers, book section SPM, 1–30, Cambridge University Press, Cambridge, United Kingdom and New York, NY, USA, https://doi.org/10.1017/CBO9781107415324.004, 2013. a
Marenco, A., Thouret, V., Nédélec, P., Smit, H., Helten, M., Kley, D., Karcher, F., Simon, P., Law, K., Pyle, J., Poschmann, G., Von Wrede, R., Hume, C., and Cook, T.: Measurement of ozone and water vapor by Airbus in-service aircraft: The MOZAIC airborne program, an overview, J. Geophys. Res.-Atmos., 103, 25631–25642, https://doi.org/10.1029/98JD00977, 1998. a, b
Nédélec, P., Cammas, J.-P., Thouret, V., Athier, G., Cousin, J.-M., Legrand, C., Abonnel, C., Lecoeur, F., Cayez, G., and Marizy, C.: An improved infrared carbon monoxide analyser for routine measurements aboard commercial Airbus aircraft: technical validation and first scientific results of the MOZAIC III programme, Atmos. Chem. Phys., 3, 1551–1564, https://doi.org/10.5194/acp-3-1551-2003, 2003. a, b, c
Nédélec, P., Blot, R., Boulanger, D., Athier, G., Cousin, J.-M., Gautron, B., Petzold, A., Volz-Thomas, A., and Thouret, V.: Instrumentation on commercial aircraft for monitoring the atmospheric composition on a global scale: the IAGOS system, technical overview of ozone and carbon monoxide measurements, Tellus B, 67, https://doi.org/10.3402/tellusb.v67.28385, 2015. a, b, c, d
Perkins, P. J. and Papathakos, L. C.: Global Sensing of Gaseous and Aerosol Trace Species Using Automated Instrumentation on 747 Airlines, Lewis Research Center, Fourth Joint Conference on Sensing of Environmental Pollutants, NASA TM-73810, 6–11 November 1977, New Orleans, La., 1977. a
Petetin, H., Thouret, V., Athier, G., Blot, R., Boulanger, D., Cousin, J.-M., Gaudel, A., Nedelec, P., and Cooper, O.: Diurnal cycle of ozone throughout the troposphere over Frankfurt as measured by MOZAIC-IAGOS commercial aircraft, Elem. Sci. Anth., 4, 000129, https://doi.org/10.12952/journal.elementa.000129, 2016a. a
Petetin, H., Thouret, V., Fontaine, A., Sauvage, B., Athier, G., Blot, R., Boulanger, D., Cousin, J.-M., and Nédélec, P.: Characterising tropospheric O3 and CO around Frankfurt over the period 1994–2012 based on MOZAIC–IAGOS aircraft measurements, Atmos. Chem. Phys., 16, 15147–15163, https://doi.org/10.5194/acp-16-15147-2016, 2016b. a
Petetin, H., Jeoffrion, M., Sauvage, B., Athier, G., Blot, R., Boulanger, D., Clark, H., Cousin, J.-M., Gheusi, F., Nédélec, P., Steinbacher, M., and Thouret, V.: Representativeness of the IAGOS airborne measurements in the lower troposphere, Elem. Sci. Anth., 6, 23, https://doi.org/10.1525/elementa.280, 2018a. a
Petetin, H., Sauvage, B., Smit, H. G. J., Gheusi, F., Lohou, F., Blot, R., Clark, H., Athier, G., Boulanger, D., Cousin, J.-M., Nedelec, P., Neis, P., Rohs, S., and Thouret, V.: A climatological view of the vertical stratification of RH, O3 and CO within the PBL and at the interface with free troposphere as seen by IAGOS aircraft and ozonesondes at northern mid-latitudes over 1994–2016, Atmos. Chem. Phys., 18, 9561–9581, https://doi.org/10.5194/acp-18-9561-2018, 2018b. a
Petzold, A., Thouret, V., Gerbig, C., Zahn, A., Brenninkmeijer, C. A., Gallagher, M., Hermann, M., Pontaud, M., Ziereis, H., Boulanger, D., Marshall, J., Nédélec, P., Smit, H. G. J., Friess, U., Flaud, J.-M., Wahner, A., Cammas, J.-P., Volz-Thomas, A., and IAGOS TEAM: Global-scale atmosphere monitoring by in-service aircraft-current achievements and future prospects of the European Research Infrastructure IAGOS, Tellus B, 67, 28452, https://doi.org/10.3402/tellusb.v67.28452 , 2015. a, b, c, d
Sauvage, B., Fontaine, A., Eckhardt, S., Auby, A., Boulanger, D., Petetin, H., Paugam, R., Athier, G., Cousin, J.-M., Darras, S., Nédélec, P., Stohl, A., Turquety, S., Cammas, J.-P., and Thouret, V.: Source attribution using FLEXPART and carbon monoxide emission inventories: SOFT-IO version 1.0, Atmos. Chem. Phys., 17, 15271–15292, https://doi.org/10.5194/acp-17-15271-2017, 2017. a
Scharffe, D., Slemr, F., Brenninkmeijer, C. A. M., and Zahn, A.: Carbon monoxide measurements onboard the CARIBIC passenger aircraft using UV resonance fluorescence, Atmos. Meas. Tech., 5, 1753–1760, https://doi.org/10.5194/amt-5-1753-2012, 2012. a, b
Smit, H. G. J., Rohs, S., Neis, P., Boulanger, D., Krämer, M., Wahner, A., and Petzold, A.: Technical Note: Reanalysis of upper troposphere humidity data from the MOZAIC programme for the period 1994 to 2009, Atmos. Chem. Phys., 14, 13241–13255, https://doi.org/10.5194/acp-14-13241-2014, 2014. a
Stohl, A., Forster, C., Frank, A., Seibert, P., and Wotawa, G.: Technical note: The Lagrangian particle dispersion model FLEXPART version 6.2, Atmos. Chem. Phys., 5, 2461–2474, https://doi.org/10.5194/acp-5-2461-2005, 2005. a
Tanimoto, H., Zbinden, R. M., Thouret, V., and Nédélec, P.: Consistency of tropospheric ozone observations made by different platforms and techniques in the global databases, Tellus B, 67, 27073, https://doi.org/10.3402/tellusb.v67.27073, 2015. a
Tarasick, D., Galbally, I., Cooper, O., Schultz, M., Ancellet, G., Leblanc, T., Wallington, T., Ziemke, J., Liu, X., Steinbacher, M., Staehelin, J., Vigouroux, C., Hannigan, J., García, O., Foret, G., Zanis, P., Weatherhead, B., Petropavlovskikh, I., Worden, H., and Neu, J.: Tropospheric Ozone Assessment Report: Tropospheric ozone from 1877 to 2016, observed levels, trends and uncertainties, Elem. Sci. Anth., 7, 39, https://doi.org/10.1525/elementa.376, 2019. a
Thouret, V., Marenco, A., Logan, J. A., Nédélec, P., and Grouhel, C.: Comparisons of ozone measurements from the MOZAIC airborne program and the ozone sounding network at eight locations, J. Geophys. Res.-Atmos., 103, 25695–25720, https://doi.org/10.1029/98JD02243, 1998. a, b
Thouret, V., Cammas, J.-P., Sauvage, B., Athier, G., Zbinden, R., Nédélec, P., Simon, P., and Karcher, F.: Tropopause referenced ozone climatology and inter-annual variability (1994–2003) from the MOZAIC programme, Atmos. Chem. Phys., 6, 1033–1051, https://doi.org/10.5194/acp-6-1033-2006, 2006. a
Volz-Thomas, A., Berg, M., Heil, T., Houben, N., Lerner, A., Petrick, W., Raak, D., and Pätz, H.-W.: Measurements of total odd nitrogen (NOy) aboard MOZAIC in-service aircraft: instrument design, operation and performance, Atmos. Chem. Phys., 5, 583–595, https://doi.org/10.5194/acp-5-583-2005, 2005. a
Zahn, A., Weppner, J., Widmann, H., Schlote-Holubek, K., Burger, B., Kühner, T., and Franke, H.: A fast and precise chemiluminescence ozone detector for eddy flux and airborne application, Atmos. Meas. Tech., 5, 363–375, https://doi.org/10.5194/amt-5-363-2012, 2012. a
Zbinden, R. M., Cammas, J.-P., Thouret, V., Nédélec, P., Karcher, F., and Simon, P.: Mid-latitude tropospheric ozone columns from the MOZAIC program: climatology and interannual variability, Atmos. Chem. Phys., 6, 1053–1073, https://doi.org/10.5194/acp-6-1053-2006, 2006. a
Zhang, Y., Cooper, O. R., Gaudel, A., Thompson, A. M., Nedelec, P., Ogino, S.-Y., and West, J. J.: Tropospheric ozone change from 1980 to 2010 dominated by equatorward redistribution of emissions, Nat. Geosci., 9, 875–879, https://doi.org/10.1038/NGEO2827, 2016. a
Certification to the European Commission Regulation standards of design, production, maintenance and operation of aircraft components.