the Creative Commons Attribution 4.0 License.
the Creative Commons Attribution 4.0 License.
 | 09 Jun 2021
A multi-purpose, multi-rotor drone system for long-range and high-altitude volcanic gas plume measurements
Santiago Arellano
Nicole Bobrowski
Vladimir Conde
Tobias P. Fischer
Gustav Gerdes
Alexandra Gutmann
Thorsten Hoffmann
Ima Itikarai
Tomas Krejci
Emma J. Liu
Kila Mulina
Scott Nowicki
Tom Richardson
Julian Rüdiger
Kieran Wood
Jiazhi Xu
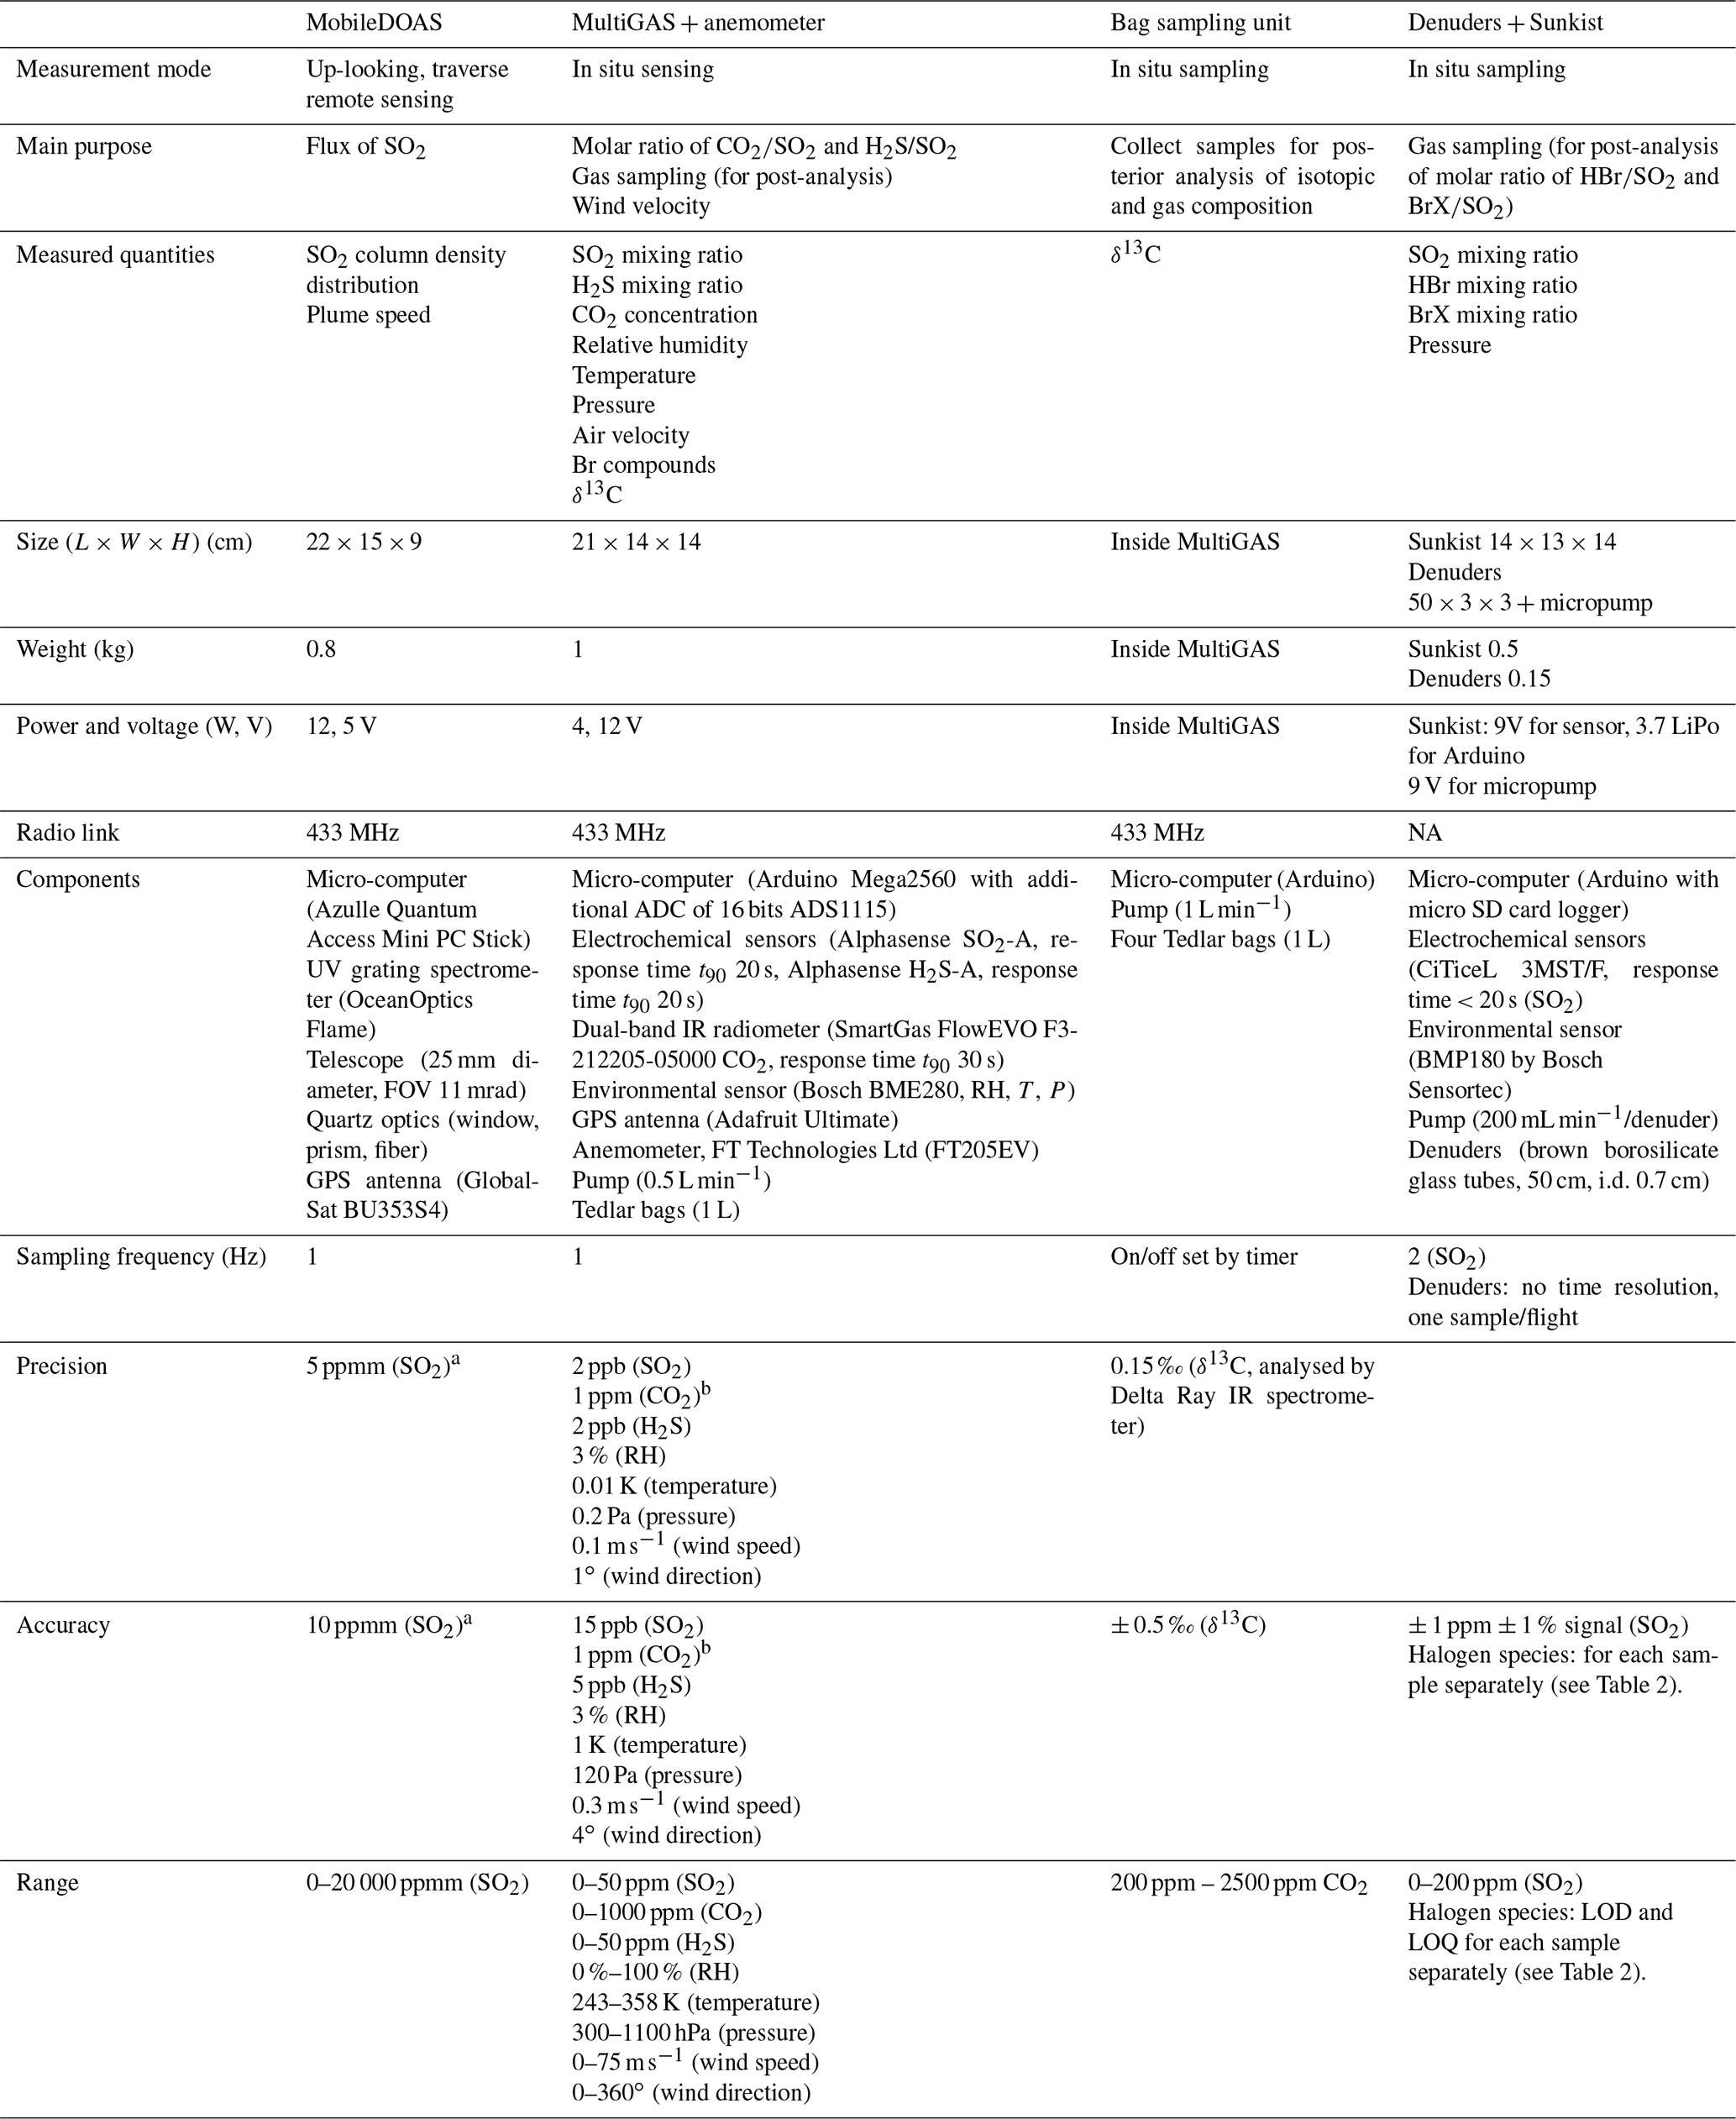
A multi-rotor drone has been adapted for studies of volcanic gas plumes. This adaptation includes improved capacity for high-altitude and long-range, real-time SO2 concentration monitoring, long-range manual control, remotely activated bag sampling and plume speed measurement capability. The drone is capable of acting as a stable platform for various instrument configurations, including multi-component gas analysis system (MultiGAS) instruments for in situ measurements of SO2, H2S, and CO2 concentrations in the gas plume and portable differential optical absorption spectrometer (MobileDOAS) instruments for spectroscopic measurement of total SO2 emission rate, remotely controlled gas sampling in bags and sampling with gas denuders for posterior analysis on the ground of isotopic composition and halogens.
The platform we present was field-tested during three campaigns in Papua New Guinea: in 2016 at Tavurvur, Bagana and Ulawun volcanoes, in 2018 at Tavurvur and Langila volcanoes and in 2019 at Tavurvur and Manam volcanoes, as well as in Mt. Etna in Italy in 2017.
This paper describes the drone platform and the multiple payloads, the various measurement strategies and an algorithm to correct for different response times of MultiGAS sensors. Specifically, we emphasize the need for an adaptive flight path, together with live data transmission of a plume tracer (such as SO2 concentration) to the ground station, to ensure optimal plume interception when operating beyond the visual line of sight. We present results from a comprehensive plume characterization obtained during a field deployment at Manam volcano in May 2019. The Papua New Guinea region, and particularly Manam volcano, has not been extensively studied for volcanic gases due to its remote location, inaccessible summit region and high level of volcanic activity. We demonstrate that the combination of a multi-rotor drone with modular payloads is a versatile solution to obtain the flux and composition of volcanic plumes, even for the case of a highly active volcano with a high-altitude plume such as Manam. Drone-based measurements offer a valuable solution to volcano research and monitoring applications and provide an alternative and complementary method to ground-based and direct sampling of volcanic gases.
- Article
(5906 KB) - Full-text XML
-
Supplement
(469 KB) - BibTeX
- EndNote


1.1 The use of drones for studies of volcanic plumes
The use of drones for volcanic plume studies was pioneered by Faivre-Pierret et al. (1980), who employed a fixed-wing drone equipped with in situ sensors to measure the composition of the volcanic plume of Mt. Etna, together with correlation-spectrometry-derived (COSPEC; Stoiber et al., 1983) fluxes of H2O, SO2, HCl and HF. This was an unmanned research aircraft that demanded high expertise and complex field operations. More recently, McGonigle et al. (2008) employed an unmanned helicopter equipped alternatively with a multi-component gas analysis system (MultiGAS; Aiuppa et al., 2005; Shinohara, 2005) and a portable differential optical absorption spectrometer (MobileDOAS; Galle et al., 2003) system to measure the flux of CO2 and SO2 from the crater rim of Vulcano Island, Italy. This was a proof-of-concept study that demonstrated the utility of a commercial system to acquire proximal measurements, although the vehicle still required a level of piloting expertise. The first use of a multi-rotor platform capable of reaching a high-elevation plume was reported by Mori et al. (2016), who performed measurements with a multi-rotor drone in the eruptive plume of Ontake volcano and measured SO2, CO2, H2S, H2O and HCl concentrations, employing a combination of MultiGAS and MobileDOAS instruments. The authors reported various problems, such as the need to properly shield electrochemical sensors used in MultiGAS units from electromagnetic interference derived from the drone motors or radio telemetry. Similar work was conducted by Rüdiger et al. (2018), who measured the plumes of Masaya, Stromboli and Turrialba volcanoes and studied the ageing of halogenic species using drone-mounted denuder samplers. De Moor et al. (2019) and Stix et al. (2018) used a multi-rotor drone to perform MultiGAS and MobileDOAS measurements and to collect plume samples for posterior carbon isotopic speciation analyses. They also measured plume speed by letting the drone drift freely with the winds at plume level. Mandon et al. (2019) also used a multi-rotor drone and a sampling unit to collect high-temperature filter pack samples of volcanic gases at White Island volcano, which were characterized geochemically, focusing on the composition of trace metal aerosols. At Villarrica, comparison of the plume chemistry measured directly above the lava lake (using a drone-mounted gas analyser) and downwind on the crater rim (using a traditional ground-based instrument) simultaneously showed how volcanic plumes can dilute and homogenize over short distances of < 150 m, especially in turbulent crater environments (Liu et al., 2019). Furthermore, Schellenberg et al. (2019) described in-plume ash collection at long range using fixed-wing vehicles at Fuego volcano (Guatemala), and Syahbana et al. (2019) launched a fixed-wing aircraft with sensors for H2O, CO2 and SO2 that were essential for a successful assessment of eruptive activity of Mt. Agung in 2017. This short account is intended to highlight representative studies using drones as platforms for volcanic plume measurements; more comprehensive reviews, including the broader applications of drones in volcanology, can be found in Villa et al. (2016) or James et al. (2020).
The above-mentioned studies show different aspects of the capabilities of drones to reach volcanic plumes and vents and perform measurements with various levels of complexity. Our study combines multiple aspects of these independent developments to show that the same unit can be used to achieve the above-mentioned goals in a single field experiment, with maximum field operability in terms of portability and a reduced number of people required for the measurement, i.e. usually only two. These features make our approach a practical solution to expand the use of drones for routine monitoring of volcanic plumes.
1.2 Manam volcano
Manam volcano, located in Papua New Guinea, is the highest volcano in the Bismarck arc. The volcano is a 3000 m high composite volcano that rises about 1800 (above mean sea level). The island of Manam is about 10 km in diameter. Manam has erupted about 40 times since the early 1600s. The current phase of eruptive activity began in June 2014 and continues to date of writing, characterized by sporadic VEI4 eruptions superimposed on persistent passive degassing and minor explosive activity (Venzke, 2013). In 2004, an eruption devastated large sectors of the island and displaced thousands of people to the mainland (Liu et al., 2020). Manam is currently ranked as one of the top 10 SO2 and CO2 emitters in the world and degassed about 1 Mt CO2 a−1 during 2005–2015 based on petrological proxies to estimate the CO2 flux (Aiuppa et al., 2019; Fischer et al., 2019).
Manam is an archetypical case that represents the challenges of obtaining detailed information on volcanic plumes for a large proportion of volcanoes in the world. Indeed, our present knowledge of the composition and flux of gas emissions from volcanoes is limited due to the same reasons described above: remote location, explosive activity or inaccessible vents and plumes. Although satellite-based remote-sensing instruments have a large potential to overcome these limitations, this approach is in general only valid for SO2 because its atmospheric background concentration is low compared to the volcanic signal. For most other species, in situ measurements are the only option, when feasible. From a total of nearly 1500 Holocene volcanoes listed in the Smithsonian Institution's Global Volcanism Program database (https://volcano.si.edu/list_volcano_holocene.cfm, last access: 4 June 2021), about 50 % have a summit altitude above 2 Nearly 100 of the Holocene volcanoes had a flux of SO2 above the Ozone Monitoring Instrument (OMI) 1 year-average threshold of about 40 t d−1 (Carn et al., 2017) during 2005–2016, of which ∼ 60 % have a summit at 2 or higher. Therefore, a drone-based platform for gas sampling or real-time measurement of volcanic species in the plume needs to be suitable to reach plumes at high elevation where air density is low and robust enough to sustain harsh measurement conditions such as acidity, corrosion and turbulence that are encountered in dense regions of the plume. Thus, Manam volcano is a suitable volcano for demonstrating the challenging use of a drone in volcano gas monitoring, and for this reason it was chosen as the target of a field campaign (Aerial Based Observations of Volcanic Emissions, ABOVE; Liu et al., 2020) to characterize this strong, yet difficult-to-access, volcanic plume.
2.1 The drone platform
We designed our system to fulfil the following demands:
-
capability to measure in situ concentrations in excess of a few parts per million (ppm) above ambient for several components of the plume: CO2, SO2 and H2S in real time;
-
capability to measure the flux of all major volcanic species in the plume, SO2 with direct measurement and the other gases after obtaining their ratio against SO2 and combination with SO2 flux;
-
capability to collect physical bag samples of the volcanic plume, for posterior chemical or isotopic analysis (of carbon or other species) on the ground;
-
capability to reach altitudes higher than 2 km above take-off altitude and ranges of the order of 5 km;
-
relatively low-cost, low-expertise threshold to operate and high field robustness and portability.
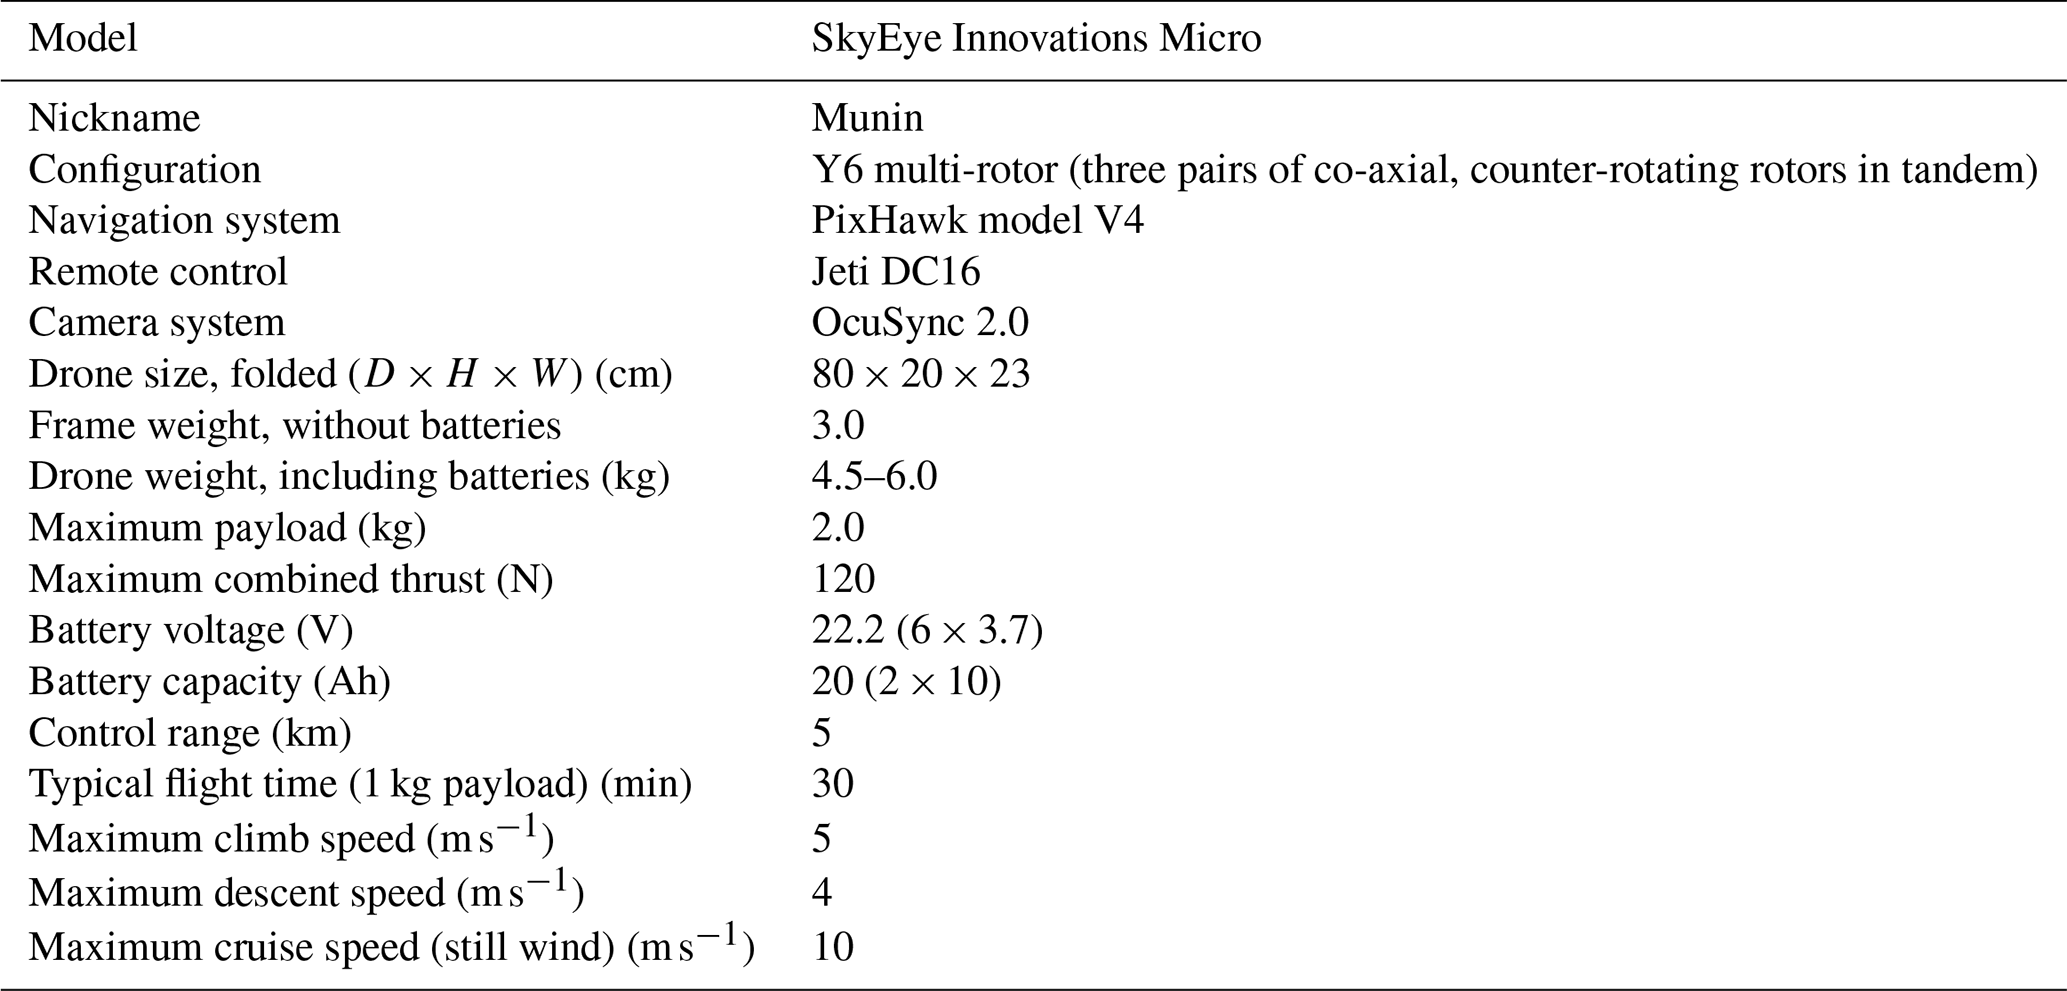
With these demands in mind, we developed the following concept: a multi-rotor drone platform with modular payloads for different types of measurement. We chose a hexa-copter in Y-shape configuration, the Micro model developed by Sky-Eye Innovations in Sweden, which we dubbed “Munin”. Among the advantages of a multi-rotor configuration, we include (1) the possibility to hover, which is required for optimal positioning of the drone in the plume, for collecting samples in a bag from a confined region and for measuring during a time long enough to guarantee a good signal; (2) the possibility to perform measurements in the vertical direction, required to, for example, determine the concentration profile in the plume; (3) high manoeuvrability to adapt to changing wind conditions and to chase high volcanic gas concentration regions of the plume; (4) high portability due to its small size, low weight and foldable parts; and (5) simplicity for operation, usually not requiring expert piloting capabilities and no more than two people. The main disadvantage of a battery-driven multi-rotor drone in comparison with combustion-powered (i.e. liquid fuel) platforms is a limited flight time, which translates into a reduced time of measurement in the plume, especially at high altitudes and distances. A main disadvantage with the combustion-powered platforms related to gas volcanic measurements is the risk of contamination, especially under hovering conditions.
2.1.1 Drone feasibility studies and lessons learnt
The development of our drone platform was initially motivated by the goal to measure the CO2 emission from Bagana volcano, identified as one of the strongest emitters of SO2 (Carn et al., 2017), in 2016. The high level of activity of this remote volcano made it impossible for people to reach its active vents for sampling, and to reach a plume at summit level required at least 1600 m of vertical climb above ground. We tested an earlier version of our drone for high-altitude flights, in order to assess the maximum altitude achievable with a payload of about 1 kg. These tests were performed at the ESRANGE Space Center, which is operated by the Swedish Space Corporation and located near to Kiruna, in northern Sweden. Loaded flights were done in vertical and horizontal trajectories to measure the current consumption during climb (at 5 m s−1), hovering, descent (at 4 m s−1) and cruise (at 8 m s−1). Typical currents for these flight modes were 54, 33, 22 and 30 A (1200, 730, 490, 660 W), respectively, during horizontal wind conditions of ∼ 10 m s−1. Vertical ascents up to 1800 m above ground were reached in these tests, above which radio control signal (at 2.4 GHz) was lost. Using two batteries, each consisting of 24 Li-ion cells (3.7 V, 2.5 Ah each) connected in a 6S4P configuration, gives a total battery capacity of 20 Ah. For a conservative mean current consumption of 40 A, this battery capacity allows for a nominal flight time of 30 min. After the experience gained from this study and field studies in Bagana and Ulawun (Northern Hemisphere (NH) autumn 2016), Etna (NH spring 2017) and Langila (NH autumn 2018) volcanoes, the main lessons learnt were as follows.
-
When ascending and moving horizontally, it was found that energy consumption could be reduced if the rise and forward motion were balanced in an optimal way, as compared to moving only in one direction at a time. This is because a considerable horizontal component in the movement gives a lift that reduces the energy consumption for maintaining the vertical position. An additional advantage is that the drone then flies in undisturbed air with less turbulence compared to a clean vertical movement. When the drone flew into clouds, energy consumption increased by about 50 %. On descent, it was found that stability deteriorated when descending through clouds; see Fig. 1. Therefore, we avoided clouds as much as possible during flights. In the later part of the campaign, this was facilitated by using an onboard camera and flying with FPV (first-person view). The drone's angle through the air, the tilt related to the ratio between horizontal and vertical motion, also proved to be of great importance for energy consumption. Both during ascent and descent, energy consumption could be minimized by considering and taking advantage of the wind's strength and direction. On the prevailing conditions at Manam, a tilt of 11∘ from the horizon was found to be optimal for the decent.
-
The volcanic plumes were typically found to move both horizontally and vertically within a short time span. In order to be able to sample the plume with in situ methods, it is crucial that the plume centre, having the densest gas concentrations, can be reached. Thus it is important to be able to receive real-time information on the ground of a relevant plume tracer (SO2 concentration) and to be able to control the remote drone location from the ground and thereby adapt the flight path of the drone in response to this real-time data stream.
-
Electrical interference from motors and telemetry influenced the noise level of the electrochemical sensors. Thus shielding and location of power and data cables, as well as location of antennas, were important (see hardware modifications detailed below).
-
It was found that the time needed for switching between different payloads could be considerably reduced by changes in the drone frame and payload designs (balance, power connection, data access, telemetry). The batteries were mounted under the frame and could be changed with a “click” locking. This enabled fast switching of batteries and improved the balance, especially at take-off and landing. The payloads were mounted on individual plates that were locked in place on the drone platform with a click lock similar to what was used for the batteries and provided by the drone manufacturer. This enabled the payloads to be pre-balanced, and no further balancing of the drone was needed after replacement of payload. A special power output on the drone gave the payloads power and access to the drone-mounted telemetry. This power output was always turned on to make it possible to do pre-flight and post-flight operations on the payload instrument without turning on the main drone electricity to save power.
-
Access to the drone flight logs were found to be useful for post-flight analysis of power consumption with different flight modes, extraction of wind information and backup data of basic parameters like pressure, temperature and position. An example of data from the flight log is given in Fig. 1.
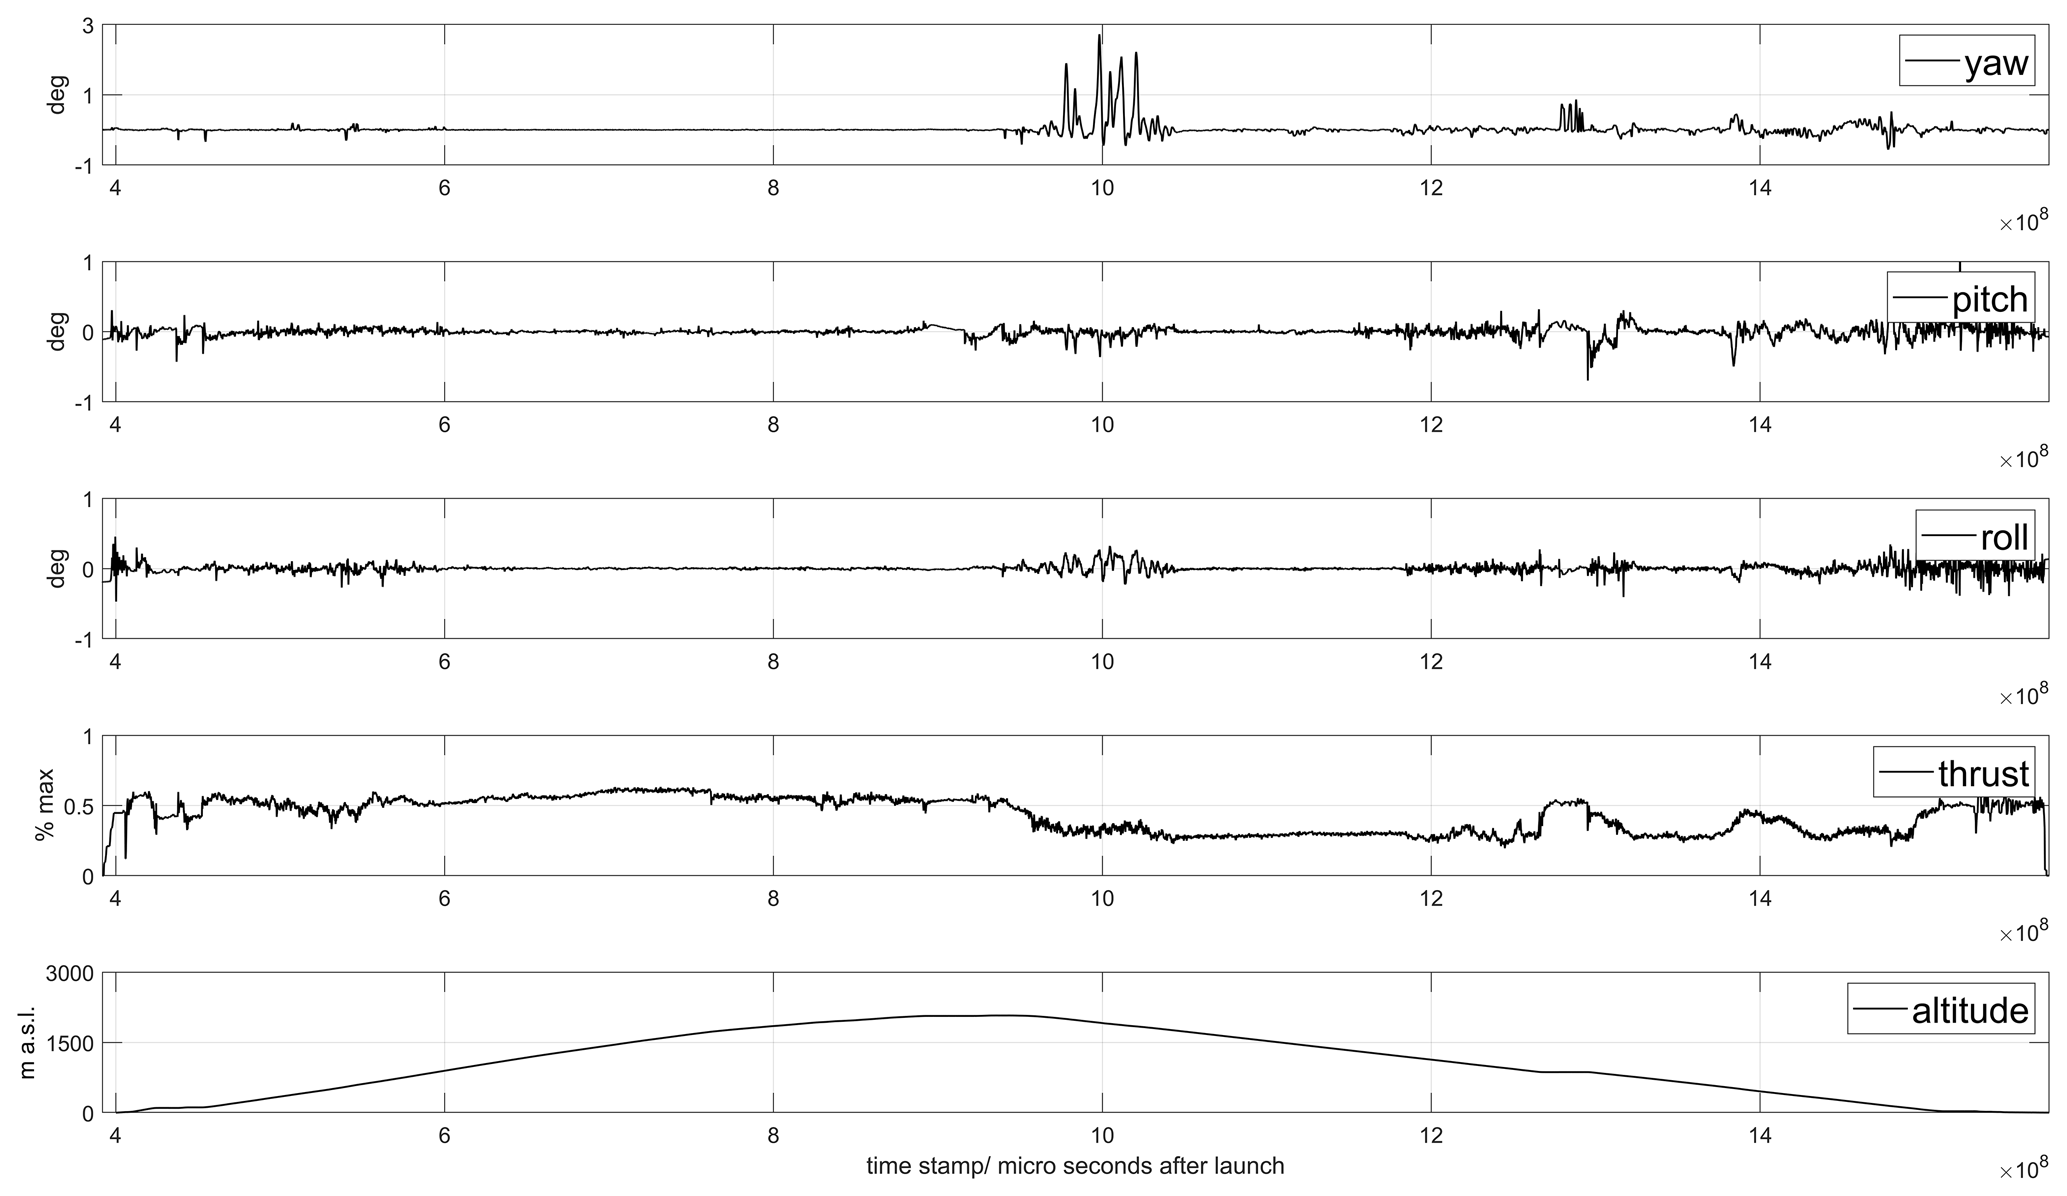
Figure 1Flight data from the drone flight shown in Fig. 9. The upper panels show time series of yaw, pitch and roll angles, the thrust (percentage) and the altitude of the drone. Notice the high variability of the parameters associated with acceleration, hovering and interference from clouds.
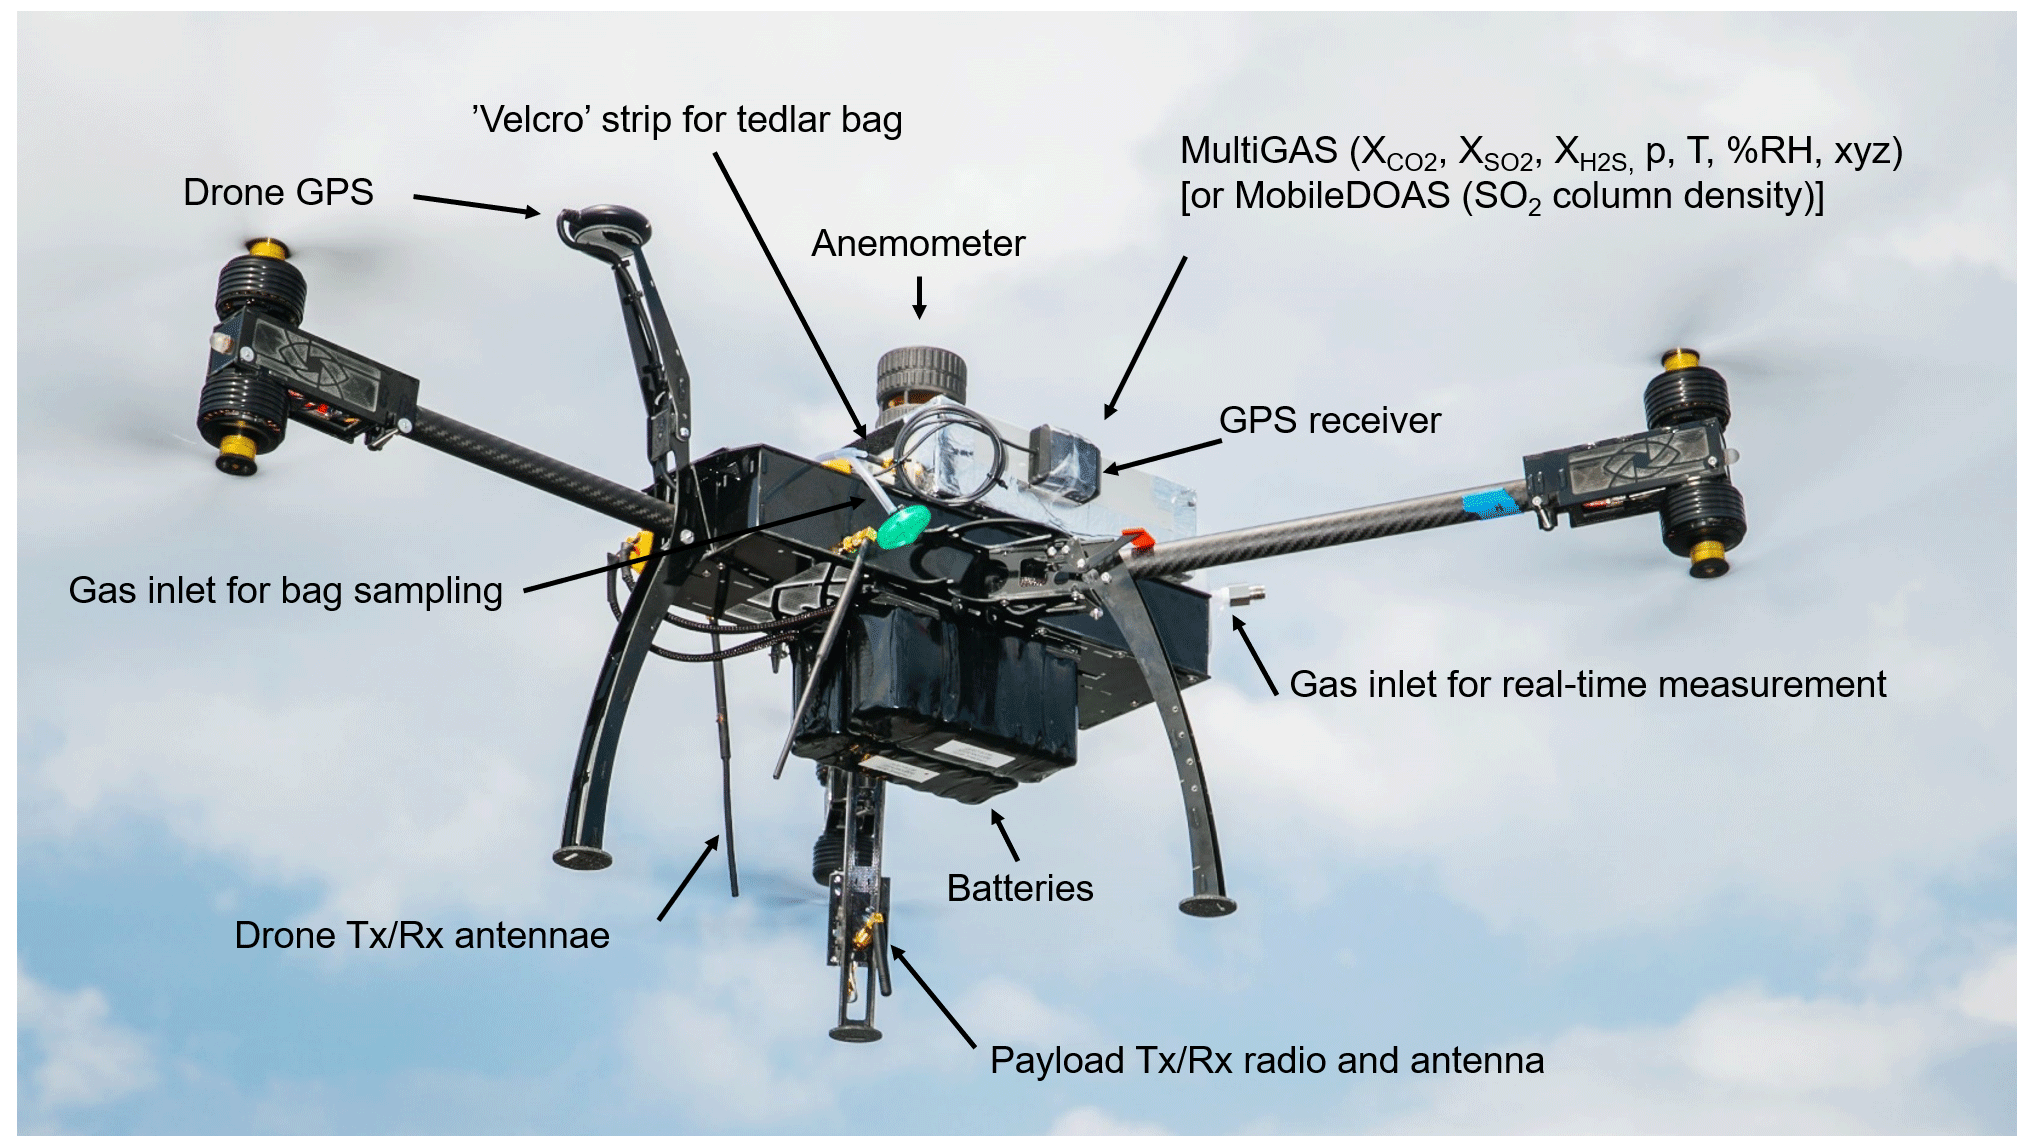
Figure 2Photo of the multi-rotor drone with modular payloads. The MultiGAS unit includes in situ sensors for gas composition (XA – concentration of species A, p – pressure, T – temperature, %RH – relative humidity, xyz – tilt coordinates), a gas-sampling unit and an anemometer. The MobileDOAS is used for the remote sensing of the gas flux. The modules are clamped to the drone at balanced position. The battery pack is placed below the drone chassis to lower the centre of gravity of the system. Flight and sensor data are telemetered in real time (photo courtesy of Matthew Wordell).
Based on these experiences, we modified the standard model of our platform in the following ways:
-
Change of operative system. We adopted an open-source navigation module PixHawk V4 with its own power distribution card in order to overcome typical restrictions in altitude and distance of other commercially available solutions, as well as to access all information of the flight logs for posterior analysis.
-
Modifications in the frame design. These modifications include addition of a larger payload-carrying platform, the use of more robust motors with race drone ESC (electronic speed control) that improves the manoeuvrability and propellers with a larger diameter than are typically standard for a drone of this size (45 cm). We also placed the batteries below, instead of on top, of the main frame to gain further stability. The drone has a triple inertial measurement unit (IMU), dual compass and one GPS and was provided with two 6S4P 10 Ah batteries.
-
Control board. Jeti DC16 was used as a pilot controller, and for transmission a Crossfire (TBS Crossfire Diversity Nano RX) was used. A tablet was connected to the Crossfire for flight planning and for monitoring the telemetry.
-
Increased telemetry range. We replaced the common 2.4 GHz by a 900 MHz radio link and used a high-gain directional antenna for ground control. Figure 2 shows a photo of the drone and its main modular payloads. Technical specifications of our drone are provided in Table 1.
-
Electrical interference. We used a shielded metal box for the electrochemical sensors and tested the optimal location of power and data cables and antennas to minimize electrical interference on these detectors.
-
Camera. During the later part of the campaign at Manam, it was found to be useful to include a camera running in FPV (first-person view) mode. The main reason for this was that it facilitated the avoidance of clouds and thereby reduced energy consumption. It also improved the manoeuvrability as it gave the pilot access to critical parameters in real time within their view (goggles).
With these modifications we have been able to reach heights of 2000 m above take off position (equivalent to absolute altitudes of up to 3700 ) and a range of nearly 5 km. Although we have limited the total flight time to 30 min under normal conditions (i.e. those conditions resulting in normal current consumption), with favourable conditions and flight piloting strategies, a flight time of 35 min could be achieved within a safe margin. In the following sections, we describe each of the modular payloads and measurement strategies compatible with this drone platform.
2.2 In situ measurements of plume speed
When determining the gas emission rate – using methods such as MobileDOAS (Galle et al., 2003), ScanDOAS (Edmonds et al., 2003) or COSPEC (Stoiber et al., 1983) – information about the wind speed at plume height is critical. Since volcanic plumes are often located at several kilometres' altitude, and the measurements are conducted in an area relatively close to a major topographic structure, acquiring representative measurements of plume speed is challenging. The use of atmospheric models (such as operational databases provided by NOAA or ECMWF) is an alternative approach; however, these models are usually coarse in horizontal, vertical and temporal resolutions, and thus validation of these modelled wind data by local measurements is valuable. A drone can offer such in situ validation.
We have applied two different methods for plume speed measurements using the drone: drone drift and anemometer. In the drone drift method, the drone is first positioned at the altitude of the plume, and then the GPS position-locking is deactivated. The drone is thus left free to drift with the horizontal wind and, after an initial lag time of less than 1 min, the drone reaches the local wind speed. The movement of the drone is logged with a separate GPS receiver, from which the local wind speed can be determined. Additionally, the actual airspeed can also be monitored in real time through the information sent to ground control, derived from GPS data. In the second method, a small and lightweight anemometer was installed on the drone, logging the total velocity experienced by the drone (wind velocity + drone velocity). With the drone held in a fixed position close to the plume, the plume speed is thus obtained. The advantage of this method over the drone drift approach is that plume speed may be derived at the same time as other measurements in the plume are conducted. The anemometer is integrated with the MultiGAS unit, described below.
2.3 MobileDOAS for remote measurement of SO2 emission rate
Since 2002 an instrument referred to as MobileDOAS (Galle et al., 2003; Johansson, 2009) has been used increasingly to replace the previously used COSPEC instrument (Stoiber et al., 1983) for measurements of volcanic SO2 gas emission rate. Both MobileDOAS and COSPEC instruments use the diffused UV solar radiation as a light source for the determination of the total column of SO2 above the instrument, which is calculated using absorption spectroscopy. During a typical measurement, the instrument is moved in such a way that it passes under the gas plume in a direction close to perpendicular to the plume transport direction while simultaneously recording spectra and GPS location. Thus, by correcting for deviations from traversing the plume perpendicularly using GPS data and using DOAS evaluation algorithms to derive SO2 total columns along the track, the total number of SO2 molecules in a cross-section of the gas plume can be derived. This quantity is then multiplied by wind speed at the centre of mass of the plume – i.e. plume speed – to derive the gas emission rate.
The main sources of error in these measurements are “dilution” of the absorption signal due to simultaneous collection of skylight that has been either transmitted through the plume or scattered from outside of the plume (Millán, 1980; Mori et al., 2006) and limited knowledge of the plume speed (Galle et al., 2010).
MobileDOAS measurements from a drone platform offer several advantages compared to traditional approaches (e.g. Rüdiger et al., 2018; De Moor et al., 2019): regardless of infrastructure (roads) and topography, traverses can be made in a direction perpendicular to the plume direction. Measurements can be made at an elevated altitude, thus reducing the effects of light dilution, and plume speed can be determined reasonably accurately by the methods described in Sect. 2.2.
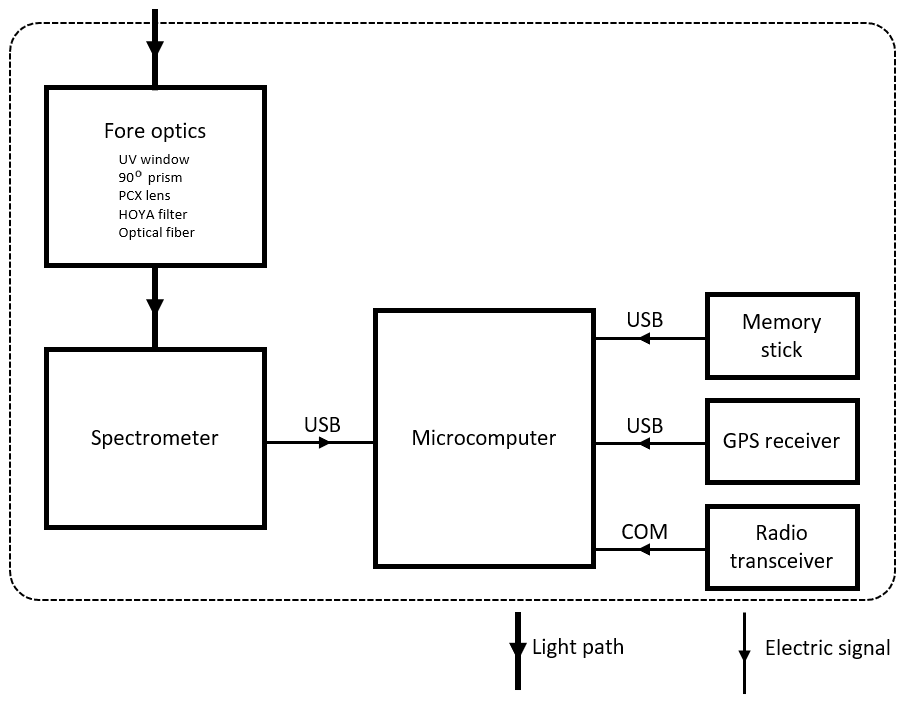
General details of the MobileDOAS hard- and software are given in Johansson et al. (2009). Details specific to our drone-mountable version of the instrument are provided in Table A1 (Appendix A). A schematic view of the MobileDOAS instrument is shown in Fig. 3.
The MobileDOAS instrument is built into a plastic case with clamps adapted to a platform on the drone in a balanced position, and it is powered from a 12/5 V power cable from the drone that was permanently active. Thus, the MobileDOAS could be installed on the drone platform, and the MobileDOAS software could be started up, or data from the MobileDOAS could be backed up, without the main drone power turned on, thereby saving battery power. While the MobileDOAS software is active, a stream of basic information (time, position, SO2 column density) is transmitted in real time via an independent radio link from the instrument. These real-time data help the pilot to guide the drone and ensure a complete traverse of the plume. The full traverse can be visualized upon landing, by connecting an external computer to the instrument computer running MobileDOAS.
2.4 MultiGAS for in situ measurement of gas composition
MobileDOAS and ScanDOAS are used to obtain SO2 – and under some circumstances also BrO (Lübcke et al., 2014) – emission rates from the ground using remote-sensing techniques. However, to obtain the relative concentrations of other volcanic species, such as CO2 and H2S, direct measurements must be conducted within the plume itself; high atmospheric background concentrations or weak optical absorption of these species preclude robust detection by remote-sensing methods. The most common method used for this is multi-component gas analyser systems (MultiGAS; Aiuppa et al., 2005; Shinohara, 2005). MultiGAS-type instruments generally consist of several small sensors (typically electrochemical or optical), with low power consumption, connected to a micro-computer and sometimes a data link for real-time data transfer. The instrument is typically installed in a gas-exposed location (e.g. a crater rim), often proximal to the vent location. Although its installation may be labour-intensive and sometimes risky, this method is generally straightforward. However, on many volcanoes, approaching the summit area would represent an enormous risk – this is the situation at Manam. In such cases, performing the in-plume measurements using a drone is an attractive possibility. An obvious requirement here is the ability of the drone to reach high altitude as well as having long endurance. This is emphasized further by the fact that many of the sensors used have slow response times, while the gas concentrations (especially close to the vent where the signal is stronger) may vary quickly within seconds due to dilution and turbulent wind conditions. Under these conditions, it is preferable to expose the sensors to the volcanic gas for as long a sampling duration as possible – ideally at least several minutes. Short time fluctuations in concentration and plume location also imply that the ability to monitor a gas tracer (such as SO2) in real time is desirable to “chase” high-concentration sites. This is of course not guaranteed when the drone is sent in autopilot, unless an adaptive flight routine based on a plume tracer is implemented.
MultiGAS units combine information from different sensors to determine the mixing ratios of different species. In our present system, these quantities are determined according to the following processes:
-
For SO2 and H2S. The target gas is pumped into a chamber to which the electrochemical sensors are exposed. The signal generated by the electrochemical effect from an electrode exposed to the gas of interest is subtracted from the signal of a reference electrode inside the system This differential signal is proportional to the gas mixing ratio. The proportionality is linear within a certain range and depends to some degree on temperature, pressure and the concentration of interfering species. These proportionality and disturbance factors are determined by calibration.
-
For CO2.
-
The same gas sample is passed through a cavity illuminated by two infrared beams with wavelengths centred in and out of an absorption band of CO2.
-
Using Beer–Lambert's extinction law, the local concentration of CO2 is determined.
-
To get the mixing ratio, further corrections are needed for temperature, pressure and relative humidity, which should be established by calibration.
-
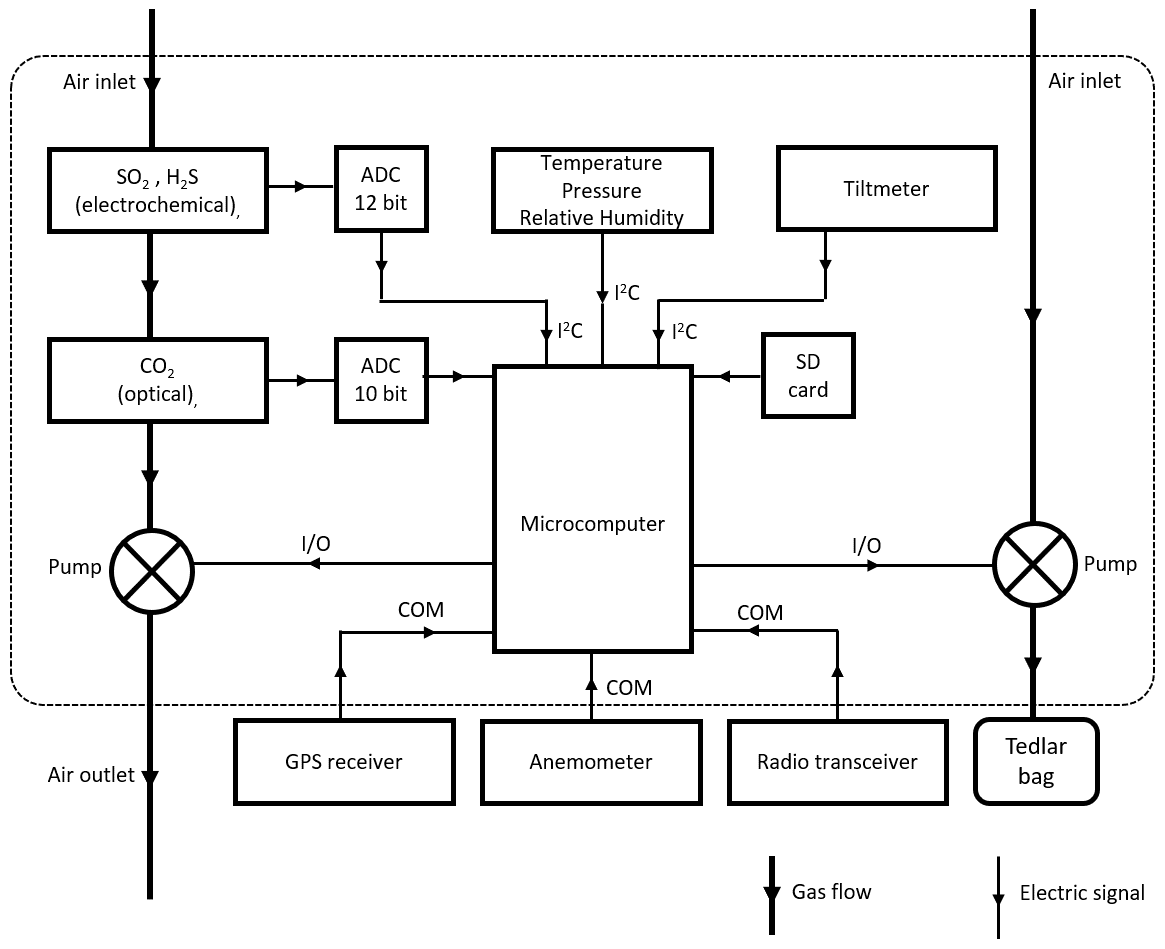
For the case of H2O, the mixing ratio can be derived from measured relative humidity, pressure and temperature, following known thermodynamic laws (see Appendix B). If the measurement of such variables is done inside the sampling circuit, the H2O mixing ratio of the sample can be determined simultaneously to the other species. Our system, however, measures these variables only inside the instrument box, so the mixing ratio is representative of ambient gas passively diffusing in the interior of the unit; H2O therefore varies differently than the other species as it is determined from outside of the closed system. The schematic layout of the MultiGAS instrument used in this study is shown in Fig. 4, and technical specifications of the sensors are given in Appendix A.
Data from this unit are transmitted through an independent data link and visualized on the ground using self-developed software used for tracking emissions from ships (Beecken et al., 2015; Mellqvist et al., 2018). This visualization is the basis to fine-tune the position of the drone for the sampling of more concentrated regions of the plume.
To obtain the mixing ratios representative of the volcanic emission, it is necessary to correct for the contribution from the same species present in the background atmosphere. Ideally, such a measurement should be done at similar ambient conditions (i.e. pressures, temperature) to those expected inside the plume, unless the corrections for different conditions are known precisely.
When two sensors have different response time characteristics, the signals they measure will have different amplitude and shape and be time-shifted with respect to the input signals depending on the frequency content of the input. This “distortion” of the input signals can be large when a rapidly fluctuating signal is measured for a short time; i.e. the instrument basically records only the transient signal. This could be the case with MultiGAS measurements on a flying drone in a turbulent plume. These effects must be considered to reproduce the input signal and subsequently analyse it (for example, taking the ratio of two signals such as ).
However, if only the ratio of the signals, and not their instantaneous amplitudes, is sought, it is enough that the dynamic constants are similar. Alternatively, the true amplitudes may be obtained if the input signals have variations in timescales longer than the characteristic response times of the sensors, and the measurement is taken for a time longer than the response time of the sensor. This can be achieved in two ways, either by selecting carefully the characteristics of the sensors or by exposing them to a near-constant signal. To achieve the latter, a practical solution is to take a sample of the gas and then expose the sensors to the sampled gas for a time long enough to achieve the correct amplitudes. Our system fulfils these two criteria: the sensors have similar response characteristics, and the MultiGAS incorporates a bag and pump unit that makes it possible to take samples of the plume and then expose it to the sensors for several minutes i.e. on the ground (see Sect. 2.5). In this mode the gas from the Teflon bag is circulated through the detectors in a closed loop, thereby exposing the detectors for the constant gas concentration in the sample for several minutes. Another advantage here is that any possible losses, i.e. wall effects, could be monitored and compensated for. This method was however not tested in the actual field campaign because the limited gas samples were instead used for isotopic composition analyses.
A detailed analysis of the problems encountered when combining data from sensors with different response times is given in the following section.
2.4.1 Correction of time-response differences in MultiGAS sensors
When measurements are made with combined data from several sensors having a different response time, e.g. measurements of the ratio using a MultiGAS instrument, great care must be taken.
In this measurement procedure, three characteristic times are important:
-
the time of variability in gas concentration, tv;
-
the sampling time, ts;
-
the response time of the sensor, t90 (meaning the time to reach 90 % of the true signal for a step change in concentration, higher than the detection limit).
The first characteristic is determined by variability in emission, variability caused by local turbulence at the point of measurement and variability caused by relative transit of the drone with respect to the plume. The second characteristic is determined by the sampling rate of the instrument and the time required for exchange of the gas sample inside the measurement cavity. By the third characteristic, we mean the dynamic response time of the sensor. Because sensors often operate according to different principles, the sensor response times are usually different; this may introduce artefacts in the mixing ratios, which would then result in wrong molar ratios for the different species, as discussed by Aiuppa et al. (2005), Shinohara (2005), Roberts et al. (2017) and Liu et al. (2019).
Drone MultiGAS measurements are normally performed by hovering in a region of high gas concentration. This means that the relative motion of gas parcels is mostly determined by local turbulence. Farther away from active vents, concentration heterogeneities are largely smoothed out, but the signal is very weak. Therefore, strong signals are usually subject to high variability.
Our MultiGAS intakes a flow of 0.5 L min−1 (∼ 10−5 m3 s−1), which means that for a measurement cell section of ∼ 10 cm2, the flow speed is in the order of 0.01 m s−1. This results in a negligible dynamic pressure in relation to atmospheric pressure inside the measurement cavity. The relation between the sampling and variability time is determined by the Nyquist criterion. The instrument would only be able to capture signals with frequency fluctuations lower than half the sampling frequency accurately (in practice, a much higher sampling frequency is required). Our MultiGAS takes a sample every second, so variations with frequencies higher than 0.5 Hz cannot be properly captured. Such dynamic changes in plume composition are assumed to be improbable for most typical scenarios. The CO2 sensor has a cavity with dimensions of 153 mm × 30 mm × 36 mm; i.e. the sampling volume of 0.17 L is exchanged in a time of about 20 s. For the electrochemical sensors, the response time depends on the transport through the membrane, dissolution in the electrolyte, reaction time and sampling. Thus, differences in sensor geometry and measurement principle produce differences in response times, even if the gas flow rate remains constant (i.e. with the same pump).
The response time depends on the dynamic properties of the sensor and the nature of the signal. For first-order sensors, only one energy-storing and one energy-dissipating component dominate, and oscillatory behaviours are neglected. For such sensors, the dynamical response can be modelled through the differential equation (e.g. Pallas-Areny and Webster, 1991):
where x(t) is the time-varying input signal (e.g. mixing ratio of SO2), y(t) is the time-varying measured signal (e.g. voltage of the SO2 electrochemical sensor), is the first derivative of the measured signal with respect to time, and a0 and a1 are constants identified with the response time (τ = ) and static sensitivity of the sensor ().
The dynamical time-response factor defines a delay in the response of the measured signal in relation to the input signal. If the input signal is a step function, one usually relates this factor by the time required for the sensor to achieve a certain level of the signal, for example 90 %. Periodical signals will be affected by an error in amplitude and by a shift caused by the frequency response of the sensor. The steady-state amplitude response to a signal of angular frequency ω is given by . The shift is given by tan −1(ωτ). An arbitrary signal can be represented by a Fourier sum of periodical signals, and for linear systems, the response of the sensor is obtained by superposition of the responses to the monochromatic signals (Pallas-Areny and Webster, 1991).
We correct our signals based on these conditions:
-
Sensors of the MultiGAS instrument can be accurately modelled as first-order systems.
-
The input signals of different sensors measured at the same time are highly correlated.
-
Variability of the gas concentration occurs at a characteristic time much shorter than the exchange time in the sensor.
-
The total measurement time is much larger than the exchange/diffusion time in the sensor.
The first assumption is supported by the design and laboratory characterization of the electrochemical and optical sensors. The second assumption requires that the molar ratio of different species is constant and homogeneous within the time of measurement. Sampling a heterogeneous mixture would produce different ratios at different times, complicating both the measurement and the interpretation of the results. In volcanic emissions, drastic changes in molar ratios within minutes are unlikely if the gases come from the same source. But if the plume mixes emissions from different vents, or if large local heterogeneities affect the chemistry or condensation of different species unequally (e.g. for plumes with heterogeneous concentration of ash), changes in gas molar ratios can occur, even on short timescales (Kelly et al., 2013). The third condition ensures that enough information is available for finding a unique solution because the high variability in the signal is required for the cross-correlation analysis, and the fourth condition is required to reduce the error caused by sampling over different exchange/diffusion times of the sensors.
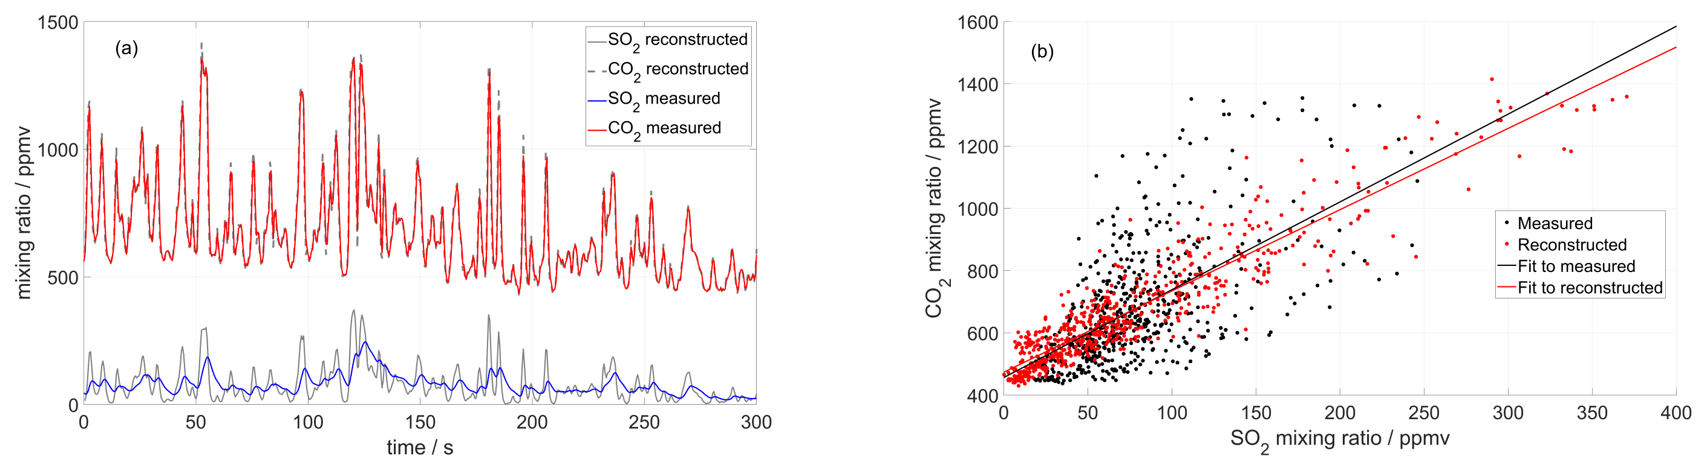
Figure 5(a) Time series of CO2 and SO2 mixing ratios measured inside the crater of Tavurvur volcano in September 2016 using a MultiGAS unit (Arellano et al., 2017). The two signals are reconstructed iteratively until an optimal correlation is found between them. For this instrument, the SO2 sensor was slower than the CO2 sensor and could not capture all rapid fluctuations. (b) After the correction, the correlation between the two series is higher, and the dispersion of the scatter plot much lower. But most importantly, the molar ratio changes from 2.8 ± 0.3 to 2.6 ± 0.08 (± of 95 % CI), and the background CO2 (inside the crater) changes from 457 ± 26 to 473 ± 9 ppm.
Based on the first assumption, our method starts with the two measured signals (e.g. and ) and constructs from them their derivatives ( and ) by simple numerical approximation, which works fine as long as the sampling time is short (i.e. as long as large variability in timescales shorter than the sampling rate is not expected). Based on the second assumption, we expect that a simple scaling exists between the two input signals, defining a constant ratio r (r = ). Now we simply iteratively vary the time-response factors of the two signals and look for the combination that maximizes the cross-correlation between the reproduced inputs according to Eq. (1) (see Appendix B for an implementation of this method). This method works best for strongly fluctuating signals, rich in information for the correlation analysis. Figure 5 shows an example of this method applied to field measurements of a very dynamical signal obtained in the crater of Tavurvur volcano (Papua New Guinea) in 2016 using the Sunkist instrument.
This method is quite general for the correction of the dynamic response of the sensors. It obviates time-consuming and frequent characterization of the response time in a laboratory and accounts for the fact that the sensors may change their dynamic characteristics when exposed to different conditions in the field, relative to the lab. Of course, calibration is still desirable to check for possible changes in offset and sensitivity of the sensor over time.
2.5 Bag sampling unit for gas composition and isotopic analysis
In some cases, real-time measurements in the gas plume are not possible, either because longer measurement time is needed to reduce the signal-to-noise ratio or because the measurement requires an analytical technique that is more complex than can be performed in situ on a drone platform. In such cases, acquiring a sample of the plume gas using a drone carrying a sample bag and a pump may be a viable option. For successful sampling of the most concentrated region of the plume, real-time data transmission of a plume tracer – such as SO2 – to the drone operator on the ground (in combination with manual flight control to respond accordingly) is advantageous; however, this can be technically challenging, especially for long-range flights.
Measurement of the carbon isotope composition of volcanic CO2 is a key example of an application that requires in-plume sample collection. Carbon isotope analyses are performed using instrumentation such as isotope ratio mass (IRMS) spectrometers (Chiodini et al., 2011; Sharp, 2007), bench-top infrared spectroscopic analyses (Fischer and Lopez, 2016; Rizzo et al., 2014; van Geldern et al., 2014) or cavity ring down spectroscopy (Lucic et al., 2015). While the bench-top spectroscopic techniques are much more portable than IRMS systems and do not require a vacuum, they still depend on a stable 110 or 220 V power source and pressurized calibration and dilution gases – facilities that are not always available in remote field locations. The spectroscopic techniques generally require a sample volume of about 300 mL at atmospheric pressure and temperature. This can be accomplished by directly placing the instrument in the volcanic plume (Rizzo et al., 2014, 2015) or by collecting a plume or fumarole sample in an appropriately sealed and non-reactive container (i.e. Tedlar sample bags) for subsequent analyses by spectroscopy (Fischer and Lopez, 2016). The application of drones for this purpose is advantageous over the use of helicopters due to the lower operational cost and smaller scale logistics, as well as avoiding sample contamination by gases present in the helicopter exhaust (Fischer and Lopez, 2016).
During our fieldwork at Manam volcano, we used two payloads to sample the plume. In the first, we equipped our drone with four Tedlar sampling bags. Each bag was connected to a small rotary pump triggered by a timer. The drone operator positioned the drone in the plume, at which point the sample was collected by a timed trigger. The duration of sample collection was approximately 45 s at an approximate flow rate of 1 L min−1. A valve system was not necessary because the pump also functioned as a valve once it stopped pumping. The second system was similar, but here the pump (at 0.5 L min−1) could be remotely controlled, and only one Tedlar bag was used. After return of the samples to the ground, the valves on the Tedlar bags were closed, and the samples were analysed by a Delta Ray infrared spectrometer. In addition to collecting samples from the plume, a clean air sample was collected upwind and at the same elevation as the plume. In principle, the analytical procedure followed that described in Fischer and Lopez (2016). Due to the remote location of Manam island and the difficulty encountered when obtaining calibration and CO2-free air gases in-country, we developed an air purification system that utilized a bicycle pump and CO2 scrubber, Sulfolime™, obtained from PP systems Inc., to produce pressurized CO2-free air. This system allowed the production of essentially unlimited amounts of CO2-free air with CO2 contents of < 0.7 ppm, as measured using the Delta Ray. The calibration gas was pure CO2 obtained from a local distributor. Prior to analysis, the C isotope composition of this gas was not known, and we therefore collected a sample of this gas to analyse back in the Volatiles Laboratory at the University of New Mexico using the Delta Ray and standard calibration gases. Therefore, we were not able to determine the exact C isotope compositions of the samples in the field but were able to adjust the pure CO2 calibration gas to the concentration of CO2 measured in the bag sample by setting the corresponding CO2 concentration in the Delta Ray software. We then retroactively corrected all our measurements using the values obtained for the field calibration gas.
2.6 Plume sampling of halogens using a denuder system
Besides H2O, CO2 and SO2, halogens are among the major constituents of volcanic emissions (Textor et al., 2004). The discovery of bromine monoxide (BrO) in volcanic plumes and the correlation of the simultaneously gained ratio with volcanic activity by automatized instruments (Lübcke et al., 2014) made a promising volcano monitoring tool. To utilize ratios for monitoring volcanic activity, an understanding of ongoing bromine chemistry in the plume is essential. For a detailed discussion on bromine chemistry in volcanic plumes, see Gutmann et al. (2018) and references therein. Besides BrO, no other bromine species can be detected by remote-sensing instruments. Therefore in situ methods have been developed recently for the determination of reactive bromine (BrX) and hydrogen bromide (HBr) (Rüdiger et al., 2017; Gutmann et al., 2020, respectively). The new methods reveal the downwind conversion of released HBr to other bromine species with time in a volcanic plume.
Bromine speciation can be measured using gas diffusion denuder systems. Gaseous molecules are derivatized in situ by an organic coating at the inner walls when pumped through gas diffusion denuders. Analysis of bromine speciation has been carried out for two different bromine species. HBr has been determined by 5,6-epoxy-[1,10]-phenanthroline-coated denuders (Gutmann et al., 2020), and BrX (such as Br2, BrCl, HOBr) and reactive chlorine species (ClX) were detected by 1,3,5-trimethoxybenzene-coated denuders (Rüdiger et al., 2017). Samples were analysed by high-performance liquid chromatography or gas chromatography coupled to mass spectrometry, at the University of Mainz, Germany, after returning from the field.
For the detection of SO2 a compact MultiGAS-type system called “Sunkist” (Rüdiger et al., 2018) was used, which contained an electrochemical CiTiceL 3MST/F sensor. The calibration of the electrochemical SO2 sensor followed Arellano et al. (2017). The Sunkist also measures ambient pressure and temperature. Since the thermometer is inside the isolated box and is affected by running instruments, only temperatures at the beginning of the flight were considered. The temperature at the starting position was 26 ∘C for the first flight and 32 ∘C for the second. Assuming a vertical temperature gradient of −5 K km−1 and an approximate flight height of 2000 m, 16 and 22 ∘C were estimated for calculations, respectively.
Denuders were connected by PTFE tubes to a micro pump providing 200 mL min−1 for each denuder. Denuder sampling does not provide time-resolved samples and instead yields an average concentration for the whole exposure interval (i.e. an average per flight). Since results obtained with environmental denuders predict that these bromine species usually only appear within the volcanic plume, we calculate their plume concentrations based on the known duration of exposure in the plume as detected by the SO2 sensor. Figure 6 shows a photo of the drone, with denuders and Sunkist, mounted on the drone and ready for take-off.

A blank correction for denuder results was performed by subtracting analysis results from coated denuders that travelled alongside samples but did not sample any air.
Background environmental blanks were sampled at the starting position of flights. For subtraction of background environmental blanks, the atmospheric concentration of samples (ppb) was calculated for the total flight time. After blank subtraction, the atmospheric concentration of the bromine species was calculated for the duration in the plume (estimated based on SO2 signals).
Limits of detection (LOD) and limits of quantification (LOQ) were calculated via 3 and 10 times deviation of the coated denuder blanks (n=3), respectively. LOD and LOQ are dependent on sampling time and the processing method in the laboratory and are, therefore, calculated for each sample separately.
3.1 Manam field-campaign conditions
A field campaign was conducted at Manam volcano in Papua New Guinea during 19–27 May 2019. This field campaign utilized all above-mentioned measurement and sampling techniques and was the culmination of several previous campaigns during which parts of the system had been extensively tested and modified in response to lessons learnt (see Sect. 2.1.1). The meteorological conditions during the campaign at Manam were characterized by low wind speeds and varying wind direction. Volcanic gas was emitted from two different locations close to the summit, the Main Crater and the Southern Crater (Liu et al., 2020). The Southern Crater was the most active, with incandescent lava visible within the crater and emanation of a persistent strong gas plume with high buoyancy (2–3 km above the crater rim). In contrast, the Main Crater showed more fumarolic degassing, generating a weaker plume with reduced buoyancy (see Fig. 7). Due to the low wind speed and varying wind direction, during some periods there was a buildup of high ambient SO2 concentrations covering a large part of the island, giving rise to challenging measurement conditions.
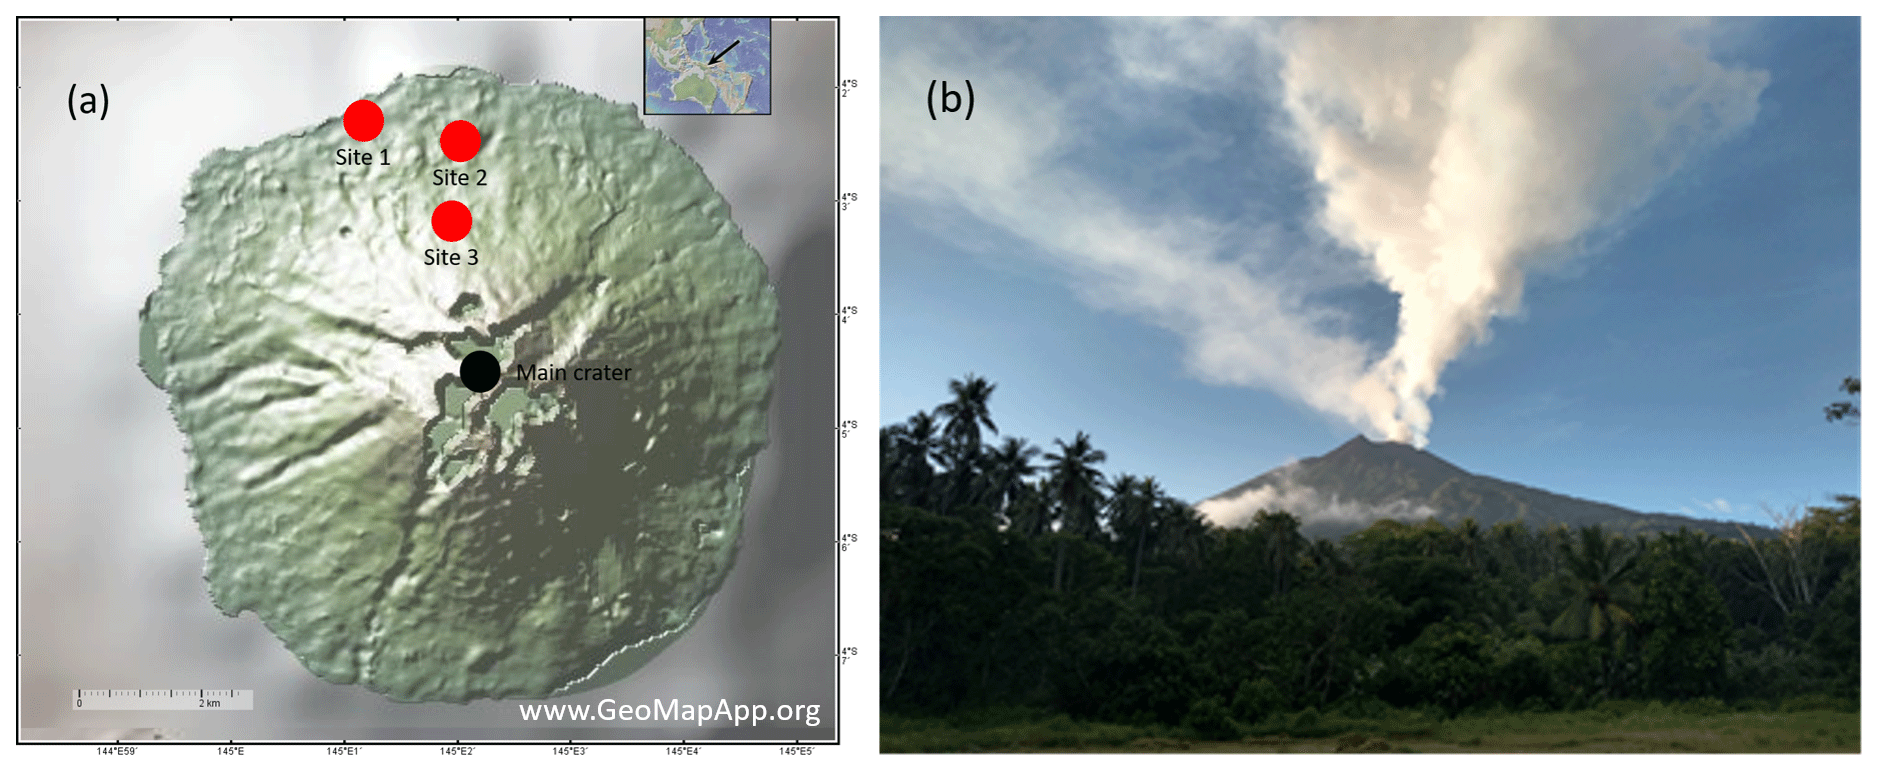
Figure 7(a) Map showing the location of Manam volcano (based on GeoMapApp; Ryan et al., 2009), with the main sites of launch of our drone (red) and the location of the crater emissions (black). (b) Photo of the plumes of Manam taken on the 27 May 2019 from Site 1.
3.2 Plume speed measurements
Figure 8 shows the horizontal wind velocity measured with an anemometer on board the drone, made in connection with a MultiGAS measurement on 22 May 2019. The high wind speeds measured before reaching the maximum altitude are due to a combination of wind velocity and horizontal drone velocity when approaching the plume region. After reaching the plume region (indicated by increased SO2 concentration around 2000 m altitude), the drone is kept at a fixed position, and after a short time a stable plume speed of 3.0 ± 0.5 m s−1 is obtained.
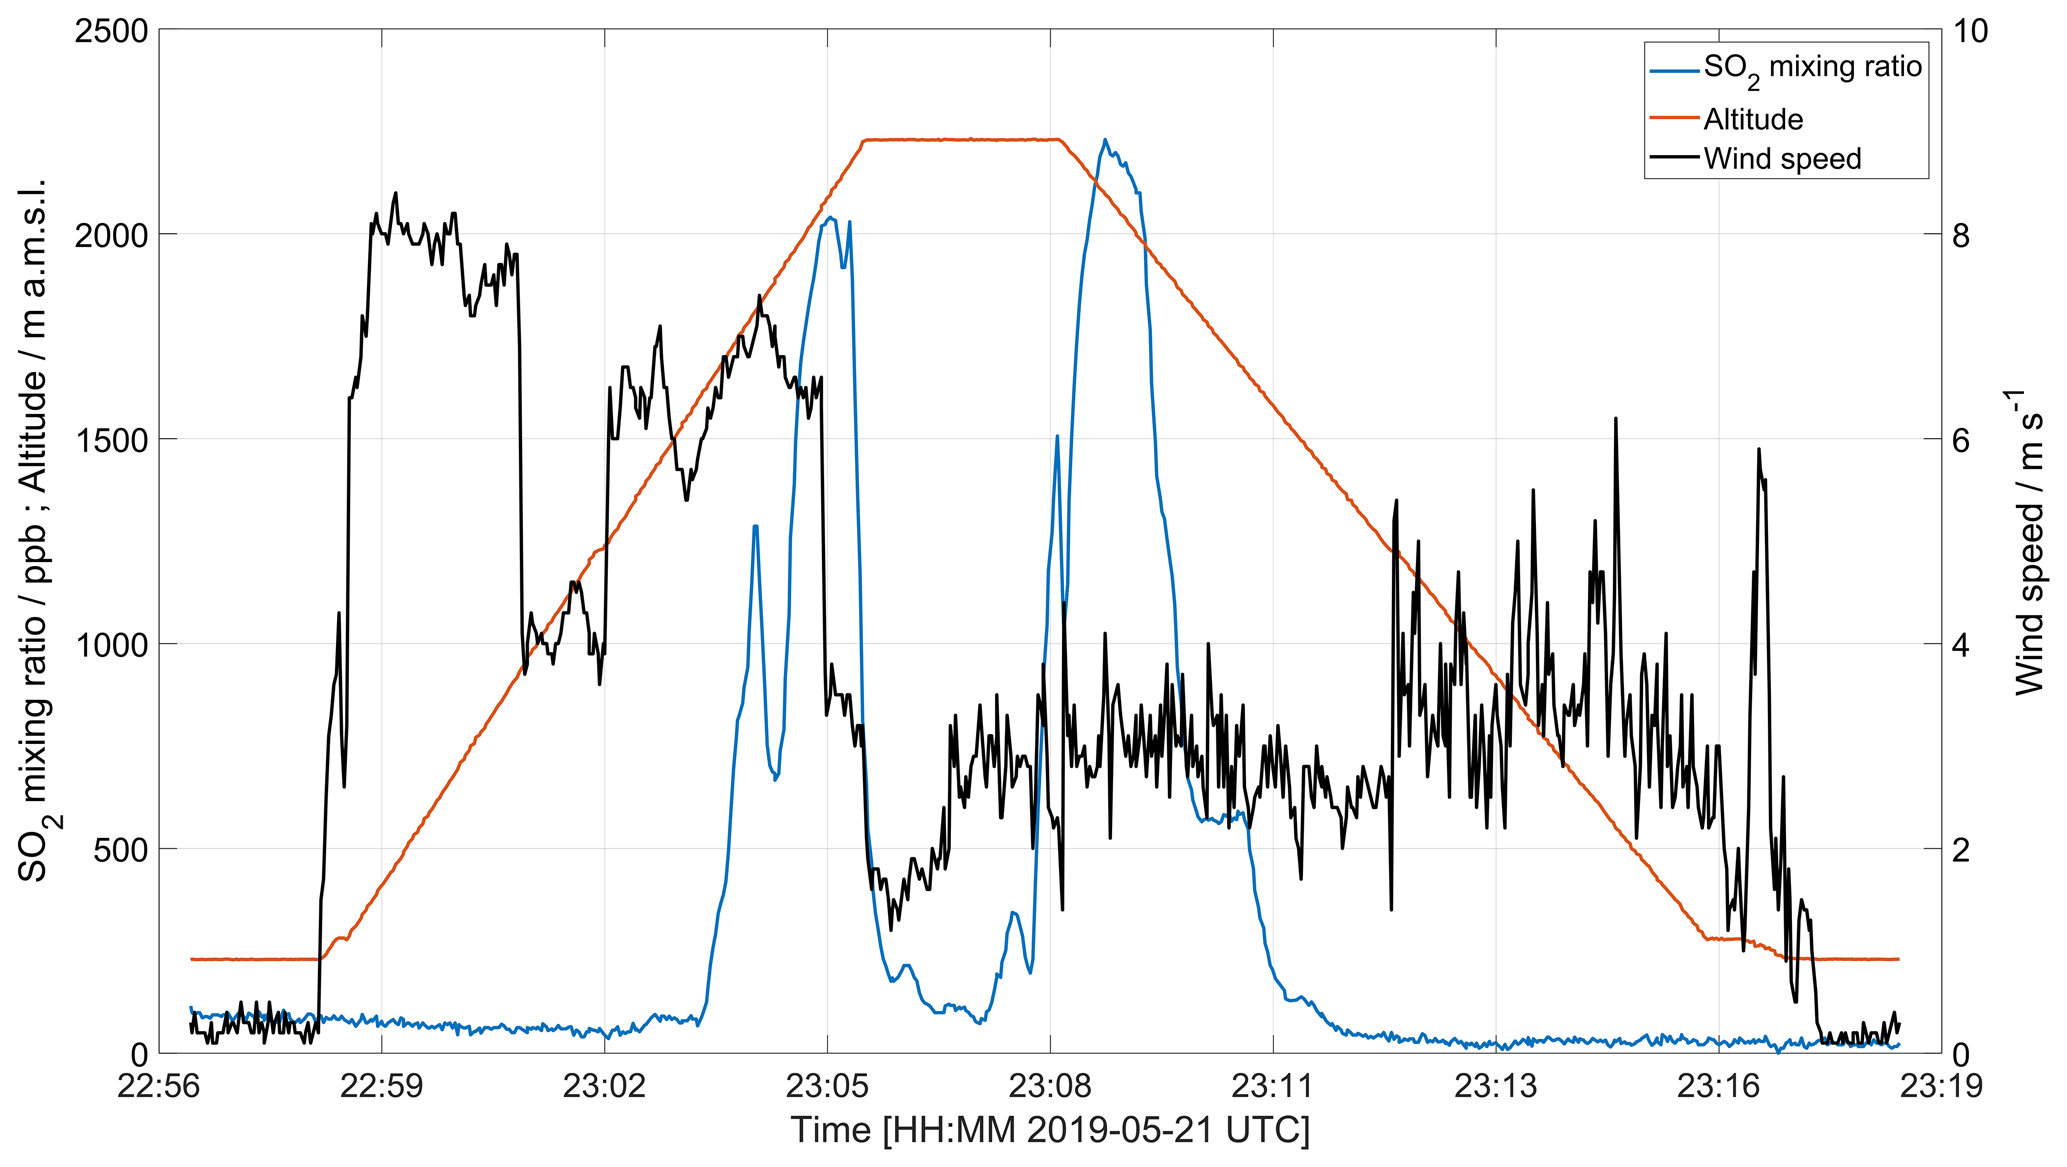
Figure 8Horizontal wind speed measurement made 22 May 2019 using an onboard anemometer. The effective measurement of wind speed at a certain level is obtained when the drone is placed in a hovering position for several seconds, usually in combination with composition measurements or gas sampling.
Figure 9 shows a plume speed measurement made using the drone drift method. After reaching the plume altitude, the drone GPS is deactivated remotely, and after a time lag (caused by the inertia of the drone), a stable drift speed of 3.8 m s−1 is obtained.
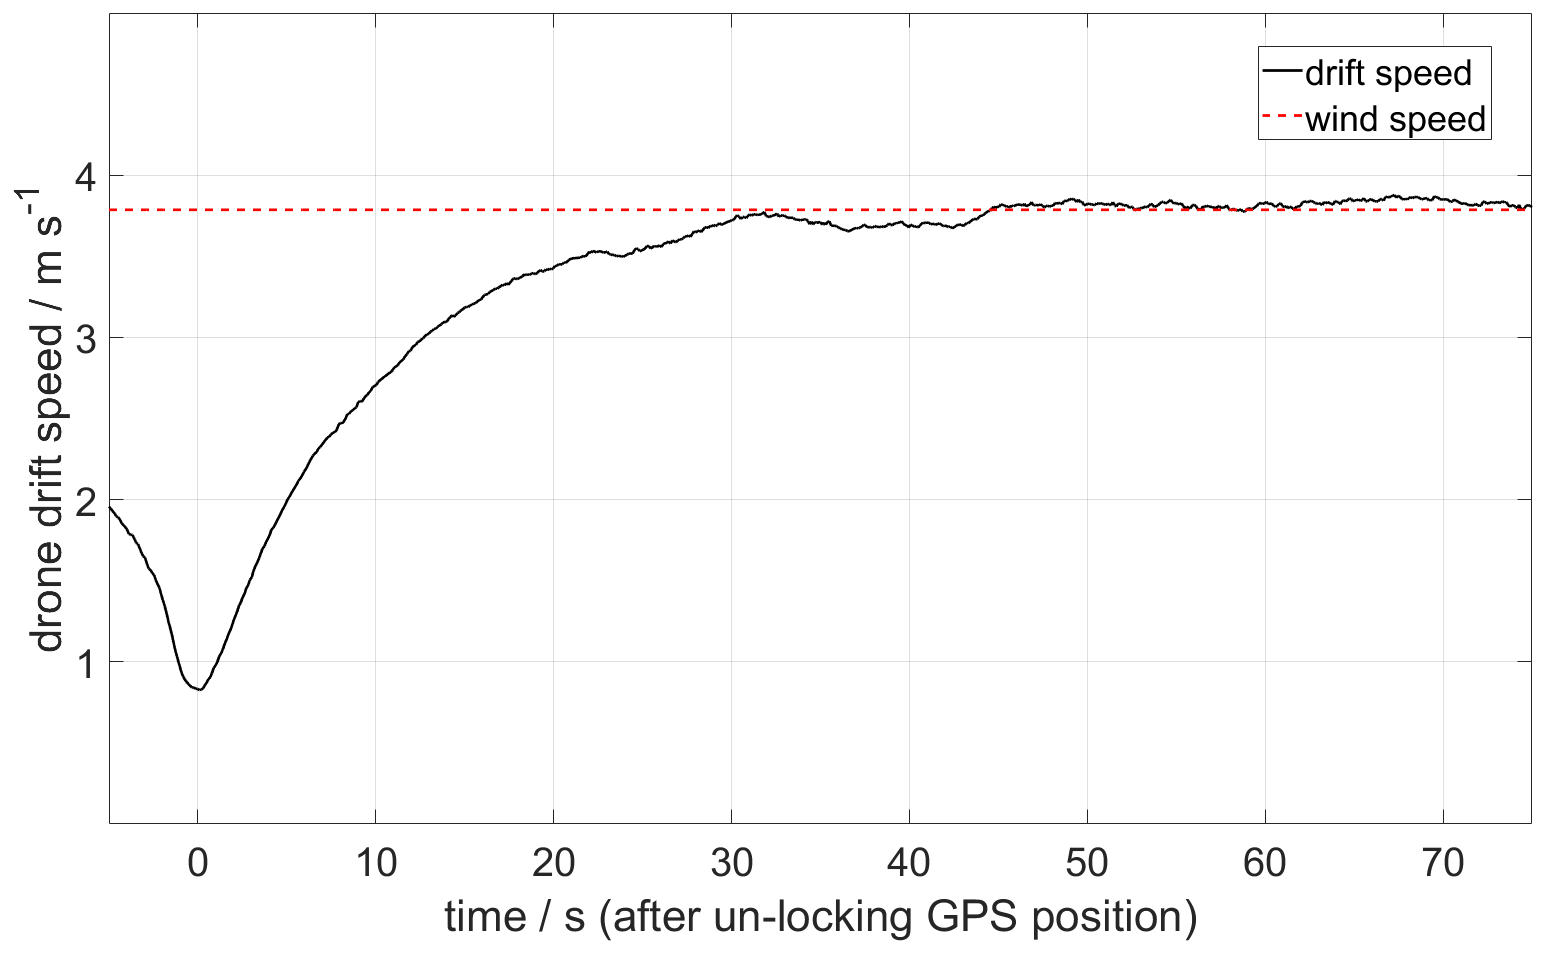
Figure 9Example of a plume speed measurement made by the drone drift method on 27 May 2019. The sequence starts at the moment when the GPS position is unlocked, and the drone is left free to be drifted by the wind at an altitude of 1911 It took about 30 s to stabilize at 3.8 m s−1.
As can be seen in Fig. 10, the wind speed at Manam during the field campaign was variable and relatively low, 1–4 m s−1, except on the final day (27 May 2019). This variability results in larger overall emission rate error estimates, as a change of a few metres per second (m s−1) in wind speed generates a large uncertainty in the emission. However, the data from the ECMWF regional model are in relatively good agreement with our drone measurements.
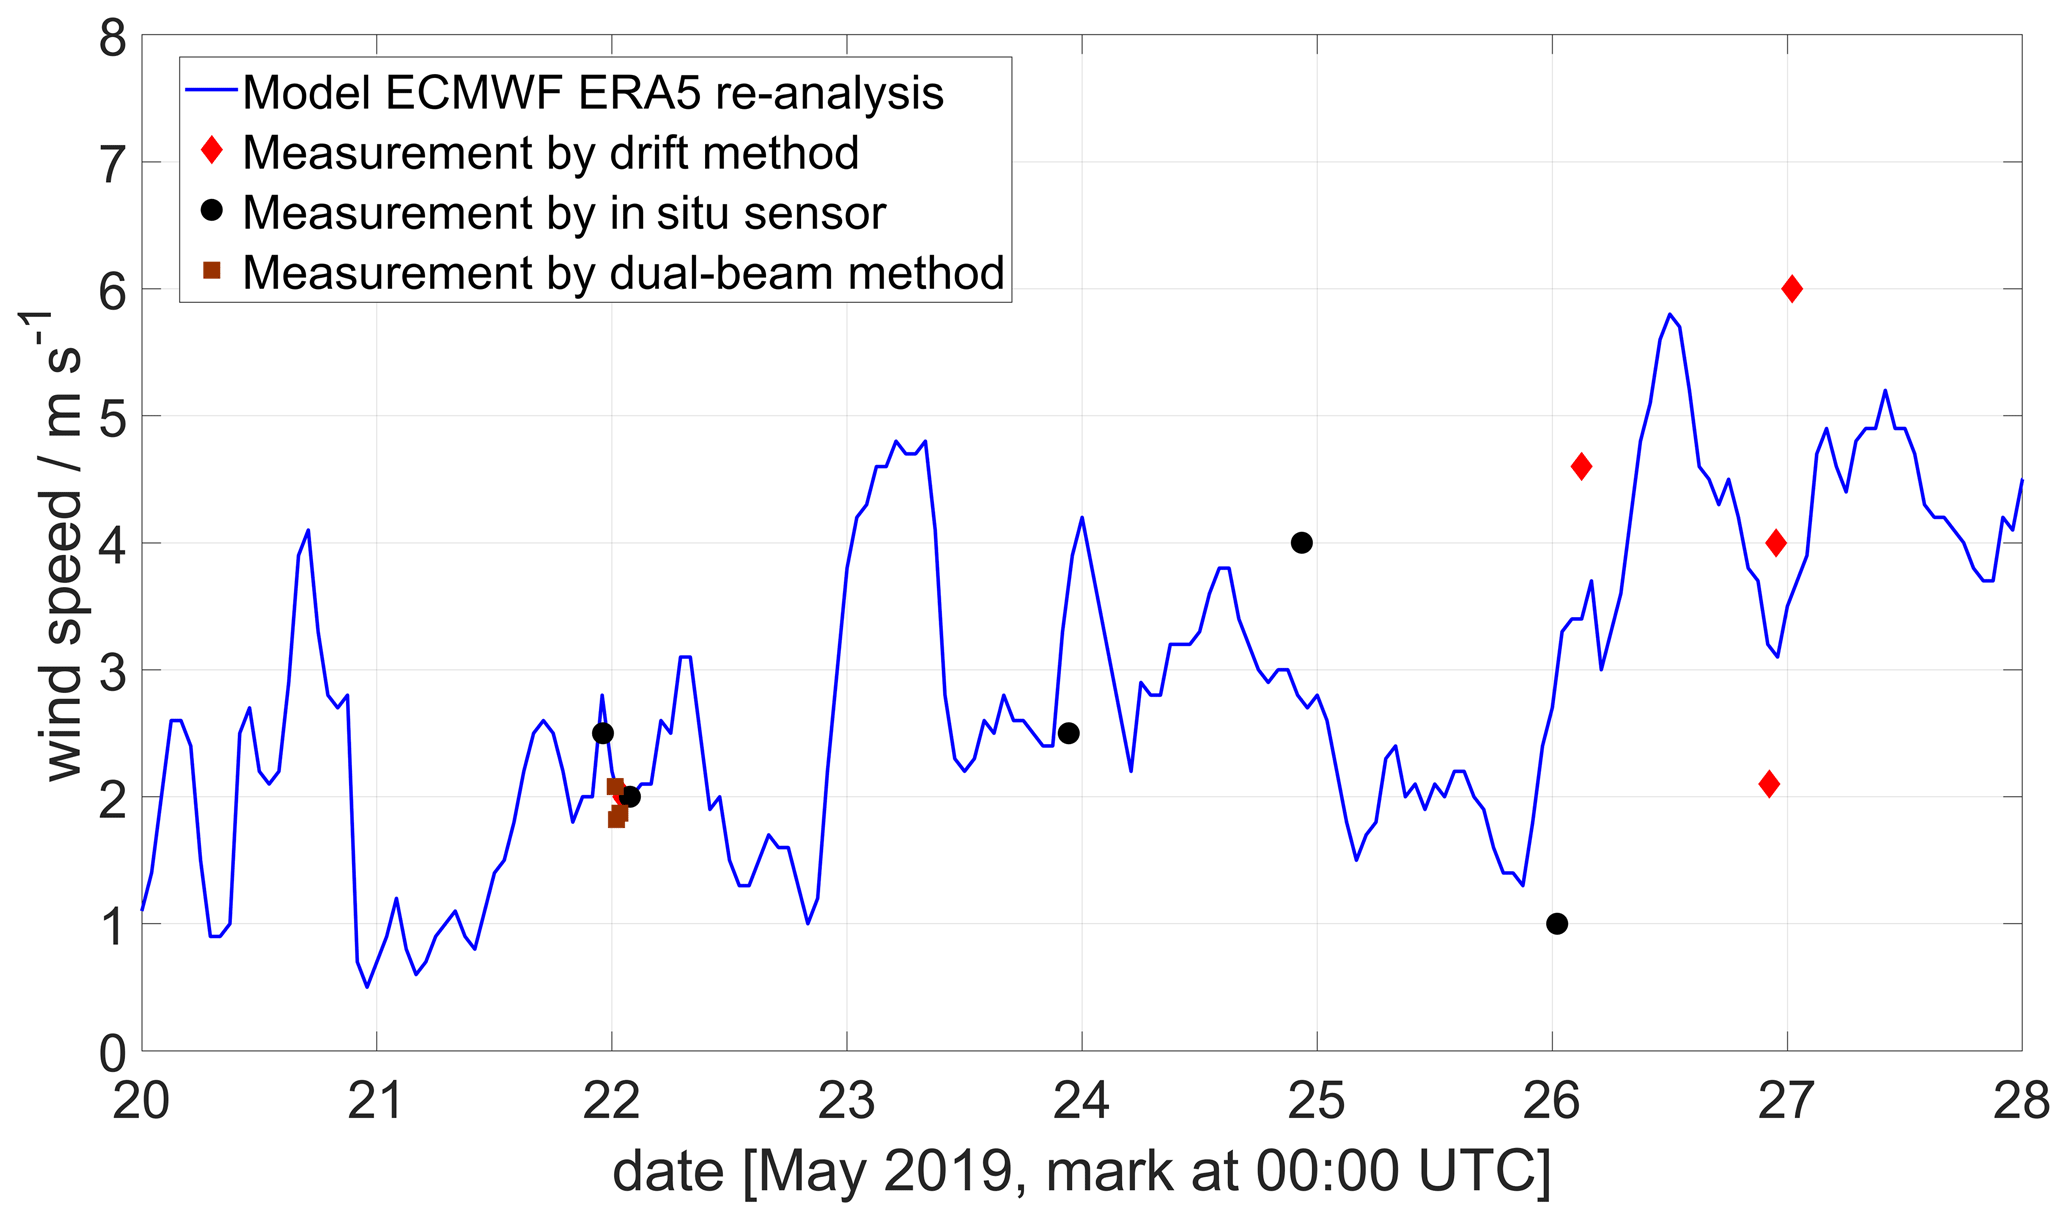
Figure 10Wind data at 1800 m altitude at Manam volcano showing model data from the ECMWF ERA5 model and drone data using the drone drift and in situ anemometer methods, as well as results from a ground-based dual-beam remote-sensing method (Johansson et al., 2009). The drone measurements were taken at different altitudes (between 1500 and 2500 ), where a SO2 signal was detected by the MultiGAS sensor. All winds are horizontal wind only.
3.3 SO2 emission rate
Figure 11 shows an example of a MobileDOAS traverse made at an altitude of 1000 at Manam volcano on 27 May 2019. An SO2 emission rate of 5200 ± 660/180 t d−1 was obtained for this traverse using a wind speed at plume height of 6 m s−1 measured with the drone drift method about 30 min after completing the traverse.
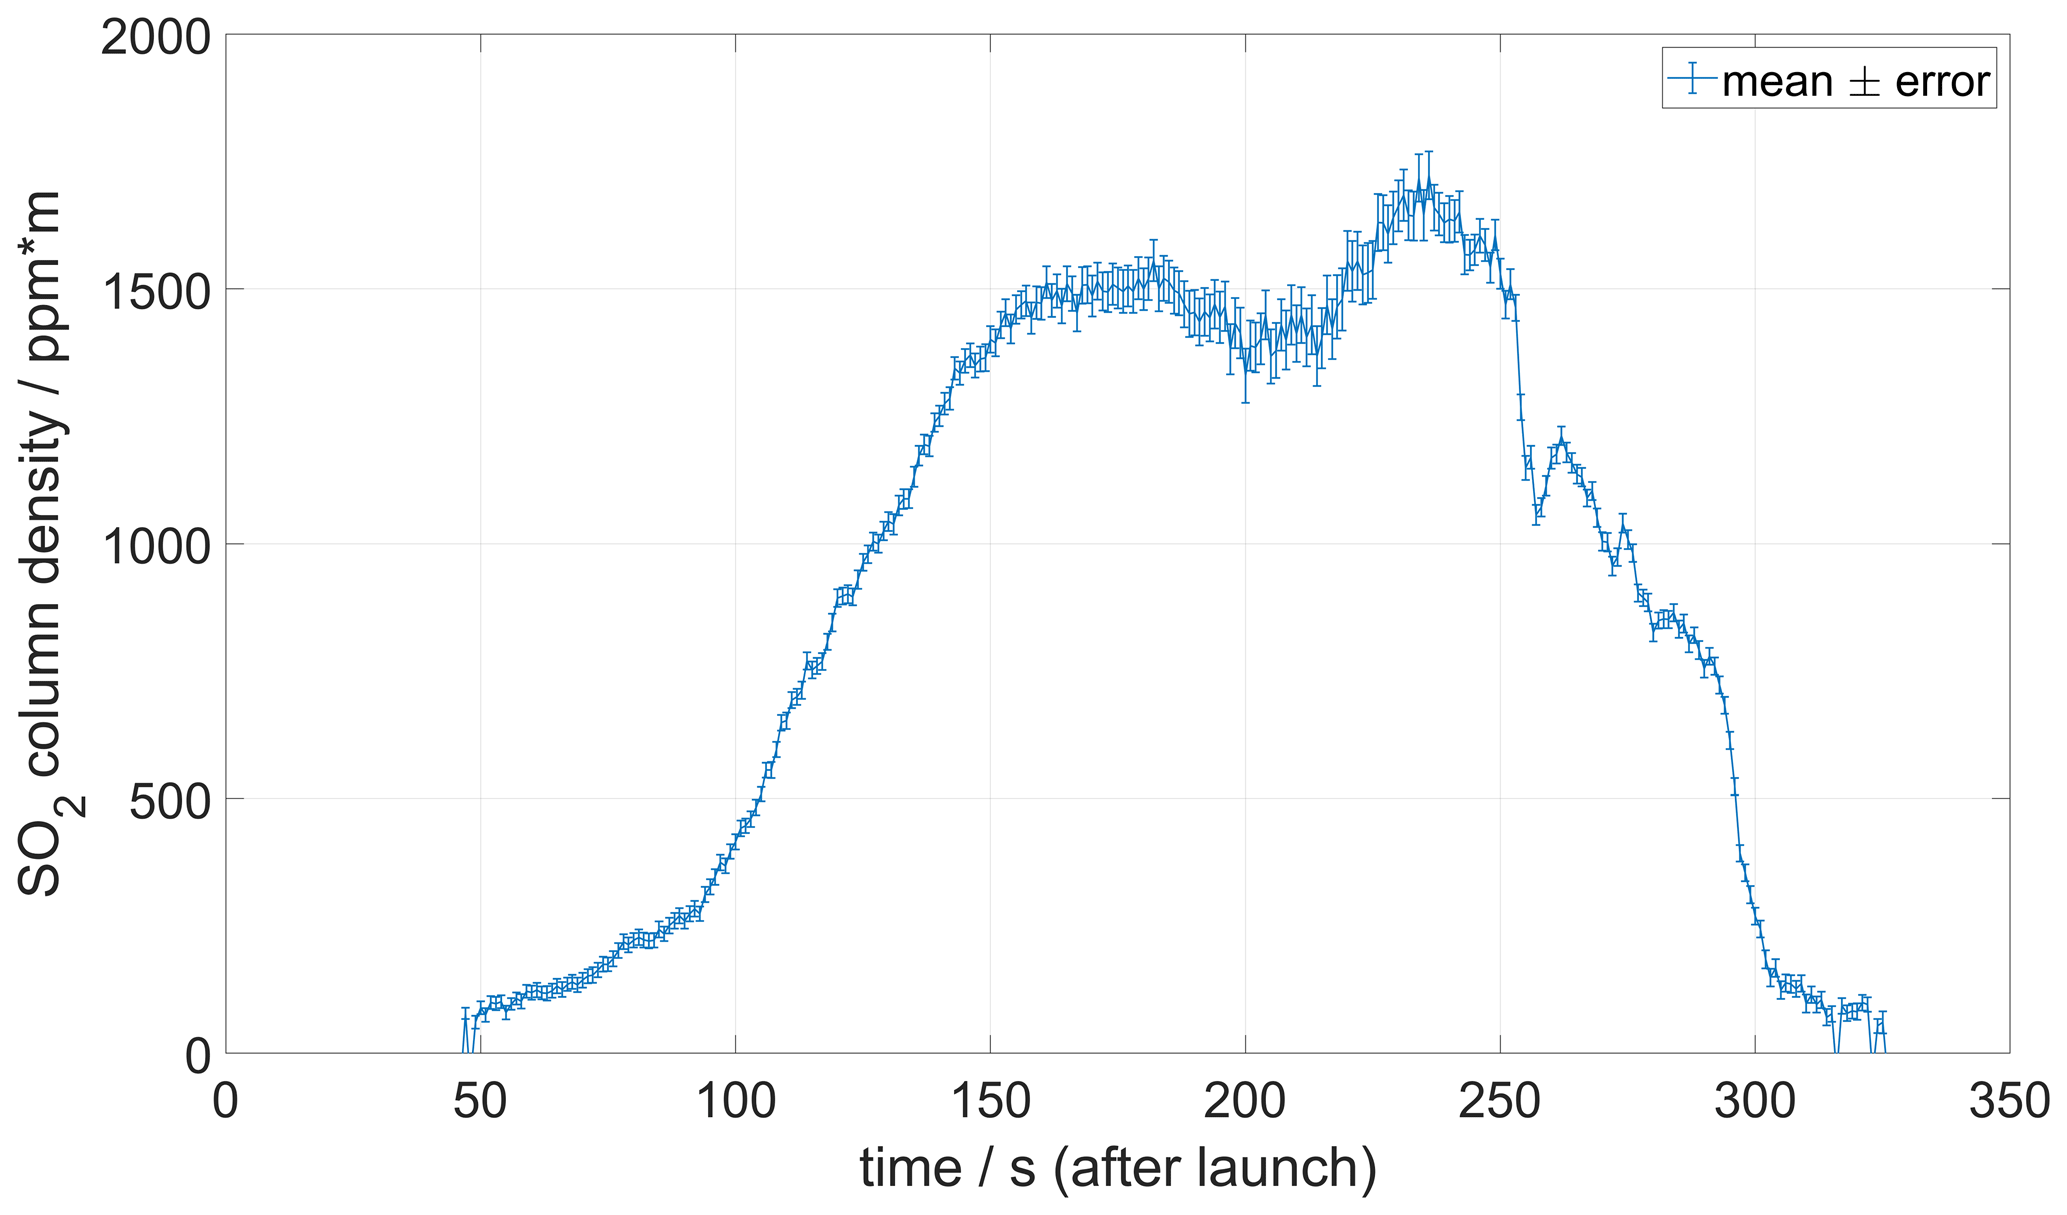
Figure 11Example of MobileDOAS traverse made at Manam volcano on 27 May 2019 at an altitude of 1000 The emission rate of SO2 was 5200 ± 660/180 t d−1, using the plume speed shown in Fig. 9. Information about the position of the drone below the plume is telemetered in real time.
This drone-based emission rate measurement can be compared to ScanDOAS measurements made from the ground on the same day, yielding an average over the day of 4512 ± 2230 t d−1, using wind speed from the ECMWF ERA5 model (Liu et al., 2020). One possible reason for this higher value in the drone measurement is that the relatively high elevation minimizes the atmospheric scattering dilution in this measurement. Over the full period of the field campaign, the representative SO2 flux was estimated at 5150 ± [733/336] t d−1 (high and low 1σ bound on uncertainty) by synthesizing a large number of measurements (and their respective uncertainties) from ground-based, drone-mounted and satellite-based approaches (Liu et al., 2020).
3.4 Molar ratios
Figure 12 shows the results from a flight simultaneously carrying a MultiGAS instrument and a plume sampling device on the drone. To obtain the ratio, it was first necessary to compensate for (a) the pressure and temperature effects on the raw concentration data, (b) the dynamical responses of the sensors and (c) the atmospheric background concentration of CO2 (see details in Appendix B), where the background is identified as the concentration of CO2 taken at the same altitude outside of the plume (where the plume tracer SO2 = 0). The resulting ratios are shown in Fig. 13. Using a linear regression, a ratio of 0.9 ± 0.2 is obtained for the Manam plume on 26 May 2019. For the entire campaign in 2019, the average plume molar ratio was 1.07 ± 0.06 based on multiple measurements acquired on different days; these additional measurements were obtained using a different (but essentially similar in operation) MultiGAS unit on board a fixed-wing unmanned aerial vehicle (UAV). The full dataset and volcanological discussion thereof are presented in Liu et al. (2020).
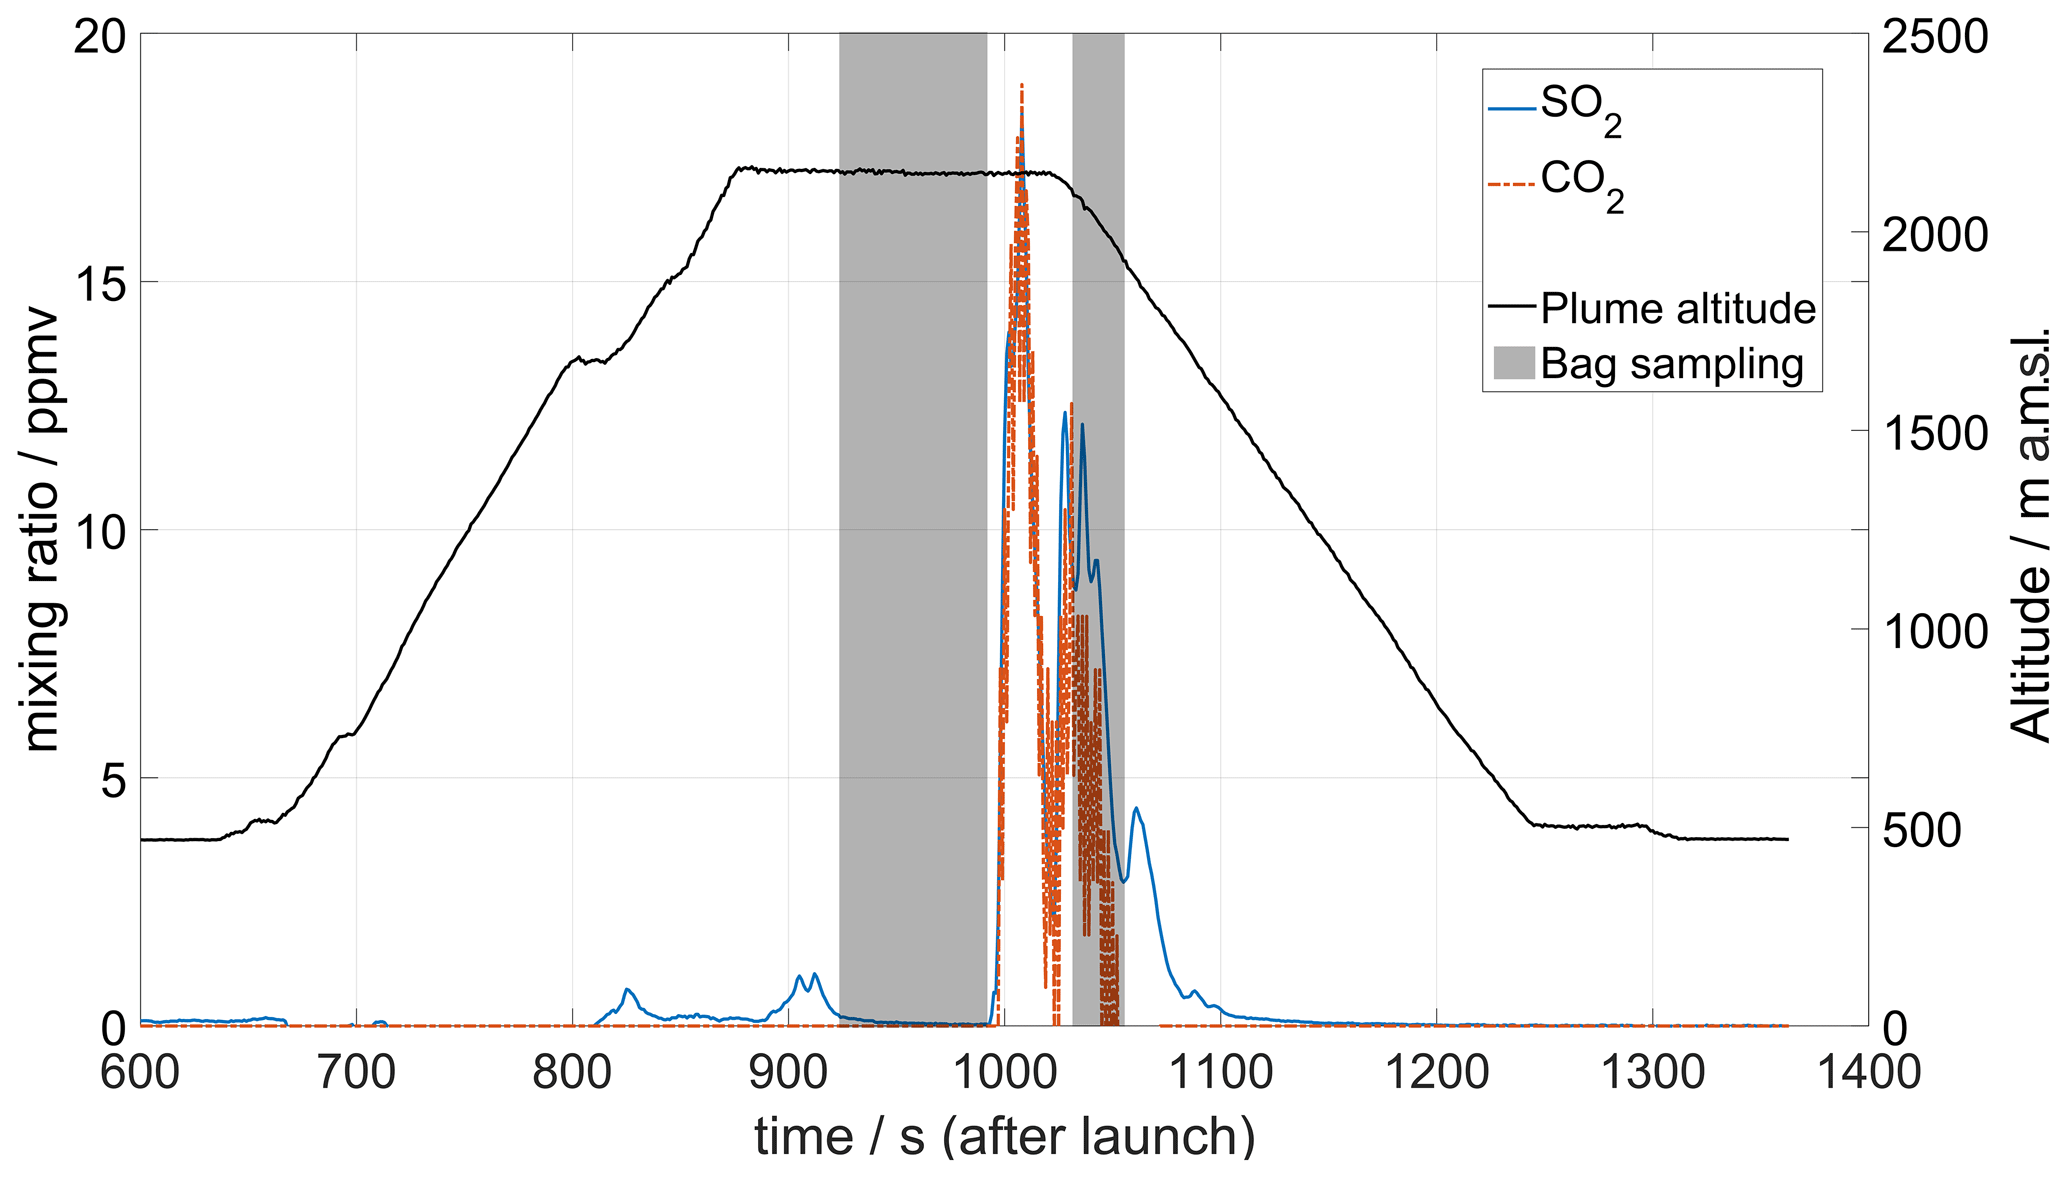
Figure 12MultiGAS measurements of CO2 and SO2 mixing ratios at 500 m above the Southern Crater of Manam volcano on 26 May 2019. SO2 was detected in small concentrations above the Main Crater (region around 800–900 s after launch) but peaked above the high emission column of the Southern Crater. CO2 concentrations above background values are only detected over this crater. The shaded area corresponds to periods of bag sampling activated remotely and used for isotopic analysis at Baliau village by the Delta Ray infrared mass spectrometer.

Figure 13A regression plot of data from Fig. 12 yielding a ratio of 0.9 ± 0.2. Only corresponding pairs where the SO2 mixing ratio was higher than 2 ppm and the altitude was stable (> 2140 ) were used for the regression.
3.5 Carbon isotopic composition
Figure 12 shows data from a flight conducted on 26 May 2019 combining a MultiGAS instrument with a bag sampling unit. A first bag sample was collected after reaching the anticipated plume location, although no significant SO2 concentration was seen in the real-time data on the ground. After some manoeuvering of the drone, the plume was found, and a second bag sample was collected.
Most samples obtained from Manam had concentrations similar to the clean air background, with CO2 concentrations ranging from 408 to 415 ppm CO2. These samples had variable and unreliable δ13C values ranging from −4.2 ‰ to −8.6 ‰, reflecting the large error on these low concentration samples. Only five samples were obtained with concentrations above 420 ppm, ranging from 421 to 494 ppm CO2; these data and the volcanological interpretation thereof are discussed in Liu et al. (2020). Extrapolation of these data to 100 % CO2 following the methodology of Fischer and Lopez (2016) and Rizzo et al. (2014) yields a value of δ13C = −3.7 ‰, close to the MOR (mid-oceanic ridge) mantle range of −5 ± 1 ‰ of Marty and Zimmermann (1999) and −6.5 ± 2 ‰ of Sano and Marty (1995). We note, however, that the regression is unconstrained at high CO2 due to the low CO2 concentrations of the plume samples; therefore, statistically the potential extrapolated range could be as large as −3.7 ± 9.5 ‰ in the 95 % confidence interval, i.e. a very large uncertainty (Liu et al., 2020). Values above +1 ‰ are highly unlikely, given that the global compilation of arc gases has a δ13C range of +2 ‰ to −19 ‰ (Fischer and Chiodini, 2015; Mason et al., 2017). The lowest possible value within that range of uncertainty would be −13.2 ‰. We can, therefore, rule out a significant contribution from organic carbon, which would have δ13C values of around −30 ‰ (Sano and Marty, 1995). Our data are generally consistent with δ13C values of fumarole and hot spring gases obtained during the few prior studies in the PNG region (−2.7 ± 0.1 ‰, Sano and Williams, 1996). Additional data from more concentrated samples (with higher CO2 concentrations ideally > 1000 ppm) collected closer to the vent would improve the accuracy of the Manam δ13C values. Nevertheless, most importantly these results demonstrate a valuable proof-of-concept that highlights the potential of drone-based sampling of volcanic emissions for future geochemical studies.
3.6 Halogen concentrations
On 27 May 2019, we achieved two successful flights with the denuder system where detection of SO2 indicated that we had entered the plume. In both flights we detected SO2 in two positions, each at different altitudes, consistent with the observation of two source regions for summit emissions (Fig. 14). The maximum SO2 concentrations were 1.74 and 1.87 ppm in flight 1 and 1.22 and 4.62 ppm in flight 2 for peak 1 and 2, respectively. Detected SO2 concentrations were averaged for each time we entered the plume. SO2 concentration for each flight was averaged proportionally to the sampling duration in the plume (Table 2).
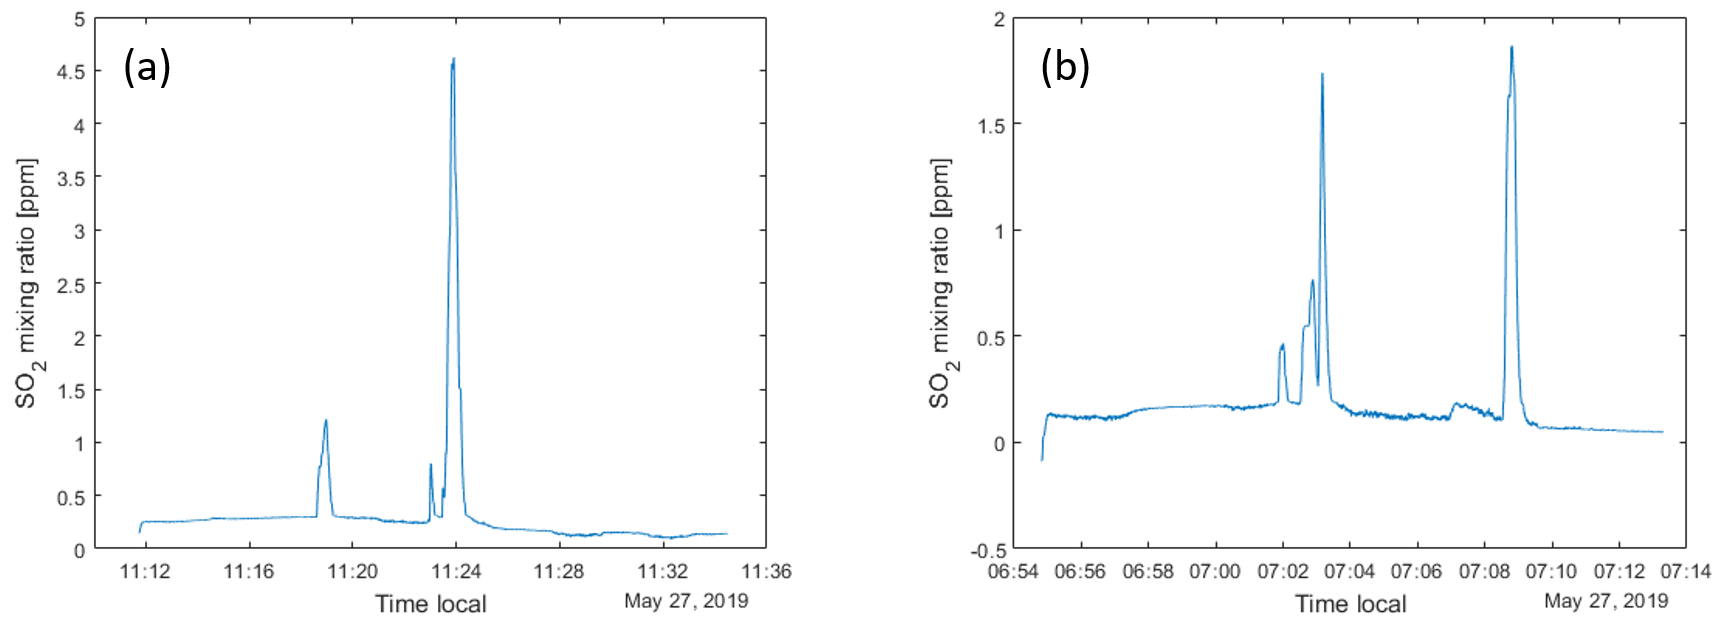
Table 2Bromine speciation based on the length of stay in the plume detected by the SO2 sensor.
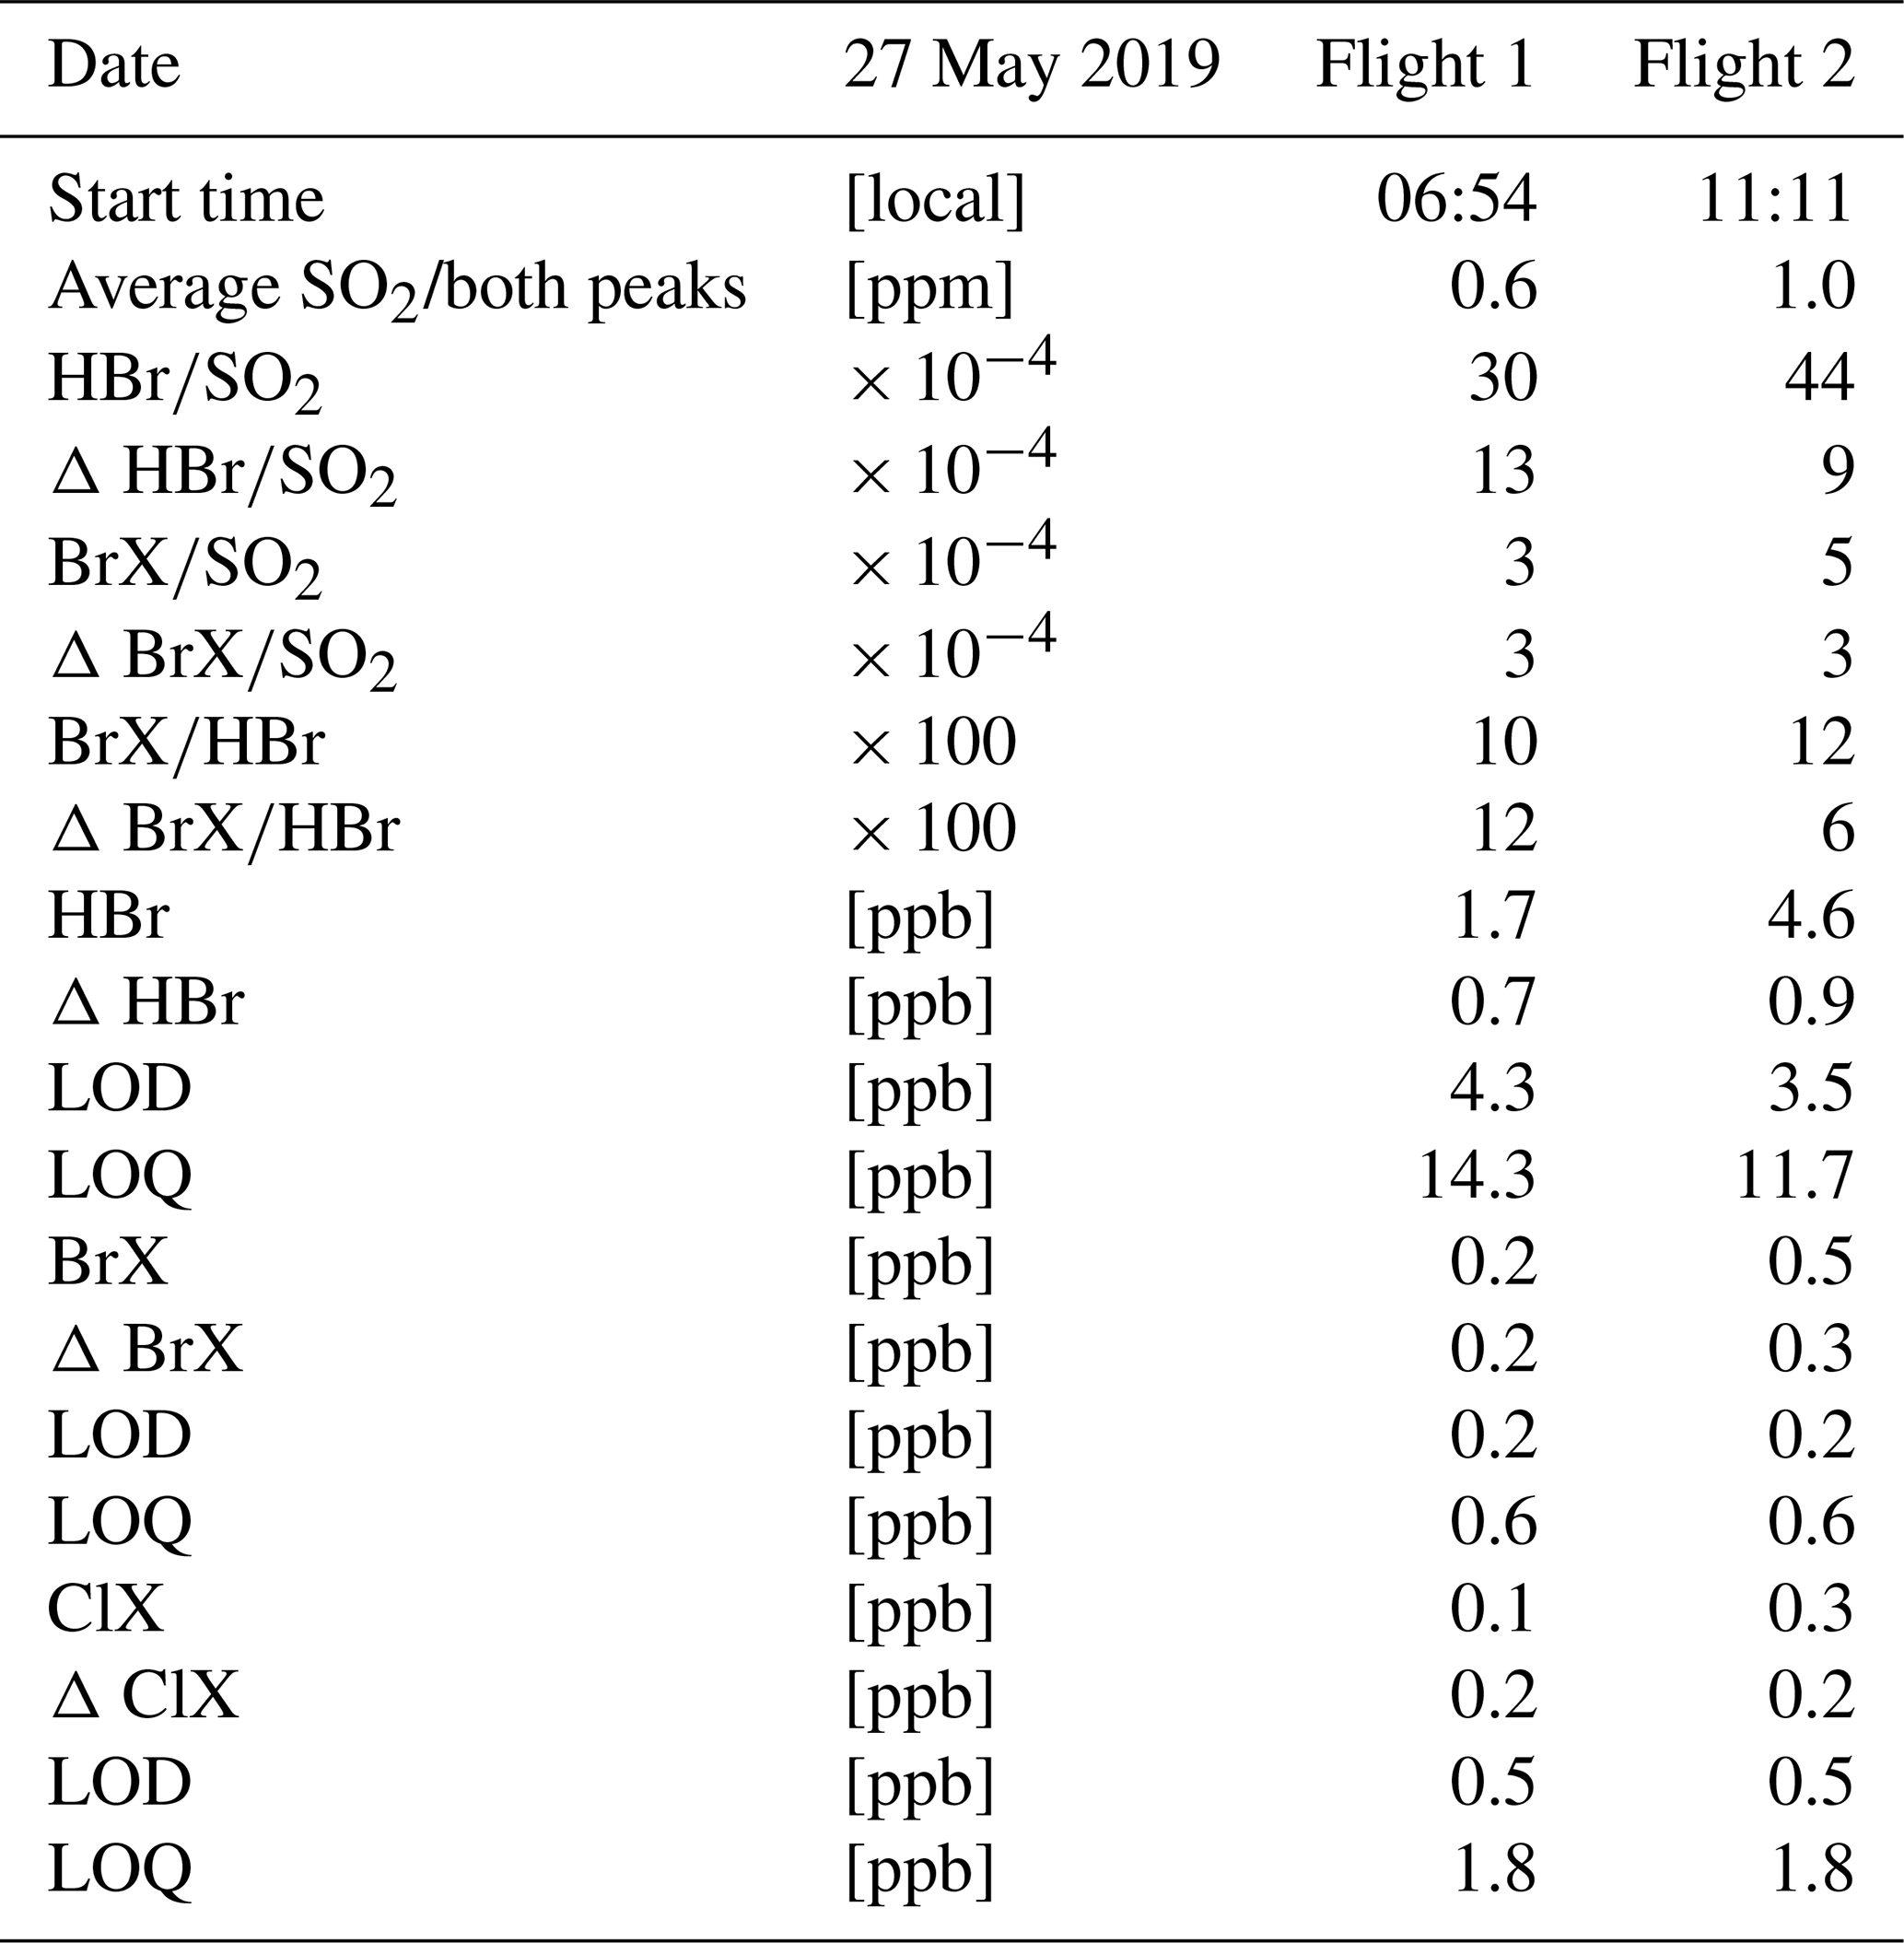
For both denuder types, an environmental blank was sampled at the starting position on the ground. For HBr the denuder results were within the deviation of unsampled but coated denuders. For reactive bromine, the environmental blank values were the highest values of the whole campaign (BrX: 0.2 ppb for 3 L sampling volume). In addition, the amount of reactive chlorine was higher than that of reactive bromine in this sample only (ClX: 0.4 ppb for 3 L sampling volume). Therefore, we infer that this sample was either contaminated or the location in the grass close to the sea does not represent the atmospheric conditions encountered during the flight. Alternatively, we subtracted an environmental blank sampled 10 d earlier in a pre-campaign at Tavurvur volcano, at an altitude of 104 m upwind on the flank of the volcano and above barren volcanic rock (17 May 2019, BrX: 0.002 ppb, ClX: 0.000 ppb). The result of the environmental blank of HBr was within the deviation of coated denuders not used for sample collection.
Average concentrations of all analysed bromine and chlorine species based on the duration of exposure in the plume and their calculated LOD and LOQ are given in Table 2. Results were just below the LOD for both bromine species in flight 1. Bromine results for flight 2 were below the LOQ but above LOD. ClX was below LOD in both samples. The ratio of the bromine species to SO2 varies between the two flights from 30 × 104 to 44 × 104 for and 3 × 10⁴ to 5 × 10⁴ for from flight 1 to 2, respectively, while the ratio between the two bromine species stays stable (flight 1: 0.10, flight 2: 0.12).
Although measurement results were below the LOQ, we were able to detect HBr and BrX in the plume of Manam volcano with our two flights. The observed ratio of 0.10–0.12 is relatively low compared to previous detected ratios of approximately 0.30 within the first minute in Masaya's plume (Rüdiger et al., 2021). Observed bromine evolution in Manam plume seems to follow the trend for high ratios suggested by Roberts et al. (2014).
We present a hexa-copter UAV specially configured for long-range, high-altitude volcanic gas plume measurements, together with a suite of drone-mountable payloads specialized for various gas measurements. We describe how the drone and its payloads were operated during a field campaign at Manam volcano in Papua New Guinea, demonstrating the utility of the proposed system for achieving long-range high-altitude volcanic gas monitoring.
In response to several key lessons learnt during prior field-based testing, we implemented specific customizations to the drone platform:
-
use of stronger motors and propellers with a larger diameter to increase payload and battery weight capacity and thereby improve range and height performance;
-
change of operative system to overcome altitude and range restrictions and enable access to flight logs for posterior analysis;
-
use of a race drone ESC (electronic speed control) to improve manoeuvrability during flight;
-
change in frame design to facilitate swapping of modular payloads.
The different payloads include the following:
-
an anemometer for measurement of wind/plume speed at plume height
-
a MobileDOAS instrument that, combined with plume speed data, can measure total SO2 emission rate by traversing below the plume;
-
a MultiGAS instrument that can measure in situ concentrations of SO2, CO2 and H2S in the plume, by flying close to the crater;
-
a bag sampling unit by which the gas in the plume can be sampled in Tedlar bags for subsequent analysis of carbon isotopes on the ground;
-
a denuder system that can sample the plume for later analysis of different halogens in the laboratory.

Figure 15Map with flight trajectories of measurements reported in this study. Wind measurement flights occurred from launch Sites 2 and 1 on 22 and 27 May, respectively. Isotopic sampling and MultiGAS flights launched from Site 3 on 26 May. MobileDOAS and Sunkist measurement flights launched from Site 1 on 27 May. Sentinel imagery shown was selected based on minimal cloud cover and may not represent the location of vents and plumes present in May 2019. The thickness of the trajectory markers is proportional to the altitude of the drone.
During the 1-week field campaign at Manam volcano, we used all these instrument payloads to perform a total of 19 successful flights to the plume of Manam (one for SO2 flux, four for molar ratio, nine for wind speed, three for C isotopic analysis and two for halogen composition). All these measurements could be carried out with only two people (one flying the drone and one supervising the measurements). Figure 15 shows the trajectories of all flights for which data are presented here.
The results presented here represent a subset of the total dataset obtained during a collaborative international field campaign at Manam volcano, involving multiple research teams and instruments. A complete synthesis of all measured data and their uncertainties, together with detailed volcanological interpretation, is presented in Liu et al. (2020). The fluxes of SO2 and CO2 were found to be 5200 ± 660/180 and 3220 ± 500/90 t d−1, respectively, based solely on the multi-rotor measurements reported in this study. The δ13C of −3.7 ± 9.5 ‰ suggests that the CO2 source of Manam crater gas is mantle-dominated with a possible carbonate contribution and a likely insignificant contribution from subducted sedimentary organic carbon. While the range of possible values is large due to the low CO2 concentrations and hence large extrapolation to pure CO2, these data are generally consistent with a measured plume ratio of 0.9 ± 0.2, indicating a predominantly mantle-derived carbon source. The bromine speciation and concentration in the plume point to a high ratio.
It was found that an adaptive flight path is essential for successful measurements, through either full manual control at long distances or adaptable automated waypoint missions. Access to real-time data of a plume tracer, such as SO2, is crucial, both when flying visual and when flying beyond visual line of sight, in order for the pilot to refine the position of the drone within the plume. Further, prior information about the approximate position of the plume from ground-based instruments, such as ScanDOAS, is very informative during the flight planning stage to maximize the chance of successful sampling and should be incorporated into field workflows. Finally, to facilitate at long range and high altitude, under limited power capacity, the flight path in approaching and returning from the target is crucial to conserve battery; flying in clouds should be avoided, wind speed and direction should be taken into account and used to their advantage and the angle between horizontal and vertical motion should be optimized for low power consumption.
We have demonstrated that the combination of a multi-rotor with modular payloads is a versatile solution to obtain the flux and composition of volcanic plumes, even for the case of a highly active volcano with a high-altitude plume such as Manam. We propose that drone-based measurements offer a valuable solution for volcano research and monitoring applications at inaccessible volcanoes globally.
Table A1Specifications of payloads of the drone system.
a For ∼ 500:1 assuming 50 % of intensity saturation for an average of 15 spectra taken at 0.5 s exposure time. b In lab conditions. In field conditions, accuracy
and precision may be considerably disturbed by electric interference. See Figs. S1 and S2 in the Supplement. NA: not available.
To obtain molar ratios of different species measured by different sensors, the general procedure followed Eq. (B1):
where XA is the molar mixing ratio of molecule A (CO2, SO2, H2S); αA the offset of sensor for molecule A, from lab calibration (in ppm); βA the sensitivity of sensor for molecule A, from lab calibration (in ppm per count); SA the signal (in counts) measured by the sensor for molecule A; τA the temperature correction factor of sensor for molecule A, from manufacturer's specifications (in K); , the temperature measured/calibrated by a thermometer in parallel to the sensor for molecule A (in K); πA the pressure correction factor of the sensor for molecule A, from manufacturer's specifications (in ppm K−1); and the pressure measured/calibrated by a pressure meter in parallel to the sensor for molecule A (in Pa).
After these corrections, the time-response correction is performed by the procedure described above, and the ratio is determined by simple linear regression on a scatterplot, using only data with SO2 mixing ratio higher than 2 ppm.
For water, the mixing ratio is obtained from the following equations (Wagner and Pruß, 2002):
where is the water dry molar mixing ratio; Pw the water vapour pressure (in Pa); P the measured ambient pressure (in Pa); RH the relative humidity (in %); Pws the water saturation vapour pressure (in Pa); Pc the water critical pressure (in Pa); Tc the water critical temperature (in K); T the measured ambient temperature (in K); and f(θ) a function of Tc and T involving six parameters.
MultiGAS data are processed with MATLAB. The following implementation was used (Arellano et al., 2017):
-
Apply calibration constants and corrections for P, T and RH.
-
Define time series for comparison, e.g. y1 (CO2) and y2 (SO2).
y1 = CO2v; %Volcanic CO2 time series
y2 = SO2v; %Volcanic SO2 time series
-
Define a time vector at high resolution (e.g. 0.1 s).
dt = 0:0.1:100; % time-step vector
-
Resample signal at high time resolution.
y1hr = (interp1(1:length(y1),y1,1:0.1:length(y1)))'; % resample signal 1 at a x10 higher resolution
y2hr = (interp1(1:length(y2),y2,1:0.1:length(y2)))'; % resample signal 1 at a x10 higher resolution
-
Create a matrix of signals modelled with different response parameters, applying fist-order sensor theory.
for k = 1:length(dt)
y1t(:,k) = (k-1)*0.1*diff(y1hr)+y1hr(2:end,1); % signal 1
y2t(:,k) = (k-1)*0.1*diff(y2hr)+y2hr(2:end,1); % signal 2
end
-
Calculate all correlation matrices between the two signals.
for i = 1:length(dt)
for j = 1:length(dt)
cc = corrcoef(y1t(:,i),y2t(:,j));
CC(i,j) = cc(1,2);
end
end
-
Find parameters that give the highest correlation between the signals.
[A,I] = max(max(CC,[],2),[],1);
[B,J] = max(max(CC,[],1),[],2);
-
Determine the time-response parameters and level of correlation.
tau1 = dt(I);
tau2 = dt(J);
corr = A;
-
Resample the signals at original resolution but without effect of response time.
Timehr = (Time(1):mean(diff(Time))/10:Time(end))';
y1tlr = interp1(Timehr(2:end),y1t(:,I),Time(2:end));
y2tlr = interp1(Timehr(2:end),y2t(:,J),Time(2:end));
-
Apply linear regression to find ratio, excluding possible outliers.
LinearEqn = 'a+b*x';
f1 = fit(y1tlr,y2tlr,LinearEqn,'Start',[0,1],'Exclude',(y1tlr<0)&(y1tlr>1000)&(y2tlr<0)&(y2tlr>900));
To obtain the SO2 flux, the integral of SO2 column densities across a surface perpendicular to the plume direction is multiplied by plume speed. Plume direction is obtained from the vector joining the source (crater) and the peak column density in the traverse. Plume speed is obtained preferably by the drone drift method.
To obtain the SO2 column densities, each spectrum in the traverse is divided by a spectrum from a region outside of the plume (which could be identified a posteriori as one with minimum column density). The transmittance spectrum is fitted to a model following the DOAS method (Platt and Stutz, 2008). The model includes absorption cross-sections of SO2 (Vandaele et al., 1994) and O3 (Voigt et al., 2001), a synthetic Ring-effect pseudo-absorber (from Chance and Kurucz, 2010) and a polynomial of fifth order to account for broadband extinction due mainly to scattering. The fitting is performed between 310 and 325 nm, and the shift is allowed for a spectrum with high SO2 signal and then fixed for the rest of the spectra in the same traverse.
Data are processed with MobileDOAS software (Johansson et al., 2019).
All data files presented in this article can be found at https://doi.org/10.5878/q3wv-ty69 (Galle and Arellano, 2021).
The supplement related to this article is available online at: https://doi.org/10.5194/amt-14-4255-2021-supplement.
SA, NB, TPF, AG, BG, GG, EJL, KM, SN, JR, TR and KW participated in the field measurements. GG piloted the drone. SA and BG collected and analysed Chalmers data (MultiGAS and MobileDOAS). TPF and SN collected and analysed UNM data (Isotope analysis). NB, AG, TH and JR collected and analysed UM data (Sunkist and denuders). GG and TK built the drone. SA, VC and JX built and calibrated the Chalmers payloads. SN built the UNM payload. NB, AG, TH and JR built and calibrated the UM payload. EJL coordinated the field campaign with support from II, KM, TR and KW. All authors contributed to writing the article.
The authors declare that they have no conflict of interest.
We thank the Rabaul Volcano Observatory (RVO) and the community of Baliau village on Manam island for their assistance and hospitality. We thank the PX4 autopilot development team for their open-source flight control software.
The main funding for this work comes from the Aerial Based Observations of Volcanic Emissions (ABOVE) project, funded by the Alfred P. Sloan Foundation through their support of the Deep Carbon Observatory (DCO) project. The drone and Chalmers payloads were supported by FORMAS, the Swedish Research Council for Sustainable Development. Santiago Arellano was supported by the Swedish National Space Agency (Dnr 149/18). Kieran Wood was supported by the NCNR EPSRC grant (EP/R02572X/1). Emma J. Liu acknowledges support from a Leverhulme Early Career Fellowship. Tom Richardson was supported by the EPSRC CASCADE programme grant (EP/R009953/1).
This research has been supported by the Alfred P. Sloan Foundation (Aerial Based Observations of Volcanic Emissions (ABOVE) project), the Swedish Research Council for Sustainable Development (FORMAS), the Swedish National Space Agency (grant non. Dnr 149/18), the NCNR EPSRC grant (grant no. EP/R02572X/1), Leverhulme Early Career Fellowship, and the EPSRC CASCADE programme grant (grant no. EP/R009953/1).
This paper was edited by Francis Pope and reviewed by Peter Kelly and one anonymous referee.
Aiuppa, A., Federico, C., Giudice, G., and Gurrieri, S.: Chemical mapping of a fumarolic field: La Fossa Crater, Vulcano Island (Aeolian Islands, Italy), Geophys. Res. Lett., 32, L13309, https://doi.org/10.1029/2005GL023207, 2005.
Aiuppa, A., Fischer, T. P., Plank, T., and Bani, P.: CO2 flux emissions from the Earth's most actively degassing volcanoes, 2005–2015, Sci. Rep., 9, 5442, https://doi.org/10.1038/s41598-019-41901-y, 2019.
Arellano, S., Galle, B., Mulina, K., Wallius, J., McCormick, B., Salem, L., D'aleo, R., Barry, P., and Itikarai, I.: Report on volcanic plume measurements on volcanoes in Papua New Guinea, Chalmers University of Technology, Gothenburg, Sweden, available at: https://research.chalmers.se/publication/254380 (last access: 3 June 2021), 2017.
Beecken, J., Mellqvist, J., Salo, K., Ekholm, J., Jalkanen, J.-P., Johansson, L., Litvinenko, V., Volodin, K., and Frank-Kamenetsky, D. A.: Emission factors of SO2, NOx and particles from ships in Neva Bay from ground-based and helicopter-borne measurements and AIS-based modeling, Atmos. Chem. Phys., 15, 5229–5241, https://doi.org/10.5194/acp-15-5229-2015, 2015.
Carn, S., Fioletov, V., McLinden, C. A., Li, C., and Krotkov, N. A.: A decade of global volcanic SO2 emissions measured from space, Sci. Rep., 7, 44095, https://doi.org/10.1038/srep44095, 2017.
Chance, K. and Kurucz, R. L.: An improved high-resolution solar reference spectrum for Earth's atmosphere measurements in the ultraviolet, visible, and near infrared, J. Quant. Spectrosc. Ra., 111, 1289–1295, 2010.
Chiodini, G., Caliro, S., Aiuppa, A., Avino, R., Granieri, D., Moretti, R., and Parello F.: First 13C/12C isotopic characterisation of volcanic plume CO2, B. Volcanol., 73, 531–542, 2011.
de Moor, J. M., Stix, J., Avard, G., Muller, C., Corrales, E., Diaz, J. A., Alan, A., Brenes, J., Pacheco, J., Aiuppa, A., and Fischer, T. P.: Insights on Hydrothermal-Magmatic Interactions and Eruptive Processes at Poás Volcano (Costa Rica) From High-Frequency Gas Monitoring and Drone Measurements, Geophys. Res. Lett., 46, 1293–1302, https://doi.org/10.1029/2018gl080301, 2019.
Edmonds, M., Herd, H., Galle, B., and Oppenheimer, C.: Automated, high time-resolution measurements of SO2 flux at Soufrière Hills Volcano, Montserrat, West Indies, B. Volcanol., 65, 578–586, https://doi.org/10.1007/s00445-003-0286-x, 2003.
Faivre-Pierret, R., Martin, D., and Sabroux, J. C.: Contribution des Sondes Aérologiques Motorisées à l'Etude de la Physico–Chimie des Panaches Volcaniques, B. Volcanol., 43, 473–485, https://doi.org/10.1007/BF02597686, 1980.
Fischer, T. P. and Chiodini, G.: Volcanic, Magmatic and Hydrothermal Gas Discharges, in: Encyclopedia of Volcanoes, Elsevier Science Direct, 2nd edn., 779–797, https://doi.org/10.1016/B978-0-12-385938-9.00045-6, 2015.
Fischer, T. P. and Lopez, T. M.: First airborne samples of a volcanic plume for δ13C of CO2 determinations, Geophys Res. Lett., 43, 3272–3279, https://doi.org/10.1002/2016GL068499, 2016.
Fischer, T. P., Arellano, S., Carn, S., Aiuppa, A., Galle, B., Allard, P., Lopez, T., Shinohara, H., Kelly, P., Werner, C., Cardellini, C., and Chiodini, G.: The emissions of CO2 and other volatiles from the world's subaerial volcanoes, Sci. Rep., 9, 18716, https://doi.org/10.1038/s41598-019-54682-1, 2019.
Galle, B. and Arellano, S.: Volcanic gas measurements with drones on Manam Papua, Nya Guinea, Chalmers University of Technology, Department of Space, Earth and Environment, Swedish National Data Service [data set], Version 1, https://doi.org/10.5878/q3wv-ty69, 2021.
Galle, B., Oppenheimer, C., Geyer, A., McGonigle, A., Edmonds, M., Horrocks, L.: A miniaturised ultraviolet spectrometer for remote sensing of SO2 fluxes: a new tool for volcano surveillance, J. Volcanol. Geoth. Res., 119, 241–254, https://doi.org/10.1016/S0377-0273(02)00356-6, 2003.
Galle, B., Johansson, M., Rivera, C., Zhang, Y., Kihlman, M., Kern, C., Lehmann, T., Platt, U., Arellano S., and Hidalgo, S.: Network for Observation of Volcanic and Atmospheric Change (NOVAC)—A global network for volcanic gas monitoring: Network layout and instrument description, J. Geophys. Res., 115, D05304 https://doi.org/10.1029/2009JD011823, 2010.
Gutmann, A., Bobrowski, N., Roberts, T. J., Rüdiger, J., and Hoffmann, T.: Advances in Bromine Speciation in Volcanic Plumes, Front. Earth Sci., 6, 213, https://doi.org/10.3389/feart.2018.00213, 2018.
Gutmann, A., Bobrowski, N., Liotta, M., and Hoffmann, T.: Bromine Speciation in Volcanic Plumes: New in-situ Derivatization LC-MS Method for the Determination of Gaseous Hydrogen Bromide by Gas Diffusion Denuder Sampling, Atmos. Meas. Tech. Discuss. [preprint], https://doi.org/10.5194/amt-2020-357, in review, 2020.
James, M. R., Carr, B., D'Arcy, F., Diefenbach, A., Dietterich, H., Fornaciai, A., Lev, E., Liu, E., Pieri, D., Rodgers, M., Smets, B., Terada, A., von Aulock, F., Walter, T., Wood, K., and Zorn, E.: Volcanological applications of unoccupied aircraft systems (UAS): Developments, strategies, and future challenges, Volcanica, 3, 67–114. https://doi.org/10.30909/vol.03.01.67114, 2020.
Johansson, M.: Application of Passive DOAS for Studies of Megacity Air Pollution and Volcanic Gas Emissions, PhD thesis, Chalmers University of Technology, Gothenburg, Sweden, 64 pp., 2009.
Johansson, M., Galle, B., Zhang, Y., Rivera, C., and Chen, D.: The Dual-Beam technique – single instrument measurements of plume height and plume speed, B. Volcanol., 71, 747–751, https://doi.org/10.1007/s00445-008-0260-8, 2009.
Johansson, M., Yang, Z., and Norgaard, D.: MobileDOAS software v. 6.2, available at: https://github.com/NOVACProject/MobileDOAS (last access: 4 June 2021), 2019.
Kelly, P. J., Kern, C., Roberts, T. J., Lopez, T., Werner, C., and Aiuppa, A.: Rapid chemical evolution of tropospheric volcanic emissions from Redoubt Volcano, Alaska, based on observations of ozone and halogen-containing gases, J. Volcanol. Geoth. Res., 259, 317–333, https://doi.org/10.1016/J.JVOLGEORES.2012.04.023, 2013.
Liu, E. J., Wood, K., Mason, E., Edmonds, M., Aiuppa, A., Giudice, G., Bitetto, M., Francofonte, V., Burrow, S., Richardson, T., Watson, M., Pering, T. D., Wilkes, T. C., McGonigle, A. J. S., Velasquez, G., Melgarejo, C., and Bucarey, C.: Dynamics of outgassing and plume transport revealed by proximal unmanned aerial system (UAS) measurements at Volcán Villarrica, Chile, Geochem. Geophy. Geosy., 20, 730–750, https://doi.org/10.1029/2018GC007692, 2019.
Liu, E., Aiuppa, A., Alan, A., Arellano, S., Bitetto, M., Bobrowski, N., Carn, S., Clarkes, R., Corrales, E., de Moor, J., Diaz, J., Edmonds, M., Fischer, T., Freer, J., Fricke, G., Galle, B., Gerdes, G., Giudice, G., Gutmann, A., Hayer, C., Itikarai, I., Jones, J., Mason, E., McCormick, B., Mulina, K., Nowicki, S., Rahilly, K., Richardson, T., Rüdiger, J., Schipper, I., Watson, I., and Woods, K.: Aerial strategies advance volcanic gas measurements at inaccessible, strongly degassing volcanoes, Science Advances, 6, eabb9103, https://doi.org/10.1126/sciadv.abb9103, 2020.
Lucic, G., Stix, J., and Wing, B.: Structural controls on the emission of magmatic carbon dioxide gas, Long Valley Caldera, USA, J. Geophys. Res.-Sol Ea., 120, 2262–2278, https://doi.org/10.1002/2014JB011760, 2015.
Lübcke, P., Bobrowski, N., Arellano, S., Galle, B., Garzón, G., Vogel, L., and Platt, U.: molar ratios from scanning DOAS measurements in the NOVAC network, Solid Earth, 5, 409–424, https://doi.org/10.5194/se-5-409-2014, 2014.
Mandon, C., Christenson, B., Schipper, I., Seward, T., and Garaebiti, E.: Metal transport in volcanic plumes: A case study at White Island and Yasur volcanoes, J. Volcanol. Geoth. Res., 369, 155–171, https://doi.org/10.1016/j.jvolgeores.2018.11.024, 2019.
Marty, B. and Zimmermann, L.: Volatiles (He, C, N, Ar) in mid-ocean ridge basalts: assessment of shallow-level fractionation and characterization of source composition, Geochim. Cosmochim. Ac., 63, 3619–3633, 1999.
Mason, E., Edmonds, M., and Turchyn, A. V.: Remobilization of crustal carbon may dominate volcanic arc emissions, Science, 357, 290–294, 2017.
McGonigle, A. J. S., Aiuppa, A., Giudice, G., Tamburello, G., Hodson, A. J., and Gurrieri, S., Unmanned aerial vehicle measurements of volcanic carbondioxide fluxes, Geophys. Res. Lett., 35, L06303, https://doi.org/10.1029/2007GL032508, 2008.
Mellqvist, J., Beecken, J., Conde, V., and Ekholm, J.: Surveillance of Sulfur Emissions from Ships in Danish Waters, final report to Danish Environmnetal Protecion agency, https://doi.org/10.17196/DEPA.001, 2018.
Millán, M. M.: Remote sensing of air pollutants. A study of some atmospheric scattering effects, Atmos. Environ., 14, 1241–1253, 1980.
Mori, T., Kazahaya, K., Ohwada, M., Hirabayashi, J., and Yoshikawa, S.: Effect of UV scattering on SO2 emission rate measurements. Geophys. Res. Lett., 33, L17513, https://doi.org/10.1029/2006GL026285, 2006.
Mori, T., Hashimoto, T., Terada, A., Yoshimoto, M., Kazahaya, R., Shinohara, H., and Tanaka, R.: Volcanic plume measurements using a UAV for the 2014 Mt. Ontake eruption, Earth Planets Space, 68, 49, https://doi.org/10.1186/s40623-016-0418-0, 2016.
Pallas-Areny, R. and Webster, J. G.: Sensors and Signal Conditioning, Wiley, New York, 1991.
Platt, U. and Stutz, J.: Differential Optical Absorption Spectroscopy, Principles and Applications, Physics of Earth and Space Environments, Springer, Berlin, Germany, 597 pp., ISBN 978-3-540-75776-4, 2008.
Rizzo, A. L., Jost, H.-J., Caracausi, A., Paonita, A., Liotta, M., and Martelli, M.: Real-time measurements of the concentration and isotope composition of atmospheric and volcanic CO2 at Mount Etna (Italy), Geophys. Res. Lett., 41, 2382–2389, 2014.
Rizzo, A. L., Liuzzo, M., Ancellin, M. A., and Jost, H. J.: Real-time measurements of δ13C, CO2 concentration, and in volcanic plume gases at Mount Etna, Italy, over 5 consecutive days, Chem. Geol., 411, 182–191, 2015.
Roberts, T. J., Martin, R. S., and Jourdain, L.: Reactive bromine chemistry in Mount Etna's volcanic plume: the influence of total Br, high-temperature processing, aerosol loading and plume–air mixing, Atmos. Chem. Phys., 14, 11201–11219, https://doi.org/10.5194/acp-14-11201-2014, 2014.
Roberts, T. J., Lurton, T., Giudice, G., Liuzzo, M., Aiuppa, A., Coltelli, M., Vignelles, D., Salerno, G., Couté, B., Chartier, M., Baron, R., Saffell, J. R., and Scaillet, B.: Validation of a novel Multi-Gas sensor for volcanic HCl alongside H2S and SO2 at Mt. Etna, B. Volcanol., 79, 11201–11219, https://doi.org/10.1007/s00445-017-1114-z, 2017.
Rüdiger, J., Bobrowski, N., Liotta, M., and Hoffmann, T.: Development and application of a sampling method for the determination of reactive halogen species in volcanic gas emissions, Anal. Bioanal. Chem., 409, 5975–5985, https://doi.org/10.1007/s00216-017-0525-1, 2017.
Rüdiger, J., Tirpitz, J.-L., de Moor, J. M., Bobrowski, N., Gutmann, A., Liuzzo, M., Ibarra, M., and Hoffmann, T.: Implementation of electrochemical, optical and denuder-based sensors and sampling techniques on UAV for volcanic gas measurements: examples from Masaya, Turrialba and Stromboli volcanoes, Atmos. Meas. Tech., 11, 2441–2457, https://doi.org/10.5194/amt-11-2441-2018, 2018.
Rüdiger, J., Gutmann, A., Bobrowski, N., Liotta, M., de Moor, J. M., Sander, R., Dinger, F., Tirpitz, J.-L., Ibarra, M., Saballos, A., Martínez, M., Mendoza, E., Ferrufino, A., Stix, J., Valdés, J., Castro, J. M., and Hoffmann, T.: Halogen activation in the plume of Masaya volcano: field observations and box model investigations, Atmos. Chem. Phys., 21, 3371–3393, https://doi.org/10.5194/acp-21-3371-2021, 2021.
Ryan, W. B. F., Carbotte, S. M., Coplan, J. O., O'Hara, S., Melkonian, A., Arko, R., Weissel, R. A., Ferrini, V., Goodwillie, A., Nitsche, F., Bonczkowski, J., and Zemsky, R.: Global Multi-Resolution Topography synthesis, Geochem. Geophy. Geosy., 10, Q03014, https://doi.org/10.1029/2008GC002332, 2009.
Sano, Y. and Marty, B.: Origin of carbon in fumarolic gas from island arcs, Chem. Geol., 119, 265–274, 1995.
Sano, Y. and Williams, S. N.: Fluxes of mantle and subducted carbon along convergent plate boundaries, Geophys. Res. Lett., 23, 2749–2752, https://doi.org/10.1029/96GL02260, 1996.
Schellenberg, B., Richardson, T., Watson, M., Greatwood, C., Clarke, R., Thomas, R., Wood, K., Freer, J., Thomas, H., Liu, E., Salama, F., and Chigna, G.: Remote sensing and identification of volcanic plumes using fixed-wing UAVs over Volcán de Fuego, Guatemala, J. Field Robot., 36, 1192—1211, https://doi.org/10.1002/rob.21896, 2019.
Sharp, Z. D.: Principles of Stable Isoptope Geochemistry, Pearson Prentice Hall, New Jersey, 344 pp., 2007.
Shinohara, H.: A new technique to estimate volcanic gas composition: plume measurements with a portable multi-sensor system, J. Volcanol. Geoth. Res., 143, 319–333, 2005.
Stix, J., de Moor, J. M., Rüdiger, J., Alan, A., Corrales, E., D'Arcy, F., Diaz, J. A., and Liotta, M.: Using Drones and Miniaturized Instrumentation to Study Degassing at Turrialba and Masaya Volcanoes, Central America, J. Geophys. Res.-Sol. Ea., 123, 6501–6520, https://doi.org/10.1029/2018jb015655, 2018.
Stoiber, R., Malinconico Jr., L., Williams, S. N.: Use of the correlation spectrometer at volcanoes, in: Forecasting Volcanic Events. Developments in Volcanology, edited by: Tazieff, H. and Sabroux, J. C., Elsevier Science Publisher, Amsterdam, the Netherlands, 425-444, 1983.
Syahbana, D. K., Kasbani, K., Suantika, G., Prambada, O., Andreas, A. S., Saing, U. B., Kunrat, S. L., Andreastuti, S., Martanto, M., Kriswati, E., Suparman, Y., Humaida, H., Ogburn, S., Kelly, P. J., Wellik, J., Wright, H. M. N., Pesicek, J. D., Wessels, R., Kern, C., Lisowski, M., Diefenbach, A., Poland, M., Beauducel, F., Pallister, J., Vaughan, R. G., and Lowenstern, J. B.: The 2017–19 activity at Mount Agung in Bali (Indonesia): Intense unrest, monitoring, crisis response, evacuation, and eruption, Sci. Rep., 9, 8848, https://doi.org/10.1038/s41598-019-45295-9, 2019.
Textor, C., Graf, H.-F., Timmreck, C., and Robock, A. (Eds.): Emissions from volcanoes: Emissions of Atmospheric Trace Compounds, Advances in Global Change Research, 18, Springer Netherlands, Dordrecht, 2004.
Vandaele, A. C., Simon, P. C., Guilmot, J. M., Carleer, M., and Colin, R.: SO2 Absorption cross-section measurement in the UV using a Fourier transform spectrometer, J. Geophys. Res., 99, 25599–25605, 1994.
van Geldern, R., Nowak, M. E., Zimmer, M., Szizybalski, A., Myrttinen, A., Barth, J. A., and Jost, H. J.: Field-based stable isotope analysis of carbon dioxide by mid-infrared laser spectroscopy for carbon capture and storage monitoring, Anal. Chem., 86, 12191–12198, 2014.
Venzke, E. (Ed.): Volcanoes of the World v. 4.8.3., Global_Volcanism_Program, Manam (251020), Smithsonian Institution, https://doi.org/10.5479/si.GVP.VOTW4-2013, 2013.
Villa, T. F., Gonzalez, F., Miljievic, B., Ristovski, Z. D., and Morawska, L: An Overview of Small Unmanned Aerial Vehicles for Air Quality Measurements: Present Applications and Future Prospectives, Sensors, 16, 1072, https://doi.org/10.3390/s16071072, 2016.
Voigt, S., Orphal, J., Bogumil, K., and Burrows, J. P.: The temperature dependence (203–293 K) of the absorption cross sections of O3 in the 230–850 nm region measured by Fourier-Transform spectroscopy, J. Photoch. Photobio. A, 143, 1–9, 2001.
Wagner, W. and Pruß, A.: The IAPWS Formulation 1995 for the Thermodynamic Properties of Ordinary Water Substance for General and Scientific Use, J. Phys. Chem. Ref. Data, 31, 387–535, 2002.
- Abstract
- Introduction
- Methods
- Results
- Conclusions
- Appendix A: Technical specifications of the payloads
- Appendix B: Analysis of MultiGAS data
- Appendix C: Analysis of MobileDOAS data
- Data availability
- Author contributions
- Competing interests
- Acknowledgements
- Financial support
- Review statement
- References
- Supplement