the Creative Commons Attribution 4.0 License.
the Creative Commons Attribution 4.0 License.
 | 10 Jun 2021
Airborne lidar observations of wind, water vapor, and aerosol profiles during the NASA Aeolus calibration and validation (Cal/Val) test flight campaign
Kristopher M. Bedka
Amin R. Nehrir
Michael Kavaya
Rory Barton-Grimley
Mark Beaubien
Brian Carroll
James Collins
John Cooney
G. David Emmitt
Steven Greco
Susan Kooi
Tsengdar Lee
Zhaoyan Liu
Sharon Rodier
Gail Skofronick-Jackson
Lidars are uniquely capable of collecting high-precision and high spatiotemporal resolution observations that have been used for atmospheric process studies from the ground, aircraft, and space for many years. The Aeolus mission, the first space-borne Doppler wind lidar, was developed by the European Space Agency (ESA) and launched in August 2018. Its novel Atmospheric LAser Doppler INstrument (ALADIN) observes profiles of the component of the wind vector and aerosol/cloud optical properties along the instrument's line-of-sight (LOS) direction on a global scale. A total of two airborne lidar systems have been developed at NASA Langley Research Center in recent years that collect measurements in support of several NASA Earth Science Division focus areas. The coherent Doppler Aerosol WiNd (DAWN) lidar measures vertical profiles of LOS velocity along selected azimuth angles that are combined to derive profiles of horizontal wind speed and direction. The High Altitude Lidar Observatory (HALO) measures high resolution profiles of atmospheric water vapor (WV) and aerosol and cloud optical properties. Because there are limitations in terms of spatial and vertical detail and measurement precision that can be accomplished from space, airborne remote sensing observations like those from DAWN and HALO are required to fill these observational gaps and to calibrate and validate space-borne measurements.
Over a 2-week period in April 2019, during their Aeolus Cal/Val Test Flight campaign, NASA conducted five research flights over the eastern Pacific Ocean with the DC-8 aircraft. The purpose was to demonstrate the following: (1) DAWN and HALO measurement capabilities across a range of atmospheric conditions, (2) Aeolus Cal/Val flight strategies and comparisons of DAWN and HALO measurements with Aeolus, to gain an initial perspective of Aeolus performance, and (3) ways in which atmospheric dynamic processes can be resolved and better understood through simultaneous observations of wind, WV, and aerosol profile observations, coupled with numerical model and other remote sensing observations. This paper provides a brief description of the DAWN and HALO instruments, discusses the synergistic observations collected across a wide range of atmospheric conditions sampled during the DC-8 flights, and gives a brief summary of the validation of DAWN, HALO, and Aeolus observations and comparisons.
- Article
(20793 KB) - Full-text XML
- BibTeX
- EndNote


The Aeolus mission, the first-ever space-borne Doppler wind lidar (DWL), was developed by the European Space Agency (ESA) and launched in August 2018. Aeolus has a Sun-synchronous orbit at 320 km altitude (Kanitz et al., 2019) and carries a single payload, the Atmospheric Laser Doppler Instrument (ALADIN). ALADIN observes profiles of the component of the wind vector and aerosol optical properties along the instrument's line-of-sight (LOS) direction, on a global scale from the ground up to 30 km in the stratosphere (ESA, 2016; Stoffelen et al., 2005; Reitebuch, 2012; Kanitz et al., 2019). Aerosol optical properties are retrieved from ALADIN measurements employing an interferometric approach similar to the high spectral resolution lidar (HSRL) technique (Shipley et al., 1983; Flamant et al., 2008). The Aeolus mission serves as both a technology demonstration and a validation of the predicted impacts of global wind profile observations on weather forecasting and atmospheric research. There is currently a robust international effort to conduct intensive Aeolus calibration and validation (Cal/Val) using ground and suborbital remote and in situ sensors as well as comparison against numerical model background fields (ESA, 2019; Witschas et al., 2020; Lux et al., 2020; Baars et al., 2020; Martin et al., 2020; Khaykin et al., 2020). NASA's long-standing heritage in the development and deployment of airborne DWL technologies, coupled with its interests in utilizing space-borne wind and aerosol observations for Earth system science process studies and weather prediction, served as the primary motivating factors for the agency to contribute to the Aeolus Cal/Val effort.
The 2017 decadal survey for Earth Science and Applications from Space (ESAS 2017) identified a set of key Earth science and applications questions to be addressed by the research community over the next decade. Of these questions, two were related to (1) a better understanding of the planetary boundary layer (PBL) processes and air–surface fluxes and (2) an understanding of why clouds, convection, and heavy precipitation occur when and where they do. Measurements required to address these questions include aerosol vertical profiles and properties, PBL height, cloud type, depth and hydrometeor composition, temperature, water vapor and wind profiles, as well as many other geophysical variables. Observations of these variables are critical for numerical weather prediction models and reanalyses that have informed our understanding of the Earth's weather and climate system over the last 40+ years (Stith et al., 2018). A number of active and passive space-borne remote sensing systems collect such observations; however, they often lack horizontal and vertical resolution, spatial coverage, temporal frequency, and/or precision to enable detailed process studies and advance our understanding. For example, the ESAS (2017) consolidated Science and Applications Traceability Matrix identifies geophysical observables and their associated accuracy required to address a number of key science questions. An ESAS (2017) “most important” question, “What planetary boundary layer (PBL) processes are integral to the air–surface (land, ocean, and sea ice) exchanges of energy, momentum, and mass, and how do these impact weather forecasts and air quality simulations?”, requires the measurement of 3-D wind vector and moisture profiles every 20 km and 3 h, with 0.2 km vertical resolution and accuracy of 1 m s−1 and 0.3 g kg−1, respectively, that is currently not attainable from space-borne sensors. ESAS (2017) recommends a future Earth System Explorer class mission focusing on atmospheric wind measurement to address gaps in the current space-borne wind-observing network. Given the limitations in how processes can be observed from space, ESAS (2017) also recommends airborne and ground-based in situ and remote sensing to fill observational gaps.
Lidars are uniquely capable of collecting high-precision and high spatiotemporal resolution observations that have been used for atmospheric process studies from the ground, aircraft, and space for many years. There are two airborne lidar systems that have been developed at the NASA Langley Research Center (LaRC) in recent years that collect measurements in support of the NASA Science Mission Directorate Earth Science Division (ESD) Weather and Atmospheric Dynamics, Carbon Cycle, and Atmospheric Composition Science focus areas. Initially developed in the late 2000s, the Doppler Aerosol WiNd (DAWN; Kavaya et al., 2014) lidar measures vertical profiles of LOS velocity that are combined to derive horizontal wind speed and direction using the coherent detection method (see Henderson et al., 2005, and references therein). More recently, in 2015, the High Altitude Lidar Observatory (HALO) was developed to measure high-resolution profiles of atmospheric water vapor (WV), aerosol, and cloud optical properties. HALO also provides the option to substitute WV profile observations with a total column and mixed layer methane observation (Nehrir et al., 2018). The distribution of atmospheric WV and its coupling to circulation is a common focus across several of the World Climate Research Program (WCRP) Grand Challenges, and its progress requires improved understanding of processes based on observations of WV, winds, and clouds, especially in the lower troposphere, and at higher vertical resolution than available from current sensors (Asrar et al., 2015; Wulfmeyer et al., 2015; Nehrir et al., 2017; Stevens et al., 2017). Simultaneous, high spatiotemporal resolution (<0.5 km vertical, 1–10 km spatial) lidar wind, WV, and aerosol observations from DAWN and HALO serve as an ideal remote sensing payload for supporting a range of airborne science campaigns to address the key process-oriented science questions posed by the 2017 Decadal Survey and WCRP, as well as for satellite Cal/Val activities, such as for the Aeolus mission.
In April 2019, NASA conducted an Aeolus Cal/Val test flight campaign to demonstrate the following: (1) DAWN Doppler wind lidar and new HALO high spectral resolution lidar (HSRL) aerosol and WV differential absorption lidar (DIAL) observational capabilities across a range of atmospheric conditions, (2) flight strategies for Aeolus Cal/Val and comparisons with Aeolus, to gain an initial perspective of Aeolus performance, in preparation for future international Aeolus Cal/Val airborne campaigns, and (3) ways in which atmospheric dynamic processes can be resolved and better understood through simultaneous observations of wind, WV, and aerosol profile observations, coupled with numerical model and other remote sensing observations. A total of five NASA DC-8 aircraft flights were conducted over a period of 2 weeks over the eastern Pacific and southwestern U.S., based out of the NASA Armstrong Flight Research Center in Palmdale, California, and Kona, Hawaii. To our knowledge, this is the first time that quantitative profiles of aerosol and cloud optical properties from a high spectral resolution lidar (HSRL), water vapor profiles from a differential absorption lidar (DIAL), and wind profiles from a Doppler wind lidar were simultaneously observed from a single aircraft. Dropsondes were released to validate the DAWN and Aeolus wind observations and compare them with HALO WV observations. The LaRC diode laser hygrometer (Diskin et al., 2002) was also installed on the DC-8 and provided several in situ WV validation profiles for both the HALO and dropsonde measurements.
This paper provides a brief description of the DAWN and HALO instruments, discusses the synergistic observations collected across a wide range of atmospheric conditions sampled during several DC-8 flights, and summarizes the validation of DAWN, HALO, and Aeolus observations and comparisons.
2.1 DAWN
DAWN, a pulsed 2 µm coherent-detection Doppler wind lidar (DWL), was initially developed in the 2000s at NASA LaRC as an airborne instrument simulator to demonstrate technologies that would be required for a future space-borne Doppler wind lidar mission and to support airborne process studies and satellite Cal/Val activities. DAWN is one of several airborne DWLs operated by the international community, such as those described by Wang et al. (2012), Witschas et al. (2017), Bucci et al. (2018), Lux et al. (2018), Marksteiner et al. (2018), Tucker et al. (2018), and Zhang et al. (2018).
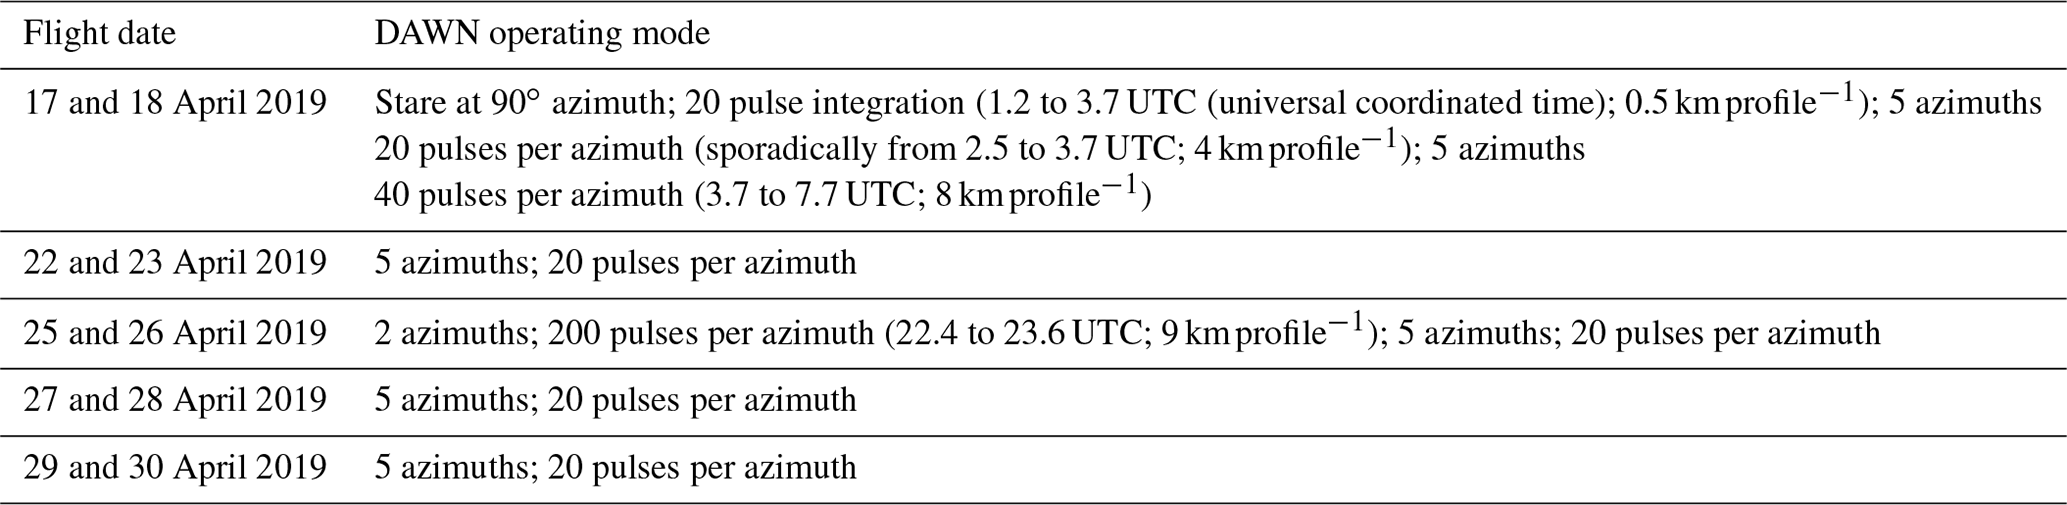
An overview of the DAWN system architecture is described by Kavaya et al. (2014) and Greco et al. (2020), but a brief summary is provided here as background. During the 2019 Aeolus Cal/Val campaign, DAWN operated with a 10 Hz pulse repetition rate and 200 ns pulse duration, generating ∼100 mJ per pulse. It originally generated 250 mJ per pulse using a crystal amplifier for the Genesis and Rapid Intensification Processes (GRIP) and Polar Winds I and II campaigns described below. However, this component failed and was removed. This change caused the beam size and curvature entering the beam expander (BEX) to be suboptimum, lowering the heterodyne mixing efficiency. The amplifier space was used to locate beam-shaping optics which restored the optimum beam to BEX coupling efficiency, thereby increasing signal-to-noise ratio (SNR) to a level greater than if the amplifier had been replaced. DAWN utilizes a 30∘ deflecting wedge scanner at the output of the system beam expander to enable vertical profiling of horizontal wind vectors. DAWN can scan at user-specified azimuth angles (commonly referred to as “looks”) with a user-specified number of laser pulse averages per LOS wind profile. Generally, a greater number of azimuths and pulses per azimuth improves the vertical coverage of successful wind retrievals and cloud cover penetration, respectively, both at the expense of horizontal distance between profiles. DAWN also has the ability to stare at one azimuth angle to retrieve wind speed along the LOS which is analogous to Aeolus observations. Table 1 provides a summary of DAWN operating modes during the campaign. The nominal operating mode is 5 azimuths (45, 22.5, 0, −22.5, and −45∘), with 0∘ oriented forward along the flight track and 20 pulses per azimuth, providing wind profiles every 4–5 km, assuming nominal DC-8 cruise speeds of 225–250 m s−1 and ∼2 s to move the scanner to a new azimuth.
Table 1A listing of DAWN operating modes throughout the five flights of the campaign and the approximate spacing between profiles.
DAWN wind retrievals are based on methods developed within the coherent DWL community and described by Kavaya et al. (2014) and Greco et al. (2020). The range-resolved retrieval is applied to each range gate spaced by 128 samples corresponding to an along-LOS range of ∼38 m at a 500 MHz sampling rate, which projects as 33 m in the vertical dimension with a 30∘ off-nadir angle. For each retrieval, a range gate of 256 samples is zero padded to 1024 samples in the fast Fourier transform (FFT) spectral analysis to determine a Doppler shift in the received lidar signal. A 256 sample range gate computes to be 76 m along the LOS and 66 m in the vertical. The 200 ns DAWN transmitted laser pulse, with a full duration at half maximum (FDHM) intensity, is 60 m long as it propagates. The lidar signal at the receiver requires a round-trip propagation of laser light, yielding an instantaneous 30 m long measurement or signal length. Using the nominal nadir angle of 30∘, the instantaneous measurement or signal height is reduced to 25.5 m. Since multiple consecutive signal samples are used to estimate wind, the independent measurement resolution lengths are necessarily longer than the pulse lengths. In addition, the electronic bandwidth of 250 MHz yields an along-LOS range of 0.6 m and a vertical range of 0.52 m. Therefore, the current DAWN wind measurement has a minimum vertical range resolution of ∼90 m, but wind retrievals in each profile are spaced by 33 m in the vertical; thus, there is some correlation between adjacent vertical levels. FFT periodograms are averaged across the number of pulses per azimuth, with corrections employed to account for slight shot-to-shot shifts in transmitted laser frequency across the number of pulses. This shot accumulation improves the SNR and, thus, permits wind measurements to have a higher success rate in lower concentrations of aerosols. The frequency shift is combined with aircraft airspeed and attitude information from the DC-8 inertial navigation system and global positioning system (INS/GPS) system to derive a wind speed range profile along the LOS. Winds from multiple LOS are combined within a solver of a linear system of equations to derive a wind vector. In practice, the vertical wind is assumed to be zero to reduce the degrees of freedom.
If a successful wind retrieval could not be derived at the highest vertical resolution (a slant range of 76.7 m) due to low aerosol concentration, data is integrated in the vertical over increasingly deep layers at 153.4, 306.8, 613.6, and 1227.3 m along each LOS until a sufficient signal magnitude that is at least 1.5 times the standard deviation of the periodogram's noise floor power is achieved. This approach is similar to the adaptive sample integration algorithm (ASIA) described by Greco et al. (2020). However, unlike Greco et al. (2020), where a wind is retrieved from samples of each LOS at the same slant range, possibly corresponding to different altitudes especially during the aircraft turns and ascent/descent, a DAWN wind retrieval is performed using samples of each LOS at the same altitude. This can improve wind retrievals during aircraft maneuvers. Figures 3b and 10d show that most winds are retrieved via multipulse integration at a single range bin (purple), analogous to the “base” retrievals described by Greco et al. (2020), but lower aerosol backscatter at middle levels (∼2–5 km altitude) of the profile in the free troposphere required more vertical integration to achieve sufficient signal.
DAWN has been used for a variety of NASA studies over the last decade. DAWN first flew on the DC-8 during the 2010 GRIP campaign (Braun et al., 2013; Kavaya et al., 2014). DAWN was also operated from the ground to explore opportunities for wind energy applications offshore of Virginia (Koch et al., 2012). Additionally, DAWN participated in two flight campaigns, Polar Winds I and II, in 2014 with the NASA UC-12B, and 2015 with the DC-8, respectively. Polar Winds II (Marksteiner et al., 2018) involved collaboration with the European Space Agency and the Deutsches Zentrum für Luft- und Raumfahrt (DLR). The NASA DC-8 and the DLR Falcon 20 exercised coordinated flight strategies during Polar Winds II that helped to inform the 2019 Cal/Val campaign strategy and future campaigns. During Polar Winds II, DAWN provided the first airborne DWL observations of a mesoscale barrier jet, driven by the interaction of synoptic-scale wind, with the steep and complex topography of Greenland (DuVivier et al., 2017). DAWN also flew aboard the DC-8 during the 2017 Convective Processes Experiment (CPEX), a campaign which sought to better understand convective cloud dynamics, downdrafts, cold pools and thermodynamics during initiation, growth, and dissipation, as well as to improve model representation of convective and boundary layer processes through the assimilation of DAWN and other remote sensing and in situ observations (NASA 2017). DAWN wind profiles agreed very well with 169 dropsonde profiles in a variety of cloud, wind, and aerosol conditions, with less than 0.2 m s−1 bias (or “accuracy”) and 1.6 m s−1 root mean squared difference (RMSD or “precision”) for wind components (Greco et al., 2020). DAWN wind observations were also well-correlated with flight-level winds measured in situ by the DC-8 and near-surface wind measured by buoys. CPEX DAWN data were assimilated into a mesoscale model to improve simulations of a mesoscale convective system and tropical storm (Cui et al., 2020) and used to demonstrate how airborne radar and Doppler wind lidar data can be used together to study convective processes (Turk et al., 2020).
A 2 µm coherent-detection Doppler wind lidar has been used by the DLR for almost 20 years within a variety of airborne science campaigns. Witschas et al. (2020) describes that detailed comparisons between the DLR lidar and dropsonde demonstrate the bias of this system to be <0.10 m s−1 with a scaled median absolute deviation (approximately the same as RMSD due to minimal bias) between 0.9 and 1.5 m s−1. This level of performance was deemed suitable for Aeolus Cal/Val during the DLR WindVal III and Aeolus Validation Through Airborne Lidars in Europe (AVATARE) campaigns. Though the DLR pulse energy, pulse length, and spatial sampling interval differs from DAWN, DAWN has provided similar performance to the DLR system in previous campaigns and, therefore, is also a useful benchmark for validating Aeolus wind profiles.
Throughout the 2019 Aeolus campaign, the INS/GPS unit attached to DAWN periodically had problems with signal acquisition that resulted in unpredictable drifts in recorded aircraft position and orientation. This unit was designed to collect data at 10 Hz that could be synced with each DAWN laser pulse to remove aircraft speed and attitude effects from the returned atmospheric signal for retrieval of Doppler shift, as described by Greco et al. (2020). The DC-8 aircraft 1 Hz INS/GPS data set was extremely stable, and was interpolated to the time of each DAWN pulse for use in place of the DAWN 10 Hz unit. Based on periods where there were reliable 10 Hz INS/GPS data, we found that the use of 1 Hz data does add some variance to the DAWN wind retrieval, ranging from ∼0.1–0.3 m s−1 and 0.5–2.5∘ in wind speed and direction, respectively, based on sensitivity analyses. Attempts to address issues with the problematic INS/GPS unit resulted in periods with, generally, less than 10 min of DAWN lidar downtime at various times during the flights.
2.2 HALO
The NASA Langley Research Center developed HALO to address the observational needs of the NASA Earth Science Division Weather and Atmospheric Dynamics, Carbon Cycle, and Atmospheric Composition Science focus areas. HALO is a modular and multifunction airborne lidar developed to measure atmospheric H2O and CH4 mixing ratios and aerosol, cloud, and ocean optical properties using the DIAL (Measures, 1984; Nehrir et al., 2017) and HSRL (Hair et al., 2008) techniques, respectively. HALO was designed as a compact replacement for the Lidar Atmospheric Sensing Experiment (LASE) WV DIAL (Browell et al., 1997) with improved and substantial additional capabilities (Nehrir et al., 2017, 2019). Furthermore, HALO was designed as an airborne simulator for future space-borne greenhouse gas DIAL missions called for by ESAS (2017), and it also serves as a test bed for the risk reduction of the key technologies required to enable those future space-borne missions. To respond to a wide range of airborne process studies, HALO can be rapidly reconfigured to provide either H2O DIAL/HSRL, CH4 DIAL/HSRL, or CH4 DIAL/H2O DIAL measurements using three different modular laser transmitters and a single multichannel and multiwavelength receiver. Though HALO has successfully flown in several field campaigns in the CH4 DIAL/HSRL configuration, providing weighted CH4 columns at 1645 nm in addition to aerosol/cloud profiling, the 2019 Aeolus Cal/Val campaign was the maiden deployment for the H2O DIAL/HSRL configuration. Despite serving as the first set of engineering test flights, HALO exceeded all expectations regarding laser reliability, measurement sensitivity, dynamic range, and accuracy and precision (to the extent validated during this mission). The results from the Aeolus Cal/Val campaign demonstrated the first new airborne WV DIAL capability within NASA in over 25 years and provides a new observational tool to the community for future process and Cal/Val studies.
In the H2O DIAL/HSRL configuration, HALO employs a 1 kHz pulse repetition frequency injection, seeded Nd:YAG, pumped optical parametric oscillator (OPO) pulsed laser to enable WV profile measurements at 935 nm using the DIAL technique, as well as the HSRL technique at 532 nm, to make independent, unambiguous retrievals of aerosol extinction and backscatter. It also employs the standard backscatter technique at 1064 nm and is polarization sensitive at the 1064 and 532 nm wavelengths. To enable WV profiling over a large dynamic range throughout the troposphere, HALO transmits four discrete wavelengths (three wavelength pairs) at 935 nm positioned on and off varying strength WV absorption lines, where each transmitted wavelength pair provides sensitivity to a different part of the atmosphere. The profiles retrieved from the three transmitted line pairs are spliced together using a weighted mean, where the WV optical depth is used to constrain the upper and lower bounds of the splice region. This WV sampling approach is similar to that presented by Wirth et al. (2009); however, HALO utilizes a single laser transmitter to generate all four transmitted wavelengths, thereby significantly reducing the overall size, weight, and power of the instrument. An overview paper summarizing the description and performance of HALO and its associated H2O, CH4, and HSRL measurements is currently in preparation.
HALO data are sampled at 0.5 s temporal and 1.25 m vertical resolution, respectively. Real-time onboard processing is employed to sum 125 shots at each of the four WV DIAL wavelengths and 500 shots at the 532 and 1064 nm wavelengths to reduce the reported data rate to 2 Hz. A high sampling rate of 120 MHz is employed to allow for accurate CH4 retrievals in the other HALO measurements configurations and future cloud and ocean profiling. The WV DIAL and 1064 nm backscatter channels have an electrical bandwidth equivalent to 15 m vertical resolution. The electrical bandwidth for the HSRL channel at 532 nm is matched to the native sampling rate to achieve 1.25 m vertical resolution in the atmosphere. The 532 nm signals are subsequently filtered and binned to 15 m vertical resolution in post-processing to increase the SNR of the HSRL aerosol retrievals.
The DIAL technique directly measures the WV molecular number density. Conversion to mass or volume mixing ratio requires knowledge of the dry air number density, which is obtained from MERRA-2 reanalysis fields of atmospheric pressure and temperature (Gelaro et al., 2017) that are interpolated in space and time to the lidar sampling track and resolution. The HALO WV mixing ratio (WVMR) products are averaged over 30–60 s horizontally (6–12 km from the DC-8, assuming nominal cruise speed) and 315–585 m vertically to achieve an absolute precision of better than 10 %, which is calculated using DIAL error propagation and Poisson statistics. The temporal and vertical averaging can be traded for precision in post-processing and optimized for specific science applications. For the Aeolus Cal/Val campaign, HALO was able to demonstrate a precision of better than 10 % with 6 km along-flight track averaging when the WV differential absorption optical depth (DAOD) was optimized by tuning the wavelength along the side of the absorption line for the specific viewing scene. The HALO WV data are calculated in real time for instrument and flight sampling optimization using a standard atmosphere model to convert the measured DAOD to mass mixing ratio. Given that this campaign served as the first check flights for HALO, optimization of the WV DAOD within the lower troposphere was not achieved for parts of the first flight and the tropical scenes, resulting in loss in precision near the surface where the absorption was too large. For ease of interpretation across the various flights presented below, all of the HALO WV data are shown at a 12 km fixed horizontal resolution. To overcome the loss in precision for cases where the near-surface DAOD was too large or SNR was degraded due to cloud attenuation, an adaptive vertical averaging routine is employed when the vertical resolution is increased from 315 to 585 m and when the uncertainty in the calculated WVMR drops below 10 %. A weighted mean is used to transition between the two different vertical averaging bin sizes. The trades on HALO WV precision vs. vertical and horizontal resolution, as well as the adaptive vertical averaging routine, will be the subject of a future paper.
Dropsonde humidity measurements during the Aeolus Cal/Val campaign lacked the vertical resolution and precision to validate the HALO WVMR retrievals, as is discussed in the following section. Qualitative comparisons, however, generally showed good agreement in the lower troposphere and into the PBL, where the HALO WV profiles resolve the shape and general magnitude of the WV measured by the sonde. Comparisons with the Diode Laser Hygrometer (DLH) in situ open path measurement, conducted during a spiral, showed excellent agreement with an average percent difference, above 4.5 and below 1 km (PBL), of approximately 5 %. Statistics between 1 and 4.5 km are omitted here due to the sparse sampling statistics and large variability within the in situ sampling volume. Details of the in situ comparisons are discussed further in Sect. 4.4. A detailed assessment of the HALO WV retrievals is beyond the scope of this paper and will be presented in a separate paper, where statistical comparisons against the dropsondes, DLH in situ measurements, and satellite retrievals of the same geophysical variable will be discussed.
In addition to profiling WVMR throughout the troposphere, total or partial columns of precipitable WV are obtained by vertical integration of the WVMR profiles. WV profile data above the surface are limited to approximately the vertical resolution of the retrieval bin width which is required to achieve sufficient on/off extinction for high-precision measurements. WV profiles over the ocean are extended to the surface, utilizing the strong surface echo, where a DIAL retrieval is carried out between the last good atmospheric retrieval above the surface and the on/off absorption from the surface echo. Preliminary results using the ocean surface echo compare favorably with the DLH in situ observations, with an absolute difference of less than 10 % from the surface up to 315 m. However, it should be noted that the lowest extent of the aircraft spiral limited the DLH observations to ∼200 m a.s.l. (above sea level) so that the lidar comparisons are also limited to 200–315 m a.s.l. As with the full profile comparisons to the sondes from above, the surface echo retrievals generally showed good agreement with the shape and magnitude of the near-surface profiles retrieved from the sonde. Given that the majority of the campaign was over the ocean, the detector gain settings were not optimized to keep the land surface echo on scale, and therefore, the surface echo retrievals are not employed over land for this study. Additionally, WV profiles above clouds are masked with an additional 45 m to avoid cloud edge effects and contamination in the DIAL retrieval.
A primary function of HALO during the Aeolus Cal/Val campaign was to provide aerosol validation for the ALADIN co-polar aerosol backscatter and extinction products. The HALO aerosol HSRL and backscatter retrievals follow the methods presented by Hair et al. (2008). HALO aerosol backscatter and depolarization products are averaged 10 s horizontally, and aerosol extinction products are averaged 60 s horizontally and 150 m vertically. The polarization and HSRL gain ratios are calculated as described in Hair et al. (2008). Operational retrievals also provide a mixing ratio of nonspherical to spherical backscatter (Sugimoto and Lee, 2006), distributions of aerosol mixed-layer height (MLH; Scarino et al., 2014), and aerosol type (Burton et al., 2012). Comparisons between HALO and Aeolus Level 2a atmospheric optical properties products during this Aeolus Cal/Val campaign are not presented here due to the current limitations of Aeolus aerosol and cloud discrimination and low sensitivity to aerosol scattering throughout the troposphere. A comprehensive assessment between the Aeolus and HALO HSRL retrievals will be carried upon the next public release of the Aeolus Level 2a optical properties product, which is expected some time in 2021.
2.3 Dropsondes
The Yankee Environmental Systems, Inc. high-definition sounding system (HDSS) is an automated system deploying the expendable digital dropsonde (XDD) designed to measure wind and pressure–temperature–humidity (PTH) profiles and skin sea surface temperature. A full technical description of the HDSS and XDD systems (hereafter referred to as sonde) is provided by Black et al. (2017). HDSS XDD sonde data were used during the 2015 Polar Winds II and 2017 CPEX campaigns to validate DAWN and the 2015 Office of Naval Research Tropical Cyclone Intensity (TCI) field program to study the horizontal structure of tropical cyclones (Doyle et al., 2017). The sonde measures PTH profiles at a 2 Hz rate and GPS location, altitude, and horizontal wind velocity at 4 Hz, equating to 5–8 m per vertical level. During the Aeolus campaign, a new RH (relative humidity) sensor, deployed for the first time within the sonde, was found to have lag in response and did not have adequate sensitivity to vertical WV gradients. An initial view of this is provided by Fig. 14a above 5 km altitude, which will be further discussed in Sect. 4. Due to this response lag, sonde WV profiles will not be discussed in detail in this paper.
A set of processing steps and filters are applied to ensure sonde data quality and that the two data sets are of comparable vertical resolution. The sonde wind data are first smoothed using a running three vertical level boxcar average to minimize noise. Sonde wind data in the first 250 m beneath the aircraft were found to be artificially fast due to the sonde being recently released from the aircraft, so all measurements taken within the first 250 m are removed from any analysis. A sonde, released on 28 April at 02:02 UTC, is especially noisy above 8 km so only sonde and DAWN data below 8 km are compared for that time. In addition, the sonde altitude is adjusted by adding 40 m to each sonde altitude measurement in order to account for a timing lag between when the sonde measurement is collected and the time stamp of a given vertical level, as suggested by Mark Beaubien (personal communication, 2019). Sonde wind data within ±33 m of each DAWN altitude bin are averaged, given that the DAWN pulse length projected into the vertical is approximately 23 m. The DAWN wind profile immediately preceding a sonde launch was used for comparison, provided that the profile occurred within 2.5 min of the sonde release to minimize the impact of spatial wind variability on the validation statistics. DAWN data met this time match criteria for 61 of the 65 sondes released across the five flights. Wind speed (direction) differences exceeding 10 m s−1 (30∘) were considered as being outliers that amounted to 0.03 % (3.57 %) of 12 284 DAWN vertical bins matched with sonde data.
2.4 Aeolus
Aeolus is a direct detection Doppler wind lidar, operating near 355 nm, that retrieves wind speed and aerosol and cloud profiles along a single LOS oriented 90∘ to the right of the Aeolus spacecraft heading (Straume et al., 2019; Kanitz et al., 2019; Reitebuch et al., 2019, and references therein). Aeolus derives wind profiles by measuring the Doppler shift of light backscattered from molecules (Rayleigh scattering) or clear-sky aerosol and cloud particles (Mie scattering). In this study, we analyze the Aeolus Level 2b horizontally projected LOS (HLOS) wind speed product that is developed by the Royal Dutch Meteorological Institute (KNMI) and the European Centre for Medium-Range Weather Forecasts (ECMWF), under ESA contract, in close cooperation with the teams developing the level 1b product (DLR; DoRIT) and level 2a product (Météo-France). Technical descriptions of the Aeolus wind retrieval processing and the level 2b product are summarized by Tan et al. (2008), Rennie et al. (2018), Witschas et al. (2020), and references therein.
The DC-8 flew along the Aeolus track for 45 to 110 min, flight dependent, and was along the Aeolus track when the satellite was overhead, resulting in little spatial and temporal variability between the observations. The evening overpass near 18:00 LT (local time) was the target for all five underflights. The Aeolus laser LOS coordinates at a 6 km altitude were used to develop the DC-8 flight track. The DC-8 flew over a range of altitudes during the Aeolus underpasses, from 7.5 to 12 km, depending on the atmospheric conditions and the specific objectives of a given flight.
Aeolus Level 2b products provide Mie winds at 10 km intervals, where clouds are present, and 0.5–1.0 km vertical spacing and Rayleigh clear winds at near 90 km intervals and 1 km vertical spacing at altitudes sampled by DAWN and up to 2 km in the lower stratosphere. When DAWN was in the vector wind profiling mode, DAWN vector winds were projected to the Aeolus viewing orientation to derive a LOS wind speed. Though the DC-8 flew along the Aeolus laser track where it intersected the 6 km altitude, winds with some component perpendicular to the flight track (i.e., cross winds) required the DC-8 to head into the wind to maintain a consistent heading. The difference between the DC-8 and Aeolus heading was taken into account when projecting the DAWN wind vector to the Aeolus view. During the Aeolus underpass on the first flight of the campaign (17 and 18 April 2019; see Table 1), DAWN was mostly operated in single-LOS mode, with its beam oriented 90∘ to the right of the aircraft heading in order to match the sampling of Aeolus. Due to strong cross winds, the DC-8 heading differed by as much as 12∘ from Aeolus. Based upon intermittent vector wind profiles collected during single LOS operations (shown in Fig. 4a–c), we found that projection to a 102∘ orientation instead of 90∘ changed the LOS wind speed by up to 4 m s−1. Sensitivity tests assuming a constant wind direction profile across the entire Aeolus underpass showed that correcting the LOS wind speeds from a 90∘ angle to a 102∘ orientation resulted in a ∼0.2 m s−1 decrease in the Aeolus–DAWN Rayleigh bias but a comparable increase in RMSD. We chose not to incorporate this correction because wind direction was not truly constant throughout the 18 April underpass, and there was a relatively negligible change in validation statistics.
DAWN data are averaged to match the Aeolus horizontal and vertical bin spacing, and DAWN outliers in each bin are filtered from the averaging. At least 30 (10) valid DAWN wind retrievals must be present within a Rayleigh clear (Mie cloudy) bin to derive a robust mean for Aeolus comparison. We used the “estimated HLOS error” parameter provided in the Aeolus Level 2b product, where it is recommended that Rayleigh clear (Mie cloudy) winds with >8 m s−1 (>5 m s−1) be excluded (Rennie and Isaksen, 2020). A DAWN–Aeolus difference exceeding 20 m s−1, which only occurred in one bin, was considered an outlier and excluded from analysis. These criteria, and the duration of the Aeolus underpasses, resulted in 231 vertical Rayleigh clear and 42 Mie cloudy data bins distributed across 46 Aeolus Rayleigh profiles.
It is important to note that, due to a variety of technical challenges that are beyond the scope of this paper, the Aeolus laser A output power gradually decreased from the time of the Aeolus launch to April 2019 when the Aeolus Cal/Val test flight campaign was conducted (Lux et al., 2020). This degradation, coupled with lower-than-expected signal throughput in the detection chain (both of which are currently being studied by the Aeolus team), served to (1) decrease the precision of Aeolus Rayleigh- and Mie-derived wind products and (2) limit the ability to retrieve aerosol products from the Mie channel under clean or very tenuous aerosol loading conditions. ESA made the decision to switch to Aeolus laser B in June 2019, which has resulted in improved laser energy output and, hence, improved precision in the wind products. In addition, anomalous signal detections on the Aeolus accumulation charged coupled device (ACCD) have been discovered (i.e., “hot pixels”), and the number of affected pixels has increased over time. A dedicated dark current calibration mode (DUDE) and an on-ground correction scheme based on the DUDE measurements has been implemented in the ground segment in June 2019 and, hence, has not been applied to the measurements validated here.
Finally, comparisons of the Aeolus data quality with the ECMWF model background and collocated Cal/Val observations from ground-based instrumentation (including wind profilers and radiosondes) showed that the variability in the Earth's top-of-atmosphere total radiance along the Aeolus orbit causes thermal stress and deformations of the instrument telescope which could not be fully compensated by the implemented telescope thermal control. This has caused biases in the Aeolus Level 2b winds of several meters per second, with variations along the orbit and from orbit to orbit (Martin et al., 2020). An on-ground correction of the telescope temperature-induced bias has been developed and was implemented in April 2020. The data set used in this comparison is, hence, affected by this known bias contributor.
The presented work includes preliminary data (not fully calibrated and validated and not yet publicly released) of the Aeolus mission that is part of the ESA Earth Explorer Programme. This includes wind products from before the public data release in May 2020 and/or aerosol and cloud products, which have not yet been publicly released. The preliminary Aeolus wind products will be reprocessed during 2020 and 2021, which will include, in particular, a significant level 2b product wind bias reduction and improved level 2a radiometric calibration. Aerosol, cloud, and wind products from the April 2019 period will become publicly available by fall 2021. The processor development, improvement, and product reprocessing preparation are performed by the Aeolus DISC (Data, Innovation, and Science Cluster), which involves government and industry partners including DLR, DoRIT, ECMWF, KNMI, Centre National de la Recherche Scientifique (CNRS), Science and Technology Corporation (S&T Delft), ASEA Brown Boveri (ABB), and Serco Group plc, in close cooperation with the Aeolus PDGS (Payload Data Ground Segment). It is likely that performance will improve with future reprocessing, thus extensive validation of these preliminary products will not be emphasized in this paper.
A total of five DC-8 flights were executed from 17–30 April 2019 – four from NASA Armstrong Flight Research Center in Palmdale, California, and one from Kailua-Kona, Hawaii (the along-flight tracks are overlain on GOES-17 imagery shown in Fig. 1). Given the short duration of this campaign and other operational considerations, we generally sought to maximize the weather targets of opportunity, with an emphasis on broad regional sampling rather than focused sampling of one particular area or phenomenon. An exception to this was the 29 and 30 April flight, where we transected the same regions multiple times to study atmospheric temporal variability and instrument performance. Flight tracks were selected to capture diverse wind and WV conditions while avoiding optically thick mid- to upper-level cloud layers that can attenuate lidar signals and inhibit vertical profiling throughout the troposphere. GOES-17 satellite imagery and the NASA Global Modeling and Assimilation Office (GMAO) Goddard Earth Observing System, version 5 (GEOS-5), model forecasts of clouds, precipitation, and aerosols were used as guidance for flight planning.
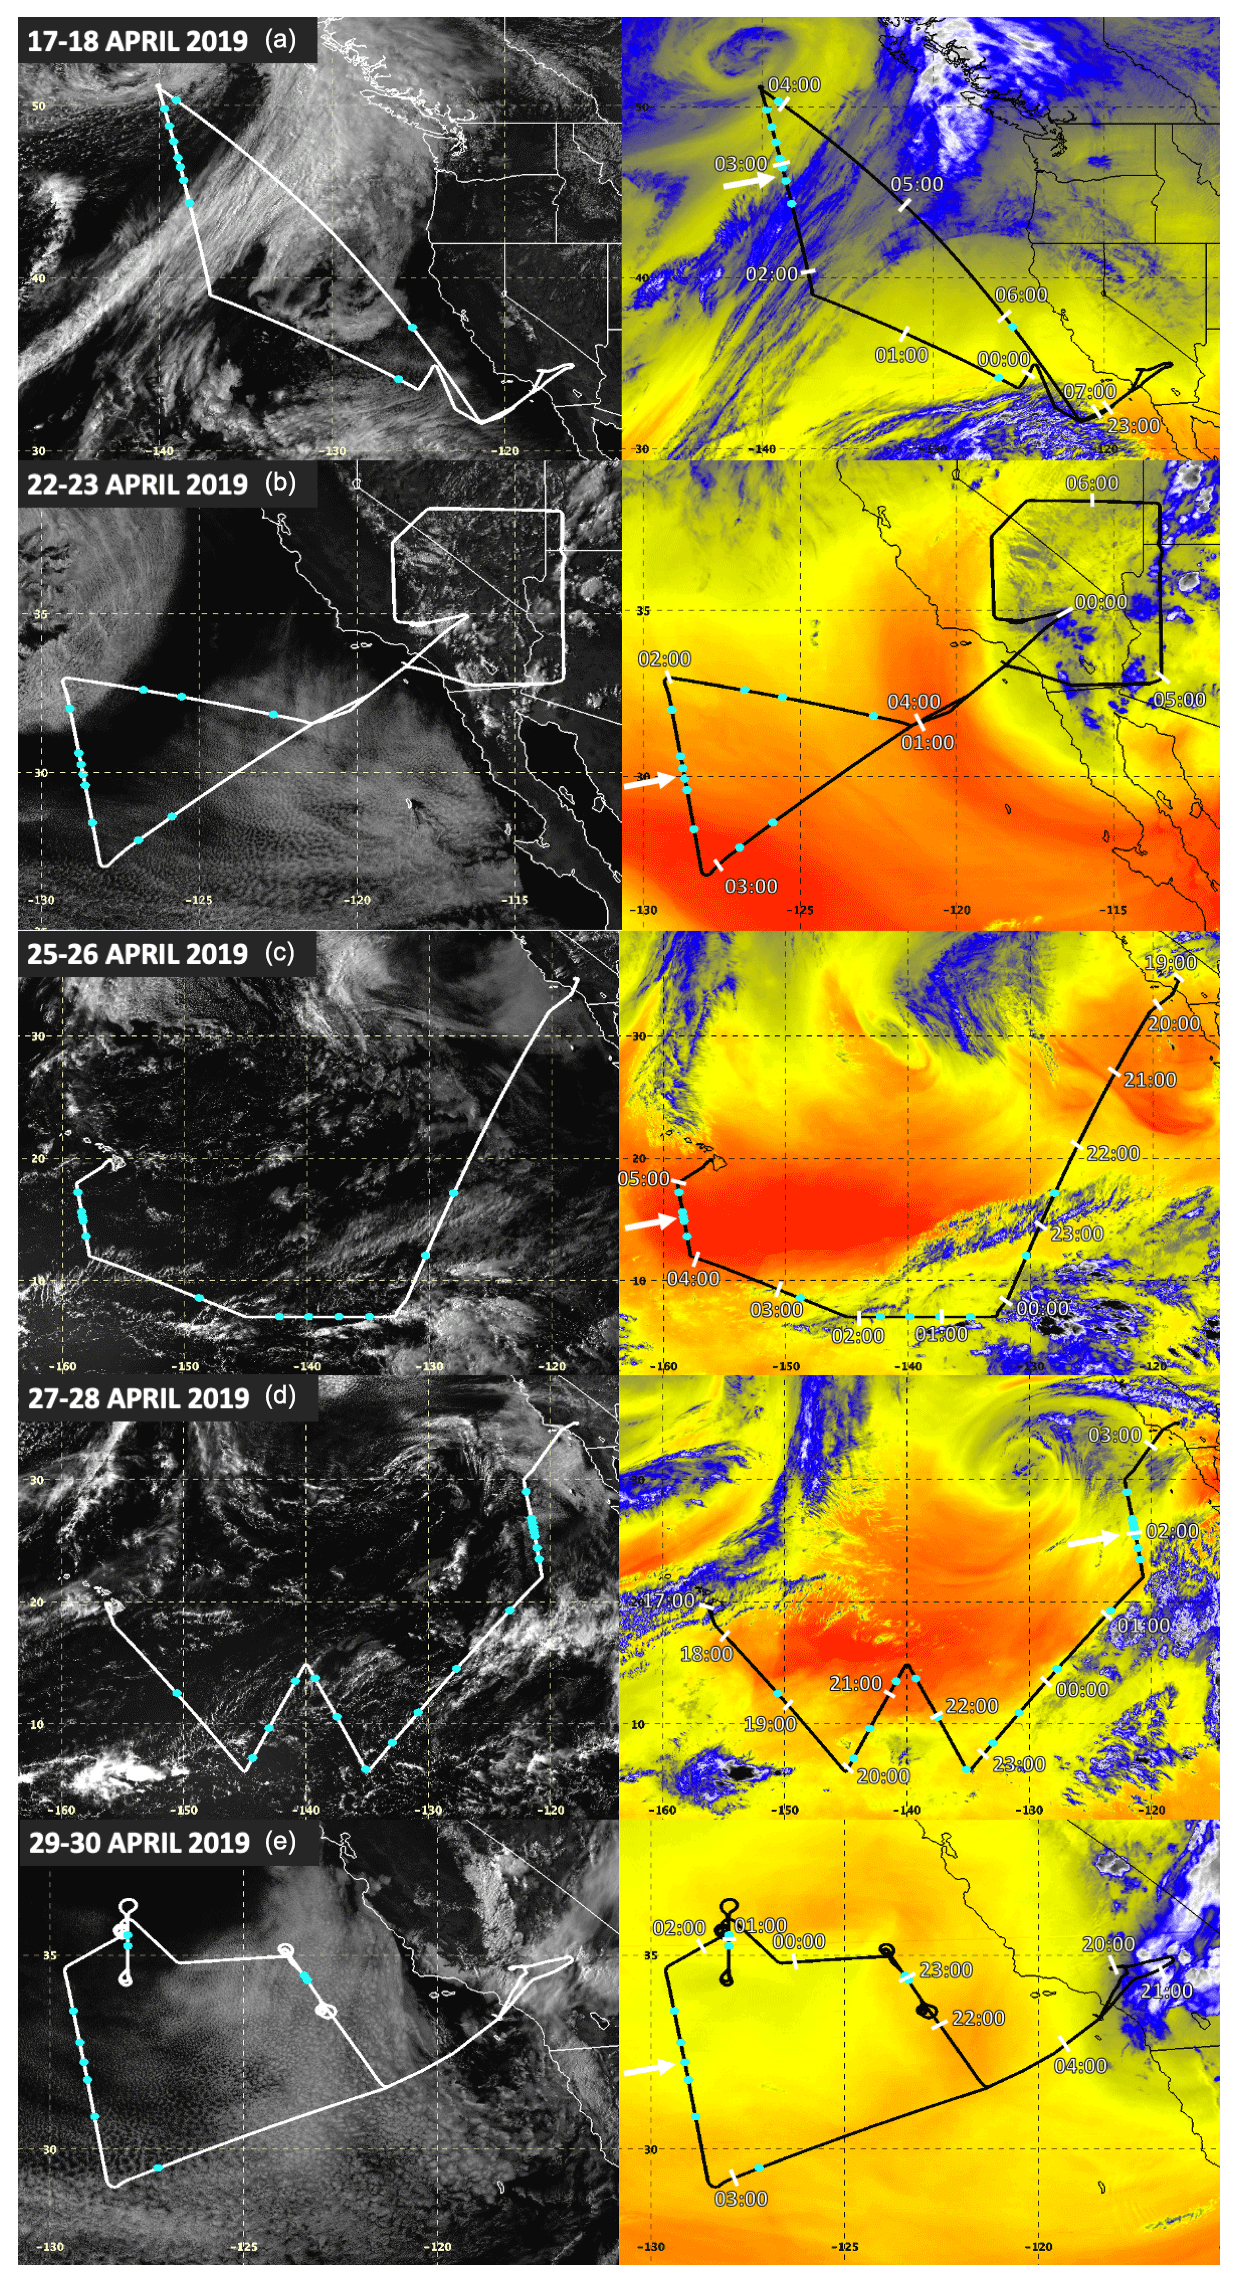
Figure 1The DC-8 flight track (bold lines) overlain atop GOES-17 0.64 µm visible (left) and 7.3 µm water vapor brightness temperature (right, in kelvin) at (a) 00 UTC on 18 April, (b) 00 UTC on 23 April, (c) 0030 UTC on 26 April, (d) 2230 UTC on 27 April, and (e) UTC on 30 April. The DC-8 aircraft position at hourly intervals is annotated on the right panels. Cyan dots indicate where dropsondes were released. White arrows point to straight northwest–southeast-oriented segments, where the DC-8 underflew the Aeolus laser track at a 6 km altitude for durations ranging from ∼45 to 110 min.
GOES-17 visible and infrared satellite imagery was uploaded in near-real time to the DC-8, where it could be displayed and animated during the flight for situational awareness and to help identify clear or broken cloud conditions for sonde releases. A GOES-17 Advanced Baseline Imager (ABI) Mesoscale Domain Sector (MDS) was provided by NOAA's National Environmental Satellite, Data, and Information Service (NESDIS) along the DC-8 flight track during almost the entirety of the 46 h flight campaign. Images were collected every minute within an MDS, which enabled a variety of cloud process and geostationary cloud- and WV-tracked atmospheric motion vector studies that are currently being conducted. Several examples of GOES-17 7.3 µm WV channel imagery are shown herein. This channel typically senses upwelling radiance emitted within the 500–750 hPa layer (∼3 to 6 km altitude) in cloud-free conditions, and it is a layer that was observed during all flights.
4.1 18 April 2019
The first flight of the campaign served as both a test flight, to ensure that all instrumentation and components were operating properly, and a science flight. The target of the flight was a strong midlatitude cyclone over the North Pacific, centered at 51∘ N, 140∘ W and shown in Fig. 2a–b. The goal was to intersect the large dry slot (Fig. 2d) of the cyclone where clear sky to broken cumulus clouds and wind speeds exceeding 50 m s−1 were present at flight level at the time of the Aeolus overpass near 03 UTC (27 UTC on the cross-section time axis).
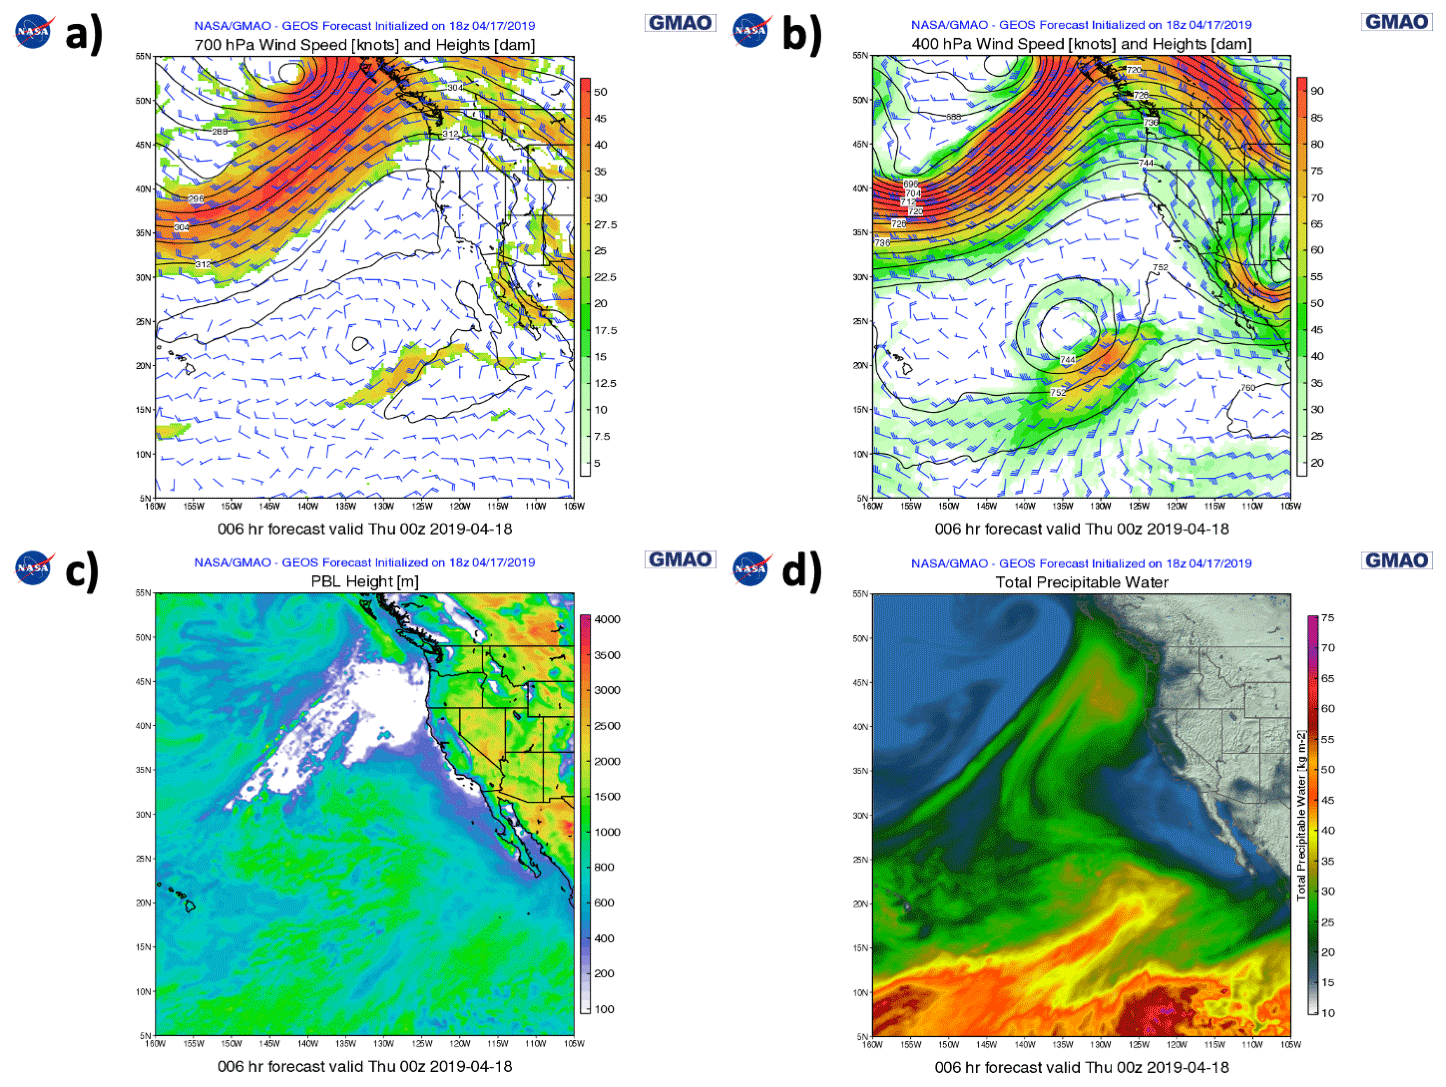
Figure 2NASA GMAO GEOS-5 6 h forecast of (a) 700 hPa wind, (b) 400 hPa wind, (c) PBL height, and (d) total precipitable water valid at 00:00 UTC on 18 April 2019.
After system testing during the first 3 h of the flight, DAWN was operated in the three modes specified in Table 1. This flight was the only one to use a single LOS DAWN stare oriented 90∘ to the right of the aircraft heading, which emulated the view of Aeolus and produced higher spatial resolution profiles than operations with multiple LOS (∼0.5 km per single LOS speed profile vs. 4–5 km per vector profile). During the stare periods, DAWN was periodically reset to operate in 5 azimuth vector profiling mode so that DAWN wind speed and direction could be validated with sondes being released in support of Aeolus validation. Due to the differences in DAWN operating mode throughout the flight, all DAWN vector wind profiles were projected to the LOS horizontal wind speed along the 90∘ azimuth. A time–height cross section of DAWN and HALO data during the intensive observing period (IOP) on 18 April is shown in Fig. 3. Figure 3a shows the absolute value of the DAWN LOS wind speed to account for changing aircraft direction. As this was the first-ever flight of HALO in the WV profiling configuration, system testing persisted until approximately 03 UTC on 18 April.
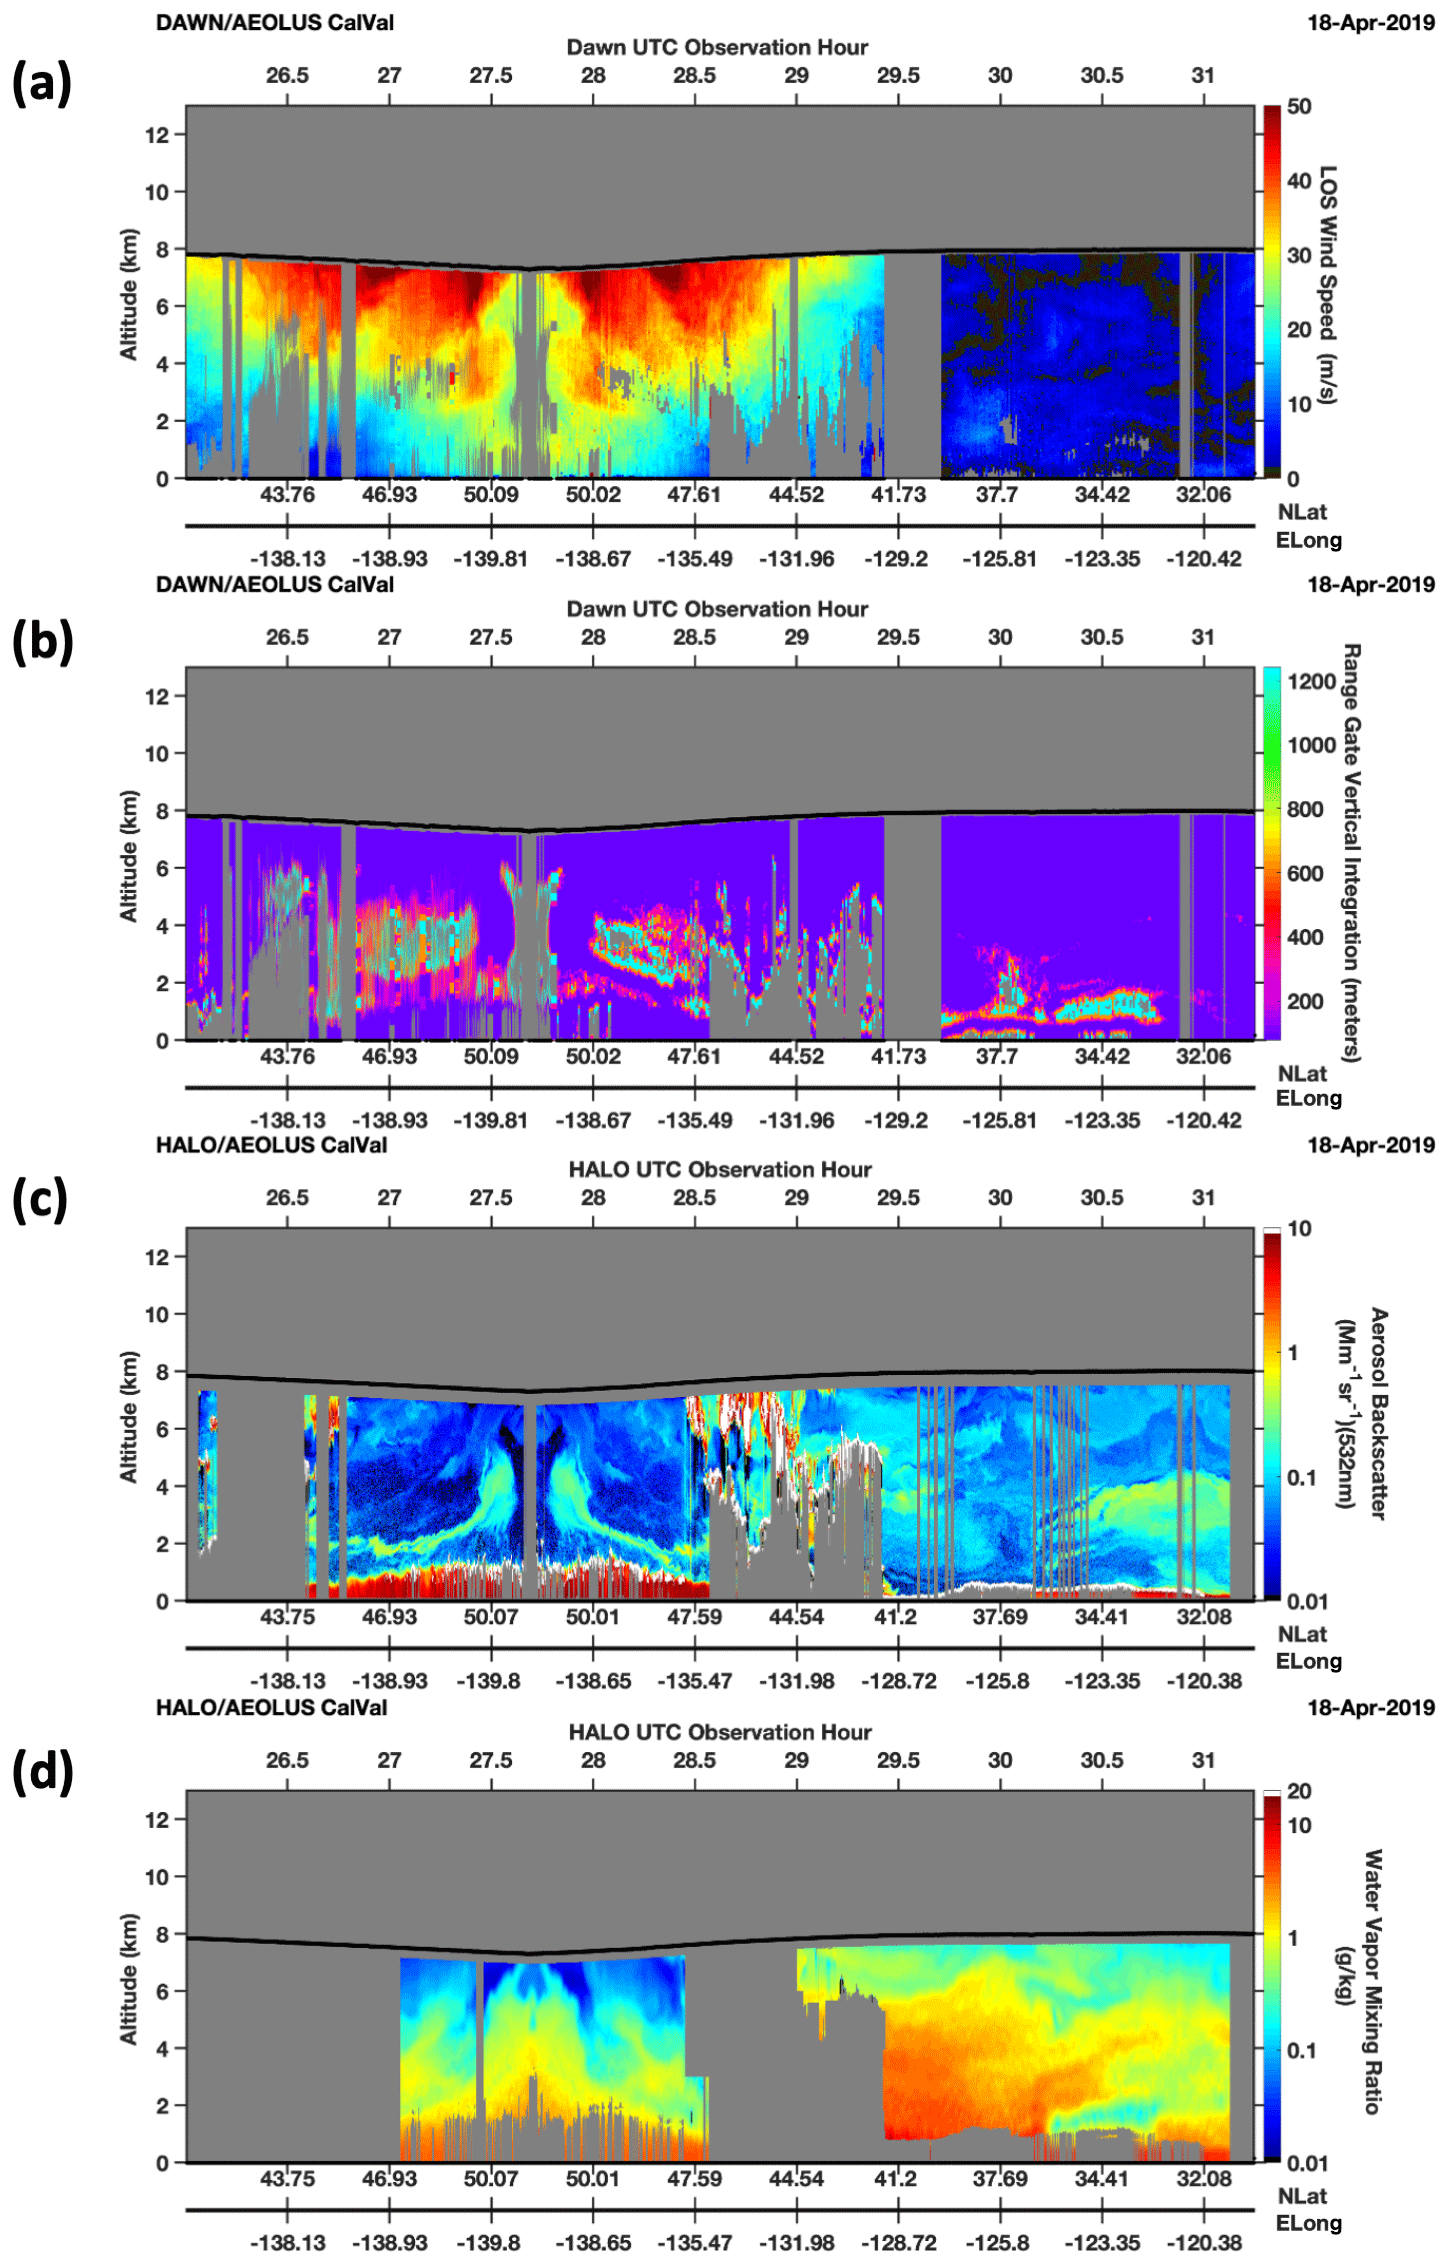
Figure 3(a) The absolute value of the DAWN horizontal line of sight (HLOS) wind speed measurement, projected 90∘ to the right of the aircraft heading from 02:00 to 07:15 UTC (i.e., 26–31.25 above) on 18 April 2019. The bold black line atop the colored cross section indicates the DC-8 flight altitude. (b) The depth of the vertical signal integration required to achieve sufficient signal for a DAWN wind retrieval. (c) HALO 532 nm aerosol backscatter coefficient, shown with a logarithmic color scale to accentuate variations in the free troposphere aerosol distributions. (d) HALO WVMR also shown with a logarithmic color scale. Gray areas in the DAWN and HALO cross sections indicate aircraft turns (), areas beneath opaque cloud cover, inadequate signal return inhibiting retrieval at a particular altitude, or instrument downtime.
The IOP for this flight began while the DC-8 was flying within a cold front, with cirrus clouds at flight level and opaque mid- to low-level clouds beneath, which often obscured DAWN and HALO measurements from reaching the surface. The DC-8 was already along the Aeolus flight track at this time (white arrow in Fig. 1a). After progressing through the frontal region, a dropsonde was released at 02.58 (0236) UTC while DAWN was briefly reset to vector wind profiling mode (Fig. 4a). The DAWN and, to a lesser extent, MERRA-2 wind profile agreed with the sonde. LOS wind speed near the flight level continued to increase until a local maximum just before 0300 UTC at the time of the Aeolus overpass at 0258 UTC. A total of two sonde releases were coordinated with DAWN vector profiles at ∼02.83 to 03.02 (0250–0301) UTC, demonstrating strong correlation between sonde and DAWN (Fig. 4b and c). HALO aerosol backscatter (Fig. 3c) depicted a prominent plume of elevated smoke (identified using HSRL aerosol-intensive parameters; not shown) from approximately 2 km altitude that rose to 6 km as it was advected toward the low-pressure center.
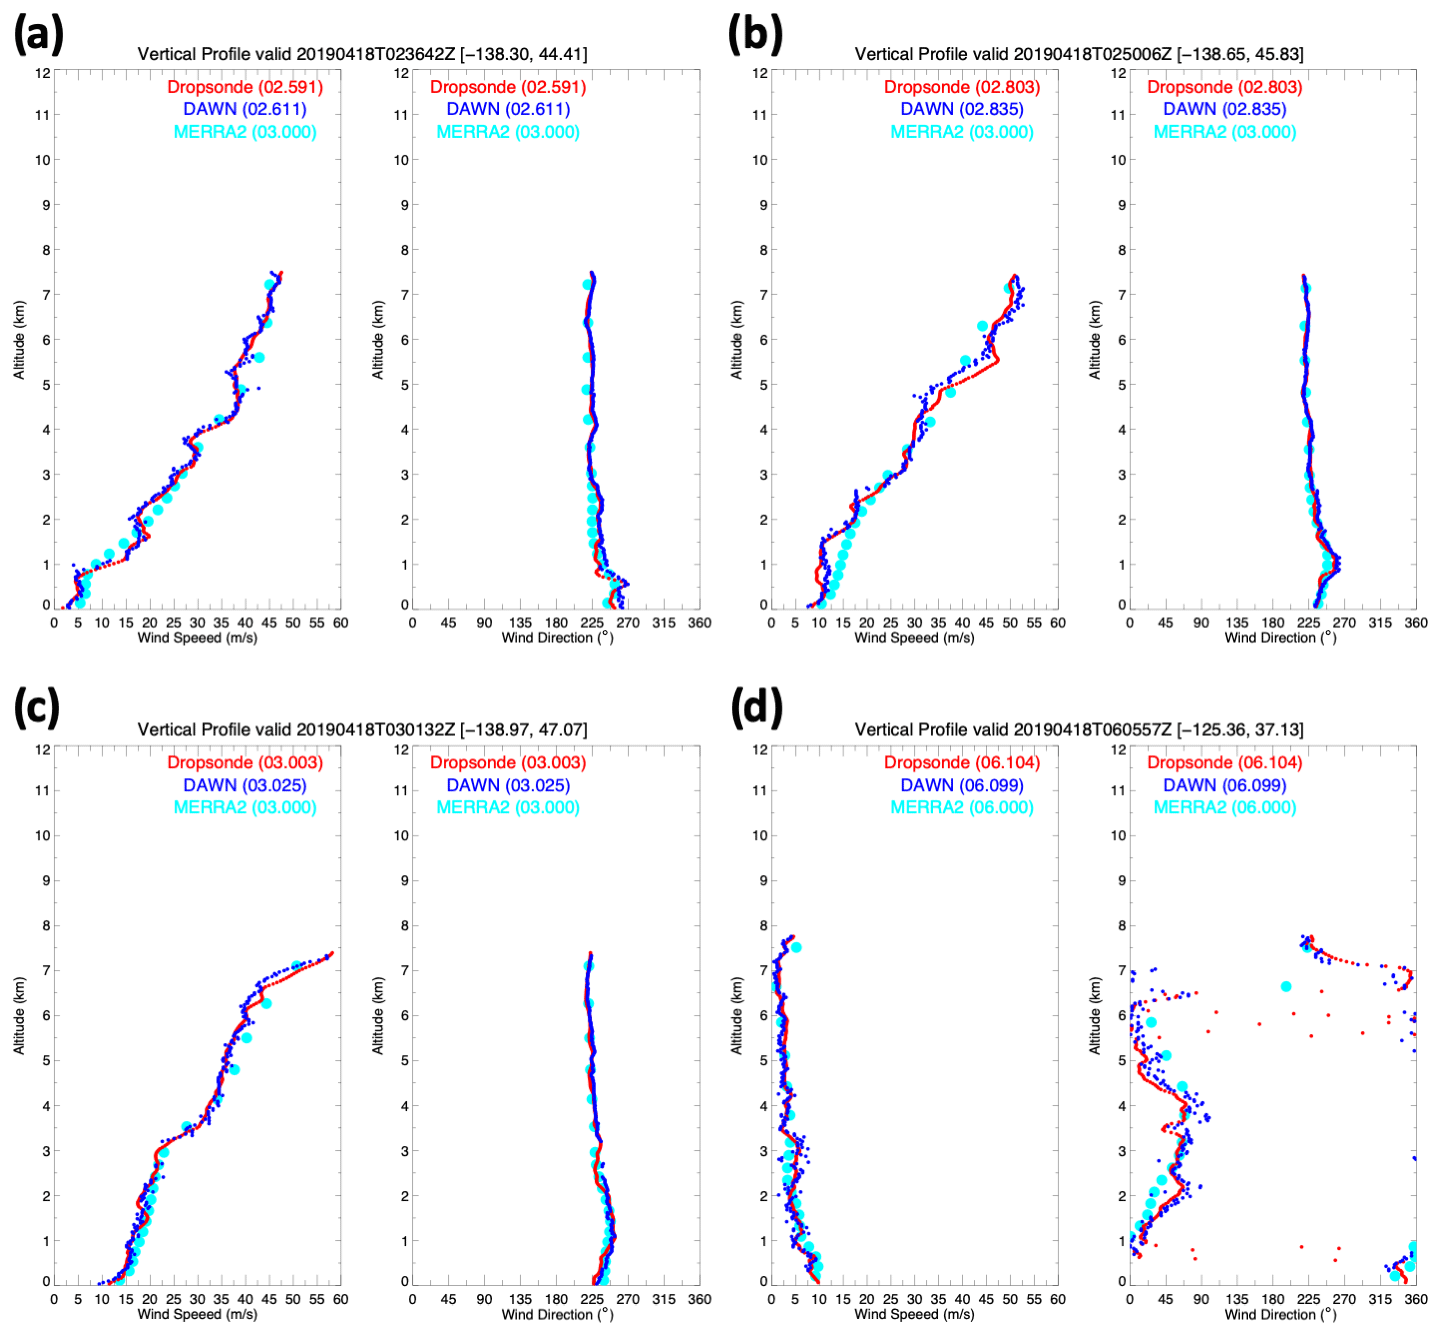
Figure 4Dropsonde (red), DAWN (blue), and MERRA-2 (cyan) for DAWN profiles at (a) 0236, (b) 0250, (c) 0301, and (d) 0605 UTC on 18 April 2019.
As the DC-8 approached opaque cumulus clouds close to the low center at 03.7 UTC, it turned southeastward for a long linear segment on the return to Palmdale, California. Opaque midlevel cloud cover associated with the front again inhibited profiling down to the surface, except for a few isolated profiles in breaks between clouds. While DAWN was reset at 05.5 UTC to address the problematic INS/GPS unit, a sharp transition into a high-pressure region with weak wind flow occurred. Enhanced PBL moisture exceeding 10 g kg−1 near the surface was observed by HALO south of the front at around 05.5 UTC (Fig. 3d). A dropsonde was released at 0605 UTC, showing winds less than 5 m s−1 throughout much of the profile that were captured well by DAWN and MERRA-2 (Fig. 4d), demonstrating that DAWN can accurately measure both high and very low wind speeds. Detailed comparisons between DAWN and MERRA-2 will be highlighted in a future paper.
Aerosol backscatter in this region was greater, on average, than the region near to the low pressure to the north, with a prominent dust plume in the 2–4.5 km layer after 06.25 UTC (via aerosol-intensive parameters; not shown). Between this dust and stratocumulus (hereafter stratocu) cloud layer below, an extremely dry layer was present, which could have been driven by dehydration from radiative cooling and/or subsidence. Although serving primarily as a test flight, this first IOP provided insight into the performance of new synergistic lidar remote sensing capabilities critical for improved understanding of atmospheric processes.
4.2 22 and 23 April 2019
The second flight on 22 and 23 April focused on sustained higher altitude operations, targeting a high-pressure region over the ocean where an Aeolus overpass was located near 129.5∘ W, followed by a low-pressure region that extended through the depth of the troposphere, centered near the Arizona–Mexico border (Fig. 5a and b). Between these two systems was a northeast–southwest-oriented jet streak located across southern California and Nevada. This jet streak had winds over 90 kts (46.3 m s−1) and can be seen via dry air in GOES-17 7.3 µm imagery (Fig. 1b), resulting from subsidence within a tropopause fold. The jet streak is evident in the DAWN wind speed cross sections during the outbound and return legs of the Aeolus underflight at approximately 0.8 and 04.3 UTC, respectively (Fig. 6a and b). DAWN observed over 40 m s−1 northerly winds above 10 km within the jet core, with winds over 20 m s−1 extending down to 5 km altitude. The HALO WV cross section (Fig. 6d) shows a narrow filament of dry air (<0.5 g kg−1) extending downward from 6 km at 01 UTC on 23 April to the top of the stratocu layer at approximately 01.5 UTC, which is correlated with the jet streak observed by DAWN.

Figure 5NASA GMAO GEOS-5 6 h forecast of (a) 700 hPa wind, (b) 300 hPa wind, (c) PBL height, and (d) total precipitable water, valid at 00 UTC on 23 April 2019.
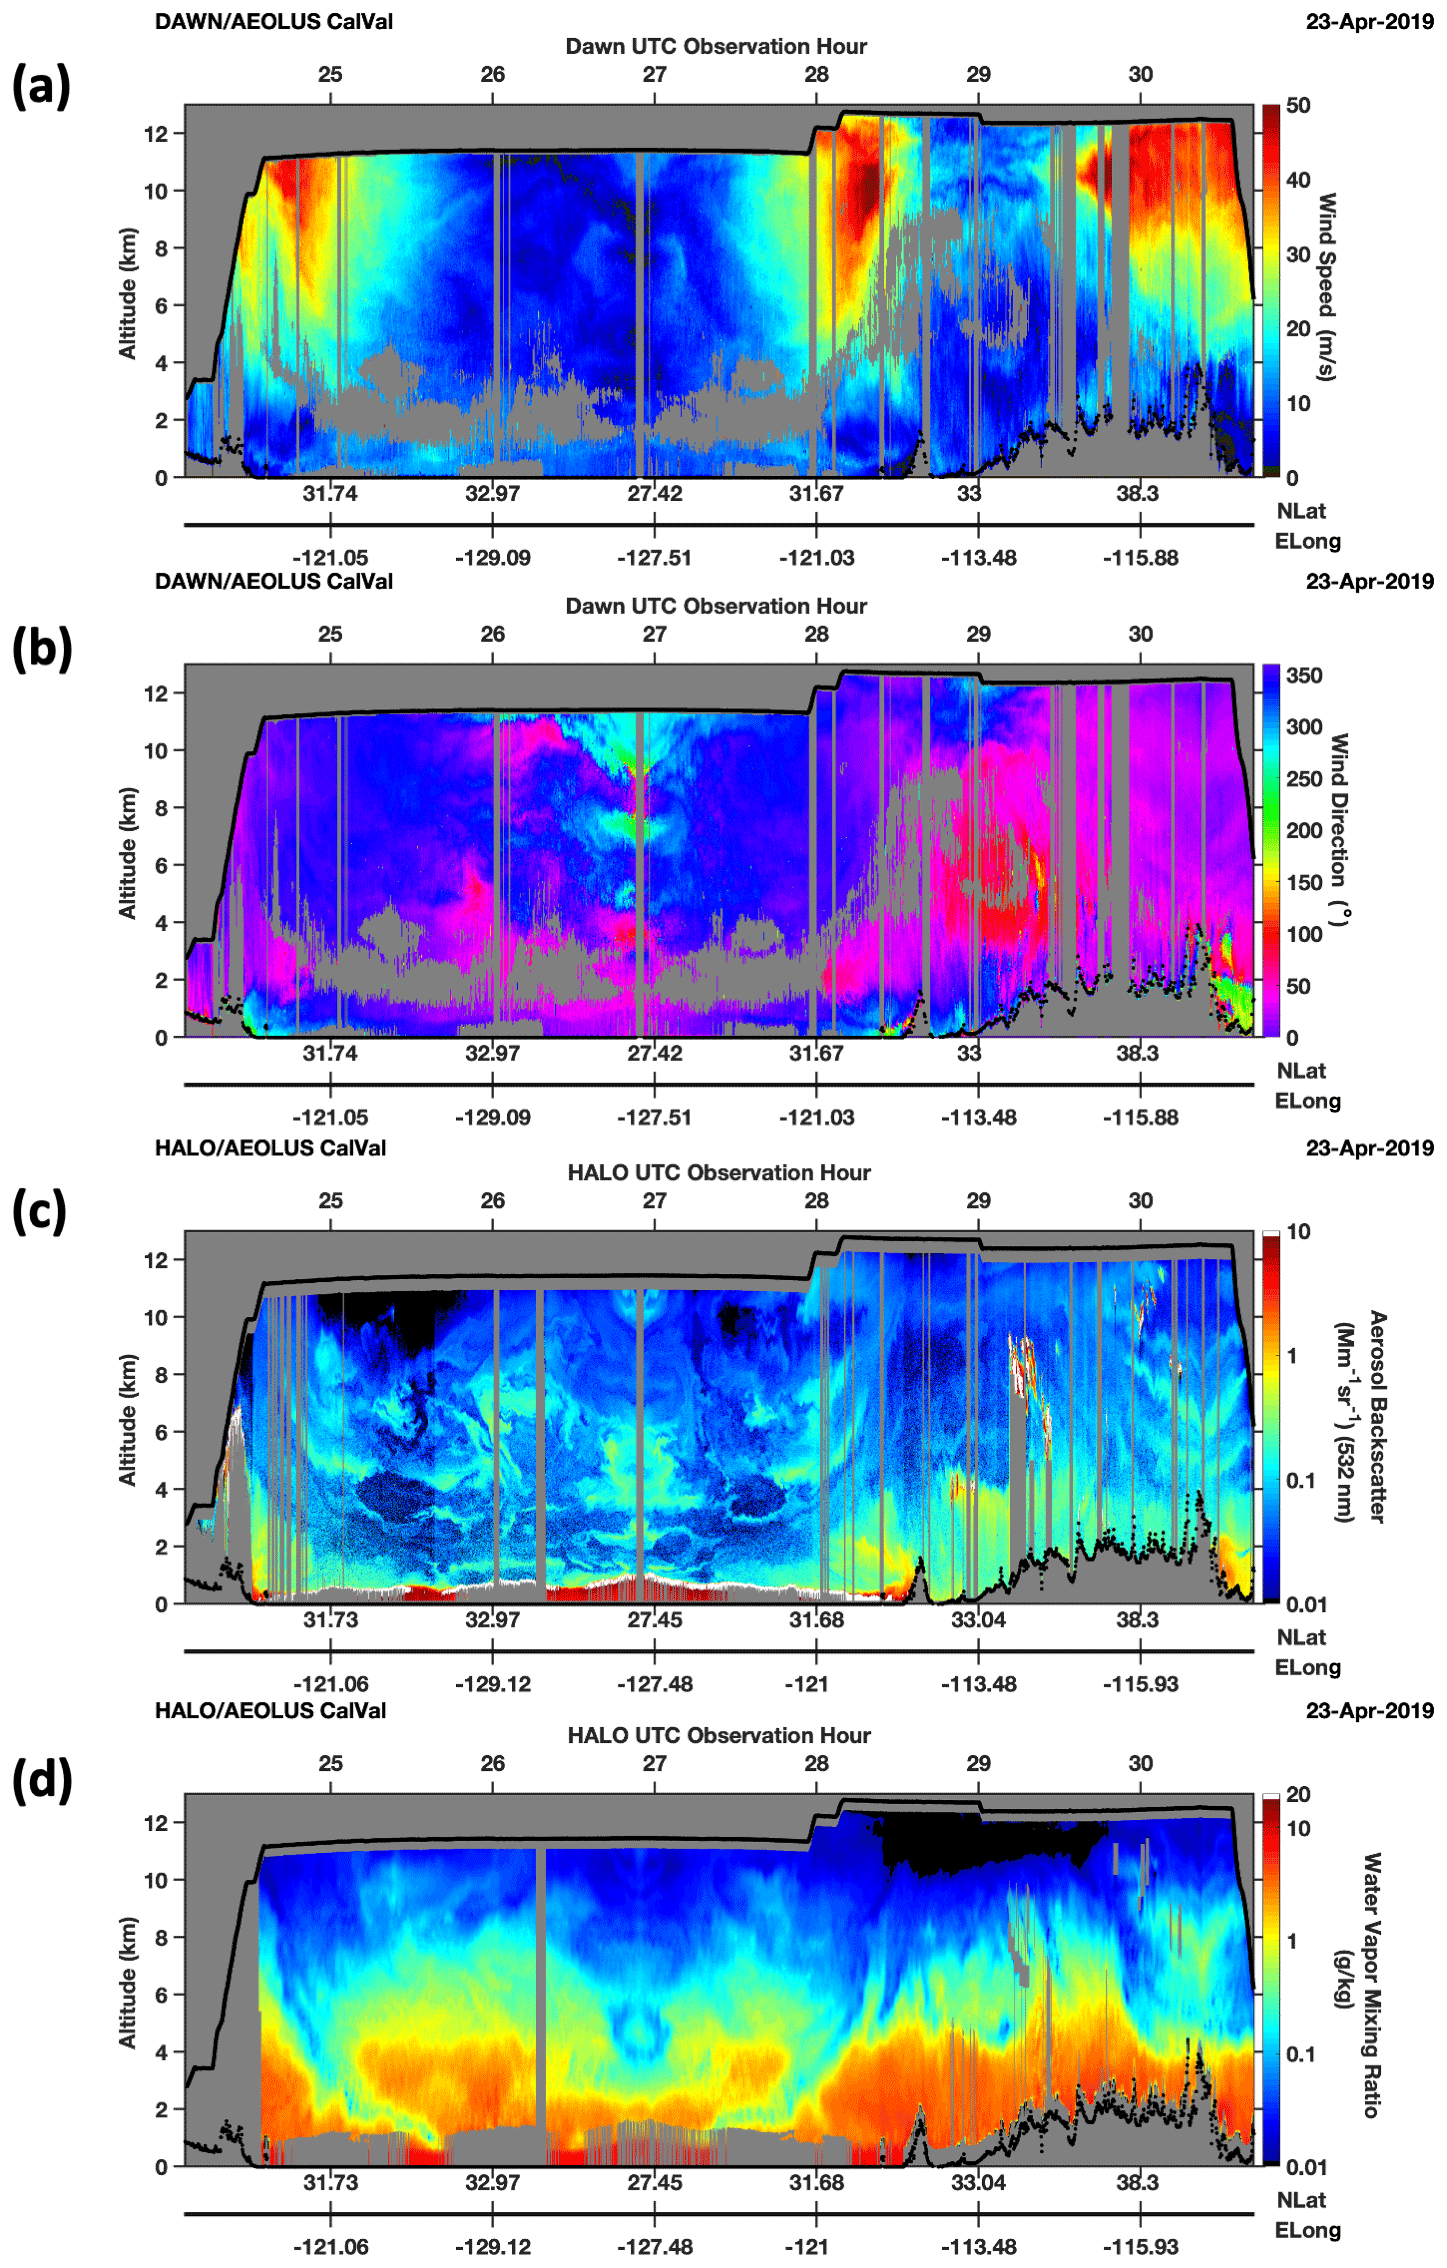
Figure 6(a, b) DAWN wind speed and direction for the 22 and 23 April 2019 flight. (c) HALO 532 nm aerosol backscatter. (d) HALO water vapor mixing ratio.
A high-pressure region with forecasted weak wind flow and low total precipitable water (Fig. 5d) was sampled to the west along the triangular portion of the flight track, where a large region of low stratocu, with varying thickness and morphology, was present. The aerosol distribution was complex during this time frame, with high aerosol backscatter within the PBL overlain by tenuous aerosol enhancements extending up to flight level (Fig. 6c). These aerosol layers exhibit a high level of correlation between the wind speed, direction, and WV fields and provide insight into the complex interaction between atmospheric state, composition, and dynamics. A layer of relatively low aerosol backscatter with some vertical variability persisted from 2 to 4 km altitude, which provided insufficient signal for DAWN wind retrieval. The flight progressed southeastward along the Aeolus track to a region of very dry air at the southernmost edge of the line. This dry air is depicted in the GOES WV imagery in Fig. 1b and can also be seen in the HALO WV cross section near 3 UTC, where a mixing ratio below 0.1 g kg−1 at 4 km was observed. DAWN and, to a lesser extent, MERRA wind profiles agreed well with sondes, as shown by the four sonde comparisons in Fig. 7.
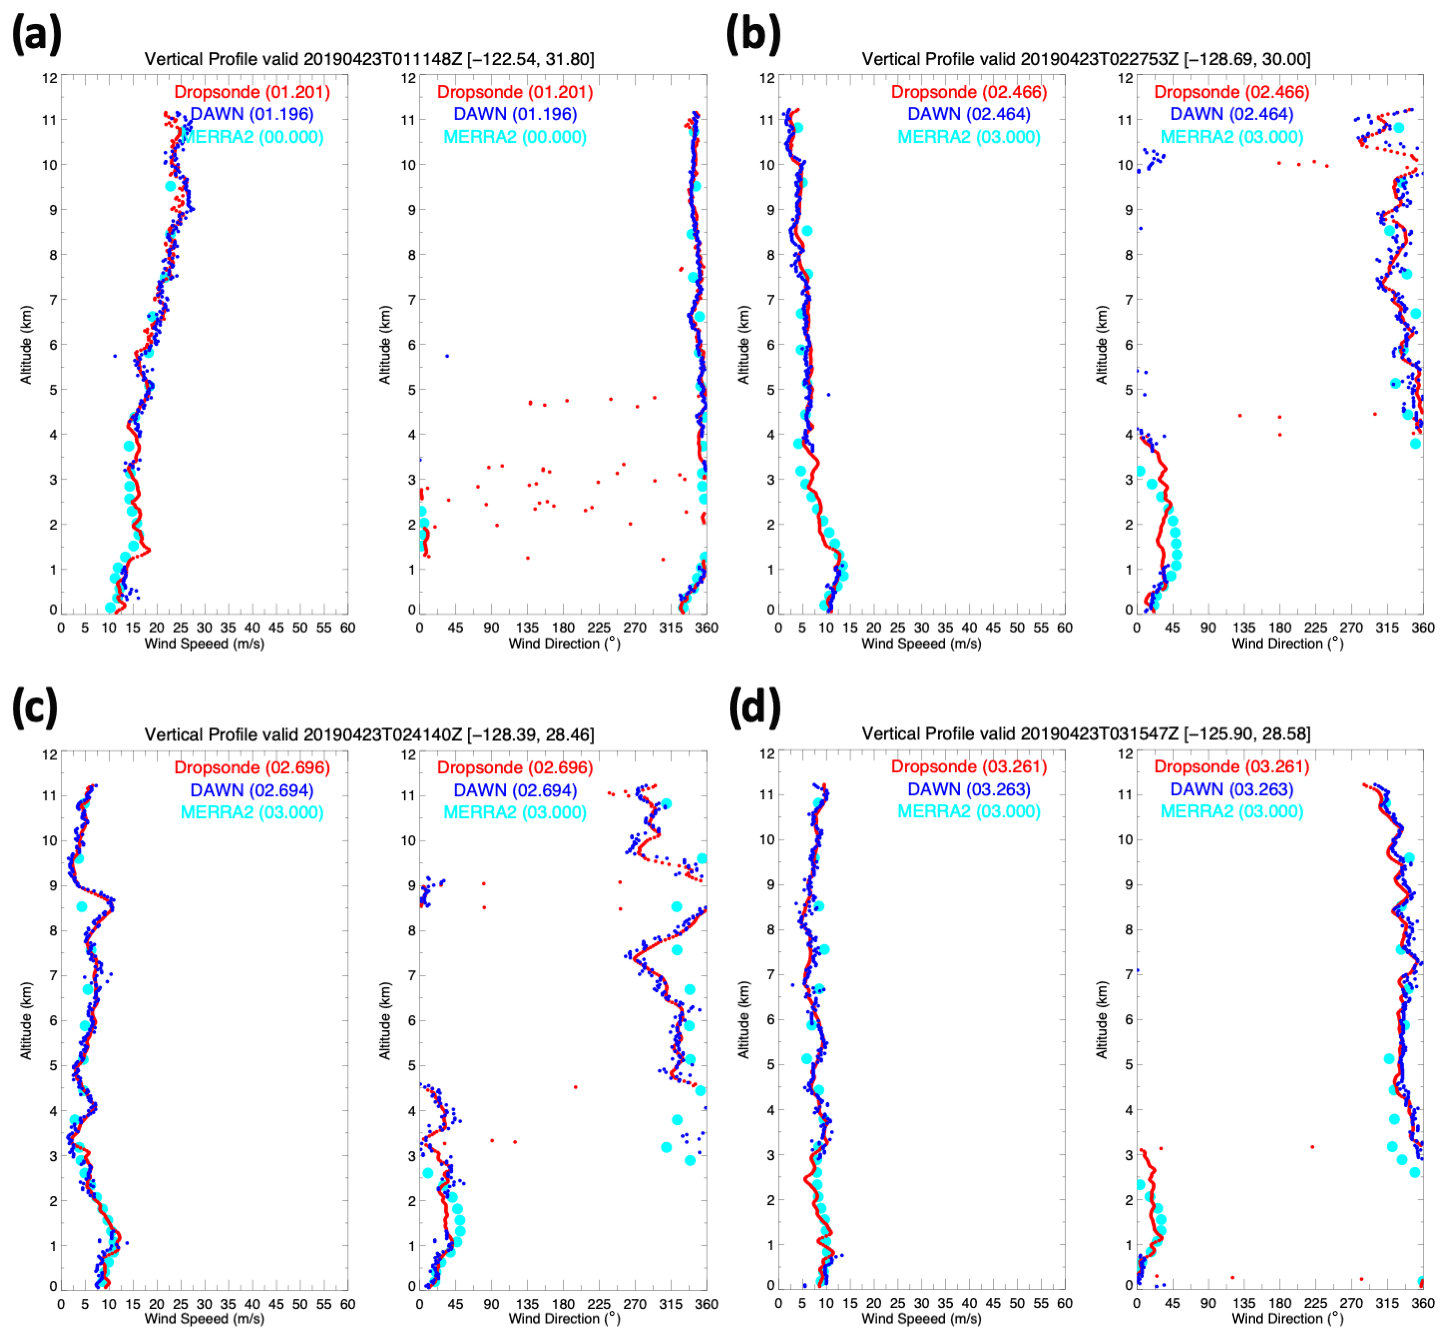
Figure 7Dropsonde (red), DAWN (blue), and MERRA-2 (cyan) for DAWN profiles at (a) 0111, (b) 0227, (c) 0241, and (d) 0315 UTC on 23 April 2019.
After the Aeolus underflight near 02.5 UTC (white arrow; Fig. 1b), the DC-8 proceeded northeast and again encountered the tropopause fold, which exhibited similar vertical structure as the leg 3 h prior during the outbound transit to the Aeolus underpass. The PBL depth and WVMR rose significantly after 04 UTC as the DC-8 transitioned from the ocean back to the land, the spatial gradients of which were depicted by the 6 h GEOS-5 forecast (Fig. 5c and d). Mountain waves of various orientations can be seen along the flight track in the contrast-enhanced GOES-17 WV image (Fig. 8a) after the flight traversed southeast of Santa Catalina Island. Complex wind, WV, and aerosol distributions were present in association with the waves within the 0–4 km layer. A layer of high aerosol backscatter and weak (<5 m s−1) winds was located in the lowest 0.75 km of the cross section from 04 to 04.6 (0400–0436) UTC as the flight approached the Peninsular Range along the California coast (Fig. 8a–c). A shallow layer of ∼12.5 m s−1 westerly wind, with reduced aerosol and drier air (Fig. 8d) around 1 km altitude, was beneath a filament of higher aerosol, weaker winds, and increased moisture that extended up to 2 km. Embedded wave structures can be seen in the aerosol backscatter from 04.4 to 04.6 UTC.
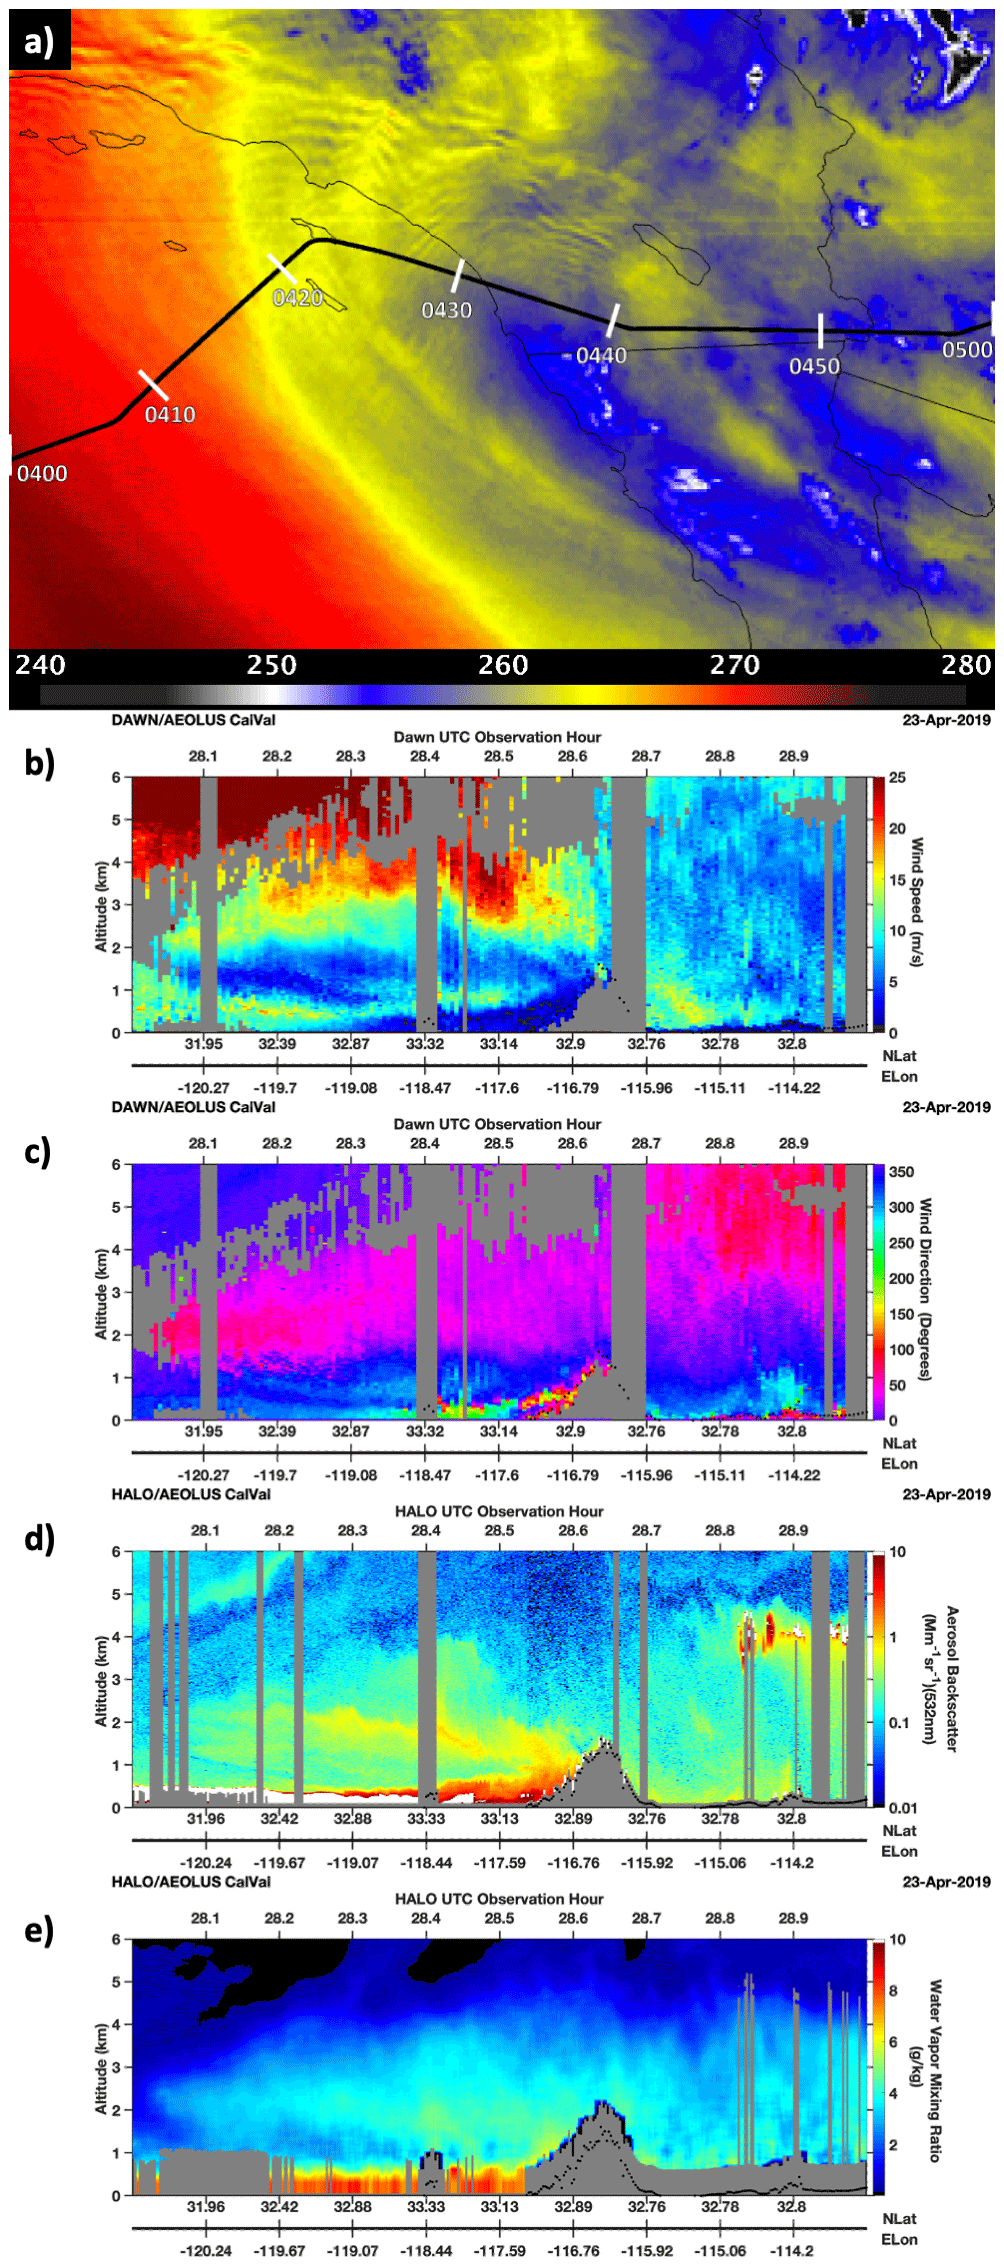
Figure 8(a) GOES 7.3 µm water vapor brightness temperature (in kelvin) at 0426 UTC on 23 April 2019. The color scale of this image has been compressed relative to that shown in Fig. 1 to accentuate mountain wave patterns along the flight track (bold black line). (b, c) DAWN wind speed and direction along the 1 h flight period shown in the GOES image. The wind speed color scale has also been compressed to accentuate wind speed variations associated with the mountain waves. (d) HALO 532 nm aerosol backscatter. (e) HALO water vapor mixing ratio colorized with a linear scale to accentuate details.
As the flight proceeded along the US–Mexico border and then turned northward, it transected near the center of the low-pressure system (Fig. 5a and b). This can be seen in the DAWN wind direction data before and after 05:00 UTC in Fig. 6b, where wind direction changes from northwesterly (magenta) to southeasterly (red to yellow) and wind speed reduced throughout the depth of the column. The GEOS-5 forecast indicated that the PBL height exceeded 3.5 km across southern California and western Arizona (Fig. 5c), which is consistent with HALO-derived MLHs. WVMRs up to 7 g kg−1 and enhanced aerosol backscatter were observed upwards of 4 km altitude over the complex mountainous terrain due to orographic lifting. Deep convection had occurred earlier in the day in Arizona and had decayed by the time the DC-8 sampled the region, leaving the remnant anvil cloud observed in the HALO aerosol backscatter at 05.25 UTC. The low-pressure system was associated with a depression in the tropopause, which reached a 10 km altitude. The stratospheric layer atop this low-pressure system can be seen in the HALO WV data as extremely dry air (<0.007 g kg−1) from ∼04.5 to 05.75 UTC and approximately 3 orders of magnitude drier than the PBL air mass below. This transect through the stratospheric intrusion was an ideal opportunity to showcase the capability of HALO to measure over 4 orders of magnitude in WVMR from the moist PBL to the dry upper troposphere and lower stratosphere.
After sampling the stratospheric intrusion, the flight progressed northward into Utah before turning west across Nevada along the jet streak that was previously sampled across California. Mountain waves were also evident in GOES WV imagery across western Nevada near 06 UTC (Fig. 1b), which can also be seen via wave structures in layers of enhanced aerosol and WV measured by HALO, and there are DAWN wind direction variations that extended up to 9 km altitude. After 06.3 UTC on the western side of the Sierra Madre mountains, the DC-8 flew through the Central Valley region of California while descending to land in Palmdale, where there was a notable enhancement of aerosol backscatter in the PBL with weak wind flow and complex vertical aerosol structures.
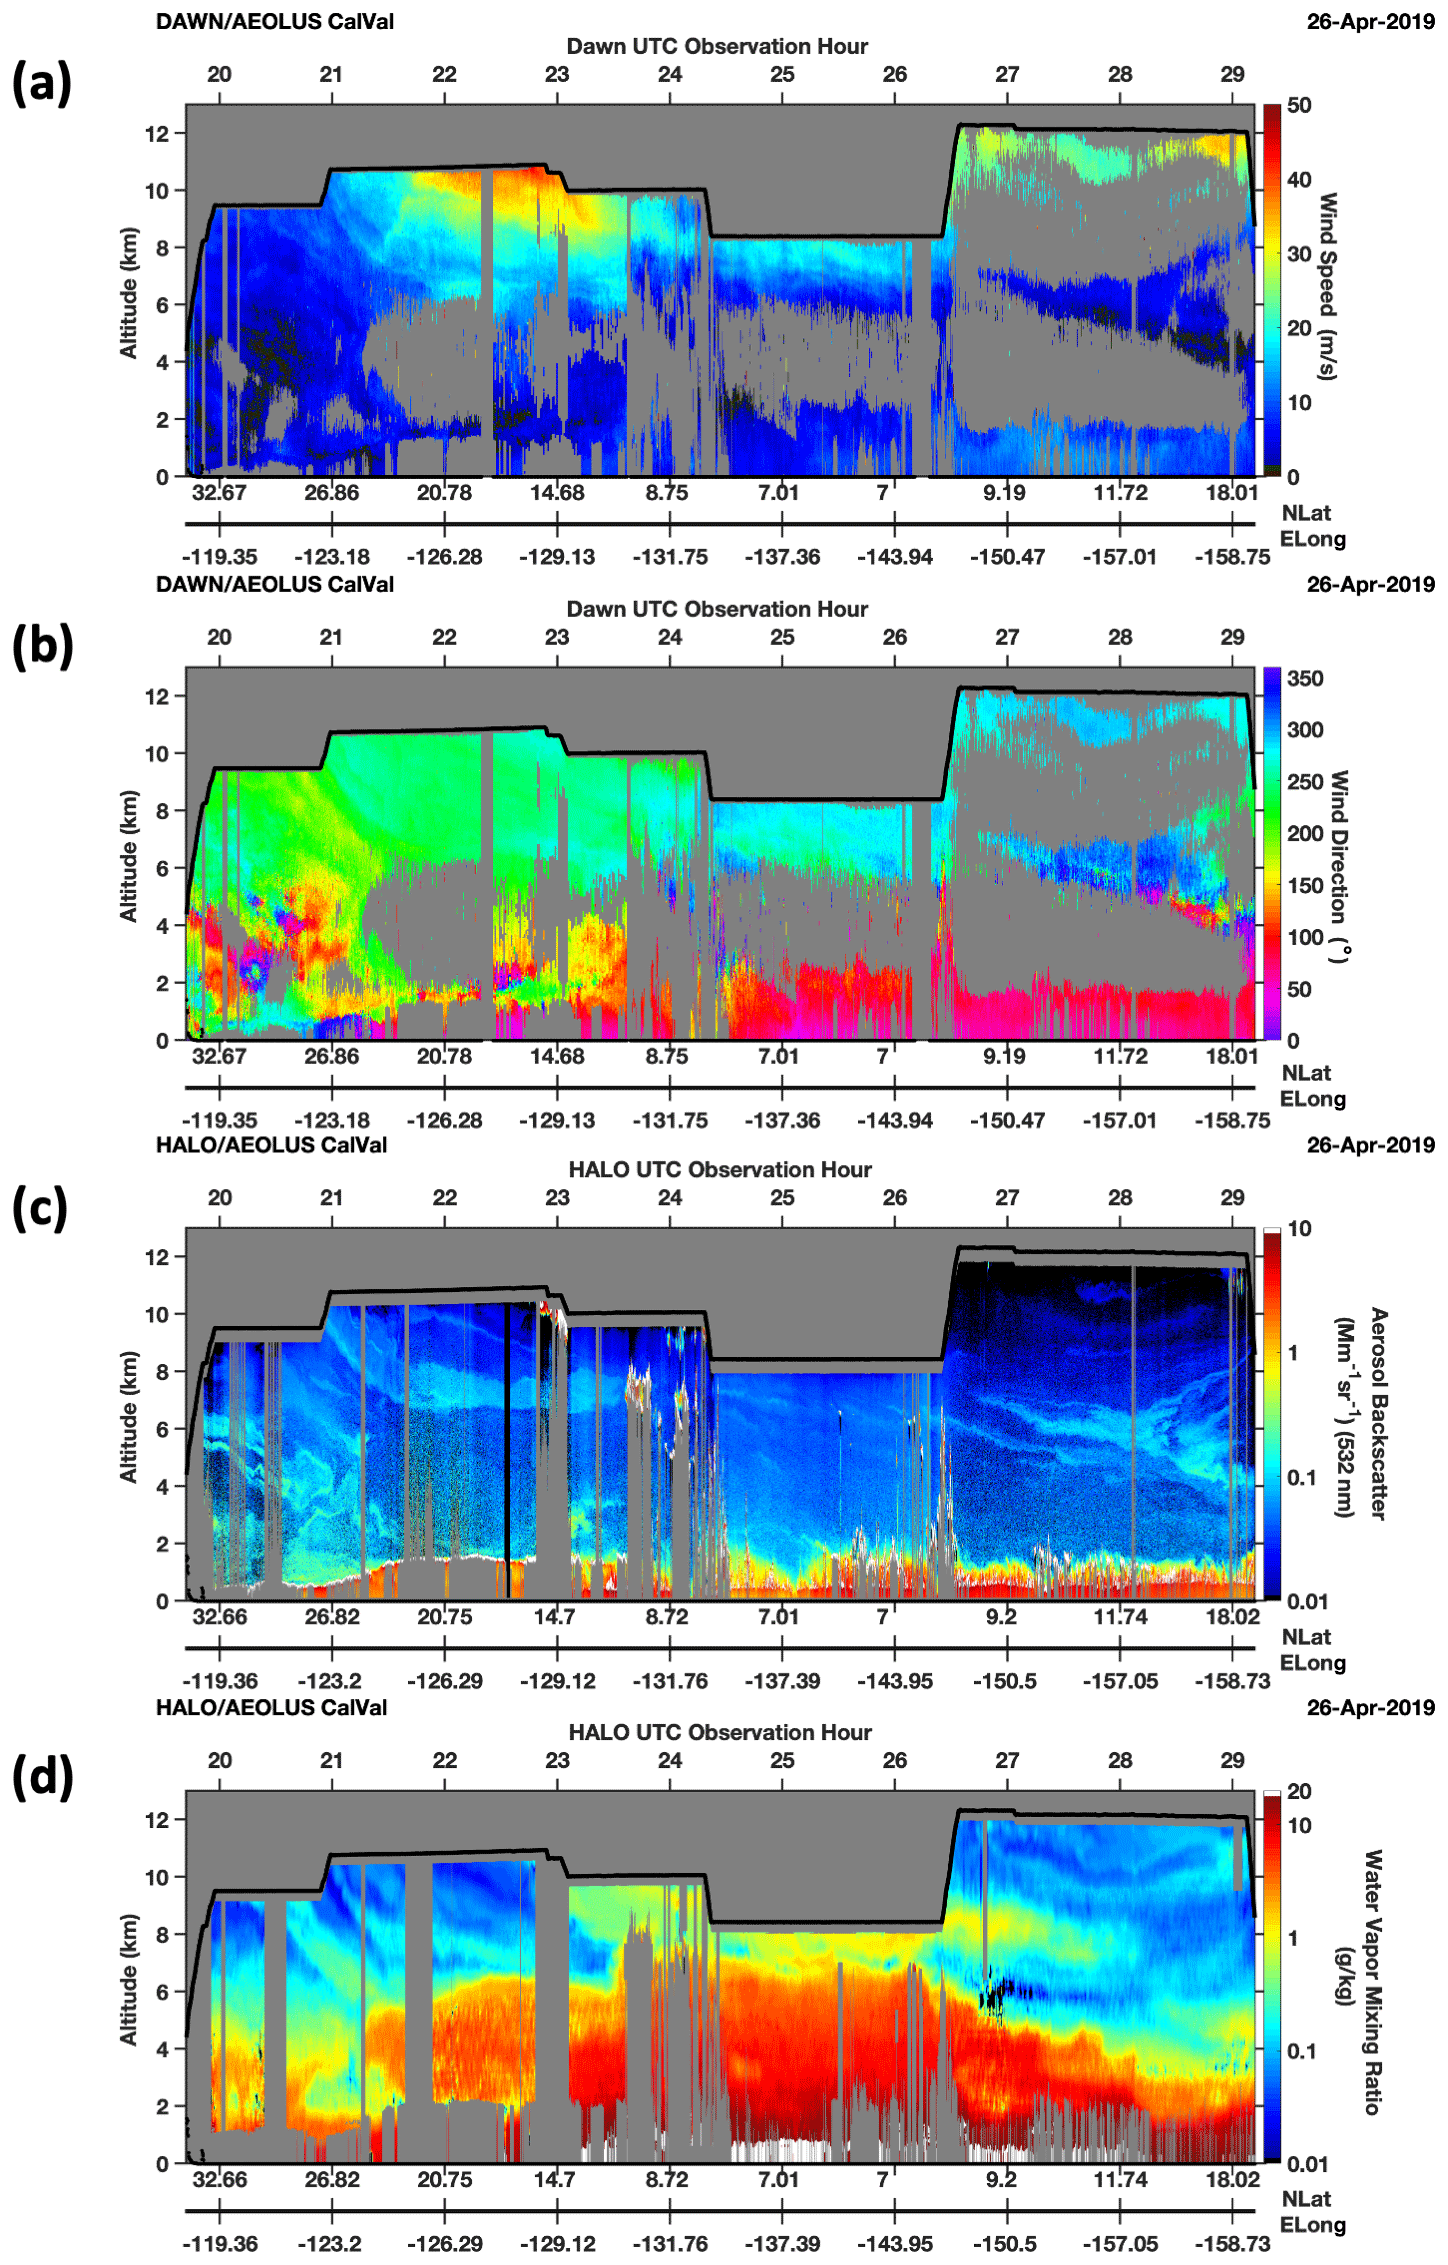
4.3 25–28 April 2019
The goals of the third and fourth flights of the Aeolus campaign focused on evaluating the performance of DAWN and HALO from the midlatitudes to the tropics and also to the transition of wind, WV, aerosol, and cloud fields from the subtropics to the deep tropics. The third flight on 25 and 26 April took a southwesterly heading to 7∘ N, 133∘ W, then descended as it progressed westward through the tropics at an 8 km altitude, before ascending and intersecting with the Aeolus track along a north-northwesterly heading before landing in Kona, Hawaii (Fig. 1c). The subtropical jet stream can be observed in the DAWN wind speed as the DC-8 transitioned from the midlatitude down to the east–west tropical line (Fig. 9a). The tropical jet extends down to approximately 6 km, which correlates extremely well with the top of the elevated moist layer observed in the HALO WV profiles at approximately 22.5 UTC (Fig. 9d). As the DC-8 proceeded westward toward the start of the Aeolus line, the midtroposphere moist layer strengthened and deepened, and a weak overturning circulation associated with convective detrainment could be observed in the WV distributions, evidenced by the moist layer at and above ∼8 km altitude extending northward from the deep tropics. HALO's ability to measure and infer dynamical processes via high vertical resolution WV and aerosol measurements is critical for an improved understanding of the radiative transfer that drives large-scale circulation, which can, in turn, effect low tropospheric stability, cloud formation, and convective aggregation (Stevens et al., 2017; Holloway et al., 2017; Mapes et al., 2017; Lebsock et al., 2017).
Another area of interest during this flight was the long north–south transect from Palmdale to the tropics, where a variety of stratocu morphologies were present along the flight track (Fig. 10a), from closed cell to open cell stratocu in the northern part of the domain (20 to 20.8 UTC), then a combination of clear sky and a small closed cell (20.8 to 21.6 UTC), and, finally, a larger closed cell with a different appearance than the previously observed clouds (21.6 to 22.5 UTC). Though wind speed was generally within the 0–10 m s−1 range within and above these clouds, the wind direction, aerosol, and WV profiles varied significantly, as seen in the DAWN and HALO data in Fig. 10. For example, a relatively moist air mass above the PBL and a shallow PBL depth was associated with the stratocu from 20–20.8 UTC (Fig. 10e and f). Sharp directional wind shear in the 0 to 3 km layer was present around 20.3 UTC during a brief transition to open-cell stratocu (Fig. 10c). Dry, high aerosol backscatter air with slightly higher wind speed was found above the PBL from 20.8–21.6 UTC, leading to clear sky and broken clouds. The PBL depth and cloud top height grew with the differently textured closed cell clouds that were later encountered from 21.6 to 22.5 UTC.
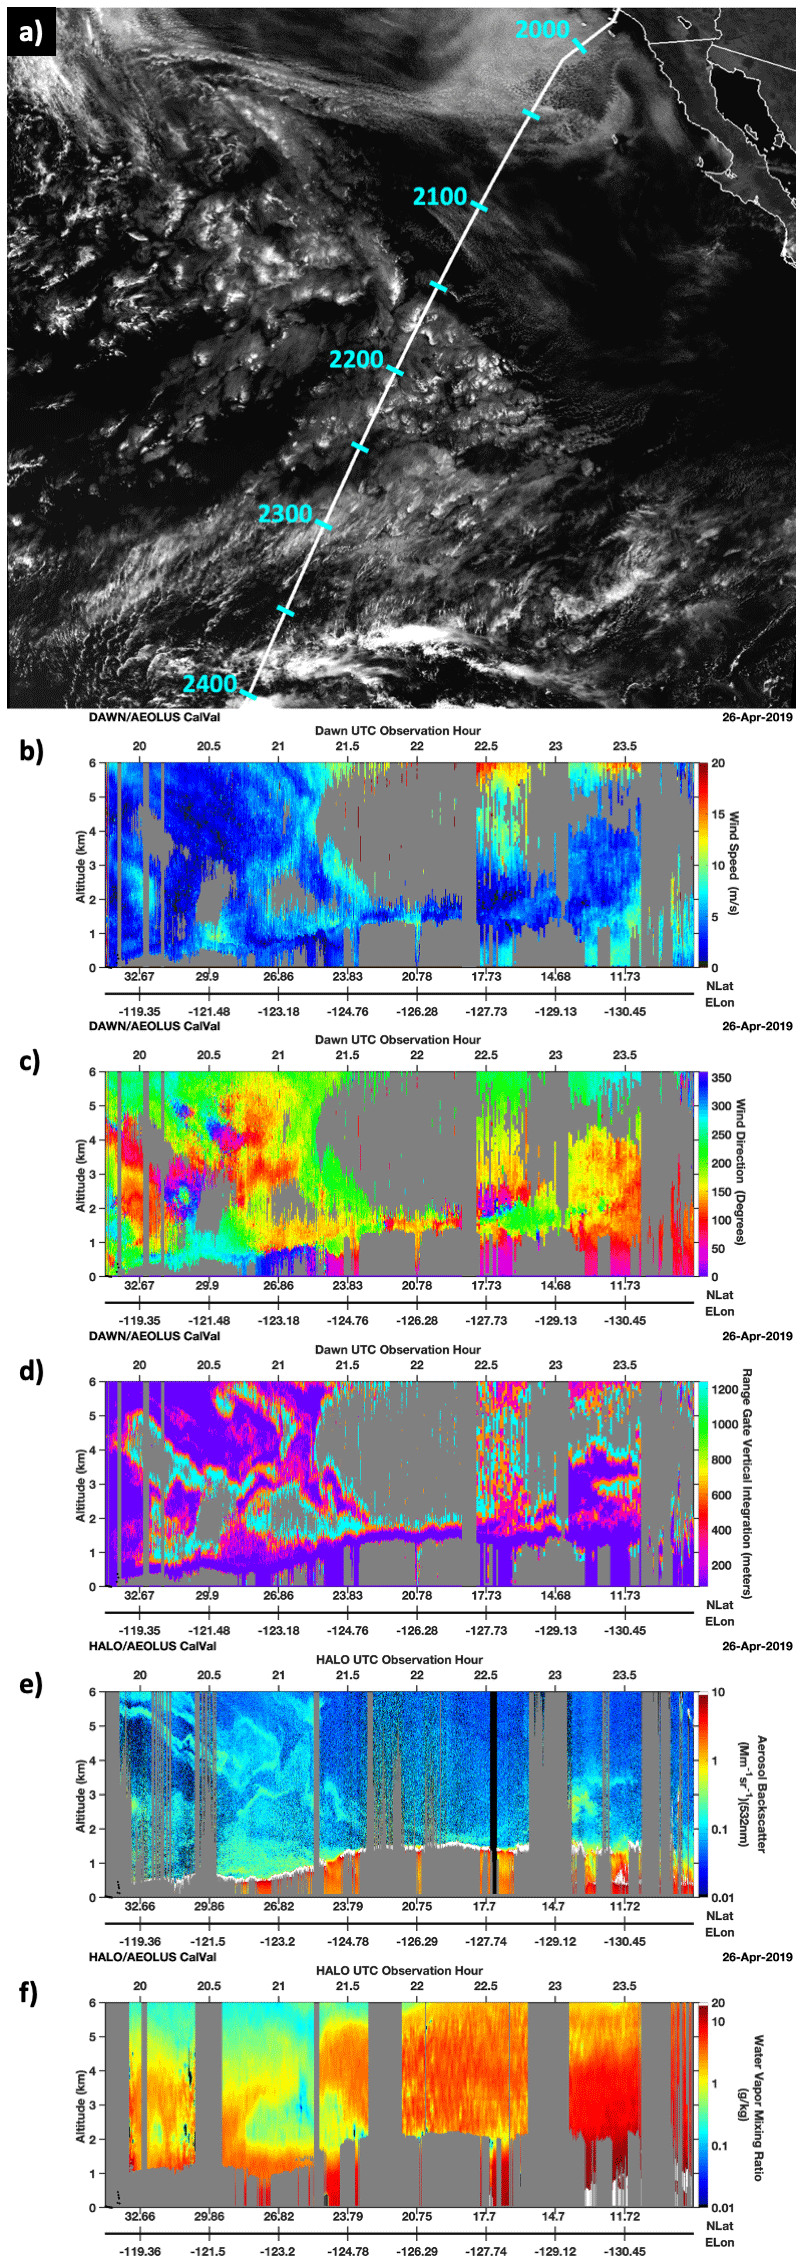
Figure 10(a) GOES-17 0.64 µm visible at 2200 UTC on 25 April 2019 overlain with a nearly 4 h duration DC-8 flight track over stratocu and tropical convection. (b, c) DAWN wind speed and direction. The DAWN wind speed color scale was compressed to 0–20 m s−1 to accentuate wind speed variations along the flight track. Only data between 0 and 6 km altitude are shown. (d) The depth of vertical signal integration required to achieve sufficient signal for a DAWN wind retrieval. (e, f) HALO 532 nm aerosol backscatter and water vapor mixing ratio.
Prior to 22:00 UTC, thin cirrus associated with the subtropical jet stream were encountered at flight level, which inhibited HALO profiling below 6 km. Cirrus were also encountered later in the flight at around 23, 01, and 03–05 UTC. Additionally, ice accretion on the HALO window resulted in significant near-field signal and contaminated the 532 nm cross-polarization channel. Similar near-field signals were also observed on the subsequent return flight from Kona back to Palmdale. As a result, the HSRL measurement for both of the tropical flights is limited to only use the co-polarization channels, resulting in limited retrievals of aerosol intensive parameters such as depolarization, spectral depolarization ratio, and aerosol type. In order to increase sensitivity and enable wind retrieval in low aerosol conditions encountered after 21.25 UTC correlated with increasing moisture within a subtropical air mass, DAWN was operated in a 2 azimuth, 200 pulse per azimuth mode from 22.4 to 23.6 UTC. This change helped to provide greater vertical coverage of winds at middle levels of the cross section, though Fig. 10d shows that vertical integration at a variety of depths was still required to achieve sufficient signal for wind retrieval. A sonde was released at 22.6 (2236) UTC, where HALO observed weak aerosol signal in the 1.5 to 6 km layer. Despite this weak signal and the vertical integration required to achieve enough signal for wind retrieval, DAWN retrieved a full wind profile that agreed well with a sonde (Fig. 11).

Figure 11Dropsonde (red), DAWN (blue), and MERRA-2 (cyan) for DAWN profiles at 2235 UTC, on 25 April 2019, in an air mass with weak aerosol signal within the 2–6 km altitude layer when DAWN was operating in 2 azimuths, 200 pulse per azimuth mode.
As noted above, after 23 UTC, deep tropical moisture was observed by HALO, with mixing ratios exceeding 20 g kg−1 near the surface and exceeding 6 g kg−1 up to 6 km. The enhanced moisture content in the middle troposphere could be seen in GOES WV imagery via colder temperature, indicating WV absorption from higher altitudes (Fig. 1c). The tropical air mass featured weak aerosol scattering above 2 km, which generally inhibited wind profiling within the 2–6 km layer. After 02 UTC, the plane ascended as it moved northwestward to head toward the Aeolus track. GOES WV imagery showed a sharp transition from moist to dry conditions as the aircraft crossed 10∘ N. This drying can be seen in the HALO data, where the mixing ratio decreased from above 5 to below 1 g kg−1 above 4 km. An aerosol layer was present at 6 km, which enabled wind retrieval for comparison with the Aeolus overpass in the 04–05 UTC time frame.
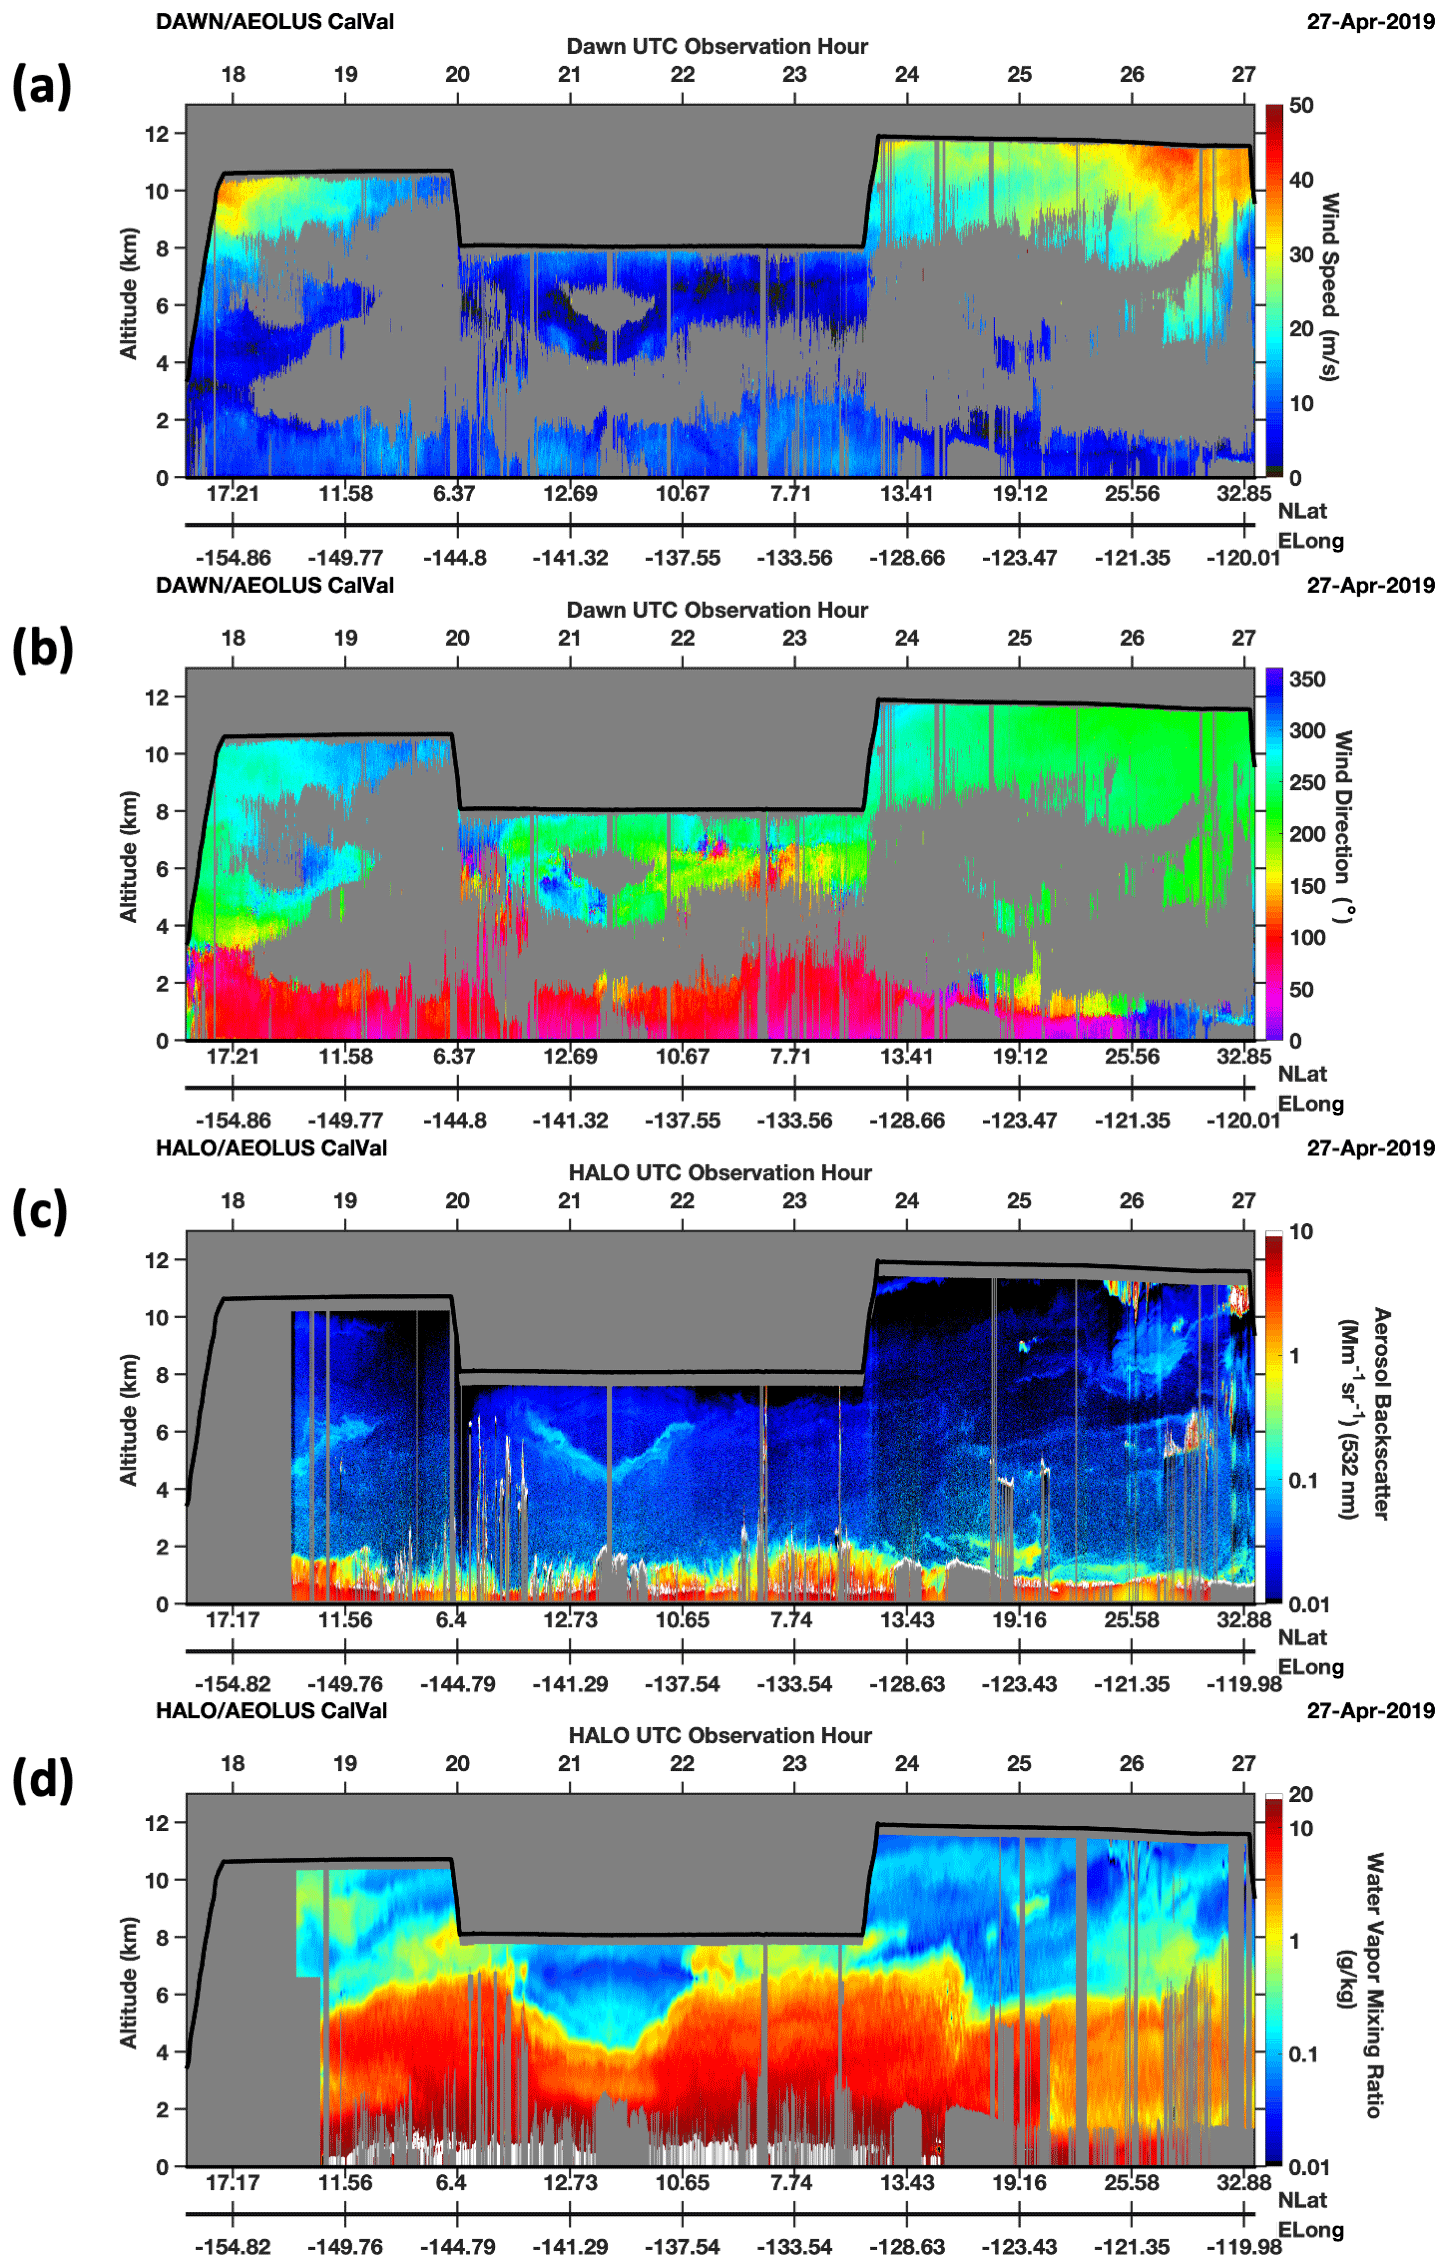
The 27 and 28 April flight from Kona featured similar conditions to the 25 and 26 April flight, with tropical moisture within and above the PBL in a relatively clean atmosphere void of significant aerosol enhancements. This flight was designed to transect through the northern half of the ITCZ (intertropical convergence zone) in an attempt to sample the ascending branch of the Hadley circulation (Fig. 1d). Furthermore, several diagonally oriented transects allowed for testing and optimization of the HALO DIAL measurements over a wide range of mid–lower tropospheric WV concentrations, demonstrating the ability of the WV DIAL to optimize the WV absorption as a function of latitude and moisture content. Although HALO was able to demonstrate the required spectral tuning to maintain good measurement precision over the midlatitude and subtropical environments, the required amount of spectral tuning necessary for precise measurements in the tropics was not achieved. This was overcome by increasing the vertical averaging within the lower free troposphere and PBL from 315 to 585 m. The additional spectral tuning required to achieve high precision and vertical resolution in the tropics is currently under investigation and will be implemented for future campaigns.
The DAWN and HALO wind, WV, and aerosol backscatter cross sections are shown in Fig. 12. The subtropical jet was observed by DAWN, with upper level winds exceeding 30 m s−1 above 10 km (Fig. 12a). DAWN data show good vertical coverage despite the low aerosol loading throughout the middle free troposphere (Fig. 12c). As with the previous flight, the HALO WV and aerosol fields show a high level of correlation where the vertical gradients of WV enhancements throughout the midtroposphere were often correlated with gradients in aerosol backscatter (Fig. 12c and d). These gradients are likely associated with advected air masses and show the utility of using WV and aerosol fields as atmospheric tracers for large-scale motion. As with the 25 and 26 April flight, moistening of the midtroposphere was observed as the DC-8 approached the ITCZ. The HALO WV cross sections near the tropics around 20 UTC (∼6∘ N) again show evidence of overturning circulation to the higher latitudes resulting from convective midlevel detrainment near the ITCZ.
4.4 29 and 30 April 2019
The final flight of the campaign sampled a similar geographic region to the oceanic portion of the 22 and 23 April flight and was focused on analyzing atmospheric spatial and temporal variability, instrument performance, and dropsonde and HALO WV profile validation (Fig. 1e). The flight began with a segment beneath 5 km, extending into southeastern California, near to regions of developing convection within an upper-level low. HALO WV mixing ratio in this region reached 8 g kg−1, which provided sufficient moisture for the development of deep convection (Fig. 13d). The aircraft ascended to above 9 km and crossed through the western edge of the cyclonic circulation, where a deep layer of northerly winds exceeding 20 m s−1 were present (Fig. 13a).
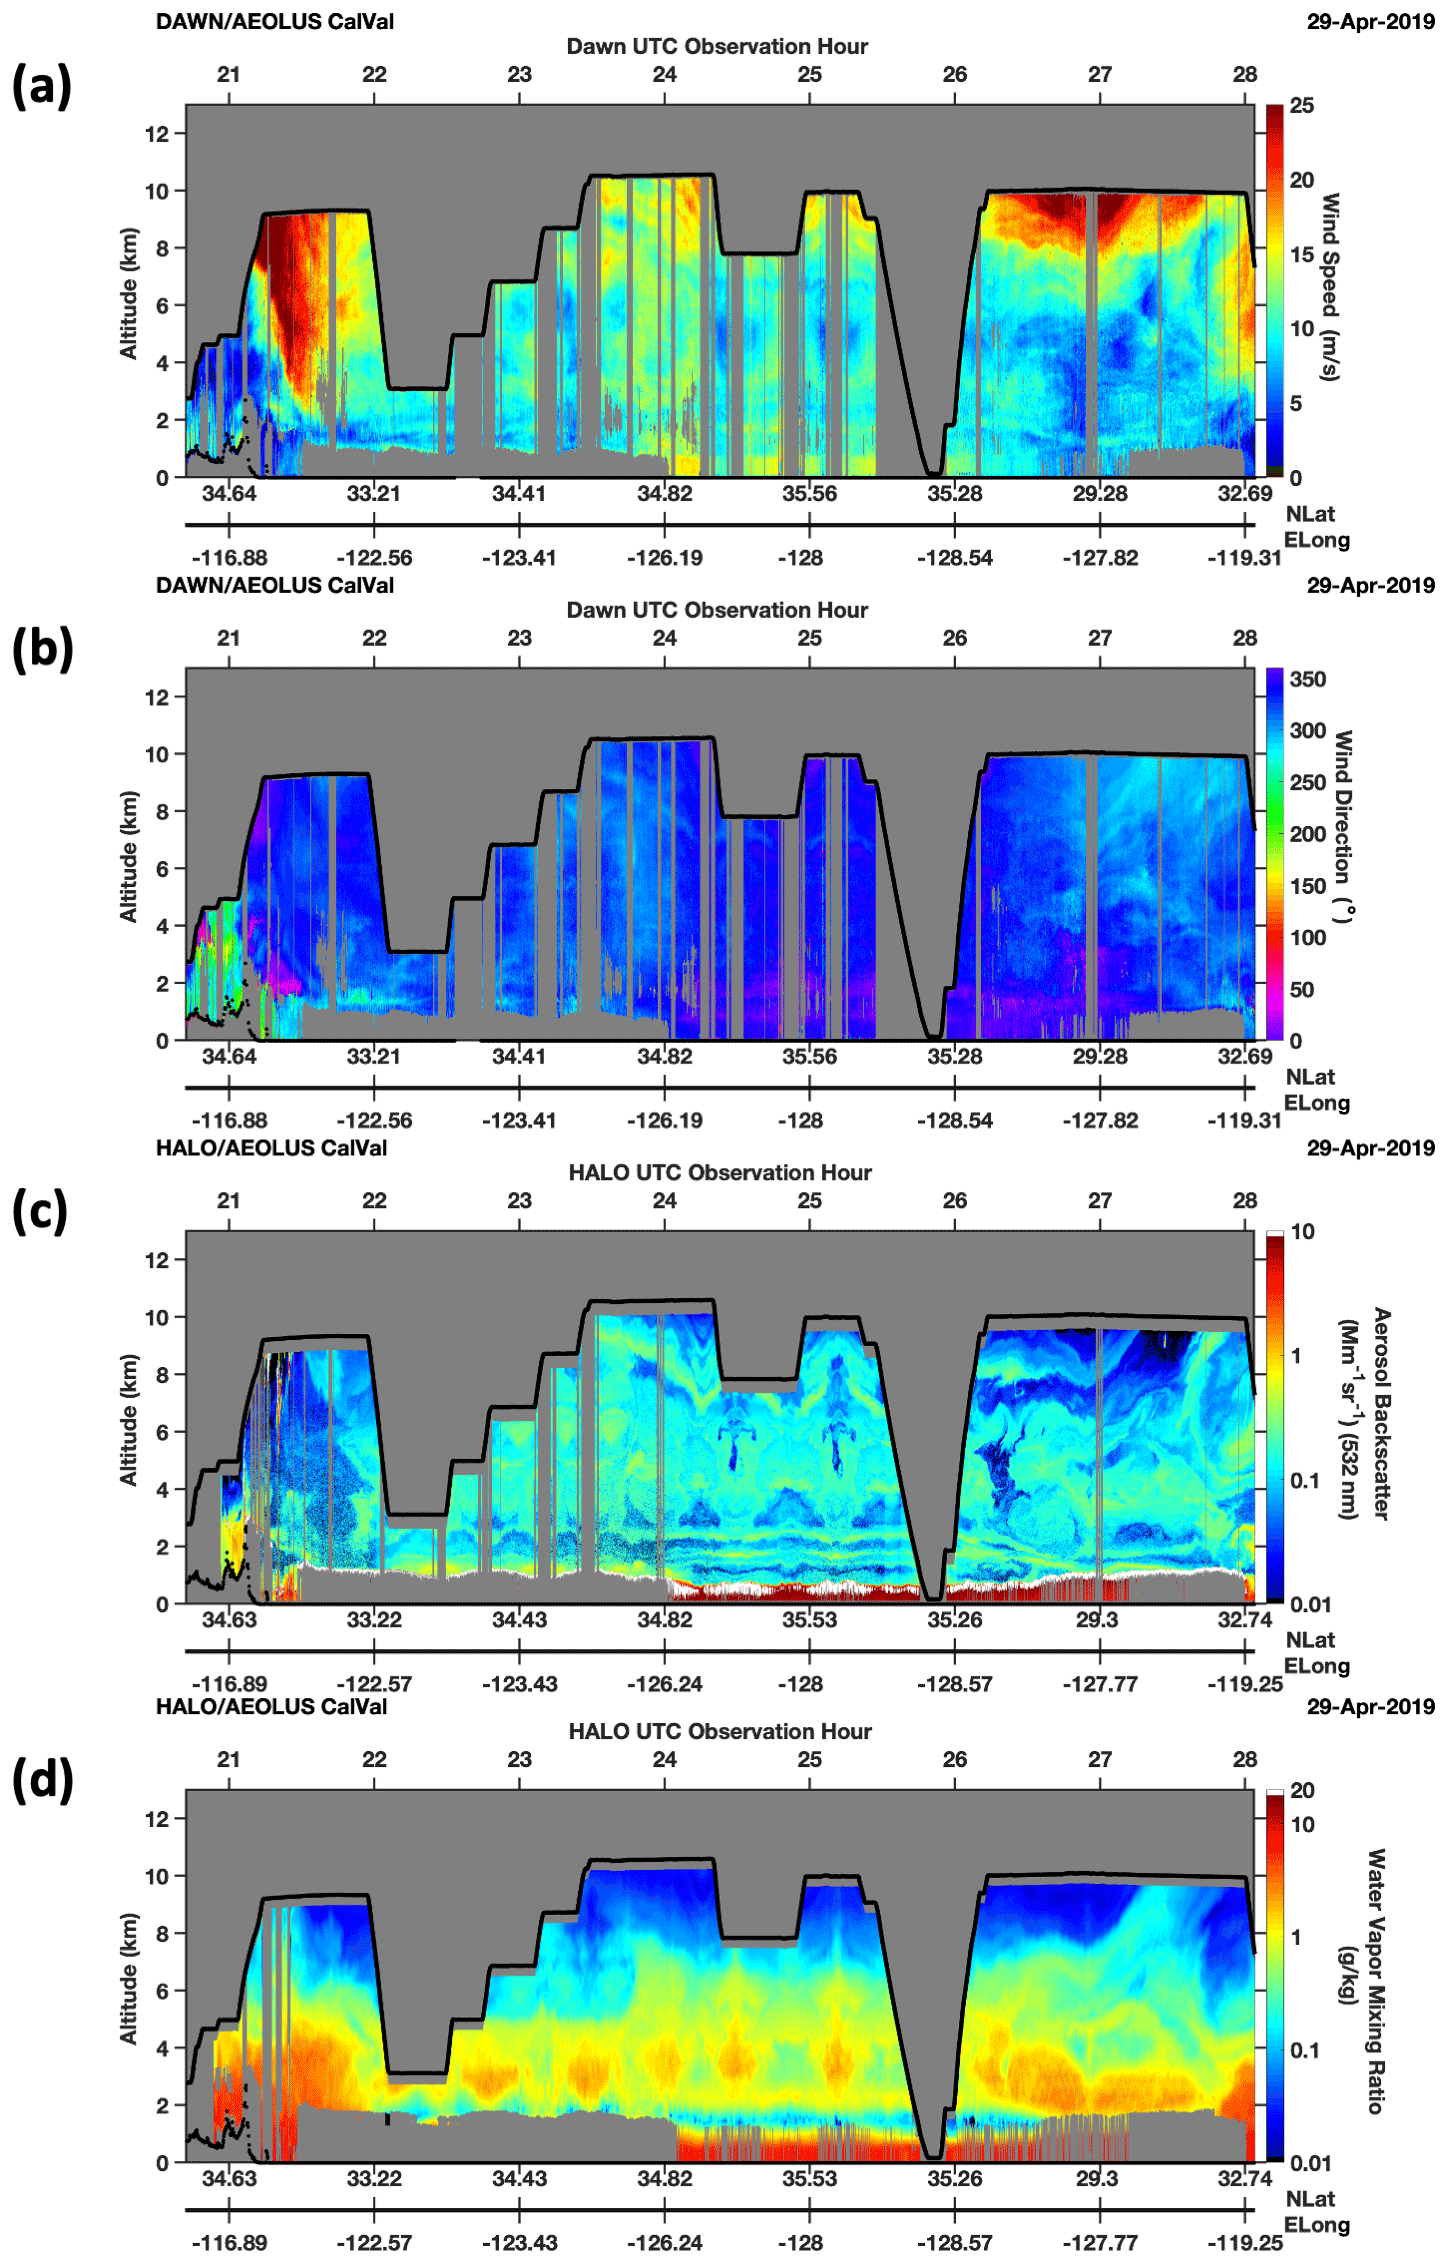
Figure 13The same as Fig. 6 except for the 29 and 30 April 2019 flight. The color scale of the DAWN wind speed is compressed to 0 to 25 m s−1 to accentuate the lower wind speeds observed during this flight.
The flight progressed to a region with optically thick and spatially uniform stratocu where the aircraft decreased altitude to near 3 km above sea level. The aircraft carried out a stair-step flight pattern at five different altitudes over this same region (region indicated by circles at the center of the GOES imagery in Fig. 1e), ascending by approximately 1.8 km in flight level with each pass. The intent of this flight pattern was to look at the repeatability of the lidar measurements over the same air mass and also to assess the DAWN sensitivity to aerosol backscatter with increasing flight altitude. The HALO WV and aerosol observations show very persistent, repetitive patterns as the aircraft transected the same region at different altitudes (Fig. 13c and d). Extremely dry air was present just above the stratocu tops near 2 km within a strong capping inversion (not shown), a feature which was pervasive throughout the flight and could have been caused by a combination of radiative cooling near cloud top and subsidence, similar to the 18 April flight. The symmetry is not quite as prominent in the DAWN data due to frequent turns, but it can be seen that winds were continually retrieved from the aircraft to stratocu cloud top until the aircraft reached 10.5 km altitude.
The flight left this stratocu region around 23.75 UTC and progressed westward to another area with clear sky to broken clouds at 0.25 UTC (24.25 UTC on the lidar time series) to carry out lidar overpasses near an in situ spiral location to validate the HALO WV measurements against the DLH open path measurements. As the DC-8 approached the sampling area, it was vectored by air traffic control, which resulted in altitude changes around 0.3 and 0.8 UTC. The aircraft descended to 8 km, flew over this region, and then ascended to 10 km and again flew over the same region. A sonde was released during both transects, with one corresponding to the center of the north–south leg and the other closer to the location of a spiral near the north end of the leg. Upon a final pass near the sampling region on the north end of the leg, the aircraft spiraled from the flight altitude at ∼10 km down to ∼150 m above the ocean surface. During this time, the NASA LaRC DLH instrument was collecting in situ WV observations which were used to assess the performance of the HALO- and sonde-derived WV profiles within the same region.
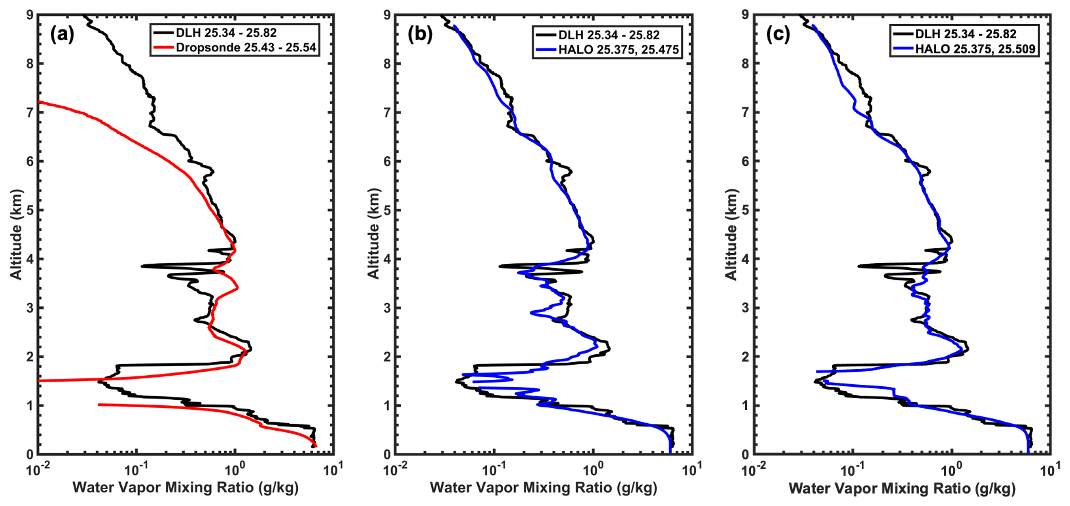
Figure 14HALO and dropsonde comparisons with DLH. (a) Yankee XDD dropsonde (red) comparison against DLH-derived WVMR profile (black) from the descending DC-8 spiral. The time of flight for the sonde and those also used to generate the DLH profile are indicated in the legend. (b) HALO 315 m vertical and 12 km horizontal resolution WV profile (blue) comparison against DLH. There are two HALO profiles spliced together using the times indicated in the legend to account for the heterogeneity in the WV field over the spiral location and to account for the spatial offset between the HALO and DLH in situ spiral. Panel (c) is the same as panel (b) but with a different profile chosen for the lower tropospheric splice region. Data are shown on a logarithmic scale to highlight the large dynamic range throughout the depth of the profile.
Examples of these comparison profiles between the three measurements during the descending leg of the spiral are shown in Fig. 14. Figure 14a shows the comparison between the sonde and the DLH profile. As previously discussed, the slow response time of the humidity sensor after deployment from the DC-8 limited meaningful observations until ∼5 km above the surface. The damped response time is also evident throughout the lower troposphere, resulting in disagreement in the prominent features compared to DLH. It should, however, be noted that the moisture field within the comparison region was quite variable, and some of the disagreement could result from mismatch in sampling volumes between the two measurements. It should also be noted that only the edge of the in situ spiral overlapped with the multiple DC-8 remote sensing tracks, and that the location of the spiral was also offset to the northern end of the track. Furthermore, the diameter of the in situ spiral was approximately one-quarter of the width of the entire comparison track, and substantial variability was observed within this volume, which could explain the high-frequency variability in the DLH data around 4 km.
Figure 14b and c show the comparison between the HALO and DLH WV measurements at two different locations along the remote sensing tracks. These comparisons were carried out at the higher 315 m vertical resolution as there was sufficient aerosol loading throughout the troposphere allowing for higher resolution retrievals. For each comparison, two independently retrieved profiles were joined using a 315 m weighted average. This was carried out to overcome the mismatch in the sampling volumes and the variability in the WV field along the aircraft track and provide a fair comparison between the two measurements. The top portion of the profile for the comparisons in Fig. 14b and c are from 0123 UTC and extend to the highest altitude right before the start of the spiral. In both comparisons, the top profile is used until the bottom profile is available, at which point the 315 m weighted average is carried out. The weighted average is applied from 8154 to 7839 m and 7090 to 6775 m for the comparisons in Fig. 14b and c, respectively. As discussed above, the comparisons with the DLH in situ open-path measurement conducted during a spiral showed good agreement with an average percent difference above 4.5 and below 1 km (PBL) of approximately 5 %. Statistics between 1 and 4.5 km are omitted here due to the sparse sampling statistics and large variability within the in situ sampling volume. The limited comparison between HALO and DLH shows very good agreement and provides confidence in the validity of the measurements throughout the duration of the Aeolus campaign. A HALO WV validation paper is currently being prepared and will provide further details on HALO performance with independent in situ and space-based observations.
After completing the descending in situ profile, the aircraft spiraled upward to 10 km and reached the Aeolus overpass at 02.2 UTC, where it stayed along the overpass track until near 03 UTC. Very intricate structures in the WV, aerosol, and wind fields were observed along the entire Aeolus underpass. Winds gradually accelerated to near 30 m s−1 along the overpass, where a narrow jet streak with very low aerosol backscatter conditions was sampled near 3 UTC. This jet streak also resulted in the transport of moisture from the mid–lower troposphere to the aircraft altitude (see the layer between 03–04 UTC above 8 km). The DC-8 then proceeded directly back to Palmdale to complete the flight campaign.
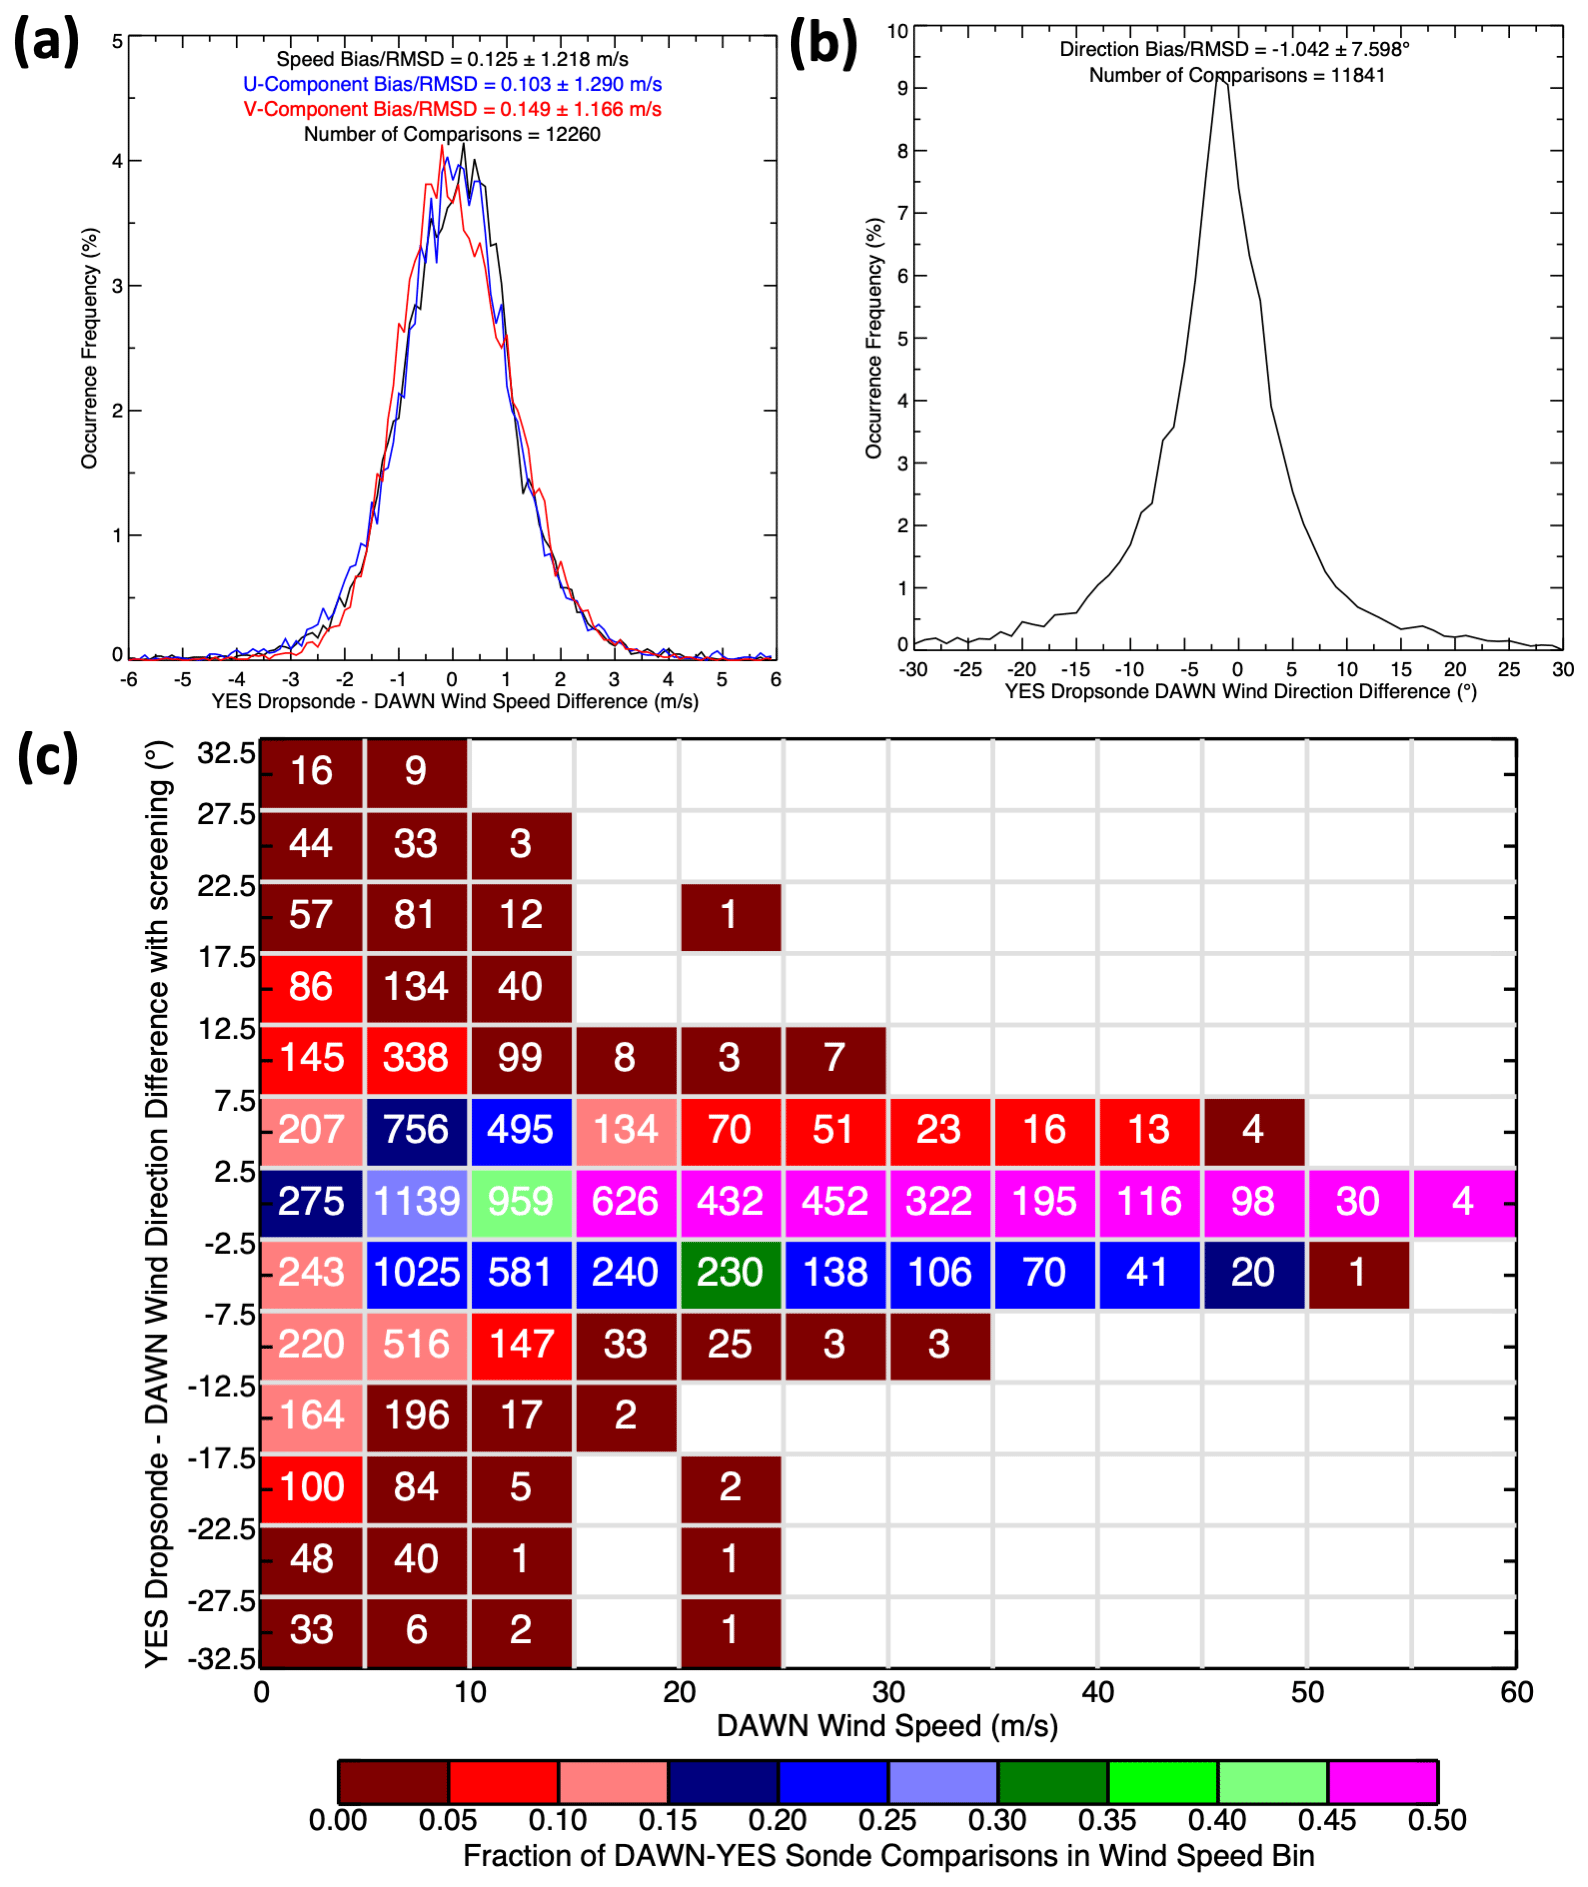
Figure 15A comparison of DAWN and dropsonde vector wind speed (black), and u- and v-component speed (blue and red, respectively) a) and direction (b) aggregated across all vertical bins with a valid DAWN retrieval, using the methods described in Sect. 2.3. (c) DAWN-sonde wind direction difference as a function of wind speed, clustered into 5∘ and 5 m s−1 bins. Bins are colored by the fraction of observations within a bin relative to the total samples in each column. The number of samples is listed within each bin.
4.5 DAWN validation
Figures 4, 7, and 11 show that DAWN winds agreed quite well with sonde, regardless of wind speed, though some differences are evident. Differences should not necessarily be interpreted as errors because DAWN and sonde measure winds at differing spatiotemporal scales, in addition to the fact that sondes drift away from the aircraft flight track into regions not sampled by DAWN. Histograms of DAWN–sonde wind speed and direction differences are shown in Fig. 15a and b, based on the comparison of 61 time-matched sondes encompassing up to 12 260 DAWN vertical levels. Both the wind speed and directional accuracy (e.g., bias) were minimal at 0.12 m s−1 and 1.02∘, respectively. Precision (i.e., root mean squared difference or RMSD) was 1.22 m s−1 and 7.6∘ for speed and direction, respectively. Wind direction precision decreased with decreasing wind speed and was lowest for wind speed less than 5 m s−1 (Fig. 15c). This is to be expected, given that weak wind flows can have variable wind direction over the typical observation and comparison periods discussed here. For example, the sonde wind direction profile deviated from DAWN quite significantly in the 6–7 km altitude layer (Fig. 4d) where wind speeds less than 2.5 m s−1 were measured. It is unclear to what extent the sonde can precisely measure wind direction at very slow wind speed, so we feel that the use of a 30∘ gross outlier filter is justified. Wind component differences from the sonde ranged from 1.17 (v component; red line) to 1.29 m s−1 (u component; blue line), which differed from the 2017 CPEX campaign (Greco et al., 2020) where ∼1.6 m s−1 RMSD for both components were found. However, sondes were released within and near the convection, during CPEX 2017, where increased spatial wind variability occurs, relative to the more quiescent conditions during the Aeolus Cal/Val campaign. These results further reinforce the conclusion of Greco et al. (2020), in that coherent airborne Doppler wind lidar can deliver, to the atmospheric research and operational forecasting communities, a low-bias wind profile from 10+ km altitude with a high vertical resolution every 2–10 km along the ground track (aircraft airspeed dependent), aerosols and clouds permitting. The combination of the high resolution, accuracy, and precision of the DAWN and HALO data, makes these data extremely useful for atmospheric and cloud process studies and Aeolus validation.
4.6 DAWN comparisons with Aeolus
Aeolus Level 2b Rayleigh clear HLOS and DAWN HLOS cross sections and profile comparisons with sonde at the time of the Aeolus overpass from the 30 April flight are shown in Fig. 16a and b. Due in part to the issues described in Sect. 2, and the fact that Aeolus is measuring winds from a 320 km orbit distance, the Aeolus cross section shows much greater random variability than the DAWN cross section. This is further depicted in the profile comparison (Fig. 16c), where a 90 km mean DAWN profile and sonde wind speed profile (projected to the Aeolus LOS), agree extremely well, but Aeolus often falls outside of the variance in each Aeolus vertical layer measured by DAWN. Rayleigh clear HLOS and DAWN HLOS cross sections for the other four flights are shown in Fig. 17, which again illustrates random variability in the Aeolus data relative to the more smooth and spatially coherent DAWN winds. A scatter diagram of Aeolus Level 2b and DAWN HLOS comparisons is shown in Fig. 18, encompassing 231 vertical levels of Aeolus Rayleigh clear and 42 levels of Mie cloudy vertical bins using methods described in Sect. 2.4. Aeolus Rayleigh clear had a high wind speed bias of 1.19 m s−1 and a RMSD of 5.14 m s−1. Aeolus Mie cloudy had a high bias of 1.98 m s−1 and RMSD of 4.68 m s−1. As mentioned in Sect. 2.4, it should be noted here that the validated Aeolus Level 2b data set is known to contain wind speed biases caused by an imperfect telescope temperature management along the orbit and from orbit to orbit, pending the top-of-atmosphere total radiance variability. This has been shown from ECMWF model observation monitoring and from comparisons with ground-based and radiosonde observations (Martin et al., 2020). These results differ from those reported by Witschas et al. (2020) during WindVal III and AVATARE, which could be caused by a variety of factors, including differences in Aeolus laser pulse energy and latitude, longitude, and time-dependent telescope temperature issues at the time of the campaigns, wind conditions being sampled, sample size, and criteria used to construct the Aeolus airborne wind lidar match database. As mentioned previously, since the time that this Aeolus data was produced, numerous corrections to address various instrument and data issues have been developed. Extensive validation of Aeolus is not possible here due to the relatively small sample size of co-located data and preliminary nature of the Aeolus products. We expect that future reprocessing of Aeolus data with improved bias correction and also greater output power from Aeolus laser B will result in better data quality with improved agreement with air- and ground-based wind observations.
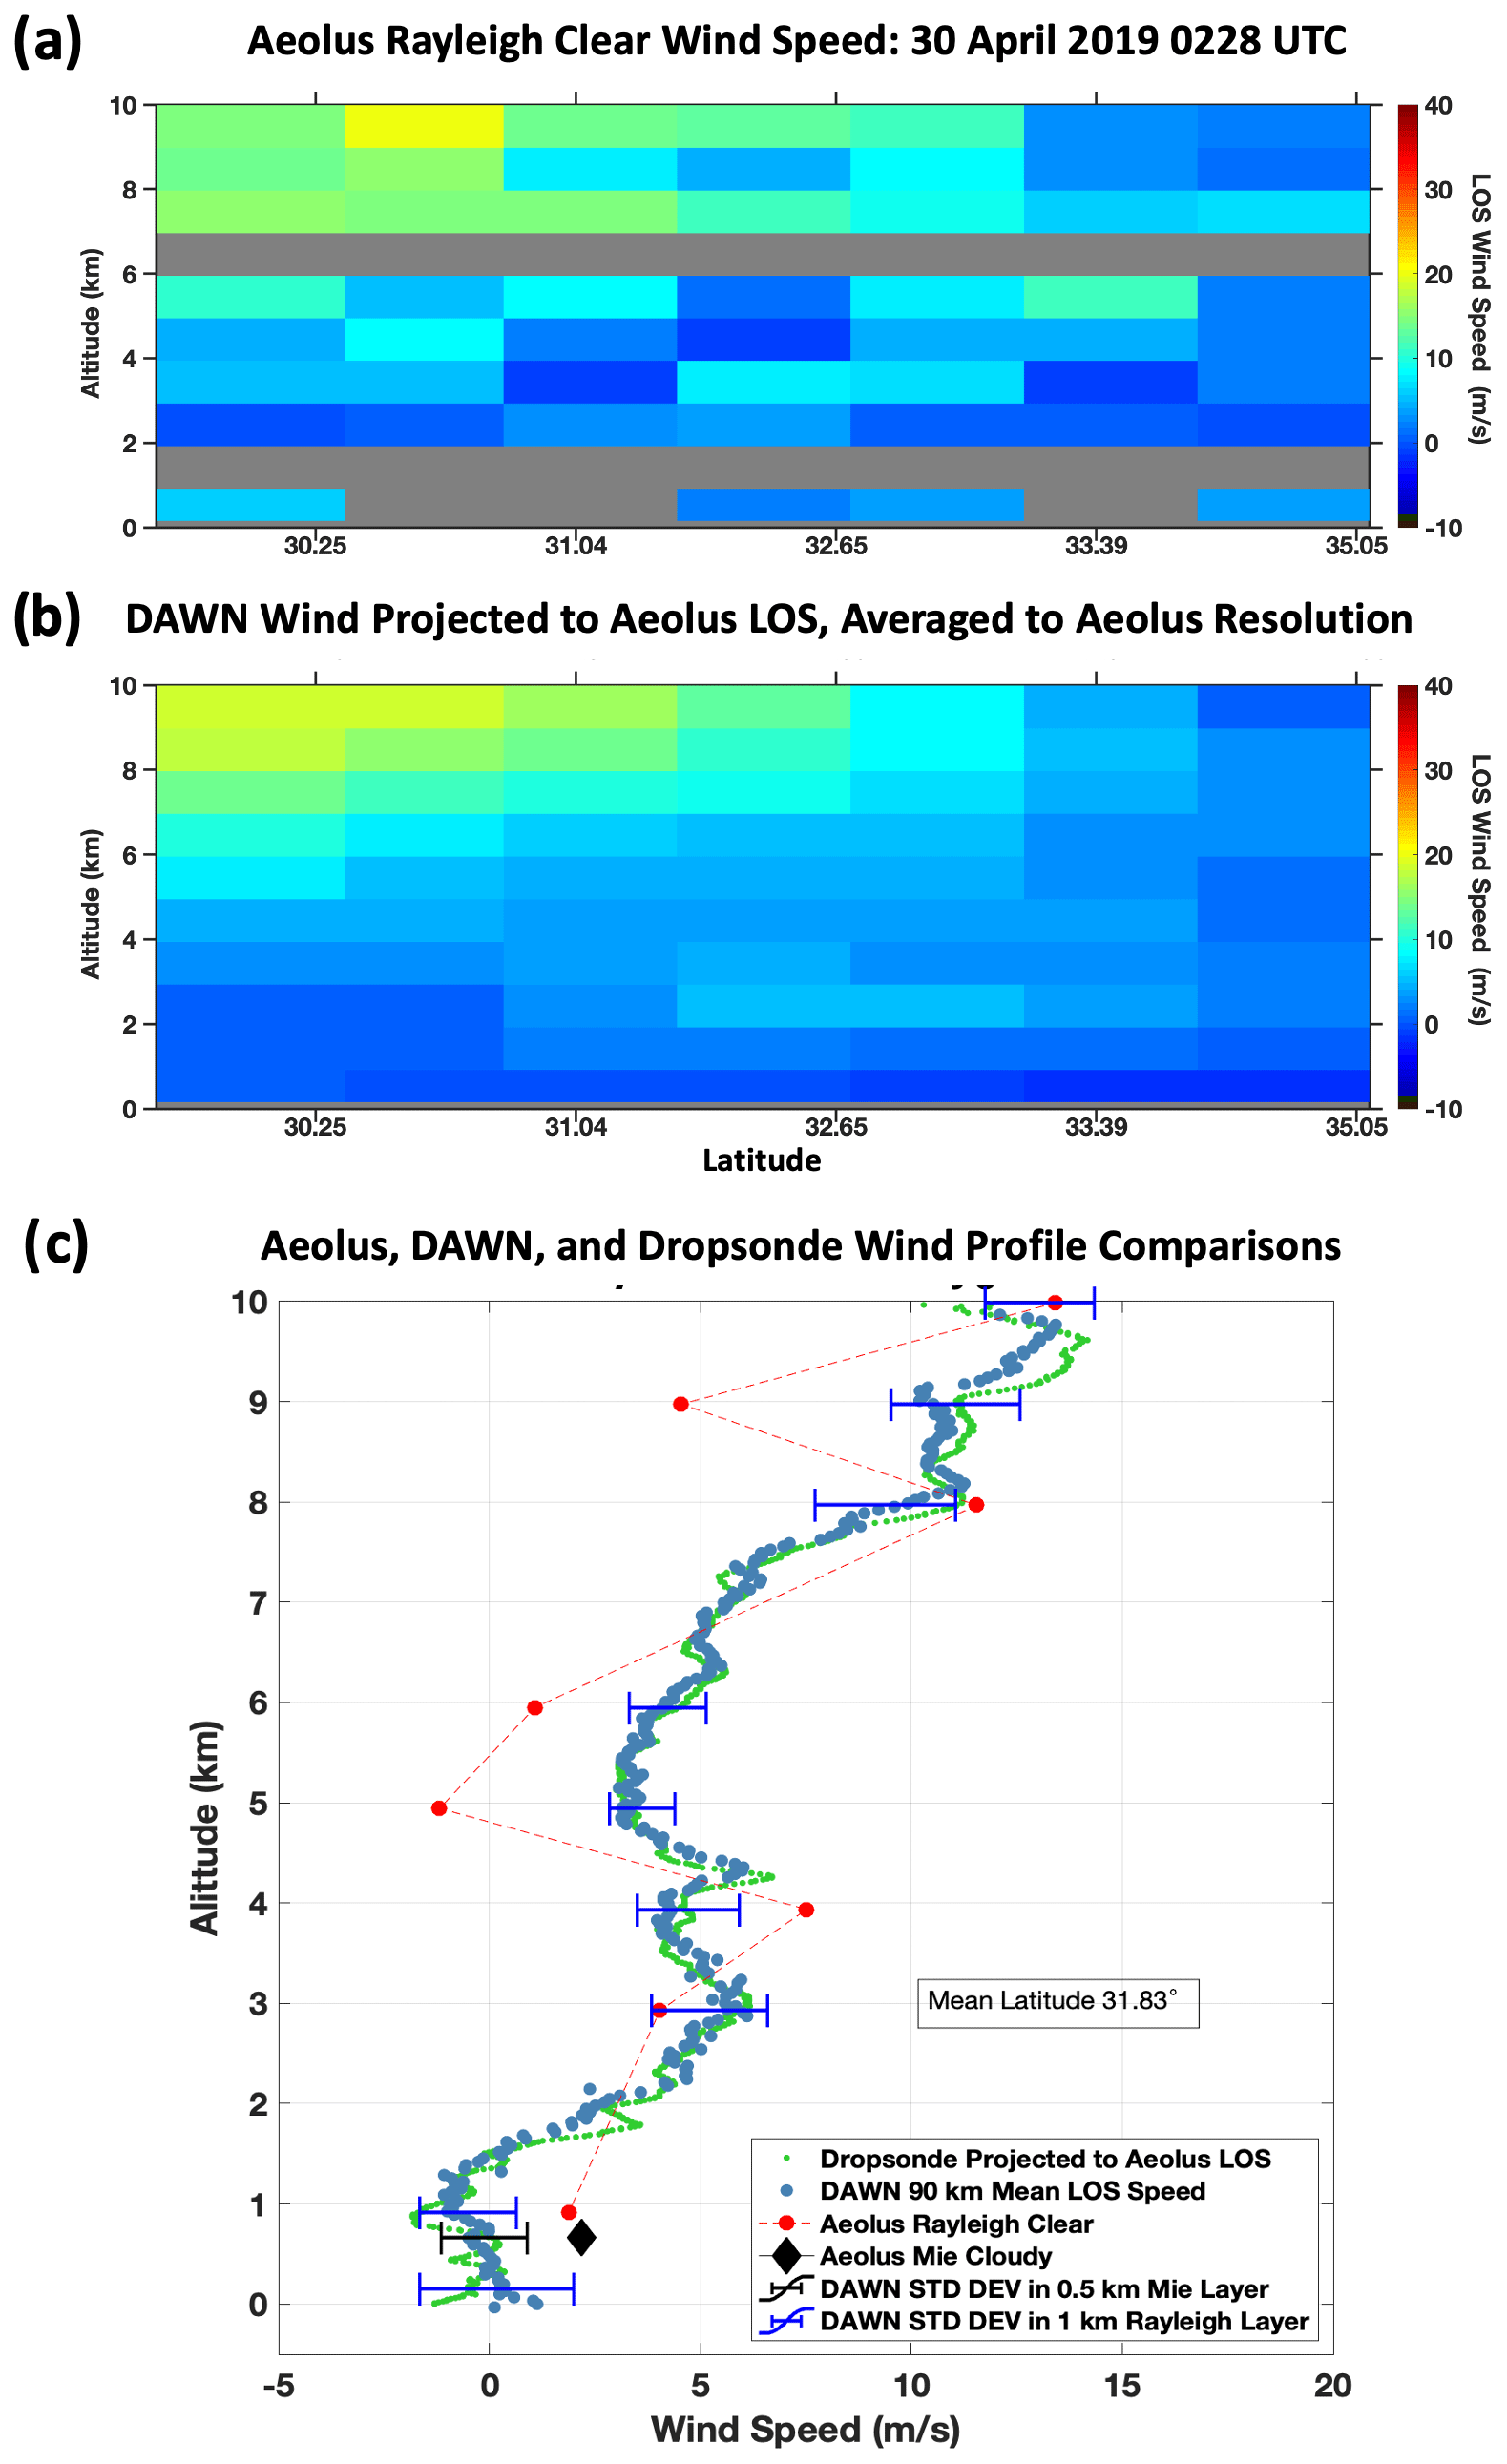
Figure 16(a) Aeolus Rayleigh clear and (b) DAWN HLOS wind speed profile cross section, coinciding with the 0228 UTC Aeolus overpass on 30 April 2019. (c) The mean DAWN HLOS speed aggregated across the 90 km Rayleigh clear integration distance (blue), dropsonde-projected LOS speed (green), and Aeolus Rayleigh clear (red) and Mie cloudy (black diamond) speed. DAWN variance across the Rayleigh vertical bin depth and ∼90 km horizontal distance are also overlain with blue whiskers.
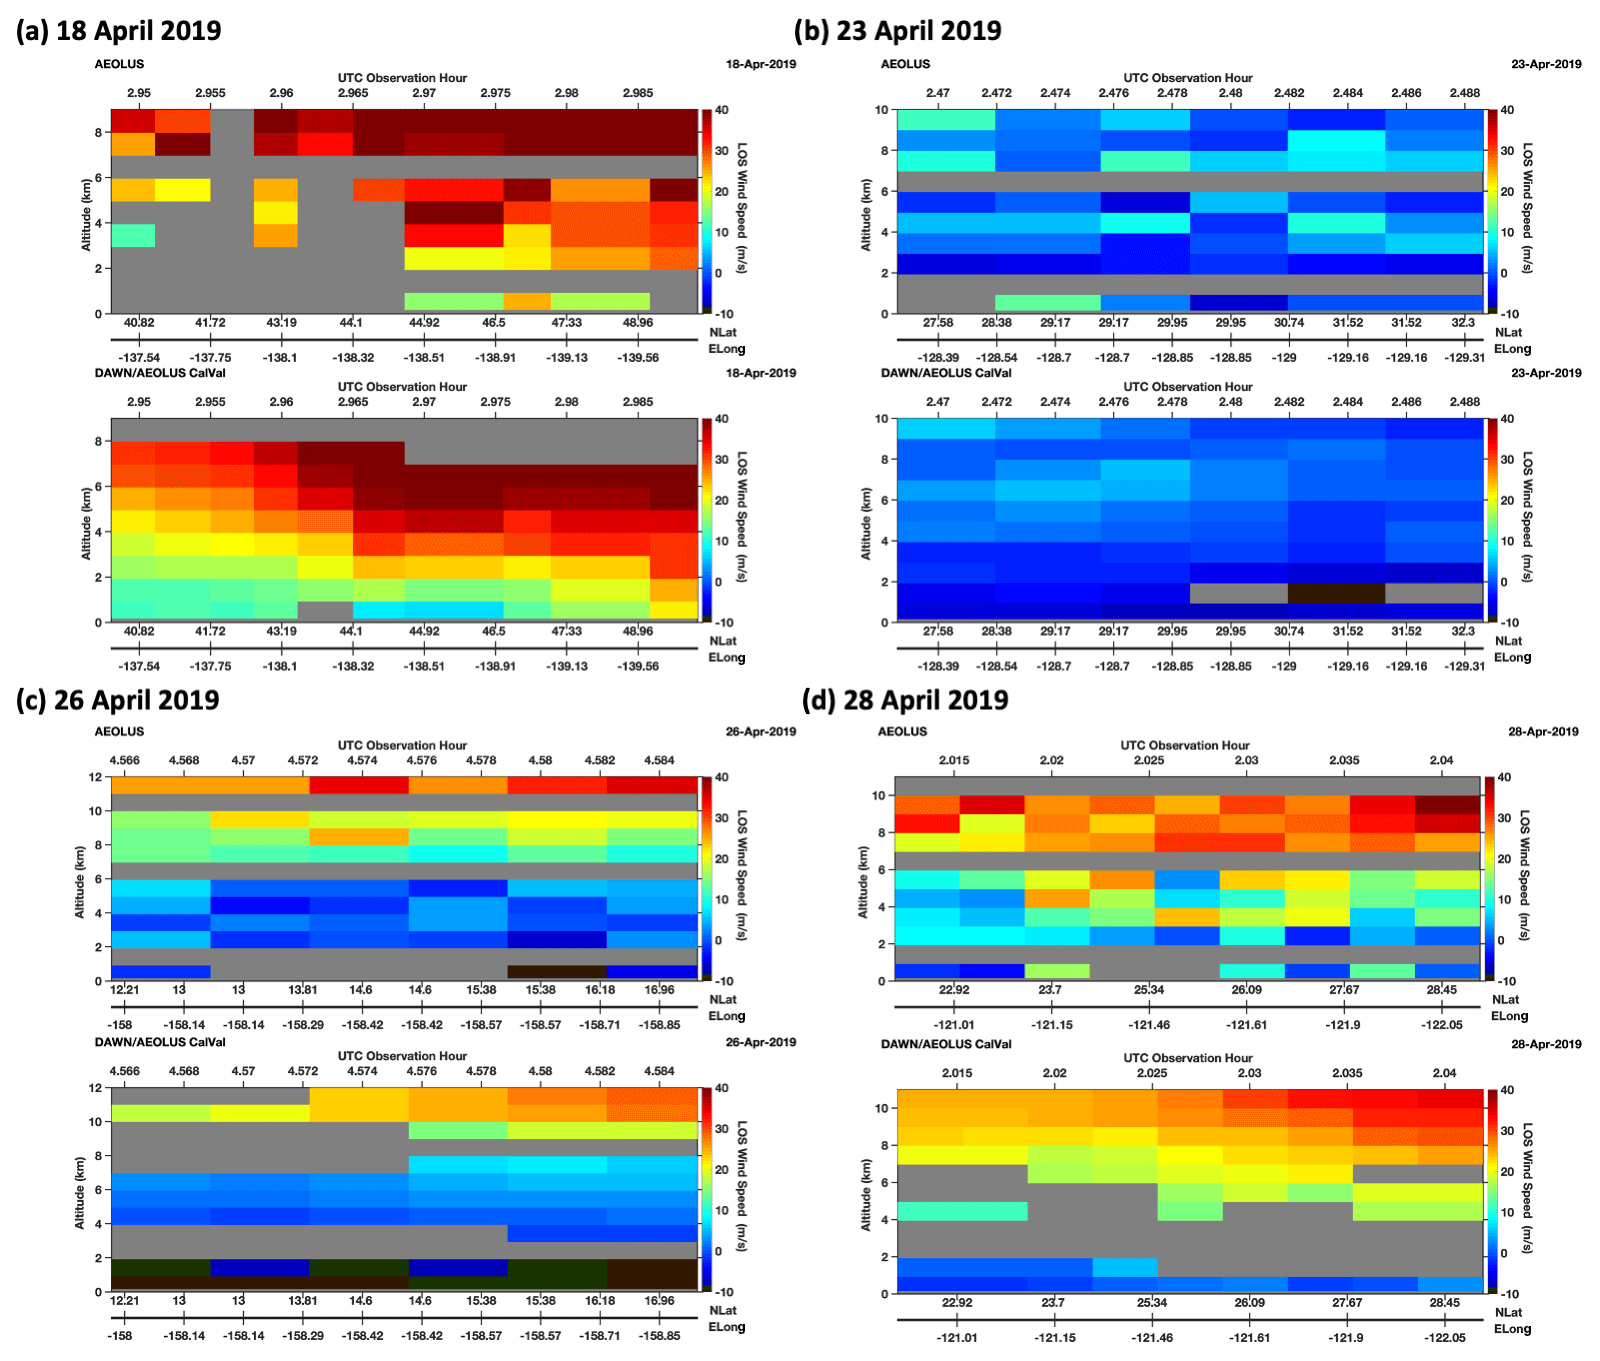
Figure 17Aeolus Rayleigh clear (a, b) and the mean DAWN HLOS speed aggregated across 90 km Rayleigh clear integration distances (c, d), analogous to Fig. 16a and b, for the four remaining Aeolus underflights.
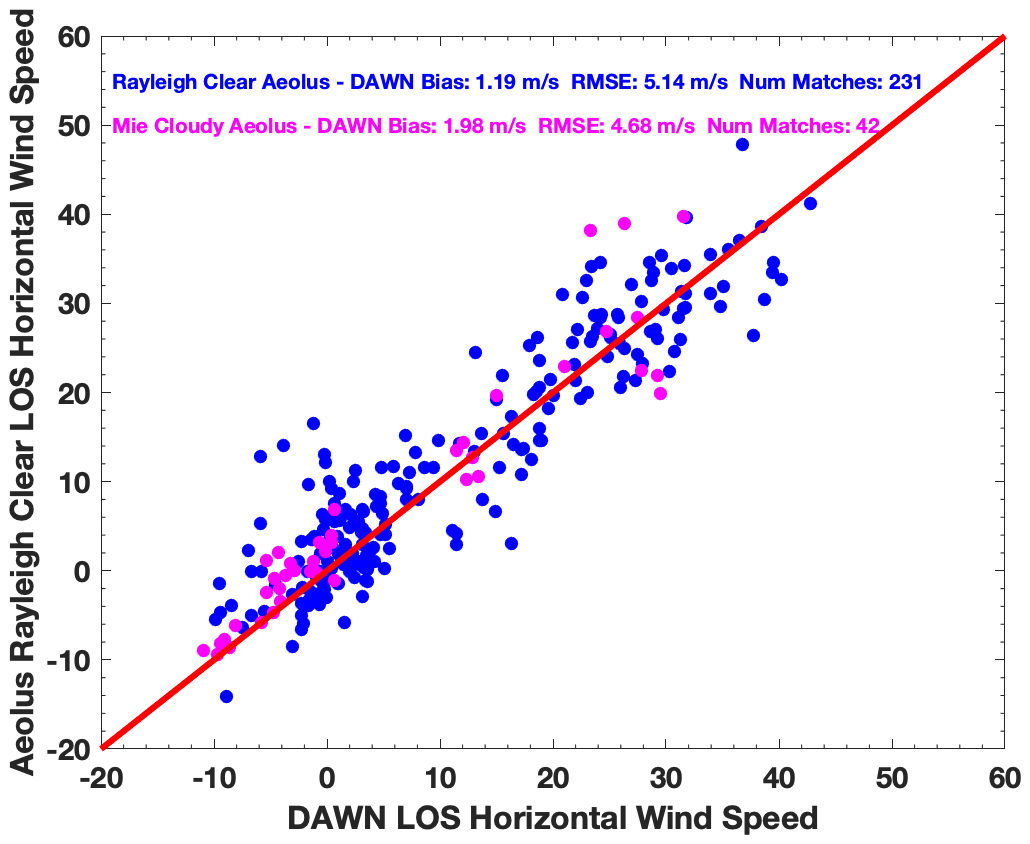
Figure 18Aeolus–DAWN HLOS wind comparison based on 244 Aeolus Rayleigh clear (blue) and 43 Mie cloudy (magenta) vertical bins aggregated across 46 profiles.
This paper summarized DAWN and HALO lidar observations and the wide variety of atmospheric phenomena sampled during the April 2019 Aeolus Cal/Val test flight campaign across the eastern Pacific Ocean. Though this campaign focused on regional surveys to characterize instrument performance rather than detailed process studies, phenomena and conditions sampled during the campaign were relatively unique for DAWN, in addition to this being the first flight in which HALO operated in WV-profiling mode. It was found that DAWN and HALO resolved complex and detailed vertical structures and horizontal gradients associated with a variety of phenomena, including midlatitude cyclones, jet streaks and tropopause folds, mountain waves, large-scale tropical circulation, and variability associated with changing stratocumulus cloud patterns. More focused case studies analyzing some of these features are planned for future publication. DAWN wind retrievals generally coincided with areas of enhanced HALO aerosol backscatter and demonstrated close agreement with sonde (1.22 m s−1 and 7.6∘ RMSD) throughout the campaign. Though we were not able to validate the HALO WV profiles with sonde profiles due to sonde performance issues, validation using DLH in situ WV data during a spiral down to near the ocean surface indicated excellent agreement. Comparison with DLH indicated that extremely low WVMR above the stratocumulus cloud top observed by HALO during two flights was a real phenomenon, highlighting how WV DIAL and HSRL can be used in future PBL and cloud-focused studies to resolve fine-scale features that are challenging for other passive retrieval methods. Aeolus, which had been encountering performance issues and other technical challenges from the time of launch through when our campaign was conducted, provided winds that differed from DAWN more than in other recent European Aeolus Cal/Val campaigns involving the DLR 2 µ coherent wind lidar. We anticipate improved agreement with DAWN when Aeolus Level 2b data are reprocessed in the future.
This campaign provided an initial demonstration of how cloud and weather phenomena coincide with and are modulated by variations in wind, WV, and aerosol conditions, and how such variations can be observed by airborne lidar instruments. High-precision and detailed measurements of these variables, in addition to many others such as temperature, cloud microphysics, and precipitation profiles, are required to address key science questions posed by the 2017 Earth science decadal survey (Earth Science and Applications from Space, ESAS, 2017). Airborne sensors and campaigns, like this Aeolus Cal/Val test flight campaign, are needed to collect data of sufficient precision and detail to supplement and evaluate the performance of existing space-borne sensors.
The upcoming Convective Processes Experiment – Aerosols and Winds (CPEX-AW) campaign, scheduled to occur in July and August 2021 and intended to operate out of Sal Island, Cabo Verde, will build upon the understanding of convective processes that has been gained from 2017 CPEX campaign data sets and models. DAWN, HALO, dropsondes, the Airborne Precipitation and cloud Radar – 3rd Generation (APR-3), and the High-Altitude Monolithic Microwave integrated Circuit Sounding Radiometer (HAMSR; Brown et al., 2011) instruments will fly aboard the DC-8 during CPEX-AW. CPEX-AW, in conjunction with the international Aeolus Tropical Campaign, will conduct flight segments focused on Aeolus Cal/Val in addition to other segments to address a number of science goals, including the following: (1) investigating how convective systems interact with lower tropospheric and surface winds in the intertropical convergence zone (ITCZ); (2) determining the role of aerosols, WV, winds, clouds, and precipitation and their interactions with African weather and air quality; (3) measuring the vertical structures and variability of WV, winds, and aerosols within the boundary layer and their coupling to convection initiation and life cycle in the ITCZ; and (4) studying how the African easterly waves and Saharan Air Layer (dry air and dust) control the convectively suppressed and active periods of the ITCZ. In preparation for CPEX-AW, we are continuing to improve DAWN through better detector response, faster scanning between azimuths, and adjustment to DAWN scanning patterns, which will result in improved aerosol sensitivity and higher spatial sampling of wind profiles and improved resolution of mesoscale wind flows. HALO improvements for CPEX-AW include optimization of detector gain settings for improved SNR and increasing the offset locking bandwidth of the PBL weighted transmitted wavelength to allow for optimization of the WV optical depth and, hence, precision within the tropical and subtropical latitudes.
DAWN, HALO, and dropsonde data sets described in this paper can be accessed at https://doi.org/10.5067/SUBORBITAL/AEOLUSCALVAL2019/DATA001 (Bedka et al., 2020).
KB and AN drafted the paper and analyzed the data. MK helped formulate the Aeolus Cal/Val campaign and analyzed the data. RBG, JaC, JoC, BC, GDE, SG, SK, ZL, and SR analyzed the data. MB provided the dropsonde data. TL and GSJ helped formulate the Aeolus Cal/Val campaign.
The authors declare that they have no conflict of interest.
This article is part of the special issue “Aeolus data and their application (AMT/ACP/WCD inter-journal SI)”. It is not associated with a conference.
We acknowledge directed funding support from the NASA Headquarters Earth Science Division that covered execution of the flight campaign and subsequent data analysis. We thank the DC-8 team at the NASA Armstrong Flight Research Center and the National Suborbital Education and Research Center at the University of North Dakota for their excellent execution of the campaign. We thank the following people from NASA Langley Research Center: Anthony Notari and David Harper, for the heroic effort in integrating and testing HALO prior to the campaign; Joseph Lee, for his time and effort in integrating and operating HALO during the campaign; Larry Petway, John Marketon, Dave Macdonnell, Charles Trepte, Sam Chen, Jay Yu, Abou Traore, Connor Huffine, Seth Begay, Anna Noe, Diego Pierrottet, Alan Little, and Eric Altman, for their incredible efforts in preparing and testing DAWN prior to deployment, improving instrument performance, integrating onto the DC-8, operating throughout the campaign, and supporting science investigations; Glenn Diskin and Joshua Digangi, for providing DLH data used to validate HALO WV observations; and Christopher Yost, Douglas Spangenberg, Thad Chee, and Louis Nguyen, for providing forecasting and flight planning support for the campaign. We also thank Sammy Henderson of Beyond Photonics, for his expertise with characterizing DAWN performance prior to integration. We thank Anne Grete Straume-Linder and Sebastian Bley (ESA) and Oliver Reitebuch (DLR), for their contributions to the description of the Aeolus mission and ALADIN status. We thank Will McCarty and the NASA GMAO, for providing GEOS-5 forecast products over the flight campaign domain. We thank the Data Center at the University of Wisconsin–Madison Space Science Engineering Center, for providing GOES-17 imagery, and NOAA NESDIS, for granting 1 min GOES-17 Mesoscale Domain Sectors throughout the campaign.
This research has been supported by the NASA Aeronautics and Space Administration Earth Science Division Weather and Atmospheric Dynamics Focus Area.
This paper was edited by Oliver Reitebuch and reviewed by two anonymous referees.
Asrar, G., Bony, S., Boucher, O., Busalacchi, A., Cazenave, A., Dowell, M., Flato, G., Hegerl, G., Källén, E., Nakajima, T., Ratier, A., Saunders, R., Slingo, J., Sohn, B., Schmetz, J., Stevens, B., Zhang, P., and Zwiers, F.: Climate Symposium 2014: Findings and Recommendations, B. Am. Meteorol. Soc., 96, ES145–ES147, https://doi.org/10.1175/BAMS-D-15-00003.1, 2015.
Baars, H., Herzog, A., Heese, B., Ohneiser, K., Hanbuch, K., Hofer, J., Yin, Z., Engelmann, R., and Wandinger, U.: Validation of Aeolus wind products above the Atlantic Ocean, Atmos. Meas. Tech., 13, 6007–6024, https://doi.org/10.5194/amt-13-6007-2020, 2020.
Bedka, K., Liu, Z., Rodier, S., Nehrir, A., Kooi, S., Collins, J., Carroll, B., and Beaubien, M.: Aeolus Calibration/Validation (Cal/Val), NASA Langley Atmospheric Science Data Center [data set], https://doi.org/10.5067/SUBORBITAL/AEOLUSCALVAL2019/DATA001, 2020.
Black, P., Harrison, L., Beaubien, M., Bluth, R., Woods, R., Penny, A., Smith, R. W., and Doyle, J. D.: High-Definition Sounding System (HDSS) for Atmospheric Profiling, J. Atmos. Ocean. Tech., 34, 777–796, https://doi.org/10.1175/JTECH-D-14-00210.1, 2017.
Braun, S. A., Kakar, R., Zipser, E., Heymsfield, G., Albers, C., Brown, S., Durden, S. L., Guimond, S., Halverson, J., Heymsfield, A., Ismail, S., Lambrigtsen, B., Miller, T., Tanelli, S., Thomas, J., and Zawislak, J.: NASA's Genesis and Rapid Intensification Processes (GRIP) Field Experiment, B. Am. Meteorol. Soc., 94, 345–363, https://doi.org/10.1175/BAMS-D-11-00232.1, 2013.
Browell, E. V., Ismail, S., Hall, W. M., Moore, A. S., Kooi, S. A., Brackett, V. G., Clayton, M. B., Barrick, J. D. W., Schmidlin, F. J., Higdon, N. S., Melfi, S. H., and Whiteman, D. N.: LASE Validation Experiment, in: Advances in Atmospheric Remote Sensing with Lidar, edited by: Ansmann, A., Neuber, R., Rairoux, P., and Wandinger, U., Springer-Verlag, Berlin, 289–295, 1997.
Brown, S. T., Lambrigtsen, B., Denning, R. F., Gaier, T., Kangaslahti, P., Lim, B. H., Tanabe, J. M., and Tanner, A. B.: The High-Altitude MMIC Sounding Radiometer for the Global Hawk Unmanned Aerial Vehicle: Instrument Description and Performance, IEEE T. Geosci. Remote, 49, 3291–3301, https://doi.org/10.1109/TGRS.2011.2125973, 2011.
Bucci, L. R., O'Handley, C., Emmitt, G. D., Zhang, J. A., Ryan, K., and Atlas, R.: Validation of an Airborne Doppler Wind Lidar in Tropical Cyclones, Sensors, 18, 4288, https://doi.org/10.3390/s18124288, 2018.
Burton, S. P., Ferrare, R. A., Hostetler, C. A., Hair, J. W., Rogers, R. R., Obland, M. D., Butler, C. F., Cook, A. L., Harper, D. B., and Froyd, K. D.: Aerosol classification using airborne High Spectral Resolution Lidar measurements – methodology and examples, Atmos. Meas. Tech., 5, 73–98, https://doi.org/10.5194/amt-5-73-2012, 2012.
Cui, Z., Pu, Z., Emmitt, G. D., and Greco, S.: The Impact of Airborne Doppler Aerosol Wind (DAWN) Lidar Wind Profiles on Numerical Simulations of Tropical Convective Systems during the NASA Convective Processes Experiment (CPEX), J. Atmos. Ocean. Tech., 37, 705–722, https://doi.org/10.1175/JTECH-D-19-0123.1, 2020.
Diskin, G. S., Podolske, J. R., Sachse, G. W., and Slate, T. A.: Open-path airborne tunable diode laser hygrometer, Diode Lasers and Applications in Atmospheric Sensing, Proc. SPIE, 4817, https://doi.org/10.1117/12.453736, 2002.
Doyle, J. D., Moskaitis, J. R., Feldmeier, J. W., Ferek, R. J., Beaubien, M., Bell, M. M., Cecil, D. L., Creasey, R. L., Duran, P., Elsberry, R. L., Komaromi, W. A., Molinari, J., Ryglicki, D. R., Stern, D. P., Velden, C. S., Wang, X., Allen, T., Barrett, B. S., Black, P. G., Dunion, J. P., Emanuel, K. A., Harr, P. A., Harrison, L., Hendricks, E. A., Herndon, D., Jeffries, W. Q., Majumdar, S. J., Moore, J. A., Pu, Z., Rogers, R. F., Sanabia, E. R., Tripoli, G. J., and Zhang, D.: A View of Tropical Cyclones from Above: The Tropical Cyclone Intensity Experiment, B. Am. Meteorol. Soc., 98, 2113–2134, https://doi.org/10.1175/BAMS-D-16-0055.1, 2017.
DuVivier, A. K., Cassano, J. J., Greco, S., and Emmitt, G. D.: A Case Study of Observed and Modeled Barrier Flow in the Denmark Strait in May 2015, Mon. Weather Rev., 145, 2385–2404, https://doi.org/10.1175/MWR-D-16-0386.1, 2017.
ESA: ADM-Aeolus Mission Requirements Document, available online at: https://esamultimedia.esa.int/docs/EarthObservation/ADM-Aeolus_MRD.pdf (last access: 27 May 2021), 2016.
ESA: Aeolus Scientific Calibration and Validation Implementation Plan, available online at: https://earth.esa.int/pi/esa?id=4910&cmd=image&table=aotarget (last access: 27 May 2021), 2019.
ESAS: https://www.nationalacademies.org/our-work-decadal-survey-for-earth-science-and-applications-from-space (last access: 27 May 2021), 2017.
Flamant, P., Cuesta, J., Denneulin, M. L., Dabas, A., and Huber, D.: ADM-Aeolus retrieval algorithms for aerosol and cloud products, Tellus A, 60, 273–288, 2008.
Gelaro, R., McCarty, W., Suarez, M., Todling, R., Molod, A., Takacs, L., Randles, C., Darmenov, A., Bosilovich, M., and Reichle, R.: The Modern-Era Retrospective Analysis for Research and Applications, Version 2 (MERRA-2), J. Climate, 30, 5419–5454, https://doi.org/10.1175/JCLI-D-16-0758.1, 2017.
Greco, S., Emmitt, G. D., Garstang, M., and Kavaya, M.: Doppler Aerosol WiNd (DAWN) Lidar during CPEX 2017: Instrument Performance and Data Utility, Remote Sens., 12, 2951, https://doi.org/10.3390/rs12182951, 2020.
Hair, J. W., Hostetler, C. A., Cook, A. L., Harper, D. B., Ferrare, R. A., Mack, T. L., Welch, W., Izquierdo, L. R., and Hovis, F. E.: Airborne High Spectral Resolution Lidar for profiling aerosol optical properties, Appl. Optics., 47, 6734–6752, 2008.
Henderson, S. W., Gatt, P., Rees, D., and Huffaker, R. M.: Wind lidar. Laser Remote Sensing, edited by: Fujii, T. and Fukuchi, T., CRC Taylor and Francis, 469–722, 2005.
Holloway, C. E., Wing, A. A., Bony, S., Muller, C., Masunaga, H., L'Ecuyer, T. S., Turner, D. D., and Zuidema, P.: Observing Convective Aggregation, Surv. Geophys., 38, 1199–1236, https://doi.org/10.1007/s10712-017-9419-1, 2017.
Kanitz, T., Lochard, J., Marshall, J., McGoldrick, P., Lecrenier, O., Bravetti, P., Reitebuch, O., Rennie, M., Wernham, D., and Elfving, A.: Aeolus first light: first glimpse, in: Proc. SPIE, 11180, International Conference on Space Optics – ICSO 2018, 111801R, https://doi.org/10.1117/12.2535982, 2019.
Kavaya, M. J., Beyon, J. Y., Koch, G. J., Petros, M., Petzar, P. J., Singh, U. N., Trieu, B. C., and Yu, J.: The Doppler Aerosol Wind (DAWN) Airborne, Wind-Profiling Coherent-Detection Lidar System: Overview and Preliminary Flight Results, J. Atmos. Ocean. Tech., 31, 826–842, https://doi.org/10.1175/JTECH-D-12-00274.1, 2014.
Khaykin, S. M., Hauchecorne, A., Wing, R., Keckhut, P., Godin-Beekmann, S., Porteneuve, J., Mariscal, J.-F., and Schmitt, J.: Doppler lidar at Observatoire de Haute-Provence for wind profiling up to 75 km altitude: performance evaluation and observations, Atmos. Meas. Tech., 13, 1501–1516, https://doi.org/10.5194/amt-13-1501-2020, 2020.
Koch, G. J, Beyon, J. Y., Modlin, E. A., Petzar, P. J., Woll, S., Petros, M., Yu, J., and Kavaya, M. J.: Side-scan Doppler lidar for offshore wind energy applications, J. Appl. Remote Sens., 6, 063562, https://doi.org/10.1117/1.JRS.6.063562, 2012.
Lebsock, M. D., L'Ecuyer, T. S., and Pincus, R.: An Observational View of Relationships Between Moisture Aggregation, Cloud, and Radiative Heating Profiles, Surv. Geophys., 38, 1237–1254, https://doi.org/10.1007/s10712-017-9443-1, 2017.
Lux, O., Lemmerz, C., Weiler, F., Marksteiner, U., Witschas, B., Rahm, S., Schäfler, A., and Reitebuch, O.: Airborne wind lidar observations over the North Atlantic in 2016 for the pre-launch validation of the satellite mission Aeolus, Atmos. Meas. Tech., 11, 3297–3322, https://doi.org/10.5194/amt-11-3297-2018, 2018.
Lux, O., Lemmerz, C., Weiler, F., Marksteiner, U., Witschas, B., Rahm, S., Geiß, A., and Reitebuch, O.: Intercomparison of wind observations from the European Space Agency's Aeolus satellite mission and the ALADIN Airborne Demonstrator, Atmos. Meas. Tech., 13, 2075–2097, https://doi.org/10.5194/amt-13-2075-2020, 2020.
Marksteiner, U., Lemmerz, C., Lux, O., Rahm, S., Schäfler, A., Witschas, B., and Reitebuch, O.: Calibrations and Wind Observations of an Airborne Direct-Detection Wind LiDAR Supporting ESA's Aeolus Mission, Remote Sens., 10, 2056, https://doi.org/10.3390/rs10122056, 2018.
Martin, A., Weissmann, M., Reitebuch, O., Rennie, M., Geiß, A., and Cress, A.: Validation of Aeolus winds using radiosonde observations and numerical weather prediction model equivalents, Atmos. Meas. Tech., 14, 2167–2183, https://doi.org/10.5194/amt-14-2167-2021, 2021.
Mapes, B., Chandra, A. S., Kuang, Z., and Zuidema, P.: Importance Profiles for Water Vapor, Surv. Geophys., 38, 6, 1355–1369, 2017.
Measures, R. M.: Laser Remote Sensing: Fundamentals and Applications, John Wiley, New York, 510 pp., ISBN: 0471081930, 9780471081937, 1984.
NASA: https://cpex.jpl.nasa.gov/cpex2017/index.php (last access: 21 May 2021), 2017.
Nehrir, A. R., Kiemle, C., Lebsock, M. D., Kirchengast, G., Buehler, S. A., Löhnert, U., Liu, C.-L., Hargrave, P. C., Barrera-Verdejo M., and Winker, D. M.: Emerging Technologies and Synergies for Airborne and Space-Based Measurements of Water Vapor Profiles, Surv. Geophys., 38, 1445–1482, https://doi.org/10.1007/s10712-017-9448-9, 2017.
Nehrir, A. R., Hair, J. W., Ferrare, R. A., Hostetler, C. A., Kooi, S. A., Notari, A., Harper, D. A., Collins Jr., J. E., Barton-Grimley, R. A., Antill, C., Hare, R. J., and Fitzpatrick, F.: The High Altitude Lidar Observatory (HALO): A multi-function lidar and technology testbed for airborne and space-based measurements of water vapor and methane, American Geophysical Union Fall Meeting 2018, Washington D.C., 10–14 December 2018, A31P-3155, 2018.
Nehrir, A. R., Hair, H., Ferrare R., Hostetler, C., Notari, A., Harper, D., Collins, J., Kooi, S., Barton-Grimley, R., and Fitzpatrick, F.: Airborne Lidar Observations of Water Vapor, Methane, and Aerosol/Cloud Profiles with the High Altitude Lidar Observatory, American Geophysical Union Fall Meeting, San Francisco, California, 9–13 December 2019, A43D-04, 2019.
Reitebuch O.: Wind Lidar for Atmospheric Research, in: Atmospheric Physics. Research Topics in Aerospace, edited by: Schumann, U., Springer, Berlin, Heidelberg, https://doi.org/10.1007/978-3-642-30183-4_30, 2012.
Reitebuch, O., Lemmerz, C., Lux, O., Marksteiner, U., Rahm, S., Weiler, F., Witschas, B., Meringer, M., Schmidt, K., Huber, D., Nikolaus, I., Geiß, A., Vaughan, M., Dabas, A., Flament, T., Stieglitz, H., Isaksen, L., Rennie, M., de Kloe, J., Marseille, G.-J., Stoffelen, A., Wernham, D., Kanitz, T., Straume, A.-G., Fehr, T., von Bismark, J., Floberghagen, R., and Parrinello, T.: Initial assessment of the performance of the first Wind Lidar in space on Aeolus, EPJ Web Conf., 237, 01010, https://doi.org/10.1051/epjconf/202023701010, 2019.
Rennie, M. P.: An assessment of the expected quality of Aeolus Level-2B wind products, EPJ Web Conf., 176, 02015, https://doi.org/10.1051/epjconf/201817602015, 2018.
Rennie, M. P. and Isaksen, L.: The NWP impact of Aeolus Level-2B Winds at ECMWF, ECMWF Technical Memorandum 864, https://doi.org/10.21957/alift7mhr, 2020.
Scarino, A. J., Obland, M. D., Fast, J. D., Burton, S. P., Ferrare, R. A., Hostetler, C. A., Berg, L. K., Lefer, B., Haman, C., Hair, J. W., Rogers, R. R., Butler, C., Cook, A. L., and Harper, D. B.: Comparison of mixed layer heights from airborne high spectral resolution lidar, ground-based measurements, and the WRF-Chem model during CalNex and CARES, Atmos. Chem. Phys., 14, 5547–5560, https://doi.org/10.5194/acp-14-5547-2014, 2014.
Shipley S. T., Tracy, D. H., Eloranta, E. W., Tauger, J. T., Sroga, J. T., Roesler, F. L., and Weinman, J. A.: High spectral resolution lidar to measure optical scattering properties of atmospheric aerosols, 1: Theory and instrumentation, Appl. Optics, 22, 3716–3724, 1983.
Stevens, B., Brogniez, H., Kiemle, C., Lacour, J.-L., Crevoisier, C., and Kiliani, J.: Structure and Dynamical Influence of Water Vapor in the Lower Tropical Troposphere, Surv. Geophys., 38, 1371–1397, https://doi.org/10.1007/s10712-017-9420-8, 2017.
Stith, J. L., Baumgardner, D., Haggerty, J., Hardesty, R. M., Lee, W., Lenschow, D., Pilewskie, P., Smith, P. L., Steiner, M., and Vömel, H.: 100 Years of Progress in Atmospheric Observing Systems, Meteor. Mon., 59, 2.1–2.55, https://doi.org/10.1175/AMSMONOGRAPHS-D-18-0006.1, 2018.
Stoffelen, A., Pailleux, J., Källén, E., Vaughan, J. M., Isaksen, I., Flamant, P., Wergen, W., Andersson, E., Schyberg, H., Culoma, A., Meynart, R., Endemann, M., and Ingmann, P.: The Atmospheric Dynamics Mission for global wind field measurement, B. Am. Meteorol. Soc., 86, 73–87, 2005.
Straume, A.-G., Rennie, M., Isaksen, L., de Kloe, J., Marseille, G.-J., Stoffelen, A., Flament, T., Stieglitz, H., Dabas, A., Huber, D., Reitebuch, O., Lemmerz, C., Lux, O., Marksteiner, U., Rahm, S., Weiler, F., Witschas, B., Meringer, M., Schmidt, K., Nikolaus, I., Geiss, A., Flamant, P., Kanitz, T., Wernham, D., von Bismark, J., Bley, S., Fehr, T., Floberghagen, R., and Parrinello, T.: ESA's Space-based Doppler Wind Lidar Mission Aeolus – First Wind and Aerosol Product Assessment Results, in: International Laser Radar Conference, Hefei, China, 24–28 June 2019, 2019.
Sugimoto, N. and Lee, C. H.: Characteristics of dust aerosols inferred from lidar depolarization measurements at two wavelengths, Appl. Optics, 45, 7468–7474, 2006.
Tan, D. G. H., Andersson, E., De Kloe, J., Marseille, G-J., Stoffelen, A., Poli, P., Denneulin, M-L., Dabas, A., Huber, D., Reitebuch, O., Flamant, P., Le Rille, O., and Nett, H.: The ADM-Aeolus wind retrieval algorithms, Tellus A, 60, 191–205, https://doi.org/10.1111/j.1600-0870.2007.00285.x, 2008.
Tucker, S. C., Weimer, C. S., Baidar, S., and Hardesty, R. M.: The Optical Autocovariance Wind Lidar. Part I: OAWL Instrument Development and Demonstration, J. Atmos. Ocean. Tech., 35, 2079–2097, https://doi.org/10.1175/JTECH-D-18-0024.1. 2018.
Turk, F. J., Hristova-Veleva, S., Durden, S. L., Tanelli, S., Sy, O., Emmitt, G. D., Greco, S., and Zhang, S. Q.: Joint analysis of convective structure from the APR-2 precipitation radar and the DAWN Doppler wind lidar during the 2017 Convective Processes Experiment (CPEX), Atmos. Meas. Tech., 13, 4521–4537, https://doi.org/10.5194/amt-13-4521-2020, 2020.
Wang, Y., Williamson, C., Huynh, G., Emmitt, D., and Greco, S.: Airborne Doppler wind lidar data fusion with a diagnostic wind model, Laser Radar Technology and Applications XVII, Proc. SPIE, 8379, 83790 L (14 May 2012), https://doi.org/10.1117/12.918466, 2012.
Wirth, M., Fix, A., Mahnke, P., Schwarzer, H., Schrandt, F., and Ehret, G.: The airborne multi-wavelength water vapor differential absorption lidar WALES: system design and performance, Appl. Phys. B-Lasers O., 96, 201, https://doi.org/10.1007/s00340-009-3365-7, 2009.
Witschas, B., Rahm, S., Dörnbrack, A., Wagner, J., and Rapp, M.: Airborne Wind Lidar Measurements of Vertical and Horizontal Winds for the Investigation of Orographically Induced Gravity Waves, J. Atmos. Ocean. Tech., 34, 1371–1386, https://doi.org/10.1175/JTECH-D-17-0021.1. 2017.
Witschas, B., Lemmerz, C., Geiß, A., Lux, O., Marksteiner, U., Rahm, S., Reitebuch, O., and Weiler, F.: First validation of Aeolus wind observations by airborne Doppler wind lidar measurements, Atmos. Meas. Tech., 13, 2381–2396, https://doi.org/10.5194/amt-13-2381-2020, 2020.
Wulfmeyer, V., Hardesty, R. M., Turner, D. D., Behrendt, A., Cadeddu, M. P., DiGirolamo, P., Schlüssel, P., Van Baelen, J., and Zus, F.: A review of the remote sensing of lower tropospheric thermodynamic profiles and its indispensable role for the understanding and the simulation of water and energy cycles, Rev. Geophys., 53, 819–895, https://doi.org/10.1002/2014RG000476, 2015.
Zhang, J. A., Atlas, R., Emmitt, G. D., Bucci, L., and Ryan, K.: Airborne doppler wind lidar observations of the tropical cyclone boundary layer, Remote Sens., 10, 825, https://doi.org/10.3390/rs10060825, 2018.